1. Introduction
The last few years have brought a clear shift in the strategy of network asset management, including large power transformers. The overall aging of the transformer population, manifesting itself, e.g., in an increase in the average moisture content [
1], and the more often occurring catastrophic failures have forced the introduction of new regulations and recommendations for the operation and diagnosis of strategic importance devices to ensure a continuity of energy supply. Additionally, the growing demands of insurance companies concerning an aged network infrastructure, and thus burdened with a high risk of failure, have forced operators to change the current policy. One of the symptoms of these changes is the introduction of more complex diagnosis of particular transformer components and shorter intervals between successive periodic inspections.
The increasing outlays for periodic diagnostics seriously enhance the overall operating costs without bringing a 100% guarantee to avoid damaging of the unit, e.g., due to the rapidly developing defects. Therefore, currently, an alternative to periodic diagnosis is more often the use of a transformer monitoring in the short-term (e.g., weekly monitoring of partial discharge (PD)) or continuous mode (the measurement system is installed permanently). With the rising costs of operation and due to the increasing reliability of these solutions, it seems that the use of online systems is advantageous from both a technical and economical point of view. It should also be noted that continuous monitoring systems very well fit into the strategy that assumes resignation from manned substations in the near future to those that are fully automated and remotely managed.
The primary task of the monitoring system of any electric power device is to assess its technical condition and to generate an alarm or a warning signal if some anomaly is to occur in its functioning. In the case of such a large and complex device such as a power transformer, it is very difficult to provide a clear, synthetic answer regarding its condition (e.g., in the form of a three-stage classification: normal, warning or alarm), especially if we are aware that defects in the insulation may develop at different rates, in different places and have different levels of importance to the risk of failure of a given unit.
One of the ways to assess the condition of power transformer insulation is to track changes in the activity of PDs. The presence of PDs in the transformer insulation system is an alarming signal about the development of dangerous defects that can lead to serious consequences, including damage of the unit. The main causes of PD activity are: (i) the electrical or mechanical weakening of insulation; (ii) the presence of voids (delaminations), gas bubbles or conductive particles; and (iii) the excessive moisture. The moisture migration and its impact on the PD activity in oil-paper insulation will be the subject of this article.
One of the currently used methods of online measurement of PDs is a method of detection and localisation of acoustic emission (AE) signal sources and the ultra-high frequency (UHF) signal, both of which belong to a group called unconventional methods [
2,
3,
4]. In these methods, the recorded measuring signal, based on different physical phenomena, is associated with the effect of PD generation in a way that prevents its calibration, e.g., correlation with the apparent charge, which is a widely accepted parameter describing the phenomenon of PD generation. In practice, this means that generally accepted normative criteria expressed in pico/nano Coulombs cannot be used for an assessment of the power transformer, and only quantities describing parameter changes over time, the trends of these changes, etc. are used. Implementation of a monitoring system that will take into account all of these factors and also carefully protect the object is extremely difficult. It requires the creation of complex algorithms of inference that should be verified based on the system’s operation as installed on the units in service.
In 2011, as a result of a four-year research project, the Institute of Electrical Power Engineering at the Poznan University of Technology (Poznan, Poland) developed a prototype system (called PDtracker), which was one of the first in Europe for PD online monitoring of power transformers (
Figure 1). PDtracker was intensively tested and developed for almost two years at one of the power substations belonging to a Polish Transmission System Operator (PSE) [
5]. After this time, PDtracker was used for PD detection and monitoring in numerous power transformers and allowed the authors to expand their knowledge on this important issue [
6].
The PDtracker system can operate autonomously or as an integrated part of the overall substation monitoring system. This approach enables a wide range of correlation analysis that allows for combining PD activity with selected parameters of unit functioning (e.g., oil temperature, voltage, load). This, in turn, creates conditions for observation of a scientific nature.
The experience gained from implementation of PDtracker, which was the basis for the laboratory tests undertaken by this team of authors, is discussed in detail in the next sections of this paper.
2. Prototype Online Partial Discharge Monitoring System for Power Transformers
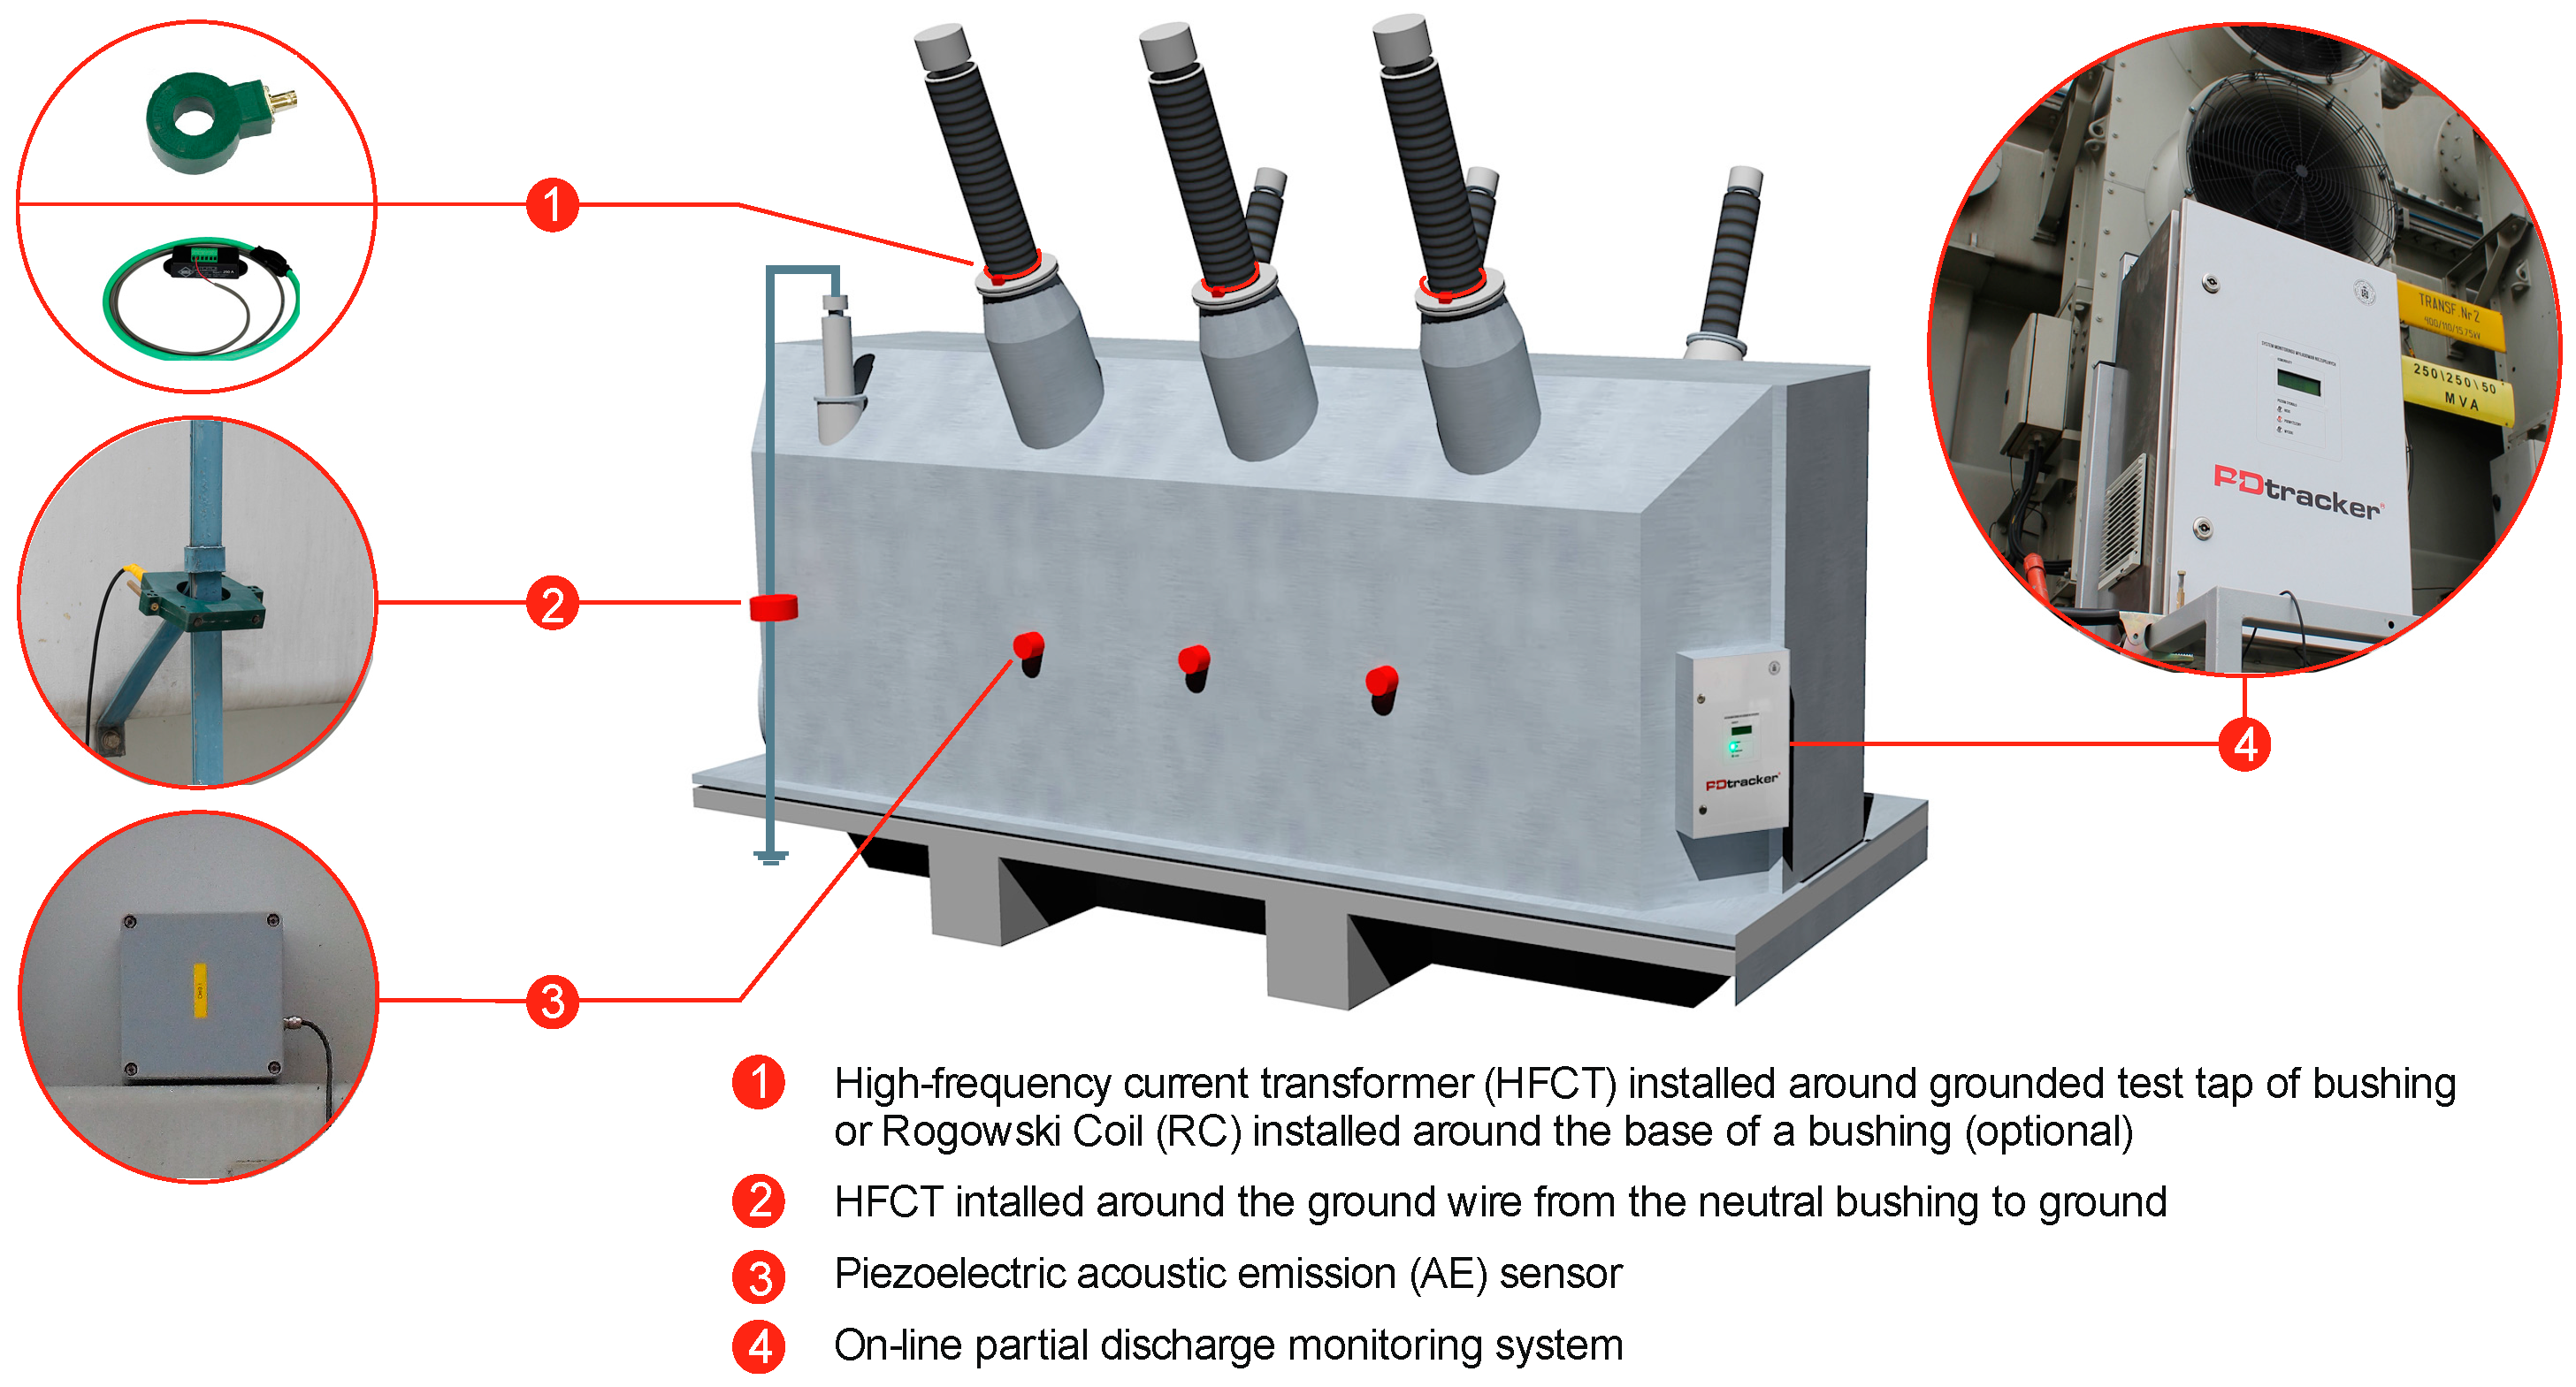
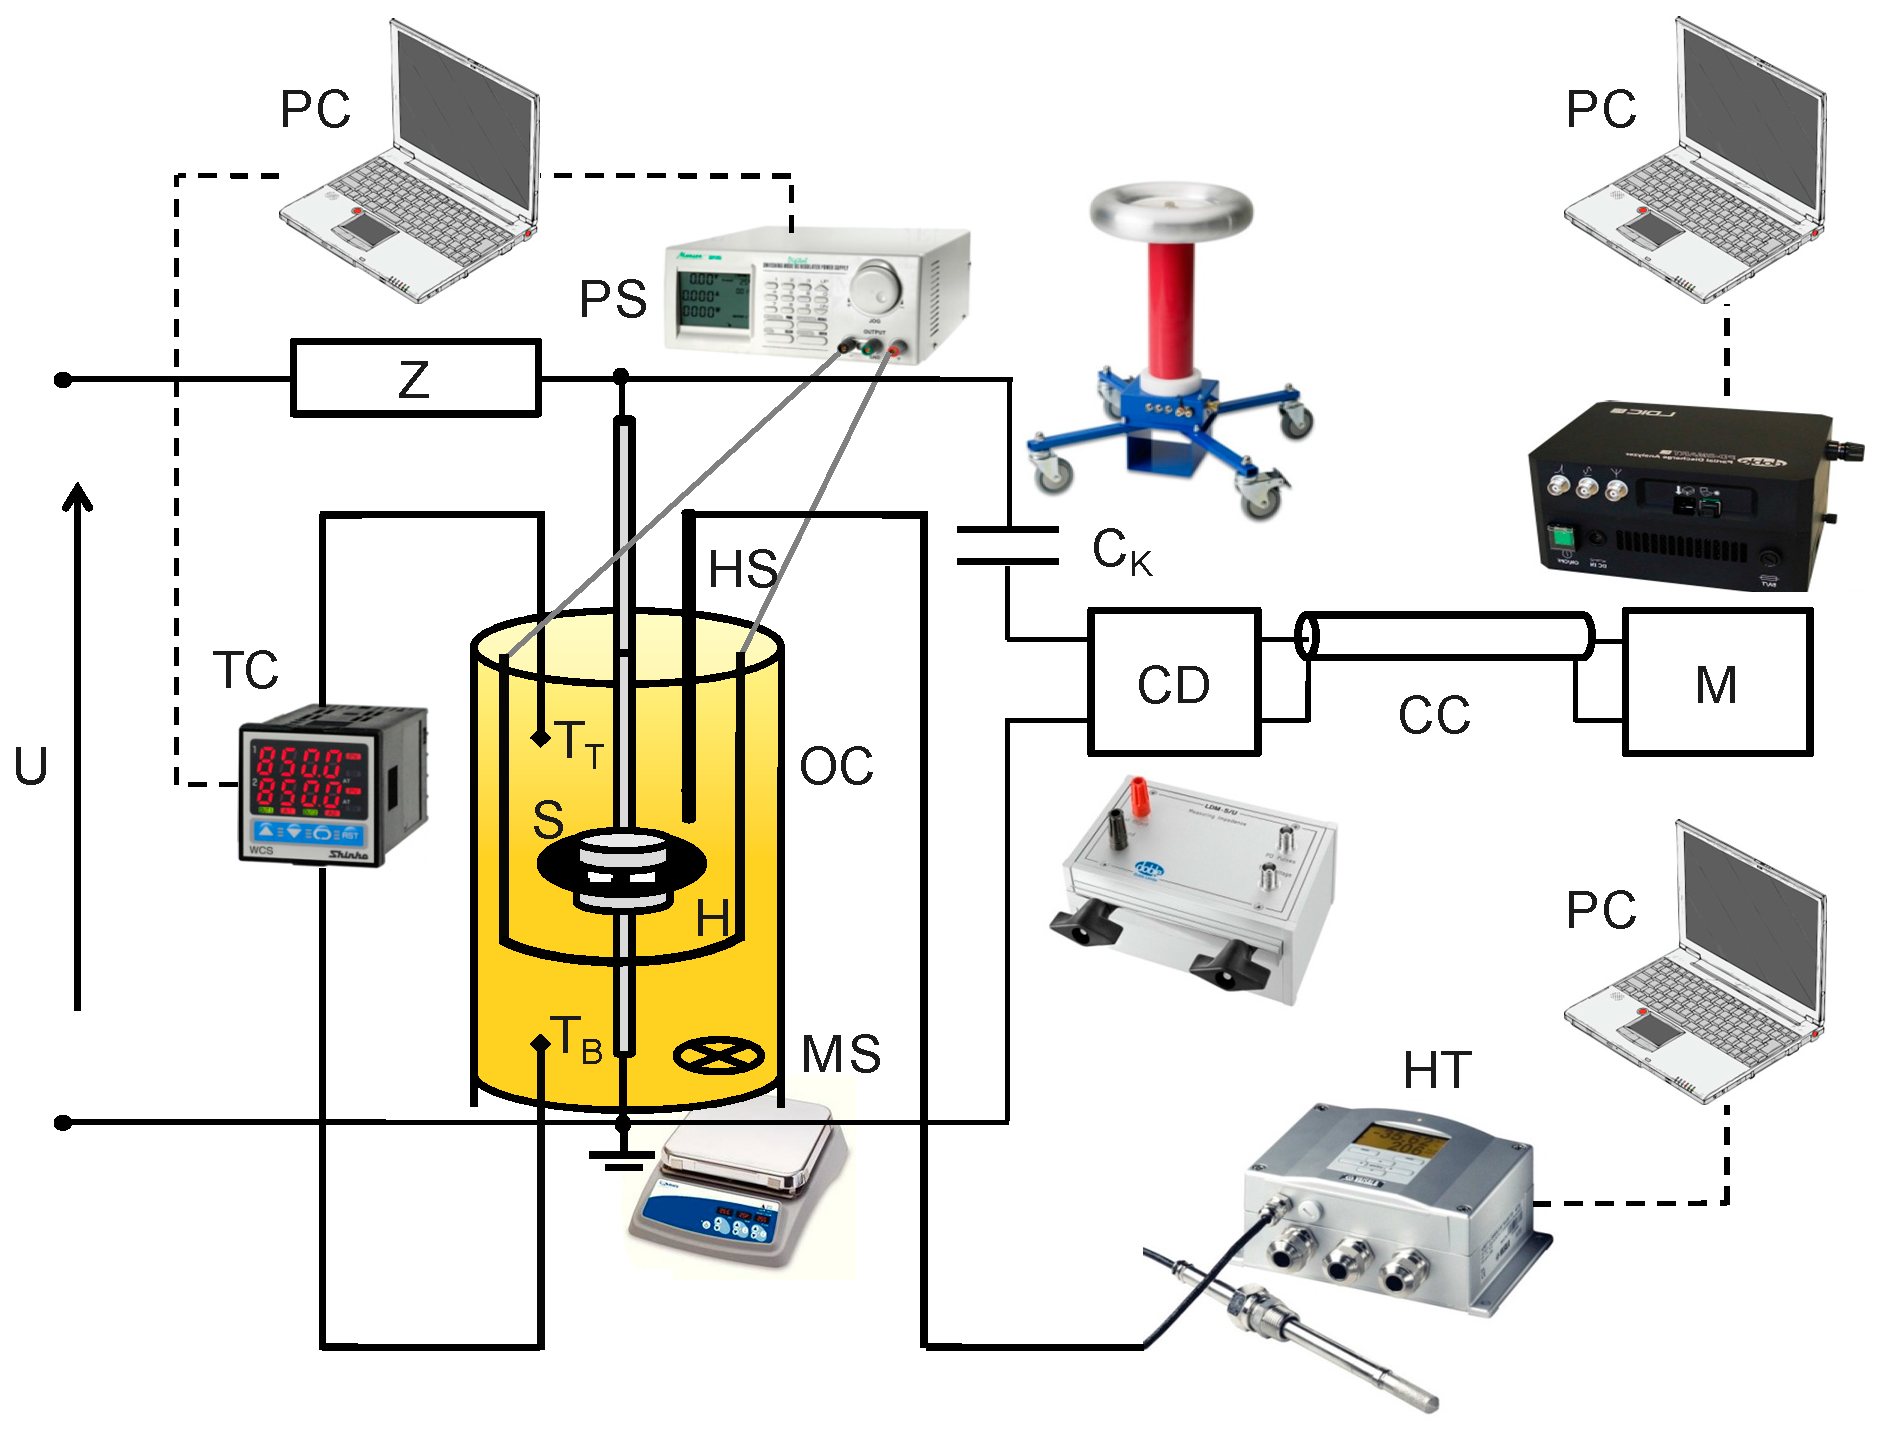
PDtracker works based on the detection of AE pulses registered by piezoelectric contact transducers, which are mounted on the transformer tank wall. The mounting places are usually chosen on the basis of results obtained with the auscultatory technique (PD activity regions can be easily identified by taking acoustic measurements in a number of places on the transformer tank) [
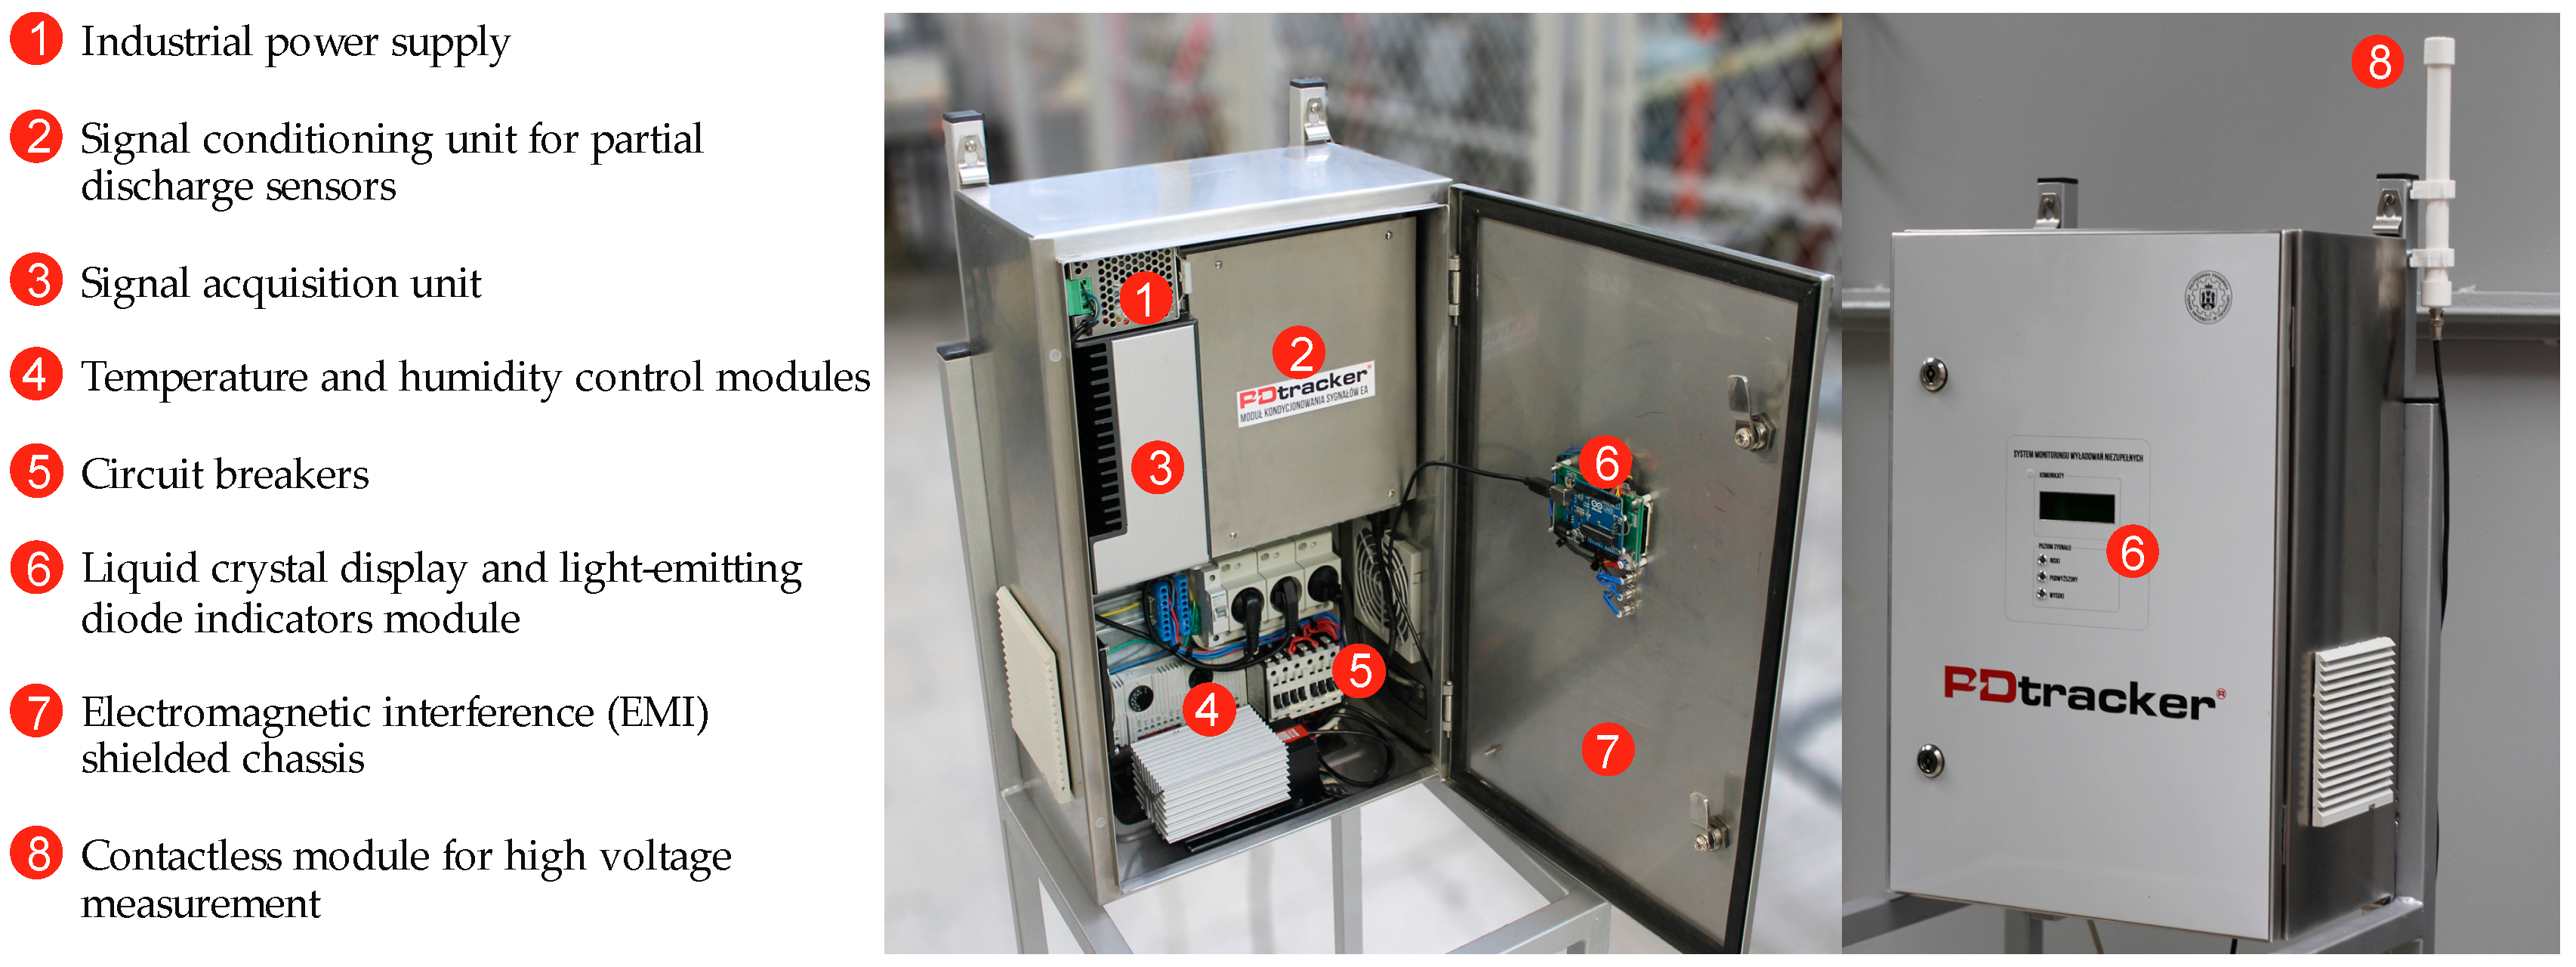
7]. To reduce the influence of external electromagnetic and acoustic interference, the piezoelectric transducer and preamplifier circuit (40 dB) are mounted in a combined metal housing equipped with magnetic holders and passive vibration absorbers. The pre-amplified signals are transmitted to a signal conditioning unit that consists of adjustable-gain amplifiers and band-pass (20–800 kHz) filters. The conditioned signals are then streamed into a signal acquisition unit that includes a powerful, fan-less industrial PC with a high-speed acquisition card (simultaneous-sampling rate up to 20 MS/s). Procedures for data acquisition and signal processing were implemented in a LabVIEW 2009 (National Instruments, Austin, TX, USA) programming environment and are done in real time.
The PDtracker system was designed for continuous, multi-month fieldwork. Therefore, the specialised firmware not only allows for continuous registration of PD activity but also for correct work of the system itself (e.g., temperature and humidity inside the enclosure or operation of the electronic measuring circuits). The firmware is equipped with advanced data processing modules that make it easier to evaluate events and noise filtering (wavelet-based denoising). In addition to registration and calculation of basic parameters (e.g., AE hits rate, energy and amplitude of AE pulses, dominant frequency), the program also creates an event log whose goal is to inform, with a specified frequency (service station or the superior system), about the work of the PD monitoring system or about a threat to the transformer resulting from intensity discharge growth [
8]. External communication is provided using a GSM (Global System for Mobile Communications) modem with an additional antenna or LAN/WLAN network (Local/Wireless Local Area Network). Optionally, in order to increase the reliability of PD detection and to determine the source of the AE signals (internal PDs or external acoustic disturbances), the PDtracker system can be equipped with high-frequency current transformers (split ferrite core; bandwidth from 400 kHz to 10 MHz) installed around the ground wire, from neutral bushing to ground or around the grounded test tap of bushing [
9]. The system can also be equipped with Rogowski Coils installed around the base of the bushing (just above where the porcelain and metal flange join). Currently, work is underway to deploy the UHF module with probes installed in the transformer via the oil drain valve or in the mounting flanges [
10]. A typical arrangement of the sensors for PD monitoring is shown in
Figure 2.
3. Experience with Online Partial Discharge Monitoring of Power Transformers
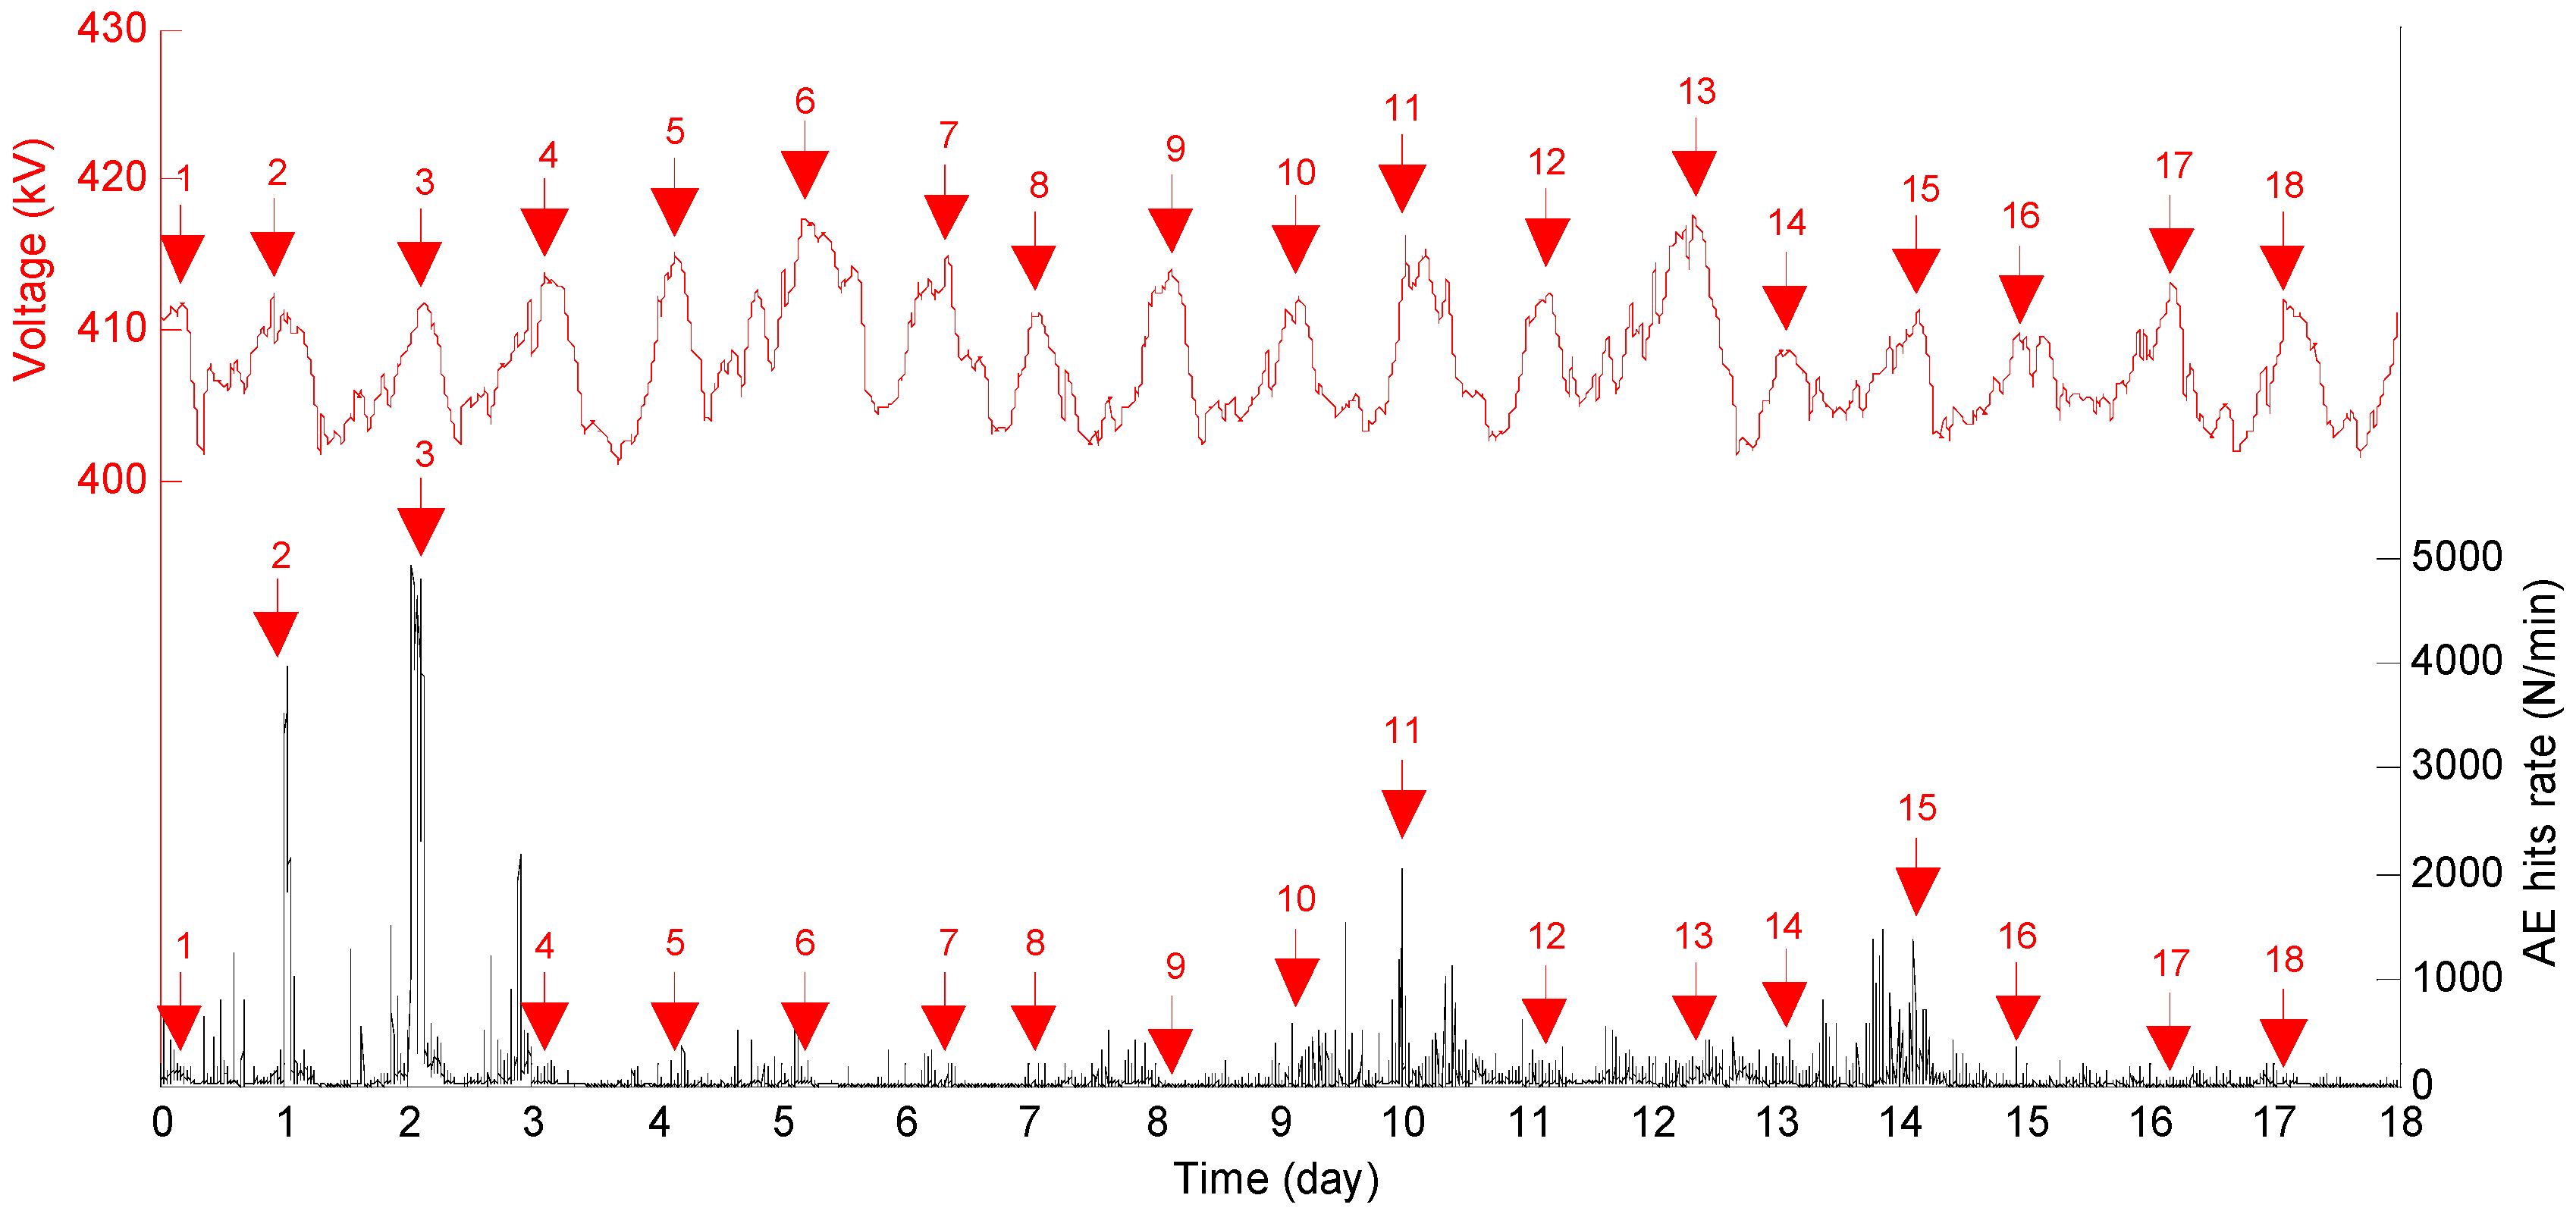
The PDtracker system was implemented in short- or long-term monitoring mode on a dozen power transformers. Most of the transformers were chosen by the power grid operator on the basis of negative results during a periodical diagnosis (the most common cause was a growing level of dissolved gases in oil). In most cases, analysis of the measurement data recorded by the system confirmed the stochastic nature of the PD phenomenon, which is affected by the complexity of the mechanisms of its generation and development (e.g., local electrical stress concentrations in the insulation or on the surface of the insulation, thermal and electrochemical ageing of the insulation). This fact is well illustrated in
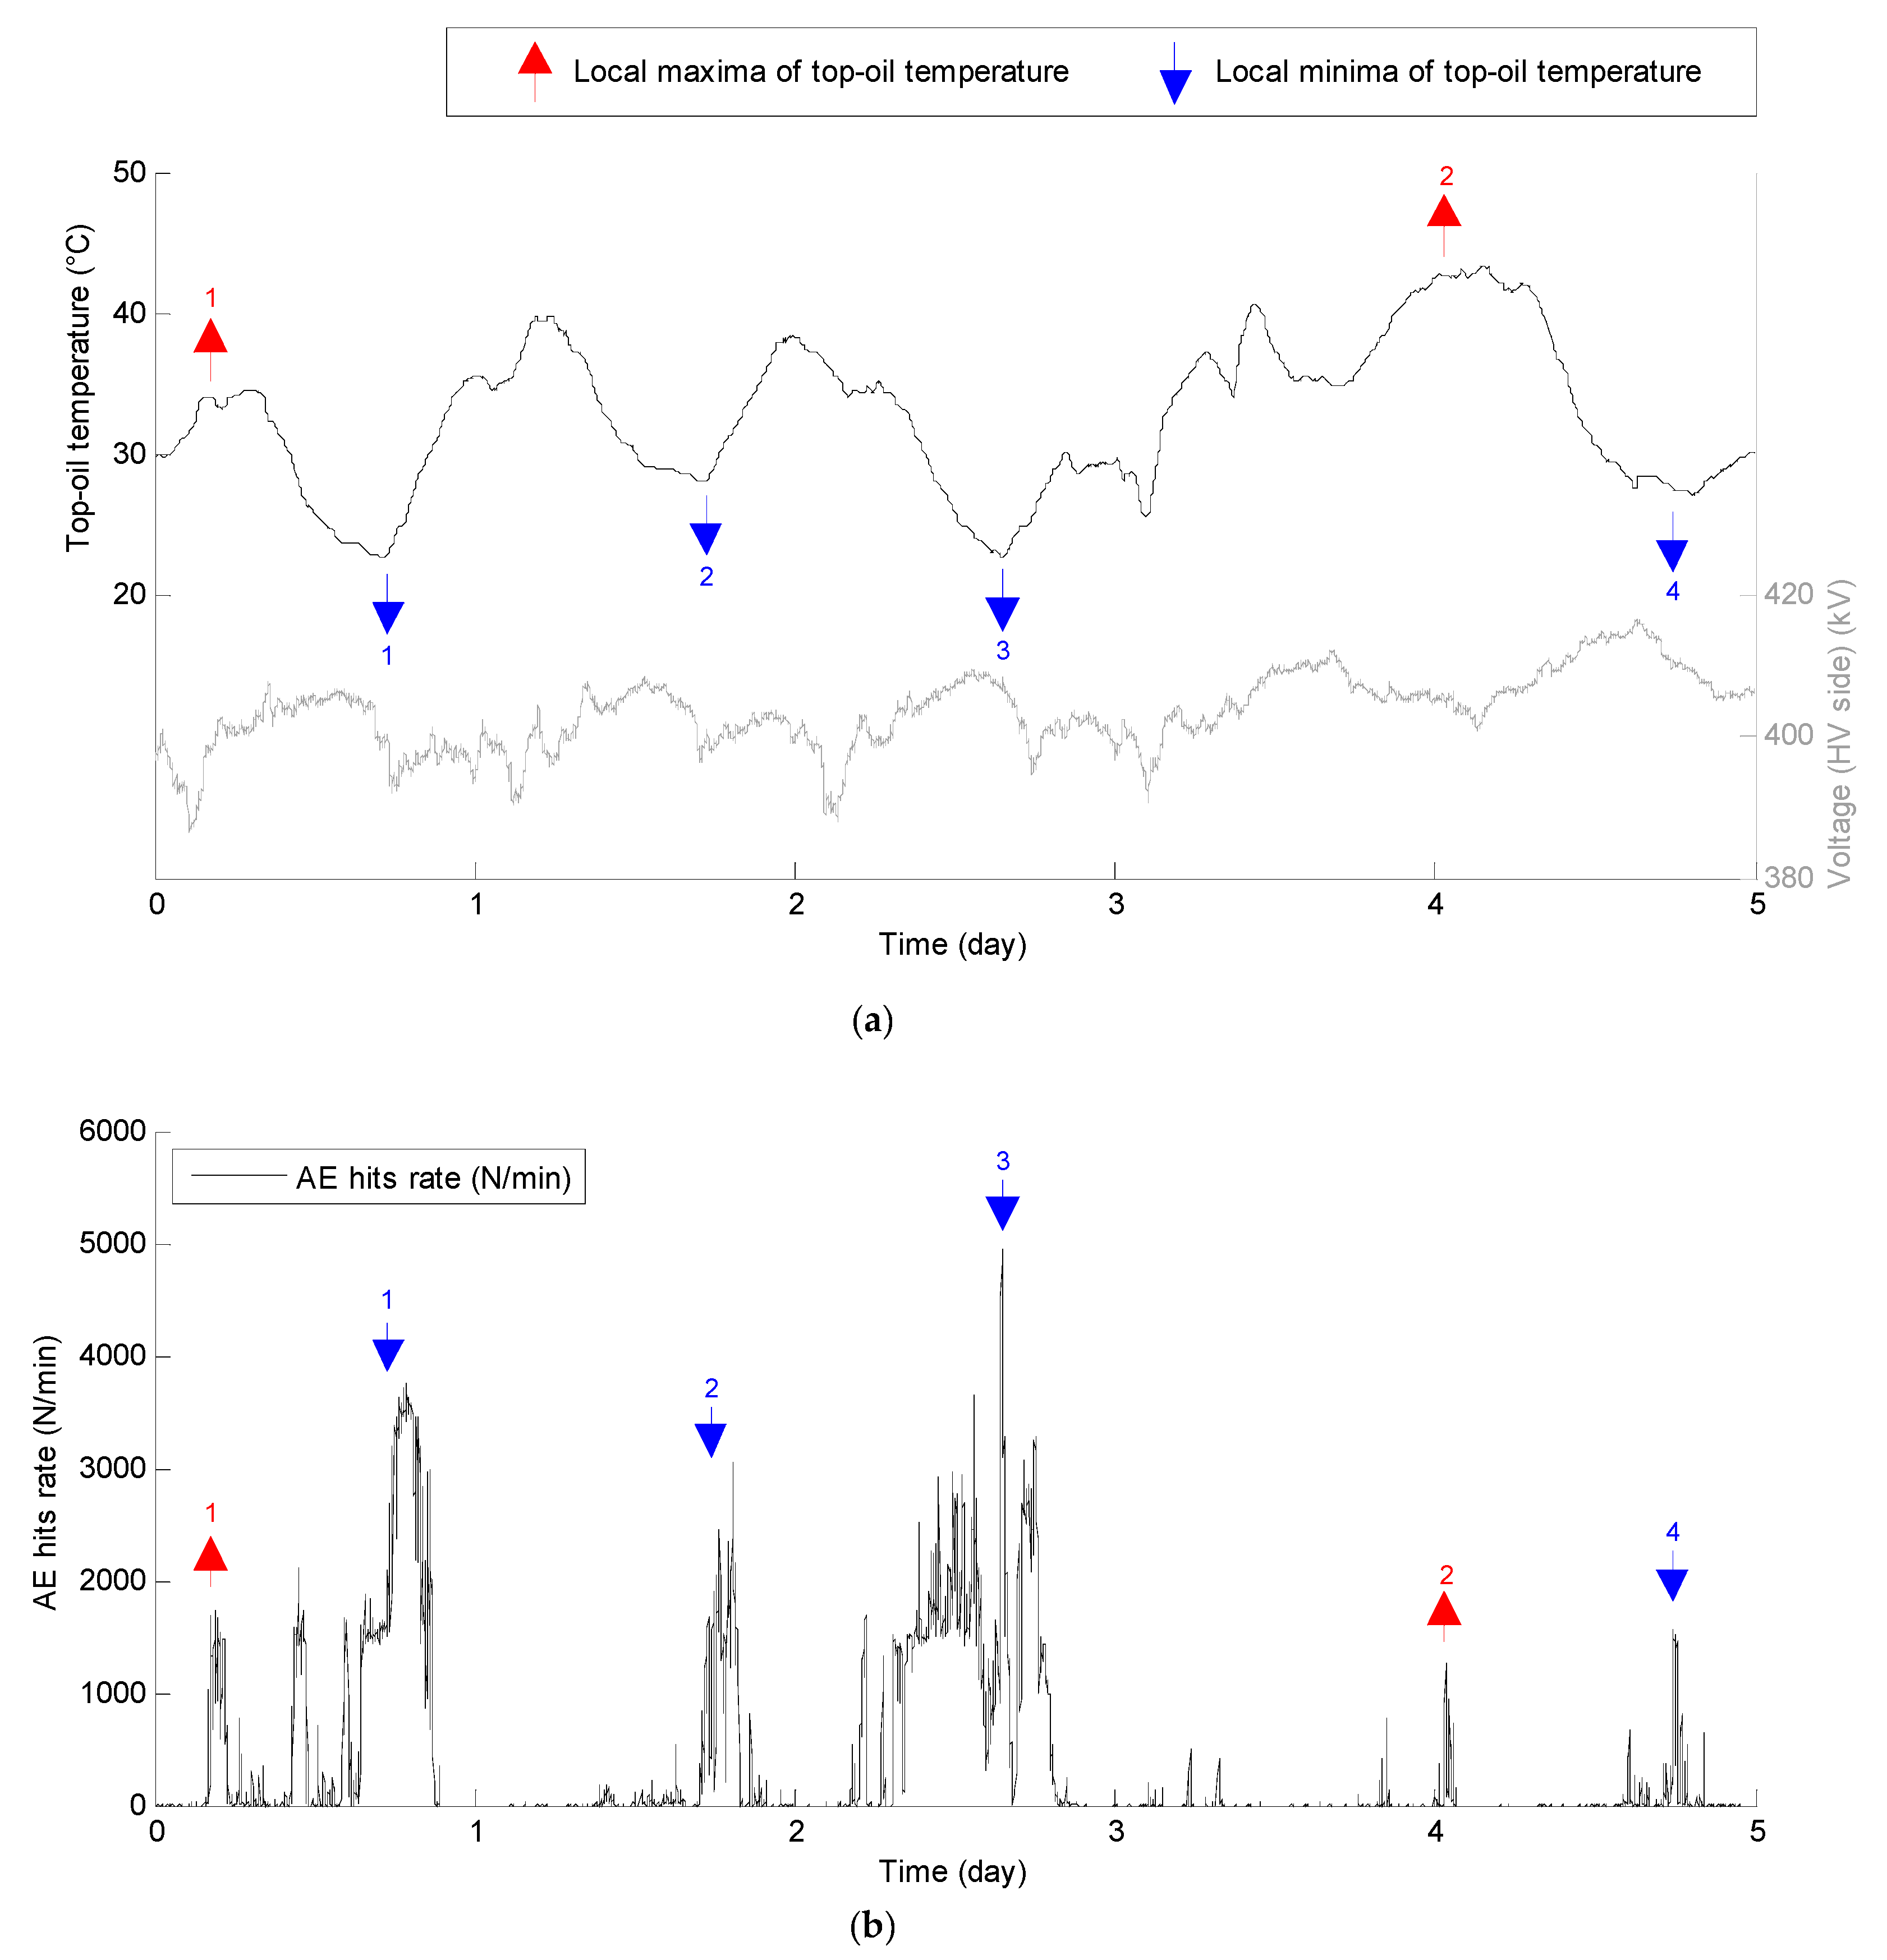
Figure 3, which summarises the activity of PD (AE hits rate per minute) as a function of voltage registered for one of the monitored power transformers (330 MVA, 400/110 kV). In the analysed period (18 days), it may be observed that it was not always increased electric field intensity (in
Figure 3, the voltage peaks are marked by arrows) that determined the moment of initiation of PD phenomena and its activity level.
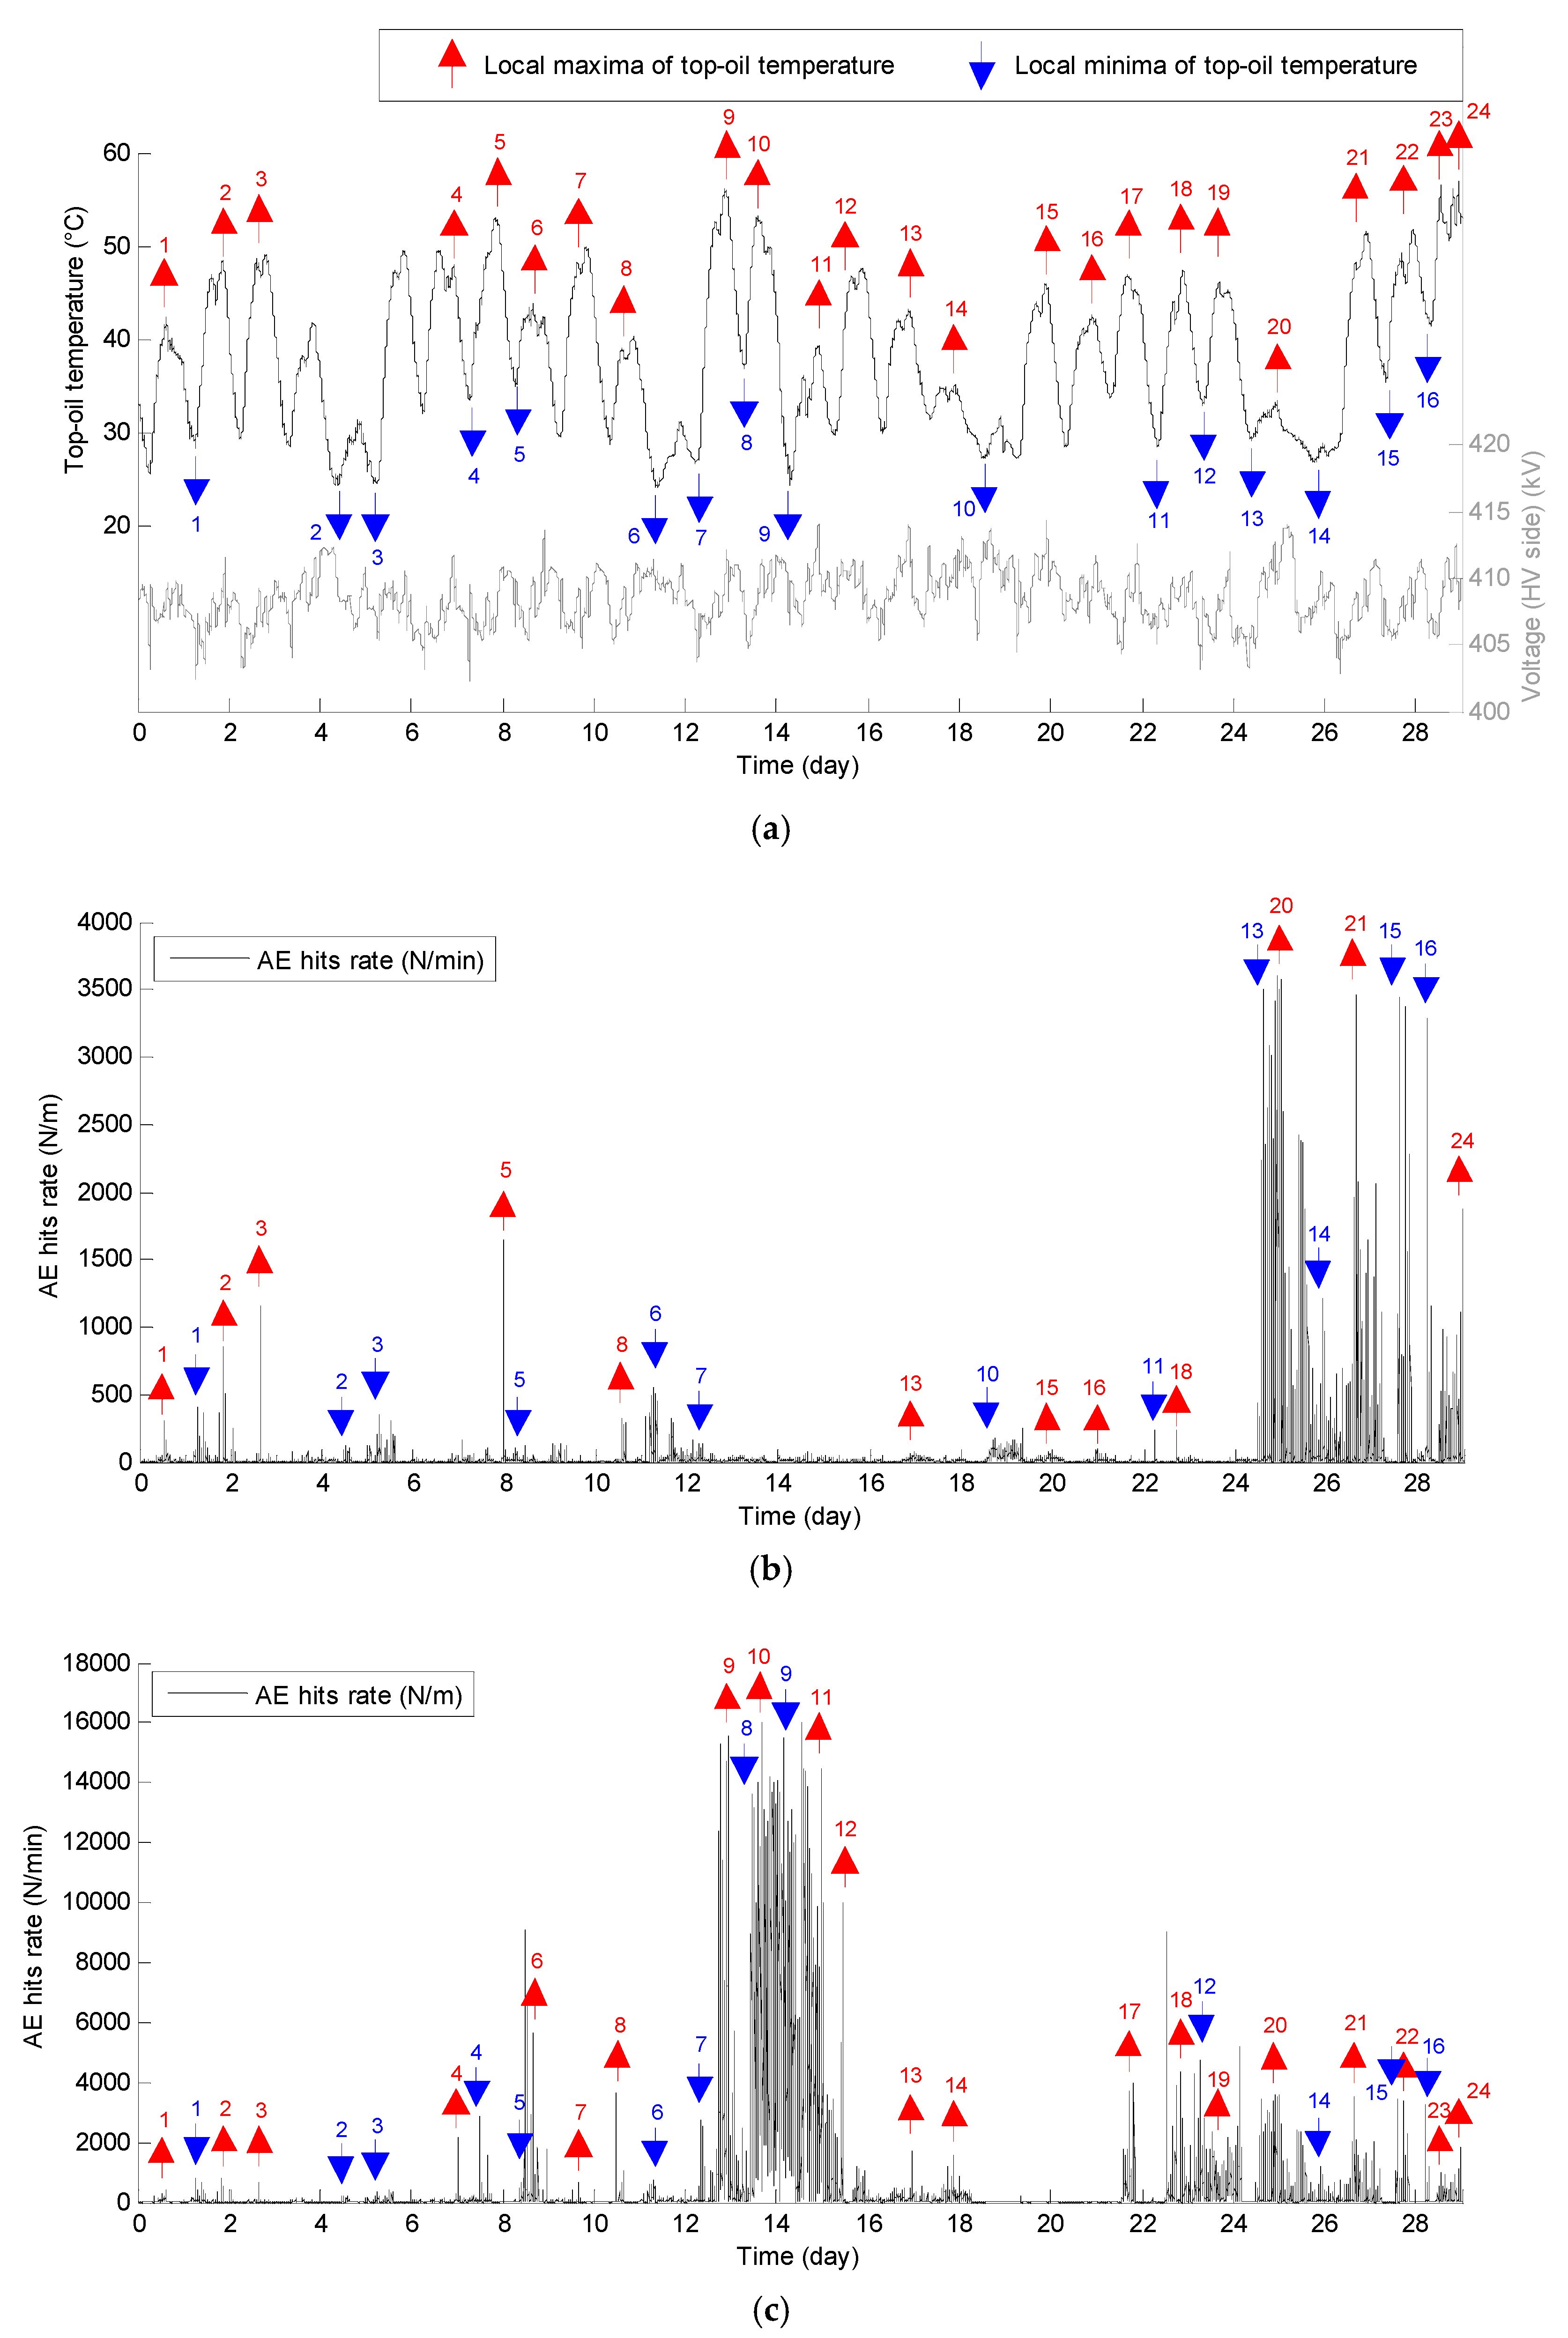
In the case of the transformer as discussed above, an interesting relationship was observed between the intensity of the PD and the top-oil temperature estimated based on the thermal model of the power transformer (according to IEC 60076-7 Loading Guide for Oil-Immersed Power Transformers [
11]) implemented in the substation superior monitoring system (supervisory control and data acquisition (SCADA)) and temperature measurements carried out by the thirteen industrial PT100 sensors (two sensors were installed under the top cover of the transformer tank, ten sensors were installed at the inlet and outlet of the radiators and one sensor was used to monitor the ambient temperature).
An analysis of the measurement data shows that PDs were generated not only in the periods in which the voltage was increasing but also when its value was decreasing or relatively low. What is important to note is that, especially in the context of the research discussed in this article, it was observed that the periods of increased intensity of PDs often coincided with the local maxima and minima of top-oil temperature.
Figure 4 shows the results of measurements worked out for a selected period (February 2012) during which the monitoring system reported the highest activity of PDs. The largest differences between the minimum and maximum top-oil temperature (over 30 °C) were recorded periodically during periods including the Saturday (or Sunday) minimum and the Monday maximum power demand. It can be noticed that the monitoring system was recording high PD activity during these periods.
A similar correlation between PD intensity and changes in the temperature of oil was also observed during monitoring of the 250 MVA transformer (the system was running for five days), for which the periodic DGA (dissolved gas analysis) tests (
Table 1) and the AE inspection indicated the presence of PD phenomena (
Figure 5).
An analysis of the literature shows that the physical mechanism describing the detected correlation has not been studied and well understood yet. The authors, based on their own experience in the field of testing the degree of moisture of oil-paper insulation and the PD phenomenon, put forth the hypothesis that migration of water (from cellulose to oil and vice versa) occurring during a cycle of cooling and heating the transformer oil may be responsible for this state of affairs. It was also assumed that this could have a direct impact on the decrease in electrical strength at the cellulose–oil interface, which, in turn, should facilitate the initiation and development of PDs.
4. Water Migration in an Oil-Paper Insulation System in the Context of Partial Discharge Phenomena
In the transformer insulation system, water migrates between cellulose materials and mineral oil or other liquid insulation. It is well known that an increase in the insulation temperature is the cause of water migration from paper to oil, whereas its decrease is the cause of migration in the opposite direction. The direction of water migration is due to the fact that hygroscopicity of cellulose decreases and water solubility in dielectric liquids increases along with a temperature rise [
12,
13,
14,
15]. Water migration in a transformer in service is mainly caused by: (i) load changes; (ii) non-uniform temperature distribution inside the insulation; and (iii) ambient temperature changes.
Moreover, according to [
16,
17,
18], the thickness of the cellulose materials also strongly affects the process of water migration. In a brochure [
17], distinguishing the insulating system components into three insulation structures such as: “thick structures”, “thin and cold structures” and “thin and hot structures” can be found. Due to the high temperature and small thickness of the cellulose materials, water migration in the areas of the "thin and hot structure" is the most dynamic.
Issues related to the influence of temperature changes and water migration on the development of PDs and electrical strength of the insulating system were analysed in several scientific centers. The main conclusions of these analyses are shown below.
Based on a research study, the authors of [
19] demonstrated that the breakdown voltage of pressboard impregnated with mineral oil depends not only on insulation temperature changes, but, first of all, on water content. The authors of this paper noted that the temperature changes of a dry pressboard with a water content equal to 0.5% insignificantly affected its electrical strength, whereas with moistened pressboard (3.5%), a 25% decrease in breakdown voltage was observed in the case of a small temperature gradient (0.08 °C/min) and a 40% decrease in the case of a high temperature gradient (0.13 °C/min). According to the authors of this paper, the decrease in electric strength of the pressboard should be explained by the transient state and a disturbance of the moisture equilibrium in the oil-paper insulation system. Similar conclusions can be found in [
20].
The authors of [
21] also noted that the exposure time of the temperature influenced the intensity of PDs, i.e., the higher the temperature, the more dynamic the phenomenon. This relationship is associated with the fact that the higher the temperature and the longer the exposure time, the more intensive the water migration is from the cellulose materials to the electro-insulating liquid.
Water saturation of oil increases and significantly decreases its electrical strength as a consequence of water migration from cellulose to dielectric liquid [
22,
23]. Such a situation is particularly dangerous when the water saturation limit is exceeded and dispersed and free water occurs. The increase in water saturation of oil affects PD activity, which was confirmed in [
24]. In the literature, information indicating the dependence of water content in the insulation system on PD activity is described by means of inception voltage of PDs [
25] and the number of impulses [
26]. Such a situation can be explained by a local weakening of oil insulation due to the presence of water.
The authors of this paper, based on the literature analysis and their experience gained during PD monitoring of power transformers, assumed that a local increase in the water content can appear at the interface of cellulose and oil, which can then lead to surface discharges. Undoubtedly, the electric field intensity contributes to the local increase in moisture. Information concerning the influence of the electric field on the motion of water to the area of the highest electric field intensity may be found in [
24,
27]. Such a field will occur exactly at the materials’ interface, which is caused due to the different electric permittivity of mineral oil (ε = 2.2) and the cellulose material impregnated with mineral oil (ε = 4.4). Pollution particles of electric permittivity significantly different from the permittivity of mineral oil are particularly easily drawn into the area of the highest electric field intensity. An example of such a contamination is water (ε = 80.1 at 20 °C). In particular, contaminants with relatively large dimensions are drawn to the area of the highest electric field intensity. However, in [
27], it was demonstrated that also water dissolved in oil could migrate to the area of the highest electric field intensity. The author of [
27] noticed that the water content at the interface area increases to a certain limit value, beyond which the concentration of water definitely decreases. For the conditions of the experiment assumed in [
27], the highest increase of the water content occurred at an electric field intensity in the range between 15 kV/cm and 20 kV/cm. Such an electric field occurs in a real transformer insulation system. It should be pointed out that an even lower electric field intensity leads to the motion of water molecules moving to the area of the highest electric field.
According to the authors of this paper, during insulation, temperature growth as a consequence of water migration from cellulose to the oil and its concentration at the interface of these materials, surface resistivity of cellulose is considerably reduced, which can lead to the appearance of surface discharges. The situation is not improved in the case of a temperature drop. Surface discharges may still occur and even their intensification is possible. This is due to a decrease in oil electric strength resulting from the increase in water saturation of oil. This increase is caused by a decrease in the water saturation limit due to a temperature drop.
The assumptions presented above result from the literature analysis and the experience of the authors gained during PD monitoring of power transformers as described in
Section 3. An extensive experiment was conducted in order to confirm the crucial influence of the presence of water in an oil-paper insulation system on the possibility of the appearance of PDs. The results of these research studies are presented in the next section.
5. Experiment
5.1. Measurement Set-Up
A measurement set-up was designed and compiled for the experiment. It allowed for simultaneous realisation of multiple tasks, i.e., (i) the generation of a surface PD in the model of an oil-paper insulation system; (ii) PD detection by means of the conventional electrical method according to norm IEC 60270 [
28]; (iii) controlling and monitoring of the oil temperature; (iv) monitoring of moisture content in oil; and (v) oil-circulation forcing in the test chamber. The temperature of oil was measured by means of three sensors. Two of them (Pt1000 sensors) were connected to the temperature controller (TC). These sensors were used to control of the heating procedure and to monitor the top (
TT) and the bottom (
TB) oil temperature. Moreover, the temperature of the oil in the middle part of the chamber was measured using a Vaisala probe (humidity and temperature sensor (HS), Vaisala, Helsinki, Finland). The humidity and the temperature sensors were placed directly above the magnetic stirrer (700 rpm) to improve their response time. A schematic diagram of the measurement set-up is presented in
Figure 6.
5.2. Electrode System for Partial Discharge Generation
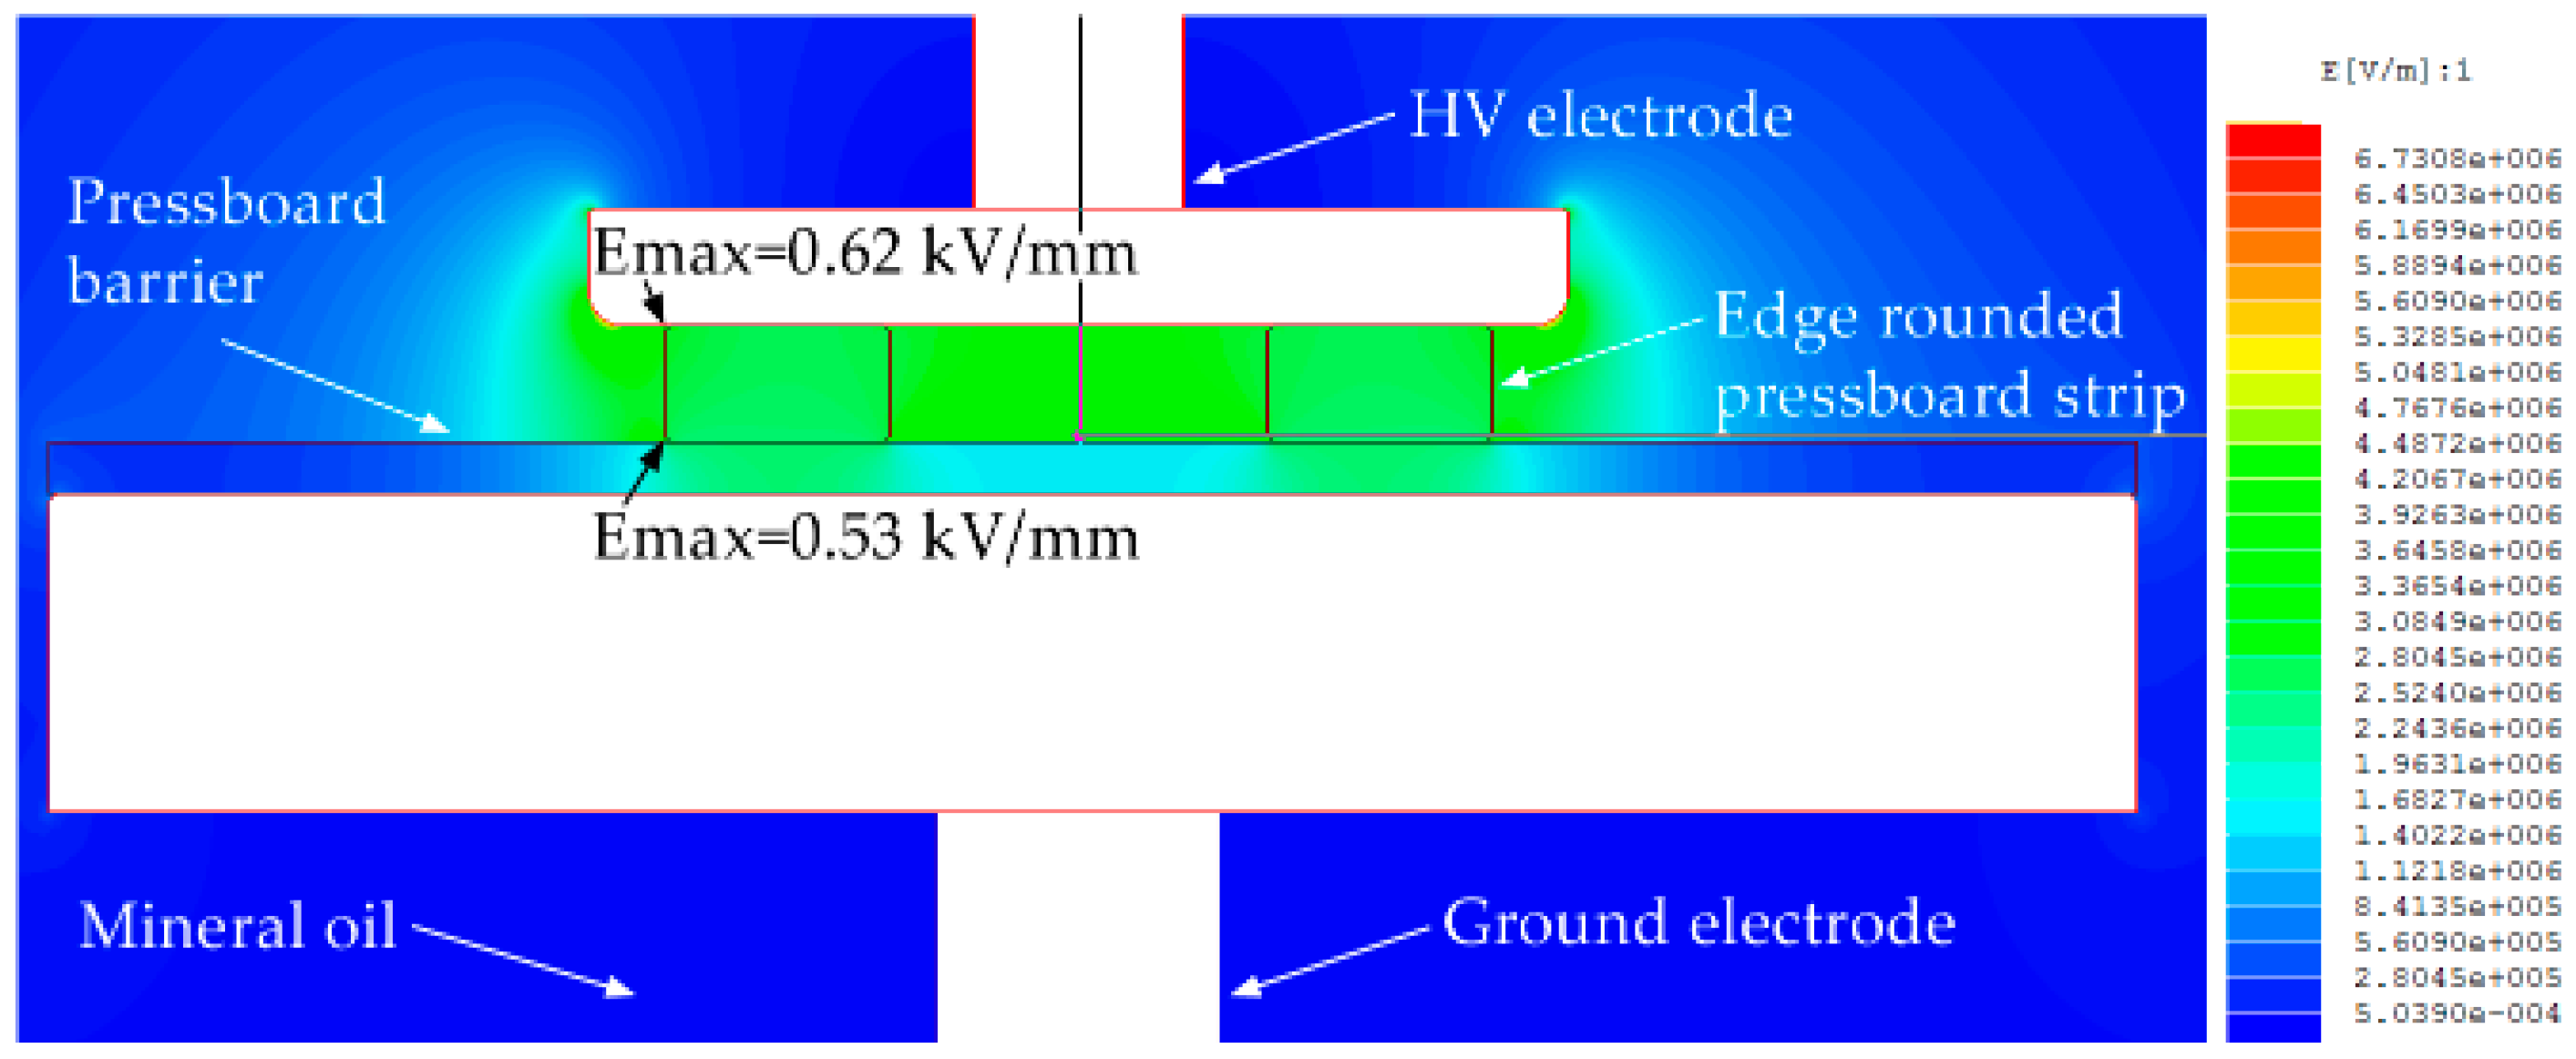
Generally, all insulation systems of the transformer can be treated as systems of the oil-barrier type in which the initiation and development of PDs always takes place in the oil. In an ideal set-up of this type, the electric field is perpendicular to the barrier surface and parallel (tangential) to the spacer elements (strips, spacers, etc.). In this configuration, the ratio of electric field strength in the barrier to electric field strength in the oil channels is inversely proportional to the ratio of electrical permittivity of the barrier (ε = 3.6–4.7) and oil (ε = 2.2). Thus, the electric field strength in the compartments does not exceed 60%–70% of the electric field strength in the oil channels. A breakdown of barriers that are located perpendicularly to the force lines of the electric field can only be the result of discharges in oil. Spacers in oil ducts in the ideal oil-barrier system are “unbreakable” because the cross-stress here is almost the same as stress in the oil channels. The cross-strength of the spacer elements is always greater than their surface strength. Therefore, the development of PD on strips or spacers can be caused almost exclusively by a loss of surface strength. According to the previously outlined theoretical assumptions, this may happen as a result of the migration of water caused by a local increase in moisture (both at the surface of the spacer and at the interface of the oil-pressboard). An important factor may also be the process of entanglement of water molecules in the area of higher electric field strengths (e.g., in the oil gap created by the rounded edge of the pressboard strip).
Based on these assumptions, the authors decided to use the electrode arrangement presented in
Figure 7a, which approximately reproduces the part of the transformer insulation, i.e., the oil duct-strip-barrier (
Figure 7b).
This electrode system allows for generating surface discharges in a uniform electric field where the normal component of the field is negligible. In the experiment, it was decided to investigate this type of PD for two reasons. First, for PD initiation a deterioration of the dielectric properties of the surface of the pressboard or area at the interface of the oil–pressboard must take place (according to the hypothesis put forward in this paper, migration of water may be responsible for this state of affairs). Second, this type of discharge has, in its initial stage, relatively low energy, which ensured that the test samples would not degrade rapidly. Of course, creeping discharges are more dangerous to the transformer insulation system (surface discharges in a non-uniform electric field with a large normal component of the electric field strength vector). Unfortunately, with regard to the research assumptions, they are characterised by too high energy (at an early stage of development), and, usually, within a short period of time, this leads to a breakdown of the sample. Additionally, their ignition depends much more on the set-up geometry and the field conditions related to them.
Figure 8 shows the analysis of the distribution of the electric field for the electrodes used in the experiment. The voltage applied to the system was 30 kVrms. The simulation results show that the greatest electric field intensity is in oil gaps created by the rounded edge of the pressboard strips. The authors hypothesised that, during the process of moisture migration, water molecules are drawn into this area and may help to initiate the surface discharge.
5.3. Sample Preparation
For this research study, the authors used two kinds of pressboard, both made of sulphate wood pulp. One of the pressboards was used in a transformer insulation system as a barrier and the second one as a strip. In order to achieve different water content, the samples were dried in a vacuum chamber at a pressure of 5 mbar and in a temperature equal to 90 ± 5 °C for a time period equal to 24 h. After drying, the samples were placed in a climatic chamber. To achieve the required moisture, the samples were conditioned in contact with air of different relative humidity according to isotherms of water sorption as presented in [
29] for a period equal to about 30 days. After conditioning, the samples were impregnated with uninhibited naphthenic transformer oil—Nytro Taurus (Nynas, Stockholm, Sweden), in a vacuum chamber, and the water content was measured by means of the Karl Fischer titration method according to the standard [
30]. The following levels of water content were obtained in the pressboard samples: 0.4%, 1.6%, 2.5%, and 5.7%. According to the guidelines for interpreting the percentage of moisture as proposed in [
31], the first two values correspond to dry insulation. The next two values correspond to wet paper (2.5%) and excessively wet paper (5.7%). Samples prepared in this manner were stored in hermetically sealed vessels for a period equal to about 30 days. After that, the samples were tested according to the procedure described below.
5.4. Experimental Procedure
The experimental procedure involved the following steps:
- Step 1
Three-day conditioning of the test chamber with new mineral oil at a temperature of 25 °C.
- Step 2
Placement of the insulation sample in the test chamber.
- Step 3
Calibration of the PD measuring system.
- Step 4
Application of high voltage (30 kVrms) to the electrode system.
- Step 5
Oil heating in a temperature range from 25 °C to 75 °C for two days under a linear temperature-rising programme.
- Step 6
Oil cooling in a temperature range from 75 °C to 25 °C for the next two days.
The temperature was monitored during the experiment in the following points: (i) top-oil; (ii) bottom-oil; (iii) near the pressboard barrier; and (iv) external wall of the test chamber. Moreover, the PD apparent charge, water activity (amount of water in a substance relative to the total amount of water it can hold) and moisture content of oil expressed in ppm were simultaneously registered. The water activity of mineral oil was measured by means of Vaisala MMT 330 moisture and temperature transmitter equipped with capacitive sensor. The water content in oil expressed in ppm by weight was calculated on the basis of water activity and temperature measurement results.
5.5. Experimental Results
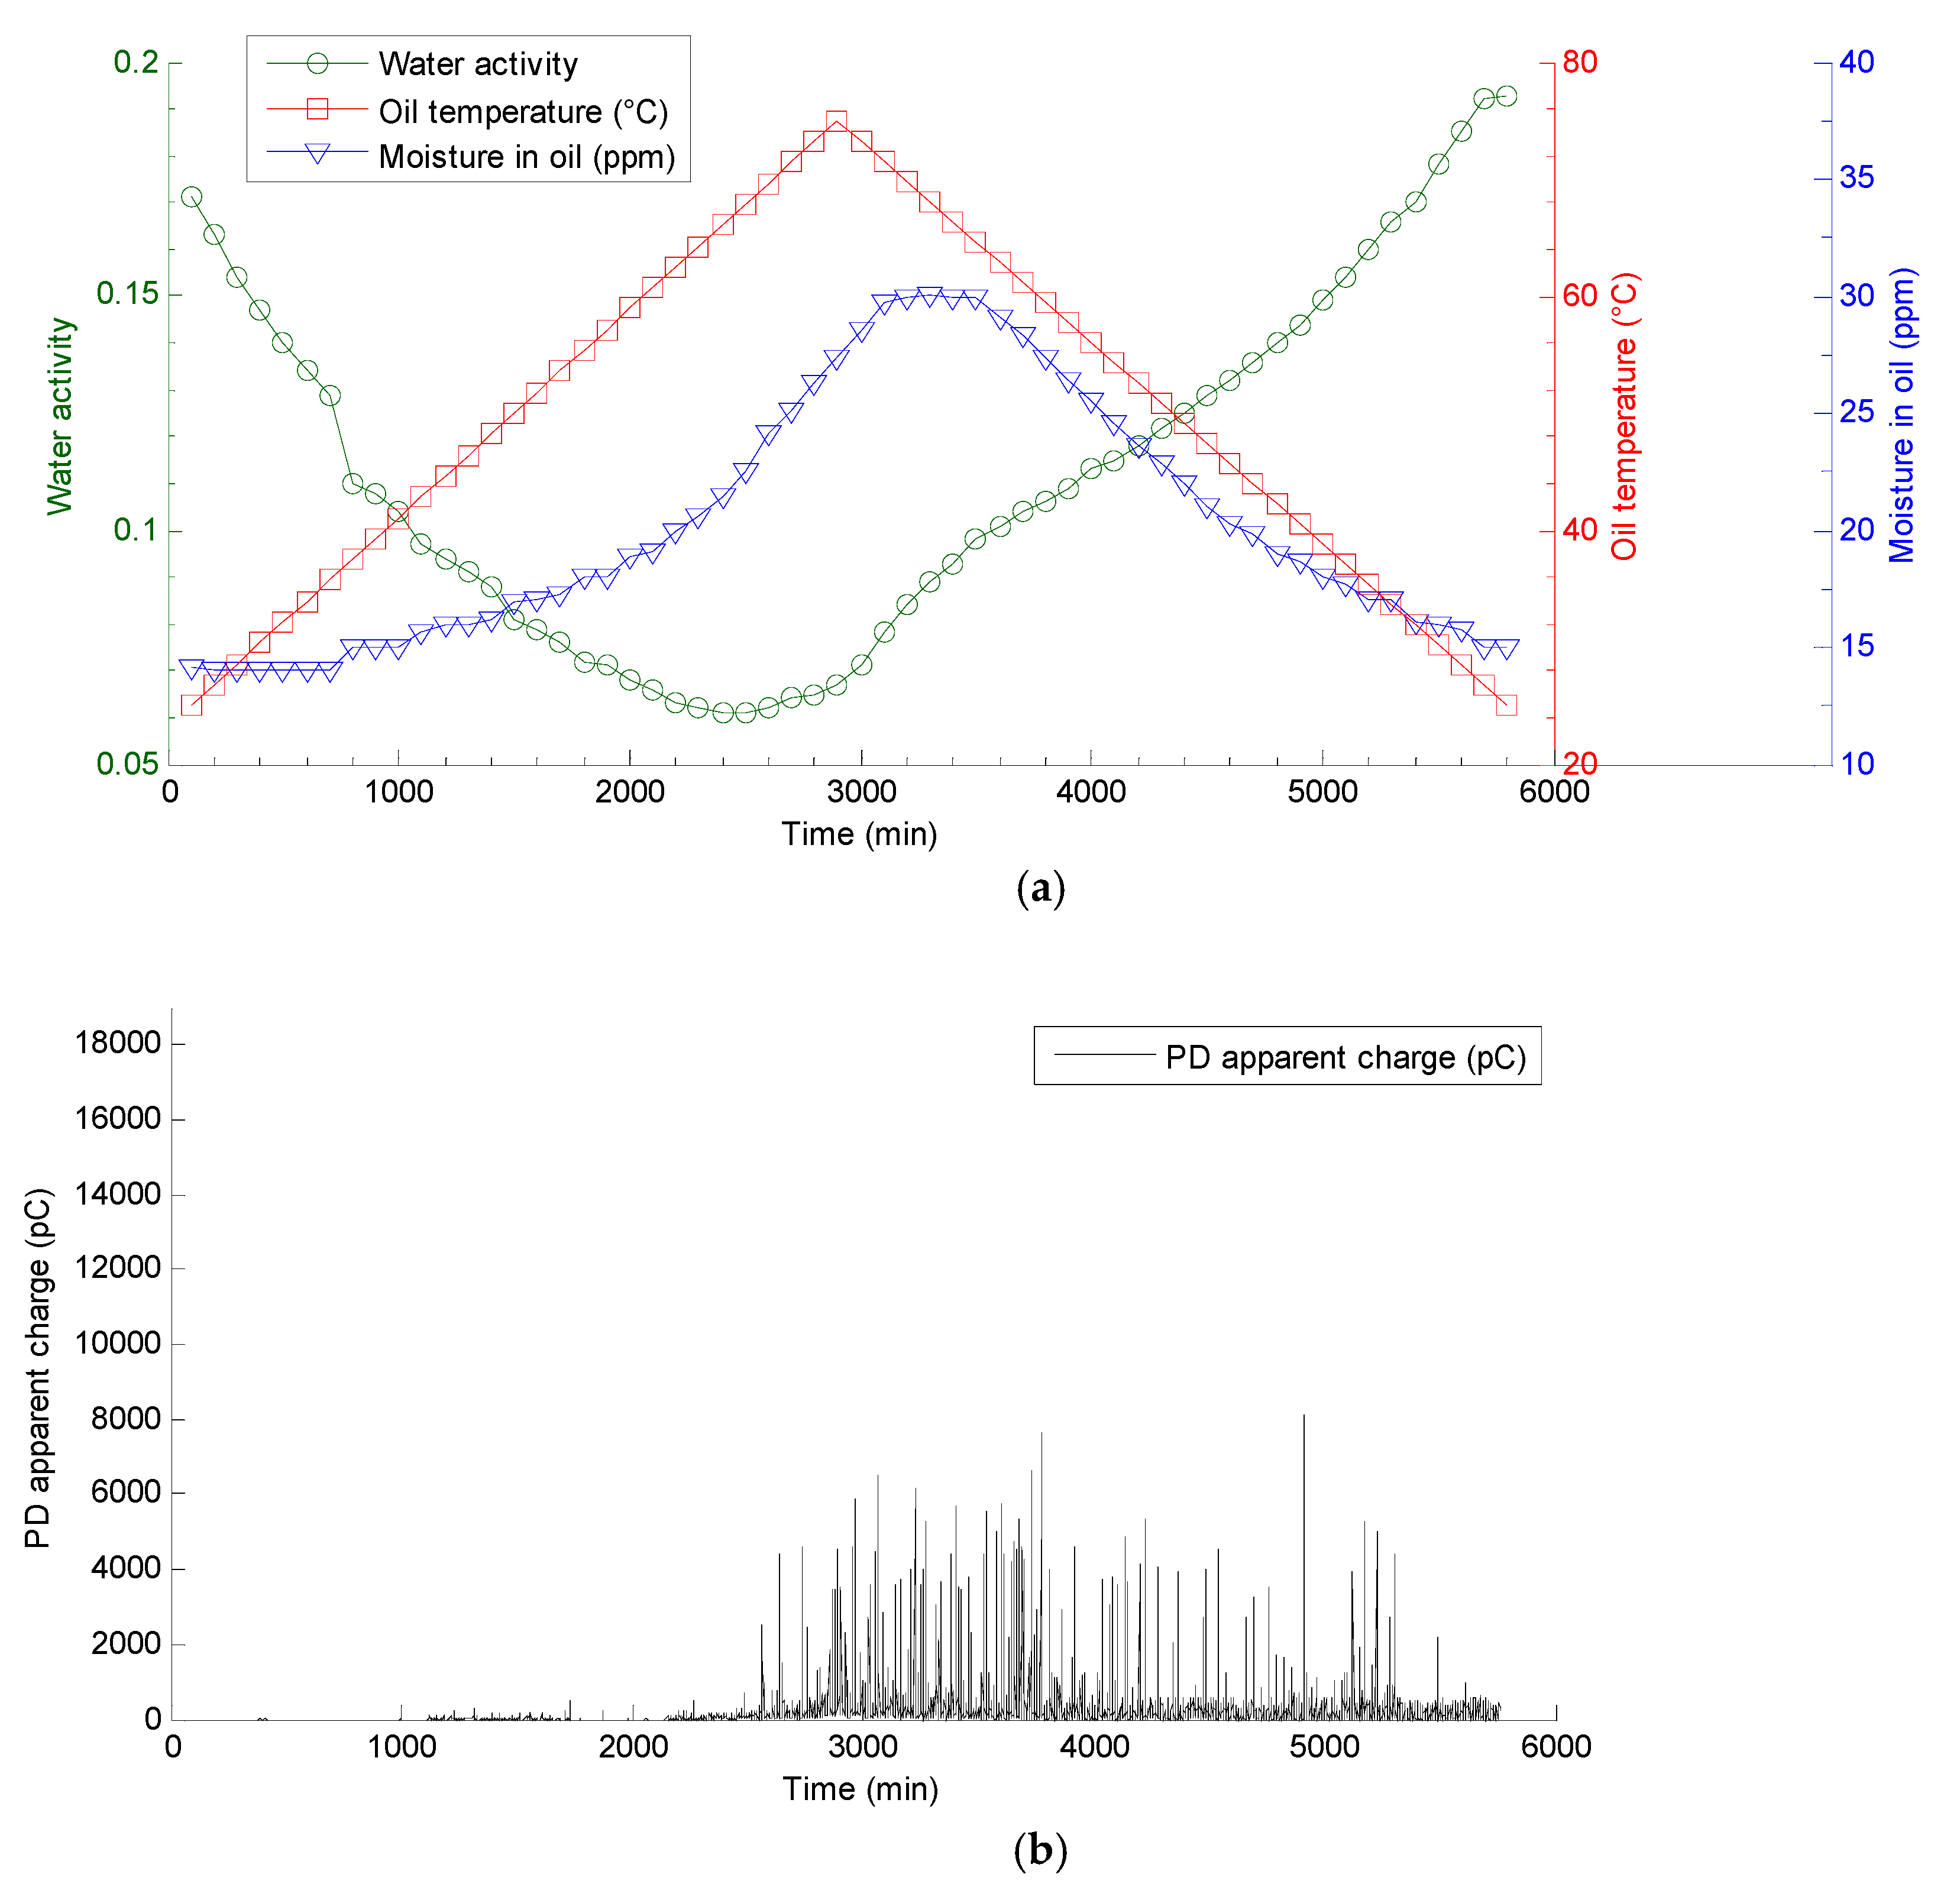
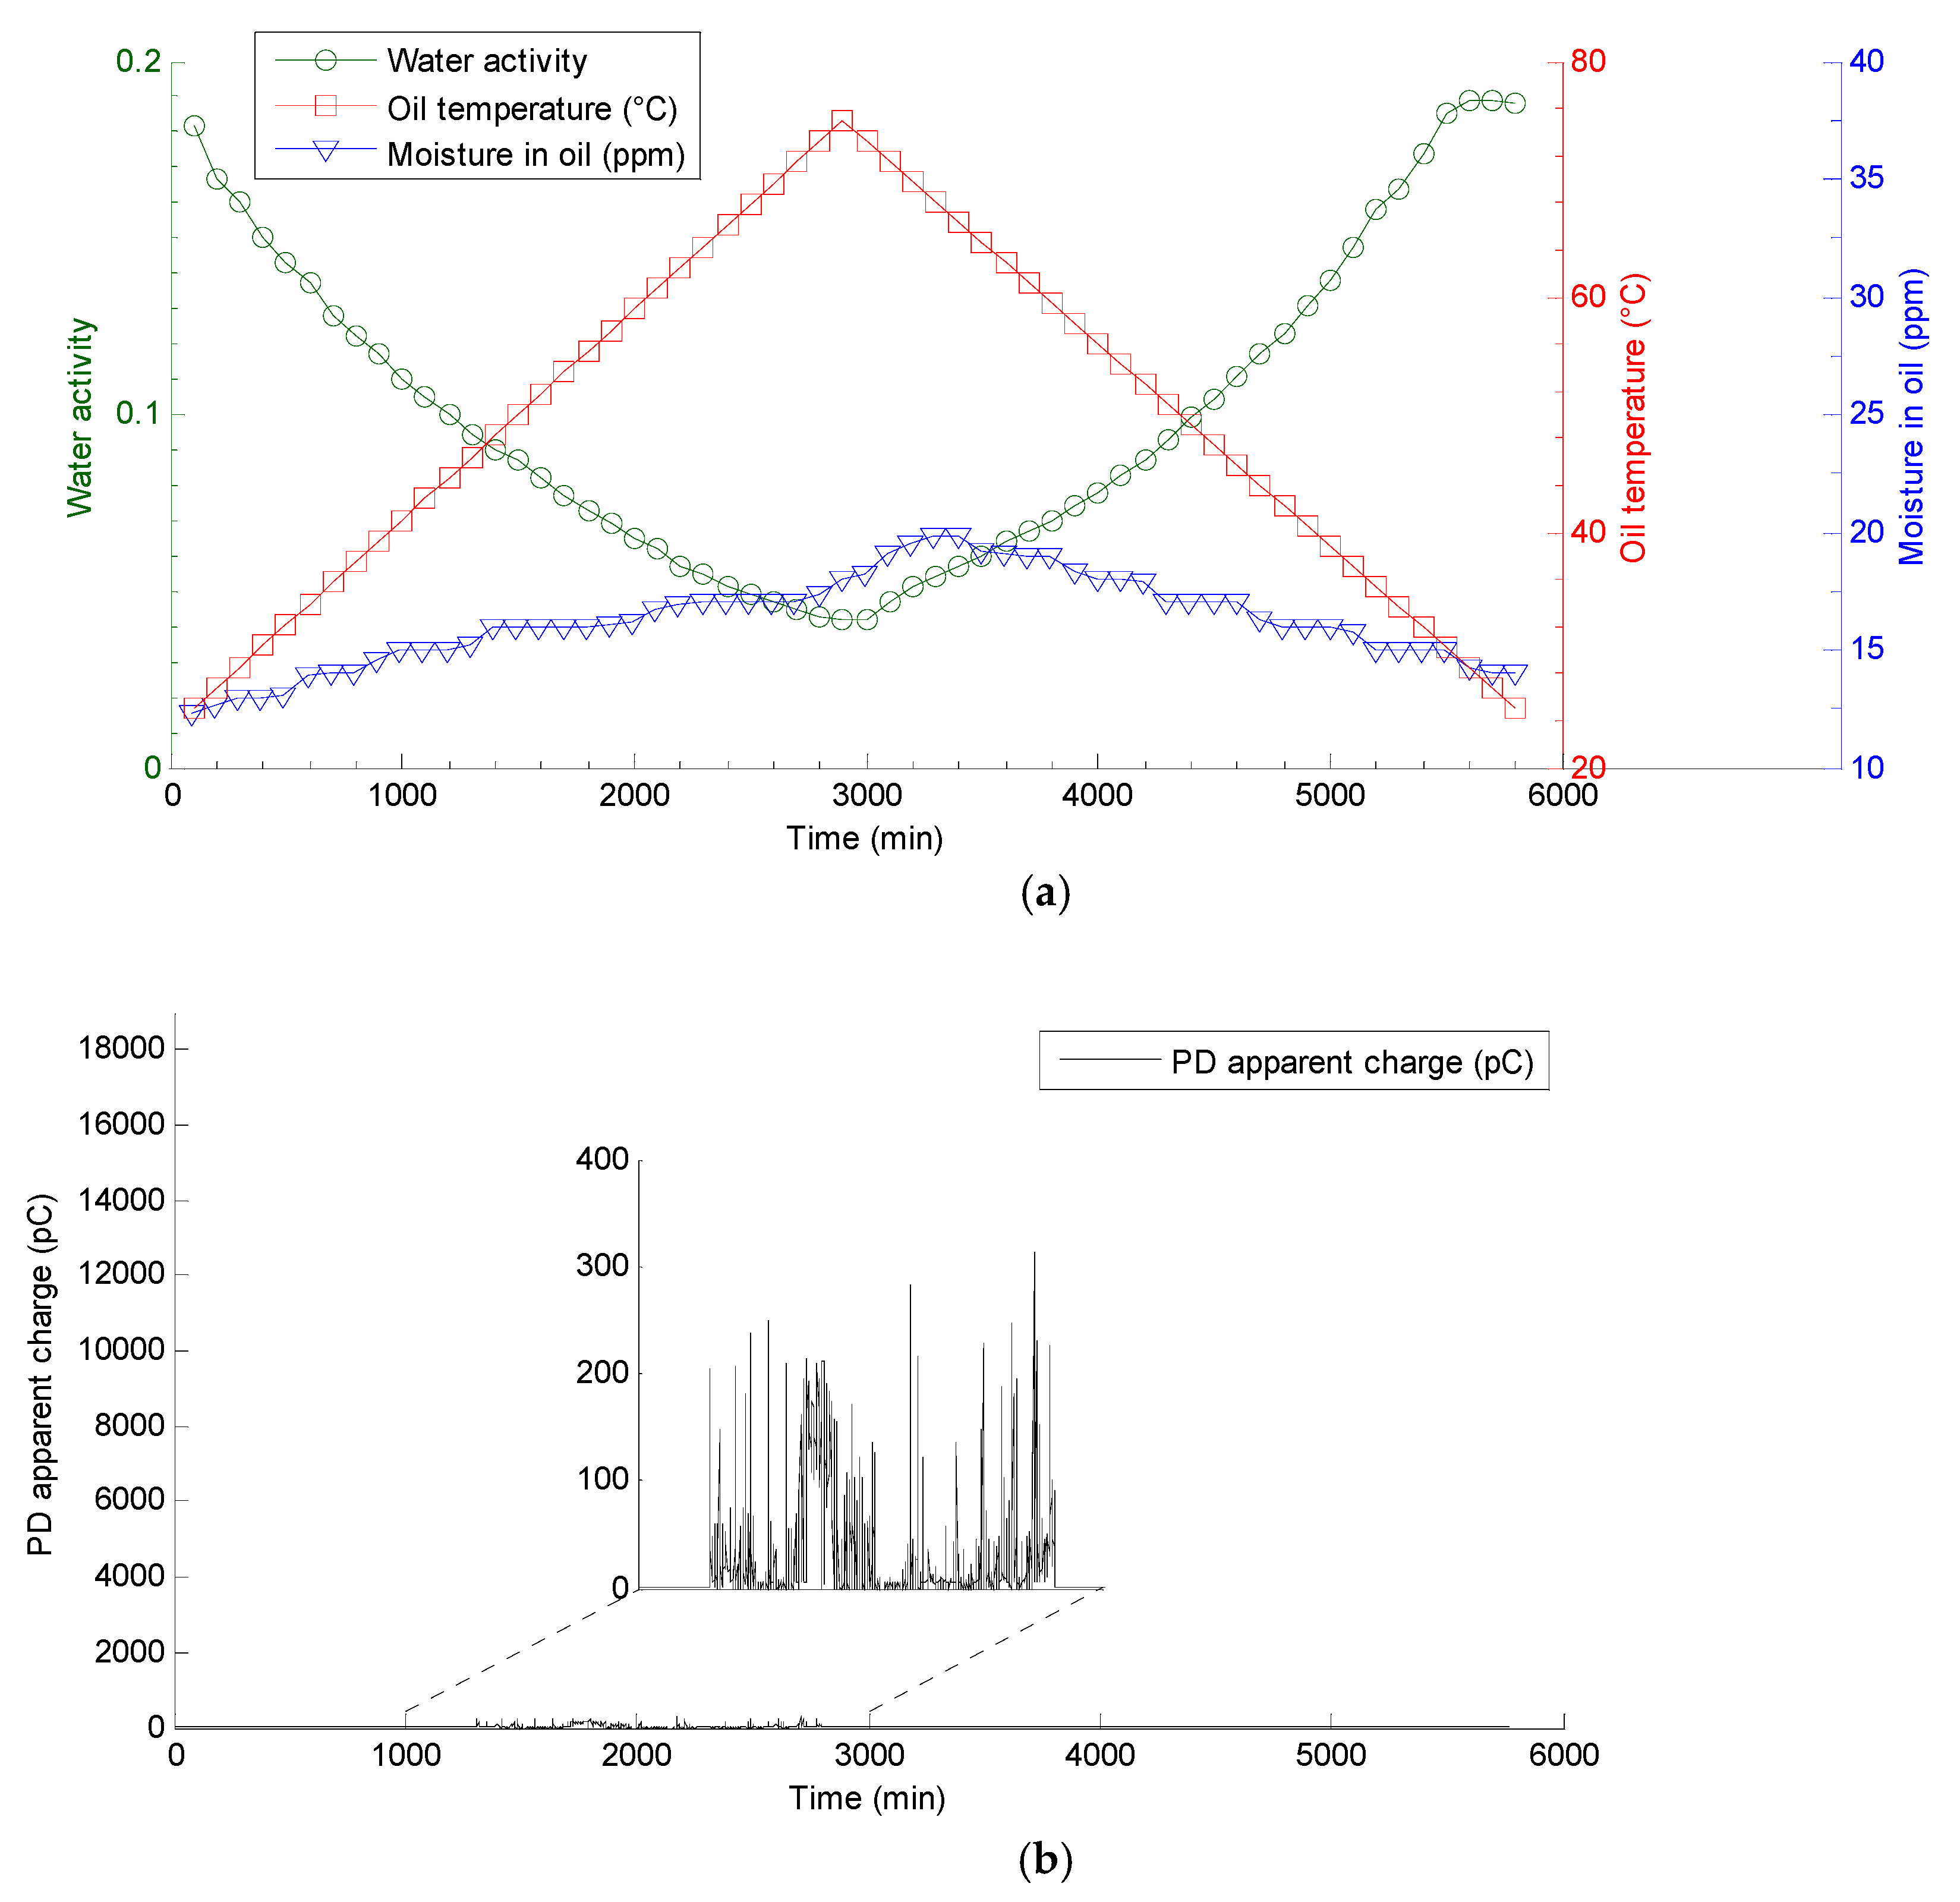
In the first stage of the research, measurements for insulation samples with a moisture content of 2.5% were performed. Typical results representative of all the measurement attempts are shown in
Figure 9.
For all of these samples, a repeatable scenario of PD activity was observed. PD pulses were not registered during the first 1000–1200 min of the experiment (which corresponded to an oil temperature near the pressboard sample equal to about 42–45 °C). Afterwards, the inception of stable PDs with a relatively low energy was found. Except for single PD events, its apparent charge did not exceed 250 pC. This state of affairs persisted for 2300–2500 min of the experiment, when the measured oil temperature reached a level of 66−70 °C. Shortly after this time period, a step change of the apparent charge level of PD (q > 500 pC) and simultaneous dynamics growth of water migration from cellulose insulation to oil were noted. From that moment onwards, a general upward trend in PD activity was observed that lasted for about 3800−4000 min of the experiment. At that time, the maximal values of the apparent charge reached a very high level of a few nC. In this time interval, the oil had already been cooled down and the analysis of the data from the humidity sensor (decrease of the moisture content in the oil) indicated a process of “reverse moisture migration” (from oil to cellulose). In the later part of the experiment, the discharges remained at a relatively high level; however, the general trend was a diminishing one. The PDs were not completely extinguished and remained at a level of 100−600 pC until the end of the experiment. It is worth underlining that none of the investigated insulation samples with a moisture content of 2.5% were broken down.
At the second stage of the investigation, measurements for dry insulation samples (0.4% and 1.6%) were conducted. During the whole four-day experiment, no PD pulses were registered for any of the investigated samples with a moisture content of 0.4%.
For samples with a moisture content of 1.6%, stable PDs were initiated in a very similar time frame as samples with a moisture content of 2.5% (i.e., after about 1000−1200 min) and with equally low energy (
q < 500 pC) (
Figure 10). It should be pointed out that, in contrast to samples with a moisture content of 2.5%, a rapid increase in PD activity was not observed. In most cases, in the second part of the experiment, when the oil temperature decreased, the discharges were completely extinguished.
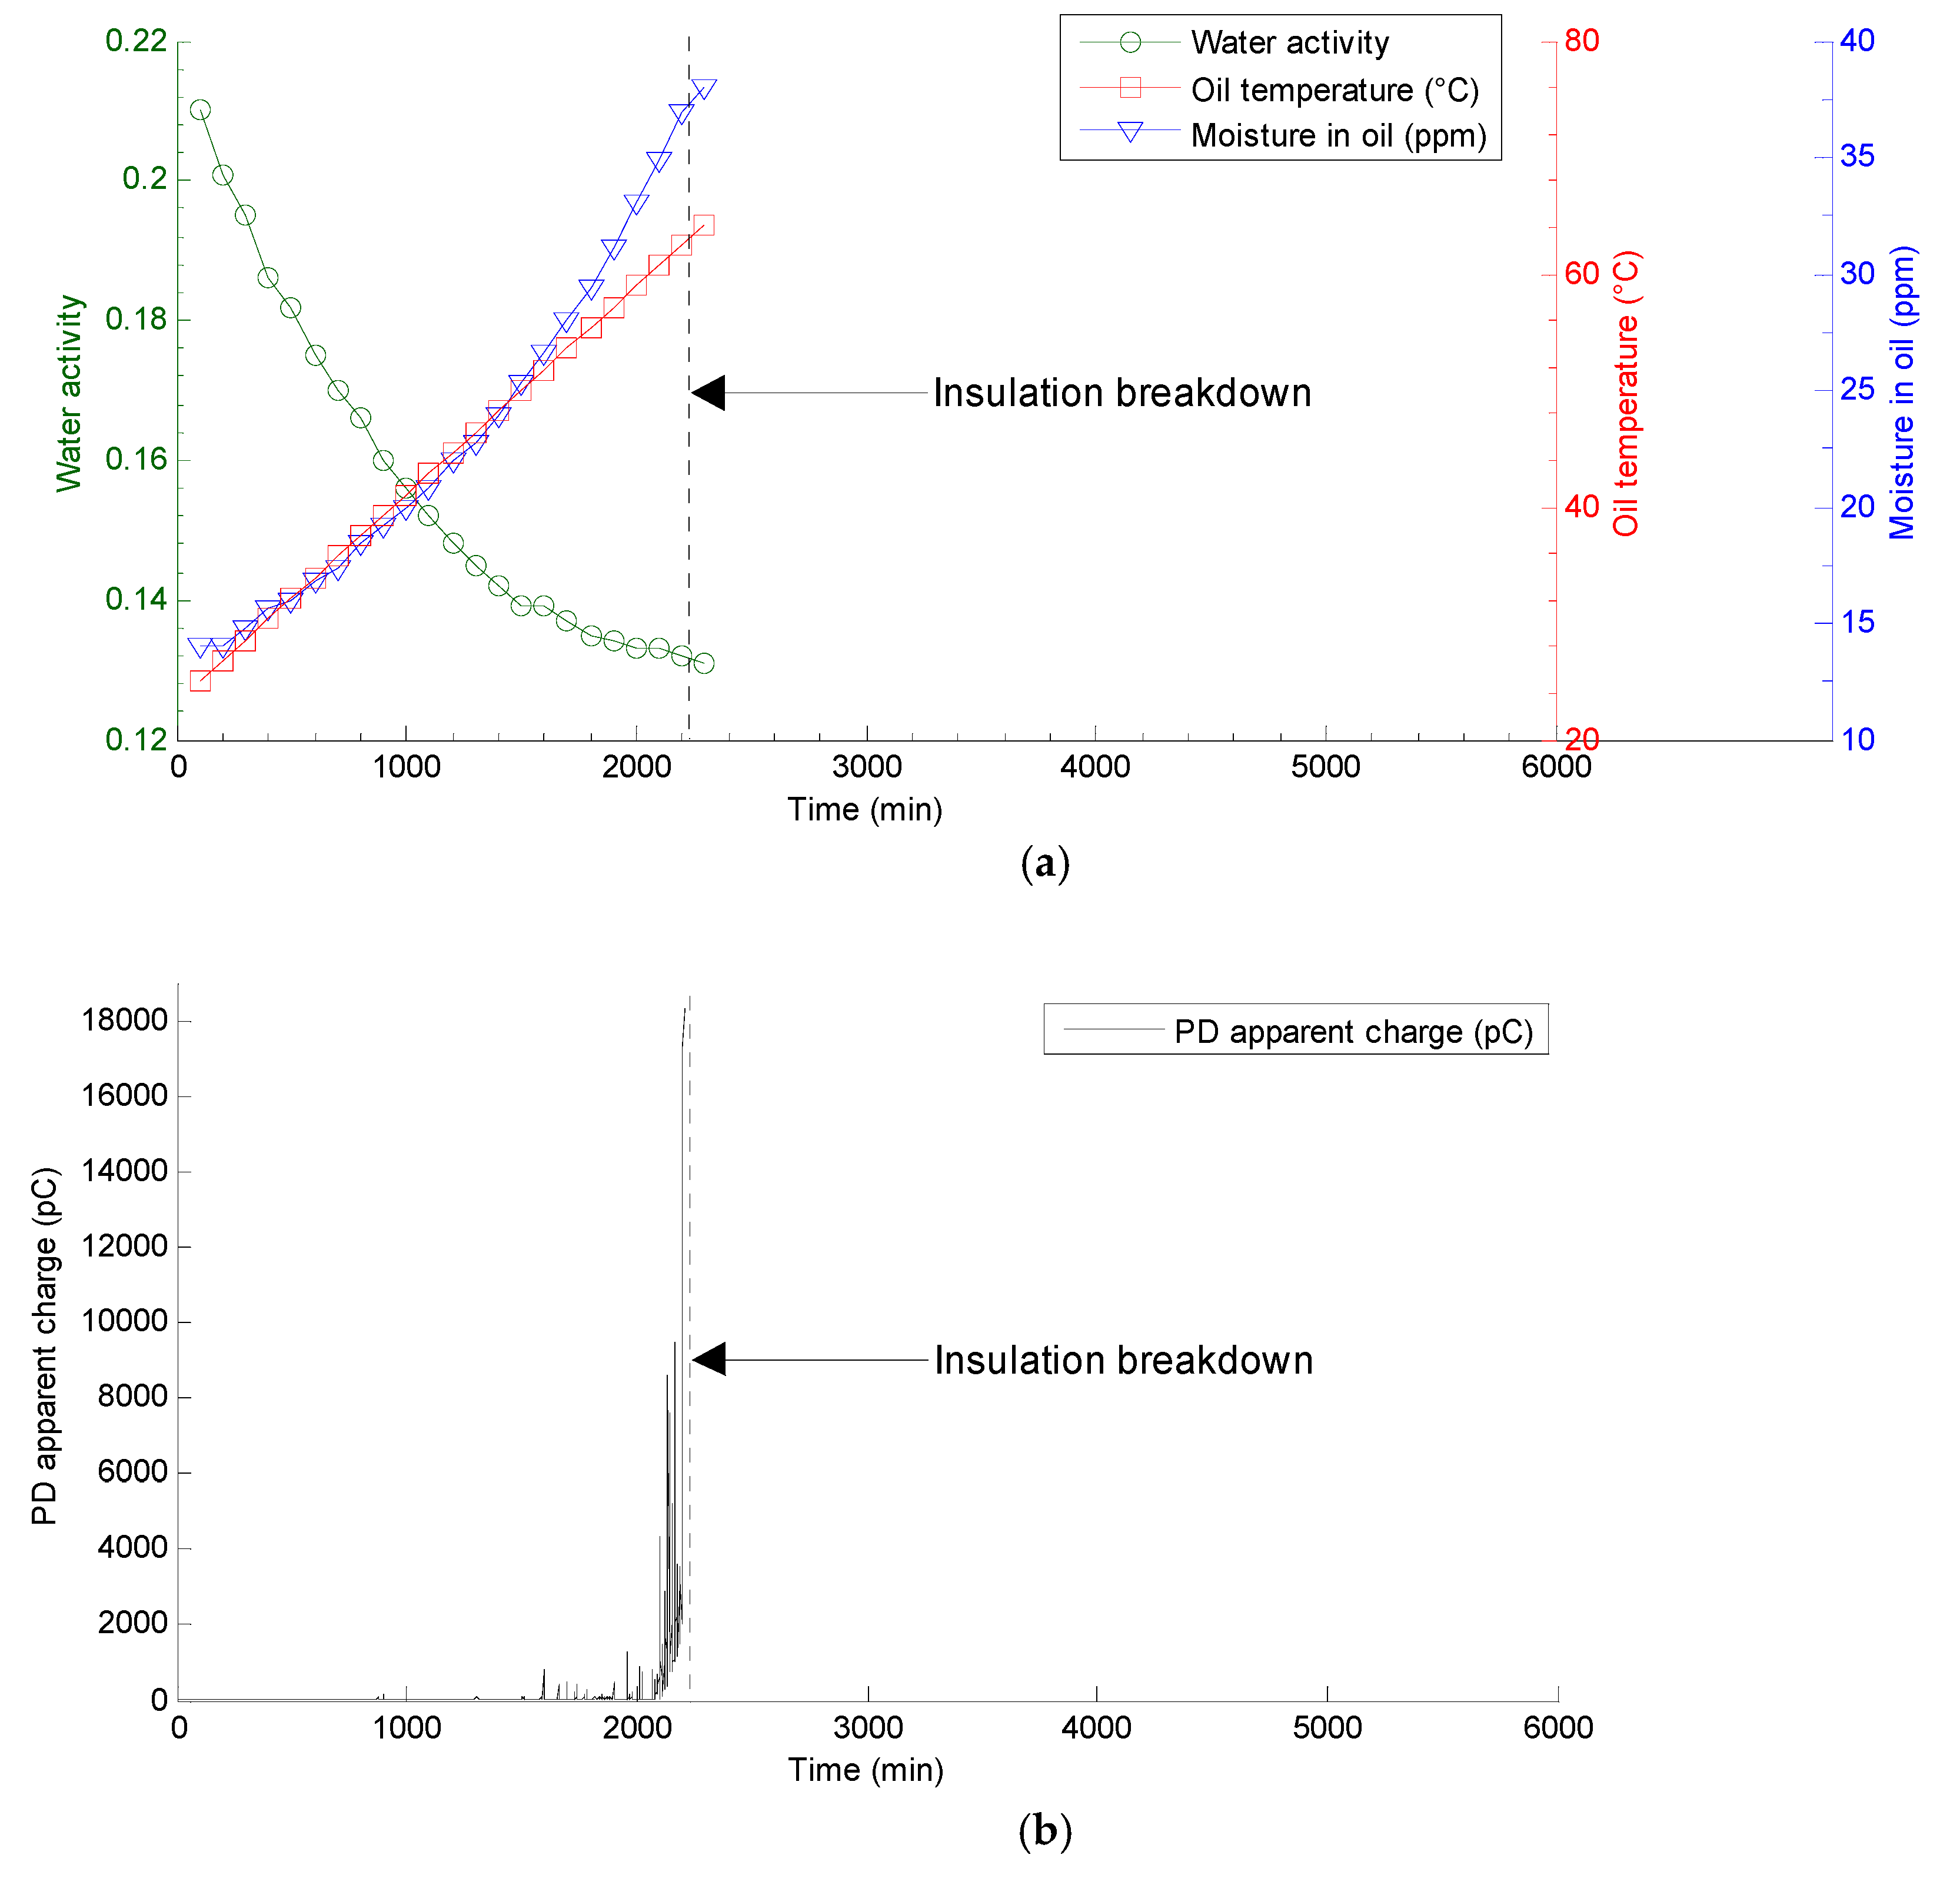
Samples with the highest moisture content (5.7%) were investigated during the last stage of the experiment. Compared to samples with a 1.6% and 2.5% moisture content, the first PD pulses were registered slightly earlier, i.e., after the first 500–800 min. Up to about 1800–2000 min of the experiment, unstable PDs were registered whose apparent charge was in the range from 50 pC to 1–2 nC. After that time, ignition of stable (continuous) PDs whose apparent charge dynamically grew, exceeding a level of 15 nC (
Figure 11), took place.
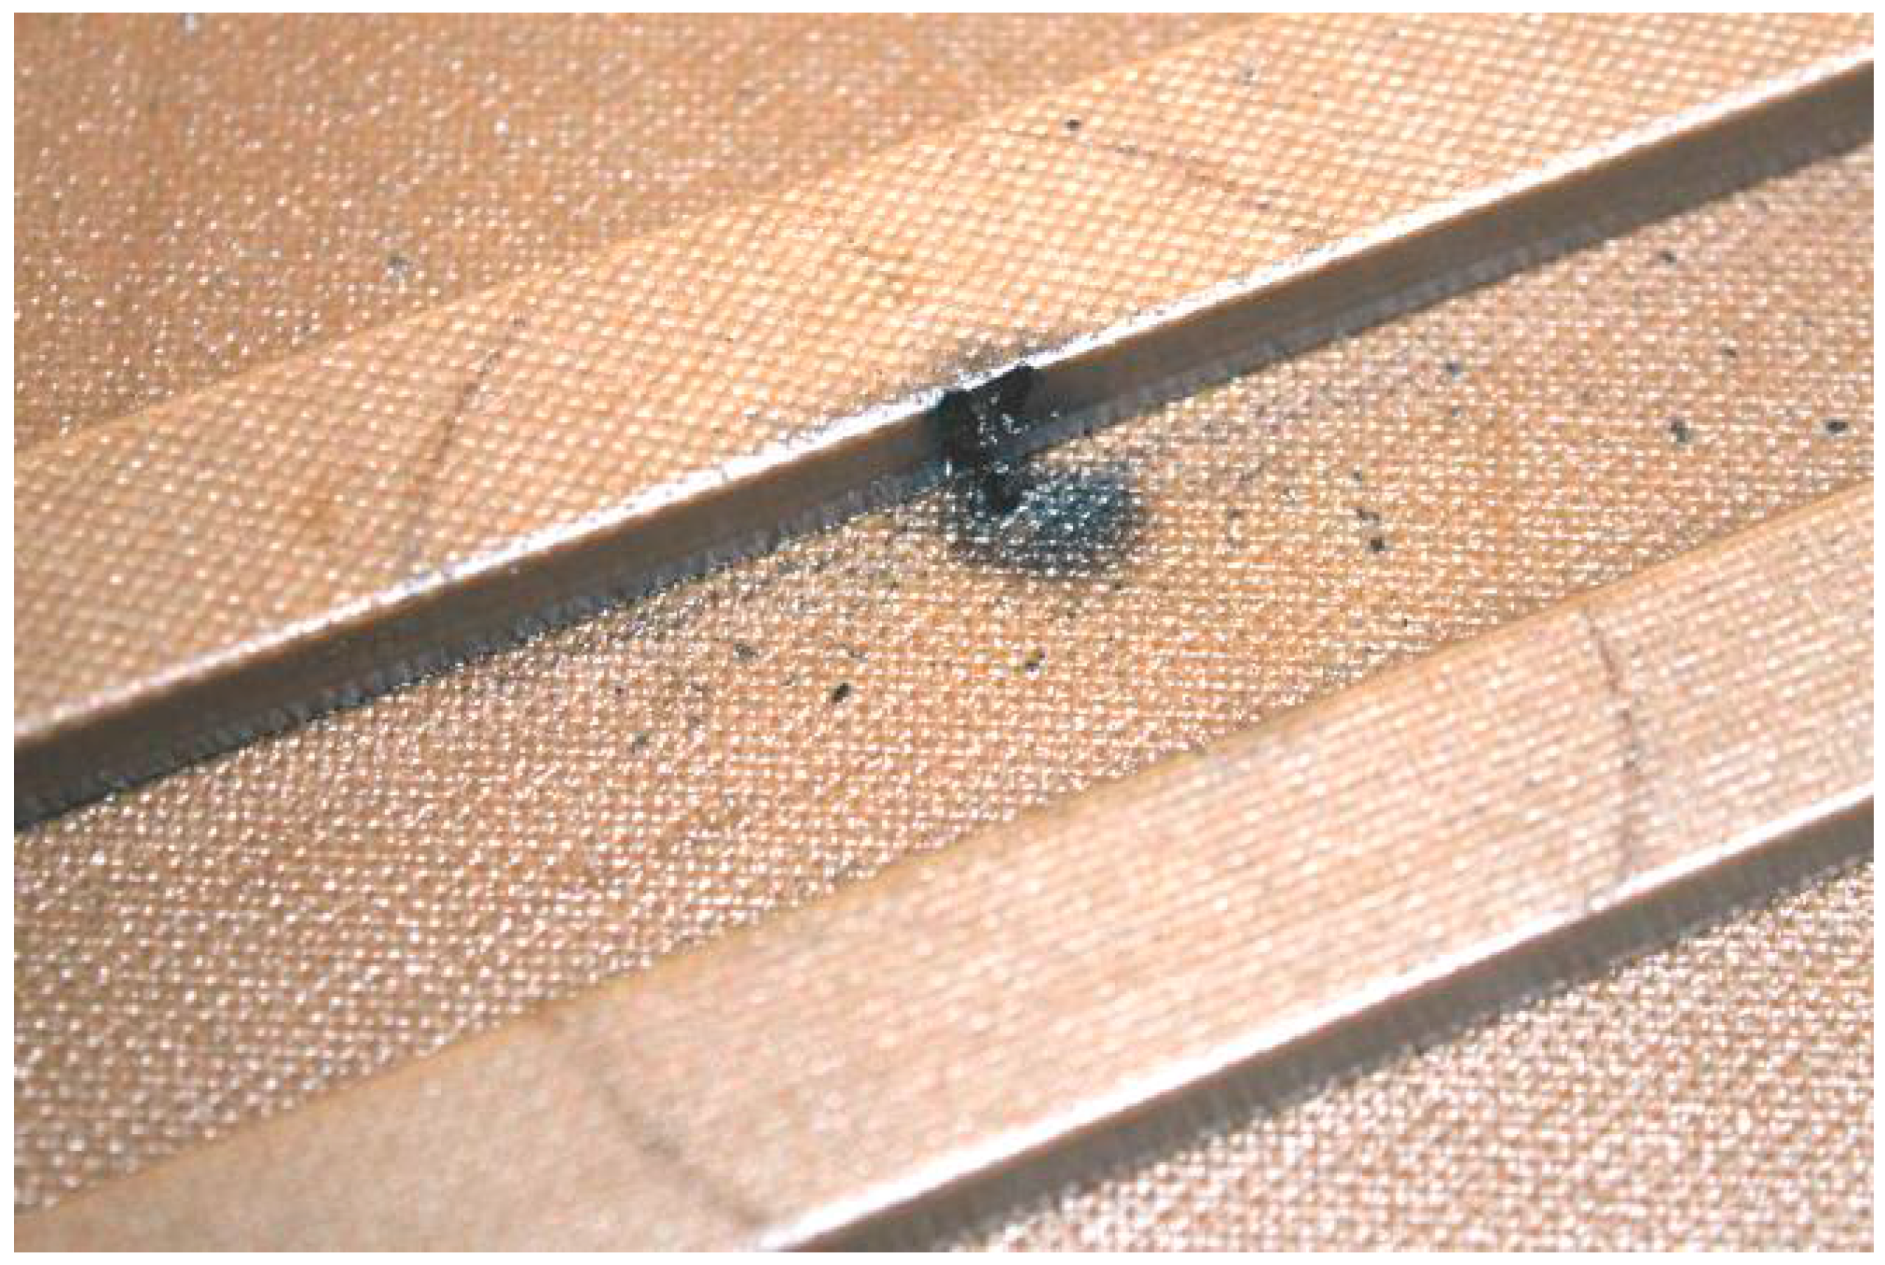
A period of high-energy discharges, mostly in a shorter time period (from a few to over a dozen min), leads to sample breakdown (
Figure 12). For such extreme moisture sample, it was not possible to carry out the experiment in the full four-day time period.
6. Conclusions
The test results presented in
Section 5.5 show that the ignition of PDs in the case of temperature changes should be associated with a higher level of moisture of the insulating system. In the case of very dry insulation (0.4%), changes in temperature insulation did not lead to ignition of PDs. However, at a higher moisture level (above 1%), it was found that the intensity of the PDs increased along with the moisture; in the case of wet samples (5.7%), the system was broken down every time after reaching the critical parameters (temperature, moisture oil). A similar relationship was observed when analysing the dynamics changes of moisture content in oil on the temperature, i.e., the higher the output of humidity of the sample, the greater the rate of change of the water content in the oil and therefore at the interface of the oil-pressboard.
According to the authors, the test results obtained in the laboratory model (
Section 5.5) can be applied to results obtained during monitoring of PDs on power transformers (
Section 3). In both cases, ignition of PDs occurred along with the growth of temperature insulation, and the discharges did not extinguish despite a drop in the temperature. In
Section 4, the authors of the article explain this state of affairs according to phenomena occurring at the interface of cellulose and oil. As a result of temperature growth, migration of water from the cellulose to the oil takes place, which was also observed during the experiment. A strengthening of the electric field occurring at the interface contributes to the concentration of water in this area. A consequence of the increase in moisture at the interface of the materials is a decrease in surface resistivity of cellulose, which leads to PD ignition of surface type. The drop in temperature insulation does not quickly dry the interfacial area, which favours the duration of PDs. This is due to the continuous impact of the electric field on the molecules of water and the time needed for migration of water from oil to cellulose.
When referring to the results of the experiment to operational conditions, it can be observed that, in the case of dry or moderately moistened (to less than 2%) insulation, even large temperature fluctuations do not cause an increase in PD activity to dangerous levels, which, in a short period of time, would damage the insulation. An increase in moisture above 3% seems to be of great importance for the transformer’s working conditions and causes significant reductions in the range of unit load, and thus in the temperature of the insulation system.
The results of the experiment, which confirmed the hypothesis that was made on the basis of registrations of the PDtracker monitoring system, indicate another important conclusion. If a clear correlation between the activity of PD and temperature changes in the monitored transformer is observed, strict control of the unit’s moisture level should be introduced, and, in extreme cases, it should be confirmed by other methods [
32] in order to allocate it to the drying process.


