Proceeding Paper

Analyzing the Effectiveness of COVID-19 Lockdown Policies Using the Time-Dependent Reproduction Number and the Regression Discontinuity Framework: Comparison between Countries †

1
Institute of Population Research, Peking University, Beijing 100871, China
2
International Institution for Applied Systems Analysis, 2361 Laxenburg, Austria
*
Authors to whom correspondence should be addressed.
Presented at the 7th International conference on Time Series and Forecasting, Gran Canaria, Spain, 19–21 July 2021.
Eng. Proc. 2021, 5(1), 8; https://doi.org/10.3390/engproc2021005008
Published: 25 June 2021
(This article belongs to the Proceedings of The 7th International Conference on Time Series and Forecasting)

Abstract

:
This study compares the effectiveness of COVID-19 control policies on the virus’s spread and on the change of the infection dynamics in China, Germany, Austria, and the USA relying on a regression discontinuity in time and ‘earlyR’ epidemic models. The effectiveness of policies is measured by real-time reproduction number and cases counts. Comparison between the two lockdowns within each country showed the importance of people's risk perception for the effectiveness of the measures. Results suggest that restrictions applied for a long period or reintroduced later may cause at-tenuated effect on the circulation of the virus and the number of casualties.

1. Introduction

COVID-19 is an infectious disease caused by SARS-CoV-2, which has been declared a global public health emergency [1]. As of 29 May 2021, it has affected more than 100million people and resulted in more than 3.5 million deaths globally (WHO). Governments worldwide have implemented similarly strict containment and closure policies to mitigate the pandemic in order to limit the spread of the virus. These restrictive community measures that limit activities or access to resources, facilities, or institutions have been often referred to as “lockdown” measures in Asia, Europe, and America [2,3]. Countries exhibited ‘herd behavior’ in response to COVID-19 [2] meaning they applied similar restrictive measures. However, the effectiveness of these measures has been different between countries. Previous studies showed that containment measures implemented in countries like China and South Korea have reduced new cases by more than 90%, which has not been the case in many other countries such as Italy, Spain, and the United States [4]. The effectiveness of the social distancing measures was evident in the data of Italy, Germany, and Turkey, but not clearly in the data of the USA and the U.K. [5]. Thus, the public administration community needs to embrace international and comparative perspectives on COVID-19 to inform how governments respond to the crisis, to learn the lessons from more successful governments, and to advance pandemic crisis management [6]. Up to now and currently, the situation is still uncertain, even though the COVID-19 vaccine is being used at full throttle in vaccination campaigns.
Related research shows that policy effectiveness is associated with income groups [2], regional political trust, and compliance [7], as well as country preparedness, socioeconomic factors [4], and a country’s values [3]. More and more research has pooled coronavirus data and control measures from countries and regions to compare the effectiveness of public health measures. These studies revealed the requirements needed to enhance scientific analysis and epidemic modeling, and the social and institutional challenges of operating in a global crisis [8]. The USA and Germany both are highly affected countries, with 34.1 million and 3.6 million confirmed cases, ranking 1st and 10th worldwide, respectively, as of 1 June 2021. Austria shares aspects of culture with Germany, and had 0.64 million confirmed cases as of the same date, ranking 38th worldwide. Nevertheless, the pandemic spread patterns of Austria and Germany have been different, especially in the second wave [9]. As for China, The Lancet recognized the quick containment of COVID-19 in China, which sets an encouraging example for other countries [10]. Moreover, these four countries have experienced the whole COVID-19 period, with at least two waves of outbreak, which could help to indicate the long-term effects.
Abundant time series data have been collected, and time-dependent statistical analysis has been widely applied in the public health policy research. Study on Africa used the interrupted time series analysis (ITSA) to analyze the effect of border closure on COVID-19 incidence rates (IRs), which revealed that the implementation of border closures within African countries had minimal effect on the IRs of COVID-19 [11]. The research conducted in England shows that mental health service delivery underwent sizable changes during the first national lockdown by using regression discontinuity in time design (RDiT) [12]. Furthermore, the regression discontinuity design (RDD) has been used by Chinese researchers for examining the lockdown policy effects on air quality, which explores the relationship between anti-epidemic measures and air quality based on the daily data from 326 prefecture-level cities in China [13] and an early assessment with cross-national evidence on the causal impacts of COVID-19 on air pollution by using a RDD approach [14].
This study intends to assess the effectiveness of lockdown COVID-19 control policies on the virus’s spread and on the change of the infection dynamics over a year with the event of a resurgence of cases, which have been implemented in China, Germany, Austria, and the USA based on real-time monitoring data and government responses. In this analysis, the different pandemic waves and the characteristics between countries are addressed. This comparative analysis aims to provide important lessons to be learnt from the experiences of these countries. Although the future of the virus is unknown at present, countries should continue to share their experiences, shield populations, and suppress transmission to save lives. In the assessment, the Oxford COVID-19 Government Response Tracker (OxCGRT) was used, which has been also used widely during the pandemic to measure the policies. We focus on the part of containment and closure, including school closing, workplace closing, cancelling public events, restrictions on gathering size, closing public transport, stay-at-home requirements, restrictions on internal movement, and restrictions on international travel. More details can be seen in Reference [15]. Since the vaccination program has been well underway since early 2021, there is hope for a gradual return to normal interaction. However, the virus in different forms poses an ongoing threat. Therefore, we should learn from the knowledge and lessons generated in the lockdown period in order to leverage better public policy to enable more resilient and effective public health services.

2. Data and Methods

2.1. Data Sources

Data used in this analysis are from 1 January to 31 December 2020. We obtained data on policy interventions from the Oxford COVID-19 Government Response Tracker (OxCGRT), which has tracked national government policy measures in response to the COVID-19 pandemic globally for 186 countries, starting from 1 January 2020 (Version 7.0). The database details are described in the working paper [16]. Our main interest is lockdown at the city/country-level, such as stay at home orders and restrictions on movement. Data on COVID-19 daily reported cases were obtained from various official sources, including the European Centre for Disease Prevention Control (ECDC), the Johns Hopkins University Centre for Systems Science and Engineering (JHU-CSSE) and the Center for Disease Control and Prevention (CDC) [17].

2.2. Epidemics and Regression Discontinuity in Time (RDiT) Model

We used a regression discontinuity in time (RDiT) design to estimate the effectiveness of lockdown policy interventions. RDiT is extended by the regression discontinuity (RD) framework that has applications in several fields. Compared to the standard RD framework, RDiT has been adapted to applications where time is the running variable and treatment begins at a particular threshold in time. In other words, it uses time as the running variable, with a treatment date as the threshold. This approach is close to quasi experimental framework (pre-intervention compared to post-intervention). Papers using RDiT span fields that include public economics, industrial organization, environmental economics, marketing, and international trade [18].
The effectiveness of intervention measures is measured by two ways: real-time reproduction number (Rt) and counts of cases. Rt was estimated by the ‘earlyR’ epidemic model, which is a simplified version of the model introduced by Anne Cori et al. [19]. Parameter estimates were obtained from the early transmission dynamics in Wuhan, China of COVID-19 project by the China Center for Disease Control and Prevention (CCDC), and the serial interval distribution had a mean (±SD) of 7.5 ± 3.4 days (95% CI, 5.3 to 19) [20]. Since the policy interventions may not have immediate effects, we hypothesized a 14-days lag time for counts of cases to coincide with the approximate incubation period of COVID-19.
We took advantage of the pandemic-induced lockdowns as an exogenous policy shock and attempted to retrieve the impact of policy interventions using RDiT approaches. In this approach, we assume the lockdown’s start date is when the first “stay at home requirements” become equal to “2”, which means to mandate not leaving the house with exceptions for daily exercise, grocery shopping, and ‘essential’ trips. Alternatively, this was also evaluated as when “restrictions on internal movement” become greater than zero, which means it is recommend not to travel between regions/cities. The usual RDiT regressions were run, both using a polynomial approach and a local linear approach. The equation is as follows:
Y i t = α i + β i L i t + γ X i t + f ( d i t ) + ε i t
where the outcome variables Y (Rt or counts of cases) in country i on date t , Y i t , is regressed by treatment variable L i t , a dummy variable for pre/post-intervention, a vector of covariates X i t , and a flexible nth-order polynomial in f ( d i t ) , and d i t denotes the number of days from lockdown date. The coefficient of interest, β i , is the treatment effect of the lockdown interventions on outcome variables in country i . In other words, this is the expected difference between the outcome variable before and after the lockdown. Additionally, α i denotes the country fixed effects and ε i t denotes the error term.
As countries implemented more than one lockdown because of the secondary COVID-19 waves, we define the first lockdown as the timing of “stay at home requirements” policy adoption (score becomes equal to “2”) and the second lockdown as the timing of re-imposition after subsequent policy easing. Table 1 presents two consequent lockdowns and summarizes the information about the lockdowns in the case study countries during the research period from 1 January to 31 December 2020, i.e., the date on the lockdown, number of COVID-cases on that day, and the policy stringency index. Policy stringency index is one of the composite measures, which combine different indicators into a general index. The details can be found in the codebook [16]. Although there is a lack of information on policy implication and demographic or cultural characteristics, the value and purpose of the indices is to allow for cross-national comparisons of government interventions.

3. Results

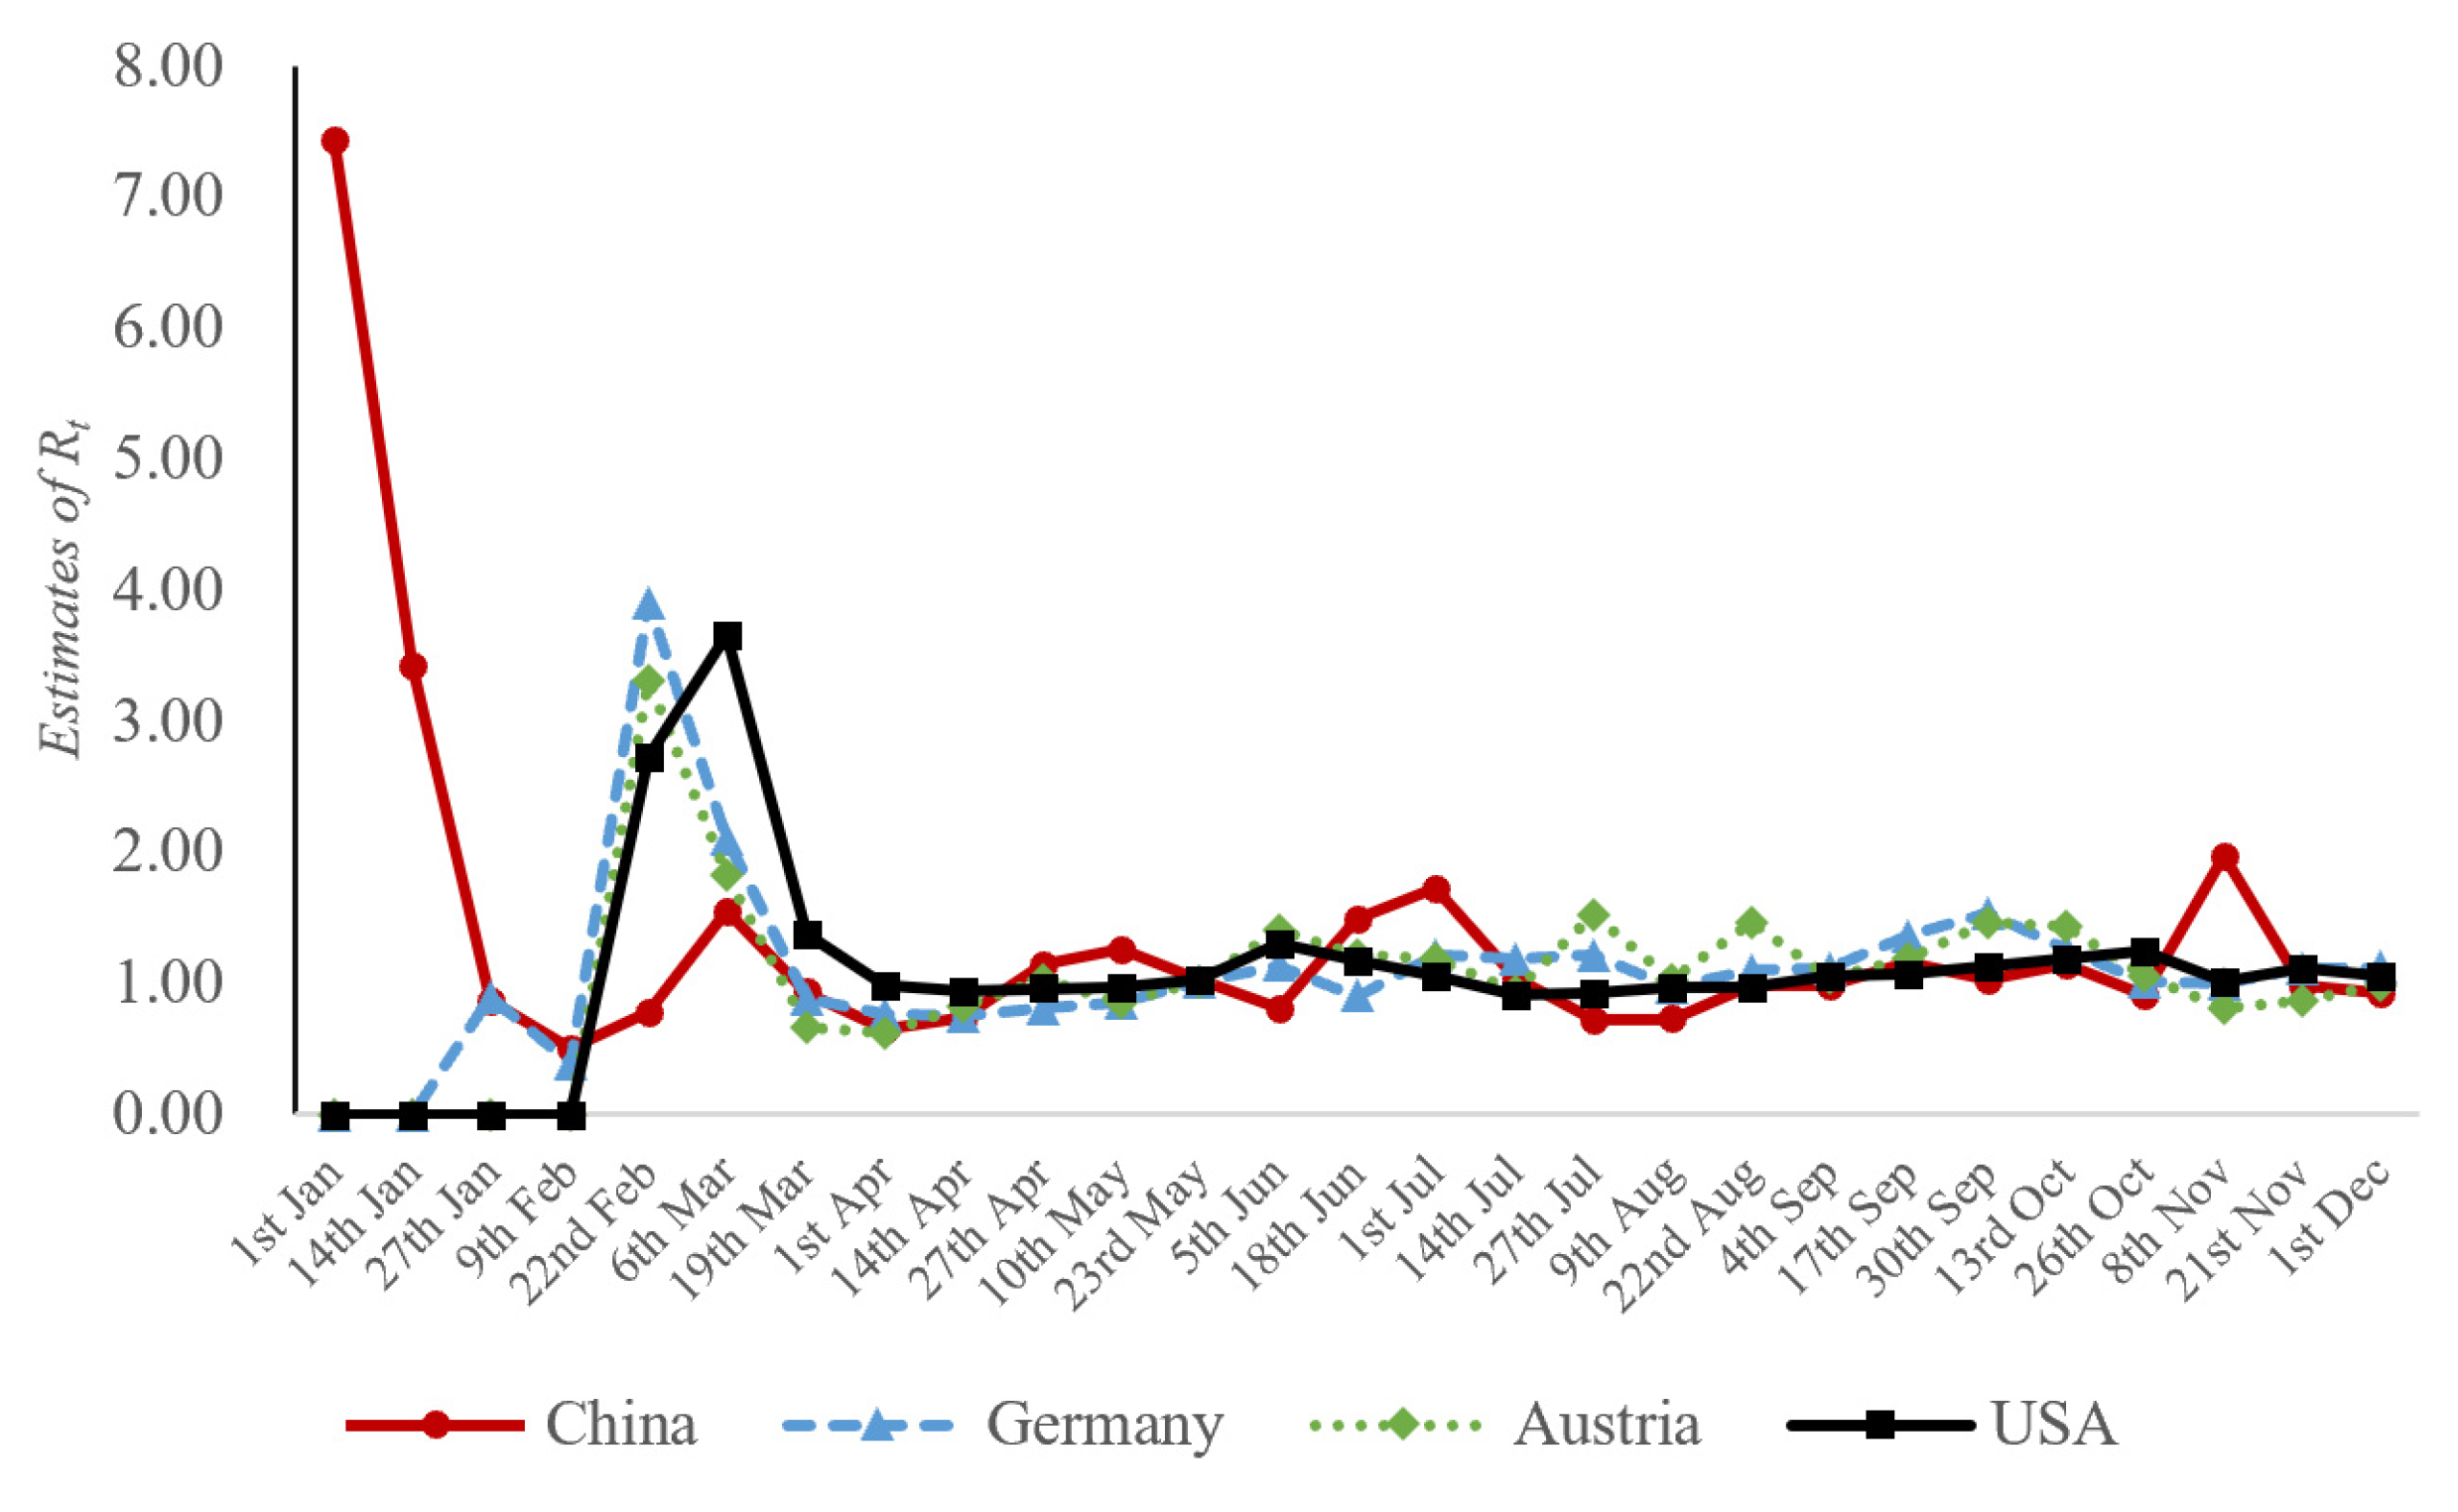
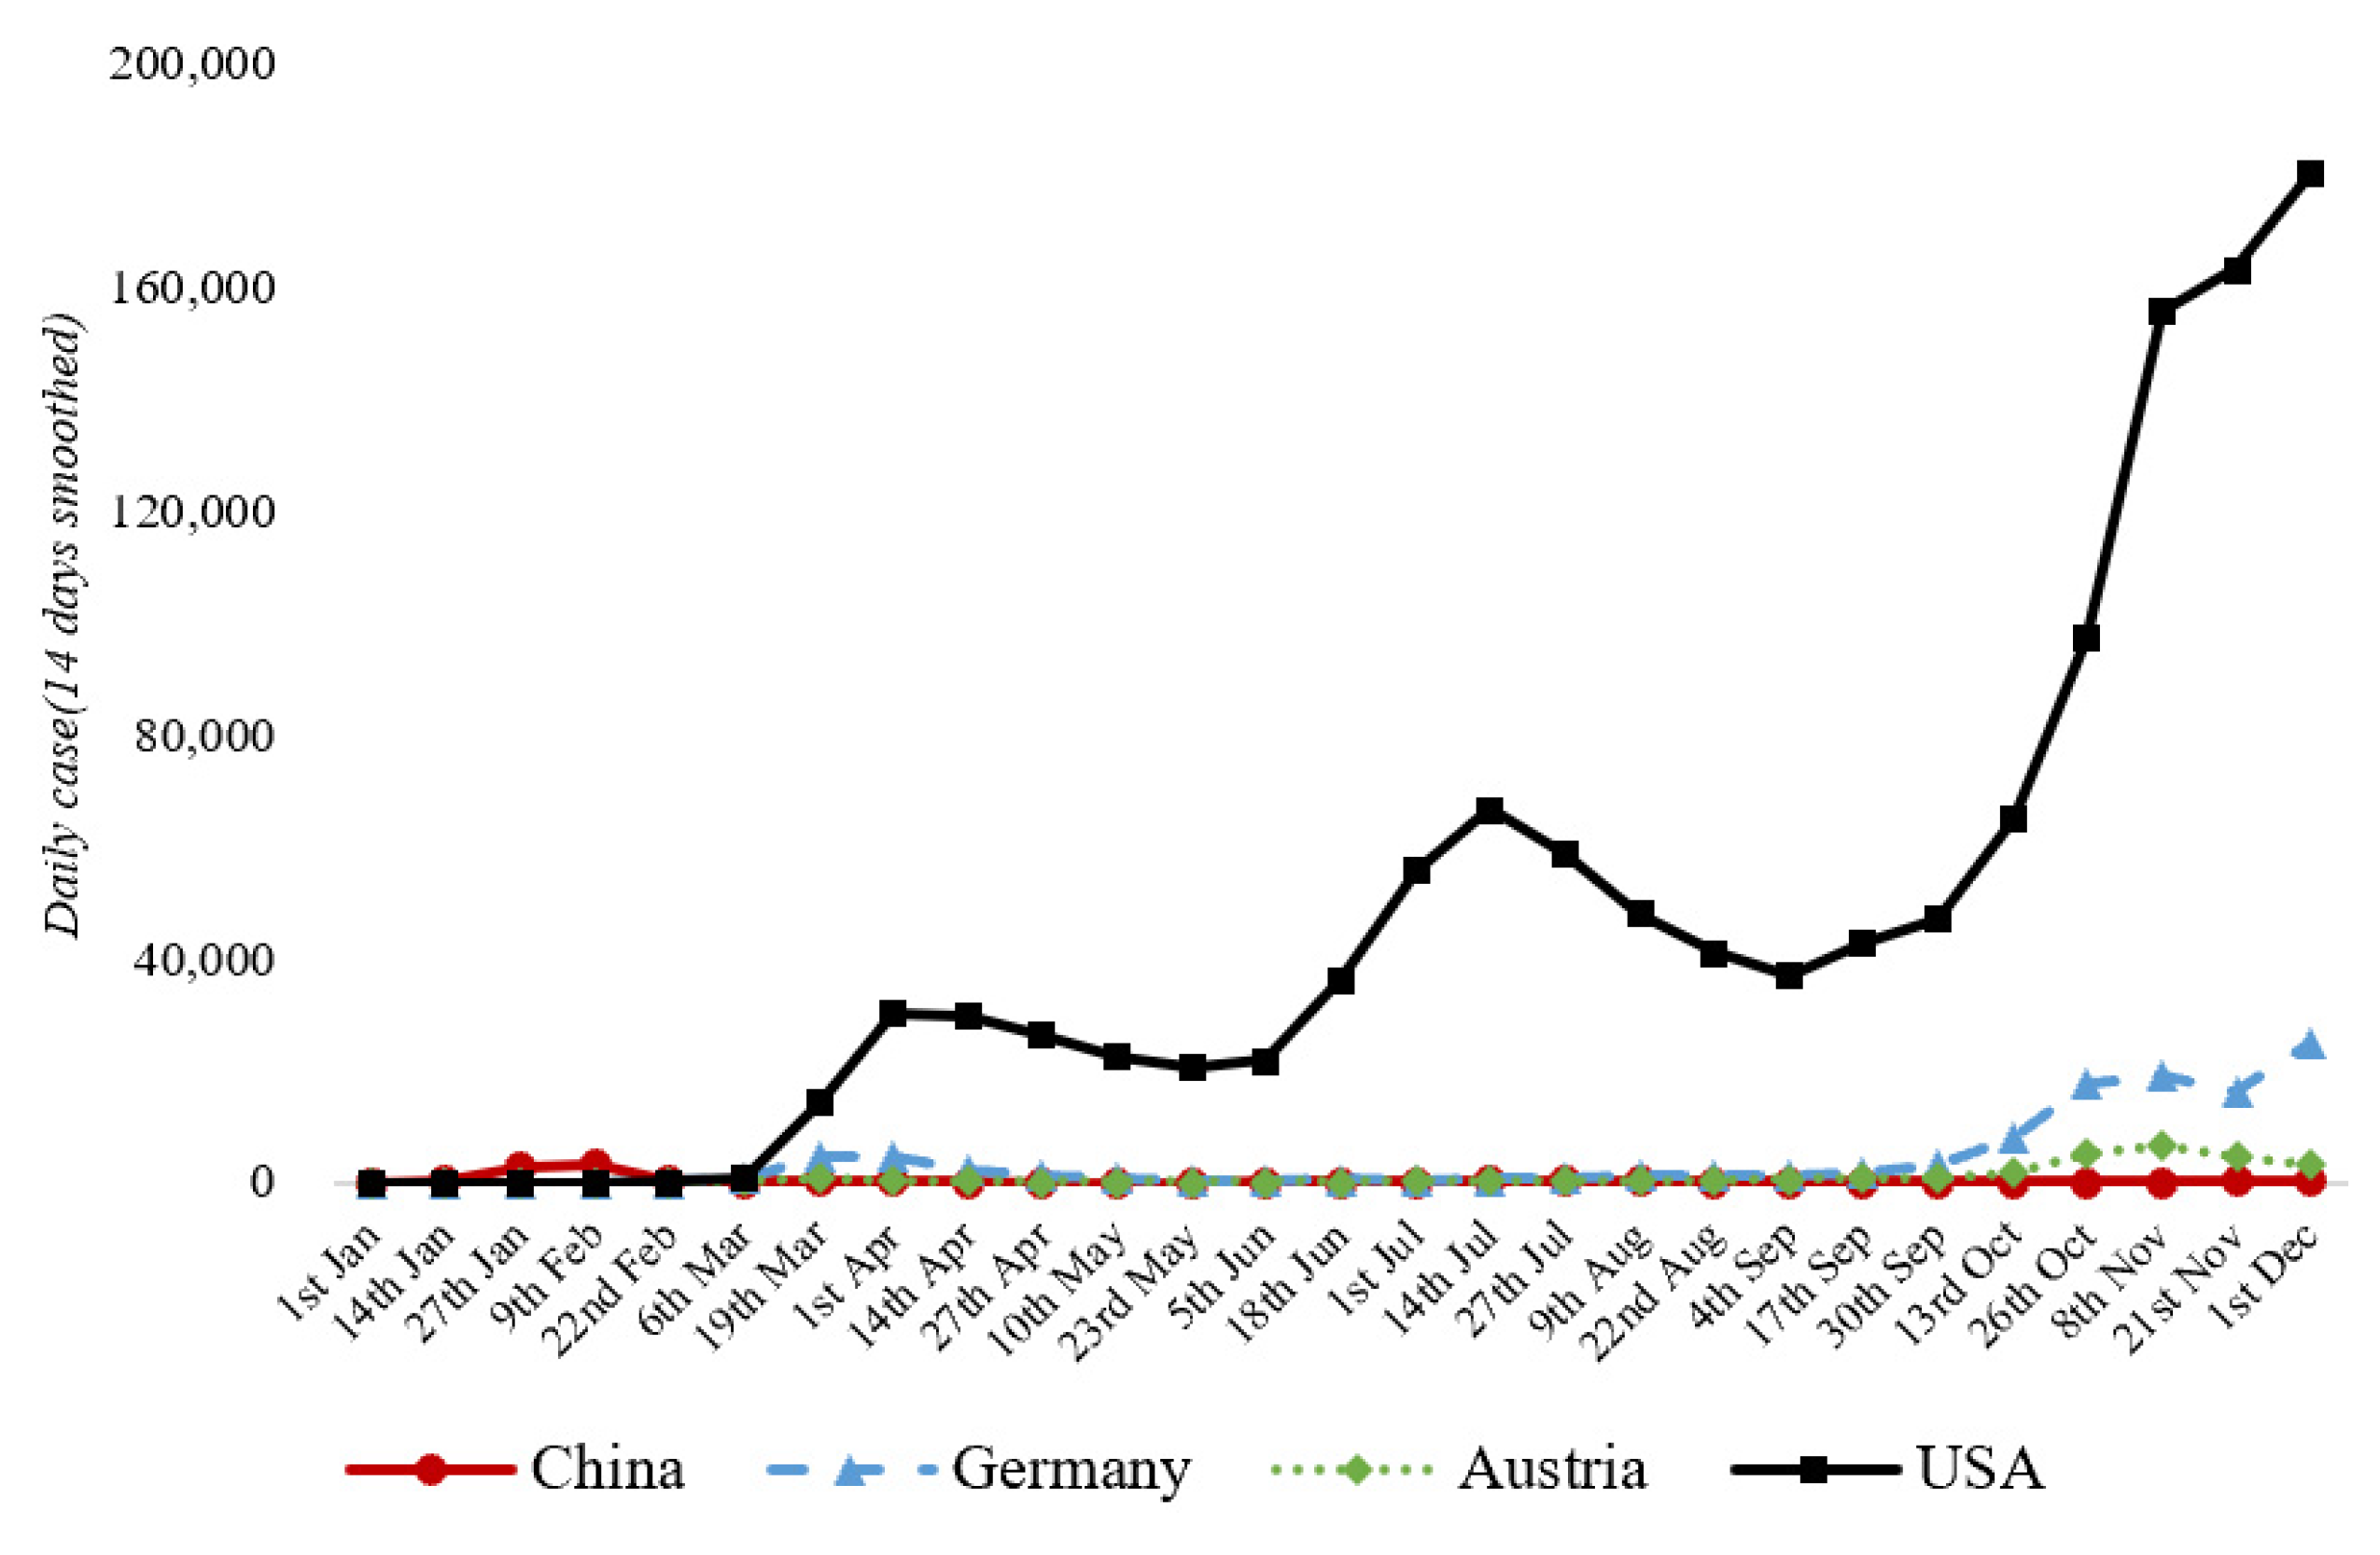
3.1. Estimates of Rt

The estimated Rt for all included countries (China, Germany, Austria, and the United States) from 1 January to 1 December 2020 are shown in Figure 1. It is clear that all countries were affected by the pandemic after March 2020, and the changing dynamics of the impacts in the four selected countries was different. China had the highest reproduction number, while the maximum reproduction number in the other three countries seemed to be similar. In the early stages, all countries were exposed to extremely high pandemic risk spread rate, which is indicated in Figure 1, with the highest position of the parameter Rt in all countries. In the period from March to April, Rt gradually declined because of governmental intervention policies to reduce the pandemic spread.
Among the intervention measures, the lockdowns are perhaps the most stringent. Table 1 shows that lockdowns in different case study countries were introduced differently. In China, the first lockdown was implemented on 1 February, i.e., the earliest date of the four studied countries. In Austria and the USA, the first lockdown started almost simultaneously, then followed by the lockdown on 21 March in Germany. From March to May, the curve of Rt was flattened; however, it still fluctuated around Rt = 1. It is visible from Figure 1 that after improving the situation as a result of the first lockdown, all four countries experienced repetitive rush increases of the parameter Rt in different subperiods during March and December 2020. This can be explained by the fact that in each country the removal of the lockdown led to the return of the highly epidemic situation because of the insufficient natural immunity among the population.
Figure 2 shows the trend of 14-days average daily cases during this period. For China, the epidemic peak passed with the number of new cases steadily declining and the epidemic under control. The estimated Rt shows fluctuations because China is likely to see sporadic outbreaks of scattered infections or to experience regional outbreaks. For the USA, there was an initial infection peak in April, and the rate of new cases dropped somewhat after the containment interventions. However, it is more of a plateau, and the next peak came in July. Experiencing the temporarily declining, the second wave bounced, increasing exponentially after September. For Germany and Austria, the second wave also came after July, but Austria seemed to control it better.

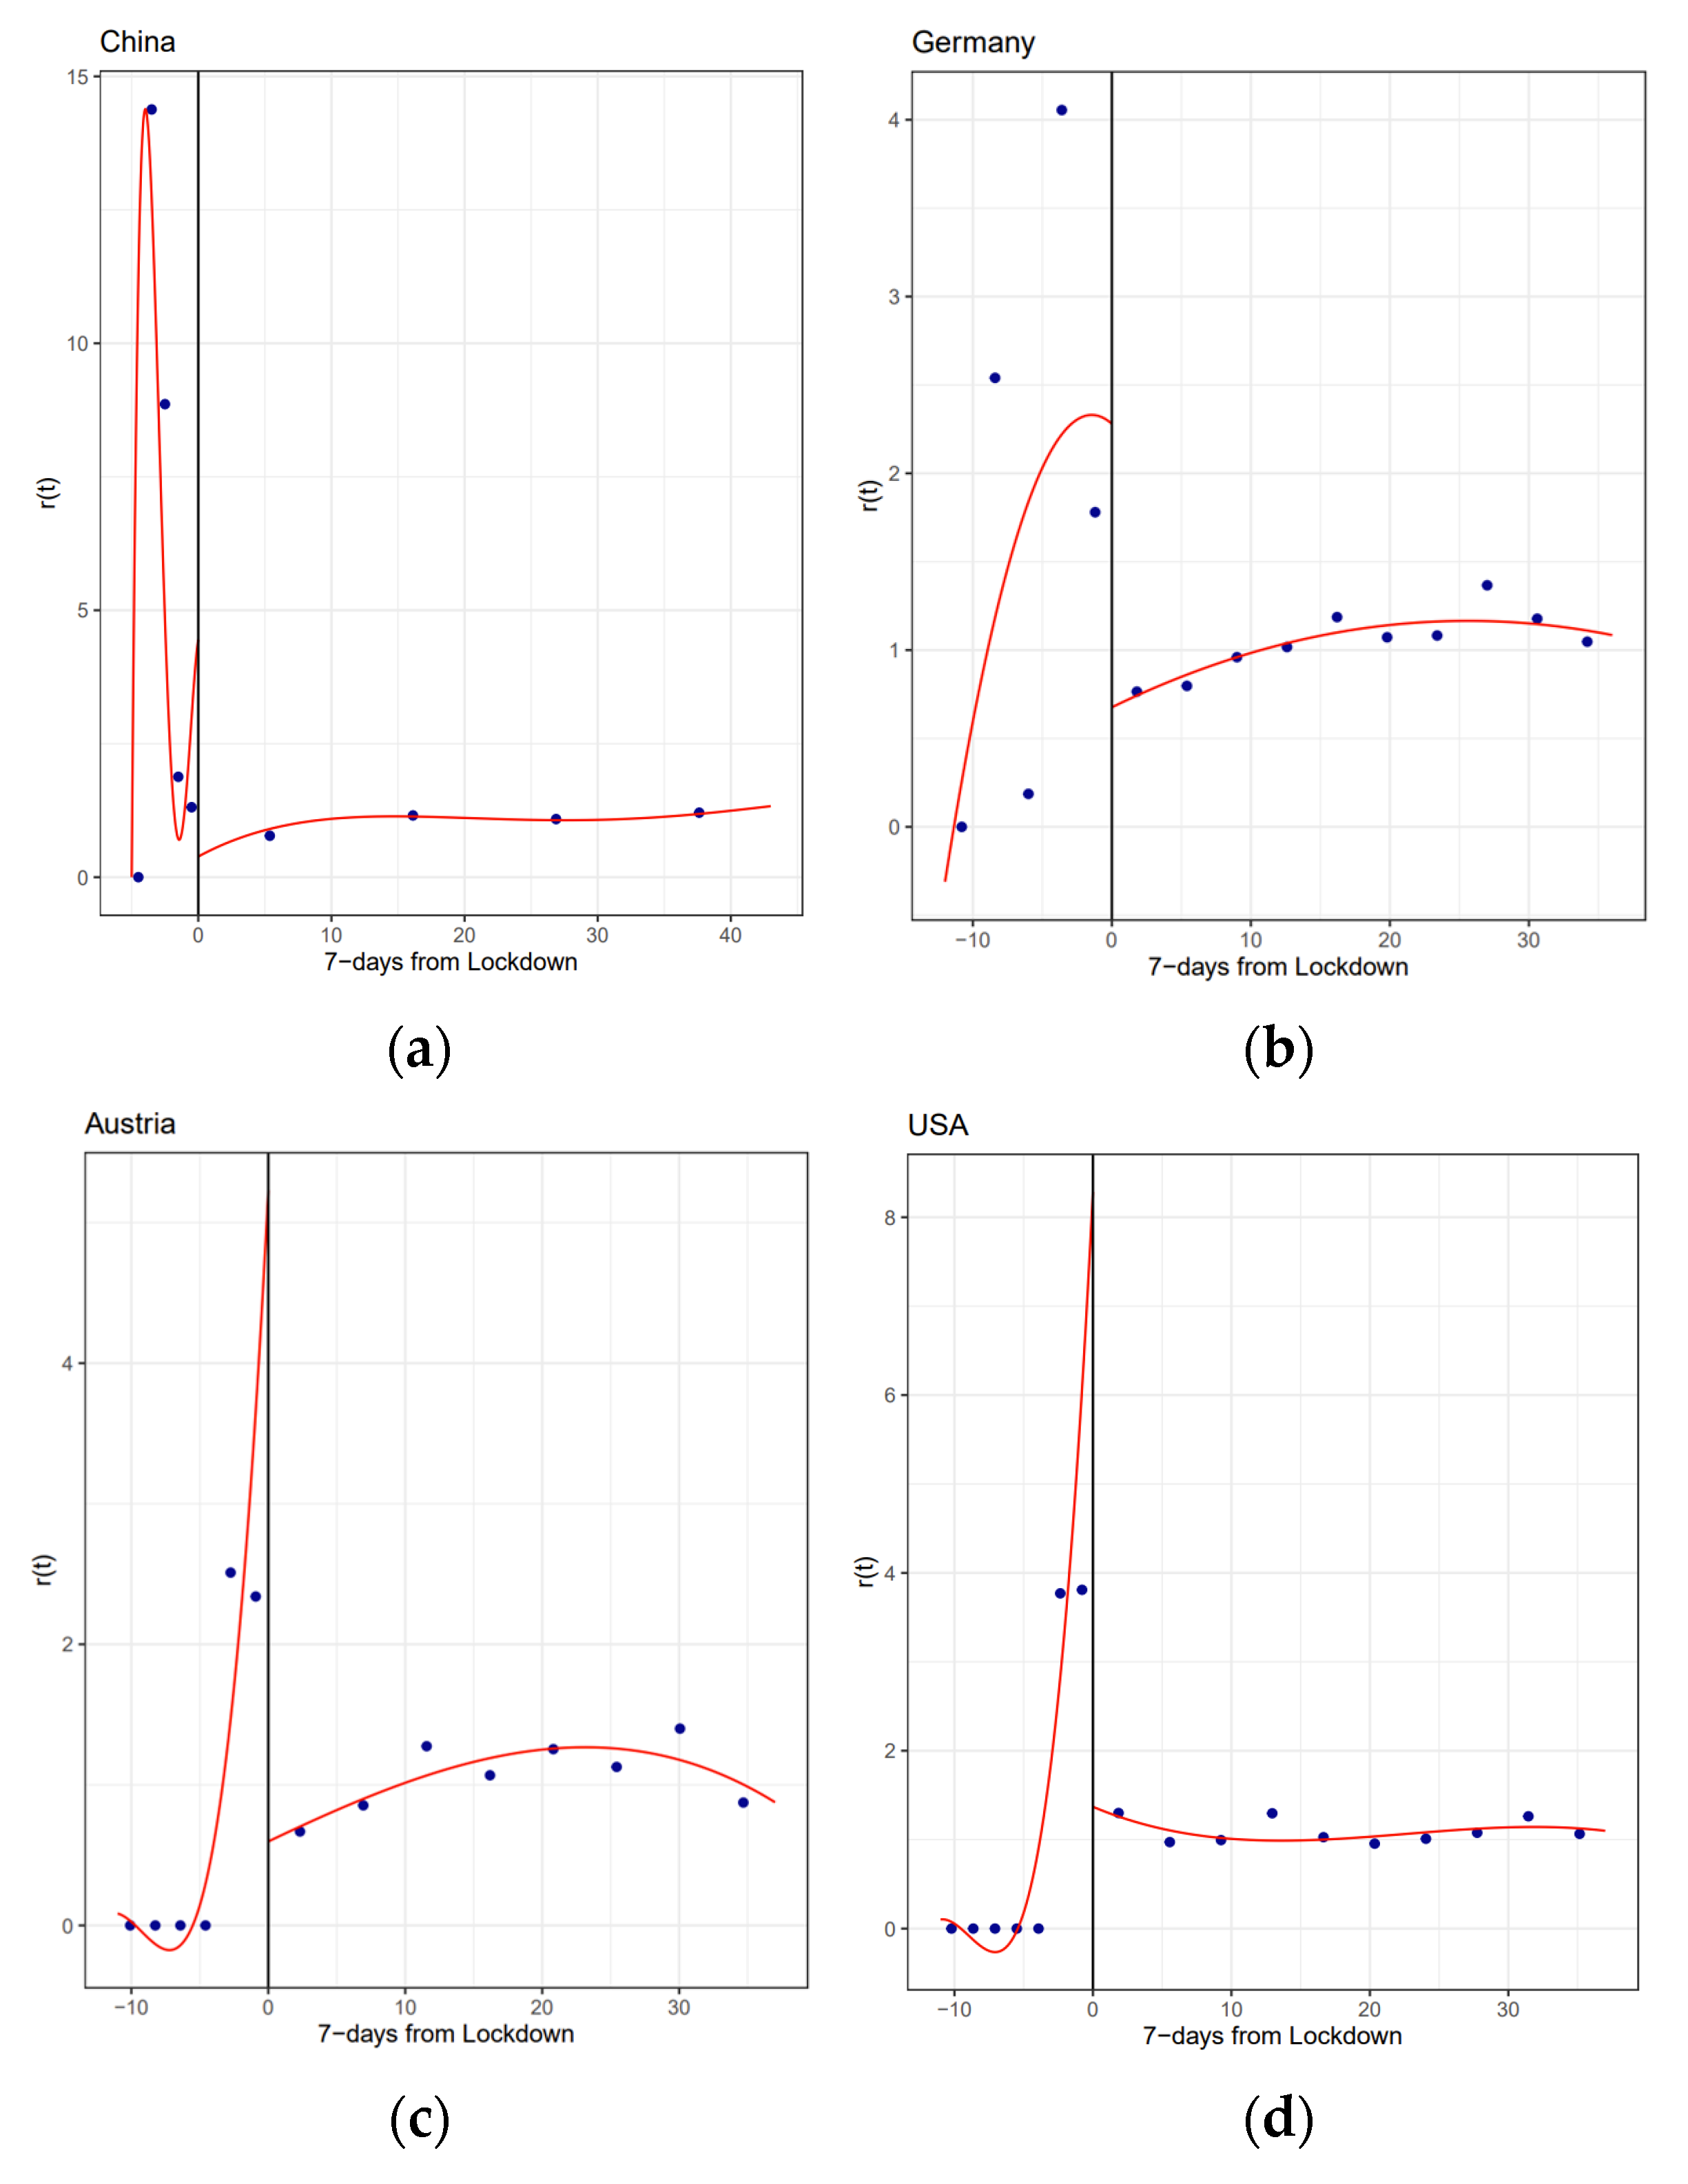
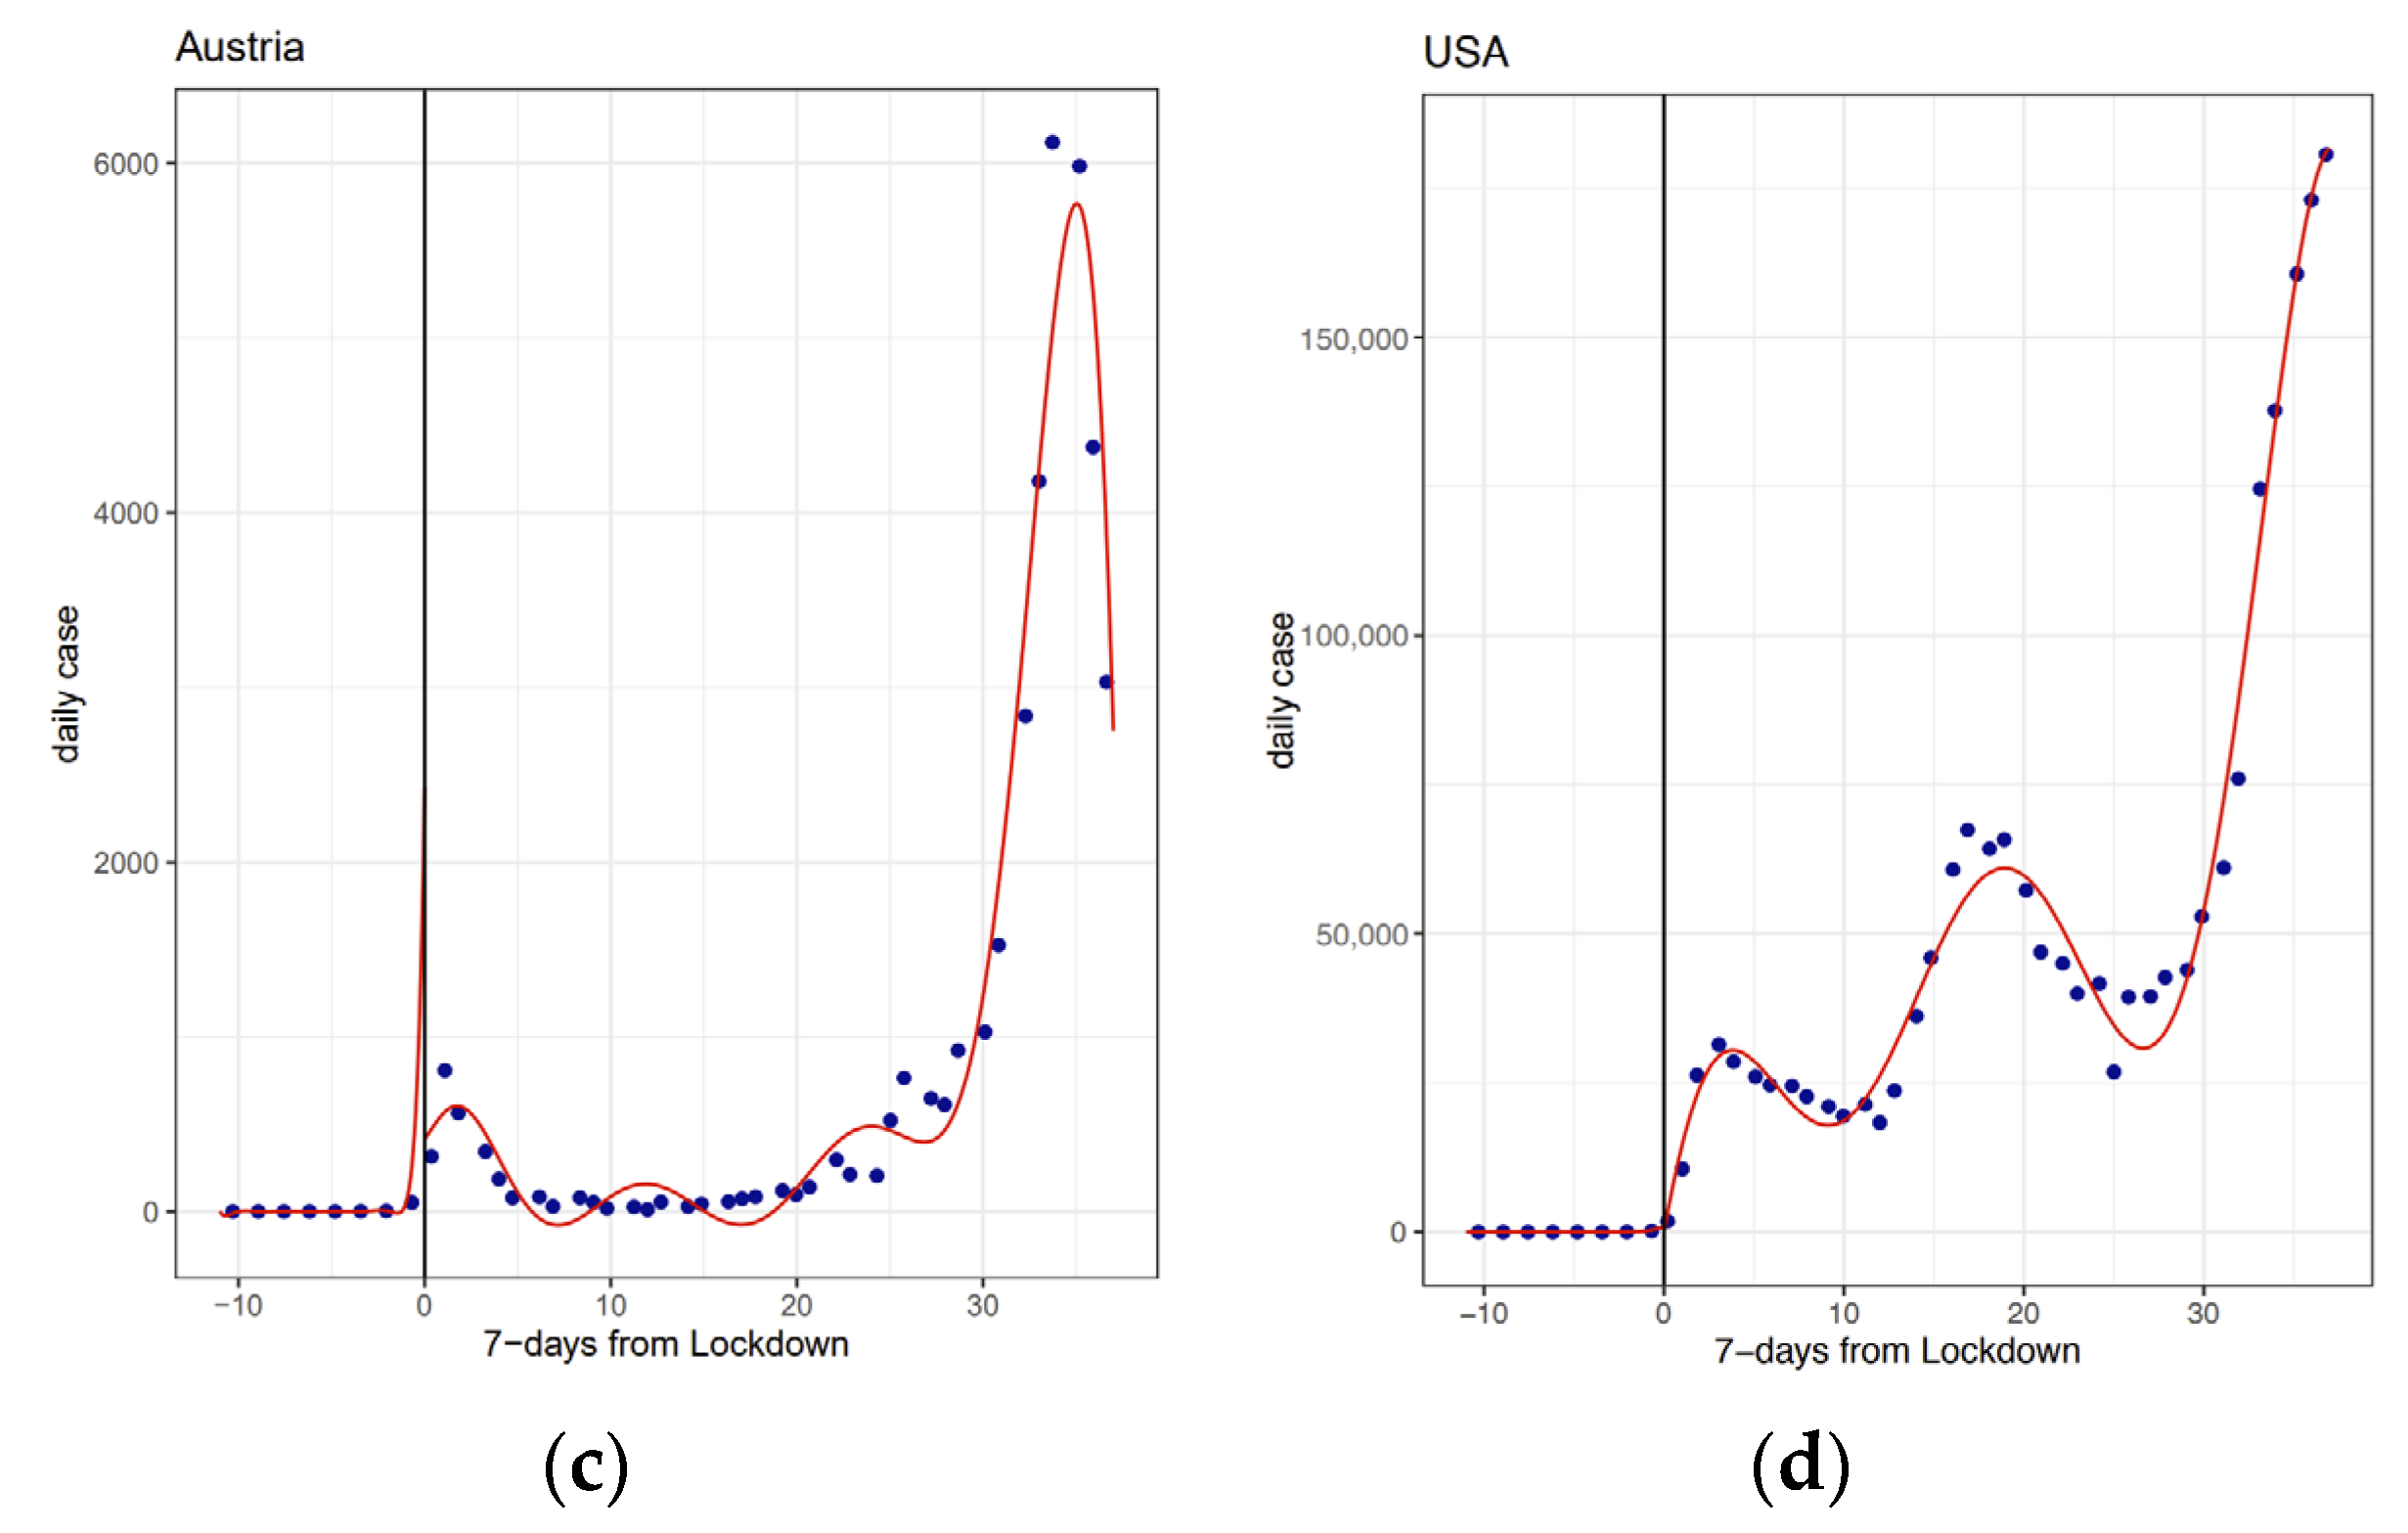
3.2. Overall Impact of Lockdown Interventions

Figure 3 and Figure 4 show the regression discontinuity in time estimates, including Rt and daily cases. The horizontal axis displays days before and after the complete lockdown at d = 0, the vertical axis defines the value of Rt (or daily cases) in the respective day on the horizontal axis. Both show the prima facie evidence of impacts of the first lockdowns. Especially the Rt shows significant discontinuity for these four countries, and it implies the lockdowns have effects on the spread. Every country had a tendency to flatten Rt after the lockdown. However, the decreasing trend of Rt before d = 0 indicates that some of governmental intervention measures were already implemented before the complete lockdown, such as “keep distance” or “wear masks”. As for the daily cases, Germany, Austria, and the USA show a closer discontinuity gap. This can be attributed to the limited cases before the first lockdown time.
Most RDiT models were of good fit. The country-specific linear interaction and quadratic interaction regression results are presented in Table 2 (dependent variable is Rt) and Table 3 (dependent variable is daily cases). For China, the Rt could decline by 0.988 before the first lockdown, and the lockdown brought a 4.457 decrease, which is strongly statistically significant. The quadratic interaction regression results were similar, with a 4.432 decrease. For Germany, compared to the slightly increase, the Rt declined by nearly 2 after the lockdown. Austria showed a 1.201 increase before the first lockdown, while there was a 3.831 decrease after the first lockdown. For the U.S., the Rt could increase by 1.879, while there was a 5.566 decrease after the first lockdown.
As for the analysis of daily cases, the results looked different. For China, the daily cases would increase 2782.4 if there was no intervention of lockdown. The first lockdown decrease of 3274.5 daily cases was strongly statistically significant. However, for Germany, Austria, and the USA, the situation was different. Even though the Rt flattened, the daily cases increased after the first lockdown, with 7162.5, 1473.1, and 37,561.1, respectively. It seems strange but is in line with the facts.

3.3. Comparative Effectiveness of First and second Lockdown

As discussed earlier, many countries implemented more than one lockdown because of the secondary COVID-19 waves. Therefore, we took the second wave into the consideration in our research. We compared the Rt and daily cases of 25 days before and after each lockdown. The country-specific quadratic interaction regression results are presented in Table 4 (dependent variable is Rt) and Table 5 (dependent variable is daily cases).
For China, the effectiveness of the second lockdown was weaker compared to the first lockdown, with an estimated Rt decrease by 1.556 in the first lockdown and increase by 0.585 in the second lockdown. Meanwhile, the daily cases did not decrease as fast as before (−24.5 vs. −762.3). In Germany, we found out the effect on the Rt was slightly stronger; Rt decreased by 0.715 (from 0.827 to 0.112), although it still was positive. Therefore, there was a significant increase in the daily cases after the second lockdown (4811.651 increase). For Austria, the effect on Rt after the first lockdown and the second lockdown was a 0.564 increase and 0.128 decrease, respectively. It means that the second lockdown contributed to flattening the Rt curve. Meanwhile, we also saw a decrease of daily cases in Austria, with 108.633 and 254.206, respectively. For the USA, there was a significant increase of Rt after the second lockdown, which had a 4.75 increase. Compared to the first lockdown, the situation became worse, with a higher Rt (1.334 vs. 4.750) and daily cases (−2058.49 vs. 2100.23).
It is noted that the results were related to the baseline, namely, the total confirmed and infected cases. For China, the first outbreak was the most serious wave during the COVID-19 period, which affected the country nationwide. Therefore, the first lockdown quickly smoothed the curve and reduced a large number of cases. The second lockdown was introduced at regional level to smooth provincial outbreaks. On the other hand, for Europe and the USA, the pattern was different. The first lockdown in Europe and the USA was introduced when the cases were growing and the epidemics’ epicenters were detected in neighboring countries. The second lockdown was implemented to deal with the domestic outbreak.

4. Discussion

We offer a retrospective study that provides cross-national evidence on the causal impacts of policy intervention on COVID-19 spread. A rich database was assembled from various sources, which were analyzed with EarlyR and RDiT models. Overall, the results show that COVID-19-induced lockdowns resulted in a decrease in Rt and daily cases, which varied across different countries. We expected the lockdown could mitigate the spread of COVID-19, but the results were not satisfactory and should be further explained. Comparing different countries, China had the most effective lockdown, which could lower the Rt and decrease the daily cases, while the USA, Germany, and Austria had strongly decreased Rt but presented large daily case enhancement. Comparison between the two lockdowns within each country showed that people's risk perception was relaxed during the second lockdown, especially in Germany (the increased daily cases were the highest in the studied countries) and the USA (the increased reproduction number was the highest in the studied countries).
Our results were similar to the relevant research, which suggested that the stringent lockdown policies adopted in China, Italy, and Spain were among the most effective national-scale policies [21]. China also showed the most effective results in our study. For Germany and Austria, they showed different patterns in our study, although they share common borders in Central Europe and have substantial cultural, historical, and economic ties [22]. The differences may be explained in terms of the fact that the power was consolidated in central governments in Austria, while in Germany, states retain their autonomy [22]. The USA presented the most unexpected results, and some research gives further explanations: namely, except for the timing and strictness of implementing measures [23,24], national culture, economic, and health and social issues also influence the results [25,26]. Most importantly, our results suggest that restrictions applied for a long period or reintroduced late in the pandemic would exert, at best, a weaker, attenuated effect on the circulation of the virus and the number of casualties. Our results support the conclusion of Haug et al. (2020) that lockdowns should be strict and brief [27].

Institutional Review Board Statement

Not applicable.

Informed Consent Statement

Not applicable.

Data Availability Statement

Data on policy interventions from the OxCGRT (http://bsg.ox.ac.uk/covidtracker, accessed on 24 June 2021). COVID-19 daily reported cases were obtained from official sources, including the ECDC (https://www.ecdc.europa.eu/en/covid-19/situation-updates, accessed on 24 June 2021); JHU-CSSE (https://github.com/CSSEGISandData/COVID-19, accessed on 24 June 2021) and the CDC (https://covid.cdc.gov/covid-data-tracker/#datatracker-home, accessed on 24 June 2021).

References

  1. Hui, D.S.; Azhar, E.I.; Memish, Z.A.; Zumla, A. Human Coronavirus Infections—Severe Acute Respiratory Syndrome (SARS), Middle East Respiratory Syndrome (MERS), and SARS-CoV-2. In Reference Module in Biomedical Sciences; Elsevier: Amsterdam, The Netherlands, 2020. [Google Scholar]
  2. Pincombe, M.; Reese, V.; Dolan, C.B. The effectiveness of national-level containment and closure policies across income levels during the COVID-19 pandemic: An analysis of 113 countries. Health Policy Plan. 2021. [Google Scholar] [CrossRef]
  3. Chen, S.X.; Lam, B.C.; Liu, J.H.; Choi, H.S.; Kashima, E.; Bernardo, A.B. Effects of containment and closure policies on controlling the COVID-19 pandemic in East Asia. Asian J. Soc. Psychol. 2021, 24, 42–47. [Google Scholar] [CrossRef] [PubMed]
  4. Chaudhry, R.; Dranitsaris, G.; Mubashir, T.; Bartoszko, J.; Riazi, S. A country level analysis measuring the impact of government actions, country preparedness and socioeconomic factors on COVID-19 mortality and related health outcomes. EClinicalMedicine 2020, 25, 100464. [Google Scholar] [CrossRef]
  5. Thu, T.P.B.; Ngoc, P.N.H.; Hai, N.M. Effect of the social distancing measures on the spread of COVID-19 in 10 highly infected countries. Sci. Total Environ. 2020, 742, 140430. [Google Scholar] [CrossRef]
  6. You, J. Lessons From South Korea’s Covid-19 Policy Response. Am. Rev. Public Adm. 2020, 50, 801–808. [Google Scholar] [CrossRef]
  7. Bargain, O.; Aminjonov, U. Trust and Compliance to Public Health Policies in Times of Covid-19. J. Public Econ. 2020, 192, 104316. [Google Scholar] [CrossRef]
  8. Trump, B.D.; Keenan, J.M.; Linkov, I. Multi-Disciplinary Perspectives on Systemic Risk and Resilience in the Time of COVID-19. In COVID-19: Systemic Risk and Resilience; Springer: Berlin/Heidelberg, Germany, 2021. [Google Scholar]
  9. Post, L.; Culler, K.; Moss, C.B.; Murphy, R.L.; Achenbach, C.J.; Ison, M.G.; Resnick, D.; Singh, L.N.; White, J.; Boctor, M.J.; et al. Surveillance of the Second Wave of COVID-19 in Europe: Longitudinal Trend Analyses. JMIR Public Health Surveill. 2021, 7, e25695. [Google Scholar] [CrossRef] [PubMed]
  10. Lancet, T. Sustaining containment of COVID-19 in China. Lancet 2020, 395, 1230. [Google Scholar] [CrossRef]
  11. Emeto, T.I.; Alele, F.O.; Ilesanmi, O.S. Evaluation of the effect of border closure on COVID-19 incidence rates across nine African countries: An interrupted time series study. Trans. R. Soc. Trop. Med. Hyg. 2021. [Google Scholar] [CrossRef]
  12. Bakolis, I.; Stewart, R.; Baldwin, D.; Beenstock, J.; Bibby, P.; Broadbent, M.; Cardinal, R.; Chen, S.; Chinnasamy, K.; Cipriani, A.; et al. Changes in daily mental health service use and mortality at the commencement and lifting of COVID-19 ‘lockdown’ policy in 10 UK sites: A regression discontinuity in time design. BMJ Open 2021, 11, e049721. [Google Scholar] [CrossRef]
  13. Song, Y.; Li, Z.; Liu, J.; Yang, T.; Zhang, M.; Pang, J. The effect of environmental regulation on air quality in China: A natural experiment during the COVID-19 pandemic. Atmos. Pollut. Res. 2021, 12, 21–30. [Google Scholar] [CrossRef]
  14. Dang, H.A.H.; Trinh, T.A. Does the COVID-19 lockdown improve global air quality? New cross-national evidence on its unintended consequences. J. Environ. Econ. Manag. 2021, 105, 25. [Google Scholar] [CrossRef]
  15. Hale, T.; Angrist, N.; Goldszmidt, R.; Kira, B.; Petherick, A.; Phillips, T.; Webster, S.; Cameron-Blake, E.; Hallas, L.; Majumdar, S.; et al. A global panel database of pandemic policies (Oxford COVID-19 Government Response Tracker). Nat. Hum. Behav. 2021, 5, 529–538. [Google Scholar] [CrossRef]
  16. Hale, T.; Webster, S. Oxford COVID-19 Government Response Tracker; Blavatnik School of Government: Oxford, UK, 2020. [Google Scholar]
  17. Hasell, J.; Mathieu, E.; Beltekian, D.; Macdonald, B.; Giattino, C.; Ortiz-Ospina, E.; Roser, M.; Ritchie, H. A cross-country database of COVID-19 testing. Sci. Data 2020, 7, 345. [Google Scholar] [CrossRef]
  18. Hausman, C.; Rapson, D. Regression Discontinuity in Time: Considerations for Empirical Applications. Annu. Rev. Resour. Econ. 2018, 10, 533–552. [Google Scholar] [CrossRef] [Green Version]
  19. Cori, A.; Ferguson, N.M.; Fraser, C.; Cauchemez, S. A New Framework and Software to Estimate Time-Varying Reproduction Numbers During Epidemics. Am. J. Epidemiol. 2013, 178, 1505–1512. [Google Scholar] [CrossRef] [Green Version]
  20. Li, Q.; Guan, X.; Wu, P.; Wang, X.; Zhou, L.; Tong, Y.; Ren, R.; Leung, K.S.; Lau, E.H.; Wong, J.Y.; et al. Early Transmission Dynamics in Wuhan, China, of Novel Coronavirus–Infected Pneumonia. N. Engl. J. Med. 2020, 382, 1199–1207. [Google Scholar] [CrossRef]
  21. Dehkordi, A.H.; Alizadeh, M.; Derakhshan, P.; Babazadeh, P.; Jahandideh, A. Understanding epidemic data and statistics: A case study of COVID-19. J. Med. Virol. 2020, 92, 868–882. [Google Scholar] [CrossRef] [Green Version]
  22. Desson, Z.; Lambertz, L.; Peters, J.W.; Falkenbach, M.; Kauer, L. Europe’s Covid-19 Outliers: German, Austrian and Swiss policy responses during the early stages of the 2020 pandemic. Health Policy Technol. 2020, 9, 405–418. [Google Scholar] [CrossRef] [PubMed]
  23. Coughlin, S.S.; Yiǧiter, A.; Xu, H.; Berman, A.E.; Chen, J. Early detection of change patterns in COVID-19 incidence and the implementation of public health policies: A multi-national study. Public Health Pract. 2020, 2, 100064. [Google Scholar] [CrossRef] [PubMed]
  24. Fouda, A.; Mahmoudi, N.; Moy, N.; Paolucci, F. Comparing the COVID-19 Pandemic in Greece, Iceland, New Zealand, and Singapore. Icel. N. Z. Singap. 2020. [Google Scholar] [CrossRef]
  25. Giamberardino, P.D.; Iacoviello, D. Evaluation of the effect of different policies in the containment of epidemic spreads for the COVID-19 case. Biomed. Signal Process. Control 2021, 65, 102325. [Google Scholar] [CrossRef] [PubMed]
  26. Wang, Y. Government Policies, National Culture and Social Distancing during the First Wave of the COVID-19 Pandemic: International Evidence. Saf. Sci. 2020, 135, 105138. [Google Scholar] [CrossRef]
  27. Haug, N.; Geyrhofer, L.; Londei, A.; Dervic, E.; Desvars-Larrive, A.; Loreto, V.; Pinior, B.; Thurner, S.; Klimek, P. Ranking the effectiveness of worldwide COVID-19 government interventions. Nat. Hum. Behav. 2020, 4, 1303–1312. [Google Scholar] [CrossRef] [PubMed]
Figure 1. Estimated Rt of four countries from 1 January to 1 December (14-days smoothed).
Engproc 05 00008 g001
Figure 2. Daily case of four countries from 1 January to 1 December (14-days smoothed).
Engproc 05 00008 g002
Figure 3. RDiT graphs, (a) China (b) Germany (c) Austria (d) USA. 7 days from the first lockdown and Rt (These figures plot regression discontinuity in time estimates. All show a line fitted to those observations by using a local linear approach).
Engproc 05 00008 g003
Figure 4. RDiT graphs, (a) China (b) Germany (c) Austria (d) USA. 7 days from the first lockdown and Rt (These figures plot regression discontinuity in time estimates. All shows a line fitted to those observations by using a local linear approach).
Engproc 05 00008 g004aEngproc 05 00008 g004b
Table 1. Lockdown time and conditions.
CountryLockdownsDateRtCOVID-19 CasesPolicy Stringency Index
China1st1 February1.27208977.31
2nd10 May0.932081.94
Germany1st21 March1.09236568.06
2nd22 October1.11595260.65
Austria1st16 March0.9215881.48
2nd17 October1.49174758.8
USA1st15 March1.6323441.2
2nd13 October1.225287966.2
Table 2. RDiT of the effects of first lockdown on COVID-19 Rt across China, Germany, Austria, and the USA.
Dependent Variable: Rt
ChinaGermanyAustriaUSA
(1)(2)(1)(2)(1)(2)(1)(2)
X−0.988 *0.0070.240 ***0.108 ***0.289 ***1.201 ***0.447 ***1.879 ***
I(X_2) 0.0001 −0.003 ** 0.076 *** 0.119 ***
treatment−4.457 ***−4.432 ***−2.167 ***−2.059 ***−1.534 ***−3.831 ***−2.605 ***−5.566 ***
X_treatment0.999 *14.458 ***−0.228 ***0.107−0.279 ***−1.137 ***−0.448 ***−1.904 ***
I(X_2):treatment 2.240 *** 0.023 −0.077 *** −0.119 ***
Constant2.322−13.358 ***3.000 ***2.280 **2.403 ***4.379 ***3.716 ***6.819 ***
Adjusted R20.3290.6190.1780.1640.3190.5040.3190.565
F Statistic8.842 *** 16.567 *** 4.463 *** 2.880 ** 8.493 ***10.750 *** 8.499 *** 11.171 ***
Note: * p ** p *** p < 0.01.
Table 3. RDiT of the effects of lockdowns on COVID-19 daily cases across China, Germany, Austria and the USA.
Dependent Variable: Daily Cases
ChinaGermanyAustriaUSA
(1)(2)(1)(2)(1)(2)(1)(2)
X526.400 *2782.400 ***402.040 ***550.004 ***95.700 ***13.4052930.453 ***50.155
I(X_2) 376.000 ** 27.681 *** 0.910 121.134 ***
treatment−1362.27 *−3274.50 ***5537.66 **7162.482 **1388.330 **1473.104 **18,375.94037,561.110 **
X_treatment−550.325 **−2909.15 ***326.6641701.04195.463237.527 2846.793
I(X_2):treatment −373.61 ** 16.871 7.794 153.278
Constant2105.600 ***4737.600 ***2805.675 *1631.25019.98243.64874.382163.018
Adjusted R20.2160.4750.3820.7810.4470.7680.6770.789
F Statistic5.41 ***9.676 ***10.901 ***35.251 ***13.946 *** 32.729 *** 31.495 ***32.115 ***
Note: * p ** p *** p < 0.01.
Table 4. Compared RDiT of the effects of the first and second lockdowns on COVID-19 Rt across China, Germany, Austria, and the USA.
Dependent Variable: Rt
ChinaGermanyAustriaUSA
1st 2nd 1st 2nd 1st 2nd 1st 2nd
X0.371 ***−0.117 ***−0.282 ***−0.065 ***−0.359 ***0.002−0.874 ***−2.352 ***
I(X_2)0.033 ***−0.005 ***−0.005 **−0.002 ***−0.006−0.001 *−0.041 ***−0.180 ***
treatment−1.556 ***0.585 *0.827 *0.112 ***0.564−0.128 **1.3344.750 ***
X_treatment−0.359 ***0.141 **0.272 ***0.046 ***0.336 ***−0.037 ***0.752 ***2.282 ***
I(X_2):treatment−0.034 ***0.004 *0.005 *0.003 ***0.0070.0010.044 ***0.178 ***
Constant1.986 ***0.529 **0.0271.014 ***0.1741.566 ***0.771−2.742 **
Adjusted R20.9860.1730.8540.9640.9100.9030.6490.752
F Statistic685.674 ***3.098 **59.560 *** 272.104 ***91.812 ***94.318 *** 19.486 *** 22.653 ***
Note: * p ** p *** p < 0.01.
Table 5. Compared RDiT of the effects of the first and second lockdowns on COVID-19 daily cases across China, Germany, Austria, and the USA.
Dependent Variable: Daily Cases
ChinaGermanyAustriaUSA
1st 2nd 1st 2nd 1st 2nd 1st 2nd
X353.007 ***7.889 ***426.831 ***646.062 ***36.538 **67.566 *735.098 ***735.098 ***
I(X_2)9.801 **0.423 ***10.875 ***12.0181.191 *4.351 ***24.305 ***24.305 ***
treatment−762.321−24.508 **−865.244 *4811.651 ***−108.633 *−254.206−2058.490 **2100.234 ***
X_treatment−243.693−8.009 ***−192.626 **441.737110.960 ***208.117 ***2100.234 **−35.416 ***
I(X_2):treatment−20.954 ***−0.416 ***−24.520 ***−46.101 ***−17.168 ***−1.549−35.416 ***986.184
Constant2981.537 ***31.207 ***4104.298 ***9243.376 ***303.808 ***1558.123 ***938.363938.363
Adjusted R20.6990.7680.9420.8790.9720.9810.9910.991
F Statistic24.255 ***34.156 ***162.698 *** 122.417 *** 226.549 *** 521.901 ***1091.190 ***1091.190 ***
Note: * p ** p *** p < 0.01.
Publisher’s Note: MDPI stays neutral with regard to jurisdictional claims in published maps and institutional affiliations.

