A Novel Tree Height Extraction Approach for Individual Trees by Combining TLS and UAV Image-Based Point Cloud Integration

 , , , ,
Abstract
:1. Introduction
2. Materials
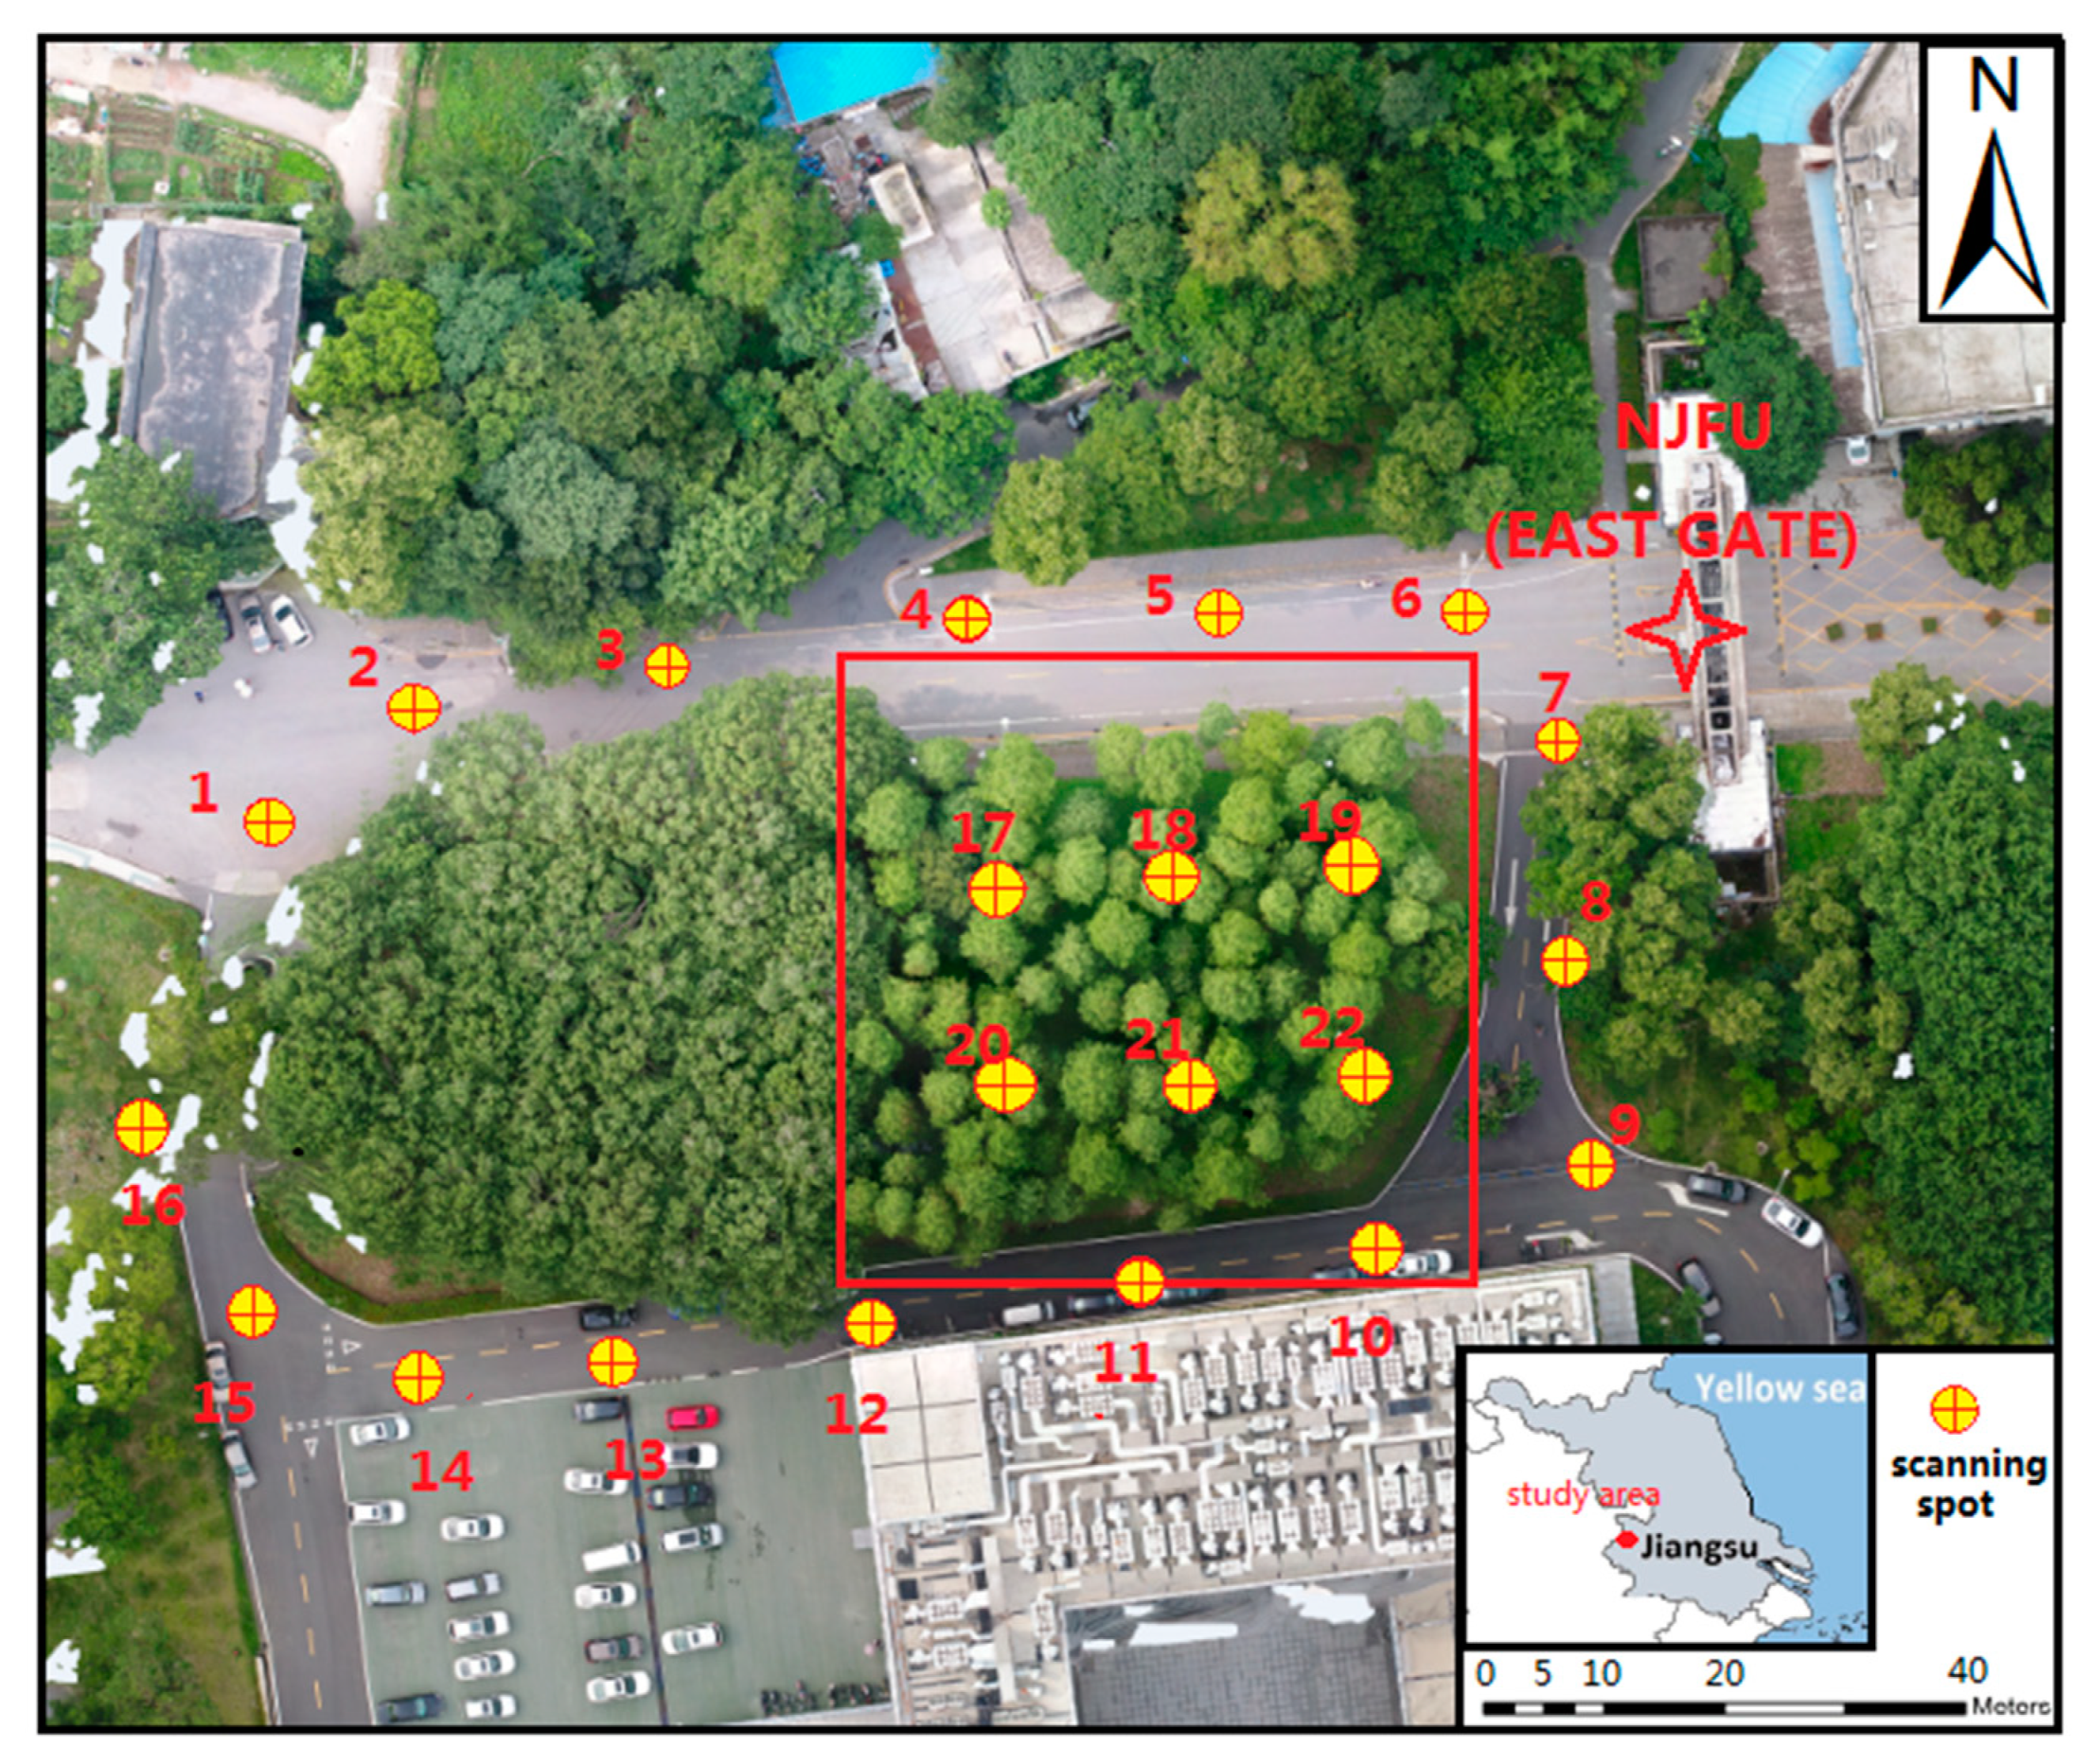
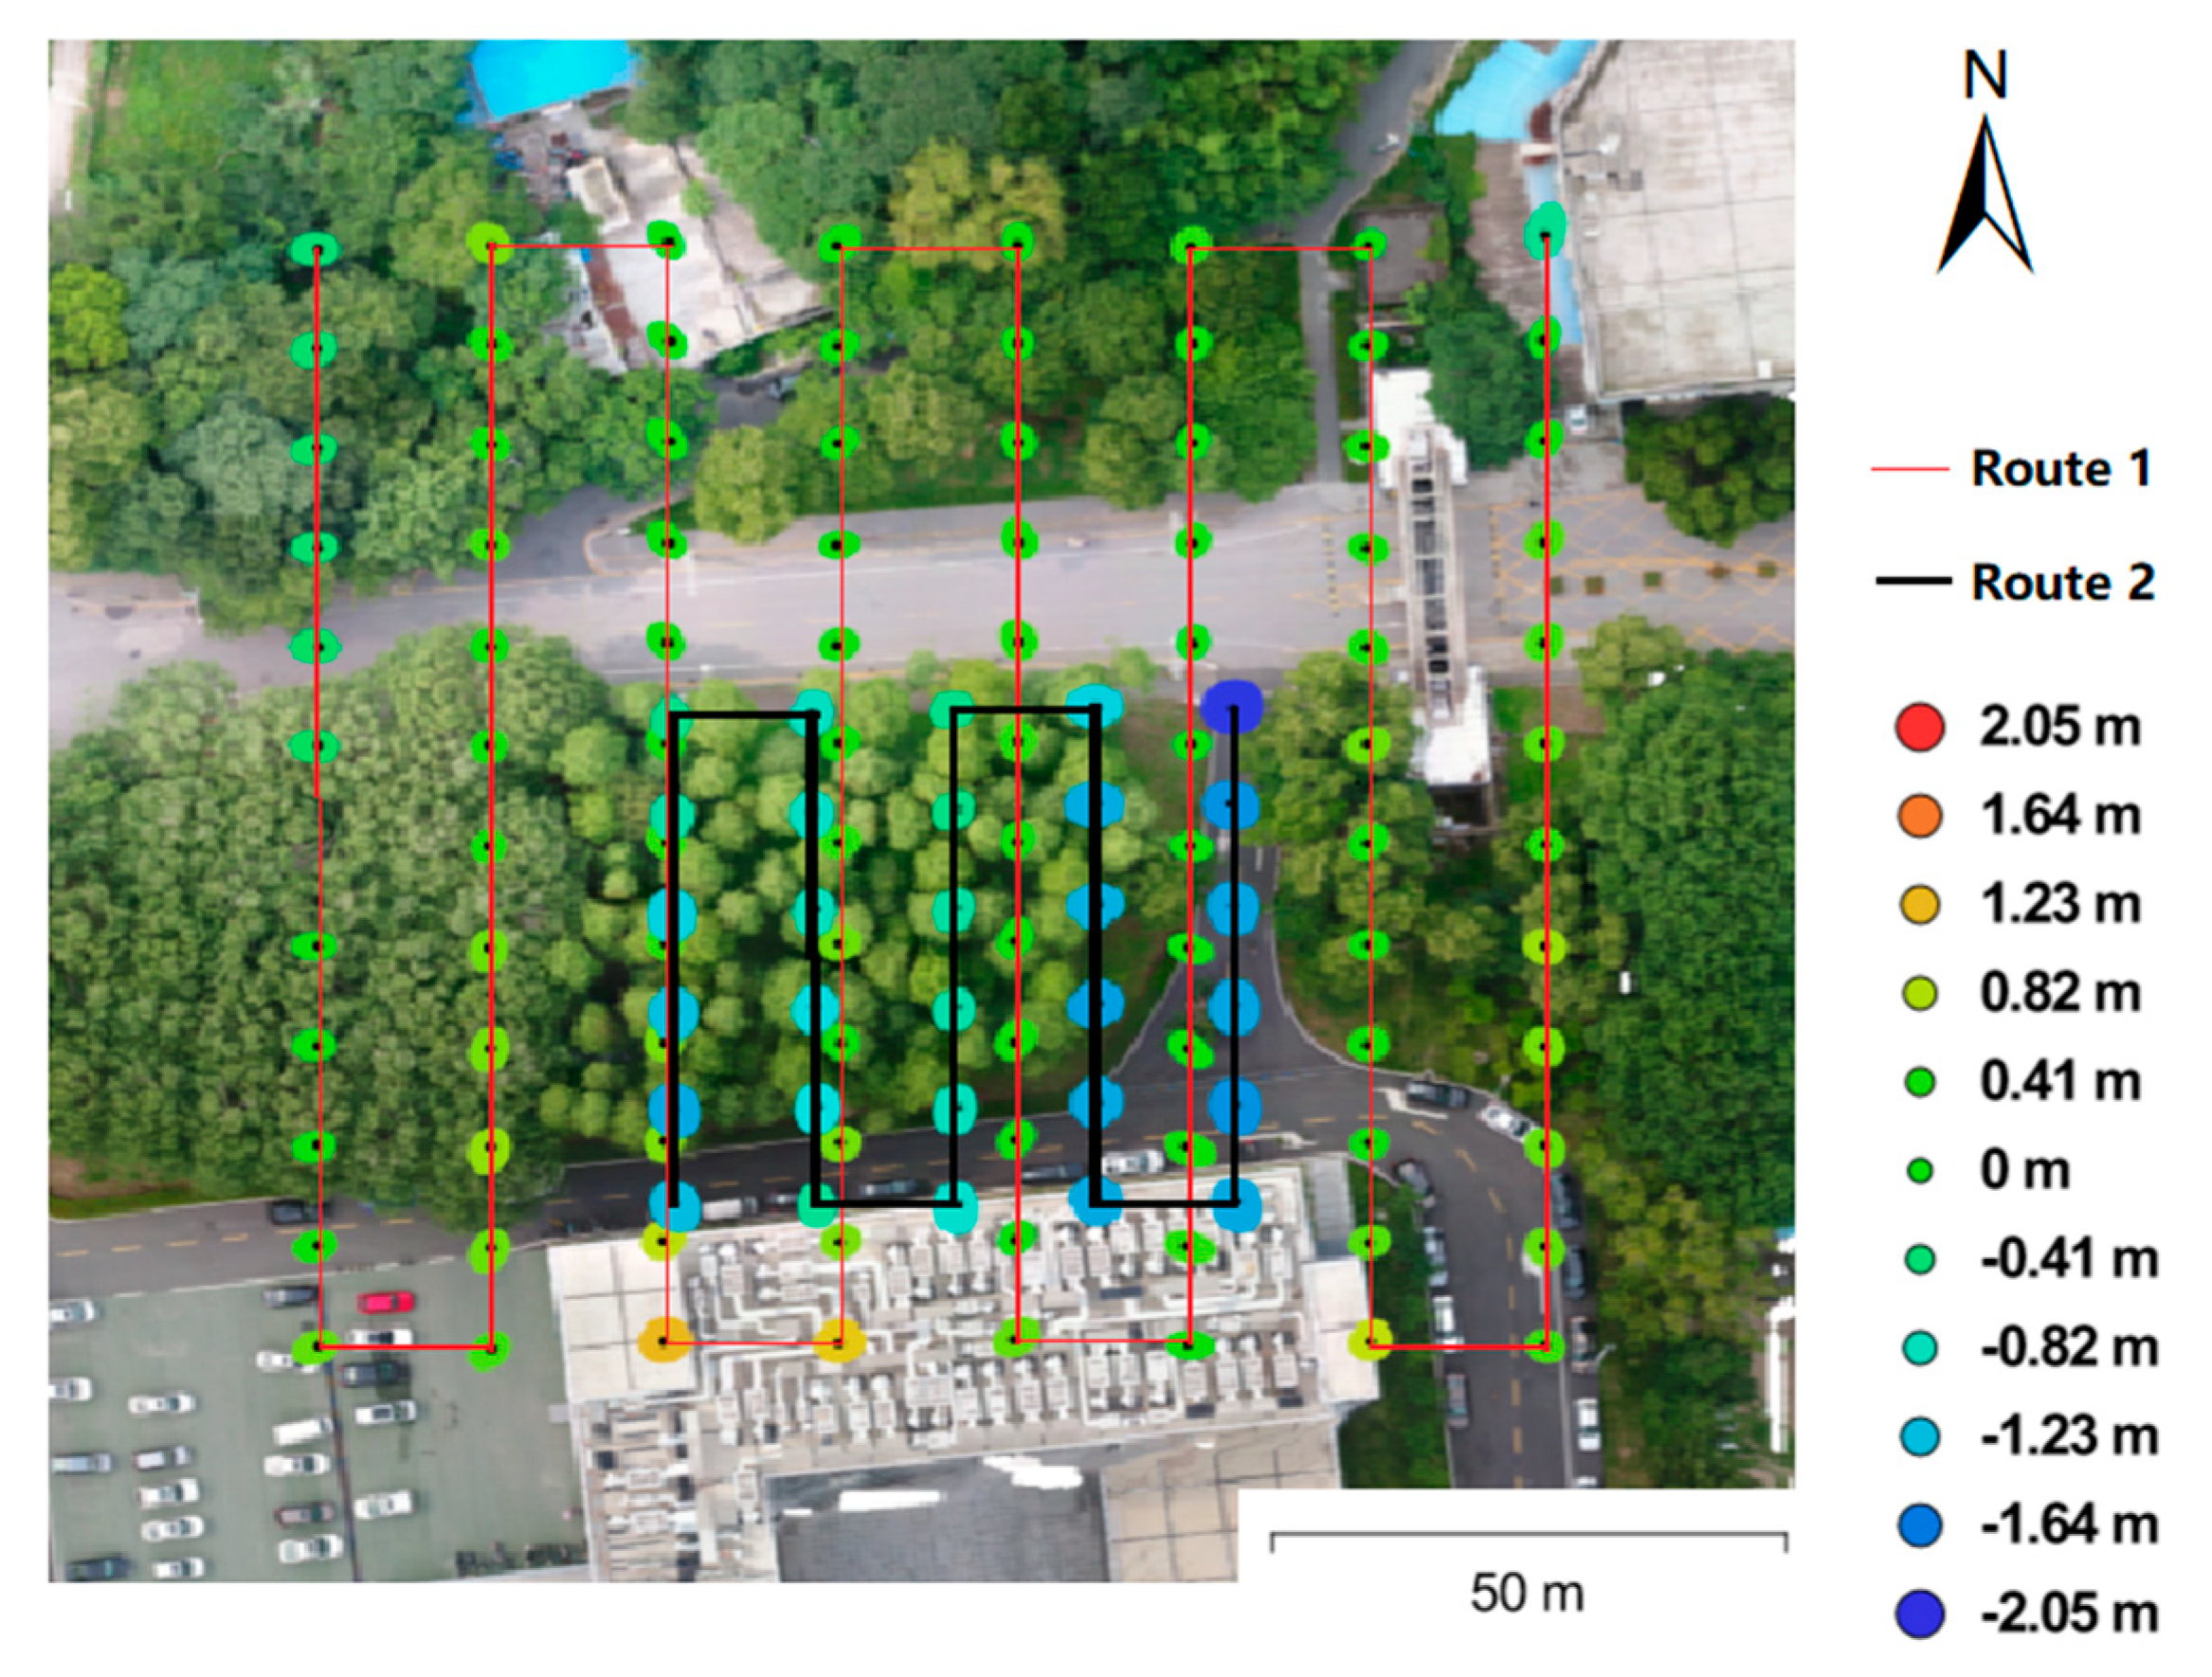
2.1. Study Area
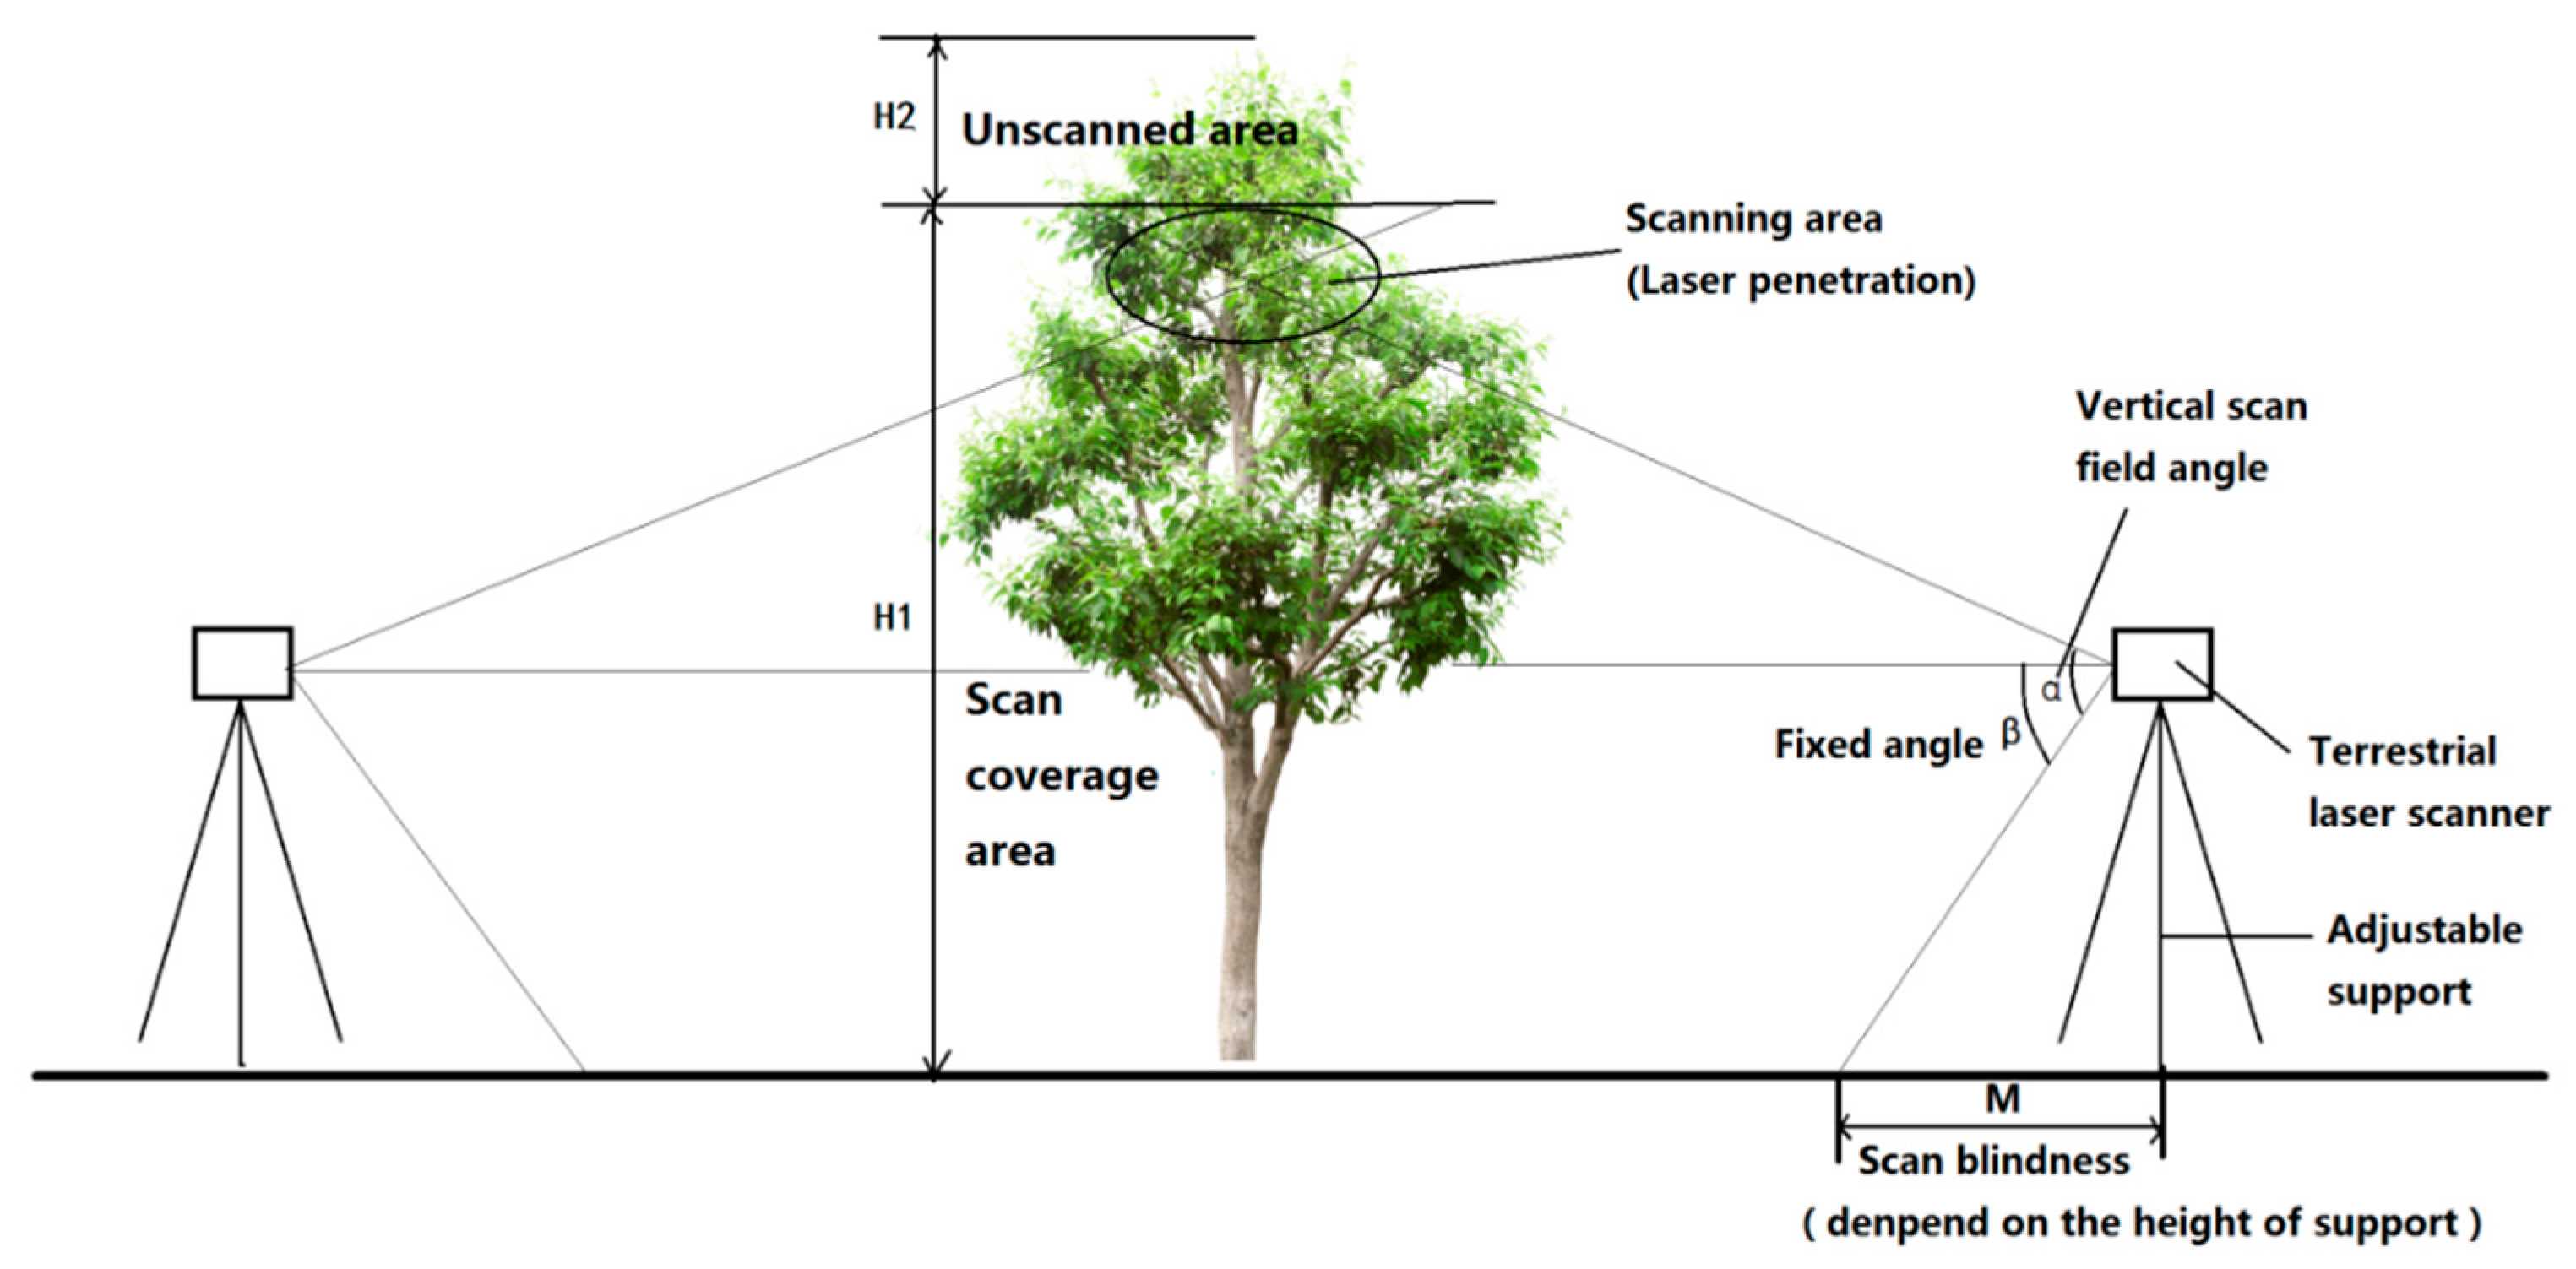
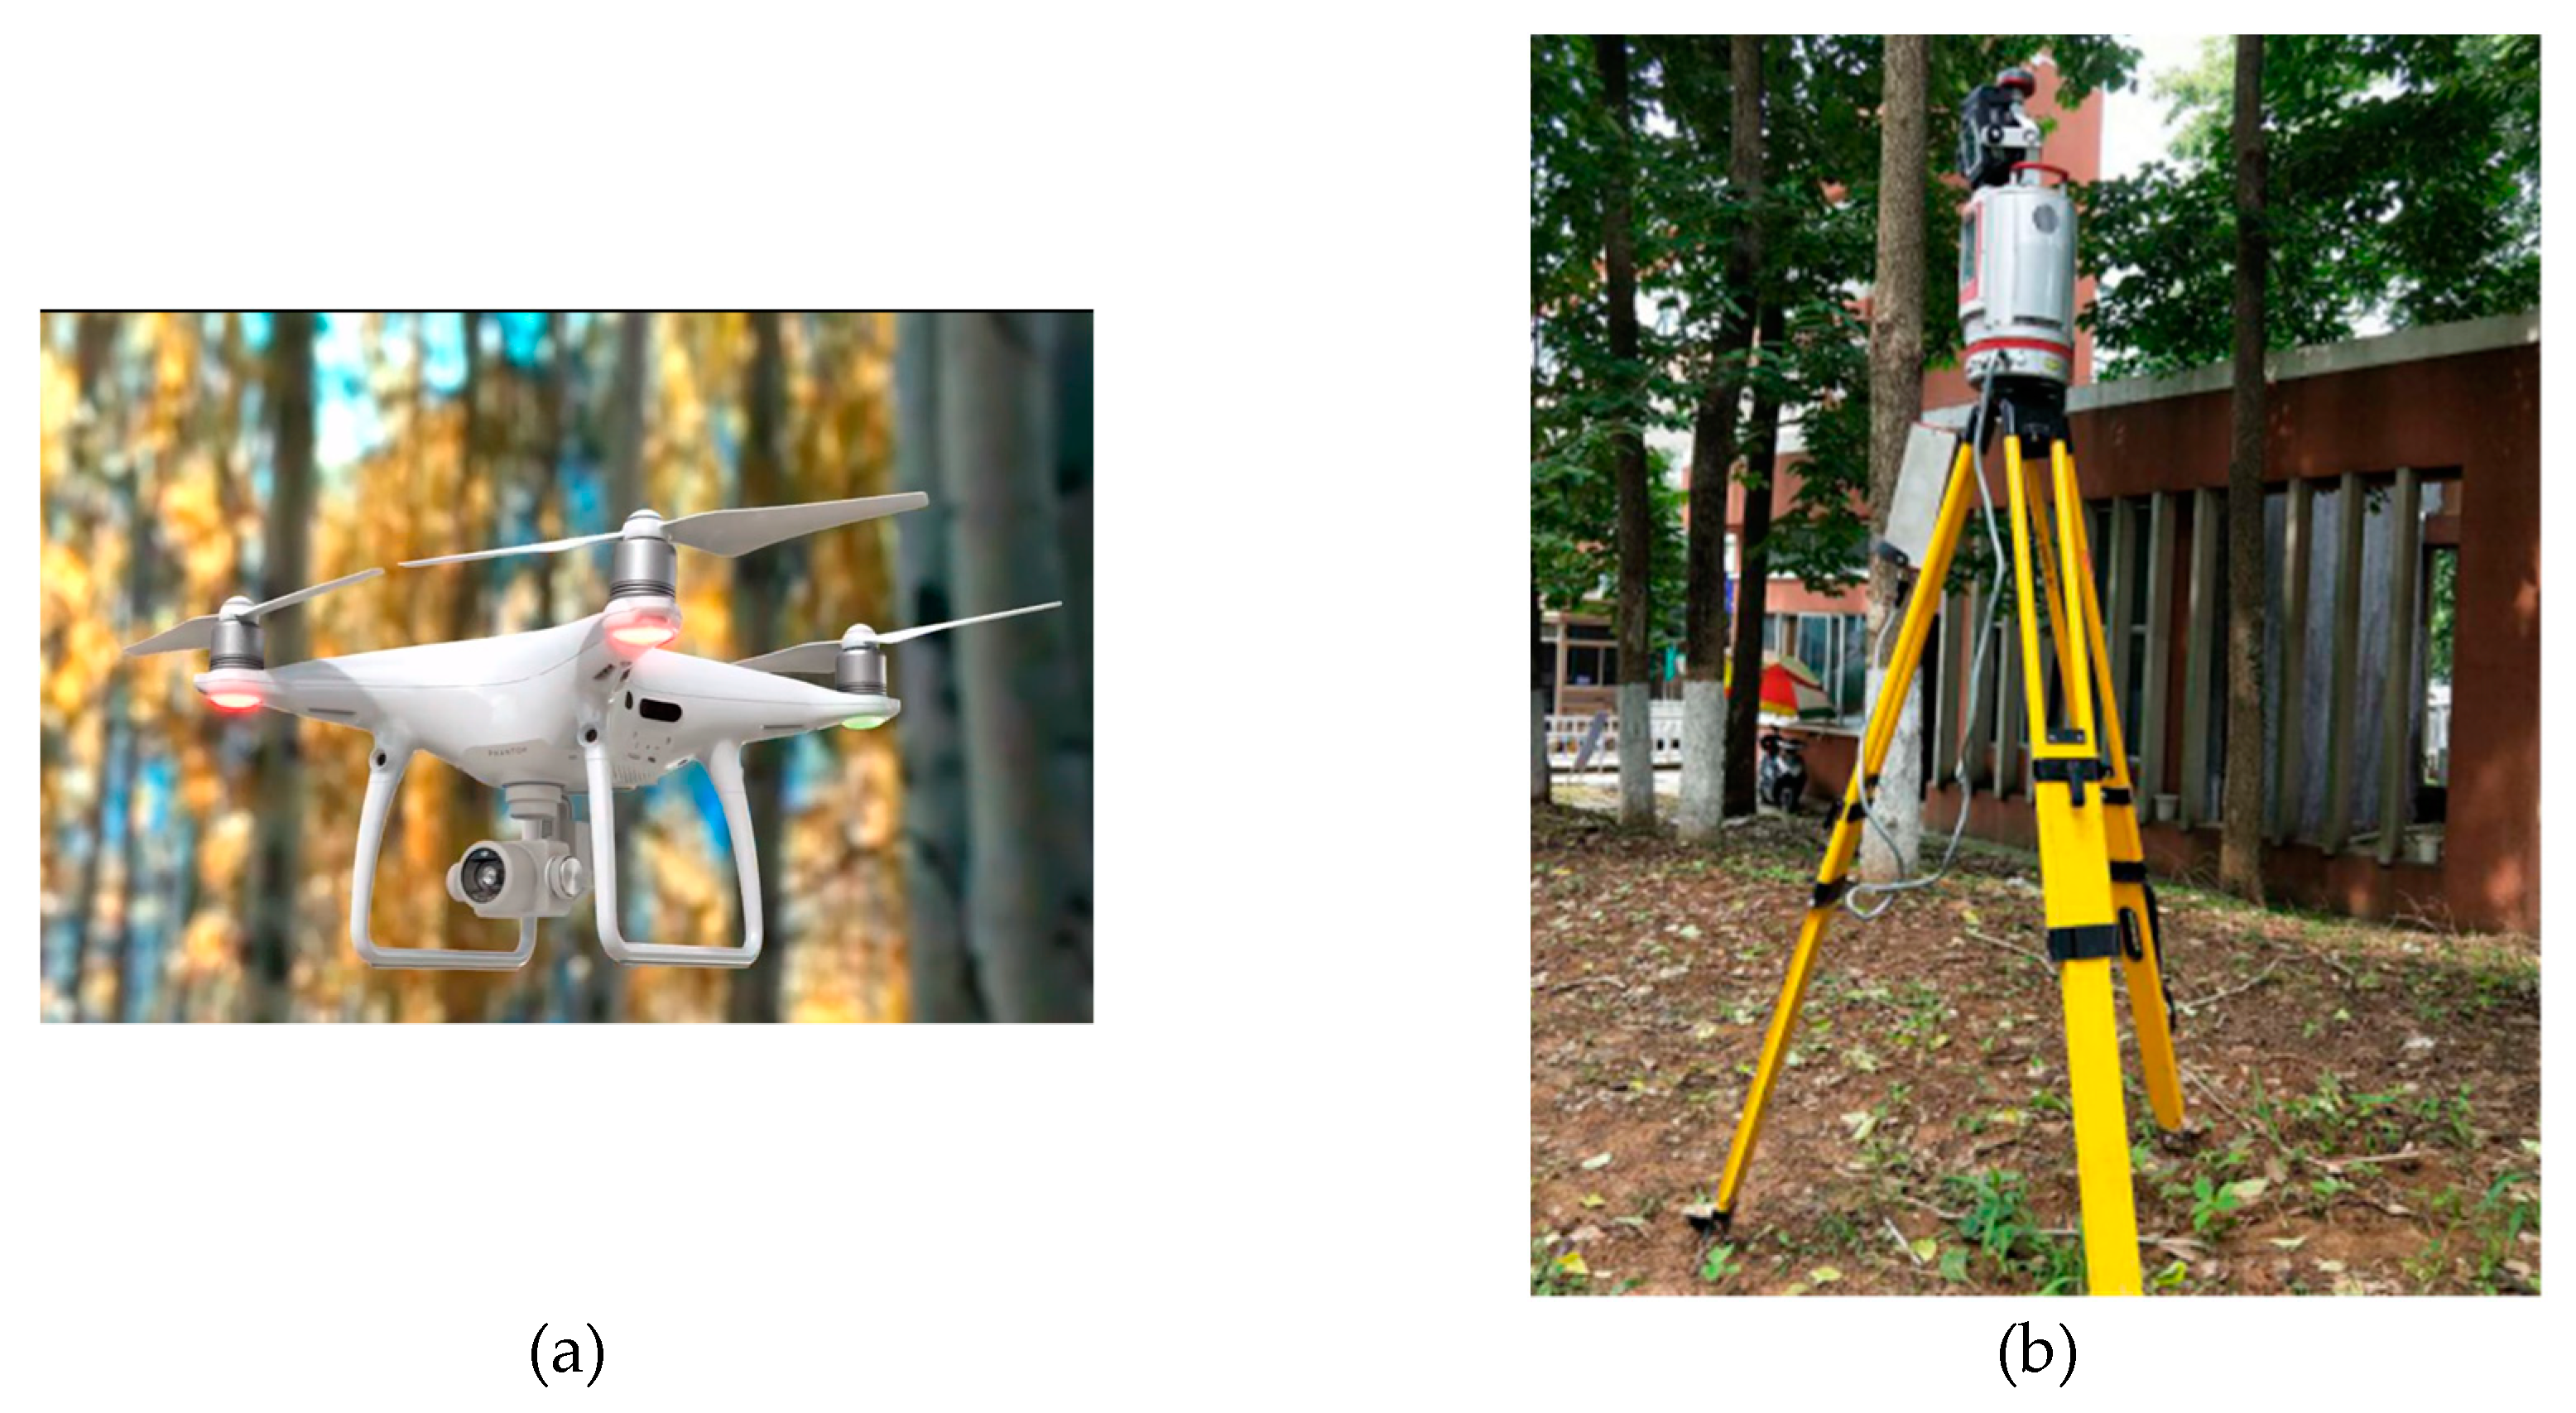
2.2. Equipment Introduction and Data Collection
3. Methods
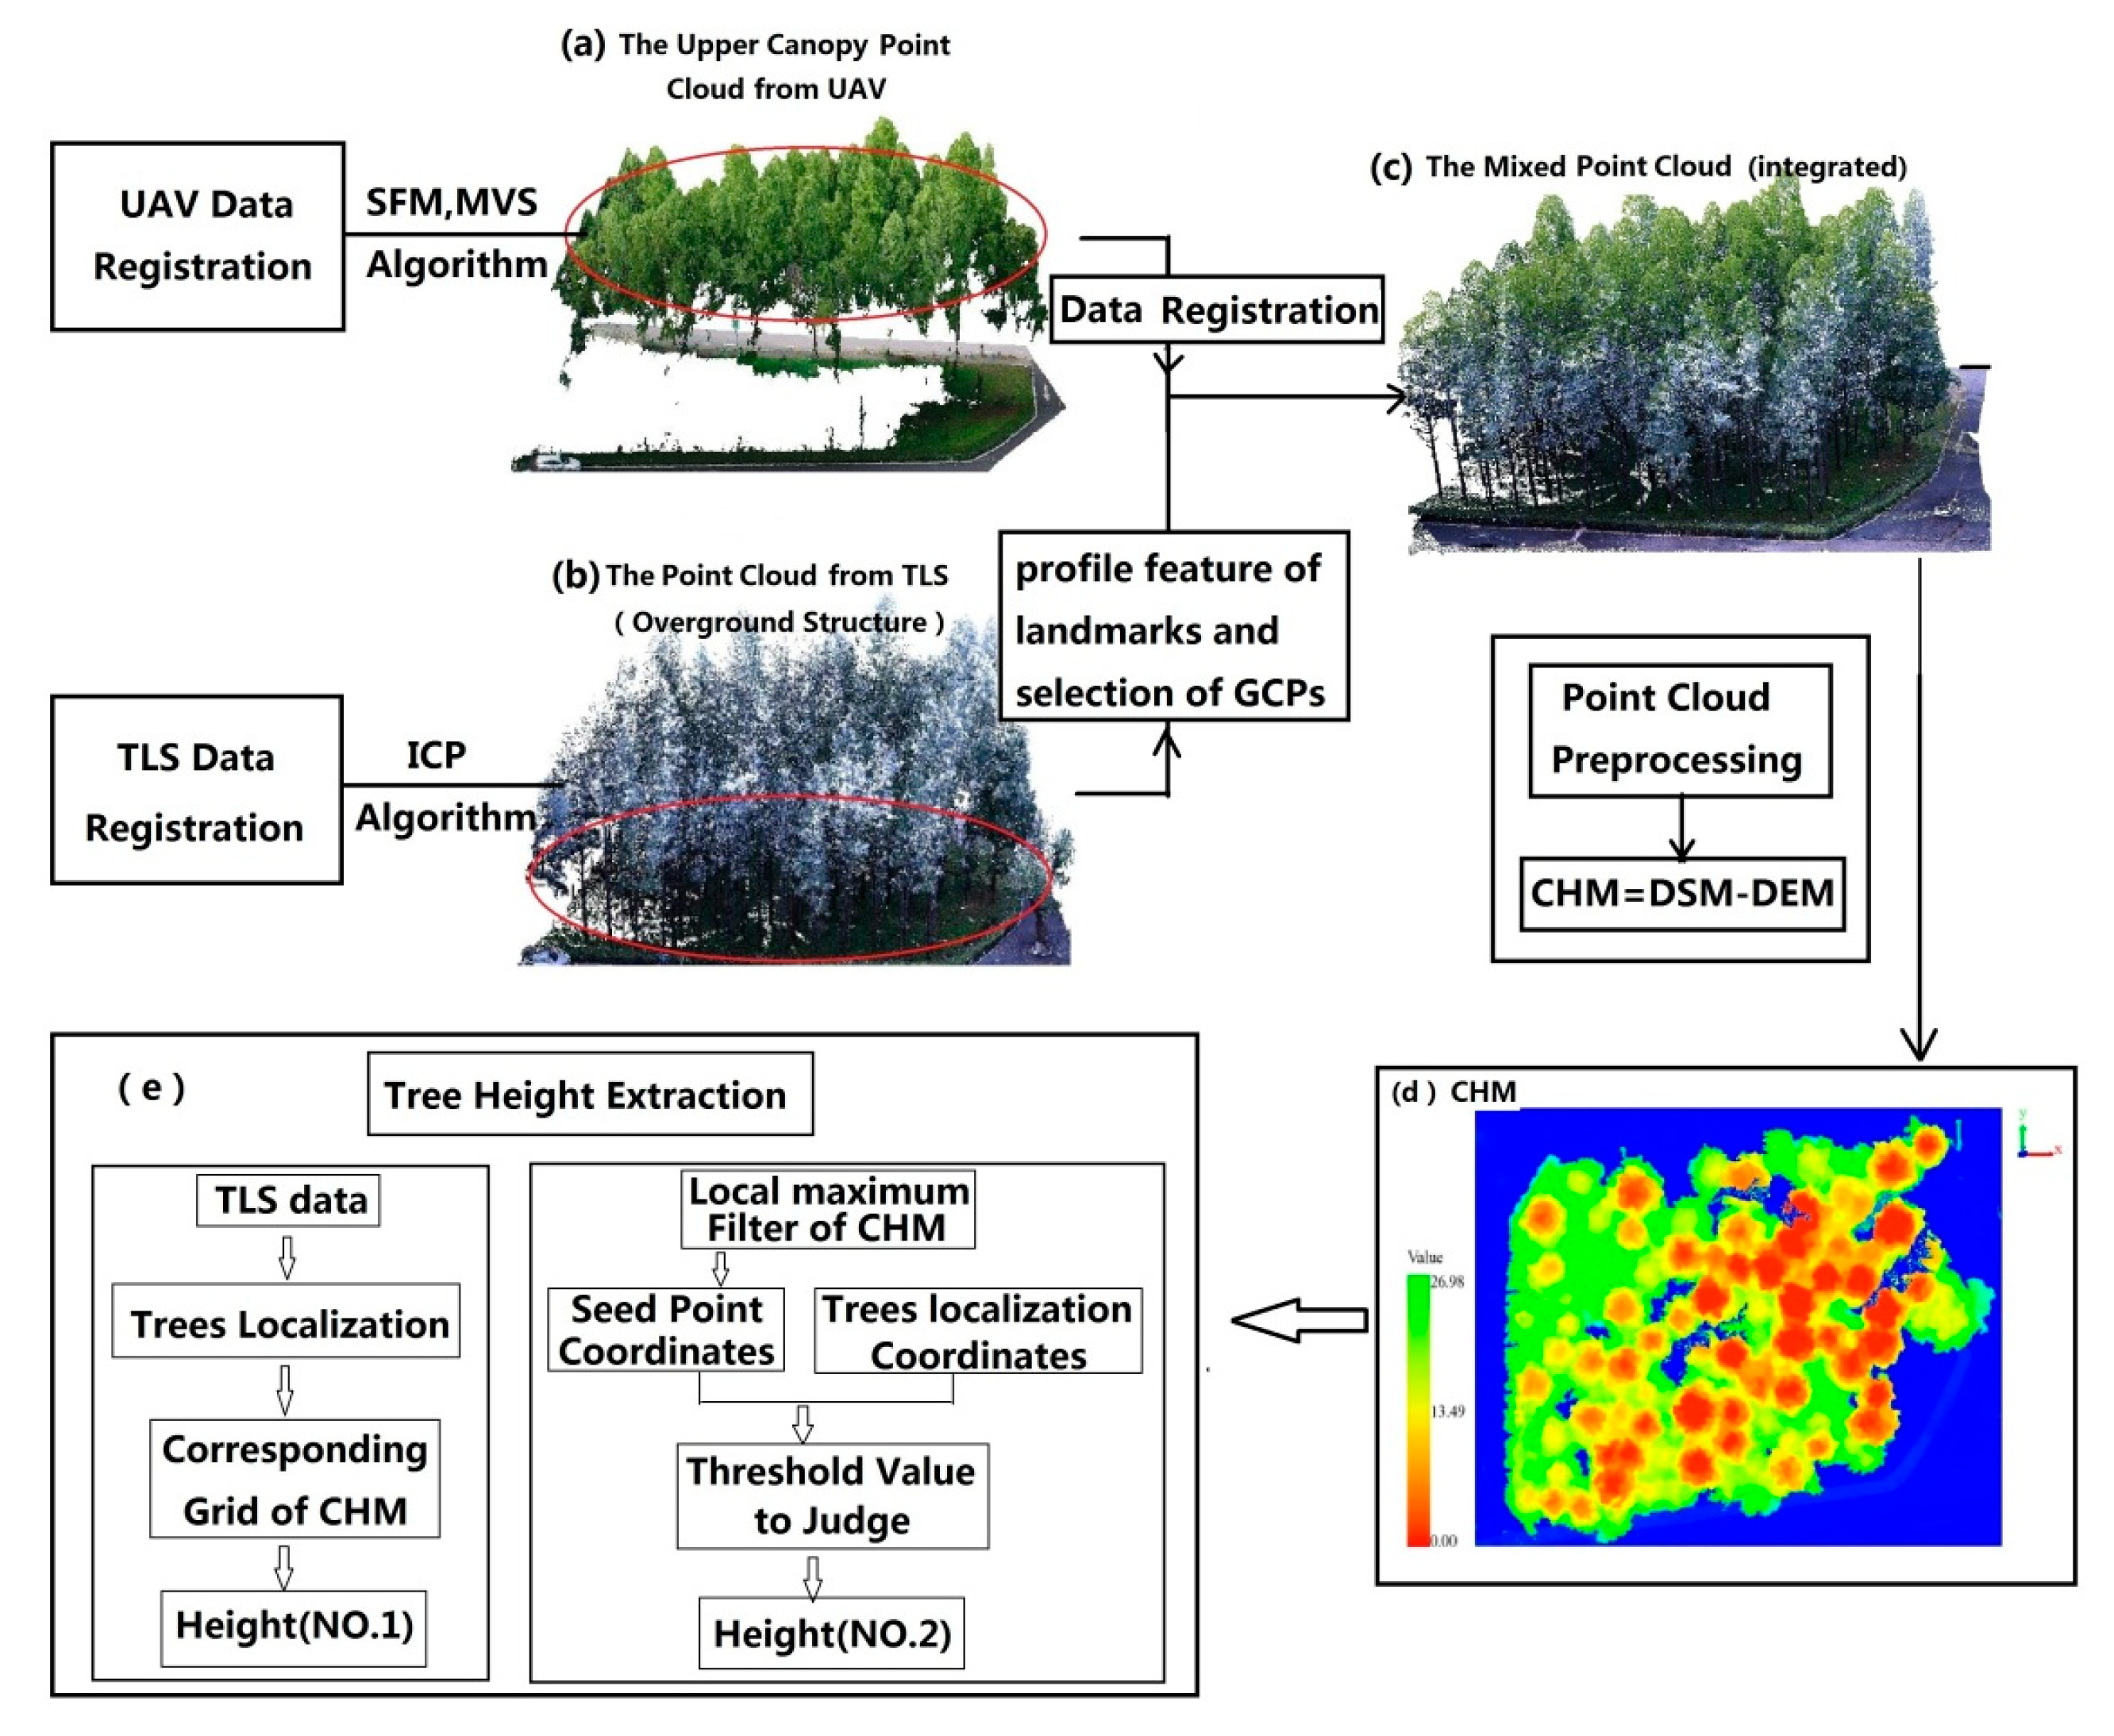
3.1. Data Registration
3.2. Mixed Data Preprocessing and CHM Acquirement
3.3. Tree Height Extraction
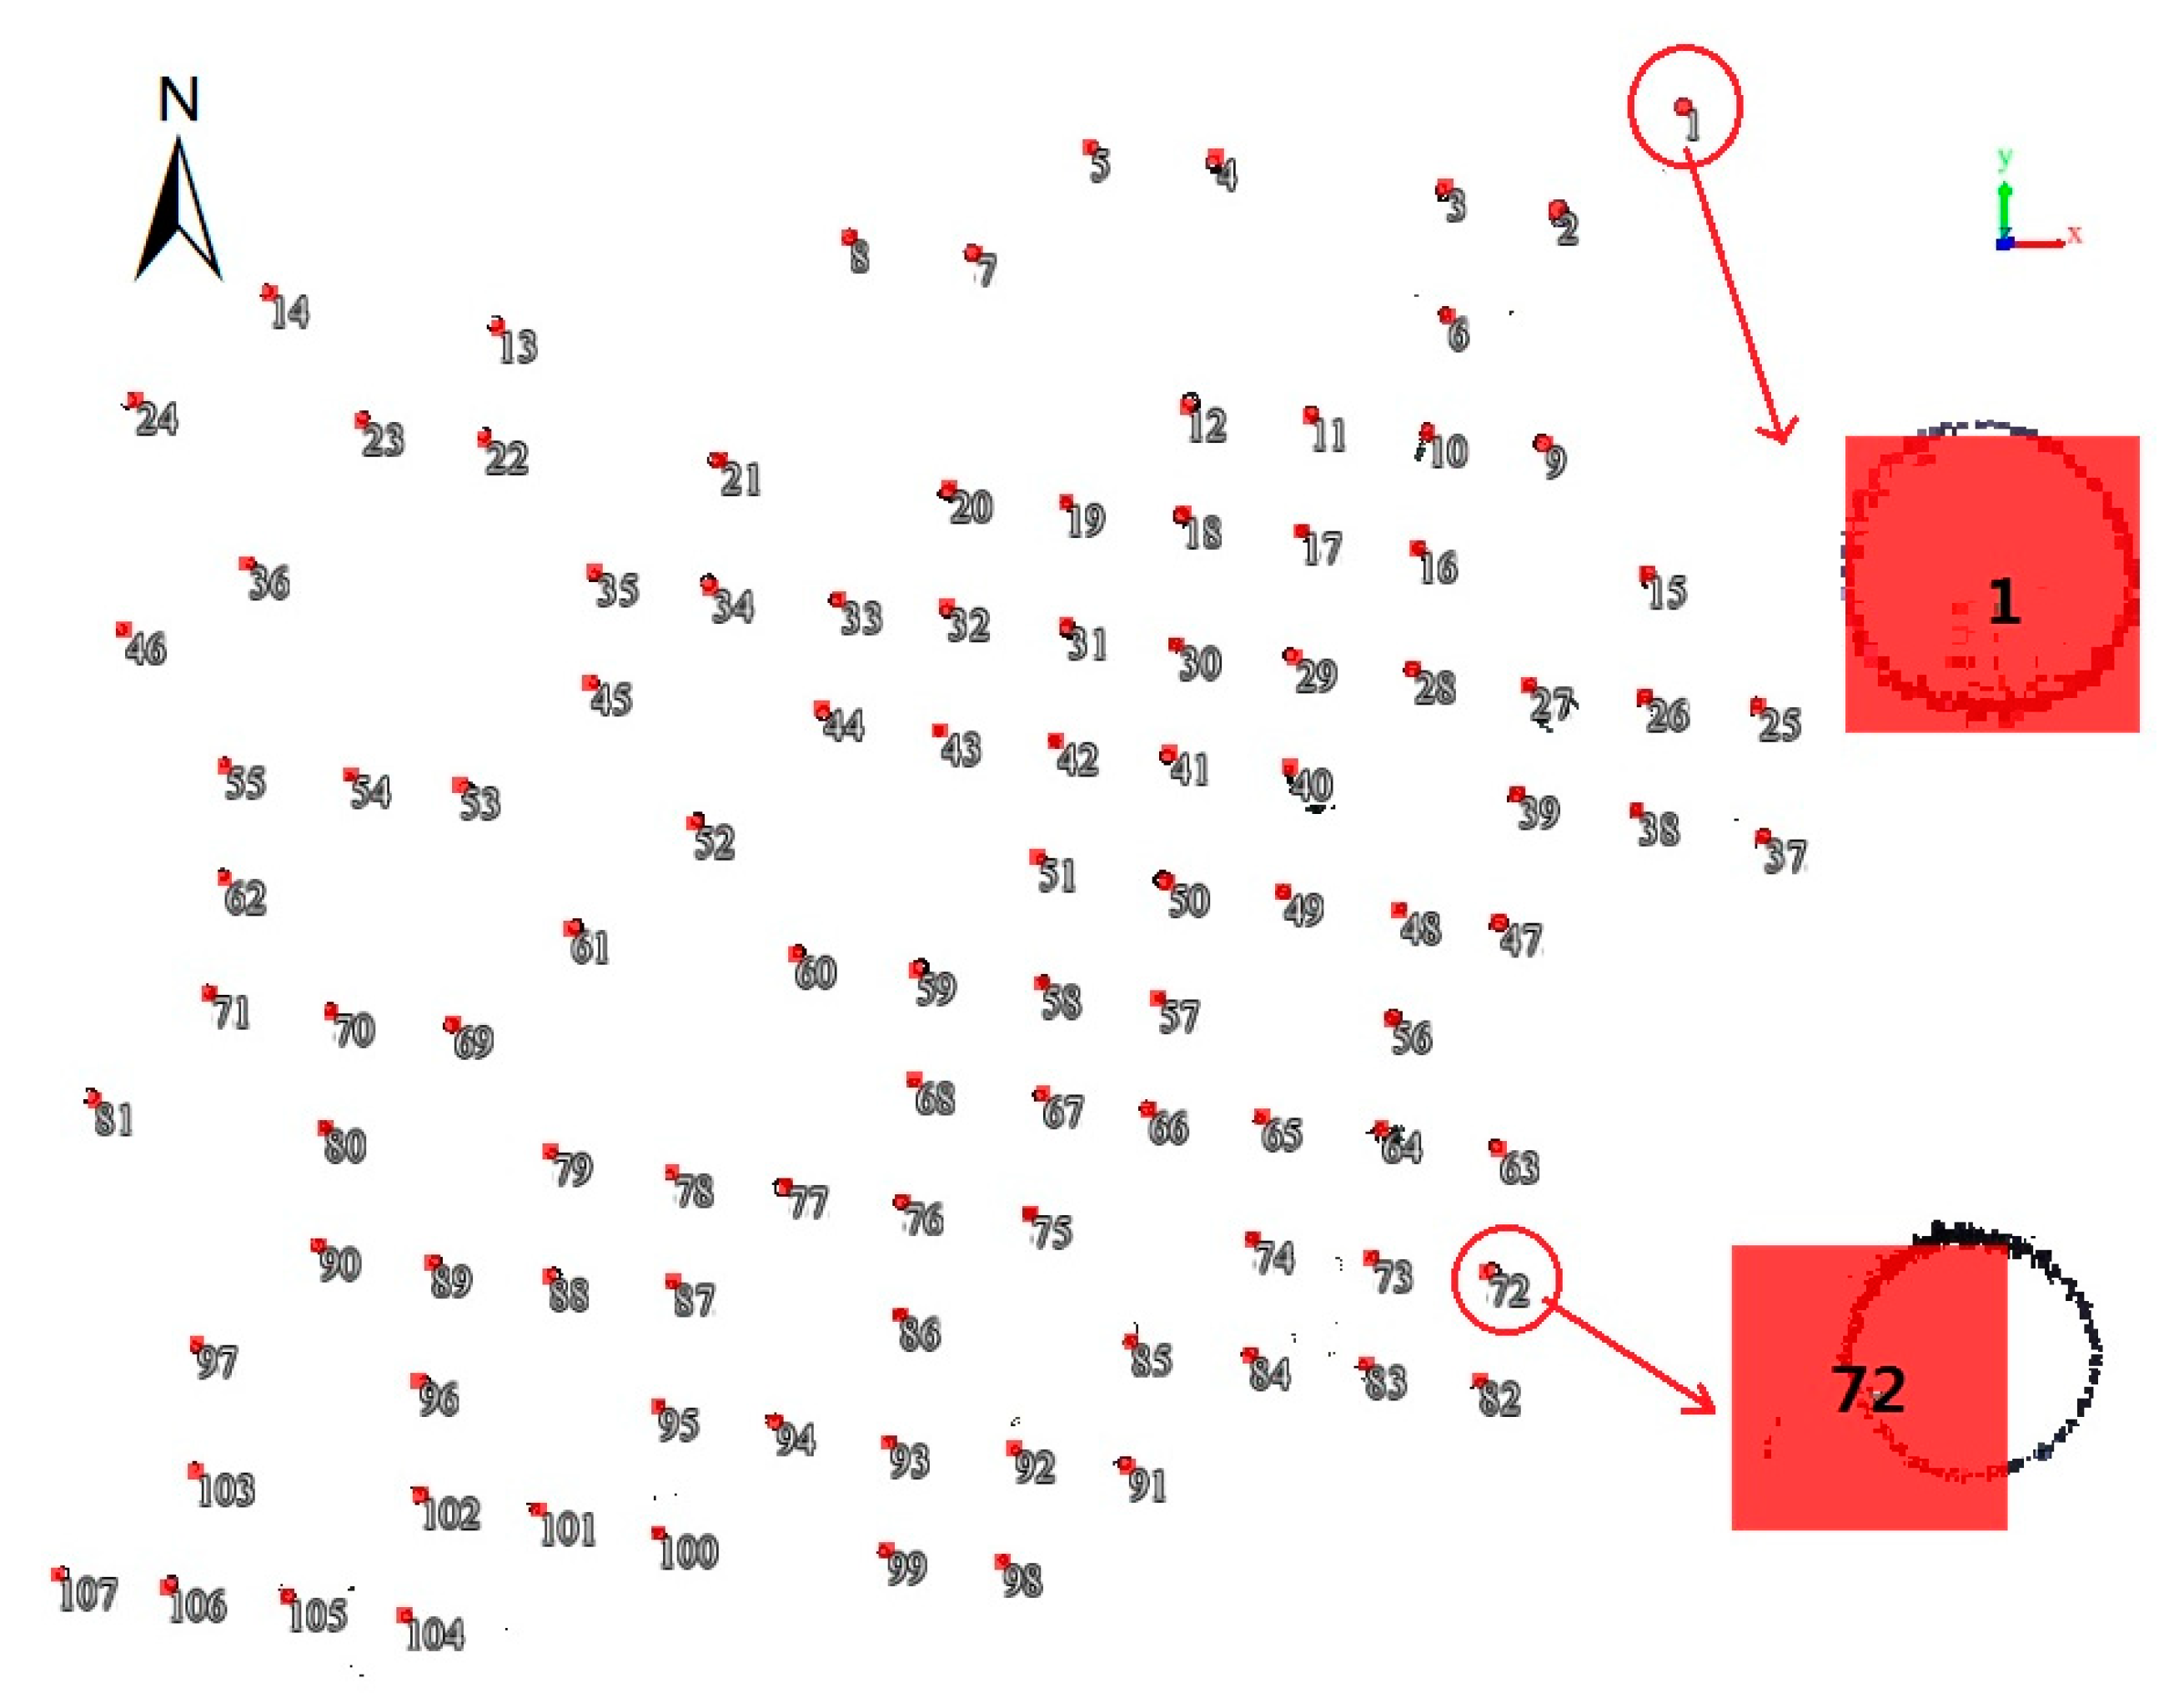
3.3.1. Tree Height Extraction Based on Individual Tree Localization
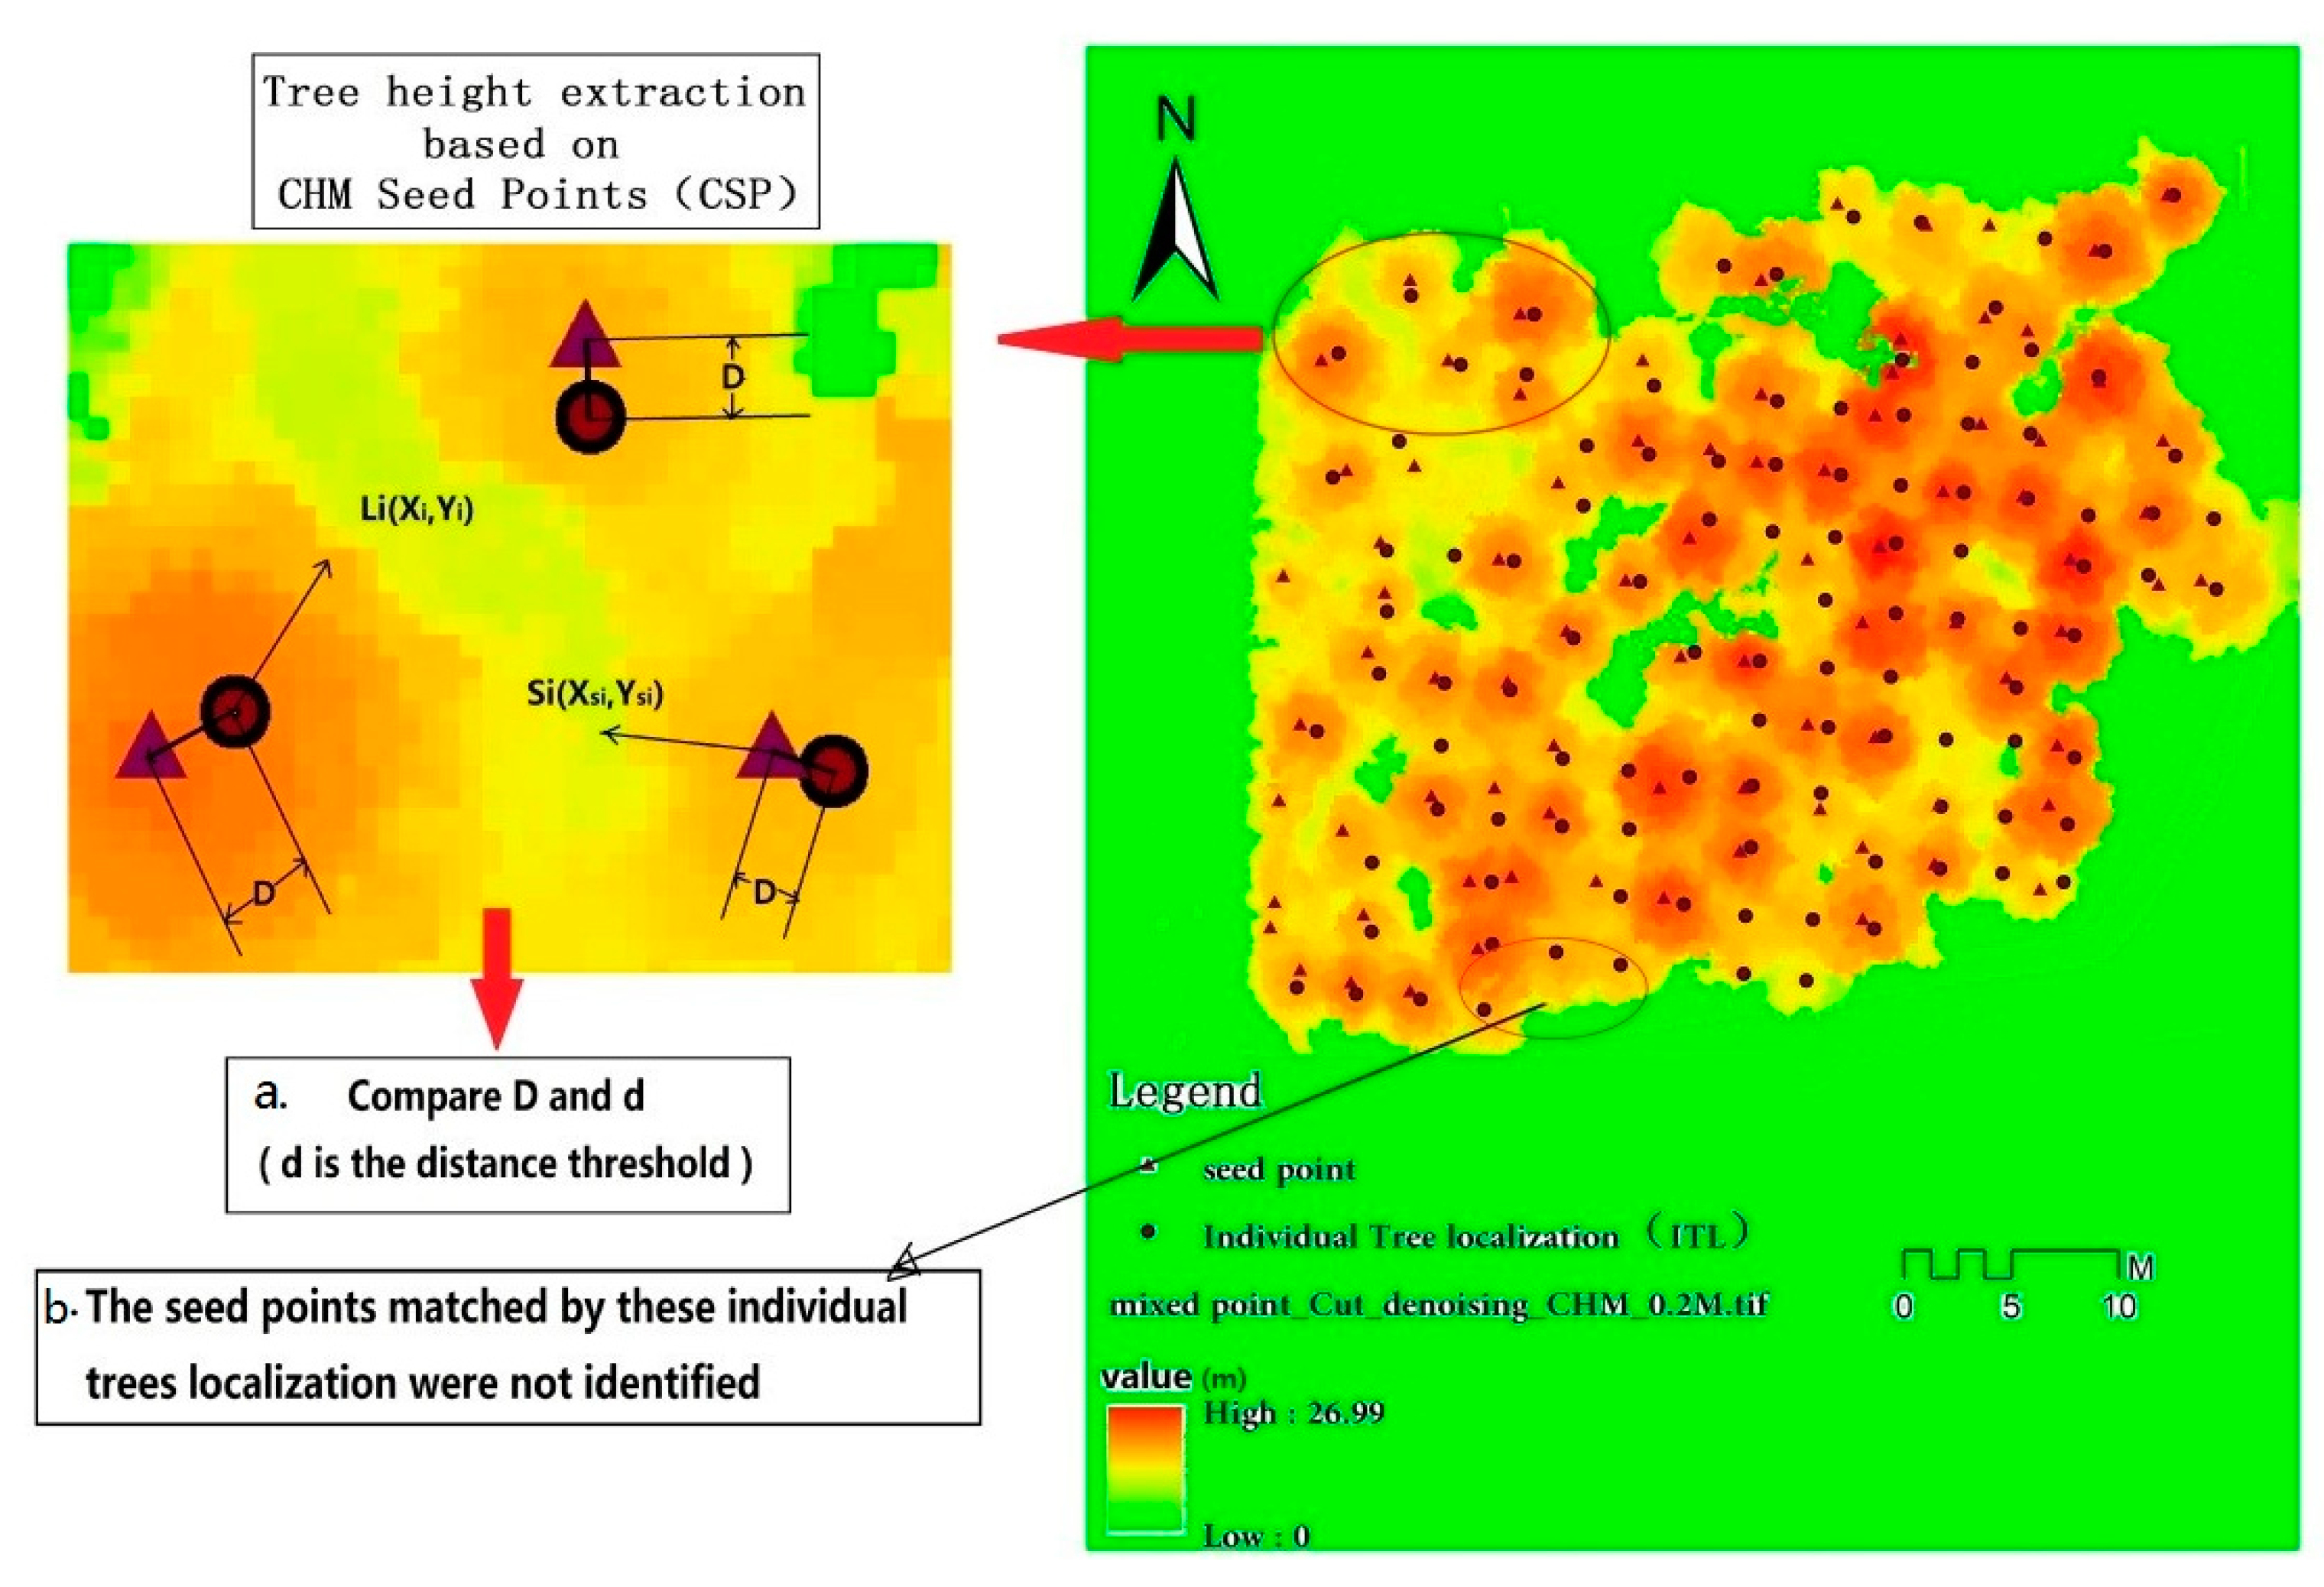
3.3.2. Tree Height Extraction Based on CHM Seed Points
| Title: CSP algorithm |
| Input: 1. CHM raster data of a certain resolution extracted through mixed point cloud (Tif format); 2. The information of ITL coordinate: Li = {(Xi, Yi) | i = 1,2,3,…,n, n is the number of trees}; and 3. Input the distance threshold d, the height threshold H, and search window size SIZE. Output: 1. Output the image of seed point Si and ITL point Li on CHM; and 2. If Di ≤ d, output Si, (Xsi,Ysi) and Vh; If Di > d, output False. |
| 1. Read the CHM raster information, including the origin coordinate (X0, Y0) of the raster data, resolution R (m), and raster value. According to the original coordinate, resolution and raster line, and column number (A, B), the localization coordinate of any raster (Xp, Yp) can be obtained. 2. Utilize a Gaussian-smoothing filter and local maximum filter for the CHM raster data, according to the search window size SIZE and height threshold H the point with the largest value in the search window size is marked as the seed point Si, and obtain the coordinates of Si (Xsi, Ysi) and its corresponding tree height value Vh. 3. Read the coordinate information of ITL, load the coordinate information of seed point Si at the same time. Project both points onto the XOY plane, take the projection distance between each seed point and the nearest ITL point as Di, and judge the size of Di and d |
4. Results
4.1. Validation of Mixed Data Registration Accuracy
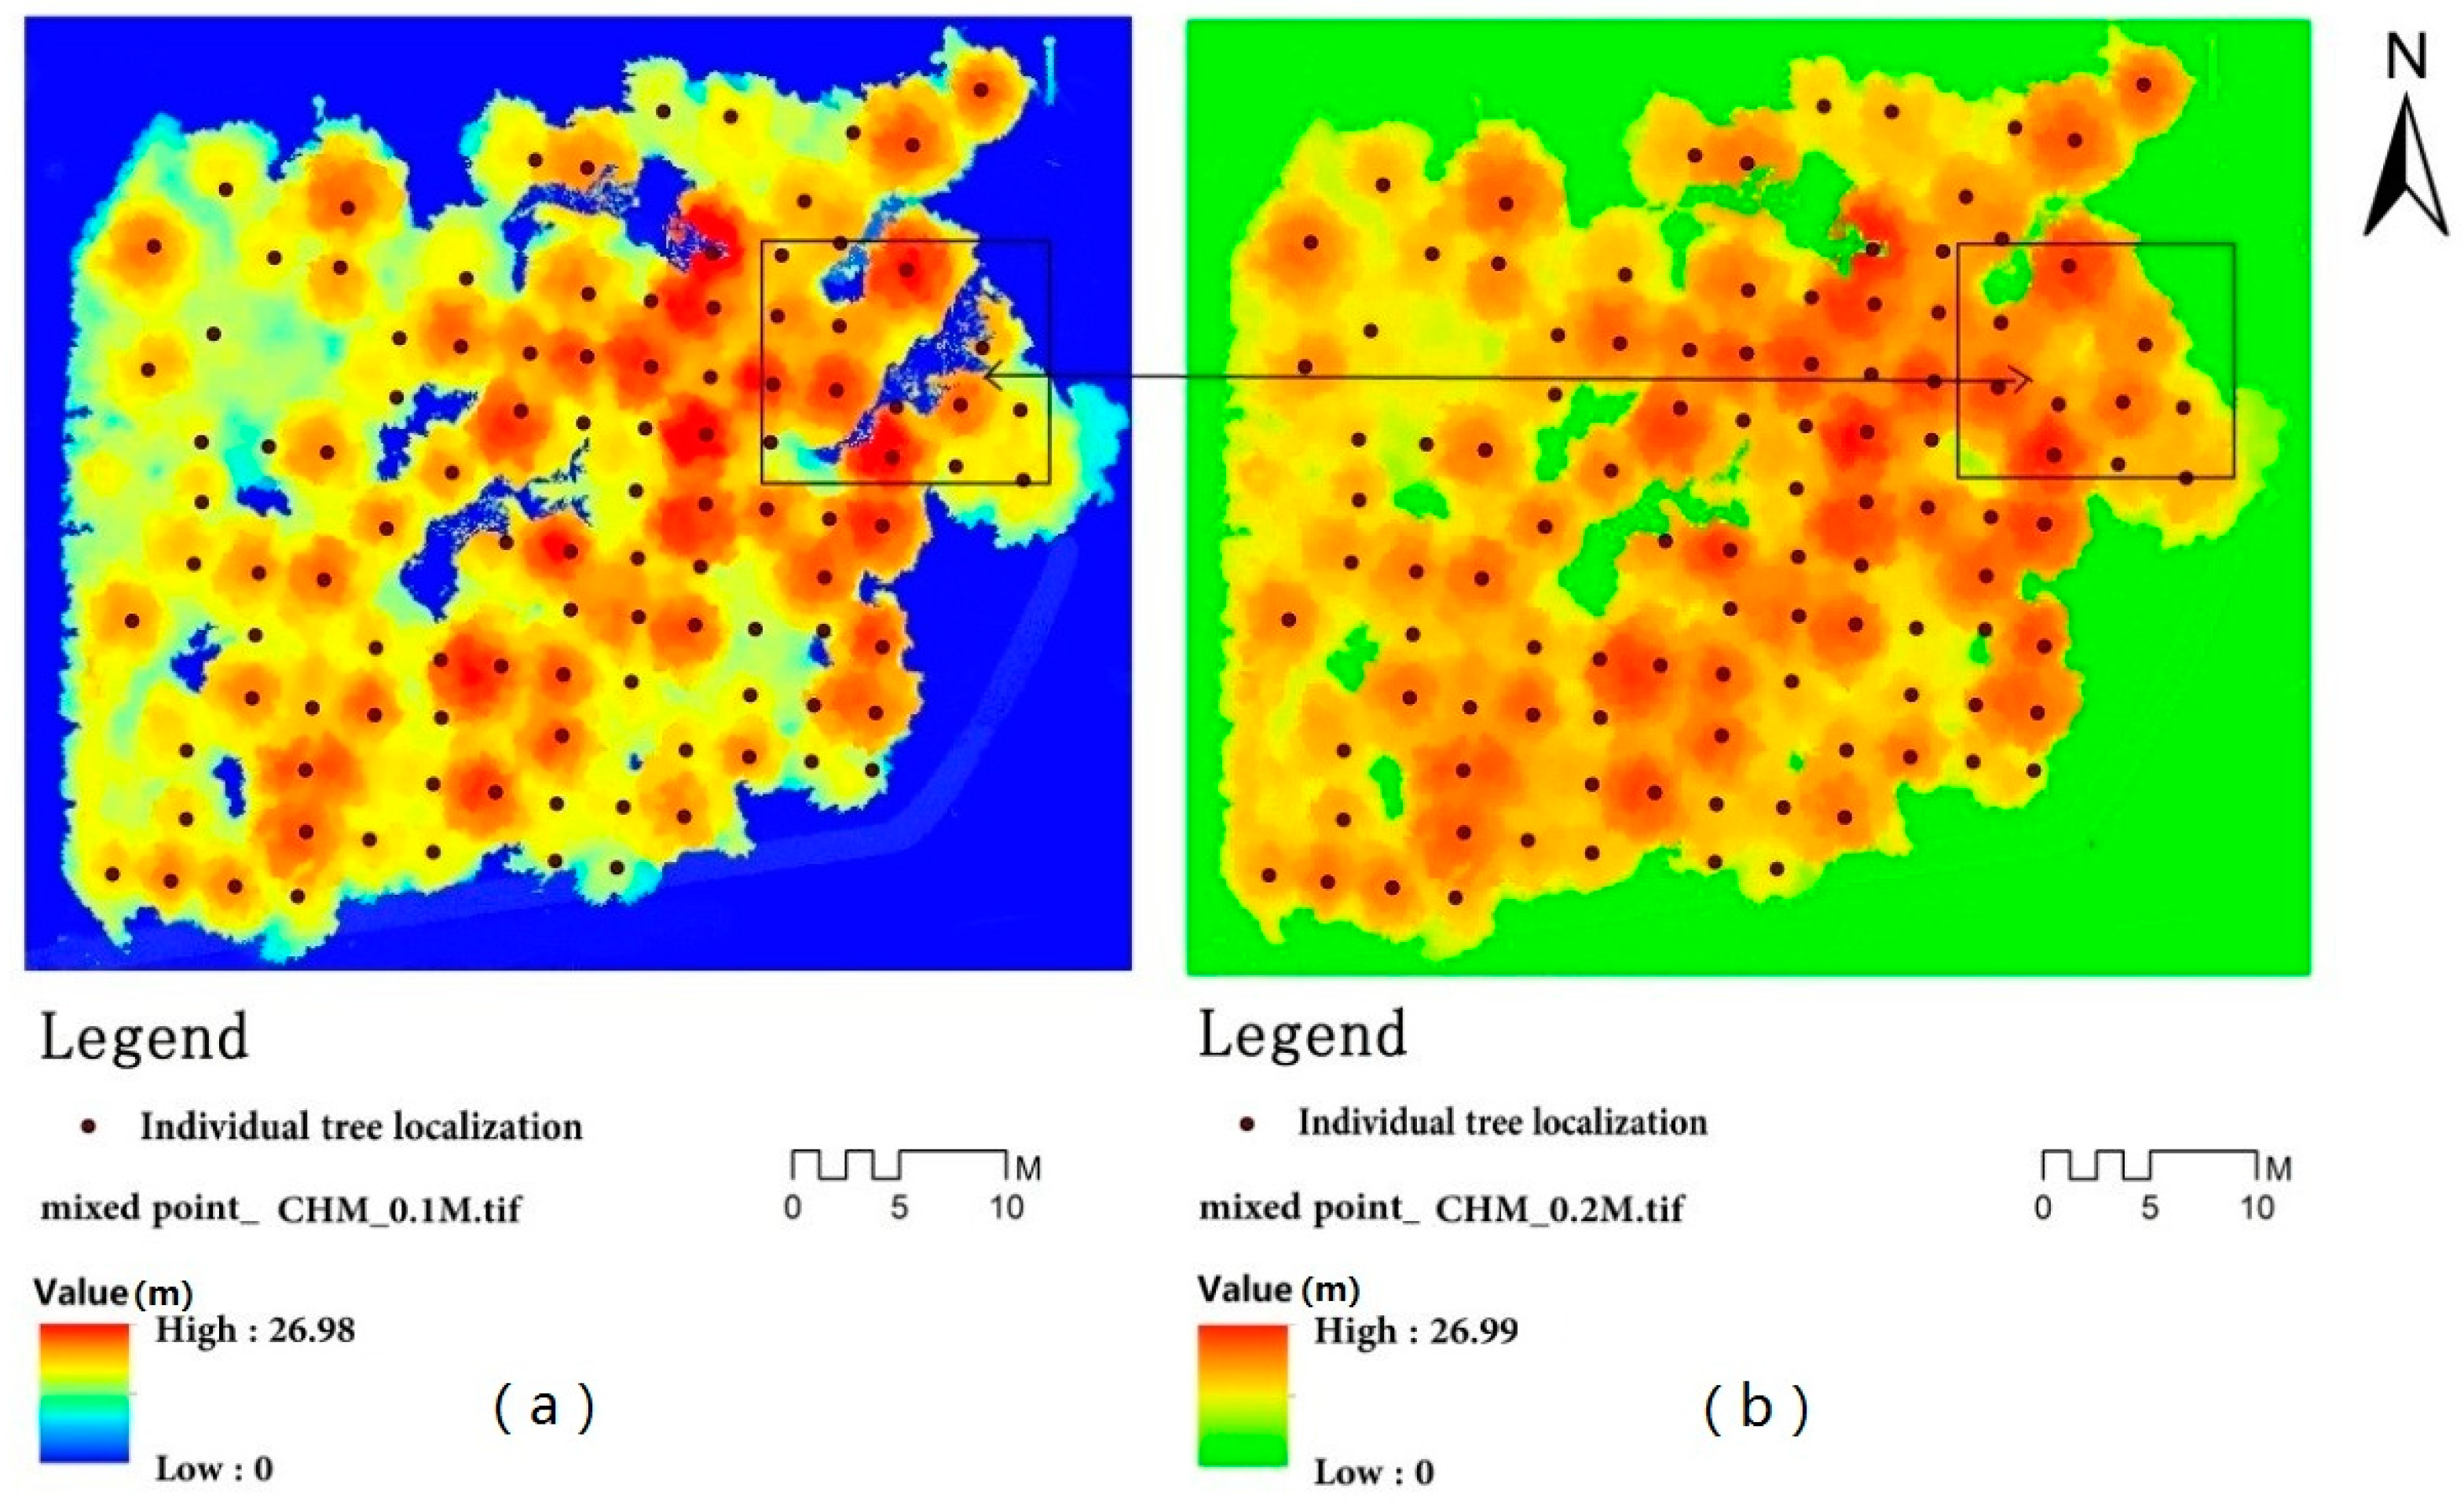
4.2. Height Extraction
4.2.1. ITL Extraction Results
4.2.2. CSP extraction results
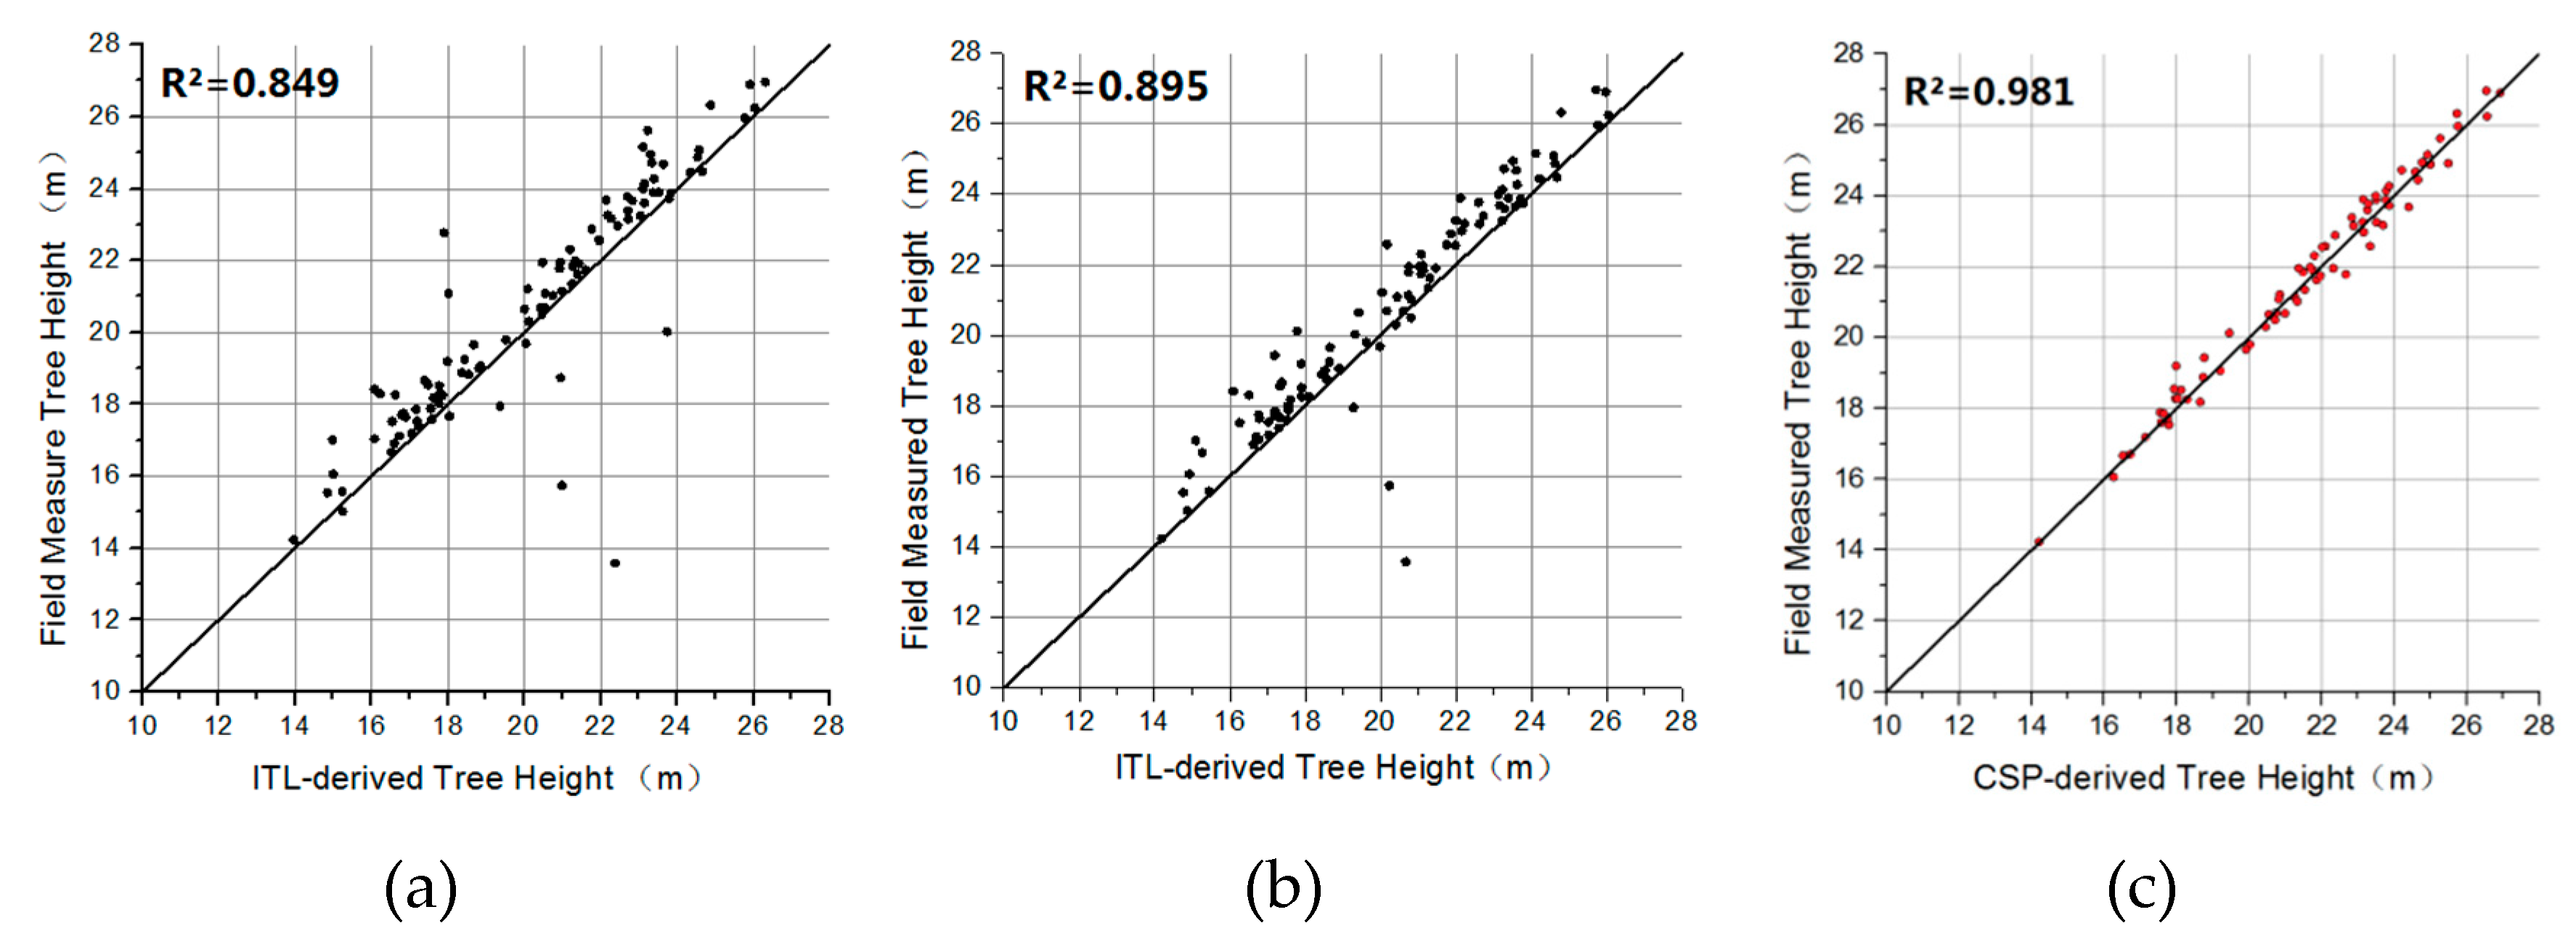
4.2.3. Tree Height Extraction Results and Precision Evaluation
5. Discussion
5.1. Data Registration Accuracy
5.2. Parameters Extraction
5.3. Suggestions for Tree Farm Resource Surveys
6. Conclusions
Author Contributions
Funding
Acknowledgments
Conflicts of Interest
References
- Miłosz, M.; Krzysztof, S.; Anahita, K. Testing and evaluating different LiDAR-derived canopy height model generation methods for tree height estimation. Int. J. Appl. Earth Obs. 2018, 71, 132–143. [Google Scholar]
- Mass, H.G.; Bienert, A.; Scheller, S.; Keane, E. Automatic forest inventory parameter determination from terrestrial laser scanner data. Int. J. Remote Sens. 2008, 29, 1579–1593. [Google Scholar] [CrossRef]
- Li, H.D.; Gao, J.X.; Hu, Q.W.; Li, Y.K.; Tian, J.R.; Liao, C.R.; Ma, W.B.; Xu, Y.N. Assessing revegetation effectiveness on an extremely degraded grassland with terrestrial LiDAR, southern Qinghai-Tibetan Plateau. Agr. Ecosyst. Environ. 2019, 282, 13–22. [Google Scholar] [CrossRef]
- Liang, X.L.; Kankare, V.; Hyyppä, J.; Wang, Y.; Kukko, A.; Haggrén, H.; Yu, X.; Kaartinen, H.; Jaakkola, A.; Guan, F.; et al. Terrestrial laser scanning in forest inventories. ISPRS J. Photogram. Remote Sens. 2016, 115, 63–77. [Google Scholar] [CrossRef]
- Liang, X.L.; Hyyppä, J.; Kaartinen, H.; Lehtomaki, M.; Pyorala, J.; Pfeifer, N.; Holopainen, M.; Brolly, G.; Francesco, P.; Hackenberg, J. International benchmarking of terrestrial laser scanning approaches for forest inventories. ISPRS J. Photogram. Remote Sens. 2018, 144, 137–179. [Google Scholar] [CrossRef]
- Bauwens, S.; Bartholomeus, H.; Calders, K.; Lejeune, P. Forest inventory with terrestrial LiDAR: A comparison of static and hand-held mobile laser scanning. Forests 2016, 7, 127. [Google Scholar] [CrossRef]
- Cabo, C.; Del Pozo, S.; Rodríguez-Gonzálvez, P.; Ordóñez, C.; González-Aguilera, D. Comparing terrestrial laser scanning (TLS) and wearable laser scanning (WLS) for individual tree modeling at plot level. Remote Sens. 2018, 10, 540. [Google Scholar] [CrossRef]
- Liang, X.; Kukko, A.; Kaartinen, H.; Hyyppä, J.; Yu, X.; Jaakkola, A.; Wang, Y. Possibilities of a personal laser scanning system for forest mapping and ecosystem services. Sensors 2013, 14, 1228–1248. [Google Scholar] [CrossRef]
- Oveland, I.; Hauglin, M.; Giannetti, F.; Schipper Kjørsvik, N.; Gobakken, T. Comparing three different ground based laser scanning methods for tree stem detection. Remote Sens. 2018, 10, 538. [Google Scholar] [CrossRef]
- Pang, Y.; Li, Z.Y.; Chen, E.X.; Sun, G.Q. Lidar Remote Sensing Technology and Its Application in Forestry. Sci. Silvae Sin. 2005, 41, 129–136. [Google Scholar]
- Zhao, Y.Y.; Hu, Q.W.; Li, H.D.; Wang, S.H.; Ai, M.Y. Evaluating Carbon Sequestration and PM2.5 Removal of Urban Street Trees Using Mobile Laser Scanning Data. Remote Sens. 2018, 10, 1759. [Google Scholar] [CrossRef]
- Van, L.M.; Nieuwenhuis, M. Retrieval of forest structural parameters using LiDAR remote sensing. Eur. J. For. Res. 2010, 129, 749–770. [Google Scholar]
- Moskal, L.M.; Zheng, G. Retrieving forest inventory variables with terrestrial laser scanning (TLS) in urban heterogeneous forest. Remote Sens. 2011, 4, 1–20. [Google Scholar] [CrossRef]
- Seidel, D.; Fleck, S.; Leuschne, C. Analyzing forest canopies with ground-based laser scanning: A comparison with hemispherical photography. Agr. For. Meteorol. 2012, 154-155, 1–8. [Google Scholar] [CrossRef]
- Cao, L.; Coops, N.C.; Innes, J.L.; Sheppard, S.R.J.; Fu, L.Y.; Ruan, H.H.; She, G.H. Estimation of forest biomass dynamics in subtropical forests using multi-temporal airborne LiDAR data. Remote Sens. Environ. 2016, 178, 158–171. [Google Scholar] [CrossRef]
- Zhang, Z.N.; Cao, L.; She, G.H. Estimating Forest Structural Parameters Using Canopy Metrics Derived from Airborne LiDAR Data in Subtropical Forests. Remote Sens. 2017, 9, 940. [Google Scholar] [CrossRef]
- Shen, X.; Cao, L.; Chen, D.; Sun, Y.; Wang, G.; Ruan, H. Prediction of forest structural parameters using airborne full-waveform LiDAR and hyperspectral data in subtropical forests. Remote Sens. 2018, 10, 1729. [Google Scholar] [CrossRef]
- Weiskittel, A.R.; Hann, D.W.; Kershaw, J.A.; Vanclay, J.K. Forest Growth and Yield Modeling. In Bibliography; John Wiley & Sons: Hoboken, NJ, USA, 2011; pp. 327–395. [Google Scholar]
- Bettinger, P.; Lennette, M.; Johnson, K.N.; Spies, T.A. A hierarchical spatial framework for forest landscape planning. Ecol. Model. 2005, 182, 25–48. [Google Scholar] [CrossRef]
- Kane, V.R.; North, M.P.; Lutz, J.A.; Churchill, D.J.; Roberts, S.L.; Smith, D.F.; McGaughey, R.J.; Kane, J.T.; Brooks, M.L. Assessing fire effects on forest spatial structure using a fusion of Landsat and airborne LiDAR data in yosemite national park. Remote Sens. Environ. 2014, 151, 89–101. [Google Scholar] [CrossRef]
- Naesset, E. Determination of mean tree height of forest stands using airborne laser scanner data. ISPRS J. Photogram. Remote Sens. 1997, 52, 49–56. [Google Scholar] [CrossRef]
- Pang, Y.; Zhao, F.; Li, Z.Y.; Zhou, S.F.; Deng, G. Forest Height Inversion using Airborne Lidar Technology. J. Remote Sens. 2008, 12, 152–158. [Google Scholar]
- Gomez, C.; Purdie, H. UAV- based photogrammetry and geocomputing for Hazards and Disaster Risk Monitoring—A Review. Geoenviron. Disasters 2016, 3, 23. [Google Scholar] [CrossRef]
- Ai, M.Y.; Hu, Q.W.; Li, J.Y.; Wang, M.; Yuan, H.; Wang, S.H. A robust photogrammetric processing method of low-altitude UAV images. Remote Sens. 2015, 7, 2302–2333. [Google Scholar] [CrossRef]
- Liu, Q.W.; Li, S.M.; Li, Z.Y.; Fu, L.Y.; Hu, K.L. Review on the applications of UAV-based LiDAR and photogrammetry in forestry. Sci. Silvae Sin. 2017, 7, 134–148. [Google Scholar]
- Patricio, M.C.; Francisco, A.V.; Fernando, C.R.; Francisco-Javier, M.C.; Alfonso, G.F.; Fernando-Juan, P.P. Assessment of UAV-photogrammetric mapping accuracy based on variation of ground control points. Int. J. Appl. Earth Obs. 2018, 72, 1–10. [Google Scholar]
- Francisco, A.V.; Fernando, C.R.; Patricio, M.C. Assessment of photogrammetric mapping accuracy based on variation ground control points number using unmanned aerial vehicle. Measurement 2017, 98, 221–227. [Google Scholar]
- Dandois, J.P.; Ellis, E.C. Remote sensing of vegetation structure using computer vision. Remote Sens. 2010, 2, 1157–1176. [Google Scholar] [CrossRef]
- Jonathan, L.; Marc, P.D.; Stephanie, B. A photogrammetric workflow for the creation of a forest canopy height model from small unmanned aerial system imagery. Forests 2013, 4, 922–944. [Google Scholar]
- Zhang, J.; Hu, J.; Lian, J.; Fan, Z.; Ouyang, X.; Ye, W. Seeing the forest from drones: Testing the potential of lightweight drones as a tool for long-term forest monitoring. Biol. Conserv. 2016, 198, 60–69. [Google Scholar] [CrossRef]
- Dandois, J.P.; Ellis, E.C. High spatial resolution three-dimensional mapping of vegetation spectral dynamics using computer vision. Remote Sens. Environ. 2013, 136, 259–276. [Google Scholar] [CrossRef] [Green Version]
- Ahmadabadian, A.H.; Robson, S.; Boehm, J.; Shortis, M.; Wenzel, K.; Fritsch, D. A comparison of dense matching algorithms for scaled surface reconstruction using stereo camera rigs. ISPRS J. Photogramm. 2013, 78, 157–167. [Google Scholar] [CrossRef]
- Frirsch, D.; Khosravani, A.M.; Cefalu, A.; Wenzel, K. Multi-Sensors and Multiray Reconstruction for Digital Preservation. In Photogrammetric Week 2011; Wichmann: Berlin, Germany, 2011; pp. 305–323. [Google Scholar]
- Jun, M. Application of UAV Remote Sensing in Tree Parameters Extraction in Plantation Forest. Master’s Thesis, Nanjing Forestry University, Nanjing, China, June 2018. [Google Scholar]
- Zaragoza, L.M.E.; Caroti, G.; Piemonte, A.; Riedel, B.; Tengen, D.; Niemeier, W. Structure from motion (SfM) processing of UAV images and combination with terrestrial laser scanning, applied for a 3D-documentation in a hazardous situation. J. Assoc. Inf. Syst. 2017, 18, 1492–1505. [Google Scholar]
- Cao, M.W.; Li, S.J.; Jia, W.; Li, S.L.; Liu, X.P. Robust bundle adjustment for large-scale structure from motion. Multimed Tools Appl. 2017, 76, 21843–21867. [Google Scholar] [CrossRef]
- Robleda, P.G.; Caroti, G.; Zaragoza, I.M.; Piemonte, A. Computational vision in UV-mapping of textured meshes coming from photogrammetric recovery: unwrapping frescoed vault. ISPRS Int. Arch. Photogramm. Remote Sens. 2016, XLI–B5, 391–398. [Google Scholar] [CrossRef]
- Besel, P.J.; McKay, N.D. A method for registration of 3–D shapes. IEEE Trans. Pattern Anal. Mach. Intell. 1992, 14, 239–256. [Google Scholar] [CrossRef]
- Axelsson, P. DEM generation from laser scanner data using adaptive TIN models. Int. Arch. Photogramm. Remote Sens. 2000, 33, 111–118. [Google Scholar]
- Zhao, X.Q.; Guo, Q.H.; Su, Y.J.; Xue, B.L. Improved progressive TIN densification filtering algorithm for airborne LiDAR data in forested areas. ISPRS J. Photogramm. Remote Sens. 2016, 117, 79–91. [Google Scholar] [CrossRef] [Green Version]
- Chen, Q.; Baldocchi, D.; Goog, P.; Kelly, M. Isolating individual trees in a savanna woodland using small footprint lidar data. Photogramm. Eng. Remote Sens. 2006, 72, 923–932. [Google Scholar] [CrossRef]
- Li, W.K.; Guo, Q.H.; Jakubowski, M.K.; Kelly, M. A new method for segmenting individual trees from the lidar point cloud. Photogramm. Eng. Remote Sens. 2012, 78, 75–84. [Google Scholar] [CrossRef]
- Aicardi, I.; Dabove, P.; Lingua, A.M.; Piras, M. Integration between TLS and UAV photogrammetry techniques for forestry applications. iForest 2016, 10, 41–47. [Google Scholar] [CrossRef]
- Zhang, W.M.; Zhao, J.; Chen, M.; Chen, Y.M.; Yan, K.; Li, L.Y.; Qi, J.B.; Wang, X.Y.; Luo, J.H.; Chu, Q. Registration of optical imagery and LiDAR data using an inherent geometrical constraint. Opt Express 2015, 23, 7694–7702. [Google Scholar] [CrossRef] [PubMed]
- Tao, S.L.; Wu, F.F.; Guo, Q.H.; Wang, Y.C.; Li, W.K.; Xue, B.L.; Hu, X.Y.; Li, P.; Tian, D.; Li, C.; et al. Segmenting tree crowns from terrestrial and mobile lidar data by exploring ecological theories. ISPRS J. Photogramm. Remote Sens. 2015, 110, 67–76. [Google Scholar] [CrossRef]


| Measurement Distance Range | 1.5 m (min a) to 800 m (max) |
|---|---|
| Laser transmitting frequency | 500,000 points per second |
| Ranging precision | 5 mm @ 100 m |
| Field of view | 360° (horizontal) |
| Total 100° (+60°/−40°) (vertical) |
| ID | U-X | U-Y | U-Z | M-X | M-Y | M-Z | Error |
|---|---|---|---|---|---|---|---|
| P01 | 54.927 | −62.316 | 198.687 | 9.745 | −51.615 | 0.801 | 0.083 |
| P02 | 65.978 | −50.230 | 197.551 | 20.742 | −38.953 | −0.182 | 0.048 |
| P03 | 68.679 | −36.707 | 196.332 | 23.060 | −25.588 | −1.303 | 0.068 |
| P04 | 58.841 | −25.852 | 195.569 | 12.922 | −14.875 | −2.002 | 0.054 |
| P05 | 27.621 | −28.334 | 196.313 | −18.200 | −18.058 | −1.534 | 0.049 |
| Window Size | Identified Seed Points | Matched Seed Points | Correctness Rate | Matching Rate |
|---|---|---|---|---|
| 1 m × 1 m | 118 | 79 | 66.94% | 75.24% |
| 1.5 m × 1.5 m | 93 | 75 | 80.65% | 71.43% |
| 2 m × 2 m | 84 | 72 | 85.71% | 68.57% |
| 3 m × 3 m | 62 | 54 | 87.10% | 51.43% |
© 2019 by the authors. Licensee MDPI, Basel, Switzerland. This article is an open access article distributed under the terms and conditions of the Creative Commons Attribution (CC BY) license (http://creativecommons.org/licenses/by/4.0/).
Share and Cite
Tian, J.; Dai, T.; Li, H.; Liao, C.; Teng, W.; Hu, Q.; Ma, W.; Xu, Y. A Novel Tree Height Extraction Approach for Individual Trees by Combining TLS and UAV Image-Based Point Cloud Integration. Forests 2019, 10, 537. https://doi.org/10.3390/f10070537
Tian J, Dai T, Li H, Liao C, Teng W, Hu Q, Ma W, Xu Y. A Novel Tree Height Extraction Approach for Individual Trees by Combining TLS and UAV Image-Based Point Cloud Integration. Forests. 2019; 10(7):537. https://doi.org/10.3390/f10070537
Chicago/Turabian StyleTian, Jiarong, Tingting Dai, Haidong Li, Chengrui Liao, Wenxiu Teng, Qingwu Hu, Weibo Ma, and Yannan Xu. 2019. "A Novel Tree Height Extraction Approach for Individual Trees by Combining TLS and UAV Image-Based Point Cloud Integration" Forests 10, no. 7: 537. https://doi.org/10.3390/f10070537