The Effect of Non-Native Black Pine (Pinus nigra J. F. Arnold) Plantations on Environmental Conditions and Undergrowth Diversity

 , , ,
, , , 
Abstract
:1. Introduction
2. Materials and Methods
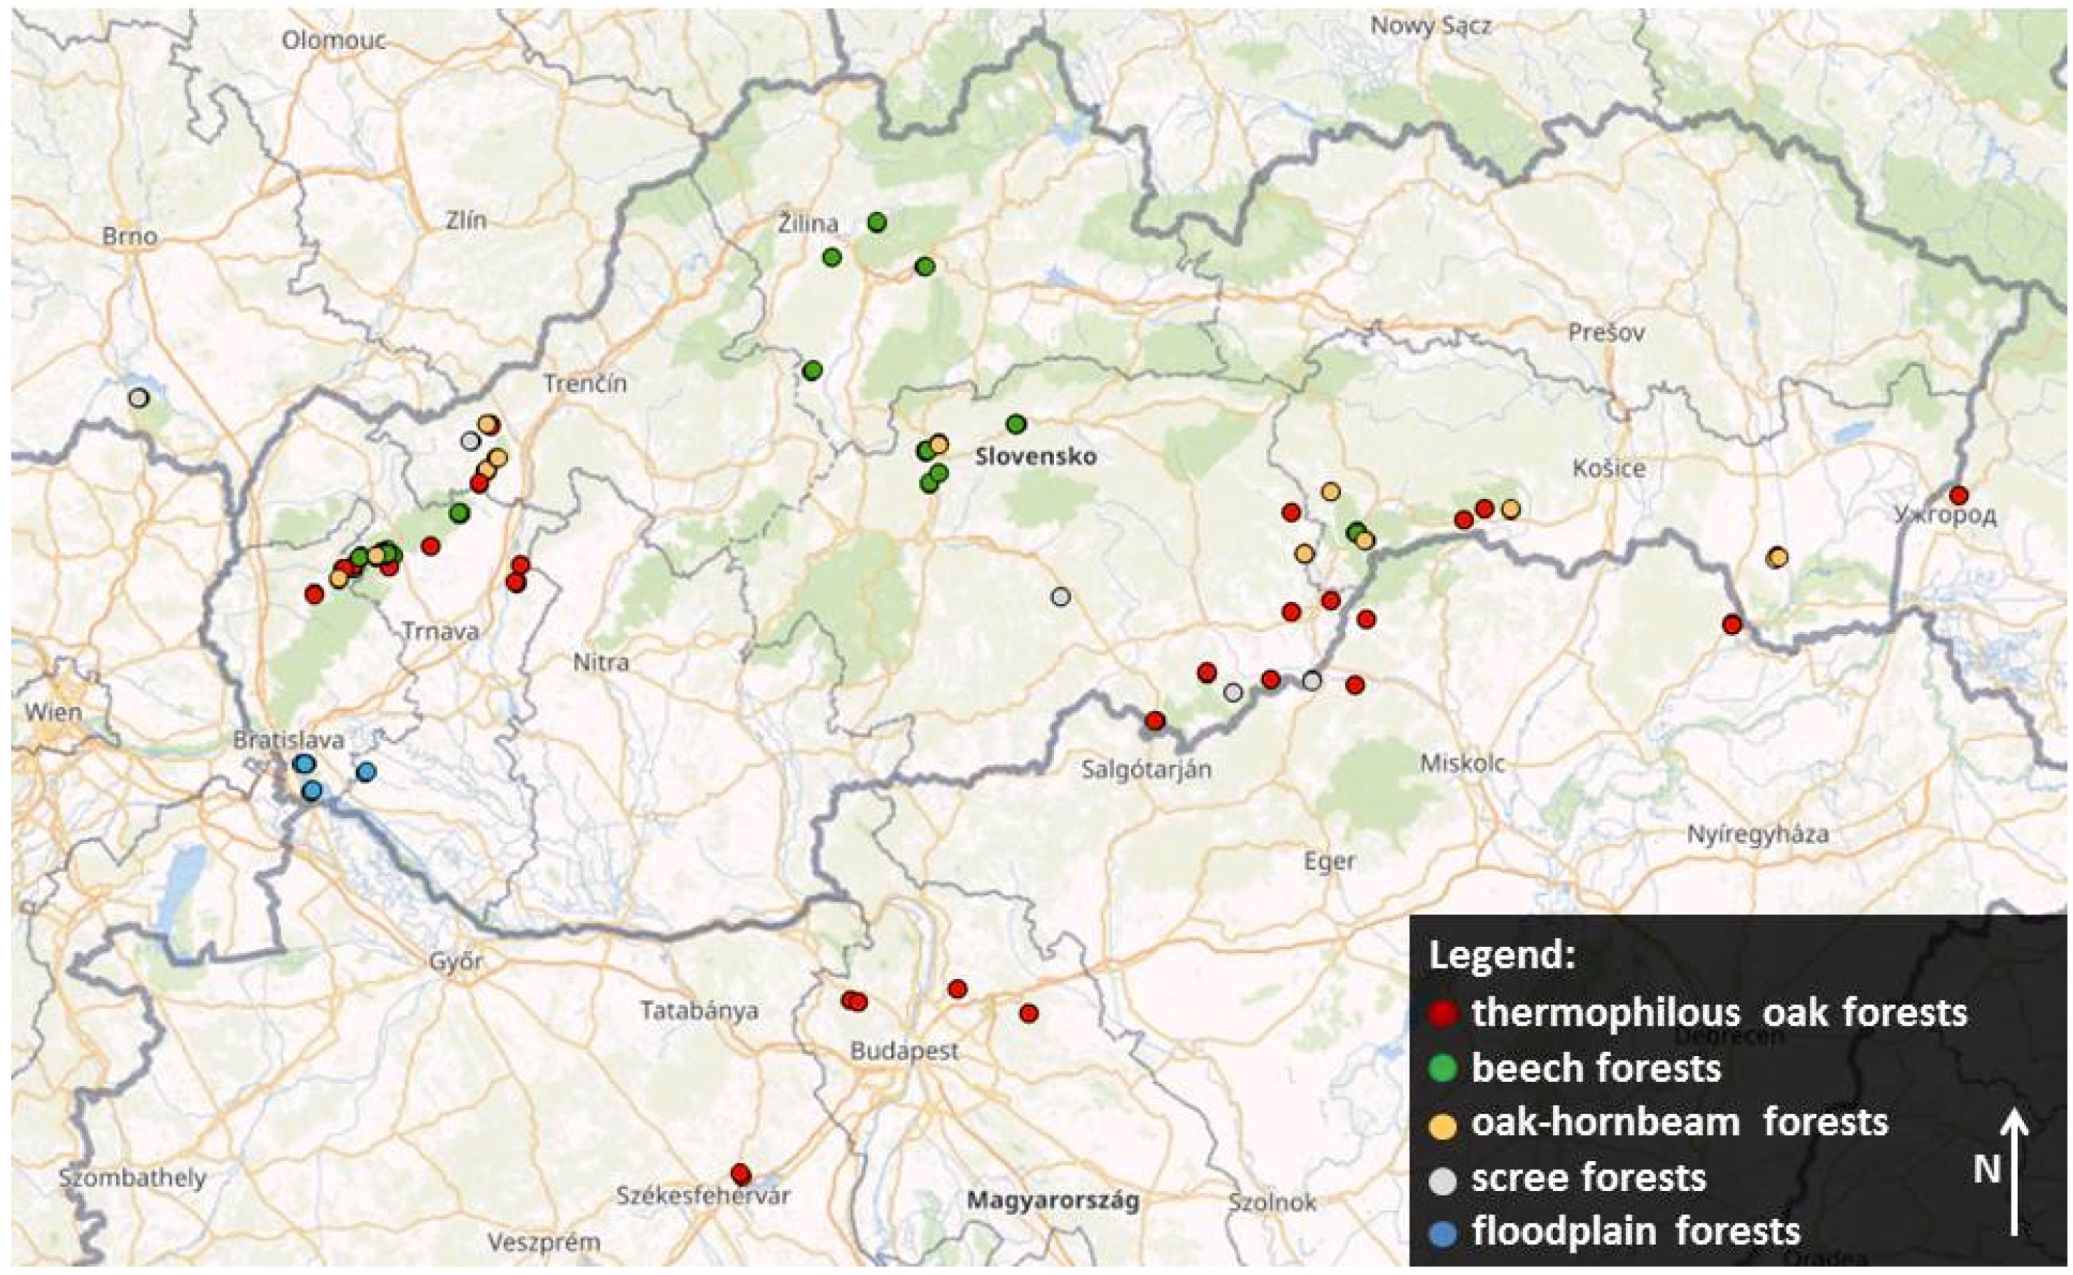
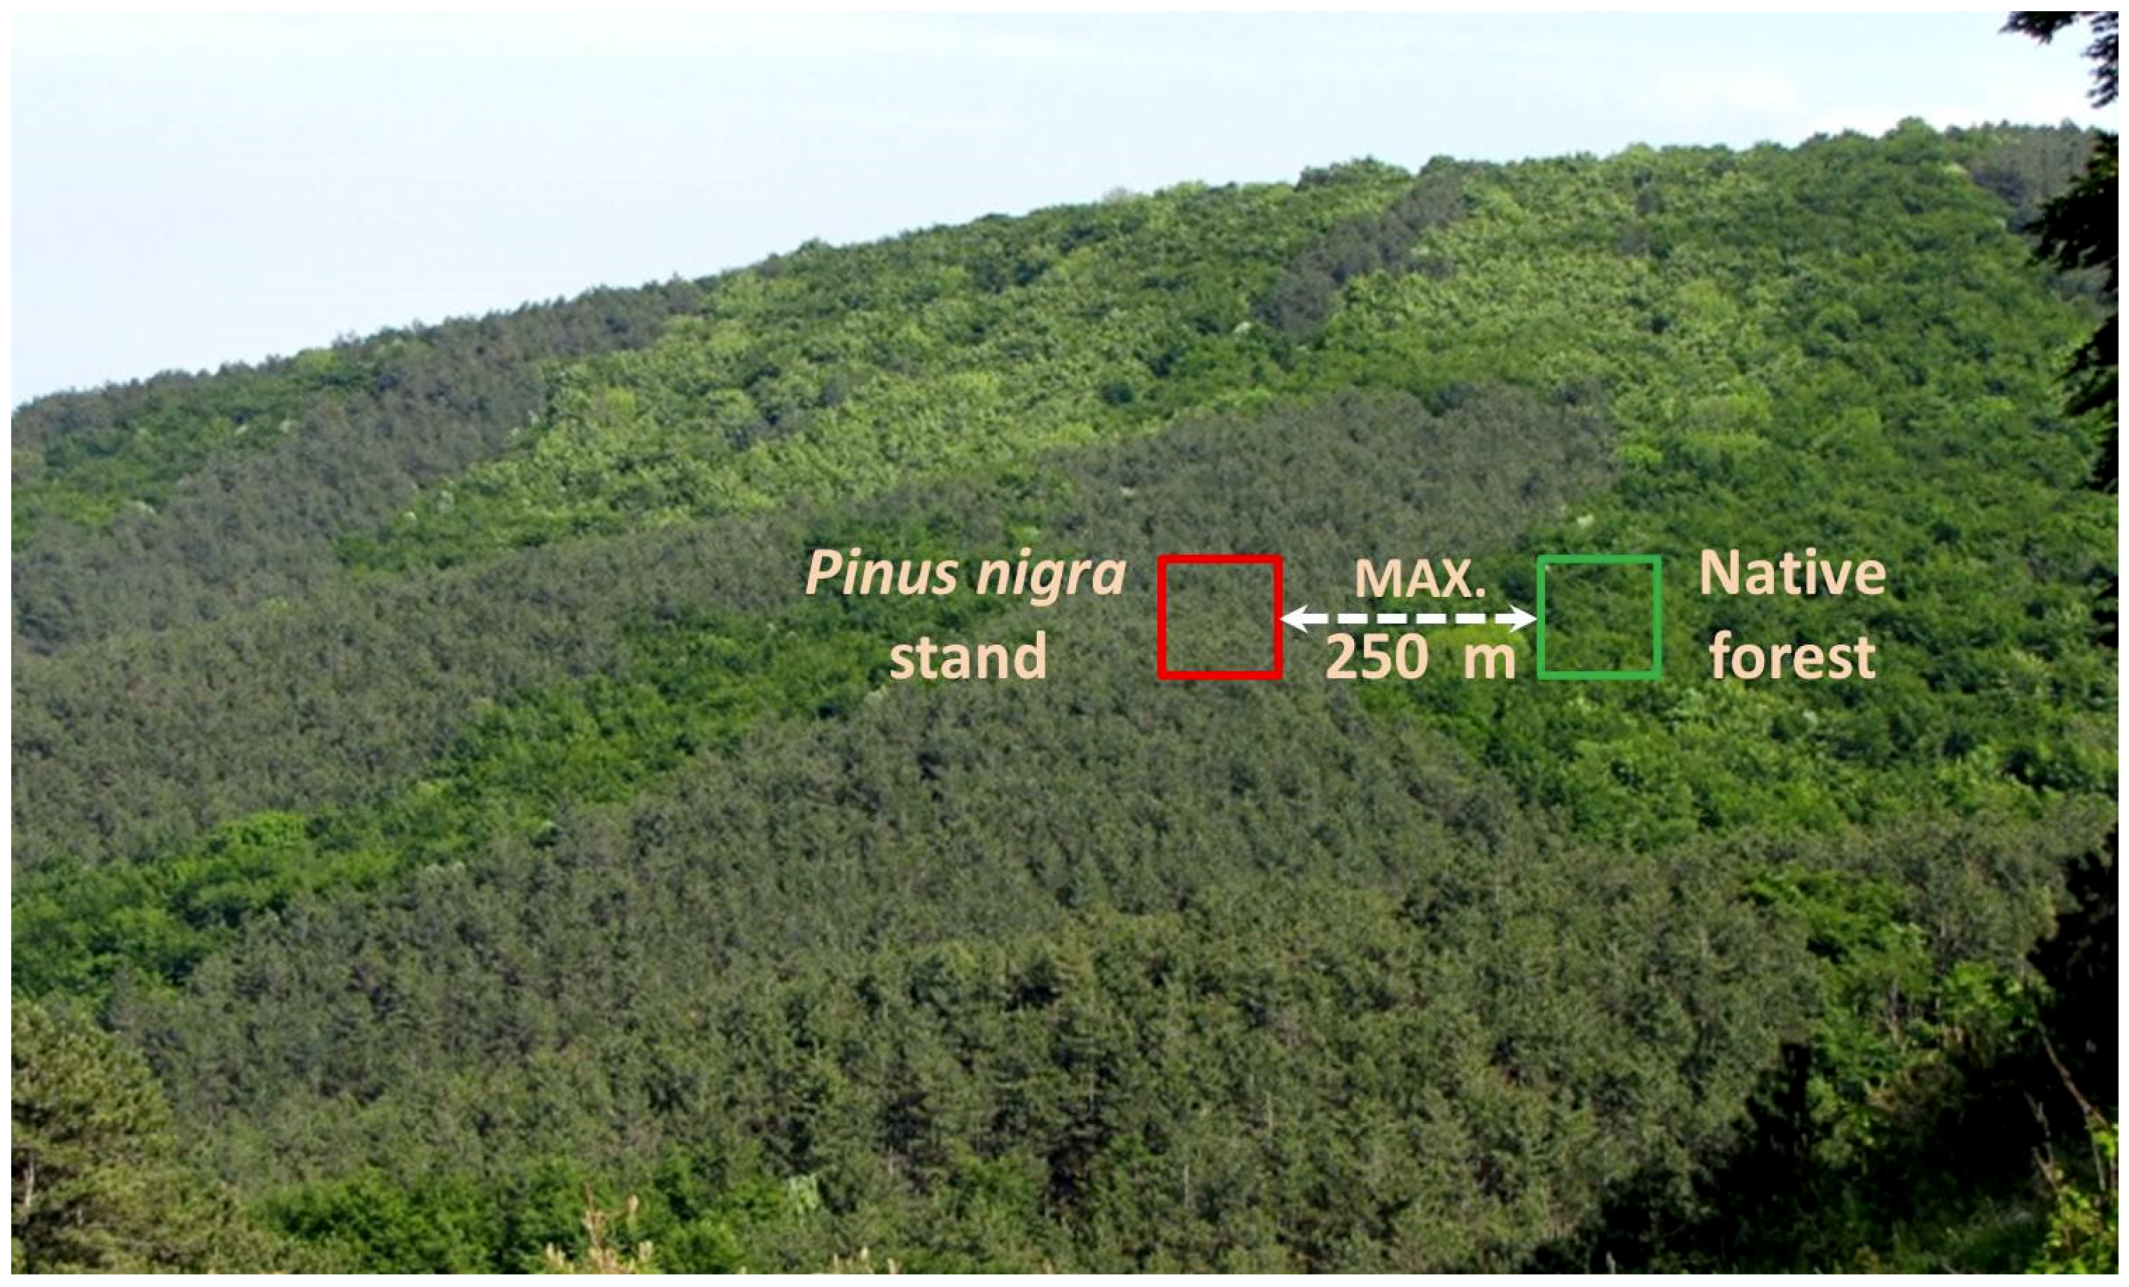
2.1. Data Collection
2.2. Data Analyses
3. Results
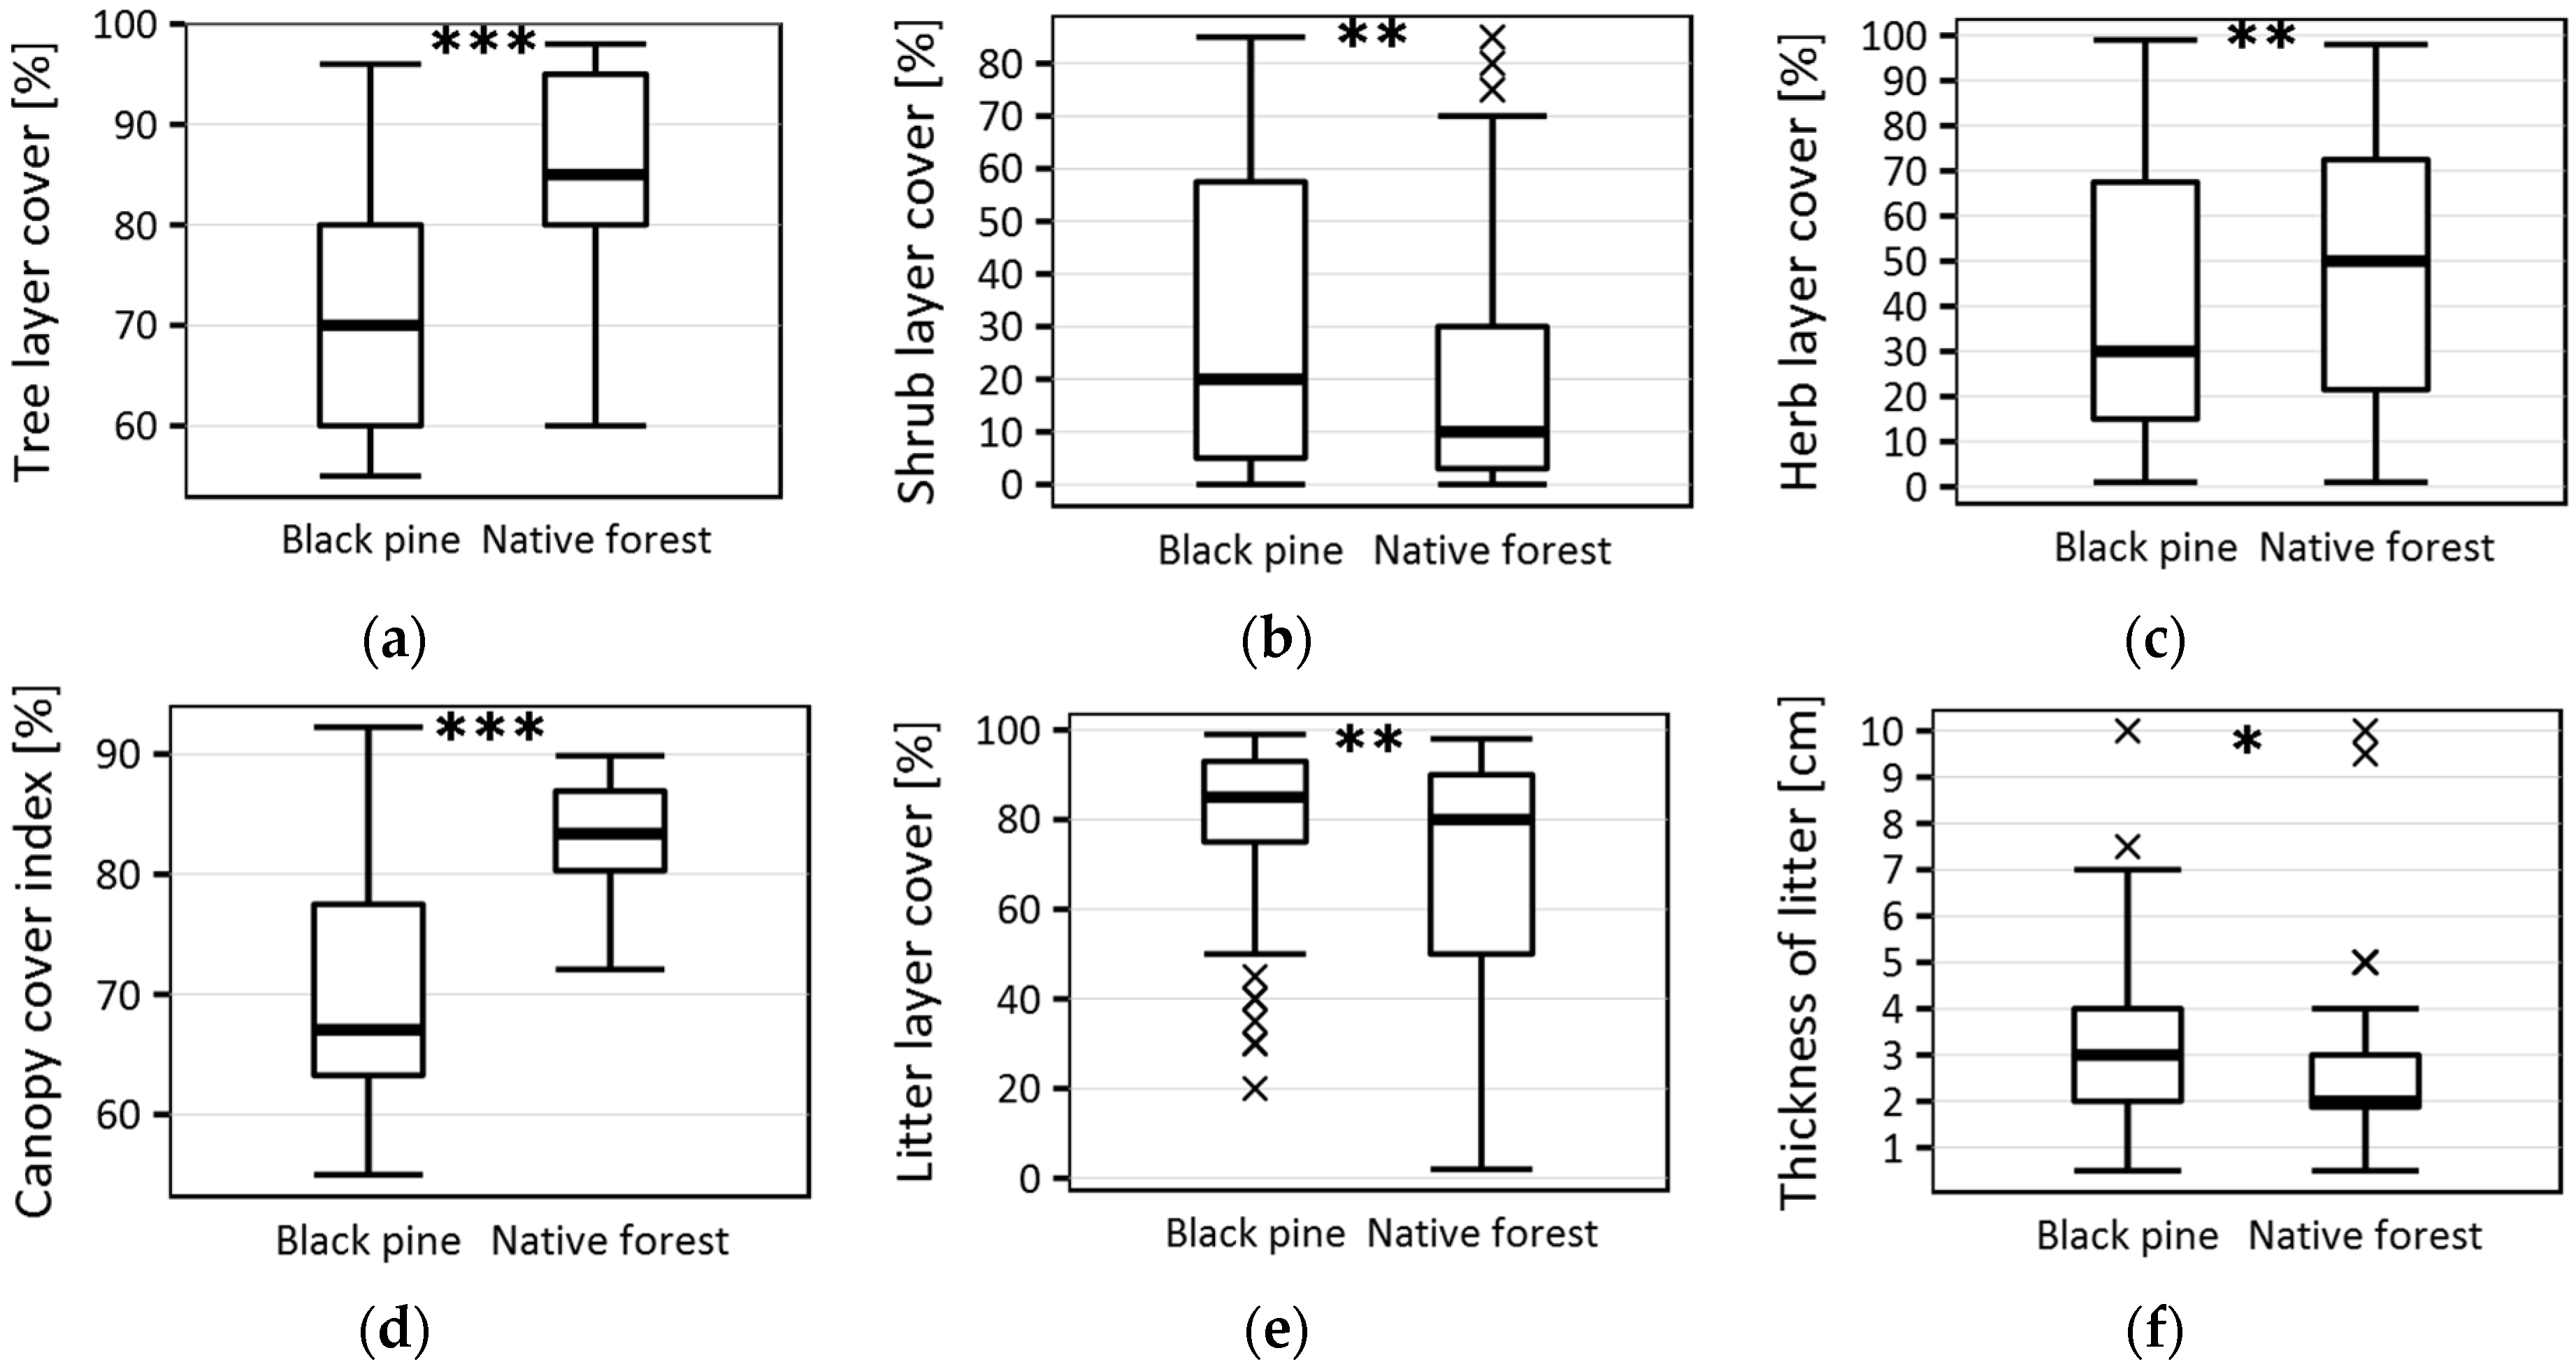
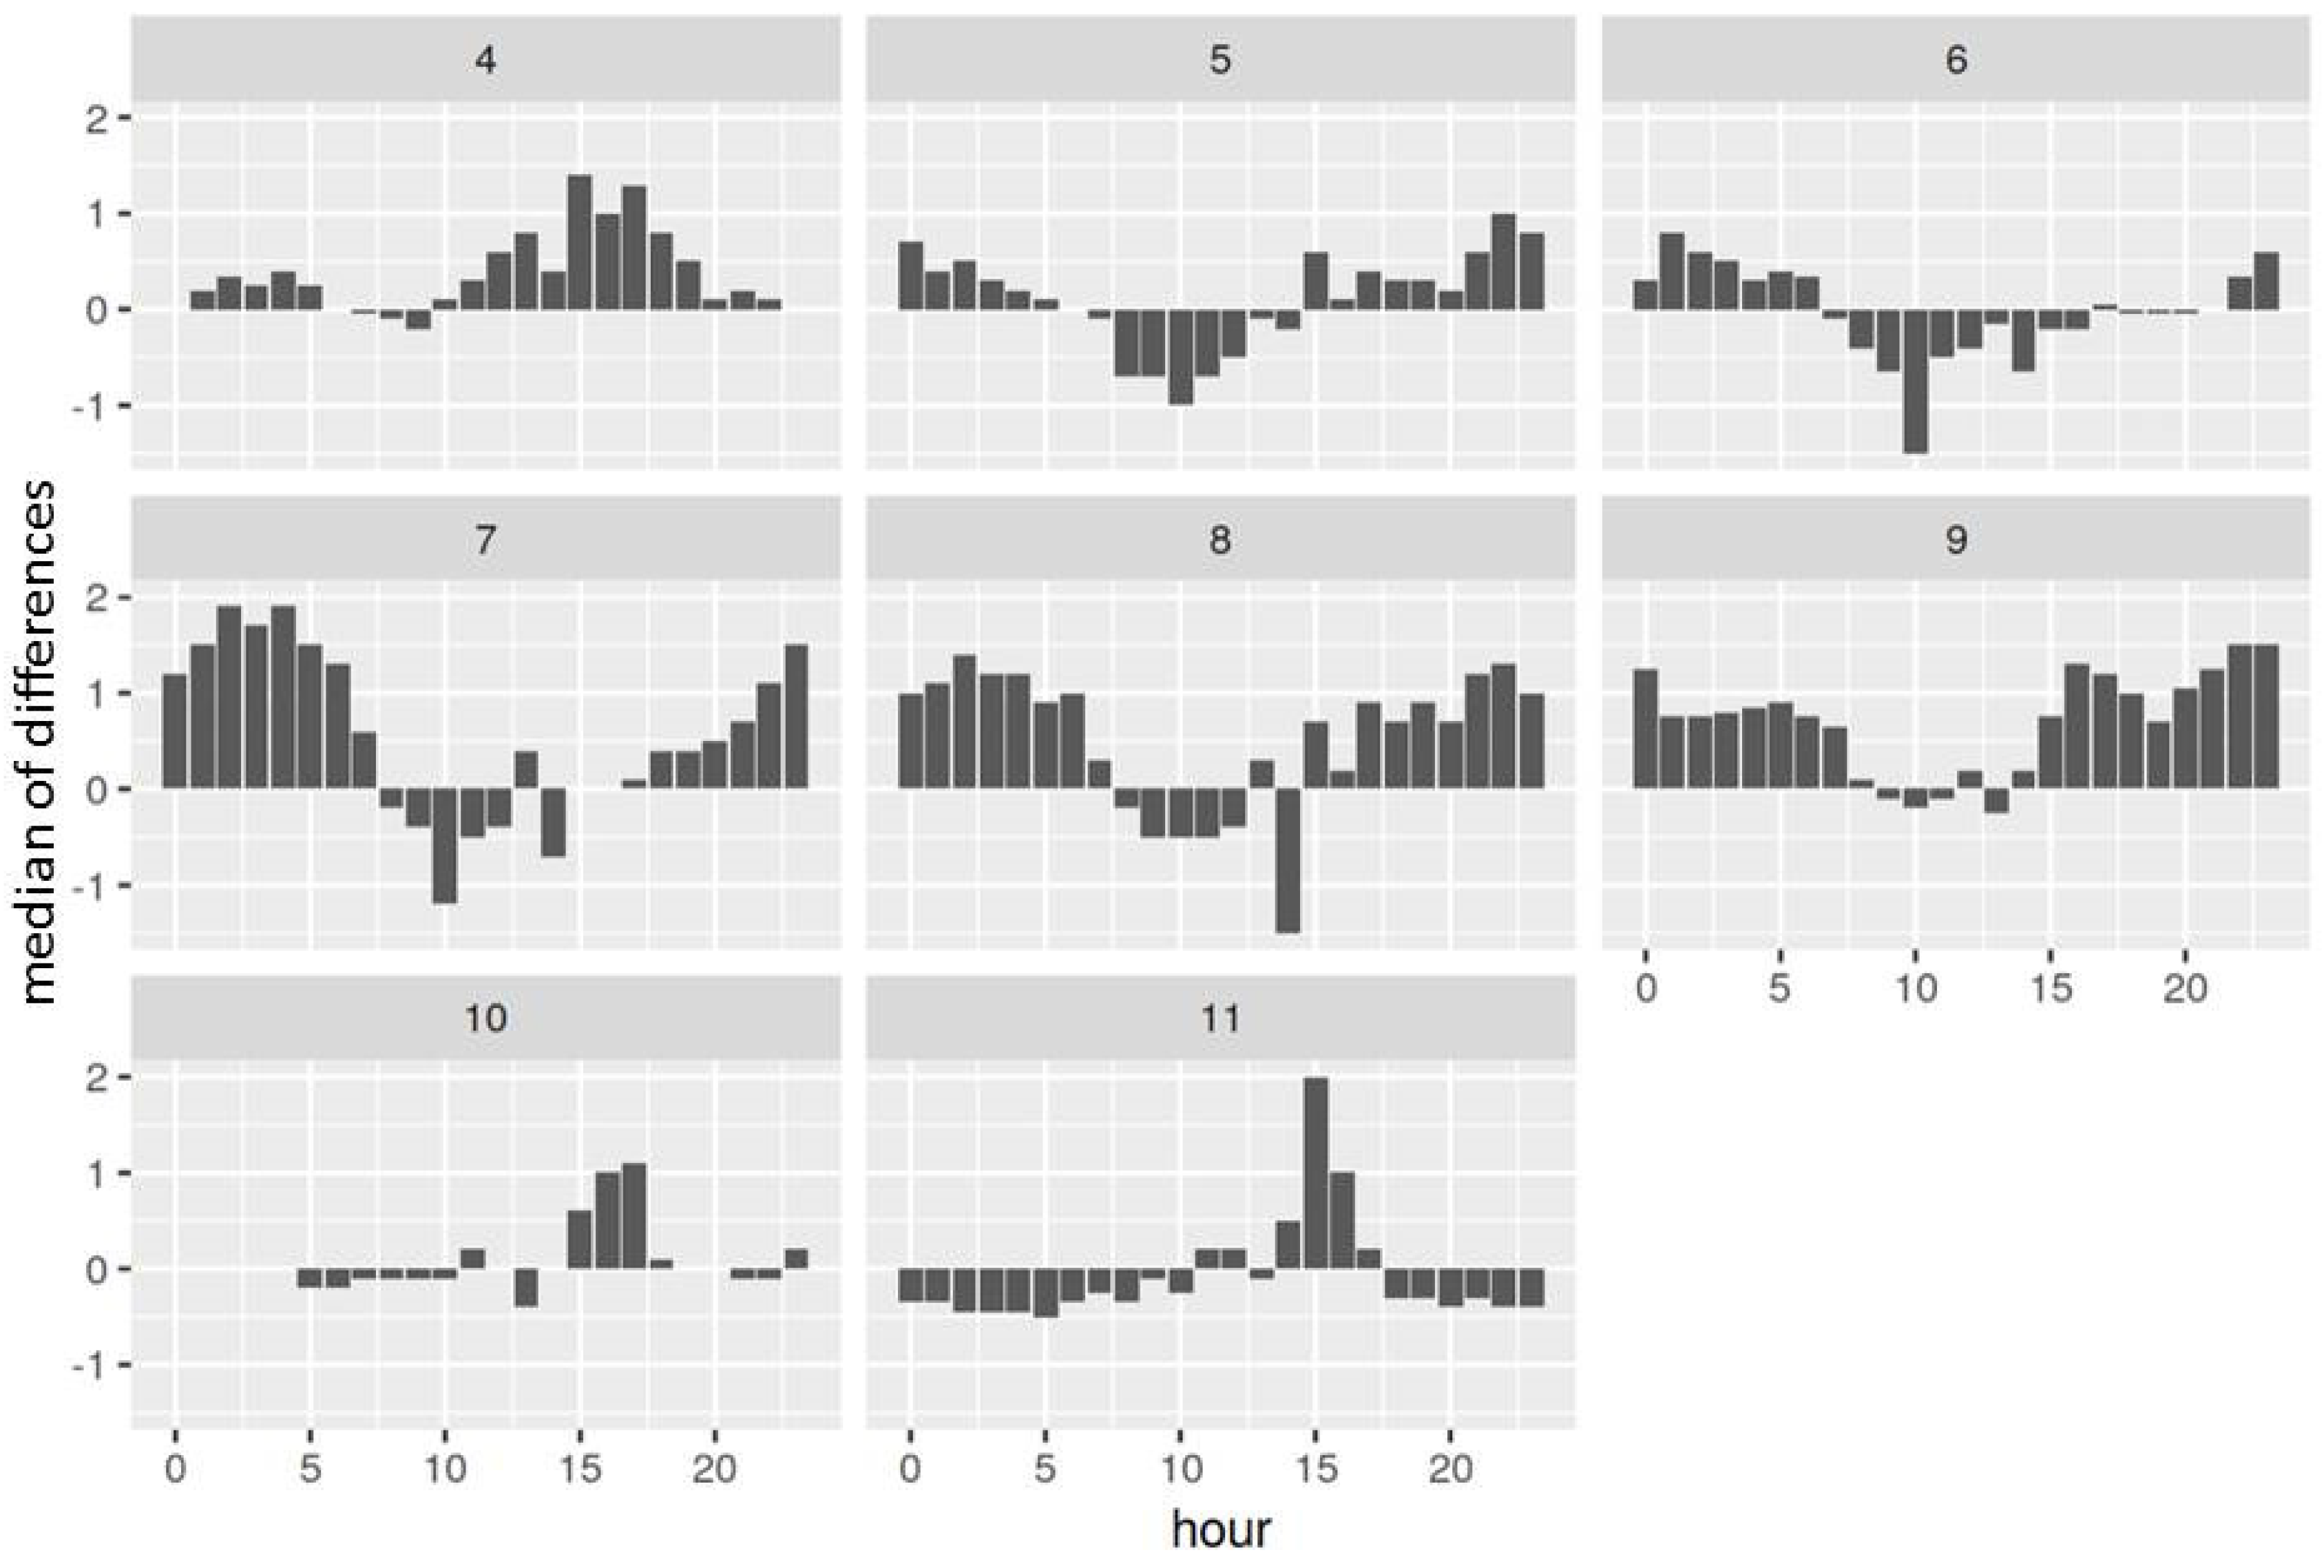
3.1. Changes in Structural and Environmental Characteristics
3.2. The Differences in Undergrowth Species Composition
3.3. The Effect of Selected Factors on Diversity Change
4. Discussion
4.1. Changes in Structural and Environmental Characteristics
4.2. The Differences in Species Composition of the Undergrowth
4.3. The Effect of Various Factors on Diversity Change
5. Conclusions
Supplementary Materials
Author Contributions
Funding
Acknowledgments
Conflicts of Interest
References
- Forest Europe. State of Europe’s Forests 2015; FOREST EUROPE Liaison Unit: Madrid, Spain, 2015; p. 314. [Google Scholar]
- Palik, B.; Engstrom, R.T. Species Composition; Cambridge University Press: Cambridge, UK, 1999; pp. 65–94. [Google Scholar]
- Ujházy, K.; Ujházyová, M.; Hederová, L.; Máliš, F.; Martinák, M. Dominant tree species and stand density are the main drivers of plant diversity in managed fir-beech forests. In Book of Abstracts, Posters, 25th Meeting of the European Vegetation Survey; Agrillo, E., Attorre, F., Spada, F., Casella, L., Eds.; European Vegetation Survey: Rome, Italy, 2016; p. 107. [Google Scholar]
- Medvecká, J.; Jarolímek, I.; Hegedüšová, K.; Škodová, I.; Bazalová, D.; Botková, K.; Šibíková, M. Forest habitat invasions–Who with whom, where and why. For. Ecol. Manage. 2018, 409, 468–478. [Google Scholar] [CrossRef]
- Benesperi, R.; Giuliani, C.; Zanetti, S.; Gennai, M.; Lippi, M.M.; Guidi, T.; Nascimbene, J.; Foggi, B. Forest plant diversity is threatened by Robinia pseudoacacia (black-locust) invasion. Biodivers. Conserv. 2012, 21, 3555–3568. [Google Scholar] [CrossRef]
- Marozas, V.; Cekstere, G.; Laivins, M.; Straigyte, L. Comparison of neophyte communities of Robinia pseudoacacia L. and Acer negundo L. in the eastern Baltic Sea region cities of Riga and Kaunas. Urban For. Urban Green. 2015, 14, 826–834. [Google Scholar] [CrossRef]
- Woziwoda, B.; Kopeć, D.; Witkowski, J. The negative impact of intentionally introduced Quercus rubra L. on a forest community. Acta. Soc. Bot. Pol. 2014, 83, 39–49. [Google Scholar] [CrossRef]
- Slabejová, D.; Bacigál, T.; Hegedüšová, K.; Májeková, J.; Medvecká, J.; Mikulová, K.; Šibíková, M.; Škodová, I.; Zaliberová, M.; Jarolímek, I. Comparison of the understory vegetation of native forests and adjacent Robinia pseudoacacia plantations in the Carpathian-Pannonian region. For. Ecol. Manag. 2019, 439, 28–40. [Google Scholar] [CrossRef]
- Isajev, V.; Fady, B.; Semerci, H.; Andonovski, V. EUFORGEN Technical Guidelines for Genetic Conservation and Use for European Black Pine (Pinus nigra); International Plant Genetic Resources Institute: Rome, Italy, 2004; p. 6. [Google Scholar]
- Dixon, C.; Fyson, G.F.; Pasiecznik, N.; Praciak, A.; Rushforth, K.; Sassen, M.; Sheil, D.; Correia, C.S.; Teeling, C.; van Heist, M. The CABI Encyclopedia of Forest Trees; CABI, Ed.; CABI Publishing: Oxfordshire, UK, 2013. [Google Scholar] [CrossRef]
- Turis, P.; Valachovič, M. Sekundárne lesné spoločenstvá s Pinus nigra na Slovensku. Acta Carpath. Occident. 2014, 5, 33–45. [Google Scholar]
- Osono, T.; Azuma, J.-I.; Hirose, D. Plant species effect on the decomposition and chemical changes of leaf litter in grassland and pine and oak forest soils. Plant Soil 2014, 376, 411–421. [Google Scholar] [CrossRef]
- Bazalová, D.; Botková, K.; Hegedüšová, K.; Májeková, J.; Medvecká, J.; Šibíková, M.; Škodová, I.; Zaliberová, M.; Jarolímek, I. Twin plots—Appropriate method to assess the impact of alien tree on understory? Hacquetia 2018, 17, 163–169. [Google Scholar] [CrossRef]
- Forestry Geographic Information System. Available online: http://gis.nlcsk.org/lgis/ (accessed on 5 March 2019).
- Braun-Blanquet, J. Pflanzensoziologie. Grundzüge der Vegetationskunde; Springer: Wien, Austria, 1964; Volume 3, p. 865. [Google Scholar]
- Westhoff, V.; van der Maarel, E. The Braun-Blanquet approach. In Ordination and Classification of Communities; Whittaker, R.H., Ed.; W. Junk Publishers: Hague, The Netherlands, 1973; pp. 617–727. [Google Scholar]
- Tichý, L. GLAMA-Gap Light Analysis Mobile Application. 2014. Available online: https://www.sci.muni.cz/botany/glama/ (accessed on 2 February 2018).
- Hennekens, S.M.; Schaminée, J.H. TURBOVEG, a comprehensive data base management system for vegetation data. J. Veg. Sci. 2001, 12, 589–591. [Google Scholar] [CrossRef]
- Tichý, L. JUICE, software for vegetation classification. J. Veg. Sci. 2002, 13, 451–453. [Google Scholar] [CrossRef]
- R Core Team. R: A Language and Environment for Statistical Computing; R Foundation for Statistical Computing: Vienna, Austria, 2016. [Google Scholar]
- Euro+Med. Euro+Med PlantBase—The Information Resource for Euro-Mediterranean Plant Diversity. Available online: http://ww2.bgbm.org/EuroPlusMed/ (accessed on 1 March 2019).
- Mucina, L.; Bültmann, H.; Dierßen, K.; Theurillat, J.-P.; Raus, T.; Čarni, A.; Šumberová, K.; Willner, W.; Dengler, J.; García, R.G.; et al. Vegetation of Europe: Hierarchical floristic classification system of vascular plant, bryophyte, lichen, and algal communities. Appl. Veg. Sci. 2016, 19, 3–264. [Google Scholar] [CrossRef]
- Ellenberg, H.; Weber, H.E.; Düll, R.; Wirth, V.; Werner, W.; Paulißen, D. Zeigerwerte von Pflanzen in Mitteleuropa. Scr. Geobot. 1992, 18, 1–248. [Google Scholar]
- Pyšek, P.; Danihelka, J.; Sádlo, J.; Chrtek, J., Jr.; Chytrý, M.; Jarošík, V.; Kaplan, Z.; Krahulec, F.; Moravcová, L.; Pergl, J. Catalogue of alien plants of the Czech Republic: Checklist update, taxonomic diversity and invasion patterns. Preslia 2012, 84, 155–255. [Google Scholar]
- Terpó, A.; Zając, M.; Zając, A. Provisional list of Hungarian archaeophytes. Thaiszia 1999, 9, 41–47. [Google Scholar]
- Balogh, L.; Dancza, I.; Király, G. A magyarországi neofitonok időszerű jegyzéke, és besorolásuk inváziós szempontból. In Biológiai inváziók Magyarországon: Özönnövények. [Biological invasions in Hungary: Invasive plants; Mihály, B., Botta-Dukát, Z., Eds.; TermészetBÚVÁR Alapítvány Kiadó: Budapest, Hunghary, 2004; pp. 61–92. [Google Scholar]
- Medvecká, J.; Kliment, J.; Majekova, J.; Halada, L.; Zaliberova, M.; Gojdičová, E.; Ferakova, V.; Jarolimek, I. Inventory of the alien flora of Slovakia. Preslia 2012, 84, 257–309. [Google Scholar]
- Protopopova, V. Sinantropnaya flora Ukrainy i puti ee razvitiya; Naukova Dumka: Kijev, Ukraine, 1991; Volume 1, p. 204. ISBN 825052143. [Google Scholar]
- Protopopova, V.V.; Shevera, M.V.; Mosyakin, S.L. Deliberate and unintentional introduction of invasive weeds: A case study of the alien flora of Ukraine. Euphytica 2006, 148, 17–33. [Google Scholar] [CrossRef]
- Jarolímek, I.; Šibík, J.; Hegedüšová, K.; Janišová, M.; Kliment, J.; Kučera, P.; Májeková, J.; Michálková, D.; Sadloňová, J.; Šibíková, I.; et al. Diagnostic, Constant and Dominant Species of the Higher Vegetation Units of Slovakia, 1st ed.; Jarolímek, I., Šibík, J., Eds.; Veda: Bratislava, Slovakia, 2008; p. 332. [Google Scholar]
- Borhidi, A.; Kevey, B.; Lendvai, G. Plant. communities of Hungary; Akadémiai Kiadó: Budapest, Hunghary, 2012; p. 544. [Google Scholar]
- Chytrý, M.; Douda, J.; Roleček, J.; Sádlo, J.; Boublík, K.; Hédl, R.; Vítková, M.; Zelený, D.; Navrátilová, J.; Neuhäuslová, Z.; et al. Vegetace České republiky 4. Lesní a křovinná vegetace; Chytrý, M., Ed.; Academia: Praha, Czech Republic, 2013; Volume 1, p. 551. [Google Scholar]
- Wickham, H. ggplot2: Elegant Graphics for Data Analysis; Springer: New York, NY, USA, 2009; p. 213. [Google Scholar] [CrossRef]
- QGIS Development Team. QGIS Geographic Information System. Open Source Geospatial Foundation Project. Version 2.18.26. 2018. Available online: https://qgis.org/en/site/ (accessed on 1 May 2019).
- Chytrý, M.; Tichý, L.; Holt, J.; Botta-Dukát, Z.; Bruelheide, H. Determination of diagnostic species with statistical fidelity measures. J. Veg Sci. 2002, 13, 79–90. [Google Scholar] [CrossRef]
- Augusto, L.; De Schrijver, A.; Vesterdal, L.; Smolander, A.; Prescott, C.; Ranger, J. Influences of evergreen gymnosperm and deciduous angiosperm tree species on the functioning of temperate and boreal forests. Biol. Rev. 2015, 90, 444–466. [Google Scholar] [CrossRef]
- Naudts, K.; Chen, Y.; McGrath, M.J.; Ryder, J.; Valade, A.; Otto, J.; Luyssaert, S. Europe’s forest management did not mitigate climate warming. Science 2016, 351, 597–600. [Google Scholar] [CrossRef]
- Alkama, R.; Cescatti, A. Biophysical climate impacts of recent changes in global forest cover. Science 2016, 351, 600–604. [Google Scholar] [CrossRef] [Green Version]
- Lindroos, A.J.; Derome, J.; Derome, K.; Smolander, A. The effect of Scots pine, Norway spruce and Silver birch on the chemical composition of stand throughfall and upper soil percolation water in northern Finland. Boreal Env. Res. 2011, 16, 240–250. [Google Scholar]
- Berg, B.; Johansson, M.-B.; Ekbohm, G.; McClaugherty, C.; Rutigliano, F.; Santo, A.V.D. Maximum decomposition limits of forest litter types: A synthesis. Can. J. Bot. 1996, 74, 659–672. [Google Scholar] [CrossRef]
- Eisalou, H.K.; Şengönül, K.; Gökbulak, F.; Serengil, Y.; Uygur, B. Effects of forest canopy cover and floor on chemical quality of water in broad leaved and coniferous forests of Istanbul, Turkey. For. Ecol. Manag. 2013, 289, 371–377. [Google Scholar] [CrossRef]
- Ayres, E.; Steltzer, H.; Berg, S.; Wallenstein, M.D.; Simmons, B.L.; Wall, D.H. Tree Species Traits Influence Soil Physical, Chemical, and Biological Properties in High Elevation Forests. PLoS ONE 2009, 4, e5964. [Google Scholar] [CrossRef] [PubMed]
- Mareschal, L.; Bonnaud, P.; Turpault, M.P.; Ranger, J. Impact of common European tree species on the chemical and physicochemical properties of fine earth: An unusual pattern. Eur. J. Soil Sci. 2010, 61, 14–23. [Google Scholar] [CrossRef]
- Hamajová, V. Charakteristika floristicko-fytocenologických zmien v lužných lesoch širšieho okolia Podunajských Biskupíc. Dipl.(msc.), depon. PriFUK, Bratislava 2001, 1, 143. [Google Scholar]
- Mucina, L.; Grabherr, G.; Ellmauer, T. Die Pflanzengesellschaften Österreichs; Gustav Fisher: Jena, Germany, 1993; Volume 1. [Google Scholar]
- Šenkýř, M. Vliv nepůvodních listnatých dřevin na diverzitu bylinného patra. Master’s Thesis, Masarykova univerzita, Brno, Czech Republic, 2015. [Google Scholar]
- Trentanovi, G.; von der Lippe, M.; Sitzia, T.; Ziechmann, U.; Kowarik, I.; Cierjacks, A.; Pyšek, P. Biotic homogenization at the community scale: Disentangling the roles of urbanization and plant invasion. Divers. Distrib. 2013, 19, 738–748. [Google Scholar] [CrossRef]
- Peloquin, R.L.; Hiebert, R.D. The Effects of Black Locust (Robinia pseudoacacia L.) on Species Diversity and Composition of Black Oak Savanna/Woodland Communities. Nat. Area. J. 1999, 19, 121–131. [Google Scholar]
- Carter, J.; Ladd, C.; Lough, K.; Pamenan, F.; Pernecky, G. Assessing the allelopathy of invasive Robina pseudoacacia in northern Michigan forests. For. Ecosys. 2017, 1, 1–10. [Google Scholar]
- Botková, K.; Bazalová, D.; Jarolímek, I.; Zedníček, Ľ.; Petrášová, M. Canadian poplar plantations–threat to softwood floodplain forests. In Book of abstracts, Posters, 25th meeting of the European Vegetation Survey; Agrillo, E., Attorre, F., Spada, F., Casella, L., Eds.; European Vegetation Survey: Roma, Italy, 2016; p. 22. [Google Scholar]
- Rahbek, C. The role of spatial scale and the perception of large-scale species-richness patterns. Ecol. Lett. 2005, 8, 224–239. [Google Scholar] [CrossRef]
- Medvecká, J.; Jarolímek, I.; Senko, D.; Svitok, M. Fifty years of plant invasion dynamics in Slovakia along a 2,500 m altitudinal gradient. Biol. Invasions 2014, 16, 1627–1638. [Google Scholar] [CrossRef]
- Walter, J.; Essl, F.; Englisch, T.; Kiehn, M. Neophytes in Austria: Habitat preferences and ecological effects. Neobiota 2005, 6, 13–25. [Google Scholar]
- Piermattei, A.; Renzaglia, F.; Urbinati, C. Recent expansion of Pinus nigra Arn. above the timberline in the central Apennines, Italy. Ann. For. Sci. 2012, 69, 509–517. [Google Scholar] [CrossRef] [Green Version]


| Black Pine Plantation Median ± st. Deviation | Native Forest Median ± st. Deviation | Wilcoxon Test p-Values | |
|---|---|---|---|
| Tree layer cover (%) | 70 ± 11.6 | 85 ± 8.0 | <0.001 |
| Shrub layer cover (%) | 20 ± 27.6 | 10 ± 21.3 | 0.007 |
| Herb layer cover (%) | 30 ± 28.3 | 50 ± 28.2 | 0.008 |
| Moss layer cover (%) | 0 ± 7.3 | 0 ± 1.3 | 0.155 |
| Litter layer cover (%) | 85 ± 19.6 | 80 ± 27.2 | 0.005 |
| Litter thickness (cm) | 3 ± 1.8 | 2 ± 1.8 | 0.039 |
| Canopy cover index (%) | 67.05 ± 9.3 | 83.37 ± 5.1 | <0.001 |
| pH | 7.09 ± 1.3 | 6.94 ± 1 | 0.626 |
| Black Pine Plantation Median ± st. Dev. | Native Forest Median ± st. Dev. | Wilcoxon Test p-Values | |
|---|---|---|---|
| No. of all species | 37 ± 13.4 | 36 ± 12.8 | 0.245 |
| Absolute no. of native species | 31 ± 11.9 | 30 ± 11.6 | 0.557 |
| Relative abundance of native species (%) | 93.33 ± 6.4 | 94.87 ± 4.9 | <0.001 |
| Cover of native species (%) | 57.2 ± 21.6 | 76.5 ± 20.2 | <0.001 |
| Absolute no. of neophytes | 1 ± 1.1 | 0 ± 0.9 | <0.001 |
| Relative abundance of neophytes (%) | 1.67 ± 3.4 | 0 ± 2.8 | 0.006 |
| Cover of neophytes (%) | 0 ± 4.7 | 0 ± 10 | 0.147 |
| Absolute no. of archaeophytes | 1 ± 1.5 | 1 ± 1.1 | 0.024 |
| Relative abundance of archaeophytes (%) | 3.13 ± 3.8 | 2.38 ± 3.2 | 0.038 |
| Cover of archaeophytes (%) | 0.5 ± 8.9 | 0 ± 4.6 | 0.031 |
| Absolute no. of diagnostic species | 2 ± 2.3 | 3 ± 2.7 | 0.008 |
| Relative abundance of diagnostic species (%) | 6.38 ± 6.9 | 8.33 ± 8.6 | <0.001 |
| Cover of diagnostic species (%) | 3 ± 13.5 | 6.9 ± 16.7 | <0.001 |
| Absolute no. of constant species | 5 ± 3.4 | 5 ± 4 | 0.084 |
| Relative abundance of constant species (%) | 14.81 ± 10.2 | 17.39 ± 11.1 | <0.001 |
| Cover of constant species (%) | 8.2 ± 16.8 | 12.5 ± 21.8 | 0.002 |
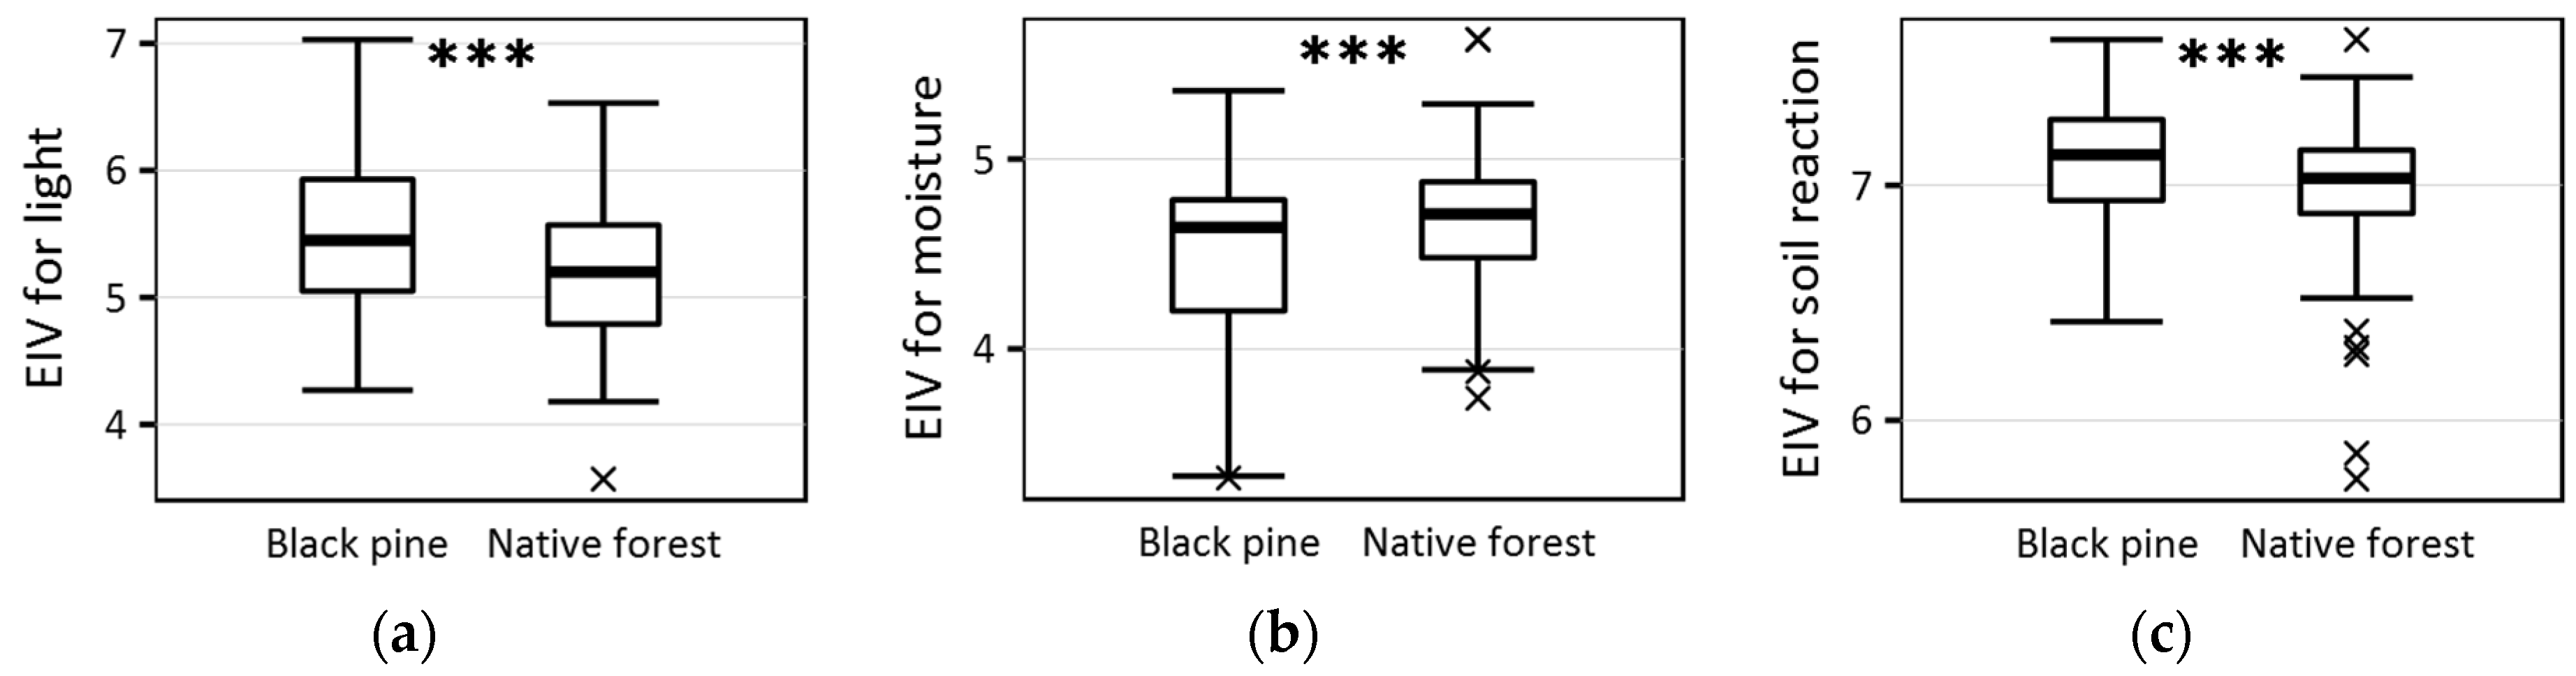
| Ellenberg indicator value for light | 5.45 ± 0.6 | 5.2 ± 0.6 | <0.001 |
| Ellenberg indicator value for moisture | 4.64 ± 0.4 | 4.71 ± 0.3 | <0.001 |
| Ellenberg indicator value for temperature | 5.59 ± 0.2 | 5.59 ± 0.2 | 0.764 |
| Ellenberg indicator value for nutrients | 5.11 ± 0.9 | 5.21 ± 0.7 | 0.206 |
| Ellenberg indicator value for soil reaction | 7.13 ± 0.3 | 7.03 ± 0.3 | <0.001 |
© 2019 by the authors. Licensee MDPI, Basel, Switzerland. This article is an open access article distributed under the terms and conditions of the Creative Commons Attribution (CC BY) license (http://creativecommons.org/licenses/by/4.0/).
Share and Cite
Mikulová, K.; Jarolímek, I.; Bacigál, T.; Hegedüšová, K.; Májeková, J.; Medvecká, J.; Slabejová, D.; Šibík, J.; Škodová, I.; Zaliberová, M.; et al. The Effect of Non-Native Black Pine (Pinus nigra J. F. Arnold) Plantations on Environmental Conditions and Undergrowth Diversity. Forests 2019, 10, 548. https://doi.org/10.3390/f10070548
Mikulová K, Jarolímek I, Bacigál T, Hegedüšová K, Májeková J, Medvecká J, Slabejová D, Šibík J, Škodová I, Zaliberová M, et al. The Effect of Non-Native Black Pine (Pinus nigra J. F. Arnold) Plantations on Environmental Conditions and Undergrowth Diversity. Forests. 2019; 10(7):548. https://doi.org/10.3390/f10070548
Chicago/Turabian StyleMikulová, Katarína, Ivan Jarolímek, Tomáš Bacigál, Katarína Hegedüšová, Jana Májeková, Jana Medvecká, Denisa Slabejová, Jozef Šibík, Iveta Škodová, Mária Zaliberová, and et al. 2019. "The Effect of Non-Native Black Pine (Pinus nigra J. F. Arnold) Plantations on Environmental Conditions and Undergrowth Diversity" Forests 10, no. 7: 548. https://doi.org/10.3390/f10070548