Article

Genetic Diversity and Population Structure of Capirona (Calycophyllum spruceanum Benth.) from the Peruvian Amazon Revealed by RAPD Markers

1
Dirección de Desarrollo Tecnológico Agrario, Instituto Nacional de Innovación Agraria (INIA), Av. La Molina 1981, Lima 15024, Peru
2
Facultad de Ciencias Biológicas, Universidad Nacional Pedro Ruíz Gallo, Juan XXIII No 391, Lambayeque 14013, Peru
3
Facultad de Ciencias Forestales, Universidad Nacional Agraria La Molina, Av. La Molina s/n, Lima 15024, Peru
*
Author to whom correspondence should be addressed.
Forests 2021, 12(8), 1125; https://doi.org/10.3390/f12081125
Submission received: 14 July 2021 / Revised: 11 August 2021 / Accepted: 20 August 2021 / Published: 22 August 2021

Abstract

:
Capirona (Calycophyllum spruceanum Benth.) is a tree species of commercial importance widely distributed in South American forests that is traditionally used for its medicinal properties and wood quality. Studies on this tree species have been focused mainly on wood properties, propagation, and growth. However, genetic studies on capirona have been very limited to date. Currently, it is possible to explore genetic diversity and population structure in a fast and reliable manner by using molecular markers. We here used 10 random amplified polymorphic DNA (RAPD) markers to analyze the genetic diversity and population structure of 59 samples of capirona that were sampled from four provinces located in the eastern region of the Peruvian amazon. A total of 186 bands were manually scored, generating a 59 × 186 presence/absence matrix. A dendrogram was generated using the UPGMA clustering algorithm, and, similar to the principal coordinate analysis (PCoA), it showed four groups that correspond to the geographic origin of the capirona samples (LBS, Irazola, Masisea, Iñapari). Similarly, a discriminant analysis of principal components (DAPC) and STRUCTURE analysis confirmed that capirona is grouped into four clusters. However, we also noticed that a few samples were intermingled. Genetic diversity estimation was conducted considering the four groups (populations) identified by STRUCTURE software. AMOVA revealed the greatest variation within populations (71.56%) and indicated that variability among populations is 28.44%. Population divergence (Fst) between clusters 1 and 4 revealed the highest genetic difference (0.269), and the lowest Fst was observed between clusters 3 and 4 (0.123). RAPD markers were successful and effective. However, more studies are needed, employing other molecular tools. To the best of our knowledge, this is the first investigation employing molecular markers in capirona in Peru considering its natural distribution, and as such it is hoped that this helps to pave the way towards its genetic improvement and the urgent sustainable management of forests in Peru.

1. Introduction

Calycophyllum spruceanum (Benth.) (Rubiaceae) is a fast-growing forest species [1] with a natural origin in the Amazon basin, covering the territories of Bolivia, Peru, Colombia, and Brazil [2]. Capirona is a valuable timber forest species in the Peruvian Amazon that is widely used by local communities and is exported around the world. It has a high-density, durable wood; therefore, it is used for the construction of economically valuable products [3]. Capirona has high potential for cultivation in agroforestry systems, which counters unsustainable land use due to activities such as slash-and-burn agriculture, and this species represents an alternative to increase rural incomes and development [4]. Thus, capirona is currently the object of research in the Peruvian Amazon basin in order to establish participatory research with local communities, optimizing genetic and silvicultural management strategies including community conservation methods [1] since it is known that the indiscriminate use of forest species is generating deforestation in various regions of the planet [5,6,7]. Genetic diversity studies are indispensable for conducting conservation programs and sustainable management. Moreover, these studies based on molecular markers provide important information on the genetic makeup of the population because they are independent of environmental factors [8]. A demographic study would not provide this kind of information, influencing decision making. In recent years, molecular markers such as DNA-based markers like random-amplified polymorphic DNA (RAPD), microsatellite or simple sequence repeat (SSR) and inter simple sequence repeat (ISSR) have been used in studies for the analysis of phylogeny, inter-species relationships and genetic diversity for forest species like Pinus leucodermis, Cedrela odorata Eucalyptus globulus, Swietenia macrophylla, Bertholletia excelsa and Populus deltoides [9,10,11,12,13,14].
Previous research determined the genetic variation of capirona by using amplified fragment length polymorphisms (AFLP) among nine populations from the Peruvian Amazon [1]. They demonstrated that variation among individuals within populations is predominant. However, they did not employ samples from the Madre de Dios department, which is considered a place where capirona exists naturally [15]. On the other hand, Tauchen et al. [3] identified the genetic variability of capirona at the level of DNA polymorphism evaluated by non-specific ITS primers of plant materials from Pucallpa, department of Ucayali, in the Peruvian Amazon. Their results showed that morphological diversity is greater than genetic diversity of capirona. They also found that environmental factors had a greater impact on the phenotype in those accessions. Finally, their results are in line with the claims of previous studies on C. spruceanum, suggesting greater variation within provenances than among provenances. Capirona is an orphan forest species, and no further studies of genetic diversity with molecular markers have been reported.
RAPD is an especially useful DNA-based method for initial research of genetic diversity in plant species. These studies are crucial for the initiation of conservation programs, and the rapidity of working with RAPD markers is an advantage because they can deliver crucial information in a short time [16,17,18]. They have been used to differentiate cultivars and also on genetic mapping [19,20,21]. Although some researchers have shown reservations regarding the usefulness of RAPD, basically due its poor reproducibility [22,23], other studies mentioned that RAPD can be employed for genetic analyses [24,25,26,27,28]. Additionally, other studies demonstrated a high level of reproducibility [29]. A great potential for the analysis of polymorphism and genetic diversity has also been demonstrated by RAPD markers as they are easy to test and require low concentrations of DNA [17].
The objective of this study was to determine the genetic diversity and population structure of capirona from primary forests located in the departments of Ucayali, San Martín and Madre de Dios located in the Peruvian Amazon to help pave the way towards its modern breeding program, the sustainable conservation of this tree species in the near future.

2. Materials and Methods

2.1. Plant Material

We collected 59 samples of capirona from Ucayali, San Martín and Madre de Dios departments in the Peruvian Amazon considering their natural range of distribution. Leaf samples were collected in paper envelopes, stored in airtight containers with silicone gel, and transported to the National Institute of Agricultural Innovation (INIA) for genomic DNA extraction. Further details of the samples examined in this study are available in Table 1.

2.2. DNA Amplification

We extracted genomic DNA by using the CTAB method with minor modifications [30,31]. All procedures were performed in 1.5 and 2 mL plastic microfuge tubes. About 0.1 g dry leaves were grounded in liquid nitrogen and suspended in 600 mL of 2× CTAB buffer containing 0.2% b-mercaptoethanol followed by incubating at 65 °C for 60 min, then an equal volume of chloroform:isoamylalcohol (24:1, v/v) was added and the sample was shaken gently and then centrifuged. The supernatant was extracted, then 10× CTAB buffer and chloroform:isoamylalcohol (24:1, v/v) was added again. The supernatant was extracted and then mixed with ice cold isopropanol. DNA was recovered as a pellet by centrifugation, washed with ice-cold ethanol twice (70 and 90%), and then DNA was dried in the air. Finally, DNA was resuspended in nuclease-free water. The RNA contamination in all samples was removed by digesting the extract with RNase-A (100 µg ml−1) for 30 min at 37 °C. DNA quality and quantity were checked in 1% agarose gels using Gelred (Biotium®, Fremont, CA, USA) and by standard spectrophotometry.
A total of 10 RAPD markers (Operon Technologies Inc., Alameda, CA, USA) were employed to assess genetic diversity among 59 samples of C. spruceanum (Table S1). Amplification was achieved with 10 µL reaction volume containing 5 ng DNA, kit Kapa HiFi Hotstart ReadyMix, and 0.2 µM of primers. The PCR amplification was performed at an initial denaturation temperature of 94 °C for 4 min followed by 40 cycles of 1 min denaturation at 94 °C, 45 s annealing at 37 °C and 2 min extension at 72 °C with a final extension of 10 min at 72 °C [32] in a Thermal Cycler Simplyone (Applied Biosystems™, Foster City, CA, USA). Amplified products were separated on 1% (w/v) agarose gel in TBE buffer by electrophoresis and were then visualized with Gelred staining and photographed using the gel documentation system. The size of the amplification products was estimated by comparing the amplicons with a 100 bp ladder (New England Biolabs, Ipswich, MA, USA).

2.3. Data Analysis

The RAPD band patterns were scored visually for the presence (1) or absence (0) of various molecular weights. Only polymorphic, clear and consistent bands were considered for the analysis [32]. Similar to the procedure employed by Chia [33], loci with more than 10% missing data were excluded from the analysis. Polymorphic information content (PIC) from dominant markers was calculated using the following equation:
PIC = 1 [ f i 2   + ( 1 f i ) 2   ]
where, fi is the frequency of the amplified band (1) and (1 − fi) is frequency of absence of band (0) [34].
We then used RStudio software v1.2.5033 to calculate genetic distances based on Provesti’s coefficient [35], then a dendrogram was generated using the UPGMA clustering algorithm with 1000 bootstrap replicates from poppr package v2.9.2 [36]. We also used ade4 v1.7–16 and adegenet v.2.1.3 packages in Rstudio to conduct a principal coordinate analysis (PCoA) and a discriminant analysis of the principal component analysis (DAPC), respectively, in order to infer the capirona population structure. Number of populations (K) were set from 1 to 10 by k-means clustering with 100,000 iterations. Selection of the most likely number of clusters was based on the lowest Bayesian Information Criterion (BIC) value.
Population structure was also estimated using the STRUCTURE program v.2.3.4 [37] with ten runs for each number of populations (K value) ranging from 1 to 10 with a burn-in length of 50,000 Monte Carlos iterations, which was followed by 150,000 iterations. An admixture model with no previous population information was considered; all other parameters were set to default values. Estimation of the most likely number of clusters was calculated by the Evanno method [38]. Membership probabilities ≥ 0.8 or the maximum membership probability was adopted to divide the capirona samples into different clusters. Population structure plots were generated with R package pophelper v.2.3.1 [39]. We used tess3r package v1.1.0 [40] to display the STRUCTURE membership coefficient matrix of the estimated K on a geographic map of Peru.
We used the number of populations determined by STRUCTURE to conduct an analysis of molecular variance (AMOVA) using the R package poppr. In addition, three genetic diversity indices were calculated using the same package: (i) Shannon–Wiener index, (ii) Simpson’s index, and (iii) Nei’s gene diversity (expected heterozygosity). The degree of gene differentiation among clusters in terms of allele frequencies (Fst) was estimated using the following formula:
Fst = 1 − (Hs/Ht)
where HS is the average expected heterozygosity estimated from each cluster and Ht is total gene diversity or expected heterozygosity in the total cluster as estimated from the pooled allele frequencies.

3. Results

3.1. RAPD Analysis

The 10 RAPD primers employed in this work revealed 16 to 23 fragments in 59 samples of capirona, with 29.4 fragments being the average. Of the total 186 fragments, 100% were polymorphic (Figure S1). Polymorphic information content (PIC) ranged from 0.20 to 0.38 (Table 2).

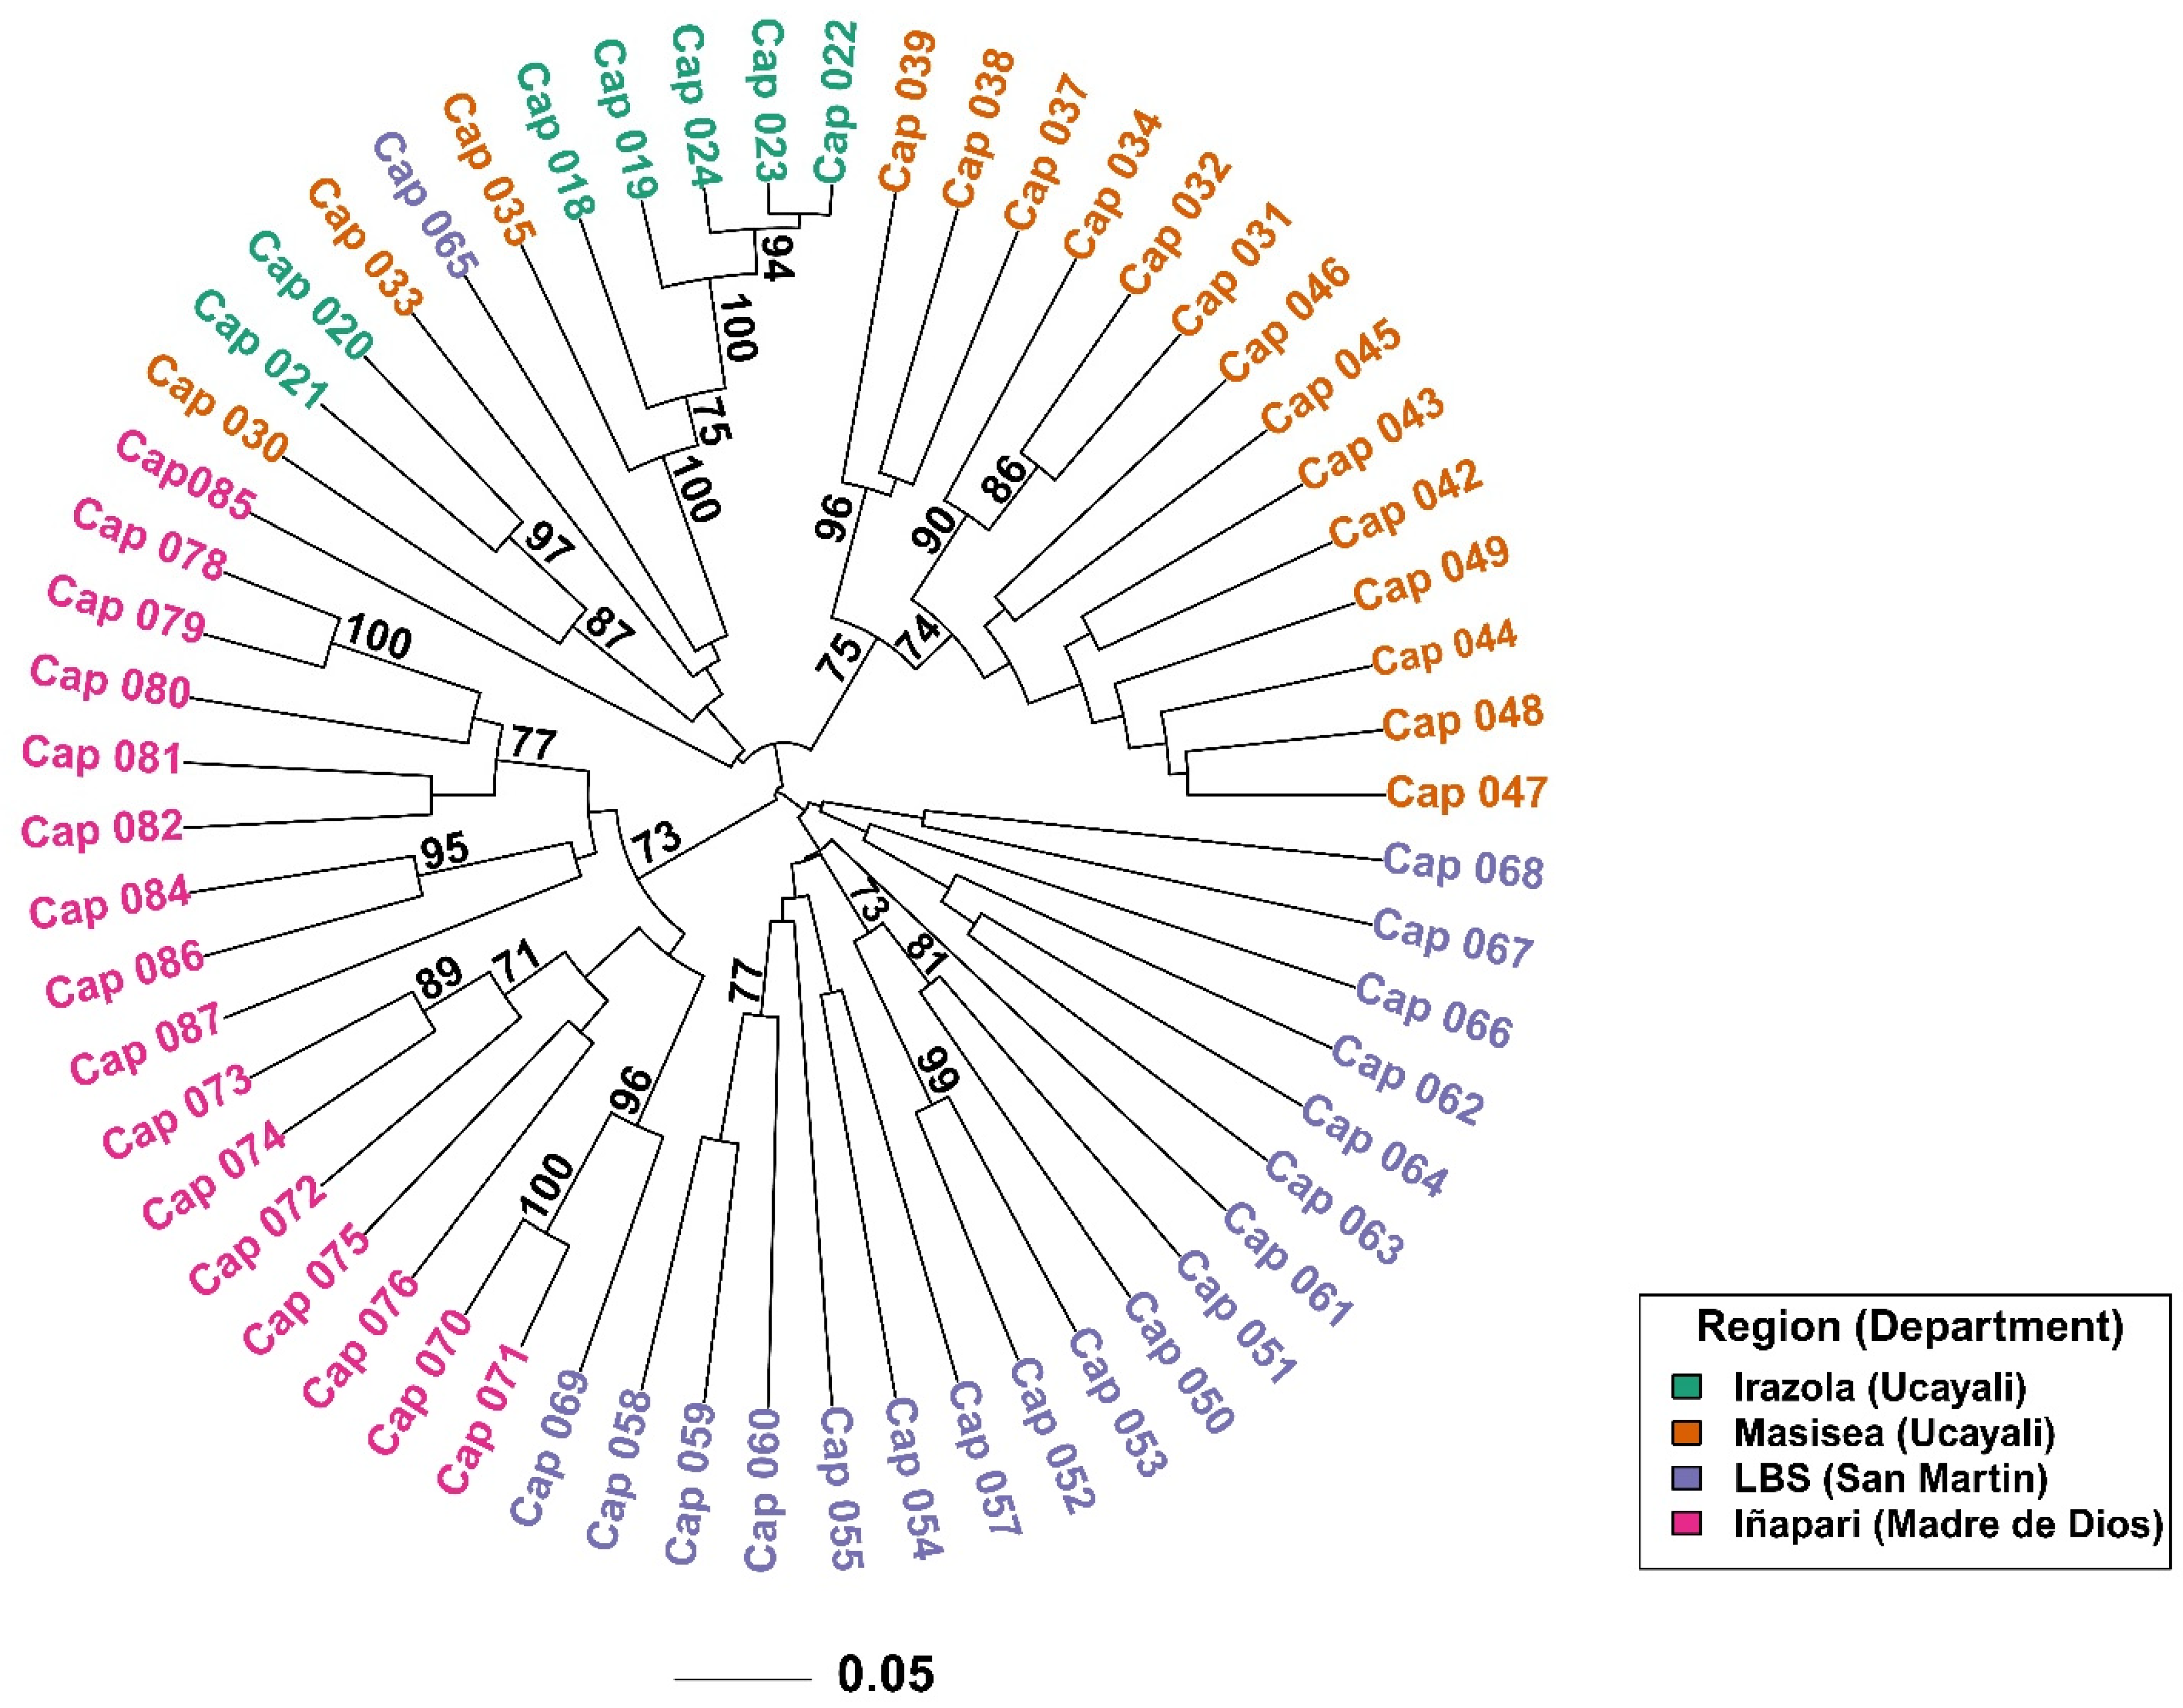
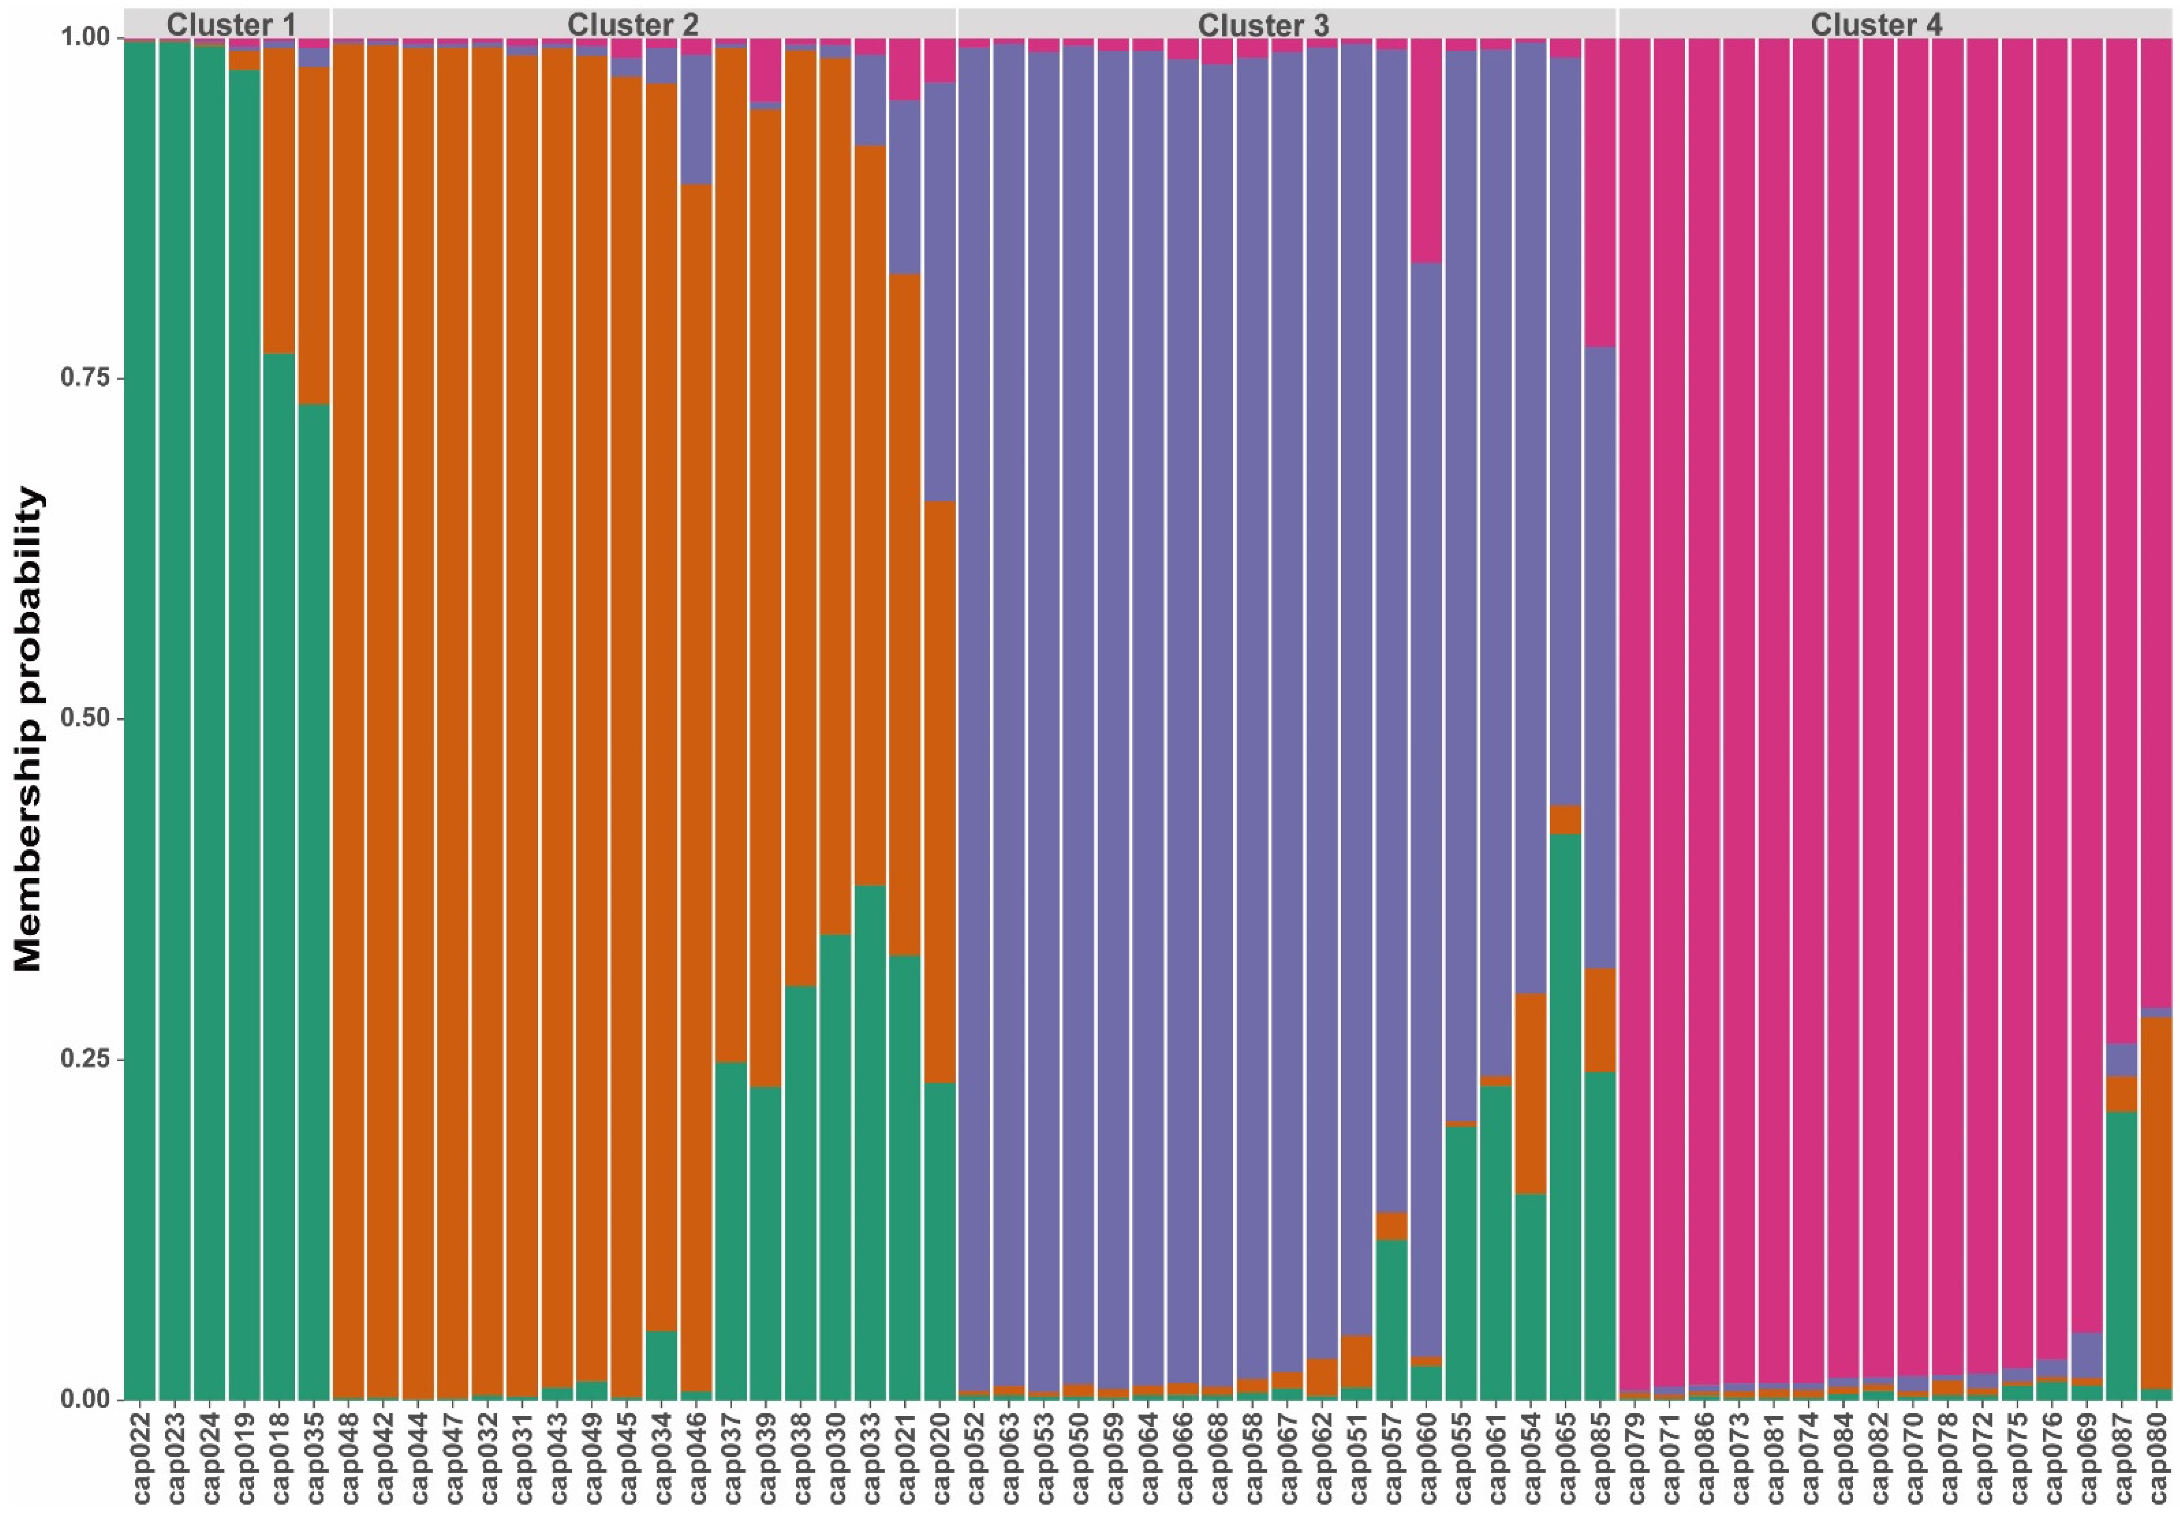
3.2. Genetic Diversity and Population Structure

A total of 186 bands were manually scored, generating a 59 × 186 presence/absence data matrix. A phylogenetic tree based on Provesti’s genetic distances showed that all members of capirona were placed in four main clusters according to their geographic locality: (1) samples belonging to Iñapari (except cap069), (2) samples from LBS, (3) samples collected at Masisea and (4) an “admixture” cluster with samples from different origin but showing a prevalence of samples belonging to Irazola (Figure 1). Regions Irazola and Masisea belong to Ucayali department. In addition, our dendrogram showed that cluster Masisea and Iñapari are the only clusters supported with a bootstrap value of more than 70% (Figure 1).
Principal coordinate analysis (PCoA) showed that the first two axis explained 22.8% of the variation and revealed that all 59 individuals are separated into four populations, according to their geographic locality (Irazola, Masisea, LBS, Iñapari). Two samples from Masisea are mixed with the Irazola population, and two samples from Iñapari are intermingled within the LBS group (Figure 2a). To explore the genetic structure of capirona from the Peruvian Amazon basin, we used the find.clusters function to determine the best K value for our capirona samples, discovering that K = 4 is the most likely number of groups according to the BIC criteria (Figure S2). In accordance with the dendrogram result, discriminant analysis of principal components (DAPC) also evidenced that all samples of capirona are separated into four clusters (Figure 2b, Table S2). Moreover, Figure S3 demonstrated that capirona samples also clustered according to their geographic origin mainly. However, four samples from cluster 1 (cap030, cap033, cap035, cap065) grouped within the Masisea and LBS population. Similarly, sample cap069 from cluster 4 were placed within the LBS population. Sample cap085 belongs to cluster 3, but it was intermingled within the Iñapari population.
The Evanno method [38] depicted that the best K value (number of populations) is two for our data set. However, the next largest peak is at K = 4. Waples and Gaggiotti (2006) [41], Frantz et al. (2009) [42] and Janes et al. (2017) [43] mentioned that the Evanno method tends to underestimate the number of genetic clusters. Similar to previous studies [44,45], we obtained a false highest peak at K  =  2 with the Evanno method due to a strong rejection of the null hypothesis of no structure (K  =  1). On the other hand, DAPC indicated that K = 4 is the most likely number of populations (Figure S2), which is concordant with the dendrogram (Figure 1) and PCoA (Figure 2a). Therefore, further analyses followed K = 4. STRUCTURE analysis exhibited admixture for a few samples. Most samples of capirona are clustered according to their geographic origin, except for samples cap020, cap021, cap035 and cap085 (Figure 3). Moreover, Figure S4 shows STRUCTURE membership proportions to clusters spatially interpolated into a map resulting from analysis in TESS3 [40]. Spatial interpolation of membership matrix inferred assigned capirona samples from Irazola to cluster 1 mainly. In the second cluster, samples belonging to Masisea are included. Cluster 3 comprised samples from LBS, and cluster 4 included samples from Iñapari.
Genetic diversity and Fst estimation were conducted considering the four clusters (populations) identified by STRUCTURE software, taking into account that RAPD are dominant markers. The Nei’s genetic diversity [46] estimates ranged from 0.12 to 0.41 among the four populations sampled across the Peruvian Amazon, showing a considerable similarity between the samples studied here. The Shannon–Wiener index ranged from 1.79 to 2.94, and Simpson’s index from 0.83–0.95, indicating high genetic diversity for all four populations of capirona. The percentage of polymorphic loci per cluster ranged from 51.08% (cluster 1) to 96.24% (cluster 3) with an average of 78.5% (Table 2). Population divergence (Fst) between clusters 1 and 4 revealed the highest genetic difference (0.269), and the lowest Fst was observed between clusters 3 and 4 (Table 3).
The analysis of molecular variance (AMOVA) allows the study of genetic variation within and between clusters. AMOVA revealed that 28.44% of the total variation was found between clusters of capirona while 71.56% was within clusters (Table 4).

4. Discussion

Genetic diversity sheds light on the evolutionary pressure on the alleles and the mutation rate a locus might have undergone over a period of time [47]. To the best of our knowledge, this is the first study that employs molecular markers to estimate population structure and genetic diversity of capirona from a wide range of natural distribution in Peru. Molecular markers based on DNA (RAPD, AFLP, SSR) are used to study genetic variation in forest species [1,8,16,48]. Advantages of these methods over others include their better representation of the variation present within species [12]. RAPD markers are applied for initial studies of genetic diversity in forest species like pine (Pinus leucodermis), big-leaf mahogany (Swietenia macrophylla) and tornillo (Cedrelinga cateniformis) [9,12,16]. To date, only a small number of studies have used molecular markers to examine genetic diversity within and between populations of capirona, and this study represents the first population structure assessment in capirona from the Peruvian Amazon. We report that genetic diversity of capirona based on RAPD markers is high among four populations sampled across the Peruvian Amazon. These estimates are in agreement with the results obtained by Russell et al. [1]. On the contrary, Dávila-Lara et al. [48] reported lower genetic diversity parameters across 13 populations of capirona in Nicaragua (Central America). This discrepancy may be explained due to different sampling origins. The Amazon basin is known as the center of origin of this forest species [2], therefore this geographic region might hide plenty of beneficial genes as germplasm around this center because it has had the opportunity to evolve adaptation capacities to multiple environmental challenges over a longer period of time. Therefore, it is expected that the capirona samples from the Amazon basin possess higher genetic diversity. Moreover, the low genetic diversity of samples from Nicaragua might be explained by its biogeographic history, Pleistocene range dynamics and recent anthropogenic deforestation [48]. In addition, Tauchen et al. [3] used nuclear ribosomal internal transcribed spacers (nrITS) to molecularly characterize populations of capirona and failed to separate individuals by multivariate analysis. They concluded that morphological diversity is higher than the genetic one in this tree species. Similarly, Montes et al. [49] analyzed the morphological diversity of Callycophyllum spruceanum in 11 natural populations of the Peruvian Amazon. They grew seeds of capirona and analyzed stem-growth and branch-wood traits and found no significant structuring populations.
The different values obtained for the three diversity indices (Shannon–Wiener, Simpson and Nei’s indices) may be explained due to the fact that whereas Nei’s index measures the level of heterozygosity, Shannon–Wiener and Simpson assumes that any difference between the analyzed individuals means a different species. Nei’s genetic diversity index ranged from 0.12 to 0.41, indicating high genetic diversity, which is concordant for specimens from natural populations as they are not affected by artificial selection. Maintaining high genetic diversity in natural populations is important because it reduces the risk of local extinction under natural conditions [50,51]. Similarly, the Shannon–Wiener index is slightly high (1.79 to 2.94) and demonstrates the wealth and abundance among capirona clusters. Likewise, Simpson index varied from 0.83 to 0.95, revealing that it is very likely that two individuals of capirona randomly selected from a cluster will belong to the same species. Although genetic relationships between species may be relatively low (low Nei’s index), the diversity of the sequences and therefore of the population can still be relatively high (high Simpson and Shannon indices) [46,52]. Similarly, a recent study on Guazuma crinita reported low Nei’s gene diversity and high Shannon information index [50]. In addition, our expected heterozygosity is similar to the populations of tornillo (Cedrelinga cateniformis) [31].
Population structure analysis is informative to understand genetic diversity and facilitates subsequent association mapping studies [51]; its presence in those studies can lead to false positive associations between markers and traits [51]. Consequently, assessing population structure is a crucial step to conduct association between molecular markers and traits. In our study, DAPC and STRUCTURE results revealed that 59 samples of capirona from the Peruvian Amazon clustered into four well-defined groups associated with their genetic structure. Moreover, PCoA gave similar results. According to Rosyara et al. [53], DAPC exhibits the ability to control population structure in association with mapping studies, and it is slightly better than STRUCTURE analysis for discriminating among populations as revealed in Prunus avium [54] and Camelia sinensis [55]. The presence of structure in these 59 samples of capirona meet our expectations since according to the pedigree of the genotypes, all the individuals can be divided into four geographical locations, and intentional selection of traits by farmers might affect the population structure. However, there are a few accessions intermingled between the four clusters. This might be due to the common process of exchanging genetic material by farmers living in close geographic areas (Irazola, Masisea, Iñapari) or migration as it may have occurred for sample cap069 (LBS).
Among the four populations identified in this study, cluster 1 included mainly samples from Irazola and showed the biggest difference from the other clusters, and it had the lowest genetic diversity. These results may suggest that samples from Irazola possess narrow genetic diversity as they were geographically isolated and developed using limited genetic resources. AMOVA demonstrated that the greatest variation exists within populations of capirona. This may be explained due to the sexual propagation method of capirona. In addition, this is expected in this species because it produces seeds that are dispersed over long distances by wind and water. In general, this is the case for tropical trees, and especially those that are outcrossing, pollinated and/or dispersed by wind, so they tend to harbor high levels of genetic diversity at local and regional spatial scales [50]. Moreover, our results agree with similar studies conducted by Russell et al. [1] and Tauchen et al. [3].
Even though there have been some efforts to study capirona at the molecular and morphological level, further research is needed aiming at identifying putative genes in this tree species. Next generation sequencing (NGS) is a modern tool widely used on many plant species. However, very few investigations were conducted using NGS on forest species [56,57]. Our next step is to develop extra molecular tools for capirona, and other tree species using NGS techniques such as de novo transcriptome in order to identify EST-SSR markers. Similar to other studies on forest species [58,59,60], the development of those markers will benefit the genetic mapping and breeding process of capirona in the near future. These molecular tools may also shed light on deciphering the evolution history of the Calycophyllum genus.

5. Conclusions

In this study we demonstrated that RAPD markers were successful and effective for the assessment of the genetic diversity and structure of C. spruceanum populations from the Peruvian Amazon. High levels of genetic diversity were registered using different indices, reflecting probable extensive gene flow due to long-distance seed dispersal. Moreover, capirona samples were grouped into four clusters according to their geographic affiliation. However, few samples were intermingled, probably due to the common activity of seed exchange followed by farmers. More work is still needed using additional collections of capirona from a wider geographic range and other molecular markers. In addition, extra molecular tools should be developed for this tree species using NGS techniques in order to promote the establishment of a modern breeding program of forest species in Peru.

Supplementary Materials

The following are available online at https://www.mdpi.com/article/10.3390/f12081125/s1, Table S1: List of the primers used in the RAPD analysis, their sequence and reference. Table S2: Cluster assignment of 59 samples of capirona based on STRUCTURE and DAPC analysis. Figure S1: RAPD banding pattern using primers OPA-10: A, SC10–20: B, OPA-02: C. Ladder 100 pb NEB. 1% agarosa. 1 ul de ADN + 9 uL de Buffer dye 1 × and 0.035 uL de gel red. Figure S2: Number of populations. Plot of K ranging from 1 to 10. (a) All K values were obtained from adegenet analysis (DAPC). (b) All K values were obtained from STRUCTURE analysis. Four populations were considered in a data set of 10 RAPD markers and 59 samples of capirona. Figure S3: Population structure of 59 samples of capirona inferred by DAPC using 10 RAPD markers. Irazola, Masisea, LBS and Iñapari refer to the geographic origin of the samples. Figure S4: Geographic map of membership matrix of STRUCTURE analysis employing 59 samples of capirona based on 10 RAPD markers. The most likely number of groups is four. Black dots indicate location where capirona genotypes were sampled.

Author Contributions

Conceptualization, C.L.S. and W.C.; methodology, C.L.S., J.D.C., M.Y.C. and W.C.; formal analysis, C.L.S. and C.I.A.; resources, M.R. and E.C.; data curation, C.I.A.; writing—original draft preparation, C.L.S. and C.I.A.; writing—review and editing, C.L.S. and C.I.A.; supervision, W.C. and C.I.A.; funding acquisition, M.R. and E.C. All authors have read and agreed to the published version of the manuscript.

Funding

This research was funded by the National Agrarian Innovation Program (PNIA)—Project No. 120-PI. C.L.S. and C.I.A. were supported by PIP 2449640 “Creación del Servicio de Agricultura de Precisión en los Departamentos de Lambayeque, Huancavelica, Ucayali, y San Martín 4 Departamentos” and PP0068 “Reducción de la vulnerabilidad y atención de emergencias por desastres”.

Acknowledgments

We would like to thank Joel Reyes for supporting the technical activities in the laboratory. We would also thank Haru Garcia, Yanett Chumbimune and Lhia Aguirre for their support with sample collection.

Conflicts of Interest

The authors declare no conflict of interest.

References

  1. Russell, J.R.; Weber, J.C.; Booth, A.; Powell, W.; Dawson, C.S. Genetic variation of Calycophyllum spruceanum in the Peruvian Amazon Basin, revealed by amplified fragment length polymorphism (AFLP) analysis. Mol. Ecol. 1999, 8, 199–204. [Google Scholar] [CrossRef]
  2. Sears, R. New Forestry on the Floodplain: The ecology and Management of Calycophyllum spruceanum (Rubiaceae) on the Amazon Landscape. Ph.D. Thesis, Columbia University, New York, NY, USA, 2003. [Google Scholar]
  3. Tauchen, J.; Lojka, B.; Hlasna-Cepkova, P.; Svobodova, E.; Dvorakova, Z.; Rollo, A. Morphological and genetic diversity of Calycophyllum spruceanum (Benth) k. Schum (Rubiaceae) in Peruvian amazon. Agric. Trop. Subtrop. 2011, 44, 212–218. [Google Scholar]
  4. Weber, J.; Sotelo-Montes, C.; Labarta-Chávarri, R. Tree domestication in the Peruvian Amazon Basin—working with farmers for community development. Agrofor. Today 1997, 9, 4–8. [Google Scholar]
  5. Busch, J.; Amarjargal, O. Authority of Second-Tier governments to reduce deforestation in 30 tropical countries. Front. For. Glob. Chang. 2020, 3, 1. [Google Scholar] [CrossRef] [Green Version]
  6. Estoque, R.C.; Ooba, M.; Avitabile, V.; Hijioka, Y.; Dasgupta, R.; Togawa, T.; Muruyama, Y. The future of Southeast Asia’s forests. Nat. Commun 2019, 10, 1–12. [Google Scholar] [CrossRef] [Green Version]
  7. Rasolofoson, R.A.; Ferraro, P.J.; Jenkins, C.N.; Jones, J.P. effectiveness of community forest management at reducing deforestation in Madagascar. Biol. Conserv. 2015, 184, 271–277. [Google Scholar] [CrossRef] [Green Version]
  8. Singh, P.; Singh, S.P.; Tiwari, A.K.; Sharma, B.L. Genetic diversity of sugarcane hybrid cultivars by RAPDs markers. Biotech 2017, 7, 1–5. [Google Scholar] [CrossRef] [PubMed]
  9. Bucci, G.; Vendramin, G.G.; Lelli, L.; Vicario, L. Assessing the genetic divergence of Pinus leucodermis Ant. endangered populations: Use of molecular markers for conservation purposes. Theor. Appl. Genet. 1997, 95, 1138–1146. [Google Scholar] [CrossRef]
  10. Gillies, A.C.M.; Cornelius, J.P.; Newton, A.C.; Navarro, C.; Hernández, M.; Wilson, J. Genetic variation in Costa Rican populations of the tropical timber species Cedrela odorata L., assessed using RAPDs. Mol. Ecol. 1997, 6, 1133–1145. [Google Scholar] [CrossRef]
  11. Nesbitt, K.A.; Potts, B.M.; Vaillancourt, R.E.; Reid, J.B. Fingerprinting and pedigree analysis in Eucalyptus globulus using RAPDs. Silvae Genet. 1997, 46, 6–11. [Google Scholar]
  12. Gillies, A.C.M.; Navarro, C.; Lowe, A.J.; Newtons, A.C.; Hernández, M.; Wilson, J. Genetic diversity in Mesoamerican populations of Mahogany (Swietenia macrophylla), assessed using RAPDs. Heredity 1999, 83, 722–732. [Google Scholar] [CrossRef]
  13. Baldoni, A.B.; Teodoro, L.P.R.; Teodoro, P.E.; Tonini, H.; Tardin, F.D.; Botin, A.A.; Hoogerheide, E.S.; Botelho, S.; Lulu, J.; Neto, A.; et al. Genetic diversity of Brazil nut tree (Bertholletia excelsa Bonpl.) in southern Brazilian Amazon. For. Ecol. Man. 2020, 458, 117795. [Google Scholar] [CrossRef]
  14. Chen, C.; Chu, Y.; Ding, C.; Su, X.; Huang, Q. Genetic diversity and population structure of black cottonwood (Populus deltoides) revealed using simple sequence repeat markers. BMC Genet. 2020, 21, 1–12. [Google Scholar] [CrossRef] [PubMed] [Green Version]
  15. Ministerio de Economía y Finanzas. Available online: https://www.mef.gob.pe/contenidos/doc_siga/catalogo/ctlogo_familias_madera_capirona.pdf (accessed on 20 August 2021).
  16. Cruz, W.; Saldaña, C.; Ramos, H.; Baselly, R.; Loli, J.C.; Cuellar, E. Estructura y diversidad genética de poblaciones naturales de Cedrelinga Cateniformis “tornillo” en la región oriental del Perú. Sci. Agropecu. 2020, 11, 521–528. [Google Scholar] [CrossRef]
  17. Tijerino, A.; Callejas, L.; Cerda-Granados, D.A. Assessment of genetic diversity in five Nicaraguan populations of Cedrela odorata L. (Meliaceae) using RAPD markers. Encuentro 2016, 103, 28–39. [Google Scholar] [CrossRef]
  18. Renau-Morata, B.; Nebauer, G.; Sales, E.; Allainguillaume, J.; Caligari, P.; Segura, J. Genetic diversity and structure of natural and managed populations of Cedrus atlantica (Pinaceae) assessed using random amplified polymorphic DNA. Am. J. Bot. 2005, 92, 875–884. [Google Scholar] [CrossRef] [PubMed]
  19. Ye, N.; Weeden, F.; Reisch, I. Genetic mapping and fingerprinting of grape vines using molecular markers. Am. J. Enol. Vitic. 1993, 44, 468. [Google Scholar]
  20. Lodhi, A.; Daly, J.; Ye, N.; Weeden, F.; Reisch, I. A molecular marker based linkage map of Vitis. Genome 1995, 38, 786–794. [Google Scholar] [CrossRef]
  21. Weeden, F.; Hemmat, M.; Lawson, M.; Lohdi, M.; Bell, L.; Manganaris, G.; Reisch, I.; Brown, K.; Ye, N. Development and application of molecular marker linkage maps in woody fruit crops. Euphytica 1994, 77, 71–75. [Google Scholar] [CrossRef]
  22. Büscher, N.; Zyprian, E.; Blaich, R. Identification of grapevine cultivars by DNA analyses: Pitfalls of random amplified polymorphic DNA techniques using 10mer primers. Vitis 1993, 32, 187–188. [Google Scholar]
  23. Xu, H.; Wilson, J.; Arulsekar, S.; Bakalinsky, A.T. Sequence-specific polymerase chain reaction markers derived from randomly amplified polymorphic DNA markers for fingerprinting grape (Vitis) rootstocks. J. Amer. Soc. Hort. Sci. 1995, 120, 714–720. [Google Scholar] [CrossRef] [Green Version]
  24. Gogorcena, Y.; Arulsekar, S.; Dandekar, M.; Parfitt, E. Molecular markers for grape characterization. Vitis 1993, 32, 183–185. [Google Scholar]
  25. Qu, X.; Lu, J.; Lamikanra, O. Genetic diversity in muscadine and American bunch grapes based on randomly amplified polymorphic DNA (RAPD) analysis. J. Amer. Soc. Hort. Sci. 1996, 121, 1020–1023. [Google Scholar] [CrossRef] [Green Version]
  26. Mendonça, G.; de Souza, M.; Vieira, A.; Estopa, A.; Reis, F.; Carvalho, D. Using random amplified polymorphic DNA to assess genetic diversity and structure of natural Calophyllum brasiliense (Clusiaceae) populations in riparian forests. Int. J. For. Res. 2014, 2014, 1–9. [Google Scholar]
  27. Basyuni, M.; Prayogi, H.; Putri, P.; Syahputra, I.; Siregar, S.; Risnasari, I.; Wati, R.; Arifiyanto, D. RAPDs markers on genetic diversity in three populations of pisifera type of oil palm (Elaeis guineensis). In IOP Conference Series: Earth and Environmental Science; IOP Publishing: Bristol, UK, 2018; Volume 130, p. 012050.guineensis. [Google Scholar]
  28. Kim, H.; Lei, P.; Wang, A.; Liu, S.; Zhao, Y.; Huang, F.; Yu, Z.; Zhu, G.; He, Z.; Tan, D.; et al. Genetic diversity of castor bean (Ricinus communis L.) revealed by ISSR and RAPDs markers. Agronomy 2021, 11, 457. [Google Scholar] [CrossRef]
  29. Vidal, J.R.; Moreno, S.; Masa, A.; Ortiz, J.M. Study of the genetic homogeneity of albariño (Vitis vinifera L.) growing in Galicia (Spain) using isozyme and RAPDs markers. Vitis 1998, 37, 145–146. [Google Scholar]
  30. Doyle, J.J.; Doyle, J.L. A rapid DNA isolation procedure for small quantities of fresh leaf tissue. Phytochem. Bulletin 1987, 19, 11–15. [Google Scholar]
  31. Cruz, W.; Ramos, H.; y Cuellar, J. Manual de Protocolos para el Estudio de Diversidad Genética en Especies Forestales Nativas: Tornillo (Cedrelinga cateniformis Ducke), Capirona (Calycophyllum spruceanum Benth.), Shihuahuaco (Dipteryx sp.), Ishpingo (Amburana sp.) y Castaña (Bertholletia Excelsa); Instituto Nacional de Innovación Agraria: Lima, Perú, 2019. [Google Scholar]
  32. Goyal, P.; Jain, R.; Kachhwaha, S.; Kothari, S.L. Assessment of genetic diversity in Pithecellobium dulce (Roxb.) Benth. germplasm using RAPDs and ISSR markers. Trees 2014, 29, 637–653. [Google Scholar] [CrossRef]
  33. Chia-Wong, J.A.; Garcia, C.L.; Suni, N.M.; Eskes, B. Characterization of Theobroma cacao L. collection at Tingo Maria using ISSR molecular markers. Rev. Aporte St. 2011, 4, 195–202. [Google Scholar]
  34. Chesnokov, Y.V.; Artemyeva, A.M. Evaluation of the measure of polymorphism information of genetic diversity. Agric. Biol. 2015, 5. [Google Scholar]
  35. Prevosti, A.; Ocana, J.; Alonso, G. Distances between populations of Drosophila subobscura, based on chromosome arrangement frequencies. Theor. Appl. Gene. 1975, 45, 231–241. [Google Scholar] [CrossRef]
  36. Kamvar, Z.N.; Tabima, J.F.; Grünwald, N.J. Poppr: An R package for genetic analysis of populations with clonal, partially clonal, and/or sexual reproduction. PeerJ 2014, 2, e281. [Google Scholar] [CrossRef] [PubMed] [Green Version]
  37. Pritchard, J.K.; Stephens, M.; Rosenberg, N.A.; Donnelly, P. Association mapping in structured populations. Am. J. Hum. Genet. 2000, 67, 170–181. [Google Scholar] [CrossRef] [PubMed] [Green Version]
  38. Evanno, G.; Regnaut, S.; Goudet, J. Detecting the number of clusters of individuals using the software STRUCTURE: A simulation study. Mol. Ecol. 2005, 14, 2611–2620. [Google Scholar] [CrossRef] [PubMed] [Green Version]
  39. Francis, R.M. pophelper: An R package and web app to analyse and visualize population structure. Mol. Ecol. Resour. 2017, 17, 27–32. [Google Scholar] [CrossRef] [PubMed] [Green Version]
  40. Caye, K.; Deist, T.M.; Martins, H.; Michel, O.; François, O. TESS3: Fast inference of spatial population structure and genome scans for selection. Mol. Ecol. Resour. 2016, 16, 540–548. [Google Scholar] [CrossRef]
  41. Waples, R.S.; Gaggiotti, O. What is a population? an empirical evaluation of some genetic methods for identifying the number of gene pools and their degree of connectivity. Mol. Ecol. 2006, 15, 1419–1439. [Google Scholar] [CrossRef] [PubMed]
  42. Frantz, A.C.; Cellina, S.; Krier, A.; Schley, L.; Burke, T. Using spatial Bayesian methods to determine the genetic structure of a continuously distributed population: Clusters or isolation by distance? J. Appl. Ecol. 2009, 46, 493–505. [Google Scholar] [CrossRef]
  43. Janes, J.K.; Miller, J.M.; Dupuis, J.R.; Malenfant, R.M.; Gorrell, J.C.; Cullingham, C.I.; Andrew, R.L. The K= 2 conundrum. Mol. Ecol. 2017, 26, 3594–3602. [Google Scholar] [CrossRef] [Green Version]
  44. Iorizzo, M.; Senalik, D.A.; Ellison, S.L.; Grzebelus, D.; Cavagnaro, P.F.; Allender, C.; Brunet, J.; Spooner, D.M.; Van Deynze, A.; Simon, P.W. Genetic structure and domestication of carrot (Daucus carota subsp. sativus) (Apiaceae). Am. J. Bot. 2013, 100, 930–938. [Google Scholar] [CrossRef]
  45. Arbizu, C.I.; Ellison, S.L.; Senalik, D.; Simon, P.W.; Spooner, D.M. Genotyping-by-sequencing provides the discriminating power to investigate the subspecies of Daucus carota (Apiaceae). BMC Evol. Biol. 2016, 16, 1–16. [Google Scholar] [CrossRef] [Green Version]
  46. Nei, M. Genetic distance between populations. Am. Nat. 1972, 106, 283–292. [Google Scholar] [CrossRef]
  47. Botstein, D.; White, R.L.; Skolnick, M.; Davis, R.W. Construction of a genetic-linkage map in man using restriction fragment length polymorphisms. Am. J. Hum. Genet. 1980, 32, 314–331. [Google Scholar]
  48. Dávila-Lara, A.; Affenzeller, M.; Tribsch, A.; Díaz and Comes, H.P. AFLP diversity and spatial structure of Calycophyllum candidissimum (Rubiaceae), a dominant tree species of Nicaragua’s critically endangered seasonally dry forest. Heredity 2017, 4, 275–286. [Google Scholar] [CrossRef] [PubMed] [Green Version]
  49. Montes, C.S.; Vidaurre, H.; Weber, J. Variation in stem-growth and branch-wood traits among provenances of Calycophyllum spruceanum Benth. from the Peruvian Amazon. New For. 2003, 26, 1–16. [Google Scholar] [CrossRef]
  50. Tuisima-Coral, L.L.; Hlásná Čepková, P.; Weber, J.C.; Lojka, B. Preliminary evidence for domestication effects on the genetic diversity of Guazuma crinita in the Peruvian Amazon. Forests 2020, 11, 795. [Google Scholar] [CrossRef]
  51. Eltaher, S.; Sallam, A.; Belamkar, V.; Emara, H.A.; Nower, A.A.; Salem, K.F.M.; Poland, J.; Baenziger, P.S. Genetic diversity and population structure of F3:6 nebraska winter wheat genotypes using genotyping-by-sequencing. Front. Genet. 2018, 9, 76. [Google Scholar] [CrossRef] [PubMed]
  52. Hennink, S.; Zeven, A.C. The interpretation of Nei and Shannon-Weaver within population variation indices. Euphytica 1990, 51, 235–240. [Google Scholar] [CrossRef]
  53. Rosyara, U.R.; De Jong, W.S.; Douches, D.S.; Endelman, J.B. Software for genome-wide association studies in autopolyploids and its application to potato. Plant Gen. 2016, 9. [Google Scholar] [CrossRef] [PubMed] [Green Version]
  54. Campoy, J.A.; Lerigoleur-Balsemin, E.; Christmann, H.; Beauvieux, R.; Girollet, N.; Quero-García, J.; Dirlewanger, E.; Ba reneche, T. Genetic diversity, linkage disequilibrium, population structure and construction of a core collection of Prunus avium L. landraces and bred cultivars. BMC Plant Biol. 2016, 16, 1–15. [Google Scholar] [CrossRef] [Green Version]
  55. Lee, K.J.; Lee, J.-R.; Sebastin, R.; Shin, M.-J.; Kim, S.-H.; Cho, G.-T.; Hyun, D.Y. Assessment of genetic diversity of tea germplasm for its management and sustainable use in Korea genebank. Forests 2019, 10, 780. [Google Scholar] [CrossRef] [Green Version]
  56. González, N.A. Identificación y Validación de Single Nucleotide Polymorphism (SNPs) Distribuidos en el Genoma de Eucalyptus globulus. Master’s Thesis, Universidad de Concepción, Concepción, Chile, 2015. [Google Scholar]
  57. Durán Reyes, R.F. Modelos de Predicción Genómicos para la Selección de Genotipos de Eucalyptus globulus en Base a Densidad de la Madera y Volumen. Ph.D. Thesis, Universidad de Concepción, Concepción, Chile, 2017. [Google Scholar]
  58. Liu, C.; Dou, Y.; Guan, X.; Fu, Q.; Zhang, Z.; Hu, Z.; Zheng, J.; Lu, Y.; Li, W. De novo transcriptomic analysis and development of EST-SSRs for Sorbus pohuashanensis (Hance) Hedl. PLoS ONE 2017, 12, e0179219. [Google Scholar] [CrossRef] [PubMed] [Green Version]
  59. Tian, X.; Zheng, J.; Jiao, Z.; Zhou, J.; He, K.; Wang, B.; He, X. Transcriptome sequencing and EST-SSR marker development in Salix babylonica and S. suchowensis. Tree Genet. Genomes 2019, 15, 9. [Google Scholar] [CrossRef]
  60. Wu, Q.; Zang, F.; Xie, X.; Ma, Y.; Zheng, Y.; Zang, D. Full-length transcriptome sequencing analysis and development of EST-SSR markers for the endangered species Populus wulianensis. Sci. Rep. 2020, 10, 1–11. [Google Scholar] [CrossRef]
Figure 1. Dendrogram based on Provesti’s genetic distance and the UPGMA clustering method of 59 samples of capirona using 10 RAPD markers. Numbers above the branches represent bootstrap values, with only values higher than 70% shown.
Forests 12 01125 g001
Figure 2. (a) Principal coordinate analysis (PCoA) of 59 samples of capirona from the eastern region of the Peruvian Amazon based on RAPD markers. Percentages of total variance explained by each coordinate are noted in parentheses. Population symbols and colors indicate geographic affiliation. (b) Discriminant analysis of principal components (DAPC) of 59 samples of capirona. The axes represent the first two linear discriminants (LD). Each circle represents a cluster and each symbol represents an individual. Numbers represent the different clusters identified by DAPC.
Forests 12 01125 g002
Figure 3. Population structure of 59 samples of capirona inferred by the STRUCTURE analysis using 10 RAPD markers.
Forests 12 01125 g003
Table 1. Codes and geographic information of the 59 samples of capirona from the Peruvian Amazon characterized in this study.
CodeRegionDepartmentLatitude LongitudeCodeRegionDepartmentLatitude Longitude
cap018IrazolaUcayali8°51′ S75°7′ Wcap057LBSSan Martín6°28′ S76°20′ W
cap019IrazolaUcayali8°51′ S75°7′ Wcap058LBSSan Martín6°28′ S76°20′ W
cap020IrazolaUcayali8°51′ S75°7′ Wcap059LBSSan Martín6°28′ S76°20′ W
cap021IrazolaUcayali8°51′ S75°7′ Wcap060LBSSan Martín6°28′ S76°20′ W
cap022IrazolaUcayali8°51′ S75°7′ Wcap061LBSSan Martín6°28′ S76°20′ W
cap023IrazolaUcayali8°51′ S75°7′ Wcap062LBSSan Martín6°28′ S76°20′ W
cap024IrazolaUcayali8°51′ S75°7′ Wcap063LBSSan Martín6°28′ S76°20′ W
cap030MasiseaUcayali8°41′ S73°37′ Wcap064LBSSan Martín6°28′ S76°20′ W
cap031MasiseaUcayali8°42′ S73°40′ Wcap065LBSSan Martín6°28′ S76°20′ W
cap032MasiseaUcayali8°42′ S73°40′ Wcap066LBSSan Martín6°28′ S76°20′ W
cap033MasiseaUcayali8°43′ S73°40′ Wcap067LBSSan Martín6°28′ S76°20′ W
cap034MasiseaUcayali8°43′ S73°40′ Wcap068LBSSan Martín6°28′ S76°20′ W
cap035MasiseaUcayali8°43′ S73°40′ Wcap069LBSSan Martín6°28′ S76°20′ W
cap037MasiseaUcayali8°49′ S73°44′ Wcap070IñapariMadre de Dios10°60′ S69°53′ W
cap038MasiseaUcayali8°50′ S73°45′ Wcap071IñapariMadre de Dios10°60′ S69°53′ W
cap039MasiseaUcayali8°50′ S73°47′ Wcap072IñapariMadre de Dios10°57′S69°54′ W
cap042MasiseaUcayali8°50′ S73°47′ Wcap073IñapariMadre de Dios10°59′ S69°53′ W
cap043MasiseaUcayali8°50′ S73°47′ Wcap074IñapariMadre de Dios10°59′ S69°54′ W
cap044MasiseaUcayali8°50′ S73°47′ Wcap075IñapariMadre de Dios10°59′ S69°53′ W
cap045MasiseaUcayali8°53′ S73°52′ Wcap076IñapariMadre de Dios10°58′ S69°53′ W
cap046MasiseaUcayali8°53′ S73°52′ Wcap078IñapariMadre de Dios10°58′ S69°54′ W
cap047MasiseaUcayali8°40′ S74°11′ Wcap079IñapariMadre de Dios10°58′ S69°54′ W
cap048MasiseaUcayali8°41′ S74°12′ Wcap080IñapariMadre de Dios10°58′ S69°54′ W
cap049MasiseaUcayali8°41′ S74°12′ Wcap081IñapariMadre de Dios10°58′ S69°54′ W
cap050LBSSan Martín6°28′ S76°20′ Wcap082IñapariMadre de Dios10°58′ S69°54′ W
cap051LBSSan Martín6°28′ S76°20′ Wcap084IñapariMadre de Dios10°58′ S69°54′ W
cap052LBSSan Martín6°28′ S76°20′ Wcap085IñapariMadre de Dios10°60′ S69°53′ W
cap053LBSSan Martín6°28′ S76°20′ Wcap086IñapariMadre de Dios11°0′ S69°53′ W
cap054LBSSan Martín6°28′ S76°20′ Wcap087IñapariMadre de Dios11°0′ S69°53′ W
cap055LBSSan Martín6°28′ S76°20′ W
Table 2. Genetic diversity based on 10 RAPD markers among four clusters inferred by the STRUCTURE analysis.
ClusterNHLambdaHePICPPL
161.790.830.120.2051.08%
2182.890.940.30.2983.33%
3192.940.950.410.3896.24%
4162.770.940.290.2083.33%
Total594.080.980.41
N: population size, H: Shannon–Wiener index of diversity, Lambda: Simpson’s index, He: Nei’s 1978 expected heterozygosity, PIC: polymorphic information content, PPL: percentage of polymorphic loci.
Table 3. The Fst values among the four clusters inferred by STRUCTURE analysis.
Cluster1234
1
20.182
30.1980.125
40.2690.1670.123
Table 4. Analysis of molecular variance (AMOVA) using 10 RAPD markers of the genetic variation of 59 samples of capirona among the four clusters inferred by STRUCTURE analysis.
SourcedfSSMSEst.Var.%
Between clusters3584.14194.7111.6928.44%
Within clusters551617.0129.4029.471.56%
Total582201.1537.9541.09100.00%
Publisher’s Note: MDPI stays neutral with regard to jurisdictional claims in published maps and institutional affiliations.

