
Predicting Suitable Environments and Potential Occurrences for Cinnamomum camphora (Linn.) Presl.

1
College of Horticulture and Plant Protection, Yangzhou University, Yangzhou 225009, China
2
Joint International Research Laboratory of Agriculture and Agri-Product Safety, The Ministry of Education of China, Yangzhou University, Yangzhou 225009, China
*
Author to whom correspondence should be addressed.
Forests 2021, 12(8), 1126; https://doi.org/10.3390/f12081126
Submission received: 15 July 2021
/
Revised: 11 August 2021
/
Accepted: 19 August 2021
/
Published: 22 August 2021
(This article belongs to the Special Issue Advances in Decision Support for Forest Management and Policy Formulation)
Abstract
:Global climate change has created a major threat to biodiversity. However, little is known about the habitat and distribution characteristics of Cinnamomum camphora (Linn.) Presl., an evergreen tree growing in tropical and subtropical Asia, as well as the factors influencing its distribution. The present study employed Maxent and a GARP to establish a potential distribution model for the target species based on 182 known occurrence sites and 17 environmental variables. The results indicate that Maxent performed better than GARP. The mean diurnal temperature range, annual precipitation, mean air temperature of driest quarter and sunshine duration in growing season were important environmental factors influencing the distribution of C. camphora and contributed 40.9%, 23.0%, 10.5%, and 7.2% to the variation in the model contribution, respectively. Based on the models, the subtropical and temperate regions of Eastern China, where the species has been recorded, had a high suitability for this species. Under each climate change scenario, the potential geographical distribution shifted farther north and toward a higher elevation. The predicted spatial and temporal distribution patterns of this species can provide guidance for the development strategies for forest management and species protection.
1. Introduction
Climate has been considered as a major factor influencing the distribution of many species on a large scale [1,2]. Global climate change has changed the distribution and frequency of many species over the past several decades, and in the meantime, led to the extinction or local extirpation of many species [1,3,4]. The potential threats that may alter the frequency and distribution of some species could be addressed through predictions about the impact of climate changes on the spatial distribution of the habitat for specific species at a landscape scale [5]. Thus, obtaining high quality distribution data is crucial to setting priorities and implementing efficient protective measures. Meanwhile, the Wallacean shortfall, namely, the insufficiency of biogeographical information, usually obstructs many types of conservation efforts [6,7,8].
Ecological niche modelling (ENMs) affords an important method that can be used to fil this gap as well as to facilitate research related to ecology, conservation, and evolution [4,9,10,11]. Multiple ENMs, including CLIMEX, Maxent, ecological niche factor analysis, genetic algorithm for rule-set prediction (GARP), and a bioclimatic prediction system, have been applied to predict the distribution area, ecological response, and ecological requirement for numerous species [12,13,14,15,16,17]. As a general rule, such models varied greatly in the selection of predictors (physiological restrictions on the mechanistic method/climatic empirical method) as well as species records (presence alone or presence/absence data) [15,18,19,20,21]. Previous studies indicated that Maxent and GARP had a better predictive accuracy than other ENMs (see Elith et al. [22] and Hernandez et al. [23] for more details). In addition, those two models also use the combination of known occurrence data and the pseudo-absence data which were resampled using the set of pixels indicating where the species under discussion is believed to not occur [15,22].
Cinnamomum camphora (Linn.) Presl. (Lauraceae) is an evergreen tree growing in tropical and subtropical Asia, mainly in Japan, Korea, and Vietnam [24]. The species provides the major source of camphor, which people commonly use as a stimulant, antispasmodic, antiseptic, and rubefacient in clinical practice [25]. Camphora can also be used in the manufacturing of celluloid. The light brown wood of C. camphora has an elegant grain and can be easily polished for the use in furniture, cabinets, and the interior decoration of buildings [24]. Previous studies of this species mainly focused on the anti-inflammatory and anti-oxidative effects [25], micropropagation [26], and camphor composition [27] of the products of this species. The only research on the suitable habitat of C. camphora we know was conducted by Zhang et al. [28], who predicted the suitable habitats of C. camphora based on 149 valid distribution records and 19 bioclimatic variables. However, variables that could influence the results of suitable habitats, such as soil pH, soil organic carbon, relative humidity, and sunshine duration during the growing season, were not included in their analysis. Furthermore, the model performance might be different between different ENMs; however, Zhang et al. [28] only used a single model, i.e., Maxent. Exploration into the relationship between C. camphora and environment variables along with associated factors influencing its distribution has great significance and would also help land use planners and managers.
In this study, Maxent and GARP modeling were employed to predict the distribution of C. camphora, to determine the distribution characteristics of the habitat for this species, and to identify the relevant factors that influence the appropriateness of its habitat. Our research goals included: (1) to determine which environmental factors affect the distribution of C. camphora; (2) to explore how climate change generates certain impacts on characteristics of the distribution of its habitat. The results will provide a theoretical reference framework related to the use, management, and cultivation of C. camphora.
2. Materials and Methods
2.1. Occurrence Records Collection
Point location data for this species were acquired from several online herbaria databases, including Tropicos (http://www.tropicos.org/ (accessed on 14 January 2019)), the Global Biodiversity Information Facility (http://www.gbif.org (accessed on 23 March 2019), and the Plant Photo Bank of China (PPBC; http://ppbc.iplant.cn/ (accessed on 14 January 2019)). Among them, the PPBC database stores distribution records based on collections in the main herbaria in China. To reduce the sampling bias of the database, and to verify the location data related to the distribution of C. camphora, field investigations were conducted by visiting 20 locations randomly selected from the database. Thereafter, to reduce overfitting to sampling bias in ecological niche models, only one point was projected within every 10 km × 10 km grid cell [5]. Ultimately, 182 non-repeating geo-referenced occurrence records were gathered in this work.
2.2. Environmental Variables
We selected 28 environmental variables that probably influenced the distribution of C. camphora (Table 1). These included 19 climatic variables with a 30 s spatial resolution collected via World Climate Database (www.worldclim.org, accessed on 16 October 2017) [29]. In addition, three topographic variables were selected, namely, slope degree, aspect, and elevation, which were acquired using the DEM (20 × 20 m2 resolution) via Geospatial Data Cloud, and three soil variables, namely, soil type, pH, as well as organic carbon content, provided by the Center for Sustainability and the Global Environment. Additionally, data concerning NDVI, relative humidity, and sunshine duration during growing season were obtained from the China Meteorological Data Sharing Service System.
To simulate the future distribution of this species, BCC-CSM1.1 data were acquired from the RCPs 2.6 and 8.5 for 2050 and 2070 published through the United National International Panel on Climate Change Assessment Report 5 (AR5). The BCC-CSM1.1 has been recommended to be applied to research about climate changes in China and for short-term climate forecasts [30]. The RCP 2.6 reveals an optimistic result of potential radiative forcing until 2100 in contrast to pre-industry +2.6 W/m2 values, while RCP 8.5 is one more pessimistic scenario that shows the high level of greenhouse gas emissions with radiative forcing at 8.5 W/m2 till 2100 [30]. Remaining variables were not altered for SDM analysis under future climate forecast scenarios.
Every bioclimatic layer was converted to a resolution of 1 km. Every environmental layer was treated with the system containing an identical projection, cell size, and extent (WGS84 Longitude–Latitude projection) under ArcGIS 10.1 (ESRI, Redlands, CA, USA). To test for variable multicollinearity, Pearson correlation coefficient was used along with principal component analysis. Only one parameter was chosen for those having a relatively high cross-correlation (r2 > 0.90) [31] according to its biological significance for C. camphora. Finally, the final predicting factors were reduced to 17 by eliminating those that were closely correlated (Table 1).
2.3. Model Simulation
Desktop GARP version 1.1.3 [32] and Maxent version 3.3.3k [20] were applied for model construction based on environmental variables and species records. The same models and procedures were also used by Zhang et al. [5]. These two models were selected because they are two common niche-based modeling approaches that adopt presence-only data. Previous studies demonstrated that they had better performances than other models [18,19,20,21]. Both models use artificial intelligence to evaluate the potential geographical distribution, and require location information and pseudo-absence (for Maxent) or background (GARP) data during the construction of models [11,13]. However, they differ in their operating principle. Maxent, a generalized linear model, generates the model through seeking the nearest uniform distribution (maximum entropy) subject to the constraints of environmental variable input [20]. In contrast, GARP, a kind of machine-learning method, employs a set of conditional rules that were originally developed iteratively for the selection, assessment, testing, incorporation, or rejection of rules [21].
Under Maxent, 25% of the occurrence data were employed for evaluating model capacity, while the remaining 75% was used for training. We tested various regularization multiplier values, and found that the default (i.e., 1) value performed best; that is, the default value provided the best representation of the current distribution of C. camphora without over-fitting the model (see Merow et al. [33] for more details). A total of ten replicates were generated in each training partition, and the results were averaged. These models were operated based on default features with a maximum of 500 iterations and a convergence threshold of 0.00001. Predicted areas containing clamping needing to be wiped out through a fade were realized by a clamping function. The same subsets employed for Maxent were used for GARP. The best subset selection procedure was adopted with 1000 maximum iterations, a convergence limit as 0.01, and 20 ran every model. Other default parameters were maintained for both Maxent and GARP [34]. Both intrinsic testing features and “best subsets” procedures were activated for selecting the top ten models. Corresponding criteria of selection were omission errors with a minimum of 20% and commission errors at a default value of 50%. At the end of the iteration, the GARP and Maxent models were both mapped to climate change scenario-related datasets. Next, we classified the frequency distribution produced by Maxent and GARP into five groups using the natural Jenks distribution available in ArcGIS. Every pixel of the potential distribution map related to C. camphora was sorted from 0 to 1; the pixels were, subsequently, divided into four classes of potential habitat as follows: ‘high potential’ (>0.6), ‘moderate potential’ (0.4–0.6), ‘low potential’ (0.2–0.4) and ‘not potential’ (<0.2) habitat. For potential habitat under climate change scenario, we cross-checked the suitable areas against the current habitat of C. camphora to determine the regions that became unsuitable (decreased), suitable (increased), and unchanged; then, we calculated and illustrated the increased, suitable, and unchanged areas in the map.
2.4. Model Evaluation
The Maxent output patterns could be interpreted using a response curve. The significance of every variable to Maxent predictions could be checked by using a Jackknife test. These models were assessed by a true skill statistic (TSS) [35] as well as an area under the receiver operating characteristic curve (AUC) [36]. The AUC values fell within the scope of 0–1. An AUC value of about 0.5 suggested that distribution model may not be superior to a random model in prediction effects, while a value of about 1 meant that the observations about species distribution were in good agreement with relevant predictions. The distribution model with a value above 0.7 showed high acceptance. The TSS statistically depends on a threshold, within a range of −1 to 1 [37]. A negative TSS value or one that was close to 0 meant that the distribution model was not superior to a random model. Comparatively, TSS value of +1 suggested that the observed and forecast distribution were consistent. The TSS and AUC were measured under ten models using each algorithm. The results of the GARP and Maxent models were compared in performance by a one-tailed Wilcoxon signed-rank test.
3. Results
3.1. Model Accuracy and Comparison
The AUC, Kappa, and TSS values under Maxent and GARP all exceeded 0.89, proving the fine performance of these two models. As shown by the one-tailed Wilcoxon signed-rank test results, the AUC, Kappa and TSS scores under the Maxent model seemed obviously greater compared with those under the GARP model (Table 2), verifying the superiority of the Maxent model to GARP. In addition, Maxent and GARP had the same sensitivity (0.94), with a specificity higher for Maxent (0.93) compared with GARP (0.87).
3.2. Potential Suitable Distribution of Cinnamomum camphora
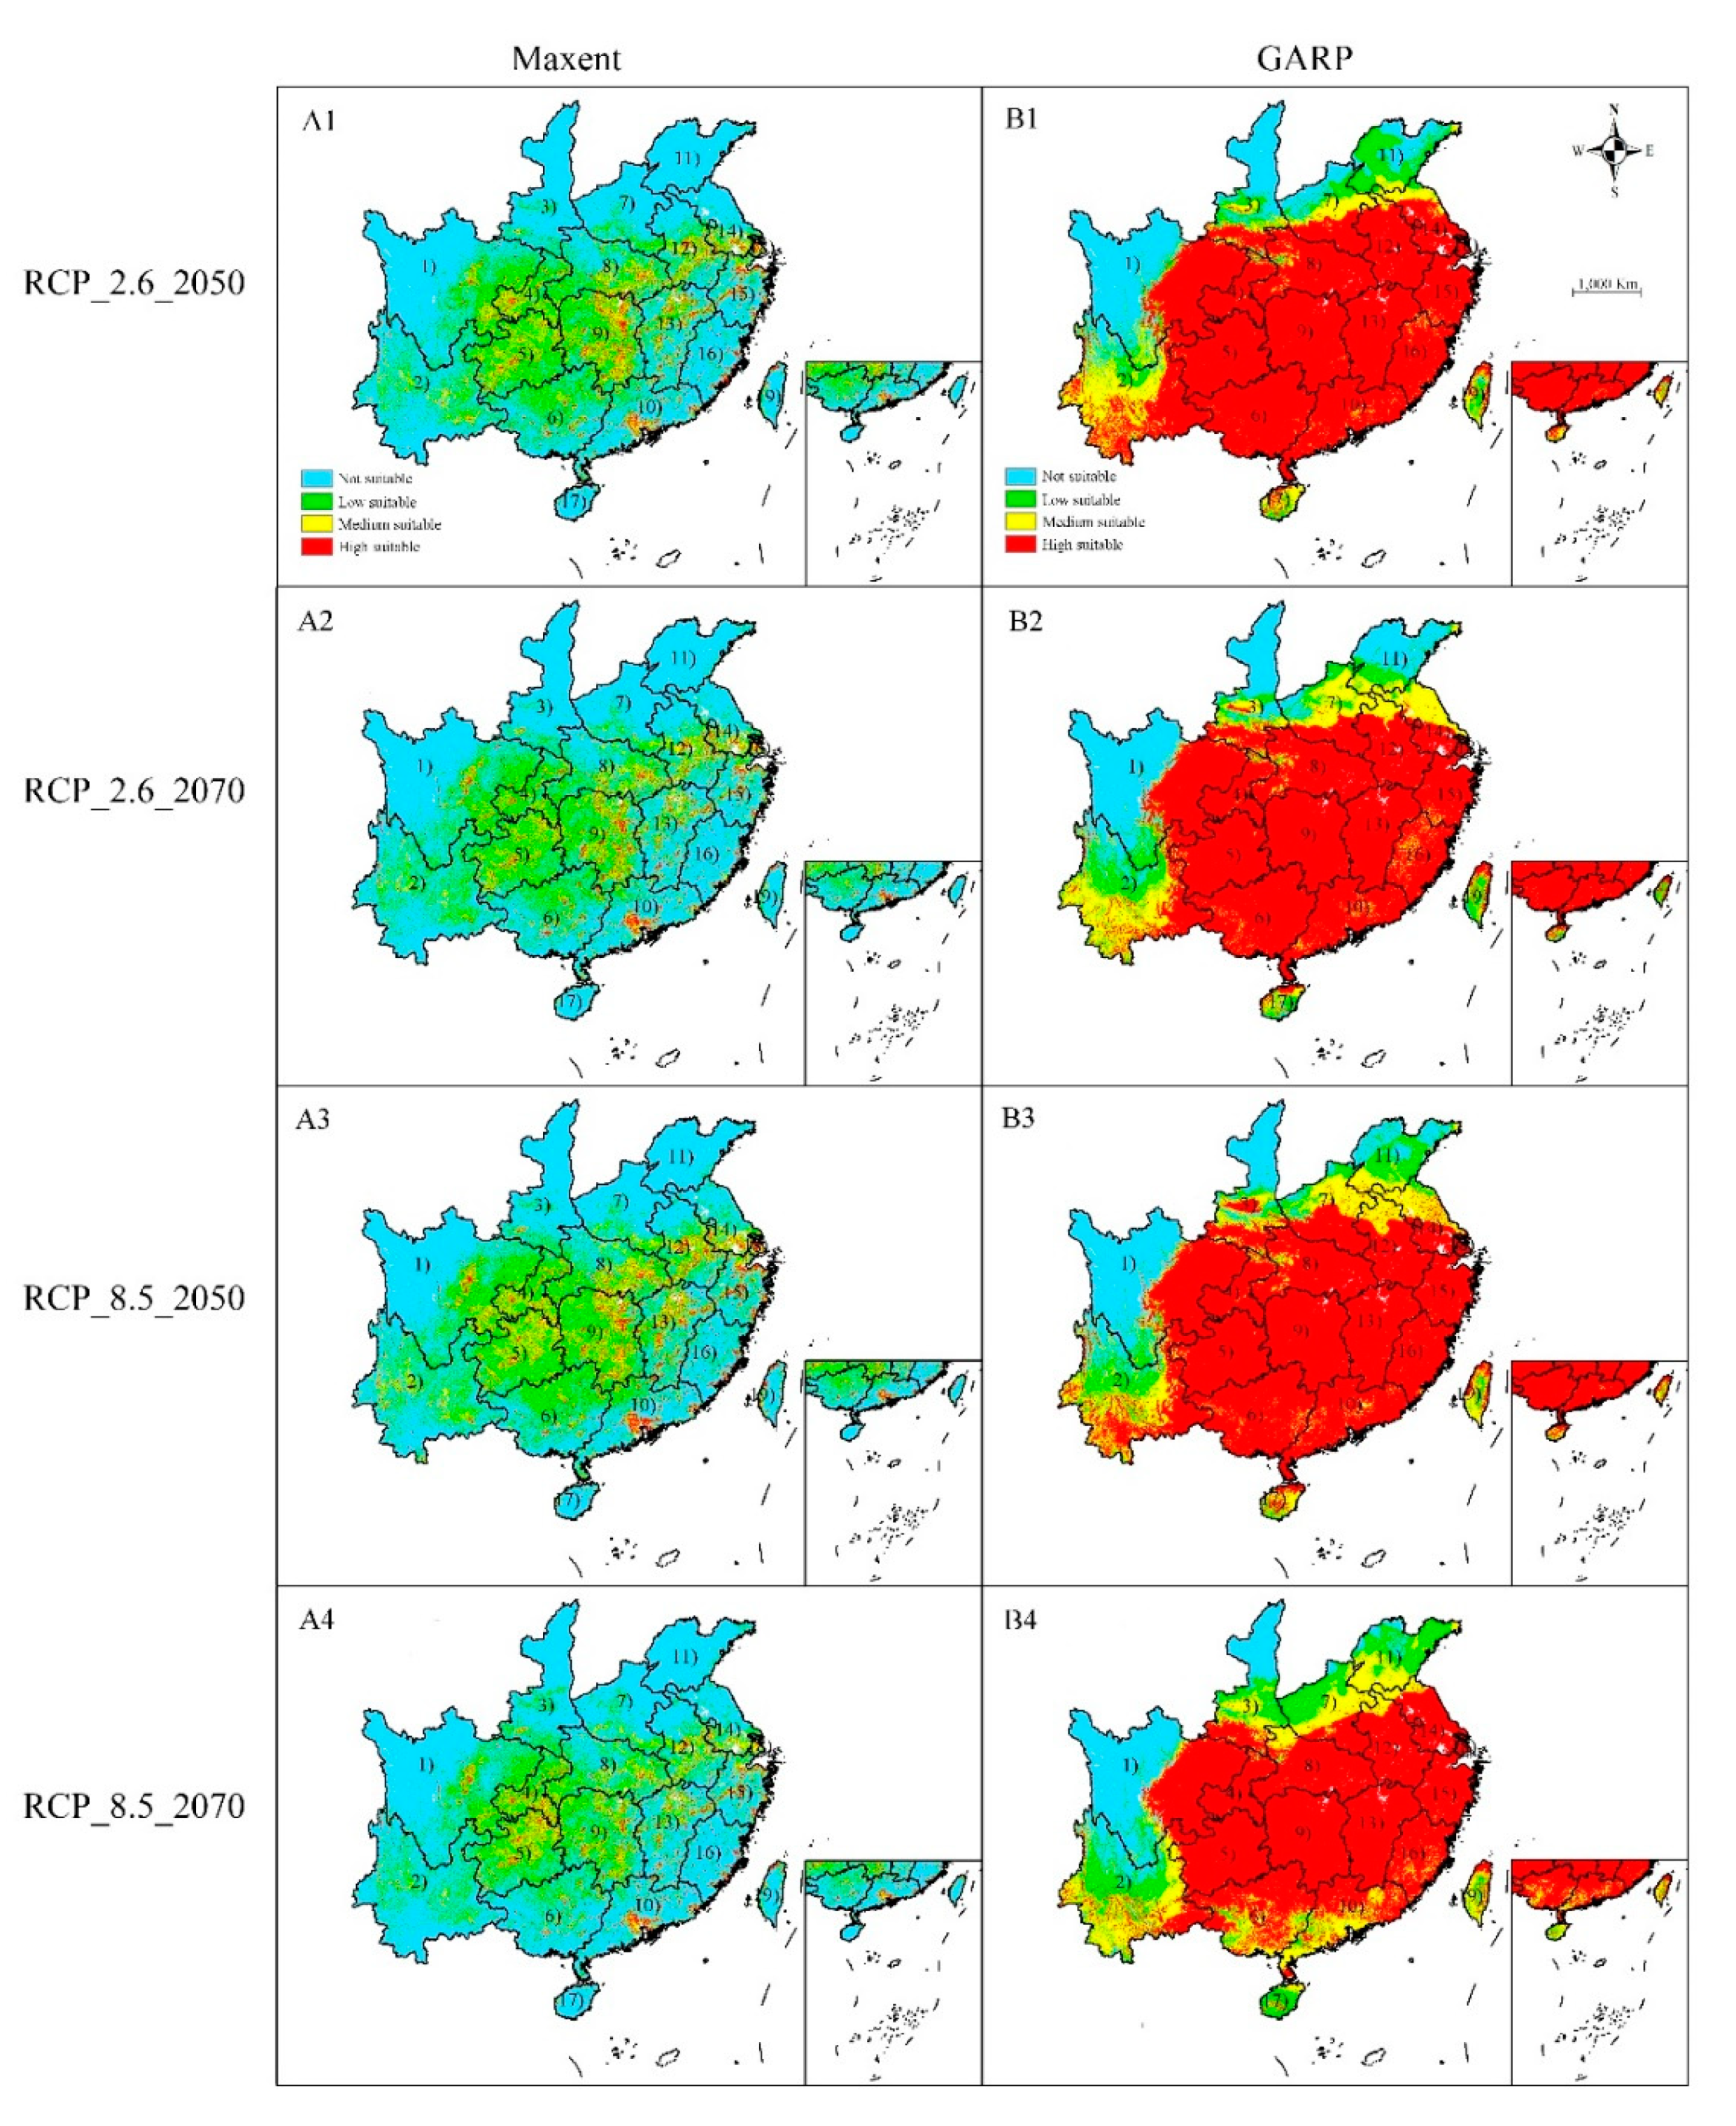
The climatic conditions in most regions of Southeastern China, including Eastern Sichuan, Hubei, Anhui, Zhejiang, Jiangxi, Hunan, Guizhou, Yunnan, Guangxi, and Guangdong, were for the distribution of C. camphora (Figure 1). However, the two models predicted an inconsistent distribution pattern: GARP predicted the habitat would be suitable in vast regions across Jiangsu, Anhui, Fujian, and Guangdong, while Maxent predicted moderate suitability in the same areas. Likewise, GARP forecast the highly suitable distribution areas were continuous and widespread, while Maxent forecast the areas these would be scattered and small.
3.3. Environmental Variables That Determined the Distribution of Cinnamomum camphora
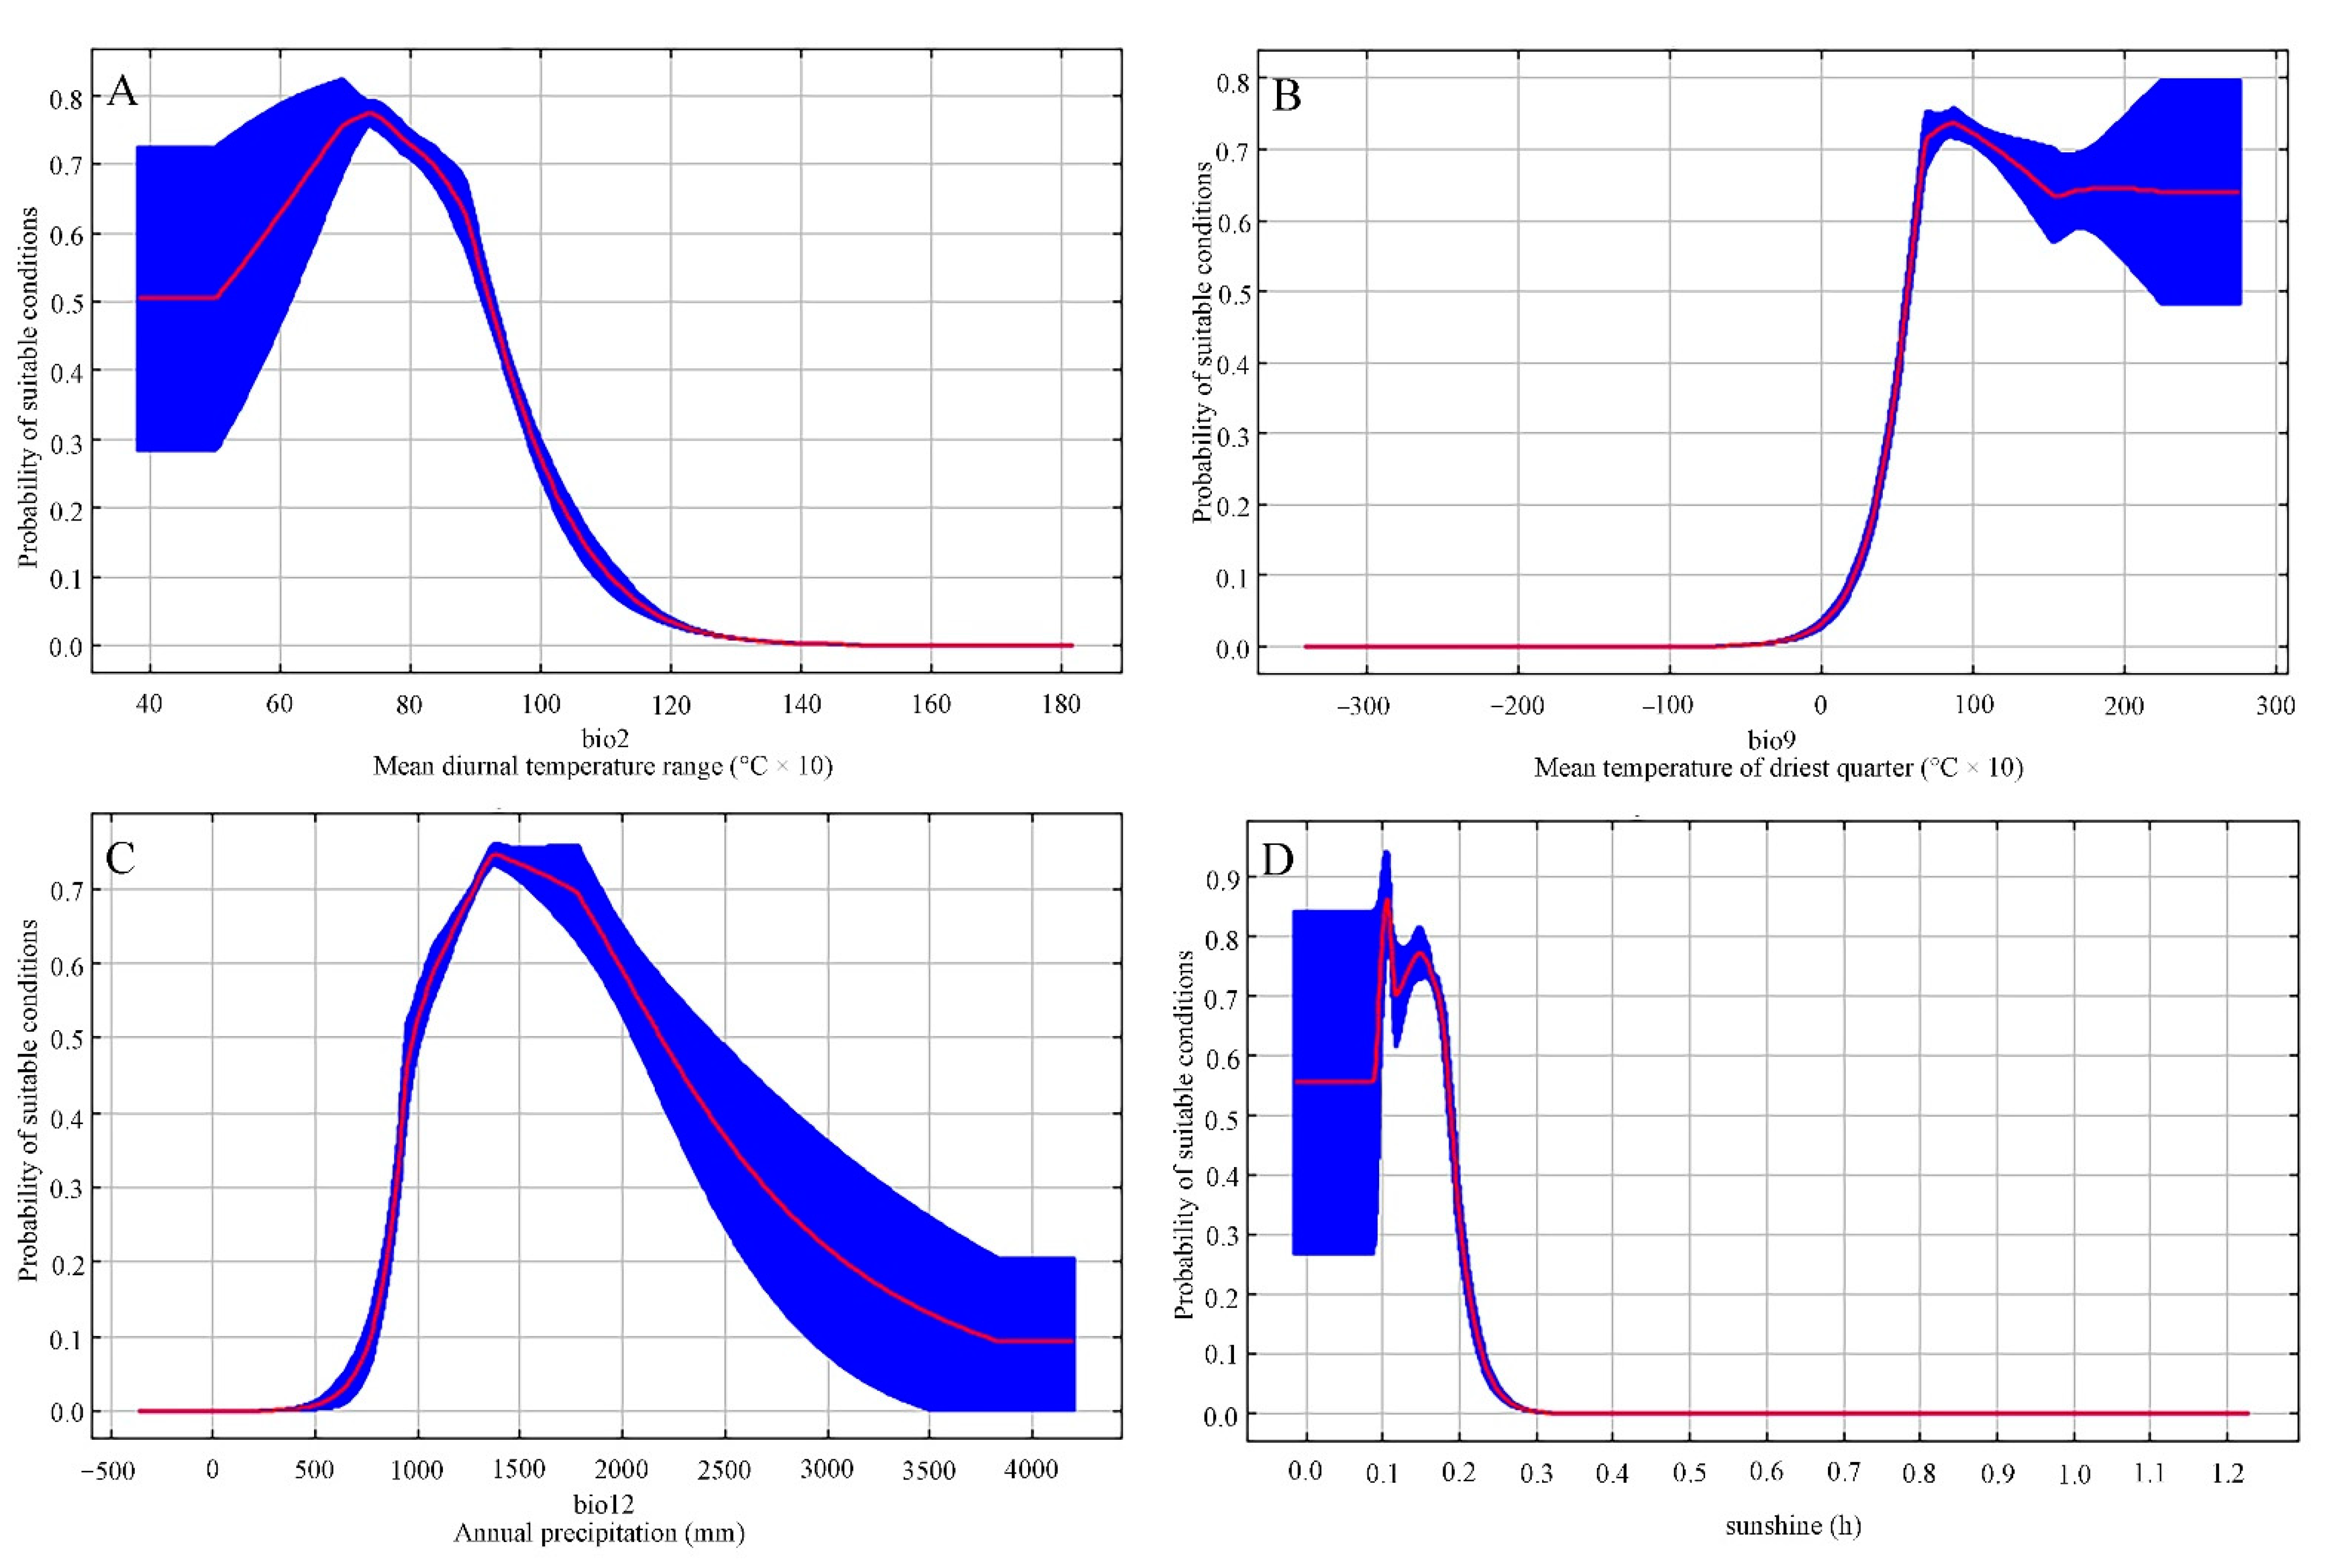
Environmental variables which had maximum contributions to the construction of the C. camphora distribution model using the Maxent method were mean diurnal temperature range (40.9% contribution), annual precipitation (Bio 12, 23.0% contribution), mean air temperature of the driest quarter (Bio 9, 10.5% contribution), and sunshine duration in the growing season (SDGH, 7.2% contribution). The cumulative contribution of the above-mentioned four environmental parameters was 81.6%, showing their significant contribution to the distribution of C. camphora. In accordance with such standard curves concerning the C. camphora distribution model (Figure 2), the leading parameter thresholds were obtained (at an occurrence probability >0.3), Bio 2 of 4–10, Bio 9 of 4–20 °C, Bio 12 of 900–2500 mm, and SDGH of 100–200 h included.
3.4. Variations of Future Habitat with Appropriate Spatial Extent
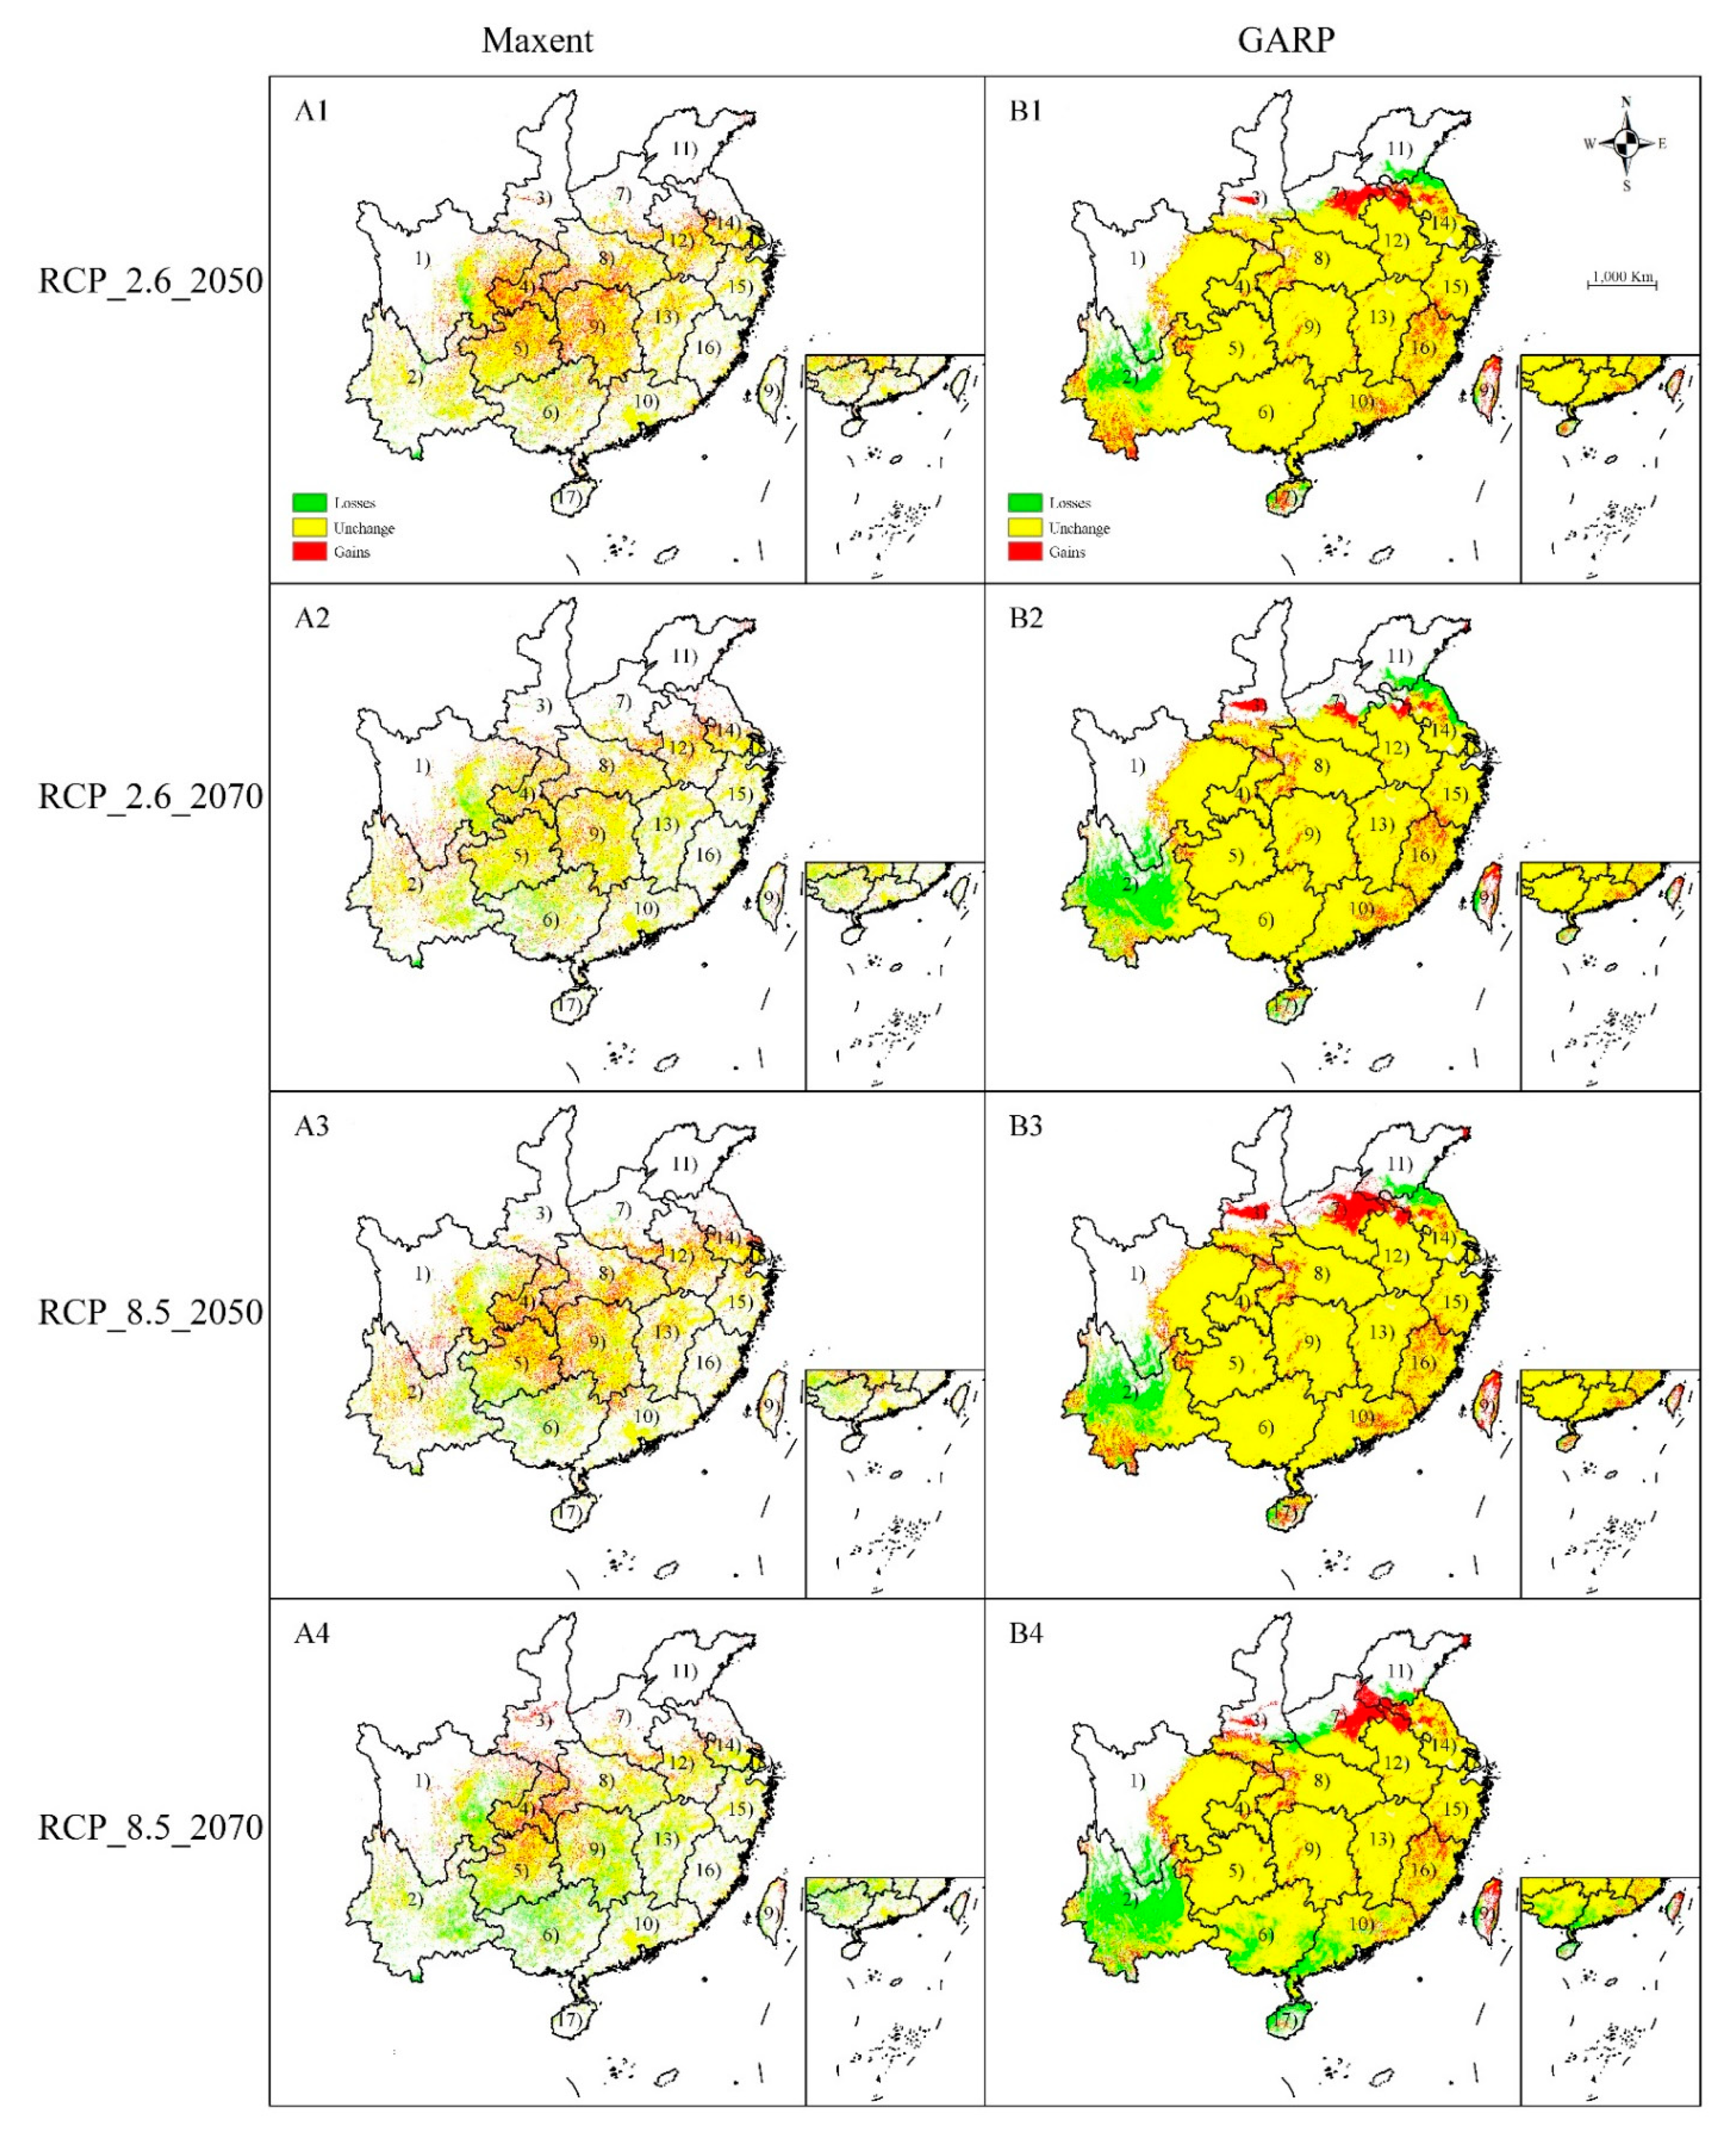
Under the RCP 2.6-2050 climate scenario, Maxent predicted that locations with an increase in the spatial extent of suitable habitats for C. camphora would be found in Chongqing, Hunan, Guizhou, South Hubei, and Central Henan (Figure 3 and Figure 4(A1)), with an increased area of 1.93 × 10⁵ km2. Additionally, future losses in the spatial extent of an appropriate habitat totaling ca. 0.54 × 10⁵ km2 were forecast to occur in Central Sichuan. Subject to RCP 2.6–2070 climate scenario, Maxent predicted the total increased area of distribution might reach 1.22 × 10⁵, while the spatial extent of suitable habitats would continually decline to ca. 0.86 × 10⁵ km2. Under RCP 2.6-2050 and -2070 climate scenarios, GARP forecast losses in the spatial extent of a suitable habitat would be ca. 1.21 × 10⁵ km2 and 2.04 × 10⁵ km2, respectively, across Yunnan and North Jiangsu (Figure 3 and Figure 4(A1,A2)). Meanwhile, the increased spatial extent of a suitable habitat would be approximately ca. 1.06 × 10⁵ km2 and 0.85 × 10⁵ km2 in RCP 2.6-2050 and -2070 climate scenarios, respectively, across Henan and Shanxi (Figure 3 and Figure 4(A1,A2)). In general, in the RCP 2.6 climate scenario, Maxent predicted an increase in the spatial extent of areas of distribution, but GARP predicted increases in 2050 but reduced distribution areas in 2070. However, Maxent and GARP models unanimously forecast a northward shift of distribution areas (Figure 3 and Figure 4).
In the RCP 8.5 climate scenario, Maxent and GARP forecast that areas with changes were in the same provinces as those in the RCP 2.6 climate scenario (Figure 3 and Figure 4) and the distribution shift was very similar. Maxent forecast that areas of increased suitability reached ca. 1.79 × 10⁵ km2 and 1.46 × 10⁵ km2 in RCP 8.5-2050 and -2070 climate scenarios, respectively, and GARP forecast increased areas reached 1.12 × 10⁵ km2 and 1.08 × 10⁵ km2 in RCP8.5-2050 and -2070 climate scenarios, respectively. Maxent forecast reduced areas reached ca. 0.73 × 10⁵ km2 and 1.93 × 10⁵ km2 in RCP 8.5-2050 and -2070 climate scenarios, respectively, and GARP forecast reduced areas reached 1.78 × 10⁵ km2 and 3.06 × 10⁵ km2 in RCP8.5-2050 and -2070 climate scenarios, respectively.
4. Discussion
4.1. Model Performance
As demonstrated by previous research results, model performance differs among various ENMs due to the sampling size, research area, species modelled [15,22]. Due to the changes in each prediction, it was difficult to identify an “optimal” modelling method. Elith et al. [22] proved Maxent performed optimally with AUC values close to 1.0. Comparatively, GARP had a poor performance with low AUC values. However, Peterson et al. [15] suggested GARP had a stronger predictive ability when compared with Maxent in forecasting species distribution. In the present study, it was observed that both Maxent and GARP have high AUC, Kappa, and TSS values. The results from all of those three evaluation indexes indicated both models had a good predictive power. Furthermore, although those three indexes of Maxent were statistically significantly higher than GARP, the size of this difference was relatively small. Therefore, we conclude that the performance of both models was roughly the same. However, from the geographic perspective, GARP predicted a large area to highly suitable for C. camphora, which were marginally predicted by Maxent. Further, the suitable habitat predicted by GARP was continuous and covered a large area; however, the suitable habitat predicted by Maxent was scattered and covered a relatively small area. Even if GARP had a rather wide range of prediction and Maxent underestimated the distribution of C. camphora particularly across Jiangsu, Zhejiang, and Fujian, these two models both plotted maps conforming to the known distribution of these species. A similar finding was obtained in the works of Elith et al. [22] and Hernandez et al. [23]. Our results were similar with a previous study [28]. Such differences may have occurred because Maxent and GARP have basic differences. GARP tends to result in models with a large number of commission errors than Maxent, i.e., GARP would predict a large suitable habitat area [37]. Those high commission errors were derived from sites with a possibly appropriate habitat where the species was predicted to be present, but where presence could not be illustrated since the species were not confirmed to exist there [5]. The use of a consistent prediction allows for the identification of inconsistencies between the modeling methods. Moreover, the differences between Maxent and GARP suggest that the actual underlying species distribution is not well understood. It will be necessary to develop further refinements for the establishment of an objective framework, so that consensual modeling methods can be used [22].
4.2. Environment Factors That Influence the Distribution of C. camphora
A major concern related to evolution and ecology should be factors that affect and maintain the geographic distribution of a species [38,39,40,41,42]. For 17 environmental variables employed in the current model, the variables that were able to best explain the environmental requirements of a species were two temperature-related variables, one precipitation-related variable, and one light-related variable, namely, the mean diurnal temperature range (40.9% contribution), annual precipitation (Bio 12, 23.0% contribution), and mean air temperature of the driest quarter (Bio 9, 10.5% contribution).
The ranges of mean diurnal temperature and mean air temperature of the driest quarter were 4–10 °C and 4–20 °C, the driest quarter occurred in winter in Eastern China. Such a small range of diurnal temperature and high mean air temperature of the driest quarter was consistent with the distribution of C. camphora that generally recorded the regions with a warm climate [24]. Previous literature has proven that low temperature negatively affects the emergence and death of C. camphora seedlings [42,43]. These hydrothermal factors probably affect C. camphora by affecting its ecological adaptability and distribution.
In addition to temperature, the fitness of a species can also be influenced by annual precipitation. The optimal annual precipitation suited to C. camphora growth fell in the range of 900 to 2500 mm. Precipitation, as a major environmental variable, is related to plant growth, and also to seedling survival and growth. The water balance in plants will be destroyed by excessive water in the soil; thus, influencing the metabolism and morphology of plants and limiting plant growth [44,45,46,47]. Additionally, annual precipitation is related to a variety of environmental factors affecting the biochemical and physiological processes of plants. Previous studies have shown that the contents of protein, soluble sugar, and MDA increased with an increasing time of drought stress, and POD activities of C. camphora were enhanced [45]. However, C. camphora cannot survive in semi-desert and desert environments, which was also described in our models. Therefore, C. camphora should be planted in an area with suitable soil moisture, so that the growth of C. camphora will not be influenced by drought stress.
It is important to note that the niche described by ENMs were not the realized niche but a fundamental niche [15]. A fundamental niche is composed of various conditions which conform to supporting the long-term existence of a certain species. The realized niche, which is a fundamental niche subset practically taken by a certain species, is smaller. Many factors that can influence the dimensions of the realized niche, such as recent human activities, geographical barriers, and biotic interactions (parasites, predators, or competitors), are likely to be neglected in the prediction of the potential geographical distribution. Therefore, besides the environmental variables we used in the present study, by some other factors, such as the natural history, anthropogenic pressures, the influence of natural enemies on predation, or possible interspecific competition, could influence habitat suitability. To this end, the prediction results of GARP and Maxent should be examined based on the existing knowledge about the natural history habitat pattern of a species.
4.3. Effect of Climate Change on Distribution of C. camphora
The majority of global climate-related models predicted that global warming would continue at the rate of 0.2 °C every decade [38]. Rising temperatures may expedite physiological processes. To be specific, plant photosynthesis will possibly reach an upper limit as temperature rises, even if the response varies with different species of plants [48,49]. These changes in photosynthetic rates and in other accelerated physiological processes were caused by increased speeds of chemical reactions. The predicted effects in many cases showed that elevation and latitude in appropriate habitats for many species are changing in response to changing climatic conditions on a regional scale. Meanwhile, several species probably can adapt to the changes in physiological or phenological terms [50]. In terms of emission scenarios and algorithms, existing models forecast a similar distribution shift trend in C. camphora with the continuing climate change. Research shows that habitats with appropriate climatic conditions for C. camphora were predicted to continue to expand in geographical space, particularly in the northward direction. As stated previously, the range of mean diurnal temperature and mean air temperature of the driest quarter were two of the main factors affecting the distribution of C. camphora. The ongoing rise of temperature would exceed the tolerance in C. camphora. The timing of phenological events such as flowering time also have potential ecological consequences [51,52,53]. Because of global warming, new geographic areas will become suitable for C. camphora, particularly in central Henan and Southern Shanxi. In the existing conditions, it is believed that Northeastern Central Henan and Southern Shanxi are unsuitable based on current climatic data. The changes in the projected climate are expected to allow the northward migration of C. camphora into new regions.
5. Conclusions
In the present study, Maxent and GARP were used to predict the distribution of C. camphora in China under present and future climate scenarios. The results revealed that the areas of suitable distribution predicted by GARP and Maxent were similar. However, the areas predicted by GARP were wider than the latter except for the overlap areas. Mean diurnal temperature range, annual precipitation, mean air temperature of the driest quarter, and sunshine duration in the growing season proved to be most important environmental variables affecting the distribution of C. camphora. Available predictions about the spatial and temporal patterns related to C. camphora in the current research will present suggestions for formulating forest management and protection measures.
Author Contributions
J.M. and J.T. conceived and designed the study; J.M., J.G. and M.L. collected and analyzed the data; J.M. and D.Z. wrote the paper. All authors have read and agreed to the published version of the manuscript.
Funding
This research was funded by the Jiangsu Agricultural Science and Technology Innovation Foundation of China (CX(19)3124) and the Modern Agriculture Industrial Technology System (Flower) in Jiangsu Province under Grant JATS (2020)436.
Data Availability Statement
Data available from the Figshare Repository: https://doi.org/10.6084/m9.figshare.15128739 (accessed on 16 July 2021).
Acknowledgments
Thanks to Keliang Zhang for his guidance on data analysis in this article. Thanks to the anonymous reviewers for their constructive and valuable comments. Thanks to the editors for their assistance in refining this article.
Conflicts of Interest
The authors declare no conflict of interest.
References
- Du, Z.Y.; He, Y.M.; Wang, H.T.; Wang, C.; Duan, Y.Z. Potential geographical distribution and habitat shift of the genus Ammopiptanthus in China under current and future climate change based on the MaxEnt model. J. Arid Environ. 2021, 184, 104328. [Google Scholar] [CrossRef]
- Garcia, A.; Ortega-Huerta, M.A.; Martinez-Meyer, E. Potential distributional changes and conservation priorities of endemic amphibians in western Mexico as a result of climate change. Environ. Conserv. 2014, 41, 1–12. [Google Scholar] [CrossRef]
- Liu, L.; Guan, L.L.; Zhao, H.X.; Huang, Y.; Mou, Q.Y.; Liu, K.; Chen, T.T.; Wang, X.Y.; Zhang, Y.; Wei, B.; et al. Modeling habitat suitability of Houttuynia cordata Thunb. (Ceercao) using MaxEnt under climate change in China. Ecol. Inform. 2021, 63, 101324. [Google Scholar] [CrossRef]
- Zhang, K.; Zhang, Y.; Zhou, C.; Meng, J.; Sun, J.; Zhou, T.; Tao, J. Impact of climate factors on future distributions of Paeonia ostii across China estimated by MaxEnt. Ecol. Inform. 2019, 50, 62–67. [Google Scholar] [CrossRef]
- Zhang, K.; Liu, H.; Pan, H.; Shi, W.; Zhao, Y.; Li, S.; Liu, J.; Tao, J. Shifts in potential geographical distribution of Pterocarya stenoptera under climate change scenarios in China. Ecol. Evol. 2020, 10, 4828–4837. [Google Scholar] [CrossRef] [Green Version]
- Anand, V.; Oinam, B.; Singh, I.H. Predicting the current and future potential spatial distribution of endangered Rucervus eldii eldii (Sangai) using MaxEnt model. Environ. Environ. Monit. Assess. 2021, 93, 1–17. [Google Scholar]
- Gomez-Ruiz, E.P.; Lacher, T.E. Modelling the potential geographic distribution of an endangered pollination corridor in Mexico and the United States. Divers. Distrib. 2017, 23, 67–78. [Google Scholar] [CrossRef] [Green Version]
- Pearson, R.G.; Raxworthy, C.J.; Nakamura, M.; Peterson, A.T. Predicting species distributions from small numbers of occurrence records: A test case using cryptic geckos in Madagascar. J. Biogeogr. 2007, 34, 102–117. [Google Scholar] [CrossRef]
- Padalia, I.; Srivastava, V.; Kushwaha, S.P.S. Modeling potential invasion range of alien invasive species, Hyptis suaveolens (L.) Poit. in India: Comparison of MaxEnt and GARP. Ecol. Inform. 2014, 22, 36–43. [Google Scholar] [CrossRef]
- Barnes, M.A.; Jerde, C.L.; Wittmann, M.E.; Chadderton, W.L.; Ding, J.Q.; Zhang, J.L.; Purcell, M.; Budhathoki, M.; Lodge, D.M. Geographic selection bias of occurrence data influences transferability of invasive Hydrilla verticillata distribution models. Ecol. Evol. 2014, 4, 2584–2593. [Google Scholar] [CrossRef] [PubMed]
- Zhang, K.; Yao, L.; Meng, J.; Tao, J. Maxent modeling for predicting the potential geographical distribution of two peony species under climate change. Sci. Total Environ. 2018, 634, 1326–1334. [Google Scholar] [CrossRef] [PubMed]
- Ashraf, U.; Peterson, A.T.; Chaudhry, M.N.; Ashraf, I.; Saqib, Z.; Ahmad, S.R.; Ali, H. Ecological niche model comparison under different climate scenarios: A case study of Olea spp. in Asia. Ecosphere 2017, 8, e01825. [Google Scholar] [CrossRef]
- Zhang, K.; Sun, L.; Tao, J. Impact of climate change on the distribution of Euscaphis japonica (Staphyleaceae) Trees. Forests 2020, 11, 525. [Google Scholar] [CrossRef]
- Torres, N.M.; Marco, P.D.; Santos, T.; Silveira, L.; Jacomo, A.T.D.; Diniz, J.A.F. Can species distribution modelling provide estimates of population densities? A case study with jaguars in the Neotropics. Divers. Distrib. 2012, 18, 615–627. [Google Scholar] [CrossRef]
- Peterson, A.T.; Papes, M.; Eaton, M. Transferability and model evaluation in ecological niche modeling: A comparison of GARP and Maxent. Ecography 2007, 30, 550–560. [Google Scholar] [CrossRef]
- Qin, Z.; Zhang, J.E.; DiTommaso, A.; Wang, R.L.; Wu, R.S. Predicting invasions of Wedelia trilobata (L.) Hitchc. with Maxent and GARP models. J. Plant Res. 2015, 128, 763–775. [Google Scholar] [CrossRef] [PubMed]
- Sergio, C.; Figueira, R.; Draper, D.; Menezes, R.; Sousa, A.J. Modelling bryophyte distribution based on ecological information for extent of occurrence assessment. Biol. Conserv. 2007, 135, 341–351. [Google Scholar] [CrossRef]
- Kong, F.; Tang, L.; He, H.; Yang, F.X.; Tao, J.; Wang, W.C. Assessing the impact of climate change on the distribution of Osmanthus fragrans using Maxent. Environ. Sci. Pollut. Res. Int. 2021, 28, 34655–34663. [Google Scholar] [CrossRef]
- Venne, S.; Currie, D.J. Can habitat suitability estimated from MaxEnt predict colonizations and extinctions? Divers. Distrib. 2021, 27, 873–886. [Google Scholar] [CrossRef]
- Phillips, S.J.; Anderson, R.P. and Schapire, R.E. Maximum entropy modeling of species geographic distributions. Ecol. Model. 2006, 190, 231–259. [Google Scholar] [CrossRef] [Green Version]
- Elith, J.; Kearney, M.; Phillips, S. The art of modelling range-shift-ing species. Methods Ecol. Model. 2010, 1, 330–342. [Google Scholar] [CrossRef]
- Elith, J.; Graham, C.H.; Anderson, R.P.; Dudík, M.; Ferrier, S.; Guisan, A.; Hijmans, R.J.; Huettmann, F.; Leathwick, J.R.; Lehmann, A.; et al. Novel methods improve prediction of species’ distributions from occurrence data. Ecography 2006, 29, 129–151. [Google Scholar] [CrossRef] [Green Version]
- Hernandez, P.A.; Graham, C.H.; Master, L.L.; Albert, D.L. The effect of sample size and species characteristics on performance of different species distribution modeling methods. Ecography 2006, 29, 773–785. [Google Scholar] [CrossRef]
- Li, X.; Li, J.; Huang, P.; Wei, F.; Cui, H.; Henk, V.D.W. Lauraceae. In Flora of China; Hong, D.Y., Pan, K.Y., Turland, N.J., Eds.; Science Press: Beijing, China; Botanical Garden Press: Saint Louis, MO, USA, 2008; Volume 7, pp. 102–253. [Google Scholar]
- Lee, H.J.; Hyun, E.A.; Yoon, W.J.; Kim, B.H.; Rhee, M.H.; Kang, H.K.; Yoo, E.S. In vitro anti-inflammatory and anti-oxidative effects of Cinnamomum camphora extracts. J. Ethnopharmacol. 2006, 103, 208–216. [Google Scholar] [CrossRef]
- Babu, K.N.; Sajina, A.; Minoo, D.; John, C.Z.; Mini, P.M.; Tushar, K.V.; Rema, J.; Ravindran, P.N. Micropropagation of camphor tree (Cinnamomum camphora). Plant Cell Tissue Organ Cult. 2003, 74, 179–183. [Google Scholar] [CrossRef]
- Tian, Z.; Luo, Q.; Zuo, Z. Seasonal emission of monoterpenes from four chemotypes of Cinnamomum camphora. Ind. Crops Prod. 2021, 163, 113–327. [Google Scholar] [CrossRef]
- Zhang, L.; Jing, Z.; Li, Z.; Liu, Y.; Fang, S. Predictive Modeling of Suitable Habitats for Cinnamomum camphora (L.) Presl Using Maxent Model under Climate Change in China. Int. J. Environ. Res. Public Health 2019, 16, 3185. [Google Scholar] [CrossRef] [PubMed] [Green Version]
- Stockwell, D.R.B.; Noble, I.R. Induction of sets of rules from animal distribution data: A robust and informative method of data analysis. Math. Comput. Simulat. 1992, 33, 385–390. [Google Scholar] [CrossRef]
- Hijmans, R.J.; Cameron, S.E.; Parra, J.L.; Jones, P.G.; Jarvis, A. Very high resolution interpolated climate surfaces for global land areas. Int. J. Climatol. 2005, 25, 1965–1978. [Google Scholar] [CrossRef]
- Yi, Y.J.; Cheng, X.; Yang, Z.F.; Zhang, S.H. Maxent modeling for predicting the potential distribution of endangered medicinal plant (H. riparia Lour) in Yunnan, China. Ecol. Eng. 2016, 92, 260–269. [Google Scholar] [CrossRef]
- Stockwell, D.; Peters, D. The GARP modelling system: Problems and solutions to automated spatial prediction. Int. J. Geogr. Inf. Sci. 1999, 13, 143–158. [Google Scholar] [CrossRef]
- Merow, C.; Smith, M.J.; Silander, J.A. A practical guide to MaxEnt for modeling species’ distributions: What it does, and why inputs and settings matter. Ecography 2013, 36, 1058–1069. [Google Scholar] [CrossRef]
- Anderson, R.P.; Lew, D.; Peterson, A.T. Evaluating predictive models of species’ distributions: Criteria for selecting optimal models. Ecol. Model. 2003, 162, 211–232. [Google Scholar] [CrossRef]
- Allouche, O.; Tsoar, A.; Kadmon, R. Assessing the accuracy of species distribution models: Prevalence, kappa and the true skill statistic (TSS). J. Appl. Ecol. 2006, 43, 1223–1232. [Google Scholar] [CrossRef]
- Fielding, A.H.; Bell, J.F. A review of methods for the assessment of prediction errors in conservation presence/absence models. Environ. Conserv. 1997, 24, 38–49. [Google Scholar] [CrossRef]
- Sánchez, F.E. GARP modeling of natural and human factors affecting the potential distribution of the invasives Schismus arabicus and Brassica tournefortii in ‘El Pinacate y Gran Desierto de Altar’ Biosphere Reserve. Ecol. Model. 2007, 204, 457–474. [Google Scholar] [CrossRef]
- Araújo, M.B.; New, M. Ensemble forecasting of species distributions. Trends Ecol. Evol. 2007, 22, 42–47. [Google Scholar] [CrossRef]
- Thuiller, W.; Araujo, M.B.; Lavorel, S. Do we need land-cover data to model species distributions in Europe? J. Biogeogr. 2004, 31, 353–361. [Google Scholar] [CrossRef]
- Zhang, K.; Zhang, Y.; Tao, J. Predicting the Potential Distribution of Paeonia veitchii (Paeoniaceae) in China by Incorporating Climate Change into a Maxent Model. Forests 2019, 10, 190. [Google Scholar] [CrossRef] [Green Version]
- Deb, J.C.; Phinn, S.; Butt, N.; McAlpine, C.A. The impact of climate change on the distribution of two threatened Dipterocarp trees. Ecol. Evol. 2017, 7, 2238–2248. [Google Scholar] [CrossRef]
- Benito, B.M.; Martinez-Ortega, M.M.; Munoz, L.M.; Lorite, J.; Penas, J. Assessing extinction-risk of endangered plants using species distribution models: A case study of habitat depletion caused by the spread of greenhouses. Biodivers. Conserv. 2009, 18, 2509–2520. [Google Scholar] [CrossRef]
- Giovanelli, J.G.R.; Siqueira, M.F.D.; Haddad, C.F.B.; Alexandrino, J. Modeling a spatially restricted distribution in the Neotropics: How the size of calibration area affects the performance of five presence-only methods. Ecol. Model. 2010, 221, 215–224. [Google Scholar] [CrossRef]
- Heikkinen, R.K.; Marmion, M.; Luoto, M. Does the interpolation accuracy of species distribution models come at the expense of transferability? Ecography 2012, 35, 276–288. [Google Scholar] [CrossRef]
- Tian, D.L.; Luo, Y.; Xiang, W.H. Photosynthetic characteristics of Cinnamomum camphora and its response to elevation of CO2 and temperature. Sci. Silv. Sin. 2004, 40, 88–92. [Google Scholar]
- Zhang, J.F.; Qian, H.S.; La, C.J. Temperature suitability and its change trend of Cinnamomum camphora in subtropical China. Chin. J. Ecol. 2010, 29, 1482–1487. [Google Scholar]
- Li, F.; Jin, Z.N.; Li, Z.Y.; Cao, J.C.; Zhang, L.; Zhang, Y.H. Seeds Properties of Cinnamomum camphora and their Response towards Environmental Factors. Acta Agric. Univ. Jiangxiensis 2017, 1, 92–100. [Google Scholar]
- Hu, Y.; Hu, T.X.; Hu, H.L.; Chen, H.; Wang, B.; Li, H. Effects of drought stress on growth and photosynthetic characteristics of Cinnamomum camphora saplings. Chin. J. Appl. Environ. Biol. 2014, 20, 675–682. [Google Scholar]
- Wang, D.F. The Effect of Drought and Water-Logging Stresses on Eco-Physiology of Cinnamomum camphora Seedlings. Master’s Thesis, Nanchang Institute of Technology, Nanchang, China, 2016. [Google Scholar]
- Singh, A.; Kushwaha, S.P.S. Refining logistic regression models for wildlife habitat suitability modeling-A case study with muntjak and goral in the Central Himalayas, India. Ecol. Model. 2011, 222, 1354–1366. [Google Scholar] [CrossRef]
- Sobek-Swant, S.; Kluza, D.A.; Cuddington, K.; Lyons, D.B. Potential distribution of emerald ash borer: What can we learn from ecological niche models using Maxent and GARP? For. Ecol. Manag. 2012, 281, 23–31. [Google Scholar] [CrossRef]
- Stigall, A.L. Using ecological niche modelling to evaluate niche stability in deep time. J. Biogeogr. 2012, 39, 772–781. [Google Scholar] [CrossRef]
- Zhu, G.P.; Bu, W.J.; Gao, Y.B.; Liu, G.Q. Potential geographic distribution of brown marmorated stink bug invasion (Halyomorpha halys). PLoS ONE 2012, 7, e31246. [Google Scholar] [CrossRef] [PubMed]
Figure 1.
Distribution of potentially suitable habitat for Cinnamomum camphora predicted by (A) Maxent and (B) GARP. Both Maxent and GARP used the same threshold of classification, i.e., ‘high potential’ (>0.6), ‘moderate potential’ (0.4–0.6), ‘low potential’ (0.2–0.4), and ‘not potential’ (<0.2) habitat. Maps show only the provinces where C. camphora was predicted to occur.

Figure 2.
Response curves of important environment predictors in the species distribution model for Cinnamomum camphora: (A) mean diurnal temperature range, (B) annual precipitation, (C) mean air temperature of driest quarter, and (D) sunshine duration in growing season based on the Maxent algorithm for C. camphora in China.

Figure 3.
Potential suitable habitat of Cinnamomum camphora predicted by (A) Maxent and (B) GARP under future climate change scenarios RCP2.6 and RCP8.5. A1, B1—scenarios for RCP 2.6–2050; A2, B2—scenarios for RCP 2.6–2070; A3, B3—scenarios for RCP 8.5–2050; A4, B4—scenarios for RCP 8.5–2070. (1), Sichuan; (2), Yunnan; (3), Shanxi; (4), Chongqing; (5), Guizhou; (6), Guangxi; (7), Henan; (8), Hubei; (9), Hunan; (10), Guangdong; (11), Shandong; (12), Anhui; (13), Jiangxi; (14), Jiangsu; (15), Zhejiang; (16), Fujian; (17), Hainan; (18), Taiwan. Both Maxent and GARP used the same threshold of classification, i.e., high potential (>0.6), moderate potential (0.4–0.6), low potential (0.2–0.4), and not potential (<0.2) habitat. Only the provinces where C. camphora was predicted to occur are shown.

Figure 4.
Comparison between current potential habitat and habitat under climate change scenarios RCP2.6 and RCP8.5 by Maxent (A1–A4) and GARP (B1–B4). A1, B1: scenarios for RCP 2.6–2050; A2, B2: scenarios for RCP 2.6–2070; A3, B3: scenarios for RCP 8.5–2050; A4, B4: scenarios for RCP 8.5–2070. White areas indicate unsuitable habitats; yellow, red, and green area indicate unchanged, increased, and decreased suitable habitat, respectively, compared with the current potentially suitable habitat. (1), Sichuan; (2), Yunnan; (3), Shanxi; (4), Chongqing; (5), Guizhou; (6), Guangxi; (7), Henan; (8), Hubei; (9), Hunan; (10), Guangdong; (11), Shandong; (12), Anhui; (13), Jiangxi; (14), Jiangsu; (15), Zhejiang; (16), Fujian; (17), Hainan; (18), Taiwan. Only the provinces where C. camphora was predicted to occur are shown.


Table 1.
Environment factors used to predict the potential distribution of Cinnamomum camphora.
| Code | Environment Variables | Unit | Contribution (%) |
|---|---|---|---|
| Bio2 | Mean diurnal air temperature range | °C × 10 | 40.9 |
| Bio12 | Annual precipitation | mm | 23.0 |
| Bio9 | Mean air temperature of driest quarter | °C × 10 | 10.5 |
| SDGH | Sunshine duration in growing season | h × 10−3 | 7.2 |
| NDVI | Normalized difference vegetation index | 4.4 | |
| SD | Degree of slope | ° | 4.2 |
| SC | Soil type | 2.0 | |
| Bio1 | Annual mean air temperature | °C × 10 | 1.7 |
| RH | Relative humidity | % | 1.4 |
| Bio15 | Precipitation seasonality | 1.2 | |
| Bio3 | Isothermality | ×100 | 0.9 |
| Ele | Elevation | m | 0.9 |
| SpH | Soil pH | ×10 | 0.7 |
| Aspect | Aspect | ° | 0.4 |
| Bio8 | Mean air temperature of wettest quarter | °C × 10 | 0.3 |
| Bio18 | Precipitation of warmest quarter | mm | 0.2 |
| SOC | Soil organic carbon | g/kg | 0.2 |
| Bio4 | temperature seasonality(standard deviation * 100) | ||
| Bio5 | Max temperature of warmest month | °C × 10 | |
| Bio6 | Min temperature of coldest month | °C × 10 | |
| Bio7 | Temperature annual range(bio5-bio6) | °C × 10 | |
| Bio10 | Mean temperature of warmest quarter | °C × 10 | |
| Bio11 | Mean temperature of coldest quarter | °C × 10 | |
| Bio13 | Precipitation of wettest month | mm | |
| Bio14 | Precipitation of driest month | mm | |
| Bio16 | Precipitation of wettest quarter | mm | |
| Bio17 | Precipitation of driest quarter | mm | |
| Bio19 | Precipitation of coldest quarter | mm |
Table 2.
Comparison of Area Under the Curve (AUC), Kappa, and True Skill Statistic (TSS) of Maxent and GARP models.
Table 2.
Comparison of Area Under the Curve (AUC), Kappa, and True Skill Statistic (TSS) of Maxent and GARP models.
| Model Type | AUC | Kappa | TSS |
|---|---|---|---|
| Maxent | 0.990 ± 0.011 | 0.994 ± 0.034 | 0.999 ± 0.055 |
| GARP | 0.978 ± 0.061 | 0.979 ± 0.030 | 0.895 ± 0.047 |
| p-value | 0.0163 | 0.0124 | 0.0085 |
Publisher’s Note: MDPI stays neutral with regard to jurisdictional claims in published maps and institutional affiliations. |
© 2021 by the authors. Licensee MDPI, Basel, Switzerland. This article is an open access article distributed under the terms and conditions of the Creative Commons Attribution (CC BY) license (https://creativecommons.org/licenses/by/4.0/).
Share and Cite
MDPI and ACS Style
Meng, J.; Li, M.; Guo, J.; Zhao, D.; Tao, J. Predicting Suitable Environments and Potential Occurrences for Cinnamomum camphora (Linn.) Presl. Forests 2021, 12, 1126. https://doi.org/10.3390/f12081126
AMA Style
Meng J, Li M, Guo J, Zhao D, Tao J. Predicting Suitable Environments and Potential Occurrences for Cinnamomum camphora (Linn.) Presl. Forests. 2021; 12(8):1126. https://doi.org/10.3390/f12081126
Chicago/Turabian StyleMeng, Jiasong, Miao Li, Jinhui Guo, Daqiu Zhao, and Jun Tao. 2021. "Predicting Suitable Environments and Potential Occurrences for Cinnamomum camphora (Linn.) Presl." Forests 12, no. 8: 1126. https://doi.org/10.3390/f12081126
Note that from the first issue of 2016, this journal uses article numbers instead of page numbers. See further details here.