
What Went Wrong? Predictors of Contact Tracing Adoption in Italy during COVID-19 Pandemic


1
Department of Education, Literatures, Intercultural Studies, Languages and Psychology, University of Florence, 50121 Florence, Italy
2
Centre for the Study of Complex Dynamics, University of Florence, 50121 Florence, Italy
*
Author to whom correspondence should be addressed.
Future Internet 2021, 13(11), 286; https://doi.org/10.3390/fi13110286
Submission received: 25 October 2021
/
Revised: 12 November 2021
/
Accepted: 13 November 2021
/
Published: 15 November 2021
(This article belongs to the Section Big Data and Augmented Intelligence)
Abstract
:Together with vaccines, contact tracing systems (CTS) have proved to be one of the best strategies to deal with the current COVID-19 pandemic. However, the adoption of such systems has been quite limited in EU countries, and Italy was no exception. The present research aimed to investigate the factors drawn from the most relevant psychological models in the literature, most associated with the adoption of CTS. The data analysis of the 501 surveyed answers (329 from CTS adopters) showed that knowing important others who have downloaded the CTS, CTS attitudes, CTS perceived efficacy, COVID-19 risk perception, and trust in the government and its actions influenced the adoption of the Italian CTS (52% of explained variance). These factors defined a new specific model that can be used to more effectively promote CTS adoption and thus increase the protective potential of these technologies, whose effectiveness is inevitably linked to adoption.
1. Introduction
Since the beginning of the pandemic, governments around the world identified non-pharmaceutical interventions (NPI) as an effective way to contain coronavirus disease (COVID-19 [1,2]). Evidence of early pre-symptomatic disease transmission [3,4] has questioned traditional containment measures based on symptom surveillance. For this reason, digital contact tracing (CT) apps have been selected globally as non-pharmaceutical tools to contain the COVID-19 contagion by exploiting the widespread use of smartphones. The main advantage of contact tracing methods is the possibility to immediately alert recent close contacts of an infected person, in order to push them towards self-isolation [5].
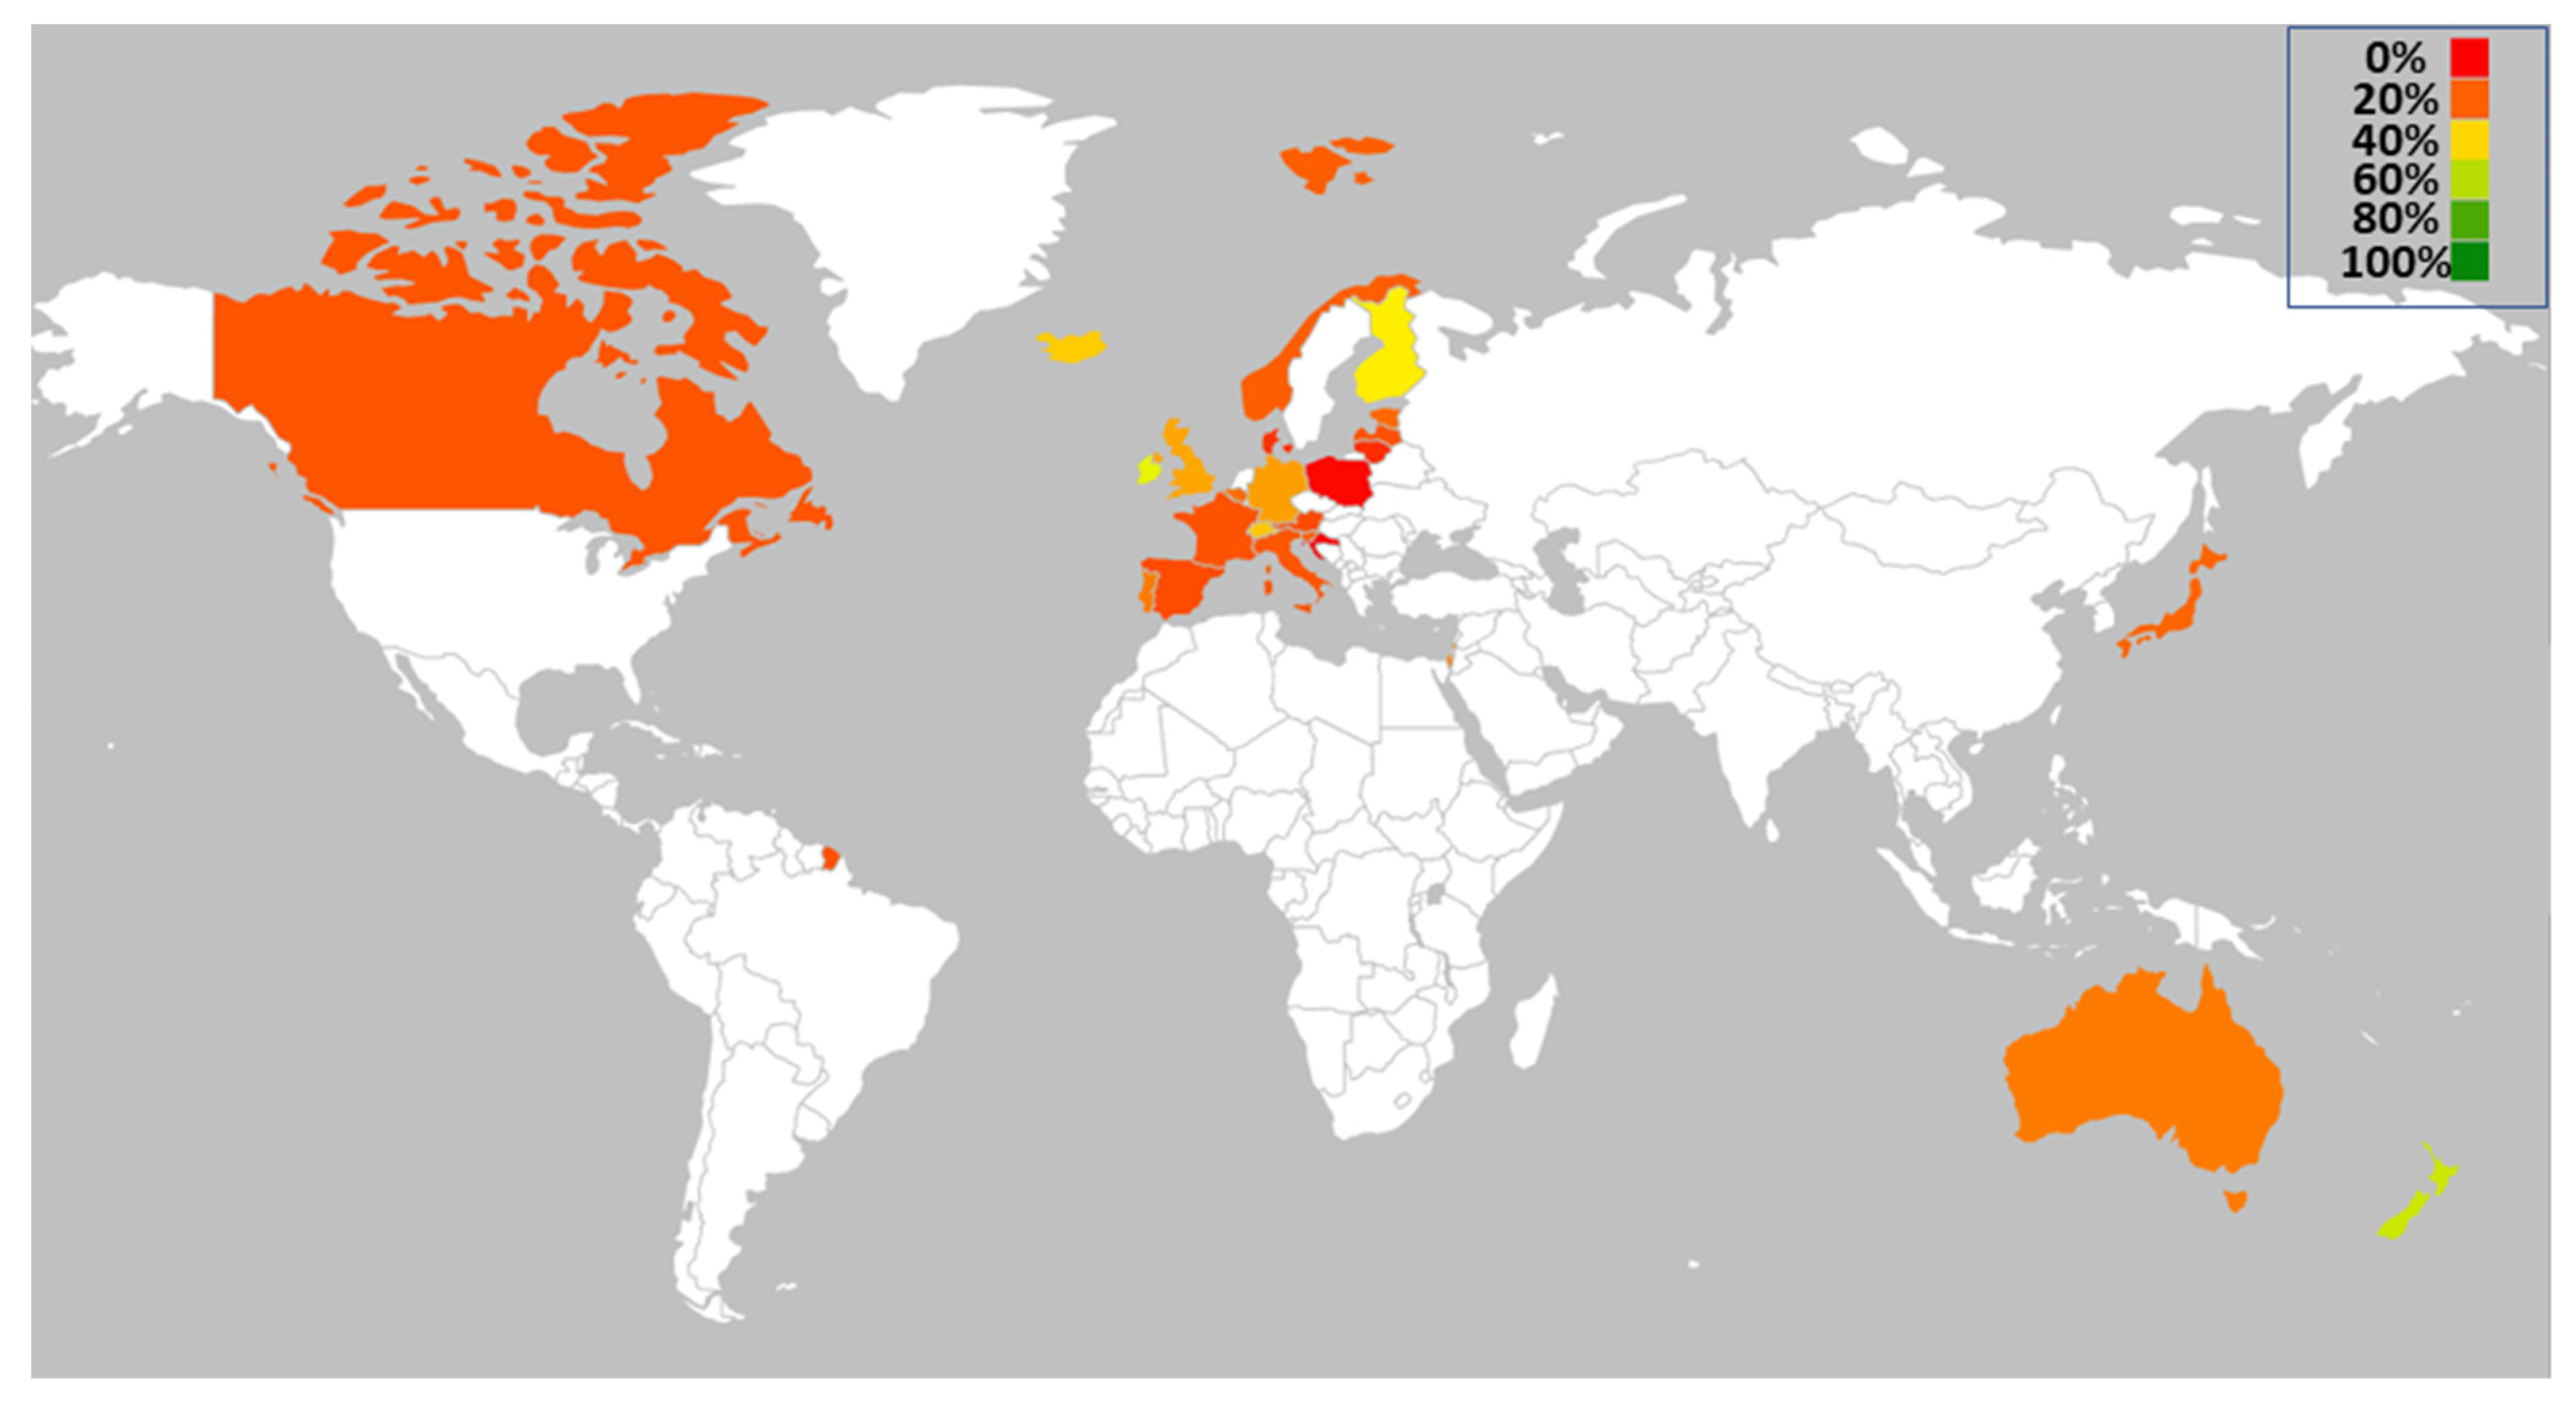
Many nations (e.g., Singapore, South Korea, Taiwan, Hong Kong, China) promptly adopted CT at the beginning of the pandemic [6,7,8], mainly due to the fact that they have already used this type of system in other outbreaks (including HIV, syphilis, and swine flu; [9]). For instance, Singapore was one of the first nations to introduce digital tools for tracing COVID-19 (GoS, TraceTogether, url: https://www.tracetogether.gov.sg/ (accessed on 20 May 2021)). Until May 2021, 37 countries relied on or used CT apps to deal with COVID-19 with different degrees of adoption by population (Figure 1) [10,11]. As reported in Figure 1, CT systems have been particularly adopted in countries such as Finland, Ireland, Germany, UK, Switzerland, and Iceland. Notably, the countries that had the highest level of adoption were Singapore (92%) and New Zealand (55%).
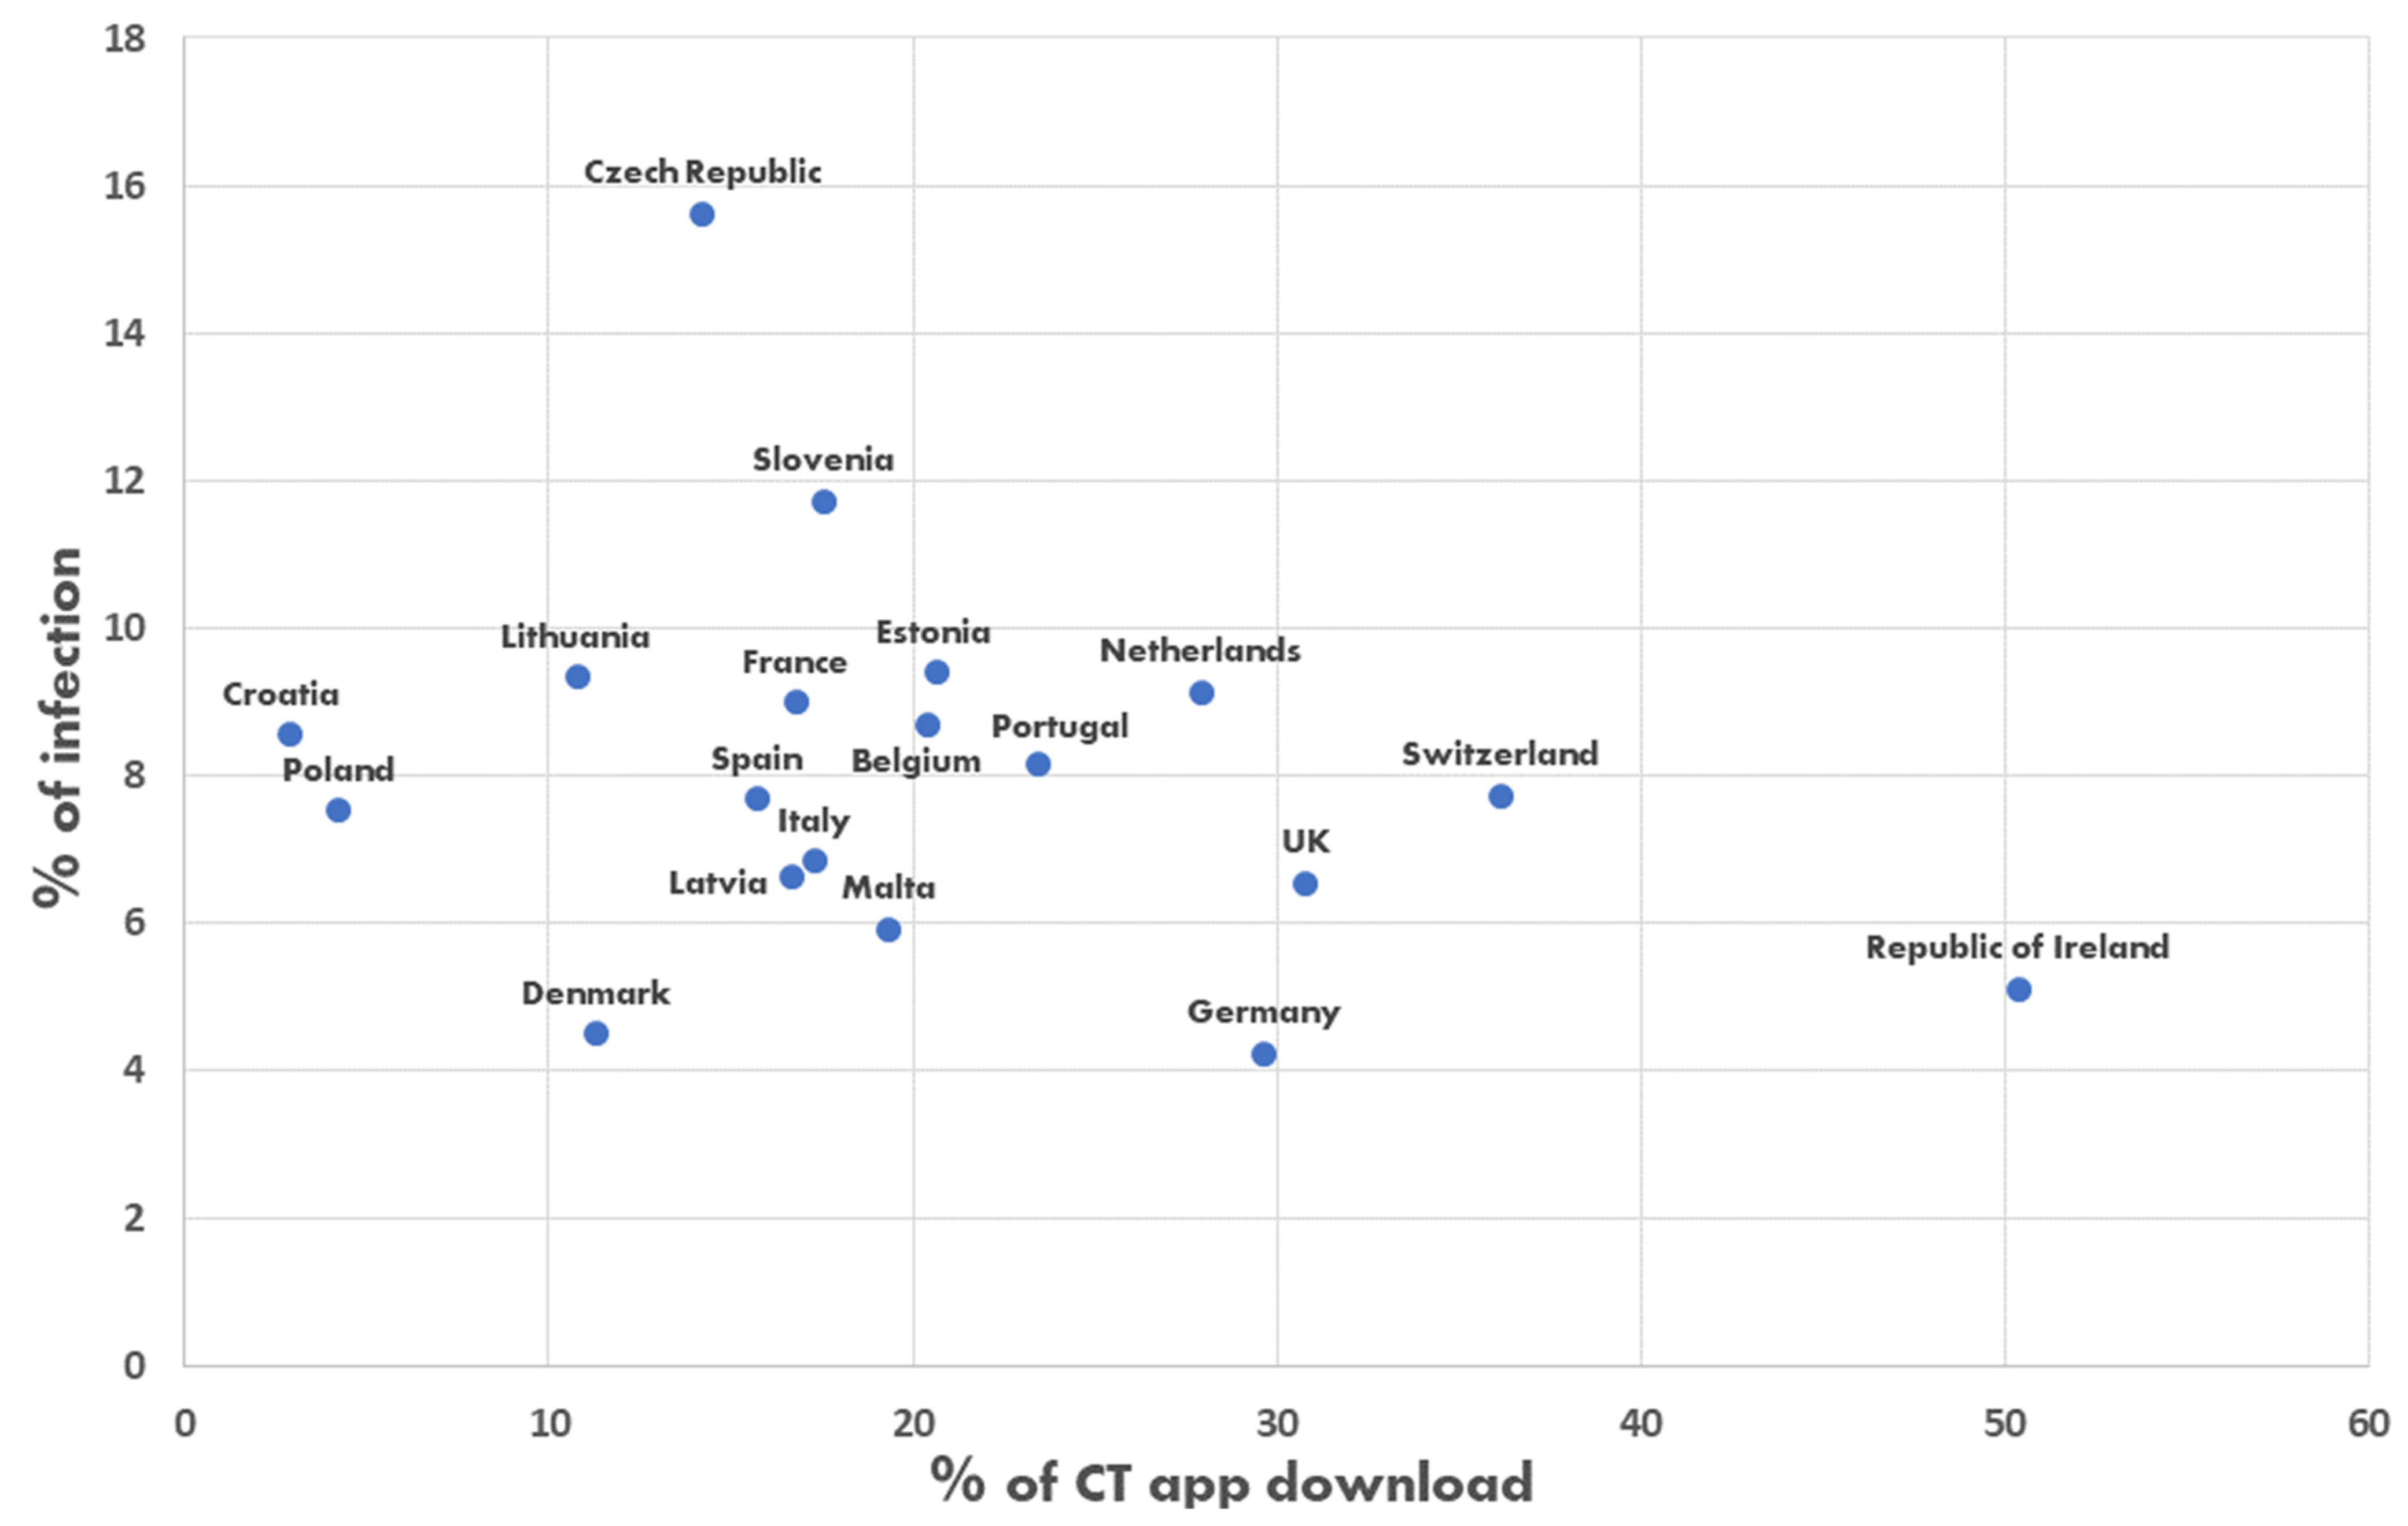
In a preliminary way, we exploratively compared the adoption of contact tracing systems with the percentage of infections in each country that adopted such a solution (if data were available) if the contagion of the population was ≥4% (see Table A1 (Appendix A), data updated to May 2021). This threshold, although chosen arbitrarily, has served to distinguish those countries in which the infection was more severe from those in which the infection was lower, since it is precisely in the former countries that the need to trace the infections emerges. Meanwhile, in areas where the contagion is somehow low, applying CT may not be so essential. The plotting of the 19/37 eligible countries’ data (Figure A1) suggested that higher adoption of contact tracing systems was associated with a lower number of infections. Therefore, the success of the CT systems seems to depend on the adoption of the population [12]. For example, Italy, one of the countries most affected by the pandemic, had an unsatisfying adoption of the Italian CT system (i.e., Immuni; see Table A1 and Figure A1). The Immuni app was promoted by the Italian Health Ministry and made by the Bending Spoons society. Bending Spoons has granted the Italian Government a perpetual and irrevocable license on Immuni free of charge. Immuni was released in June 2020, three months after the official beginning of the COVID-19 pandemic, without any mandatory requirements, and just 17.3% of the Italian population had downloaded it by May 2021 (Table A1). The modest adoption of Immuni may have contributed to the spread of infections and, consequently, the adoption of more strict measures, such as the lockdown.
The Immuni app is based on a technology called Bluetooth low energy (BLE). Once Immuni is installed on a device, it generates a temporary exposure key, which is random and modified every day to avoid identifiability and tracking issues for users. Based on this key, Immuni produces an identification code, which is then issued by the smartphone via BLE [13]. Immuni continuously saves the rolling proximity identifier of the nearby smartphones in its memory, and concurrently transmits its own identifier. In the case of a COVID-19 contagion, a national health operator can, if the user approves, upload a random exposure key on Immuni’s server, thus informing the other users who met the infected person that may have been exposed to infection [13]. Generally, the app detects and transmits a risky exposure notification when the Immuni’s system, which periodically compares all the exposure keys with locally saved rolling proximity identifiers, when certain conditions are met (e.g., the length of the contact and the distance between the devices is above certain thresholds). At this point, Immuni advises the user to consult a general practitioner [13].
Studies have shown that cultural attitudes and social norms towards privacy have influenced the use of these systems to combat the pandemic [14,15,16]. In the case of Immuni, GDPR legal requirements are met by design. Indeed, Immuni does not allow direct identification of users or devices, and the data exchanged via BLE are exclusively those necessary to warn people that they have been exposed to a risk of contagion. The communication of the identification code in the case of positivity is not mandatory and will happen only with a health worker who enters the code on the Immuni server to identify the devices with which the infected person has come into contact in the last few hours, but without matching the person’s identity to the entered code. In no case are the movements of users tracked, thus excluding any form of geolocation.
The failure of such systems was individuated by the scientific literature in several factors: skepticism about the effectiveness of the app itself [15], concerns over potential privacy and cybersecurity implications [12], inability for some to download the app [16], and lack of trust in the government [17].
The analysis of classical and integrated psychological models can help us identify the factors that contributed to the failure of these systems [18]. Balapour and colleagues [19] argue that adoption models in the context of mHealth have largely been based on traditional adoption theories such as reasoned action theory—TRA [20,21], Technology Acceptance Model—TAM [22,23], and Unified Theory of Acceptance and Use of Technology—UTAUT [24,25].
Based on these models, several important factors should be considered to adequately model the adoption of CT systems. Each of the models could theoretically be adequate to explain our specific condition. However, all the models presented pre-date the pandemic. For this reason, we integrated traditional adoption theories with other psychological factors that emerged from the literature as associated with CTS adoption to understand if there is a model that fits better than others to explain Immuni adoption or if the need for a new, more specific model arises.
1.1. Towards Comprehensive Modeling of CT Systems Adoption: Factors Potentially Affecting Technological Adoption
The adoption and use of innovation are influenced by the perception of efficacy that people have towards the new proposal. In this regard, the literature shows that performance expectancy is, in fact, one of the variables that best predicts the adoption of new technology [26,27,28]. Venkatesh et al. [26] defined performance expectancy as the degree to which using technology will provide benefits to consumers in performing certain activities. Thus, the higher people’s perception of the benefits of a new proposal, the greater the probability that the proposal will be adopted.
Regarding the new contact tracing apps proposed in recent years, the literature showed that performance expectancy is a core predictor of COVID-19 app adoption and usage. Indeed, the intention to use the app is higher if people are convinced about the app’s efficacy to protect them from potential exposure to the virus [27].
As underlined by psychological models [22,23,24,25], people’s attitudes are an important element for behavioral change. In the specific case of new technologies adoption, recent works have tried to measure the attitude that people have towards artificial entities such as robots, artificial intelligence, and chatbots [29,30]. These works have shown how a more positive attitude leads to greater acceptance and less fear [31,32].
Another key aspect concerns social influence dynamics. Social influence refers to the tendency of individuals to be influenced by the behavior of others in their social network [33]. Venkatesh et al. [25] proposed a social influence model composed of a subjective norm, which represents the person’s perception that most people who are important to them think they should or should not perform the behavior in question; and social factors [34], that is the individual’s internalization of the reference group’s subjective culture and specific interpersonal agreements that the individual has made with others, in specific social situations. In addition, the authors introduced a further dimension to the social influence construct, closely linked to the technological sphere, the image dimension [35]. It refers to the degree to which the use of an innovation is perceived to enhance one’s image or status in one’s social system.
Consequently, the adoption of a contact tracing app represents a behavior that could be largely influenced by a significant other’s beliefs about whether to download and use the app or not.
Social influence may also take the form of vicarious learning from observing the experiences of others [36]. Thus, effective behavior by one person may well be repeated by others through a process of observational learning. Similarly, choices that lead to undesirable consequences may be avoided by others.
People, through observation, also establish the appropriateness of adopting new technology. Social influence has been found to be important in the early stages of an individuals’ experience with new technology. Therefore, if individuals see their significant others use contact tracing systems, it is plausible that they will do so as well [27].
Regarding contact tracing systems, in most cases, they have been sponsored by governments and institutions for facing COVID-19 infection spreading. Psychological models state that the acceptance of a certain message not only depends on the content of the message but also on the judgment one has of the source, in terms of trust, for example.Source credibility is whether people find the evaluation (made by communication companies) to be believable, competent, and trustworthy [37,38,39]. Giffin [40] introduced credibility as an important factor within the theory of interpersonal trust and reported that if the source of the communication is perceived as credible, the messages were more persuasive.
Therefore, in order to model CT adoption, we cannot ignore people’s perception of the source of the message. For this reason, trust in government was investigated by several studies, and the findings showed its influence on people’s usage intentions regarding contact tracing applications [2,17]. Altmann et al. [17] found that lack of trust in government can have far-reaching implications. Their analysis showed that this factor has a negative effect on people’s intention to install a contact-tracing app on their phones.
These results highlighted the importance of investigating trust in government as a factor that could influence the intention of Italian citizens to download and use the Immuni app.
Another important possible predictor of CT app download and use could come from the literature that regards pandemic scenarios. In fact, both the actual and precedent pandemics [41,42] indicate the perception of severity and likelihood of infection as factors that influence people’s health behaviors.
Some current literature’s results on this topic show that fear of COVID-19 is one of the most important COVID-19-related factors that predicts acceptance of mobile applications to deal with the COVID-19 pandemic [43].
1.2. Hypothesis Development
Based on the aforementioned theoretical models and research evidence, we developed six hypotheses.
Some literature shows that sociodemographic variables such as gender, education level, and income have no influence [27,43], or marginal influence in the case of age [43], on the download and use of contact tracing apps. Other works showed precisely the opposite regarding the role of age in determining app usage. Indeed, old people are generally less likely to have smartphones, are less tech-savvy, and are less inclined to install and use new applications on their smartphones [44,45,46]. Nevertheless, in our case, since we were interested in why people that are, in theory, able to adopt such systems (i.e., they have both the opportunity and skill to use CTs) did not use them, we recruited participants that were plausibly quite familiar with new technologies, regardless of their age. For this reason, we expected age to not be related to CT adoption.
Hypotheses 1 (H1).
Sociodemographic variables such as age, gender, education level, and income do not influence the download and use of the Immuni application.
Literature shows that people who have a higher perception of the efficacy of contact tracing systems as a way to fight the pandemic will download and use contact tracing apps more often [27]. Following these results, for the second hypothesis of our study, we expect that people who have a higher perception of Immuni-related efficacy will download and use it more often. The study of Walrave et al. [27] identified performance expectancy as a core predictor of COVID-19 adoption. Performance expectancy was defined as the advantages that users expect from using technology. Thus, the authors predicted that people who have positive expectations concerning the app’s performance in dealing with the COVID-19 pandemic would be more inclined to adopt and use the app.
Hypotheses 2 (H2).
People who score a higher Immuni perception of efficacy have a higher probability of downloading and using it.
Social influence refers to individuals’ beliefs that important others think they should be using the technology. Social influence has been found to be important in the early stages of an individuals’ experience with a new technology fostering its adoption [27]. Therefore, as we investigated a new technology, such as contact tracing systems, we expect that if individuals know that significant others use the CT app, they will be more likely to do it themselves [27].
Hypotheses 3 (H3).
Individuals who know important others who have downloaded and installed the Immuni application have a higher probability of downloading and using it.
According to the literature, peoples’ beliefs of the gravity of the COVID-19 pandemic and their perceived vulnerability did not predict the intention to adopt CTs [27]. Apparently, COVID-19 concerns were negatively associated with the intention to download contact tracing apps, while they appeared to increase social conservatism levels and privacy concerns [47]. Fear of COVID-19 instead seemed to affect the acceptance of mobile applications to deal with the COVID-19 pandemic [43].
Hypotheses 4 (H4).
People who score a higher likelihood of infection (or risk perception) will download and use the Immuni application more.
Attitude towards technology is related to acceptance of contact tracing apps [43]. Walrave et al. [27] linked innovativeness to the desire to look for and try out new things (e.g., ideas, services, products). For this reason, we expected that a positive attitude toward technologies would favor people’s adoption of CTs.
Hypotheses 5 (H5).
People’s attitudes towards the Immuni application influence the download and use of it.
Psychological models show that the acceptance of a certain message depends on the judgment of the source in terms of trust, competence, and credibility [37,38,39]. Thus, a credible and trustworthy source had a higher probability of persuading the receiver of the message [40]. In the case of our study, the Immuni app was sponsored by the Health Ministry of the Italian government; thus, the Italians perception of trust in their government, as the source of the message, represents a crucial variable to be considered in Immuni adoption.
Moreover, the literature showed that willingness to use a contact-tracing application is associated with trust in the government. In general, high public trust in the government will facilitate the government in implementing policies and rules [48,49]. Regarding contact tracing adoption, people who trust the government to handle the health crisis seem more willing to accept and use contact-tracing applications [2]. Thus, according to the literature, we expected that Italian people who trust the government would be more willing to download and use the Immuni application.
Hypotheses 6 (H6).
People who trust the government have a higher probability of downloading and using the Immuni application.
2. Material and Methods
2.1. Participants and Procedure
Data about the use of Immuni was collected by designing and distributing an anonymous online survey designed ad hoc through the Google Forms platform. The survey was structured in 16 sections, with a total of 166 questions, on a Likert scale. The completion time was approximately 20 min. The sample was recruited through online posts on mainstream social networks sites (Facebook and Instagram mainly) during the second wave of the pandemic in Italy (from 23 October 2020 to 20 November 2020). The data collection reached 19/20 Italian regions, although with different degrees of participation (with the respondents from Tuscany that nearly represented 50% of the total sample). The final sample of the study was composed of 501 participants (78% females), with an average age of 34.61 (standard deviation = 14.14), through a voluntary census on the web. The high number of females is not surprising since the first group of people recruited for the survey was numerically dominated by women. Previous studies have shown that people’s social networks are often “segregated” by sex and tend to be homophilic [50,51]. Thus, in a snowball sampling, the unbalanced gender ratio observed at the beginning was maintained until the end. The data were collected according to the Italian law’s requirements of privacy and informed consent (Law Decree DL-101/2018), EU regulation (2016/699), and APA guidelines. The University of Florence’s ethical commission gave favorable feedback about the study (approved protocol number: 0092811). The participants had the possibility to leave the session at any moment, as clearly stated in the preliminary instructions. There was no missing data as all respondents who started the survey completed it. Data was not recorded for those participants who did not provide their informed consent or complete the survey, thus guaranteeing them the possibility of canceling any answer given up to that moment. Overall, 14 people did not provide their informed consent and thus were not included in the final sample.
2.2. Materials
To identify the predictors of CT adoption, we administered an online survey investigating the participants’ sociodemographic characteristics, personality traits, self-efficacy, well-being, and social connectedness. The survey was composed of the following tools:
- Sociodemographic form. It is composed of questions about several demographic characteristics, namely gender, age, education, occupational status, housing situation.
- Affective arousal. We relied on the Italian version of the Positive Affect Negative Affect Scale—PANAS [52] developed by Terracciano et al. [53]. PANAS is a self-reporting scale measured on a 5-point rating scale of two independent dimensions, which are the positive (PA) and negative (NA) affects. Participants were asked to rate how much they experienced in their past 20 emotions, ranging from 1 = ‘very slightly’ to 5 = ‘very much’. The PA scale is measured by the items excited, enthusiastic, concentrating, inspired, and determined; whereas, the NA dimension is captured by the items distressed, upset, scared, nervous, and afraid.
- Immuni “general” form. This section was composed of four ad hoc items assessed through a 5-point Likert scale, from “not at all” to “very much”. Item’s include assessing if the participant had downloaded and installed the Immuni app (e.g., “Have you downloaded and installed the Immuni App?”); people’s belief about the spreading and usage of the Immuni app, (e.g., “How much do you think the Immuni app is used for?”); participant’s perception of efficacy regarding the Immuni app (i.e., Immuni efficacy; e.g., “How effective do you think Immuni is to fight the pandemic?”); whether a participant’s family, friend, or acquaintance used the Immuni app (e.g., “Has anyone you know downloaded and installed the “Immuni” app?”)
- Attitudes towards contact tracing systems (ATCTS): This instrument was developed from the ATAI Scale [29] that assesses attitudes towards Artificial Intelligence. The original scale is composed of five items that comprise two dimensions, acceptance and fear of artificial intelligence. Maintaining the same structure as the original tool, the items were adapted to refer them to the contact tracing systems. Some examples are: “I’m afraid of contact tracing systems”; “I trust contact tracing systems”; “Contact tracing systems bring harm to people”, “Contact tracing systems benefit people”. In regard to the last item of the ATAI, which reflects the greatest concern inherent in AI (i.e., job losses), we conducted focus groups to understand which fear was most linked to CT systems, and it turned out to be a violation of privacy. Therefore, item five has been adapted as follows: “Contact tracing systems excessively violate privacy”.
- Trust in Government. In this section, we assessed the participant’s trust in government (e.g., “In general, how much confidence do you have in the government of the country?”) and in relation to the actions taken to counter the COVID-19 pandemic (e.g., “How much confidence do you have in the government in relation to the actions taken to counter the COVID-19 pandemic?”) through ad-hoc items.
- Cognitive factors of risk perception for COVID-19 [41] Cognitive factors of risk perception were assessed using five items (α = 0.79) along three dimensions. The first one concerns the perceived severity of COVID-19 (3 items). The second dimension regards the likelihood of infection and is measured by a single item. The last dimension is also measured by a single item devoted to capturing people’s “perceived coping efficacy” with the disease. Responses were provided using a 5-point Likert-type scale (0 = not at all, 5 = extremely). The items were adapted, replacing “Swine Flu” with “COVID-19”.
2.3. Data Analysis
As a first step, we verified the preconditions necessary for testing our hypotheses. For all the continuous variables, normality (asymmetry and kurtosis values), homoscedasticity, and linearity were checked. Then for analyzing differences between Immuni adopters and not, on continuous variables, we relied on Welch’s t-test since, differently from the Student’s t-test, it is more accurate when sample sizes and variances are unequal between groups [54]. The association between Immuni adoption and categorical variables was tested with the chi-square test. Cramer’s V and Phi coefficients were calculated as effect size measures according to the table size when the chi-square test resulted as statistically significant. Finally, to produce the best predictive model for Immuni adoption, we used logistic regression, which allowed us to put together metric and categorical factors to predict a dichotomous outcome.
3. Results
3.1. Univariate Analysis for Immuni Adoption
Of the 501 respondents, 329 reported using Immuni, while 172 did not download the application. Thus, in our sample, the adoption of Immuni appeared to be much higher than in the general Italian population (17.3%, see Table A1). Most of the participants had a high-school diploma (41.5%), Master’s Degree (26.3%), and income between EUR 10 k and EUR 40 k per year (50.5%) or lower than EUR 10 k (35.7%). For a more detailed description of the sample, see Table A2.
First, we analyzed univariate differences between Immuni users (or not) and continuous variables to test whether these two populations differed in terms of Immuni perceived efficacy (H2), risk perception and fear level (H4), attitudes towards the Immuni application (H5), and trust in government and its action to deal with the pandemic (H6). For continuous variables, we relied on Welch’s t-test and assessed the related effect size through Cohen’s d (Table 1). A commonly used rule for Cohen’s d interpretation identified small, medium, and large effect sizes for d values of 0.2, 0.5, and 0.8, respectively [55]. Nonetheless, this rule should not be interpreted rigidly [56]. Since the fear dimension of the ATCTS scale was not normally distributed, the variable was log-transformed to proceed with our parametric inferential analyses.
The analysis highlighted that Immuni adoption is largely related to the perceived efficacy of CT systems and both components of people’s attitudes toward CT systems (i.e., fear and acceptance). The participants that downloaded and used the Immuni application also had higher scores on trust in government and its actions against COVID-19, risk perception (Perceived Severity and Likelihood of Infection), and experienced more fear compared to individuals that did not adopt the app. No differences were found regarding participants’ age (t(323.22)= −0.56; p = 0.58). For categorical variables, Pearson’s Chi-square was used to test the association of these variables with Immuni adoption. To define the effect size of each of these characteristics, we relied on Phi coefficients as a measure for the strength of an association between two categorical variables in a 2 × 2 contingency table. It was calculated by taking the chi-square value, dividing it by the sample size, and then taking the square root of this value. The Phi coefficient can be interpreted as very strong, strong, moderate, and weak for phi values of 0.25, 0.15, 0.10, and 0.05, respectively [57]. From the analysis, it emerged that 70.2% of Immuni adopters have at least one family member who used the application. Conversely, just 24.4% of the participants did not use the Immuni application despite one or more members of the family adopting it (χ2(1) = 95.52; p. < 0.001; Φ = 0.44; p. < 0.001). A similar result emerged, considering whether or not a friend downloaded and used Immuni. The participants who used the CT app reported having at least one friend who did the same in 61.7% of cases. At the same time, 73.8% of Immuni non-adopters revealed not having a friend who used the application (χ2(1) = 57.07; p. < 0.001; Φ = 0.34; p. < 0.001). Finally, those who reported having at least one acquaintance who used Immuni passed from 16.9% in those who did not adopt Immuni to 35.3% in those who instead adopted it (χ2(1) = 18.59; p. < 0.001; Φ = 0.19; p. < 0.001). No statistically significant associations were found with participants’ gender (χ2(1) = 0.40; p. = 0.53), education level (χ2(5) = 10.86; p. = 0.06), occupation (χ2(6) = 8.94; p. = 0.18), or income (χ2(4) = 2.17; p. = 0.70). Thus, among categorical variables, the strongest association related to the adoption of Immuni appeared to be having a family member who used it, followed by having a friend who adopted it, and finally, in a more marginal way, knowing someone who relied on it.
3.2. Toward the Best Predictive Model for Immuni Adoption
Based on the statistically significant univariate effects, we tried to identify the best possible predictive model for Immuni adoption. For this purpose, we used logistic regression (with backward elimination), which allowed us to put together metric and qualitative predictors to predict a dichotomous outcome.
The model presented in Table 2 is statistically significant (χ2(8) = 193.82; p. <0.001) and explains approximately 52% of the variance according to Nagelkerke’s R2. For both continuous and categorical variables, an odds ratio greater than one highlighted a positive association, while an odds ratio less than 1 signaled a negative association. As we can gather from Table 2, observing a person who used the application, be it a family member (about four and a half times), a friend (about two and a half times), or an acquaintance (about two times), increased the probability of the contact tracing system being adopted. Moreover, people’s attitudes towards contact tracing (i.e., acceptance + and fear −), and their perception of Immuni as an effective way of dealing with the COVID-19 outbreak, appeared to shape Immuni adoption. Finally, a higher perceived likelihood of infection and feeling scared appeared to increase the adoption of the contact tracing system. Trust in Government and Government actions against COVID-19 variables did not fit into the best predictive model. Nonetheless, this fact does not imply that these variables do not have an effect, as underlined by univariate analyses.
4. Discussion and Conclusions
This study aimed to investigate the predictors of contact tracing adoption during the COVID-19 pandemic on an Italian sample. To conduct a comprehensive analysis of Immuni adoption, we administered an online survey inspired by the most important psychological models for behavioral change and technological adoption [20,21,22,23,24,25]. The participants were recruited through a voluntary census online during the second wave of the pandemic in Italy (from 23 October 2020 to 20 November 2020). Notably, during the data collection, new infections increased from 5901 to 37,242, and we also observed the second greatest increase in Immuni downloads after the initial release (Figure A2).
In order to identify the characteristics of the person who downloaded and used the Immuni application, we proceeded with the analysis of sociodemographic dimensions that, according to literature and confirming our hypothesis (H1), resulted in having no influence on the download and use of contact tracing apps [27,43]. Our study also provided evidence on the impact of factors that potentially affect technological adoption. In line with the literature, our results showed that people’s perceived efficacy of CT systems influenced Immuni adoption (H2; [26,27,28]).
Other factors, like social influence, seemed to promote the adoption of the CT system. We hypothesized that individuals who know important others that have downloaded and installed the Immuni application would have a higher probability to download and use it (H3). The results showed that the strongest association related to the adoption of Immuni appeared to be having significant others (in particular family members or friends) who used the application. These results corroborated other studies [27] that found individuals as more inclined to adopt, in general, new technology systems if significant others use them [27].
Fear of COVID-19 appeared as an important factor in predicting the adoption of mobile applications to deal with the COVID-19 pandemic.
Based on our findings, the participants that downloaded and used the Immuni application also had higher scores on risk perception (Perceived Severity and Likelihood of Infection) and experienced more fear compared to individuals that did not adopt the app (H4). Indeed, the literature shows that perception of severity and the likelihood of infection are factors that influence people’s health behaviors [41,42]. Furthermore, COVID-19 risk frightened people into adopting the app more [43]. People’s attitudes towards technology appeared also related to acceptance of contact tracing apps [43]. In line with the literature, our study shows that both components of attitudes toward CT systems (i.e., fear and acceptance) influenced the download and use of Immuni (H5).
Another factor that influences the usage of the CT system is the trust people have in the government (H6). Literature shows that willingness to use a contact-tracing application is associated with trust in the government [2]; in our research, a higher level of trust in government was associated with a higher probability of adopting the Immuni app.
Finally, we tried to identify the best possible predictive model for Immuni adoption, given the variables collected by our study. In general, each theoretical model (TAM, TRA, UTAUT) produced one or more predictors regarding the adoption of CTs; however, it is only through their integration into a new model specific to our condition that we reached a level with 52% variance explained.
The best predictors of contact tracing adoption turned out to be, first of all, having a behavioral model to observe (i.e., observing a significant one who used the application), followed by the perception of Immuni as an effective way of dealing with the COVID-19 outbreak (i.e., acceptance), and a higher perceived likelihood of infection fear. Trust in Government and Trust in Government actions against COVID-19 variables did not fit into the best predictive model; nevertheless, their effect on Immuni adoption was highlighted by univariate analyses. The role of the political dimension is undoubted, and we should not be misled by the fact that this dimension does not fit into the final model, probably due to the shared variance between Trust in Government and the other variables in the model.
Of course, this work is not without limits. The results of the present study are cross-sectional (no causation could be inferred) and not fully generalizable to all Italians, partly due to the high number of Tuscans. Moreover, our findings are supported by a biased sample of people that have technical skills and know how to operate with these apps. Thus, the described findings may not apply to the perceptions and behaviors of other people.
Future research should further deepen the investigation of the factors related to people’s adoption of contact tracing solutions. For instance, in our case, occupation did not associate with CT adoption; however, the type of profession could plausibly play a role. People that were allowed to work from home (i.e., remote working, home working) [58,59] already limited their contact with other people by default, so we can assume that they would be less likely to download and use CTs (i.e., they may perceive less need to do it) than people who had to work on-site and interact with others. People’s health status could be another valuable direction for future work, thus investigating whether the willingness to download and use the CT app is different between healthy individuals and those with COVID-19. Unfortunately, a recent publication based on a survey reported that just 0.8% referred to have been infected by Covid-19 [60], and thus a larger sample size would be needed to investigate such a difference.
Despite the aforementioned limitations, our work contributed to defining the factors (extracted from several psychological models) capable of promoting the adoption of contact tracing systems. Encouraging the adoption of contact tracing systems can help to control virus spread together with other measures such as wearing masks, physical distancing, and handwashing [60], although the efficacy of these apps to control the pandemic is not fully demonstrated [61].
In general, many things appeared to contribute to making things go wrong with CT functioning and adoption around the world: (a) many individuals do not have smartphones, especially in poor and disadvantaged countries [62,63]; (b) BLE technology was not originally designed to accurately estimate the distance between smartphones and thus is prone to errors [64]; (c) the efficacy of CT apps depend on user honesty (which is not always granted) and in the ease in reporting themselves as positive; (d) privacy and data security concerns [65,66,67,68]. In our specific case of Italian people who, despite having skills and opportunities to use CTs (i.e., no difficulties or barriers in using or accessing a smartphone), did not adopt it, we concluded that low levels of perceived efficacy of Immuni as a solution to deal with the pandemic, low-risk perception, trust in government and its action against COVID-19, together with a negative attitude towards CTs and not knowing others (i.e., family members, friends, and acquaintances) that already used the Immuni app may have contributed to an unsatisfying adoption of the system.
Thus, our results appear useful and exploitable for future public social campaigns aimed at dealing with contagious diseases (like the COVID-19) through contact tracing systems [16,69]. Designing public campaigns that leverage the identified factors could, in fact, contribute to better infection tracking due to wider adoption by the population.
Author Contributions
Conceptualization, A.G., M.F. and M.D.; methodology, A.G. and M.D.; formal analysis, A.G. and M.D.; investigation, M.F. and G.P.; data curation, A.G. and M.D.; writing—original draft preparation, A.G., M.F., G.P. and M.D.; writing—review and editing, A.G., M.F., G.P. and M.D.; All authors have read and agreed to the published version of the manuscript.
Funding
This research received no external funding.
Institutional Review Board Statement
The study was conducted according to the guidelines of the Declaration of Helsinki and approved by the Ethics Committee of University of Florence (protocol code 0092811).
Informed Consent Statement
Informed consent was obtained from all subjects involved in the study.
Data Availability Statement
The data presented in this study are available on request from the corresponding author.
Conflicts of Interest
The authors declare no conflict of interest.
Appendix A

Table A1.
Contact Tracing Systems worldwide. The Table reports the information regarding the CT system used, the number of people that downloaded it, and the number of infected people in each country until May 2021.
Table A1.
Contact Tracing Systems worldwide. The Table reports the information regarding the CT system used, the number of people that downloaded it, and the number of infected people in each country until May 2021.
| Country | CTS Name | Deployment Date | Source for CTS Download Data | People That Downloaded the CTS in Each Country until May 2021 | Infected People in Each Country until May 2021 | ||
|---|---|---|---|---|---|---|---|
| Raw Number | % | Raw Number | % | ||||
| Italy | Immuni | 15 June 2020 | https://www.immuni.italia.it/ (20 May 2021) | 10,455,260 | 17.3 | 4,131,078 | 6.8 |
| Singapore | TraceTogether | 20 March 2020 | https://www.straitstimes.com/singapore/more-than-1100-users-have-deregistered-from-tracetogether-vivian (20 May 2021) | 4,923,054 | 92 | 61,419 | 1 |
| New Zealand | NZ COVID-19 Tracer | 20 May 2020 | https://www.stuff.co.nz/national/health/300301448/covid19-as-few-as-one-in-12-of-the-28-million-tracer-app-users-scanning-daily (20 May 2021) | 2,810,683 | 55 | 2644 | 0.05 |
| Ireland | COVID-19 Tracker | 7 July 2020 | https://en.wikipedia.org/wiki/COVID_Tracker_Ireland (20 May 2021) | 2,510,000 | 50.4 | 254,013 | 5.1 |
| Finland | KoronaVilkku | 31 August 2020 | https://www.is.fi/taloussanomat/art-2000007821789.html (20 May 2021) | 2,350,000 | 42.7 | 89,270 | 1.6 |
| Iceland | Ranking C-19 | 04 April 2020 | https://unric.org/is/naerri-40-islendinga-med-rakningar-appid/ (20 May 2021) | 136,000 | 37.1 | 6526 | 1.8 |
| Switzerland | SwissCovid | 25 June 2020 | https://investigativedesk.com/data-covid-19-tracing-apps/ (20 May 2021) | 3,083,718 | 36,1 | ||
| UK | NHS COVID-19 | 24 September 2020 | https://www.statista.com/statistics/1190062/covid-19-app-downloads-uk/ (20 May 2021) | 21,000,000 | 30.8 | 4,457,742 | 6.5 |
| Germany | Corona-Warn-App | 16 June 2020 | https://de.statista.com/statistik/daten/studie/1125951/umfrage/downloads-der-corona-warn-app/ (20 May 2021) | 24,900,000 | 29.6 | 3,554,569 | 4.2 |
| The Netherlands | CoronaMelder | 17 September 2020 | https://www.icthealth.nl/nieuws/effectiviteit-eu-coronamelder-apps-onduidelijk/ (20 May 2021) | 4,900,000 | 28 | 1,600,840 | 9.1 |
| Israel ** | HaMagen | 07 July 2020 | https://www.cio.com/article/3591570/how-israels-hamagen-contact-tracing-app-rollout-went-wildly-astray.html (20 May 2021) | 2,500,000 | 25.2 | 839,030 | 8.5 |
| Australia | COVIDSafe | 26 June 2020 | https://www.abc.net.au/news/2020-06-02/coronavirus-covid19-covidsafe-app-how-many-downloads-greg-hunt/12295130 (20 May 2021) | 6,130,000 | 23.6 | 29,955 | 0.1 |
| Portugal | StayAway COVID | 09 September 2020 | https://pplware.sapo.pt/smartphones-tablets/app-stayaway-covid-regista-24-milhoes-de-downloads-ja-instalou/ (20 May 2021) | 2,415,536 | 23.5 | 840,493 | 8.1 |
| Belgium | Corona Alert | 09 September 2020 | https://www.lecho.be/economie-politique/belgique/general/succes-plus-que-mitige-pour-l-app-de-tracing-coronalert/10285959.html (20 May 2021) | 2,472,000 | 21.4 | 1,004,065 | 8.7 |
| Estonia | HOIA | 20 August 2020 | https://investigativedesk.com/data-covid-19-tracing-apps/ (20 May 2021) | 276,322 | 20.6 | 126,064 | 9.4 |
| Japan *** | Cocoa | 19 June 2020 | https://www.reuters.com/article/us-health-coronavirus-japan-app-idUSKBN2A31BA (20 May 2021) | 25,000,000 | 19.8 | 658,029 | 0.5 |
| Malta * | COVIDAlert | 18 September 2020 | https://investigativedesk.com/data-covid-19-tracing-apps/ (20 May 2021) | 99,329 | 19.3 | 30,469 | 5.9 |
| Norway | SmitteStop | 21 December 2020 | https://investigativedesk.com/data-covid-19-tracing-apps/ (20 May 2021) | 1,012,700 | 18,8 | 117,995 | 2.2 |
| Slovenia | #OstaniZdrav | 08 August 2020 | https://investigativedesk.com/data-covid-19-tracing-apps/ (20 May 2021) | 371,246 | 17.5 | 247,449 | 11.7 |
| Canada * | COVID Alert | 08 August 2020 | https://www.thestar.com/business/2021/04/06/is-the-covid-alert-app-a-failure.html (20 May 2021) | 6,500,000 | 17.1 | 1,314,304 | 3.4 |
| France | TousAntiCOVID | 22 October 2020 | https://www.statista.com/statistics/1186195/monthly-tousanticovid-app-downloads-in-france/ (20 May 2021) | 11,000,000 | 16.8 | 5,882,882 | 9 |
| Latvia * | ApturiCOVID | 29 May 2020 | https://investigativedesk.com/data-covid-19-tracing-apps/ (20 May 2021) | 316,000 | 16.6 | 125,689 | 6.6 |
| Spain | Radar COVID | 10 August 2020 | https://radarcovid.gob.es/estadisticas/descargas-radar (20 May 2021) | 7,345,988 | 15.7 | 3,592,751 | 7.7 |
| Austria | Stopp CORONA App | 03 March 2020 | https://investigativedesk.com/data-covid-19-tracing-apps/ (20 May 2021) | 1,400,000 | 15.7 | 633,960 | 7.1 |
| Denmark | SmitteStop | 18 June 2020 | https://www.oecd-opsi.org/covid-response/danish-covid-19-infection-tracing-app-smittestop/ (20 May 2021) | 660,000 | 11.3 | 262,859 | 4.5 |
| Lithuania | Korona Stop LT | 06 November 2020 | https://investigativedesk.com/data-covid-19-tracing-apps/ (20 May 2021) | 300,000 | 10.7 | 261,128 | 9.3 |
| Poland | Prote GO Safe | 09 June 2020 | https://antyapps.pl/kolejne-2-miliony-dla-protego-safe/ (20 May 2021) | 1,600,000 | 4.2 | 2,842,339 | 7.5 |
| The Czech Republic | eRouska | 04 April 2020 | https://www.idnes.cz/zpravy/domaci/ministerstvo-nefunkcni-chytra-karantena-miliony-aplikace-kontakty.A210218_185945_domaci_vank (20 May 2021) | 375,000 | 3.5 | 1,648,667 | 15.6 |
| Croatia | Stop COVID-19 | 07 July 2020 | https://www.koronavirus.hr/stop-covid-19-723/723 (20 May 2021) | 118,020 | 2.9 | 347,094 | 8.5 |
| South Korea | Corona 100m | 02 Febrary 2020 | N/A | N/A | N/A | 129,633 | 0.2 |
| Bahrain | BeAware | N/A | N/A | N/A | N/A | 194,289 | 11.8 |
| Colombia | CoronAPP | 03 March 2020 | N/A | N/A | N/A | 3,048,719 | 5.9 |
| Ghana | GH COVID-19 Tracker | N/A | N/A | N/A | N/A | 93,125 | 0.3 |
| Hungary | VirusRadar | 13 May 2020 | https://investigativedesk.com/data-covid-19-tracing-apps/ (20 May 2021) | N/A | N/A | 793,784 | 8.1 |
| Cyprus | CovTracer-EN | 11 March 2021 | https://investigativedesk.com/data-covid-19-tracing-apps/ (20 May 2021) | N/A | N/A | 49,000 | 5.5 |
| India | Aarogya Setu COVID-19 | 04 April 2020 | N/A | N/A | N/A | 23,703,665 | 1.7 |
| China | Alipay Health Code | N/A | N/A | N/A | N/A | 102,671 | 0.007 |
Note: N/A = not available (i.e., data was not produced, shared, or properly updated, OR there was no single source that combined and/or integrated downloads for different mobile device operating systems). * = download data updated to April 2021; ** = download data updated to November 2020; *** = download data updated to February 2021.
Table A2.
Sociodemographic characteristics of the sample.
| Total Sample | Adopters | Non-Adopters | |
|---|---|---|---|
| Variable | M(ds) or % | M(ds) or % | M(ds) or % |
| Age | 34.61 (14.14) | 34.87 (13.74) | 34.10 (14.92) |
| 18–44 years old | 74.9% | 76.0% | 72.7% |
| 45–64 years old | 23.0% | 22.2% | 24.4% |
| > 65 years old | 2.2% | 1.8% | 2.9% |
| Gender | |||
| Male | 22% | 22.8% | 20.3% |
| Female | 78% | 77.2% | 79.7% |
| Yearly Income | |||
| EUR < 10 k € | 35.7% | 35.3% | 36.6% |
| EUR 10 k–40 k € | 50.5% | 49.5% | 52.3% |
| EUR 40 k–70 k € | 10.0% | 11.2% | 7.6% |
| EUR 70 k–120 k € | 3.4% | 3.6% | 2.9% |
| EUR > 120 k € | 0.4% | 0.3% | 0.6% |
| Education level | |||
| Elementary school diploma | 0% | 0% | 0% |
| Lower secondary school diploma | 3.4% | 3.3% | 3.5% |
| High school diploma | 41.5% | 36.5% | 51.2% |
| Bachelor’s degree | 18.8% | 21.0% | 14.5% |
| Master’s Degree | 26.3% | 28.0% | 23.3% |
| University Master | 3.8% | 4.3% | 2.9% |
| Ph.D. | 6.2% | 7.0% | 4.7% |
| Occupational Status | |||
| Unemployed | 9.6% | 10.3% | 8.1% |
| Student | 37.9% | 35.0% | 43.6% |
| Self-employed | 18.0% | 21.0% | 12.2% |
| Public employee | 4.6% | 4.0% | 5.8% |
| Fixed-term employee | 7.0% | 7.0% | 7.0% |
| Permanent employee | 19.4% | 18.8% | 20.3% |
| Retired | 3.6% | 4.0% | 2.9% |
| Housing condition | |||
| Alone | 9.6% | 8.8% | 11.0% |
| With partner | 21.6% | 26.4% | 12.2% |
| With family | 59.7% | 55.0% | 68.6% |
| Friends/Roommates | 9.2% | 9.7% | 8.1% |
Note: N(Non-adopters): 172, N(Adopters): 329.
Figure A1.
Scatter plot. Relationship between the percentage of people that downloaded the CTSs and the infected population in each of the 19 selected countries.
Figure A1.
Scatter plot. Relationship between the percentage of people that downloaded the CTSs and the infected population in each of the 19 selected countries.

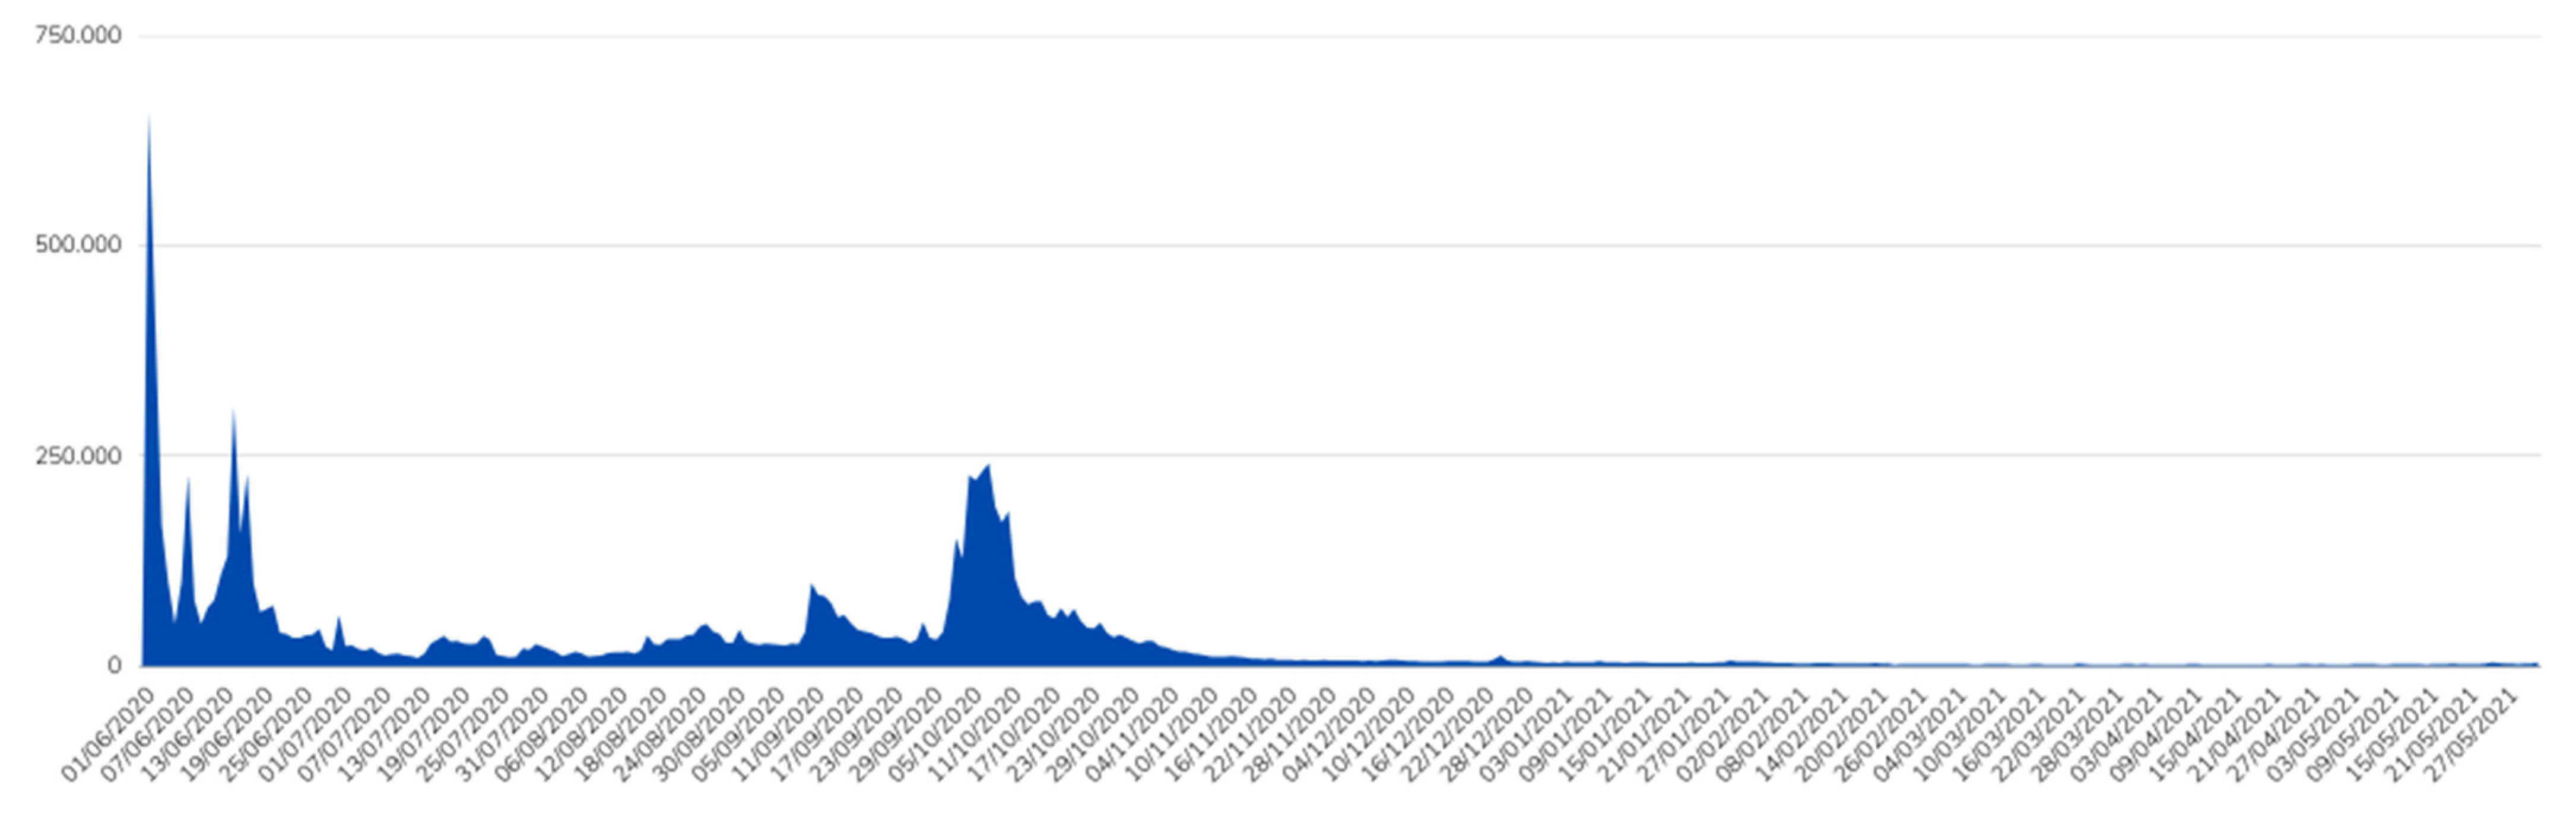
Figure A2.
Daily differences in Immuni downloads from its release. Data gathered from Immuni Dashboard Data, Dati andamento, (2021), GitHub repository, https://github.com/immuni-app/immuni-dashboard-data/blob/master/dati/andamento-download.csv (3 June 2021). In the Figure, we can observe two main peaks in time which coincide with the Immuni release period and the Italian COVID-19 second wave.

References
- Ferguson, N.; Laydon, D.; Nedjati Gilani, G.; Imai, N.; Ainslie, K.; Baguelin, M.; Bhatia, S.; Boonyasiri, A.; Cucunuba Perez, Z.; Cuomo-Dannenburg, G.; et al. Report 9: Impact of Non-Pharmaceutical Interventions (NPIs) to Reduce COVID19 Mortality and Healthcare Demand. Available online: https://www.imperial.ac.uk/mrc-global-infectious-disease-analysis/covid-19/report-9-impact-of-npis-on-covid-19/ (accessed on 25 October 2021).
- Guillon, M.; Kergall, P. Attitudes and opinions on quarantine and support for a contact-tracing application in France during the COVID-19 outbreak. Public Health 2020, 188, 21–31. [Google Scholar] [CrossRef] [PubMed]
- Bai, Y.; Yao, L.; Wei, T.; Tian, F.; Jin, D.-Y.; Chen, L.; Wang, M. Presumed Asymptomatic Carrier Transmission of COVID-19. JAMA 2020, 323, 1406–1407. [Google Scholar] [CrossRef] [PubMed] [Green Version]
- He, X.; Lau, E.H.Y.; Wu, P.; Deng, X.; Wang, J.; Hao, X.; Lau, Y.C.; Wong, J.Y.; Guan, Y.; Tan, X.; et al. Temporal dynamics in viral shedding and transmissibility of COVID-19. Nat. Med. 2020, 26, 672–675. [Google Scholar] [CrossRef] [PubMed] [Green Version]
- Ferretti, L.; Wymant, C.; Kendall, M.; Zhao, L.; Nurtay, A.; Abeler-Dörner, L.; Parker, M.; Bonsall, D.; Fraser, C. Quantifying SARS-CoV-2 transmission suggests epidemic control with digital contact tracing. Science 2020, 368, eabb6936. [Google Scholar] [CrossRef] [Green Version]
- Anderson, R.M.; Heesterbeek, H.; Klinkenberg, D.; Hollingsworth, T.D. How will country-based mitigation measures influence the course of the COVID-19 epidemic? Lancet 2020, 395, 931–934. [Google Scholar] [CrossRef]
- Bruns, D.P.; Kraguljac, N.V.; Bruns, T.R. COVID-19: Facts, Cultural Considerations, and Risk of Stigmatization. J. Transcult. Nurs. 2020, 31, 326–332. [Google Scholar] [CrossRef]
- Hale, T.; Angrist, N.; Kira, B.; Petherick, A.; Phillips, T.; Webster, S. Variation in Government Responses to COVID-19. Available online: https://www.bsg.ox.ac.uk/sites/default/files/2020-12/BSG-WP-2020-032-v10.pdf (accessed on 25 October 2021).
- Osman, M.; McLachlan, S.; Lucas, P.; Dube, K.; Hitman, G.A.; Kyrimi, E.; Neil, M. The thorny problems of COVID-19 Contact Tracing Apps: The need for a holistic approach. J. Behav. Econ. Policy 2020, 4, 57–61. [Google Scholar]
- Du, L.; Raposo, V.L.; Wang, M. COVID-19 Contact Tracing Apps: A Technologic Tower of Babel and the Gap for International Pandemic Control. JMIR MHealth UHealth 2020, 8, e23194. [Google Scholar] [CrossRef]
- Zhang, M.; Chow, A.; Smith, H. COVID-19 Contact-Tracing Apps: Analysis of the Readability of Privacy Policies. J. Med. Internet Res. 2020, 22, e21572. [Google Scholar] [CrossRef]
- Abeler, J.; Bäcker, M.; Buermeyer, U.; Zillessen, H. COVID-19 Contact Tracing and Data Protection Can Go Together. JMIR MHealth UHealth 2020, 8, e19359. [Google Scholar] [CrossRef] [Green Version]
- Bosco, C.; Cvajner, M. Investigating Italian Citizens’ Attitudes Towards Immuni, the Italian Contact Tracing App. In Proceedings of the Human-Computer Interaction–INTERACT 2021; Ardito, C., Lanzilotti, R., Malizia, A., Petrie, H., Piccinno, A., Desolda, G., Inkpen, K., Eds.; Springer International Publishing: Cham, Switzerland, 2021; pp. 34–42. [Google Scholar]
- Akinbi, A.; Forshaw, M.; Blinkhorn, V. Contact tracing apps for the COVID-19 pandemic: A systematic literature review of challenges and future directions for neo-liberal societies. Health Inf. Sci. Syst. 2021, 9, 18. [Google Scholar] [CrossRef]
- Munzert, S.; Selb, P.; Gohdes, A.; Stoetzer, L.F.; Lowe, W. Tracking and promoting the usage of a COVID-19 contact tracing app. Nat. Hum. Behav. 2021, 5, 247–255. [Google Scholar] [CrossRef]
- Seto, E.; Challa, P.; Ware, P. Adoption of COVID-19 Contact Tracing Apps: A Balance Between Privacy and Effectiveness. J. Med. Internet Res. 2021, 23, e25726. [Google Scholar] [CrossRef]
- Altmann, S.; Milsom, L.; Zillessen, H.; Blasone, R.; Gerdon, F.; Bach, R.; Kreuter, F.; Nosenzo, D.; Toussaert, S.; Abeler, J. Acceptability of App-Based Contact Tracing for COVID-19: Cross-Country Survey Study. JMIR MHealth UHealth 2020, 8, e19857. [Google Scholar] [CrossRef]
- He, W.; Zhang, Z.; Li, W. Information technology solutions, challenges, and suggestions for tackling the COVID-19 pandemic. Int. J. Inf. Manag. 2021, 57, 102287. [Google Scholar] [CrossRef]
- Balapour, A.; Reychav, I.; Sabherwal, R.; Azuri, J. Mobile technology identity and self-efficacy: Implications for the adoption of clinically supported mobile health apps. Int. J. Inf. Manag. 2019, 49, 58–68. [Google Scholar] [CrossRef]
- Zhang, X.; Guo, X.; Lai, K.; Guo, F.; Li, C. Understanding Gender Differences in m-Health Adoption: A Modified Theory of Reasoned Action Model. Telemed. E-Health 2014, 20, 39–46. [Google Scholar] [CrossRef]
- Fishbein, M. A theory of reasoned action: Some applications and implications. Nebr. Symp. Motiv. 1979, 27, 65–116. [Google Scholar]
- Deng, Z.; Hong, Z.; Ren, C.; Zhang, W.; Xiang, F. What Predicts Patients’ Adoption Intention Toward mHealth Services in China: Empirical Study. JMIR MHealth UHealth 2018, 6, e9316. [Google Scholar] [CrossRef] [Green Version]
- Dou, K.; Yu, P.; Deng, N.; Liu, F.; Guan, Y.; Li, Z.; Ji, Y.; Du, N.; Lu, X.; Duan, H. Patients’ Acceptance of Smartphone Health Technology for Chronic Disease Management: A Theoretical Model and Empirical Test. JMIR MHealth UHealth 2017, 5, e7886. [Google Scholar] [CrossRef]
- Hoque, R.; Sorwar, G. Understanding factors influencing the adoption of mHealth by the elderly: An extension of the UTAUT model. Int. J. Med. Inf. 2017, 101, 75–84. [Google Scholar] [CrossRef]
- Venkatesh, V.; Morris, M.G.; Davis, G.B.; Davis, F.D. User Acceptance of Information Technology: Toward a Unified View. MIS Q. 2003, 27, 425–478. [Google Scholar] [CrossRef] [Green Version]
- Venkatesh, V.; Thong, J.Y.L.; Xu, X. Consumer Acceptance and Use of Information Technology: Extending the Unified Theory of Acceptance and Use of Technology. MIS Q. 2012, 36, 157–178. [Google Scholar] [CrossRef] [Green Version]
- Walrave, M.; Waeterloos, C.; Ponnet, K. Ready or Not for Contact Tracing? Investigating the Adoption Intention of COVID-19 Contact-Tracing Technology Using an Extended Unified Theory of Acceptance and Use of Technology Model. Cyberpsychology Behav. Soc. Netw. 2021, 24, 377–383. [Google Scholar] [CrossRef]
- Thusi, P.; Maduku, D.K. South African millennials’ acceptance and use of retail mobile banking apps: An integrated perspective. Comput. Hum. Behav. 2020, 111, 106405. [Google Scholar] [CrossRef]
- Sindermann, C.; Sha, P.; Zhou, M.; Wernicke, J.; Schmitt, H.S.; Li, M.; Sariyska, R.; Stavrou, M.; Becker, B.; Montag, C. Assessing the Attitude Towards Artificial Intelligence: Introduction of a Short Measure in German, Chinese, and English Language. KI-Künstl. Intell. 2021, 35, 109–118. [Google Scholar] [CrossRef]
- Broadbent, E.; Kuo, I.H.; Lee, Y.I.; Rabindran, J.; Kerse, N.; Stafford, R.; MacDonald, B.A. Attitudes and Reactions to a Healthcare Robot. Telemed. E-Health 2010, 16, 608–613. [Google Scholar] [CrossRef] [PubMed]
- Nomura, T.; Kanda, T.; Suzuki, T. Experimental investigation into influence of negative attitudes toward robots on human–robot interaction. AI Soc. 2006, 20, 138–150. [Google Scholar] [CrossRef]
- Persson, A.; Laaksoharju, M.; Koga, H. We Mostly Think Alike: Individual Differences in Attitude Towards AI in Sweden and Japan. Rev. Socionetwork Strateg. 2021, 15, 123–142. [Google Scholar] [CrossRef]
- Venkatesh, V.; Brown, S.A. A Longitudinal Investigation of Personal Computers in Homes: Adoption Determinants and Emerging Challenges. MIS Q. 2001, 25, 71–102. [Google Scholar] [CrossRef] [Green Version]
- Thompson, R.L.; Higgins, C.A.; Howell, J.M. Personal Computing: Toward a Conceptual Model of Utilization. MIS Q. 1991, 15, 125–143. [Google Scholar] [CrossRef]
- Moore, G.C.; Benbasat, I. Development of an Instrument to Measure the Perceptions of Adopting an Information Technology Innovation. Inf. Syst. Res. 1991, 2, 192–222. [Google Scholar] [CrossRef] [Green Version]
- Bandura, A. Social Foundations of Thought and Action: A Social Cognitive Theory; Prentice-Hall, Inc.: Englewood Cliffs, NJ, USA, 1986; ISBN 978-0-13-815614-5. [Google Scholar]
- Sussman, S.W.; Siegal, W.S. Informational Influence in Organizations: An Integrated Approach to Knowledge Adoption. Inf. Syst. Res. 2003, 14, 47–65. [Google Scholar] [CrossRef] [Green Version]
- Arora, R.; Stoner, C.; Arora, A. Using framing and credibility to incorporate exercise and fitness in individuals’ lifestyle. J. Consum. Mark. 2006, 23, 199–207. [Google Scholar] [CrossRef]
- Li, C.-Y. Persuasive messages on information system acceptance: A theoretical extension of elaboration likelihood model and social influence theory. Comput. Hum. Behav. 2013, 29, 264–275. [Google Scholar] [CrossRef]
- Giffin, K. The contribution of studies of source credibility to a theory of interpersonal trust in the communication process. Psychol. Bull. 1967, 68, 104–120. [Google Scholar] [CrossRef]
- Prati, G.; Pietrantoni, L.; Zani, B. A Social-Cognitive Model of Pandemic Influenza H1N1 Risk Perception and Recommended Behaviors in Italy. Risk Anal. 2011, 31, 645–656. [Google Scholar] [CrossRef]
- Wilson, R.S.; Zwickle, A.; Walpole, H. Developing a Broadly Applicable Measure of Risk Perception. Risk Anal. 2019, 39, 777–791. [Google Scholar] [CrossRef]
- Jansen-Kosterink, S.; Hurmuz, M.; den Ouden, M.; van Velsen, L. Predictors to Use Mobile Apps for Monitoring COVID-19 Symptoms and Contact Tracing: A Survey among Dutch Citizens. Available online: https://www.medrxiv.org/content/10.1101/2020.06.02.20113423v1.full-text (accessed on 25 October 2021).
- Fonseca, F.; Conticelli, E.; Papageorgiou, G.; Ribeiro, P.; Jabbari, M.; Tondelli, S.; Ramos, R. Use and Perceptions of Pedestrian Navigation Apps: Findings from Bologna and Porto. ISPRS Int. J. Geo-Inf. 2021, 10, 446. [Google Scholar] [CrossRef]
- Jamal, S.; Habib, M.A. Investigation of the use of smartphone applications for trip planning and travel outcomes. Transp. Plan. Technol. 2019, 42, 227–243. [Google Scholar] [CrossRef]
- Horstmann, K.T.; Buecker, S.; Krasko, J.; Kritzler, S.; Terwiel, S. Who does or does not use the ‘Corona-Warn-App’ and why? Eur. J. Public Health 2021, 31, 49–51. [Google Scholar] [CrossRef]
- Chan, E.Y.; Saqib, N.U. Privacy concerns can explain unwillingness to download and use contact tracing apps when COVID-19 concerns are high. Comput. Hum. Behav. 2021, 119, 106718. [Google Scholar] [CrossRef] [PubMed]
- Im, T.; Cho, W.; Porumbescu, G.; Park, J. Internet, Trust in Government, and Citizen Compliance. J. Public Adm. Res. Theory 2014, 24, 741–763. [Google Scholar] [CrossRef]
- Widaningrum, A. Public Trust and Regulatory Compliance. J. Ilmu Sos. Dan Ilmu Polit. 2017, 21, 1–13. [Google Scholar] [CrossRef] [Green Version]
- Camarena, P.M.; Sarigiani, P.A.; Petersen, A.C. Gender-specific pathways to intimacy in early adolescence. J. Youth Adolesc. 1990, 19, 19–32. [Google Scholar] [CrossRef] [PubMed]
- McPherson, M.; Smith-Lovin, L.; Cook, J.M. Birds of a Feather: Homophily in Social Networks. Annu. Rev. Sociol. 2001, 27, 415–444. [Google Scholar] [CrossRef] [Green Version]
- Watson, D.; Clark, L.A.; Tellegen, A. Development and validation of brief measures of positive and negative affect: The PANAS scales. J. Pers. Soc. Psychol. 1988, 54, 1063–1070. [Google Scholar] [CrossRef]
- Terraciano, A.; McCrae, R.R.; Costa, P.T., Jr. Factorial and construct validity of the Italian Positive and Negative Affect Schedule (PANAS). Eur. J. Psychol. Assess. 2003, 19, 131–141. [Google Scholar] [CrossRef]
- Delacre, M.; Lakens, D.; Leys, C. Why Psychologists Should by Default Use Welch’s t-test Instead of Student’s t-test. Int. Rev. Soc. Psychol. 2017, 30, 92–101. [Google Scholar] [CrossRef] [Green Version]
- Cohen, J. Statistical Power Analysis for the Behavioral Sciences, Rev. ed.; Academic Press: New York, NY, USA, 1977; ISBN 978-0-12-179060-8. [Google Scholar]
- Thompson, B. Effect sizes, confidence intervals, and confidence intervals for effect sizes. Psychol. Sch. 2007, 44, 423–432. [Google Scholar] [CrossRef]
- Akoglu, H. User’s guide to correlation coefficients. Turk. J. Emerg. Med. 2018, 18, 91–93. [Google Scholar] [CrossRef]
- Moretti, A.; Menna, F.; Aulicino, M.; Paoletta, M.; Liguori, S.; Iolascon, G. Characterization of Home Working Population during COVID-19 Emergency: A Cross-Sectional Analysis. Int. J. Environ. Res. Public Health 2020, 17, 6284. [Google Scholar] [CrossRef]
- Bouziri, H.; Smith, D.R.M.; Descatha, A.; Dab, W.; Jean, K. Working from home in the time of COVID-19: How to best preserve occupational health? Occup. Environ. Med. 2020, 77, 509–510. [Google Scholar] [CrossRef]
- Duradoni, M.; Fiorenza, M.; Guazzini, A. When Italians Follow the Rules against COVID Infection: A Psychological Profile for Compliance. COVID 2021, 1, 246–262. [Google Scholar] [CrossRef]
- Madoery, P.G.; Detke, R.; Blanco, L.; Comerci, S.; Fraire, J.; Gonzalez Montoro, A.; Bellassai, J.C.; Britos, G.; Ojeda, S.; Finochietto, J.M. Feature selection for proximity estimation in COVID-19 contact tracing apps based on Bluetooth Low Energy (BLE). Pervasive Mob. Comput. 2021, 77, 101474. [Google Scholar] [CrossRef]
- Oyelaran-Oyeyinka, B.; Adeya, C.N. Internet Access in Africa: An Empirical Exploration. Available online: https://ideas.repec.org/p/unm/unuint/200205.html (accessed on 25 October 2021).
- Mariscal, J. Digital divide in a developing country. Telecommun. Policy 2005, 29, 409–428. [Google Scholar] [CrossRef]
- Shubina, V.; Ometov, A.; Simona Lohan, E. Technical Perspectives of Contact-Tracing Applications on Wearables for COVID-19 Control. In Proceedings of the 2020 12th International Congress on Ultra Modern Telecommunications and Control Systems and Workshops (ICUMT), Brno, Czech Republic, 5–7 October 2020; pp. 229–235. [Google Scholar]
- Almeida, F. Technological Solutions for Screening and Geolocation of COVID-19 Infected People: A Country Comparison Approach. Front. Health Inform. 2021, 10, 62. [Google Scholar] [CrossRef]
- Klar, R.; Lanzerath, D. The ethics of COVID-19 tracking apps–challenges and voluntariness. Res. Ethics 2020, 16, 1–9. [Google Scholar] [CrossRef]
- Dubov, A.; Shoptawb, S. The Value and Ethics of Using Technology to Contain the COVID-19 Epidemic. Am. J. Bioeth. 2020, 20, W7–W11. [Google Scholar] [CrossRef]
- Pagliari, C. The ethics and value of contact tracing apps: International insights and implications for Scotland’s COVID-19 response. J. Glob. Health 2020, 10, 020103. [Google Scholar] [CrossRef]
- Xu, W.; Wu, J.; Cao, L. COVID-19 pandemic in China: Context, experience and lessons. Health Policy Technol. 2020, 9, 639–648. [Google Scholar] [CrossRef]
Figure 1.
Level of adoption of the CT systems (%) in the 30 countries that made the download CT app data available.
Figure 1.
Level of adoption of the CT systems (%) in the 30 countries that made the download CT app data available.

Table 1.
Univariate analysis for Immuni adoption through Welch’s t-test.
| Variable | Adoption | M | s.d. | t * | df | Cohen d |
|---|---|---|---|---|---|---|
| Immuni Efficacy | No | 2.72 | 1.06 | −10.25 *** | 326.94 | −0.97 |
| Yes | 3.72 | 0.99 | ||||
| Risk Perception: Perceived Severity | No | 11.22 | 2.37 | −2.86 ** | 295.05 | −0.27 |
| Yes | 11.82 | 1.96 | ||||
| Risk Perception: Perceived Coping Efficacy | No | 3.41 | 0.85 | NS | ||
| Yes | 3.53 | 0.86 | ||||
| Risk Perception: Likelihood of Infection | No | 3.04 | 1.00 | −3.14 ** | 323.55 | −0.30 |
| Yes | 3.33 | 0.92 | ||||
| PANAS: Scared | No | 2.26 | 0.89 | −2.10 * | 363.25 | −0.17 |
| Yes | 2.42 | 0.94 | ||||
| ATCTS: Fear(log) | No | 2.34 | 0.84 | 8.78 *** | 339.33 | 0.90 |
| Yes | 1.57 | 0.87 | ||||
| ATCTS: Acceptance | No | 10.39 | 5.22 | −10.45 *** | 280.61 | −1.00 |
| Yes | 15.16 | 4.04 | ||||
| Trust in Government | No | 2.50 | 1.07 | −5.78 *** | 311.03 | −0.56 |
| Yes | 3.06 | 0.94 | ||||
| Trust in Government actions against COVID-19 | No | 2.98 | 1.14 | −5.46 *** | 301.94 | −0.55 |
| Yes | 3.54 | 0.87 |
Note: t *: Welch t test; N(no): 172, N(yes): 329; *: p < 0.05; **: p < 0.01; ***: p < 0.001. NS = not statistically significant result.
Table 2.
Logistic regression model for Immuni adoption.
| Predictor | β | SE β | Wald χ2 | df | p-Value | Odds Ratio |
|---|---|---|---|---|---|---|
| PANAS: Scared | 0.31 | 0.16 | 3.85 | 1 | 0.050 | 1.37 |
| Immuni Efficacy | 0.49 | 0.14 | 11.91 | 1 | 0.001 | 1.62 |
| Family member uses CT | 1.53 | 0.29 | 28.37 | 1 | < 0.001 | 4.62 |
| Friend uses CT | 0.95 | 0.28 | 11.10 | 1 | 0.001 | 2.60 |
| Acquaintance uses CT | 0.68 | 0.34 | 3.98 | 1 | 0.046 | 1.97 |
| Risk Perception: Likelihood of Infection | 0.27 | 0.14 | 3.38 | 1 | 0.050 | 1.31 |
| ATCTS: Fear(log) | −0.49 | 0.18 | 7.18 | 1 | 0.007 | 0.61 |
| ATCTS: Acceptance | 0.13 | 0.03 | 12.38 | 1 | < 0.001 | 1.14 |
Publisher’s Note: MDPI stays neutral with regard to jurisdictional claims in published maps and institutional affiliations. |
© 2021 by the authors. Licensee MDPI, Basel, Switzerland. This article is an open access article distributed under the terms and conditions of the Creative Commons Attribution (CC BY) license (https://creativecommons.org/licenses/by/4.0/).
Share and Cite
MDPI and ACS Style
Guazzini, A.; Fiorenza, M.; Panerai, G.; Duradoni, M. What Went Wrong? Predictors of Contact Tracing Adoption in Italy during COVID-19 Pandemic. Future Internet 2021, 13, 286. https://doi.org/10.3390/fi13110286
AMA Style
Guazzini A, Fiorenza M, Panerai G, Duradoni M. What Went Wrong? Predictors of Contact Tracing Adoption in Italy during COVID-19 Pandemic. Future Internet. 2021; 13(11):286. https://doi.org/10.3390/fi13110286
Chicago/Turabian StyleGuazzini, Andrea, Maria Fiorenza, Gabriele Panerai, and Mirko Duradoni. 2021. "What Went Wrong? Predictors of Contact Tracing Adoption in Italy during COVID-19 Pandemic" Future Internet 13, no. 11: 286. https://doi.org/10.3390/fi13110286
Note that from the first issue of 2016, this journal uses article numbers instead of page numbers. See further details here.