
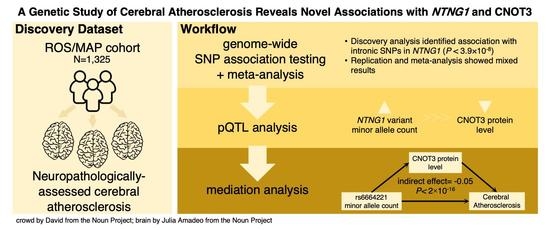
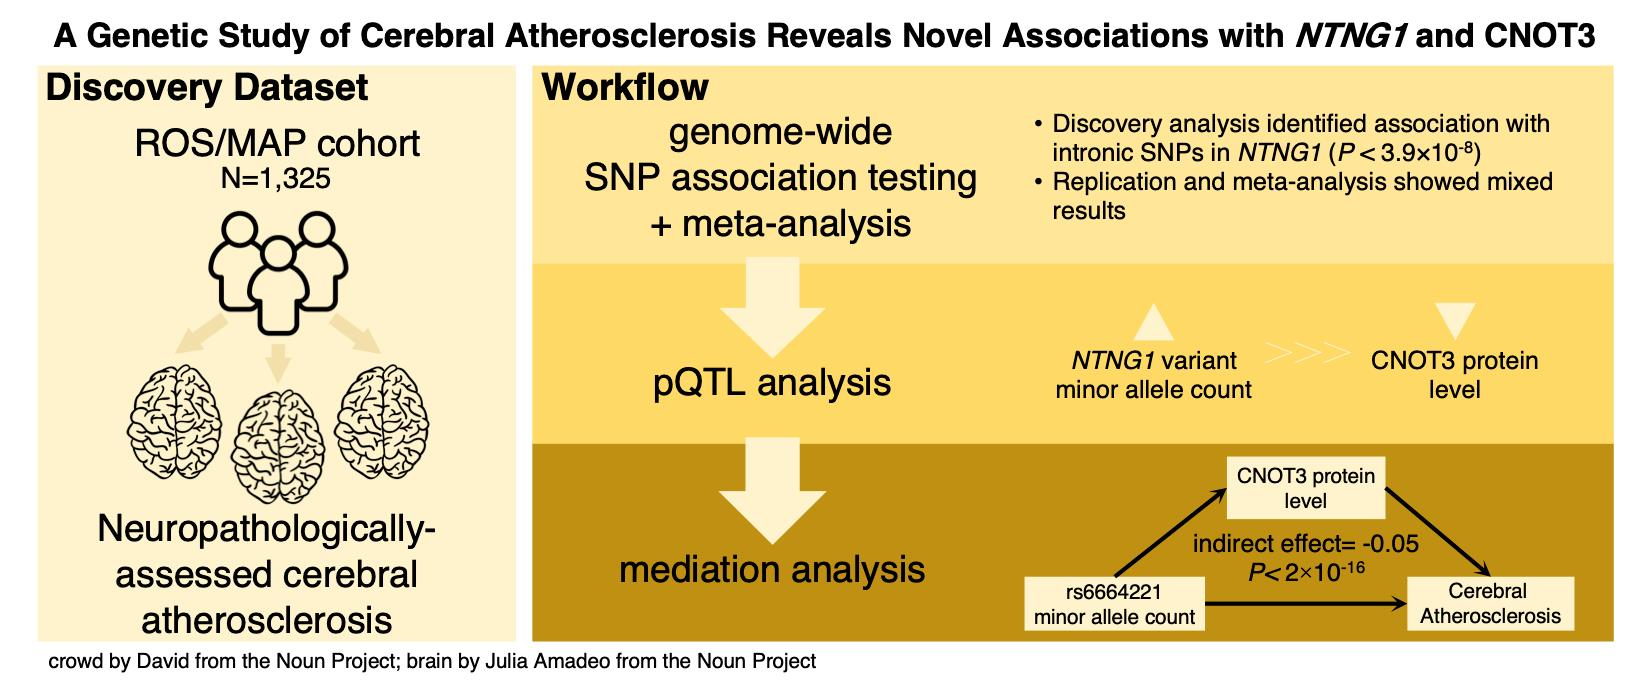
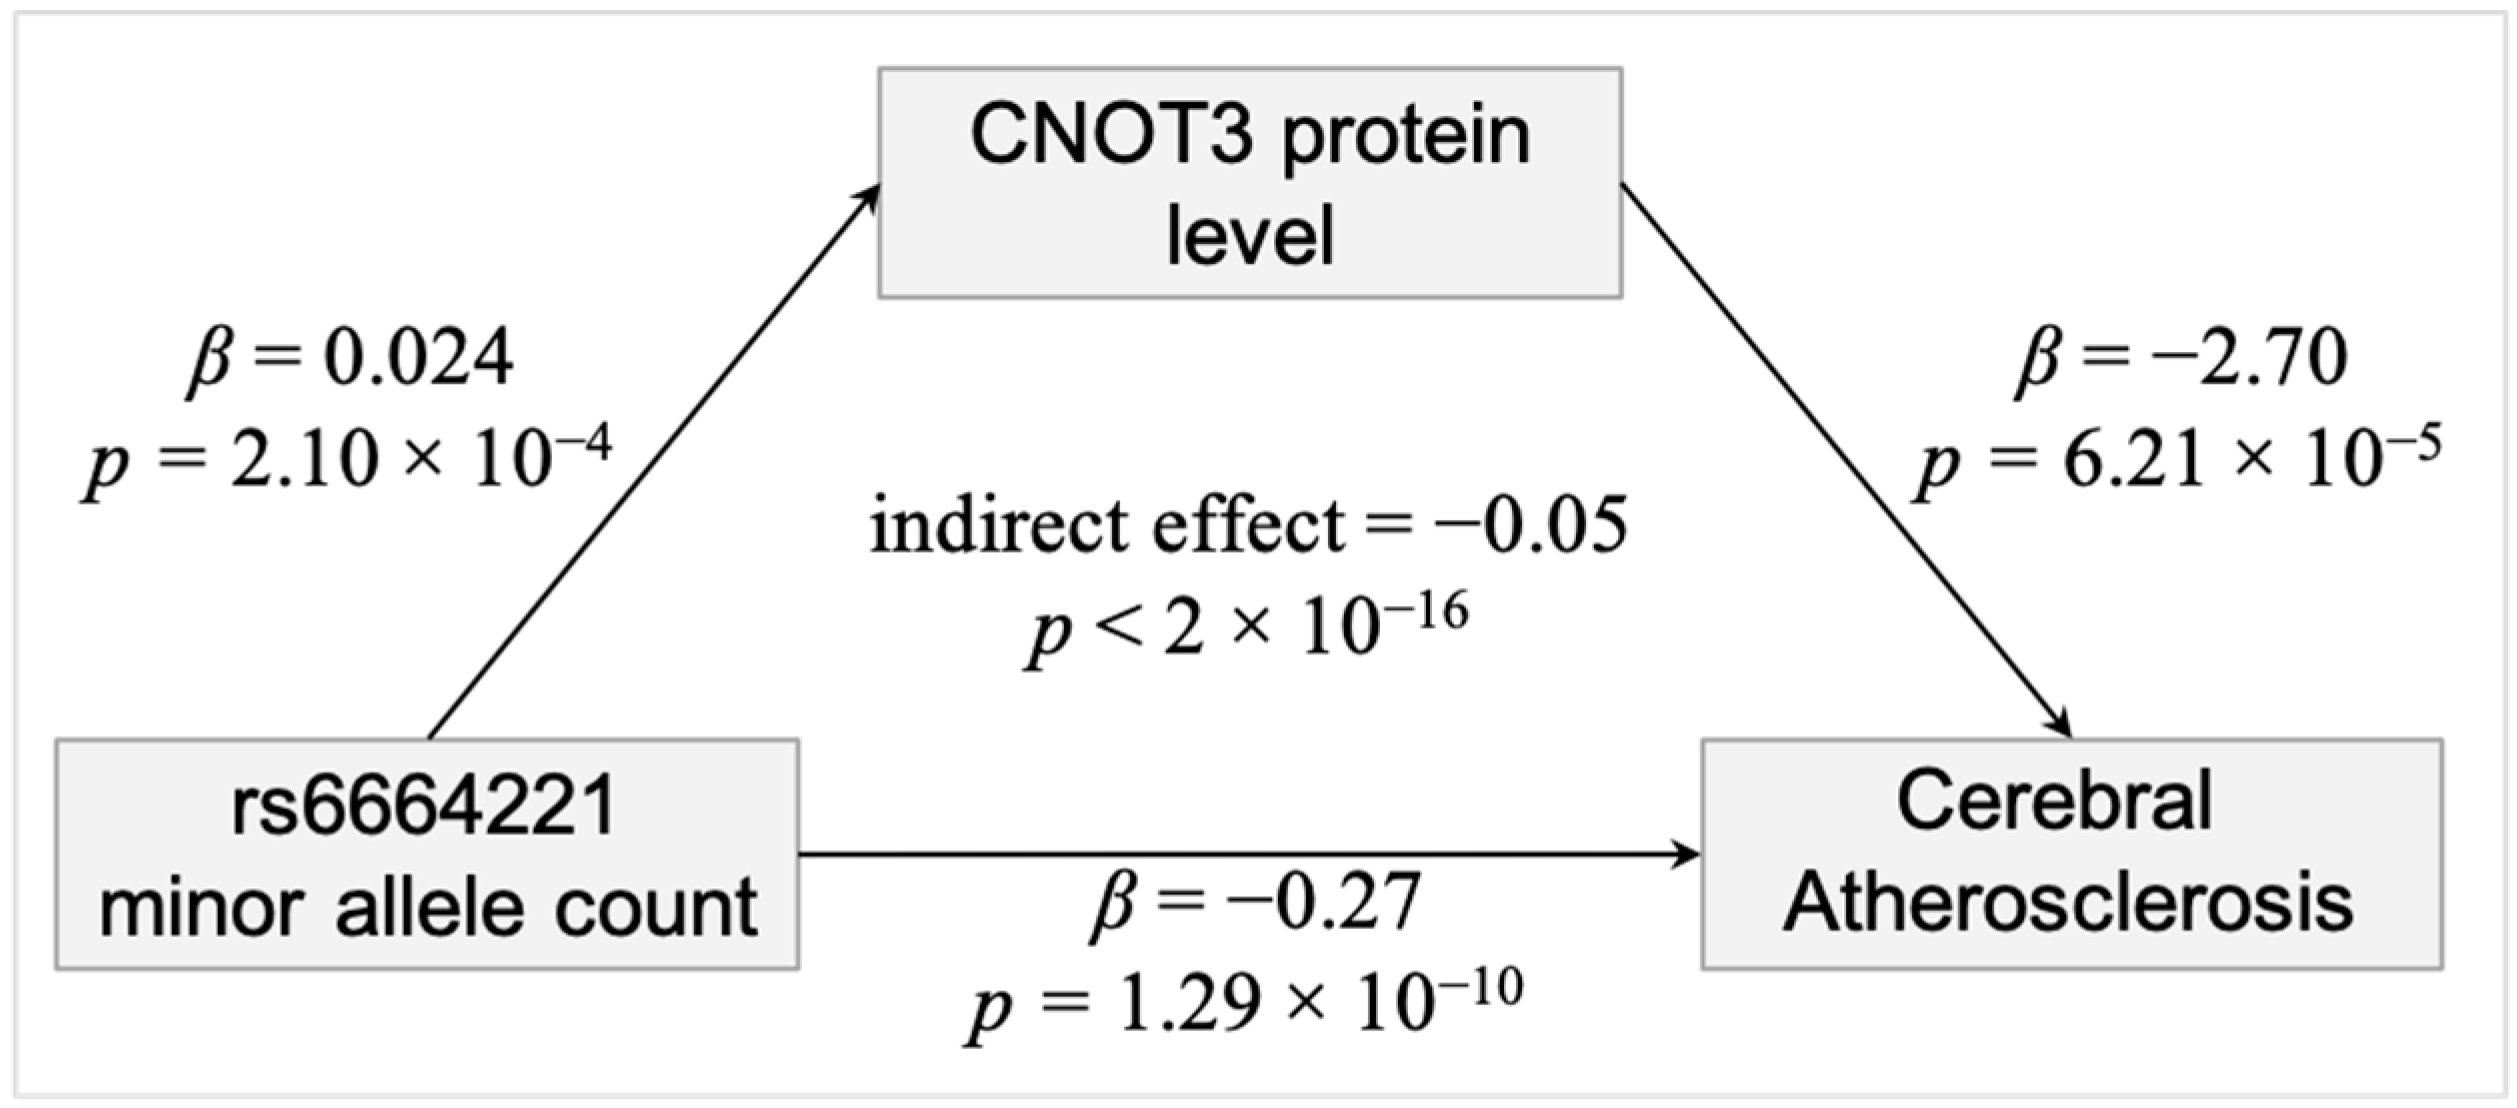
A Genetic Study of Cerebral Atherosclerosis Reveals Novel Associations with NTNG1 and CNOT3

 ,
,
Abstract
:
1. Introduction
2. Materials and Methods
2.1. Discovery Cohort
2.2. Cerebral Atherosclerosis Assessment
2.3. Genotyping and SNP Association Testing
2.4. Meta-Analysis
2.5. Protein-Protein Interaction
3. Results
4. Discussion
5. Conclusions
Author Contributions
Funding
Institutional Review Board Statement
Informed Consent Statement
Data Availability Statement
Acknowledgments
Conflicts of Interest
Appendix A


| ADGC | METAL (ROS/MAP, Banner, ADGC) | |||
|---|---|---|---|---|
| SNP | β (SE) | p | Overall Effect (SE) | p |
| rs7531573 | 0.02 (0.03) | 0.65 | −0.08 (0.02) | 3.9 × 10⁻⁴ |
| rs12035149 | 0.02 (0.03) | 0.51 | −0.92 (0.02) | 5.4 × 10⁻⁴ |
| rs10881463 | 0.02 (0.03) | 0.61 | −0.08 (0.02) | 4.6 × 10⁻⁴ |
| rs11185092 | 0.02 (0.03) | 0.54 | −0.91 (0.02) | 2.2 × 10⁻⁴ |
| rs11185093 | 0.02 (0.03) | 0.55 | −0.09 (0.02) | 2.2 × 10⁻⁴ |
| rs12742040 | 0.07 (0.04) | 0.11 | −0.09 (0.03) | 1.3 × 10⁻³ |
| rs4274093 | 0.06 (0.04) | 0.18 | −0.10 (0.03) | 8.1 × 10⁻⁴ |
| rs6664221 | 0.06 (0.04) | 0.15 | −0.90 (0.03) | 4.5 × 10⁻⁴ |
| Banner | ROS/MAP | ADGC (All Waves) | ADGC Wave 1 | ADGC Wave 2 | ADGC Wave 3 | ADGC Wave 4 | ADGC Wave 5 | ADGC Wave 6 | ADGC Wave 7 | ||
|---|---|---|---|---|---|---|---|---|---|---|---|
| Sample Count | 154 | 1325 | 1914 | 146 | 277 | 308 | 297 | 344 | 338 | 204 | |
| Age (years) | median | 86 | 90 | 85 | 85 | 85 | 86 | 85 | 86 | 84 | 84 |
| mean | 85.5 | 89.5 | 83.7 | 84.8 | 84.8 | 84.4 | 83.4 | 84.5 | 81.4 | 83.3 | |
| SD | 7.11 | 6.56 | 9.73 | 8.75 | 7.05 | 10.41 | 10.05 | 9.20 | 12.17 | 7.42 | |
| range | 66–103 | 66–108 | 47–111 | 57–105 | 65–98 | 55–111 | 47–103 | 56–102 | 52–109 | 67–102 | |
| Sex | N female | 66 | 877 | 916 | 72 | 135 | 141 | 133 | 175 | 169 | 91 |
| N male | 88 | 448 | 998 | 74 | 142 | 167 | 164 | 169 | 169 | 113 | |
| % female | 43% | 66% | 48% | 49% | 49% | 46% | 45% | 51% | 50% | 45% | |
| % male | 57% | 34% | 52% | 51% | 51% | 54% | 55% | 49% | 50% | 55% | |
| Cerebral Atherosclerosis | median | 2 | 1 | 1 | 1 | 2 | 2 | 1 | 1 | 1 | 1 |
| mean | 1.87 | 1.25 | 1.41 | 1.38 | 1.66 | 1.47 | 1.31 | 1.38 | 1.31 | 1.33 | |
| SD | 0.96 | 0.81 | 0.92 | 0.91 | 0.90 | 0.87 | 0.93 | 0.89 | 0.90 | 1.02 | |
| Cognitive Diagnosis at Death | % Normal | 40% | 30% | 16% | 38% | 5% | 14% | 13% | 21% | 12% | 16% |
| % MCI | 16% | 22% | 11% | 12% | 3% | 7% | 16% | 13% | 15% | 5% | |
| % AD | 44% | 39% | 47% | 33% | 72% | 59% | 44% | 36% | 46% | 32% | |
| % Other Dementia | 0% | 2% | 26% | 18% | 20% | 20% | 26% | 29% | 26% | 47% | |
| PMI (hours) | median | 3.0 | 6.6 | 9.0 | 8.3 | 7.0 | 9.2 | 10.6 | 9.7 | 10.0 | 7.9 |
| mean | 3.0 | 9.1 | 13.5 | 11.7 | 11.8 | 13.6 | 14.2 | 14.6 | 14.3 | 12.2 | |
| SD | 0.8 | 8.0 | 13.8 | 9.2 | 12.7 | 13.1 | 13.5 | 14.9 | 14.0 | 14.5 | |
| range | 1.5–5.5 | 0.0–98.3 | 0.0–99.0 | 0.5–37.5 | 1.3–81.8 | 0.0–63.7 | 0.0–72.0 | 1.3–96.0 | 0.0–96.0 | 0.0–99.0 | |
| N missing | 0 | 0 | 1112 | 107 | 194 | 220 | 205 | 210 | 133 | 43 | |
| Gross Infarct * | % present | 44% | 44% | 20% | 25% | 22% | 18% | 20% | 20% | 19% | 16% |
| N missing | 0 | 0 | 4 | 1 | 0 | 1 | 0 | 1 | 1 | 0 | |
| Microinfarct * | % present | − | 38% | 24% | 27% | 22% | 23% | 19% | 22% | 28% | 27% |
| N missing | − | 0 | 3 | 1 | 0 | 1 | 1 | 0 | 0 | 0 | |
| Braak Stage | median | 4 | 4 | 5 | 4 | 5 | 5 | 5 | 4 | 5 | 5 |
| mean | 4.0 | 3.6 | 4.4 | 3.8 | 4.8 | 4.5 | 4.5 | 3.8 | 4.6 | 4.6 | |
| SD | 1.3 | 1.2 | 1.7 | 1.7 | 1.5 | 1.7 | 1.6 | 1.8 | 1.6 | 1.7 | |
| N missing | 0 | 0 | 3 | 0 | 1 | 0 | 1 | 1 | 0 | 0 | |
| CERAD Neuritic Plaque Density | none | 21% | − | 17% | 27% | 10% | 16% | 15% | 20% | 16% | 17% |
| sparse | 8% | − | 13% | 12% | 8% | 12% | 13% | 22% | 13% | 11% | |
| moderate | 18% | − | 22% | 20% | 16% | 23% | 26% | 26% | 19% | 21% | |
| frequent | 52% | − | 48% | 41% | 67% | 49% | 46% | 32% | 53% | 51% | |
| N missing | 3 | − | 1 | 0 | 0 | 0 | 0 | 1 | 0 | 0 | |
| CERAD confidence in AD | No AD | 24% | 23% | − | − | − | − | − | − | − | − |
| Possible AD | 25% | 9% | − | − | − | − | − | − | − | − | |
| Probable AD | 5% | 35% | − | − | − | − | − | − | − | − | |
| Definite AD | 40% | 33% | − | − | − | − | − | − | − | − | |
| N missing | 10 | 0 | − | − | − | − | − | − | − | − |
| ROS/MAP v. ADGC | ROS/MAP v. Banner | |||||||||
|---|---|---|---|---|---|---|---|---|---|---|
| χ2 | t | df | N | p | χ2 | t | df | N | p | |
| % Female | 105.7 | 1 | 3239 | 8.5 × 10⁻²⁵ | 31.5 | 1 | 1479 | 2.0 × 10⁻⁸ | ||
| Cognitive Diagnosis * | 451.5 | 3 | 3153 | 1.5 × 10−97 | 10.0 | 3 | 1393 | 1.9 × 10⁻² | ||
| % Gross Infarct * | 222.0 | 1 | 3235 | 3.4 × 10−50 | 0.0 | 1 | 1479 | 9.5 × 10⁻¹ | ||
| % Microinfarct * | 71.9 | 1 | 3236 | 2.3 × 10⁻¹⁷ | 1.8 | 1 | 1479 | 1.9 × 10⁻¹ | ||
| Age | 20.0 | 3196.9 | 3239 | 1.0 × 10−83 | 6.6 | 185.6 | 1479 | 3.2 × 10⁻¹⁰ | ||
| Cerebral Atherosclerosis | −5.2 | 3048.0 | 3239 | 2.6 × 10⁻⁷ | −7.7 | 179.3 | 1479 | 8.7 × 10⁻¹³ | ||
| Braak Stage * | −14.9 | 3220.7 | 3229 | 2.6 × 10−48 | −3.0 | 187.4 | 1479 | 2.9 × 10⁻³ | ||
References
- Lusis, A.J.; Mar, R.; Pajukanta, P. Genetics of atherosclerosis. Annu. Rev. Genom. Hum. Genet. 2004, 5, 189–218. [Google Scholar] [CrossRef] [Green Version]
- Bae, H.J.; Lee, J.; Park, J.M.; Kwon, O.; Koo, J.S.; Kim, B.K.; Pandey, D.K. Risk factors of intracranial cerebral atherosclerosis among asymptomatics. Cerebrovasc. Dis. 2007, 24, 355–360. [Google Scholar] [CrossRef]
- Wong, L.K.S. Global Burden of Intracranial Atherosclerosis. Int. J. Stroke 2006, 1, 158–159. [Google Scholar] [CrossRef]
- White, H.; Boden-Albala, B.; Wang, C.; Elkind, M.S.; Rundek, T.; Wright, C.B.; Sacco, R.L. Ischemic stroke subtype incidence among whites, blacks, and Hispanics: The Northern Manhattan Study. Circulation 2005, 111, 1327–1331. [Google Scholar] [CrossRef] [Green Version]
- Gorelick, P.B.; Wong, K.S.; Bae, H.J.; Pandey, D.K. Large artery intracranial occlusive disease: A large worldwide burden but a relatively neglected frontier. Stroke 2008, 39, 2396–2399. [Google Scholar] [CrossRef] [Green Version]
- Qiao, Y.; Suri, F.K.; Zhang, Y.; Liu, L.; Gottesman, R.; Alonso, A.; Guallar, E.; Wasserman, B.A. Racial differences in prevalence and risk for intracranial atherosclerosis in a us community-based population. JAMA Cardiol. 2017, 2, 1341–1348. [Google Scholar] [CrossRef] [PubMed]
- Adams, H.H.H.; Arfan Ikram, M.; Vernooij, M.W.; Van Dijk, A.C.; Hofman, A.; Uitterlinden, A.G.; Van Duijn, C.M.; Koudstaal, P.J.; Franco, O.H.; Van Der Lugt, A.; et al. Heritability and genome-wide association analyses of intracranial carotid artery calcification: The Rotterdam study. Stroke 2016, 47, 912–917. [Google Scholar] [CrossRef] [Green Version]
- Larionov, S.; Dedeck, O.; Birkenmeier, G.; Orantes, M.; Ghebremedhin, E.; Thal, D.R. The intronic deletion polymorphism of the α 2-macroglobulin gene modulates the severity and extent of atherosclerosis in the circle of Willis. Neuropathol. Appl. Neurobiol. 2006, 32, 451–454. [Google Scholar] [CrossRef] [PubMed]
- Kölsch, H.; Larionov, S.; Dedeck, O.; Orantes, M.; Birkenmeier, G.; Griffin, W.S.T.; Thal, D.R. Association of the glutathione S-transferase omega-1 Ala140Asp polymorphism with cerebrovascular atherosclerosis and plaque-associated interleukin-1α expression. Stroke 2007, 38, 2847–2850. [Google Scholar] [CrossRef] [Green Version]
- Jiang, Y.; Liu, X.; Du, Y.; Zhou, S. Rs1234313 and rs45454293 are risk factors of cerebral arterial thrombosis, large artery atherosclerosis, and carotid plaque in the Han Chinese population: A case-control study. BMC Neurol. 2019, 19, 31. [Google Scholar] [CrossRef] [PubMed]
- Zhang, Z.; Chen, X.Y.; Baum, L.; Ng, H.K.; Mok, V.; Wong, K.S. Association between the Apolipoprotein e Gene Polymorphism and Atherosclerotic Middle Cerebral Artery Stenosis. Neurologist 2018, 23, 47–50. [Google Scholar] [CrossRef] [PubMed]
- Wingo, A.P.; Fan, W.; Duong, D.M.; Gerasimov, E.S.; Dammer, E.B.; Liu, Y.; Harerimana, N.V.; White, B.; Thambisetty, M.; Troncoso, J.C.; et al. Shared proteomic effects of cerebral atherosclerosis and Alzheimer’s disease on the human brain. Nat. Neurosci. 2020, 1–5. [Google Scholar] [CrossRef]
- Bennett, D.A.; Buchman, A.S.; Boyle, P.A.; Barnes, L.L.; Wilson, R.S.; Schneider, J.A. Religious Orders Study and Rush Memory and Aging Project. J. Alzheimer’s Dis. 2018, 64, S161–S189. [Google Scholar] [CrossRef] [PubMed]
- Arvanitakis, Z.; Capuano, A.W.; Leurgans, S.E.; Bennett, D.A.; Schneider, J.A. Relation of cerebral vessel disease to Alzheimer’s disease dementia and cognitive function in elderly people: A cross-sectional study. Lancet Neurol. 2016, 15, 934–943. [Google Scholar] [CrossRef] [Green Version]
- De Jager, P.L.; Ma, Y.; McCabe, C.; Xu, J.; Vardarajan, B.N.; Felsky, D.; Klein, H.U.; White, C.C.; Peters, M.A.; Lodgson, B.; et al. A multi-omic atlas of the human frontal cortex for aging and Alzheimer’s disease research. Sci. Data 2018, 5, 1–13. [Google Scholar] [CrossRef]
- Das, S.; Forer, L.; Schönherr, S.; Sidore, C.; Locke, A.E.; Kwong, A.; Vrieze, S.I.; Chew, E.Y.; Levy, S.; McGue, M.; et al. Next-generation genotype imputation service and methods. Nat. Genet. 2016, 48, 1284–1287. [Google Scholar] [CrossRef] [Green Version]
- Price, A.L.; Patterson, N.J.; Plenge, R.M.; Weinblatt, M.E.; Shadick, N.A.; Reich, D. Principal components analysis corrects for stratification in genome-wide association studies. Nat. Genet. 2006, 38, 904–909. [Google Scholar] [CrossRef]
- Manichaikul, A.; Mychaleckyj, J.C.; Rich, S.S.; Daly, K.; Sale, M.; Chen, W.M. Robust relationship inference in genome-wide association studies. Bioinformatics 2010, 26, 2867–2873. [Google Scholar] [CrossRef] [Green Version]
- Purcell, S.; Neale, B.; Todd-Brown, K.; Thomas, L.; Ferreira, M.A.R.; Bender, D.; Maller, J.; Sklar, P.; De Bakker, P.I.W.; Daly, M.J.; et al. PLINK: A tool set for whole-genome association and population-based linkage analyses. Am. J. Hum. Genet. 2007, 81, 559–575. [Google Scholar] [CrossRef] [Green Version]
- Watanabe, K.; Taskesen, E.; Van Bochoven, A.; Posthuma, D. Functional mapping and annotation of genetic associations with FUMA. Nat. Commun. 2017, 8, 1–11. [Google Scholar] [CrossRef] [PubMed] [Green Version]
- Pe’er, I.; Yelensky, R.; Altshuler, D.; Daly, M.J. Estimation of the multiple testing burden for genomewide association studies of nearly all common variants. Genet. Epidemiol. 2008, 32, 381–385. [Google Scholar] [CrossRef]
- Pruim, R.J.; Welch, R.P.; Sanna, S.; Teslovich, T.M.; Chines, P.S.; Gliedt, T.P.; Boehnke, M.; Abecasis, G.R.; Willer, C.J.; Frishman, D. LocusZoom: Regional visualization of genome-wide association scan results. Bioinformatics 2010, 26, 2336–2337. [Google Scholar] [CrossRef] [Green Version]
- Visscher, P.M.; Wray, N.R.; Zhang, Q.; Sklar, P.; McCarthy, M.I.; Brown, M.A.; Yang, J. 10 Years of GWAS Discovery: Biology, Function, and Translation. Am. J. Hum. Genet. 2017, 101, 5–22. [Google Scholar] [CrossRef] [PubMed] [Green Version]
- Beach, T.; Adler, C.; Sue, L.; Serrano, G.; Shill, H.; Walker, D.; Lue, L.; Roher, A.; Dugger, B.; Maarouf, C.; et al. Arizona Study of Aging and Neurodegenerative Disorders and Brain and Body Donation Program. Neuropathology 2015, 35, 354–389. [Google Scholar] [CrossRef] [PubMed]
- Beach, T.G.; Wilson, J.R.; Sue, L.I.; Newell, A.; Poston, M.; Cisneros, R.; Pandya, Y.; Esh, C.; Connor, D.J.; Sabbagh, M.; et al. Circle of Willis atherosclerosis: Association with Alzheimer’s disease, neuritic plaques and neurofibrillary tangles. Acta Neuropathol. 2007, 113, 13–21. [Google Scholar] [CrossRef]
- Beekly, D.L.; Ramos, E.M.; Lee, W.W.; Deitrich, W.D.; Jacka, M.E.; Wu, J.; Hubbard, J.L.; Koepsell, T.D.; Morris, J.C.; Kukull, W.A.; et al. The National Alzheimer’s Coordinating Center (NACC) database: The Uniform Data Set. Alzheimer Dis. Assoc. Disord. 2007, 21, 249–258. [Google Scholar] [CrossRef]
- Kunkle, B.W.; Grenier-Boley, B.; Sims, R.; Bis, J.C.; Damotte, V.; Naj, A.C.; Boland, A.; Vronskaya, M.; van der Lee, S.J.; Amlie-Wolf, A.; et al. Genetic meta-analysis of diagnosed Alzheimer’s disease identifies new risk loci and implicates Aβ, tau, immunity and lipid processing. Nat. Genet. 2019, 51, 414–430. [Google Scholar] [CrossRef] [PubMed] [Green Version]
- Willer, C.; Li, Y.; Abecasis, G. METAL: Fast and efficient meta-analysis of genomewide association scans. Bioinformatics 2010, 26, 2190–2191. [Google Scholar] [CrossRef]
- Oughtred, R.; Stark, C.; Breitkreutz, B.-J.; Rust, J.; Boucher, L.; Chang, C.; Kolas, N.; O’Donnell, L.; Leung, G.; McAdam, R.; et al. The BioGRID interaction database: 2019 update. Nucleic Acids Res. 2018, 47, 529–541. [Google Scholar] [CrossRef] [PubMed] [Green Version]
- Brasch, J.; Harrison, O.J.; Ahlsen, G.; Liu, Q.; Shapiro, L. Crystal structure of the ligand binding domain of netrin G2. J. Mol. Biol. 2011, 414, 723–734. [Google Scholar] [CrossRef] [Green Version]
- Schneider, J.A.; Aggarwal, N.T.; Barnes, L.; Boyle, P.; Bennett, D.A. The neuropathology of older persons with and without dementia from community versus clinic cohorts. J. Alzheimers Dis. 2009, 18, 691–701. [Google Scholar] [CrossRef] [PubMed] [Green Version]
- Sieberts, S.K.; Perumal, T.; Carrasquillo, M.M.; Allen, M.; Reddy, J.S.; Hoffman, G.E.; Dang, K.K.; Calley, J.; Ebert, P.J.; Eddy, J.; et al. Large eQTL meta-analysis reveals differing patterns between cerebral cortical and cerebellar brain regions. bioRxiv 2019, 638544. [Google Scholar] [CrossRef]
- Robins, C.; Liu, Y.; Fan, W.; Duong, D.M.; Meigs, J.; Harerimana, N.V.; Gerasimov, E.S.; Dammer, E.B.; Cutler, D.J.; Beach, T.G.; et al. Genetic control of the human brain proteome. Am. J. Hum. Genet. 2021, 108, 400–410. [Google Scholar] [CrossRef] [PubMed]
- Meerabux, J.M.A.; Ohba, H.; Fukasawa, M.; Suto, Y.; Aoki-Suzuki, M.; Nakashiba, T.; Nishimura, S.; Itohara, S.; Yoshikawa, T. Human netrin-G1 isoforms show evidence of differential expression. Genomics 2005, 86, 112–116. [Google Scholar] [CrossRef] [PubMed]
- Aoki-Suzuki, M.; Yamada, K.; Meerabux, J.; Iwayama-Shigeno, Y.; Ohba, H.; Iwamoto, K.; Takao, H.; Toyota, T.; Suto, Y.; Nakatani, N.; et al. A family-based association study and gene expression analyses of netrin-G1 and -G2 genes in schizophrenia. Biol. Psychiatry 2005, 57, 382–393. [Google Scholar] [CrossRef]
- Ohtsuki, T.; Horiuchi, Y.; Koga, M.; Ishiguro, H.; Inada, T.; Iwata, N.; Ozaki, N.; Ujike, H.; Watanabe, Y.; Someya, T.; et al. Association of polymorphisms in the haplotype block spanning the alternatively spliced exons of the NTNG1 gene at 1p13.3 with schizophrenia in Japanese populations. Neurosci. Lett. 2008, 435, 194–197. [Google Scholar] [CrossRef] [PubMed] [Green Version]
- Zhu, Y.; Yang, H.; Bi, Y.; Zhang, Y.; Zhen, C.; Xie, S.; Qin, H.; He, J.; Liu, L.; Liu, Y. Positive association between NTNG1 and schizophrenia in Chinese Han population. J. Genet. 2011, 90, 499–502. [Google Scholar] [CrossRef] [PubMed]
- Wilcox, J.; Quadri, S. Replication of NTNG1 association in schizophrenia. Psychiatr. Genet. 2014, 24, 266–268. [Google Scholar] [CrossRef] [PubMed]
- Akiyama, M.; Okada, Y.; Kanai, M.; Takahashi, A.; Momozawa, Y.; Ikeda, M.; Iwata, N.; Ikegawa, S.; Hirata, M.; Matsuda, K.; et al. Genome-wide association study identifies 112 new loci for body mass index in the Japanese population. Nat. Genet. 2017, 49, 1458–1467. [Google Scholar] [CrossRef] [PubMed]
- Hoffmann, T.J.; Choquet, H.; Yin, J.; Banda, Y.; Kvale, M.N.; Glymour, M.; Schaefer, C.; Risch, N.; Jorgenson, E. A large multiethnic genome-wide association study of adult body mass index identifies novel loci. Genetics 2018, 210, 499–515. [Google Scholar] [CrossRef] [Green Version]
- Yengo, L.; Sidorenko, J.; Kemper, K.E.; Zheng, Z.; Wood, A.R.; Weedon, M.N.; Frayling, T.M.; Hirschhorn, J.; Yang, J.; Visscher, P.M.; et al. Meta-analysis of genome-wide association studies for height and body mass index in ∼700000 individuals of European ancestry. Hum. Mol. Genet. 2018, 27, 3641–3649. [Google Scholar] [CrossRef] [PubMed]
- Qureshi, A.; Caplan, L. Intracranial atherosclerosis. Lancet 2014, 383, 984–998. [Google Scholar] [CrossRef]
- Heffron, S.P.; Dwivedi, A.; Rockman, C.B.; Xia, Y.; Guo, Y.; Zhong, J.; Berger, J.S. Body mass index and peripheral artery disease. Atherosclerosis 2020, 292, 31–36. [Google Scholar] [CrossRef] [PubMed]
- Winkler, G.S.; Mulder, K.W.; Bardwell, V.J.; Kalkhoven, E.; Timmers, H.T.M. Human Ccr4-Not complex is a ligand-dependent repressor of nuclear receptor-mediated transcription. EMBO J. 2006, 25, 3089–3099. [Google Scholar] [CrossRef] [PubMed]
- Boland, A.; Chen, Y.; Raisch, T.; Jonas, S.; Kuzuoǧlu-Öztürk, D.; Wohlbold, L.; Weichenrieder, O.; Izaurralde, E. Structure and assembly of the NOT module of the human CCR4-NOT complex. Nat. Struct. Mol. Biol. 2013, 20, 1289–1297. [Google Scholar] [CrossRef] [PubMed]
- Raisch, T.; Chang, C.T.; Levdansky, Y.; Muthukumar, S.; Raunser, S.; Valkov, E. Reconstitution of recombinant human CCR4-NOT reveals molecular insights into regulated deadenylation. Nat. Commun. 2019, 10, 1–14. [Google Scholar] [CrossRef] [PubMed] [Green Version]
- Zeng, J.; Kamiyama, T.; Niwa, R.; King-Jones, K. The Drosophila CCR4-NOT complex is required for cholesterol homeostasis and steroid hormone synthesis. Dev. Biol. 2018, 443, 10–18. [Google Scholar] [CrossRef]
- Morita, M.; Oike, Y.; Nagashima, T.; Kadomatsu, T.; Tabata, M.; Suzuki, T.; Nakamura, T.; Yoshida, N.; Okada, M.; Yamamoto, T. Obesity resistance and increased hepatic expression of catabolism-related mRNAs in Cnot3 +/− mice. EMBO J. 2011, 30, 4678–4691. [Google Scholar] [CrossRef] [PubMed] [Green Version]
- Inoue, T.; Morita, M.; Hijikata, A.; Yoko, F.-Y.; Adachi, S.; Isono, K.; Ikawa, T.; Kawamoto, H.; Koseki, H.; Natsume, T.; et al. CNOT3 contributes to early B cell development by controlling Igh rearrangement and p53 mRNA stability. J. Exp. Med. 2015, 212, 1465–1479. [Google Scholar] [CrossRef] [PubMed] [Green Version]
- Suzuki, T.; Kikuguchi, C.; Sharma, S.; Sasaki, T.; Tokumasu, M.; Adachi, S.; Natsume, T.; Kanegae, Y.; Yamamoto, T. CNOT3 suppression promotes necroptosis by stabilizing mRNAs for cell death-inducing proteins. Sci. Rep. 2015, 5, 1–14. [Google Scholar] [CrossRef] [Green Version]
- Banerjee, C.; Chimowitz, M.I. Stroke Caused by Atherosclerosis of the Major Intracranial Arteries. Circ. Res. 2017, 120, 502–513. [Google Scholar] [CrossRef] [PubMed] [Green Version]


| Characteristic | N | Percent | |
|---|---|---|---|
| Sex | |||
| Female Male | 877 448 | 66.2 33.8 | |
| Cognitive diagnosis at death * Normal cognition Mild cognitive impairment Alzheimer’s dementia Other dementia | 397 297 522 23 | 30.0 22.4 39.4 1.7 | |
| Mean (SD) | Median | Range | |
| Age at enrollment | 80.4 (6.91) | 80.8 | 63.0–102.2 |
| Age at death | 89.5 (6.56) | 89.8 | 66.0–108.3 |
| Education (years) | 16.4 (3.60) | 16.0 | 5.0–30.0 |
| Post-mortem interval (hours) | 9.1 (8.01) | 6.6 | 0.0–98.3 |
| Vascular risk factors | 1.1 (0.84) | 1.0 | 0.0–3.0 |
| N | Percent | ||
| Gross infarct (Present) | 585 | 44.2 | |
| Microinfarct (Present) | 499 | 37.7 | |
| Mean (SD) | Median | Range | |
| Cerebral atherosclerosis | 1.25 (0.81) | 1.00 | 0.0–3.0 |
| Alzheimer’s disease pathology | |||
| Amyloid | 4.1 (4.07) | 3.1 | 0.0–22.9 |
| Tangles | 7.3 (8.79) | 4.3 | 0.0–78.5 |
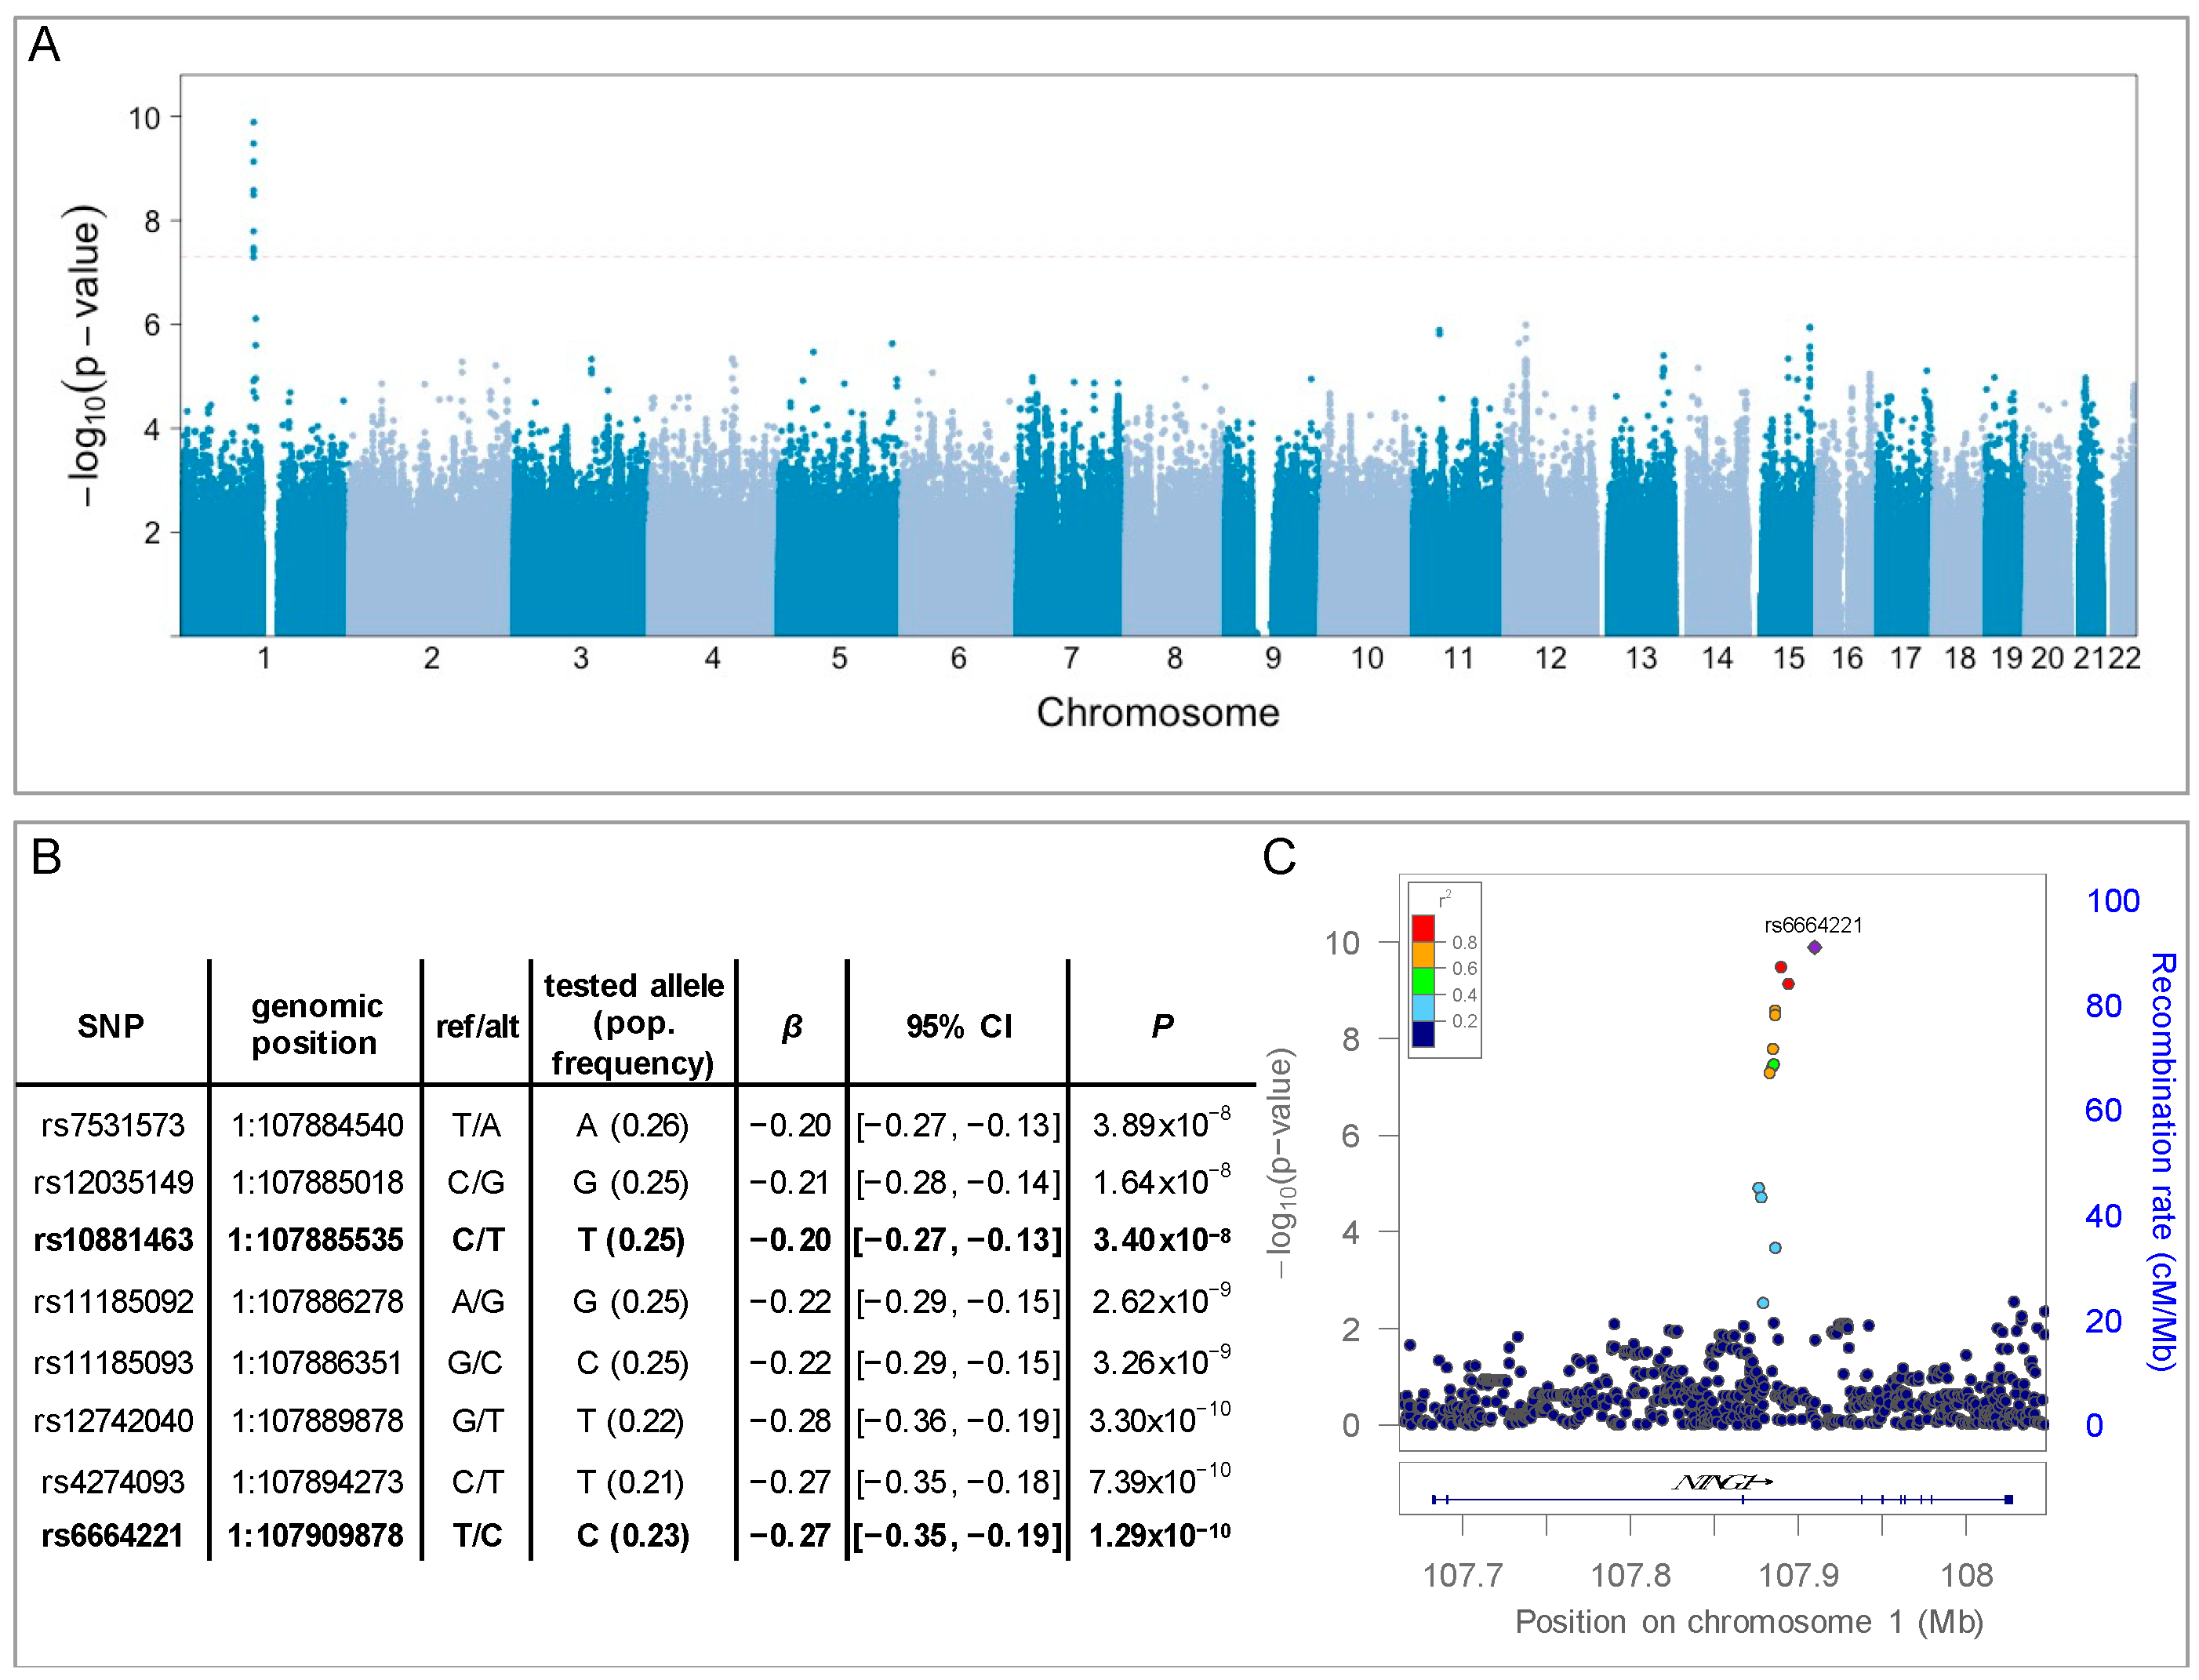
| ROS/MAP | Banner | METAL | ||||
|---|---|---|---|---|---|---|
| SNP | β (SE) | p | β (SE) | p | Overall Effect (SE) | p |
| rs7531573 | −0.20 (0.04) | 3.89 × 10⁻⁸ | −0.15 (0.13) | 0.25 | −0.19 (0.03) | 1.93 × 10⁻⁸ |
| rs12035149 | −0.21 (0.04) | 1.64 × 10⁻⁸ | −0.12 (0.13) | 0.38 | −0.20 (0.04) | 1.22 × 10⁻⁸ |
| rs10881463 | −0.20 (0.04) | 3.40 × 10⁻⁸ | −0.14 (0.13) | 0.28 | −0.20 (0.03) | 1.84 × 10⁻⁸ |
| rs11185092 | −0.22 (0.04) | 2.62 × 10⁻⁹ | −0.12 (0.13) | 0.38 | −0.21 (0.04) | 2.04 × 10⁻⁹ |
| rs11185093 | −0.22 (0.04) | 3.26 × 10⁻⁹ | −0.12 (0.13) | 0.35 | −0.21 (0.04) | 2.35 × 10⁻⁹ |
| rs12742040 | −0.28 (0.04) | 3.30 × 10⁻¹⁰ | −0.14 (0.16) | 0.36 | −0.27 (0.04) | 2.56 × 10⁻¹⁰ |
| rs4274093 | −0.27 (0.04) | 7.39 × 10⁻¹⁰ | −0.14 (0.16) | 0.36 | −0.26 (0.04) | 5.51 × 10⁻¹⁰ |
| rs6664221 | −0.27 (0.04) | 1.29 × 10⁻¹⁰ | −0.13 (0.15) | 0.38 | −0.26 (0.04) | 1.17 × 10⁻¹⁰ |
Publisher’s Note: MDPI stays neutral with regard to jurisdictional claims in published maps and institutional affiliations. |
© 2021 by the authors. Licensee MDPI, Basel, Switzerland. This article is an open access article distributed under the terms and conditions of the Creative Commons Attribution (CC BY) license (https://creativecommons.org/licenses/by/4.0/).
Share and Cite
Vattathil, S.M.; Liu, Y.; Harerimana, N.V.; Lori, A.; Gerasimov, E.S.; Beach, T.G.; Reiman, E.M.; De Jager, P.L.; Schneider, J.A.; Bennett, D.A.; et al. A Genetic Study of Cerebral Atherosclerosis Reveals Novel Associations with NTNG1 and CNOT3. Genes 2021, 12, 815. https://doi.org/10.3390/genes12060815
Vattathil SM, Liu Y, Harerimana NV, Lori A, Gerasimov ES, Beach TG, Reiman EM, De Jager PL, Schneider JA, Bennett DA, et al. A Genetic Study of Cerebral Atherosclerosis Reveals Novel Associations with NTNG1 and CNOT3. Genes. 2021; 12(6):815. https://doi.org/10.3390/genes12060815
Chicago/Turabian StyleVattathil, Selina M., Yue Liu, Nadia V. Harerimana, Adriana Lori, Ekaterina S. Gerasimov, Thomas G. Beach, Eric M. Reiman, Philip L. De Jager, Julie A. Schneider, David A. Bennett, and et al. 2021. "A Genetic Study of Cerebral Atherosclerosis Reveals Novel Associations with NTNG1 and CNOT3" Genes 12, no. 6: 815. https://doi.org/10.3390/genes12060815