Article

Development of Molecular Markers Associated with Resistance to Gray Mold Disease in Onion (Allium cepa L.) through RAPD-PCR and Transcriptome Analysis

1
Department of Horticultural Biotechnology, Kyung Hee University, 1732 Deogyoung-daero, Giheung-gu, Yongin-si 17104, Gyeonggi-do, Korea
2
Seeds & People Co., 483 Bongdeok-ro, Yeomsan-myeon, Yeonggwang-gun 57066, Jeollanam-do, Korea
*
Author to whom correspondence should be addressed.
These authors contributed equally to this work.
Horticulturae 2021, 7(11), 436; https://doi.org/10.3390/horticulturae7110436
Submission received: 25 September 2021 / Revised: 17 October 2021 / Accepted: 20 October 2021 / Published: 25 October 2021
(This article belongs to the Special Issue Advances in Molecular Breeding of Vegetable Crops)

Abstract

:
Onions (Allium cepa L.) are one of the most consumed vegetable crops worldwide and are damaged by several fungal diseases in the field or during storage. Gray mold disease caused by the necrotrophic pathogens Botrytis cinerea and Botrytis squamosa is a disease that reduces the productivity and storage life in onions. However, it is difficult to control gray mold disease in onions by using physical and chemical methods. Breeding resistant onions against gray mold disease can reduce the damage caused by pathogens, reduce the labor required for control, and reduce environmental pollution caused by fungicides. However, onions have a large genome size (16Gb), making them difficult to analyze, and have a biennial cycle, resulting in a very long breeding period. Therefore, in this study, markers were developed to shorten the onion breeding period. First, random amplified polymorphic DNA (RAPD) was performed to confirm the genetic relationship between the gray mold disease-resistant and -susceptible lines through a dendrogram. In addition, the sequence characterized amplified region (SCAR)-OPAN1 marker to select resistant lines was developed using a polymorphic RAPD fragment. Second, the RNA-seq of the gray mold-resistant and -susceptible onion lines were analyzed using NGS technology. Using the RNA-seq results and DEG and GO analyses were performed, and the variants, such as SNPs and indels, were analyzed to develop a selectable marker for the resistant line. This study developed the SNP-3 HRM marker for selecting gray mold disease-resistant lines by using the SNPs present in the aldo-keto reductase (AKR) gene with high expression levels in these lines. The SCAR-OPAN1 and SNP-3 HRM markers developed in this study could be used to select gray mold disease-resistant onions in breeding programs to reduce the damage caused by gray mold disease.

1. Introduction

Onions (Allium cepa L.) are one of the most economically and nutritionally important crops worldwide. They are also one of the oldest cultivated crops and are used as an ingredient in various foods and sauces to enhance flavor and promote health, such as for lowering cholesterol levels [1,2,3]. Therefore, it is important to breed and produce higher-quality onions to improve their competitive advantage in the market. Onion breeding is performed for various purposes, such as to improve the onion yield; for qualities like size, taste, or color; for male sterility; and for a resistance against biotic and abiotic stresses [3,4,5].
Onions are susceptible to many pathogens and insects [3]; therefore, breeding for resistant onions has been extensively studied to reduce the damage caused by various diseases, many of which are caused by the genus Botrytis. Onion botrytis leaf blight is caused by B. squamosa, and onion neck rot is caused by B. aclada, B. alli, B. squamosa, and B. porri [6]. In particular, B. cinerea is a necrotrophic pathogen with more than 200 host crop species, causing severe damage to onions [7]. Gray mold, caused by B. cinerea and B. squamosa, reduces the yield and storage capacity. Gray mold disease affecting the onion bulb is caused by B. squamosa during bulb formation and bulb filling and by B. cinerea during the later cultivation and storage periods [8,9]. Previous studies have attempted chemical and biological controls to prevent damage to onions by gray mold. To prevent this disease, onions should be kept dry, infected onions should be rapidly removed, and crops must be rotated every 3 to 4 years. In addition, many fungicides are used to control gray mold, with approximately 10% of the global fungicide market focused on controlling B. cinerea [10]. However, despite these efforts, it is difficult to control gray mold disease. Furthermore, synthetic fungicides can cause problems, such as residue concerns and a negative impact on human health, the emergence and increase of resistant pathogen populations, and environmental pollution [11,12,13,14]. Therefore, breeding disease-resistant onions can reduce the damage caused by diseases, such as gray mold disease, increase production, and reduce labor and environmental pollution.
Disease-resistant onions have a long breeding period, as onions are a biennial plant; therefore, a complete generation of onions requires two years. Marker assistant selection (MAS) can be used to shorten the breeding period of onions. In addition, a genome analysis of onions is difficult, because onions have a large genome size (16Gb), which is 100 times larger than that of Arabidopsis genomes [3,4]. Molecular markers such as random amplified polymorphic DNA (RAPD) and sequence characterized amplified region (SCAR) have been developed for various purposes. These markers are used for MAS, facilitating selection in breeding and shortening the breeding periods. RAPD is a PCR-based marker using short random primers; therefore, a RAPD analysis can reveal small genetic polymorphisms between large genomes, such as that of onions [15,16]. The disadvantage of RAPD markers is their low reproducibility. Therefore, in this study, we developed a SCAR marker by using a more specific primer than RAPD from the results of polymorphism studies between resistant and susceptible lines of onion.
In addition, NGS technologies such as RNA sequencing have enabled large-scale transcriptome data analysis, which has improved the efficiency of gene discovery despite no prior knowledge of reference genome sequences [4,17,18]. In this study, RNA-seq was performed to develop molecular markers for breeding gray mold-resistant onions. RNA-seq was used for a DEG analysis and the analysis of variants such as SNPs and insertions and deletions (InDels) between the resistant and susceptible groups. The HRM markers confirm the fluorescence of the PCR product’s melting curve when the double-stranded DNA becomes single-stranded DNA. The sequence region of interest was amplified with a fluorescent dsDNA-binding dye, and the PCR melting curve was measured when the product was gradually melted. The melting curve varies depending on the sequence, such as the presence of SNPs, GC content, length, and heterozygosity [19,20]. In this study, the HRM marker was also developed through selected transcripts from gene ontology (GO) and variant analysis using RNA-seq data to breed gray mold-resistant onions.

2. Materials and Methods

2.1. Plant Materials and Genomic DNA Extraction

To develop molecular markers, four (S&P 7522, S&P 7521, S&P 7129, and S&P 7168) gray mold-resistant and three (S&P 7130, S&P 7175, and S&P 7483) susceptible onion (Allium cepa L.) lines grown in ‘Seeds & People’ Co., Ltd. (Yeonggwang, Korea) were used in this study. The characteristics of the seven onion lines of ‘Seeds & People’ Co. are shown in Table S1. The pedigree of the seven onion lines used in this study is shown in Figure S1. In addition, to confirm the versatility of the developed molecular markers, three (Asia-12, Asia-42, and Asia-53) resistant and four (Asia-30, Asia-35, Asia-45, and Asia-50) susceptible onion lines against gray mold were provided by ‘Asia Seed’ Co., Ltd. (Seoul, Korea) and analyzed. Genomic DNA was isolated from the leaf tissues of each line by using cetyltrimethylammonium bromide (CTAB) [21]. The concentration and purity of the gDNA were measured using a Nanodrop® ND-1000 spectrophotometer (NanoDrop Technologies, Wilmington, NC, USA).

2.2. RAPD and Phylogenetic Analysis

The gDNA of each line was used for a RAPD analysis to identify the genetic relationship between the resistant and susceptible lines. For a RAPD analysis, OPERON random primers OPAN-1~OPAN-20 and OPL-1~OPL-20 were used. The sequences of the 40 OPERON random primers are shown in Table S2. The RAPD PCR was performed in 20 µL by using the Maxime PCR Premix (iNtRON Biotechnology, Seongnam, Korea) containing 2.5-U i-TaqTM Taq polymerase, 2.5-mM dNTPs, 1X reaction buffer with 10 pmol primer, and 50 ng of gDNA. The amplification program was as follows: denaturation at 95 °C for 10 min, 40 cycles of 1 min at 95 °C, 1 min at 37 °C, 1 min at 72 °C, and a final extension at 72 °C for 10 min. The amplified RAPD PCR product was electrophoresed at 100 mA for 3 h in a 1% agarose gel. The polymorphic bands obtained from the RAPD-PCR of each line were converted into binary data, depending on the presence of a band; the presence of a polymorphic band was scored as 1, while its absence was scored as 0. The dendrogram was obtained using the unweighted pair group method (UPGMA) with an arithmetic mean [22] by using the Jaccard coefficient [23] through the XLSTAT program (Addinsoft, New York, NY, USA).

2.3. Development of the SCAR Marker

To develop the SCAR marker, the 2-Kb polymorphic bands obtained between four resistant and three susceptible lines by using the OPAN-1 primer (5′-ACT CCA CGT C-3′) were sequenced and identified. The amplified polymorphic products were eluted from a 1% agarose gel and purified using the NucleoSpin® Gel and PCR Clean-up Kit (Macherey-Nagel, Duren, Germany). The eluted products were ligated into the pGEM-T easy vector (Promega, Madison, WI, USA) for sequencing. The plasmid was purified using the Fast DNA-spinTM Plasmid DNA Purification Kit (iNtRON Biotechnology, Seongnam, Korea), and the fragments were sequenced by Macrogen® (Seoul, Korea). The SCAR primer set was designed from the sequence of the 2-Kb polymorphic band between the resistant and susceptible lines. PCR using the SCAR primer set was performed under the following conditions: initial denaturation for 10 min at 95 °C, 35 cycles of 30 s at 95 °C, 30 s at 61 °C, 1 min at 72 °C, and a final extension for 10 min at 72 °C. Thereafter, the amplified products of the resistant onion lines were confirmed by electrophoresis in a 1% agarose gel. In addition, to confirm the versatility of the SCAR marker, three gray mold-resistant and four susceptible onion lines from the ‘Asia Seed’ Co. were also analyzed.

2.4. RNA Sequencing and Variant Analysis

For RNA sequencing, the leaves of four resistant and three susceptible lines were ground, and the total RNA was extracted using the RNease® kit (QIAGEN, Hilden, Germany). Before analyzing the RNA sequence, the OD values were measured using Dropsense96 (Trinean, Gentbrugge, Belgium), and the total RNA quality was checked using a Bioanalyzer RNA Chip (Agilent Technologies, Santa Clara, CA, USA). The library was constructed using the TruSeq Stranded mRNA kit (Illumina, San Diego, CA, USA), and RNA-seq was performed using HiseqX (Illumina, San Diego, CA, USA) by the DNAcare Company (Seoul, Korea). To remove the low-quality base and Illumina adapters, the Trimmomatic program (USADELLAB, Aachen, Germany) was used on the RNA-seq raw data of each line. After trimming, only paired reads containing at least 50 nucleotides were used for the analysis. In addition, quality trimming was performed by applying options such as a sliding window, average quality, and minimum read size. Thereafter, the generated trimmed data were used for the de novo assembly of resistant and susceptible lines by using the Trinity program. As a reference for mapping, the onion reference transcript (National Agricultural Biotechnology Information Center (NABIC), Rural Development Administration (RDA), JeonJu, Korea) and the data obtained through the de novo assembly were used. Read mapping was performed using the BWA-Mem algorithm. To remove the duplicated PCR reads from the produced BAM file, the Picard program (Broad Institute, Cambridge, MA, USA) was used. Thereafter, the variant information of seven lines was produced using haplotypeCaller of the Genome Analysis Tool Kit (GATK, Broad Institute, Cambridge, MA, USA), and the final raw variant call file (vcf) was generated by integrating the variant files of each line. Variant filtering was performed using Vcftools (VCFtools, 1000 Genomes Project Analysis Group, http://vcftools.sourceforge.net/ accessed on 1 October 2021) to remove the low-quality genotypes, target missing levels of depth coverage (DP), genotype quality (GQ), and genotype data. The filtering conditions were set to min DP = 5, max DP = 100, and min GQ = 220, and the missing was set to 20%. Various information was used to select the variants showing polymorphisms between the resistant and susceptible lines. For the selection condition for the variants, those showing the same genotype in each resistant and susceptible group and showing polymorphisms between these groups were selected.

2.5. Differentially Expressed Gene (DEG) and Gene Ontology (GO) Analysis for Selection of Transcript Related to Disease Resistance

Among the sequences generated from Trinity, sequences with a length of more than 100 amino acids were selected using TransDecoder. Based on these data and onion reference transcript data (NABIC, RDA, JeonJu, Korea, https://nabic.rda.go.kr, accessed on 7 February 2021), the sequences of each onion line were aligned with HISAT2. The read count of the transcript expression level was then calculated using the StringTie program. The transcripts obtained through StringTie were calculated at the transcript level, and a comparative analysis was performed between each onion line based on the read count of each transcript. After dividing into resistant and susceptible groups, a DEG analysis was performed using DEGseq (Bioconductor, http://www.bioconductor.org/packages/release/bioc/html/DEGseq.html, accessed on 2 October 2021) [24]. First, after normalizing the raw read count data, a correlation analysis was performed between each onion line based on the normalized data. The analysis was conducted using Pearson’s correlation coefficient and the average linkage method. The DEGseq of the R package was used to confirm the statistical significance of the expression differences between resistant and susceptible groups. After comparing the average expression levels between the two groups, the conditions were set as follows to select genes using significantly different expressions. The test was conducted using the equation log 2 Base   Mean   of   R Base   Mean   of   S . A negative value was set for the transcripts more expressed in the susceptible group than in the resistant group, and a positive value was set for the transcripts more expressed in the resistant group than in the susceptible groups. Thereafter, the transcripts with DEGs satisfying the conditions of |log2 fold change| ≥ 2 and PADJ < 0.05 were selected. From the results of variants analysis and DEG analysis, transcripts that commonly satisfied each condition were selected. A gene function analysis was performed to identify whether the selected variants were related to the disease-resistant mechanisms. To identify the functions related to disease resistance, the selected transcripts were analyzed using The Arabidopsis Information Resource (TAIR) ID derived from Arabidopsis, a model plant. Thereafter, GO annotation was performed using the transcripts’ confirmed gene functions by TAIR ID, and the transcripts with functions related to disease resistance were selected.

2.6. HRM Primer Designs from Selected Transcripts and HRM Analysis

HRM primers were designed from 14 selected transcripts with SNPs that exist between the resistant and susceptible lines. The conditions of the designed primers were as follows: the amplified product size was between 80 and 200 bp, the variant region was inside the PCR product, and the annealing temperature was approximately 60 ± 1 °C. The sequences and annealing temperature information of the HRM primers are listed in Table 1. HRM was performed using a total 10-µL reaction mixture containing the BioFactTM 2X Real-Time PCR Master Mix (BIOFACT, Daejeon, Korea) with a 10-pmol primer and 50 ng of gDNA. The reaction conditions were: pre-denaturation at 95 °C for 15 min, 40 cycles of denaturation at 95 °C for 20 s, annealing at 60 °C for 30 s, and extension at 72 °C for 20 s. Thereafter, the temperature was sequentially increased from 65 °C to 95 °C, and the melt curve and peak value were measured. At least six repetitions were performed for each line. The HRM results were statistically grouped using the ANOVA of the XLSTAT program. In addition, to confirm the versatility of the selected HRM marker, which was able to distinguish between resistant and susceptible onion lines, an additional analysis was performed using ‘Asia Seed’ Co. onion lines.

2.7. Quantitative Real-Time PCR (qPCR) to Identify Expression Level of Transcripts

The total RNA was extracted from the leaves of the resistant and susceptible lines by using the Plant RNA Extraction Kit (Takara, Shiga, Japan). The concentration and purity of the RNA were measured using a Nanodrop® ND-1000 spectrophotometer (NanoDrop Technologies, Wilmington, NC, USA). Thereafter, cDNA was synthesized from 500 ng of RNA extracted from each line by using the HiSenScript™ RH[-] RT PreMix Kit (iNtRON, Seongnam, Korea). PCR for cDNA synthesis was performed using the following cycle: reverse transcription step at 42 °C for 1 h and RTase inactivation extension step at 85 °C for 10 min. The synthesized cDNA was stored at −20 °C. Quantitative real-time PCR (qPCR) was performed to compare the expression levels of the SNP-3 transcript related to the aldo-keto reductase (AKR) gene with in silico data, which showed significant HRM results in 14 transcripts. The qPCR primer conditions were as follows: the amplified product size was less than 200 bp, and the annealing temperature was approximately 60 ± 1 °C. The forward primer was 5′-CGT TAG CTC AAG TGG GTT TGA GGT G-3′, and the reverse primer was 5′-CTC CAG CAC ACG CCC TCC A-3′. Before the qPCR analysis, it was confirmed that the 171-bp band targeted by the qPCR primer set was amplified by RT-PCR using the Maxime™ PCR PreMix Kit (iNtRON, Seongnam, Korea). The reaction cycle was as follows: 10 min of initial denaturation at 95 °C, followed by 40 cycles of 95 °C for 30 s, 60 °C for 30 s, 72 °C for 40 s, and a final extension at 72 °C for 10 min. The amplified product was electrophoresed using 1% agarose gel.
The qPCR analysis was performed with the TransStart Top Green qPCR Super Mix (TransGen, Beijing, China) containing 1 pmol of qPCR primer and 500 ng of cDNA by using Roter-GeneTM6000 (Corbett, Melbourne, Vic, Australia), and the qPCR program proceeded at 95 °C for 10 s, followed by 40 cycles consisting of 2 steps: 95 °C for 10 s and 60 °C for 30 s. After amplification, a fluorescence melting curve was obtained by heating the samples from 60 °C to 95 °C. AKR gene expression was identified using the Ct value. To compare the differences in the gene expression levels between the resistant and susceptible lines, the actin gene, the housekeeping gene, was used as a control. After obtaining the Ct value using Roter-Gene Q Series Software, the ΔCt value ((Ct value of target gene)−(Ct value of actin gene)) was calculated. To compare the expression levels based on the susceptible S&P 7483 lines, the ΔΔCt value ((ΔCt of each onion line)−(ΔCt of S&P 7483)) was obtained. The difference in the expression levels was confirmed by calculating the 2ΔΔCt. The expression level of each line was calculated from the results of six repetitions. Data were presented as the means with standard errors, and the means were compared using Duncan’s multiple comparison test (p ≤ 0.05).

3. Results

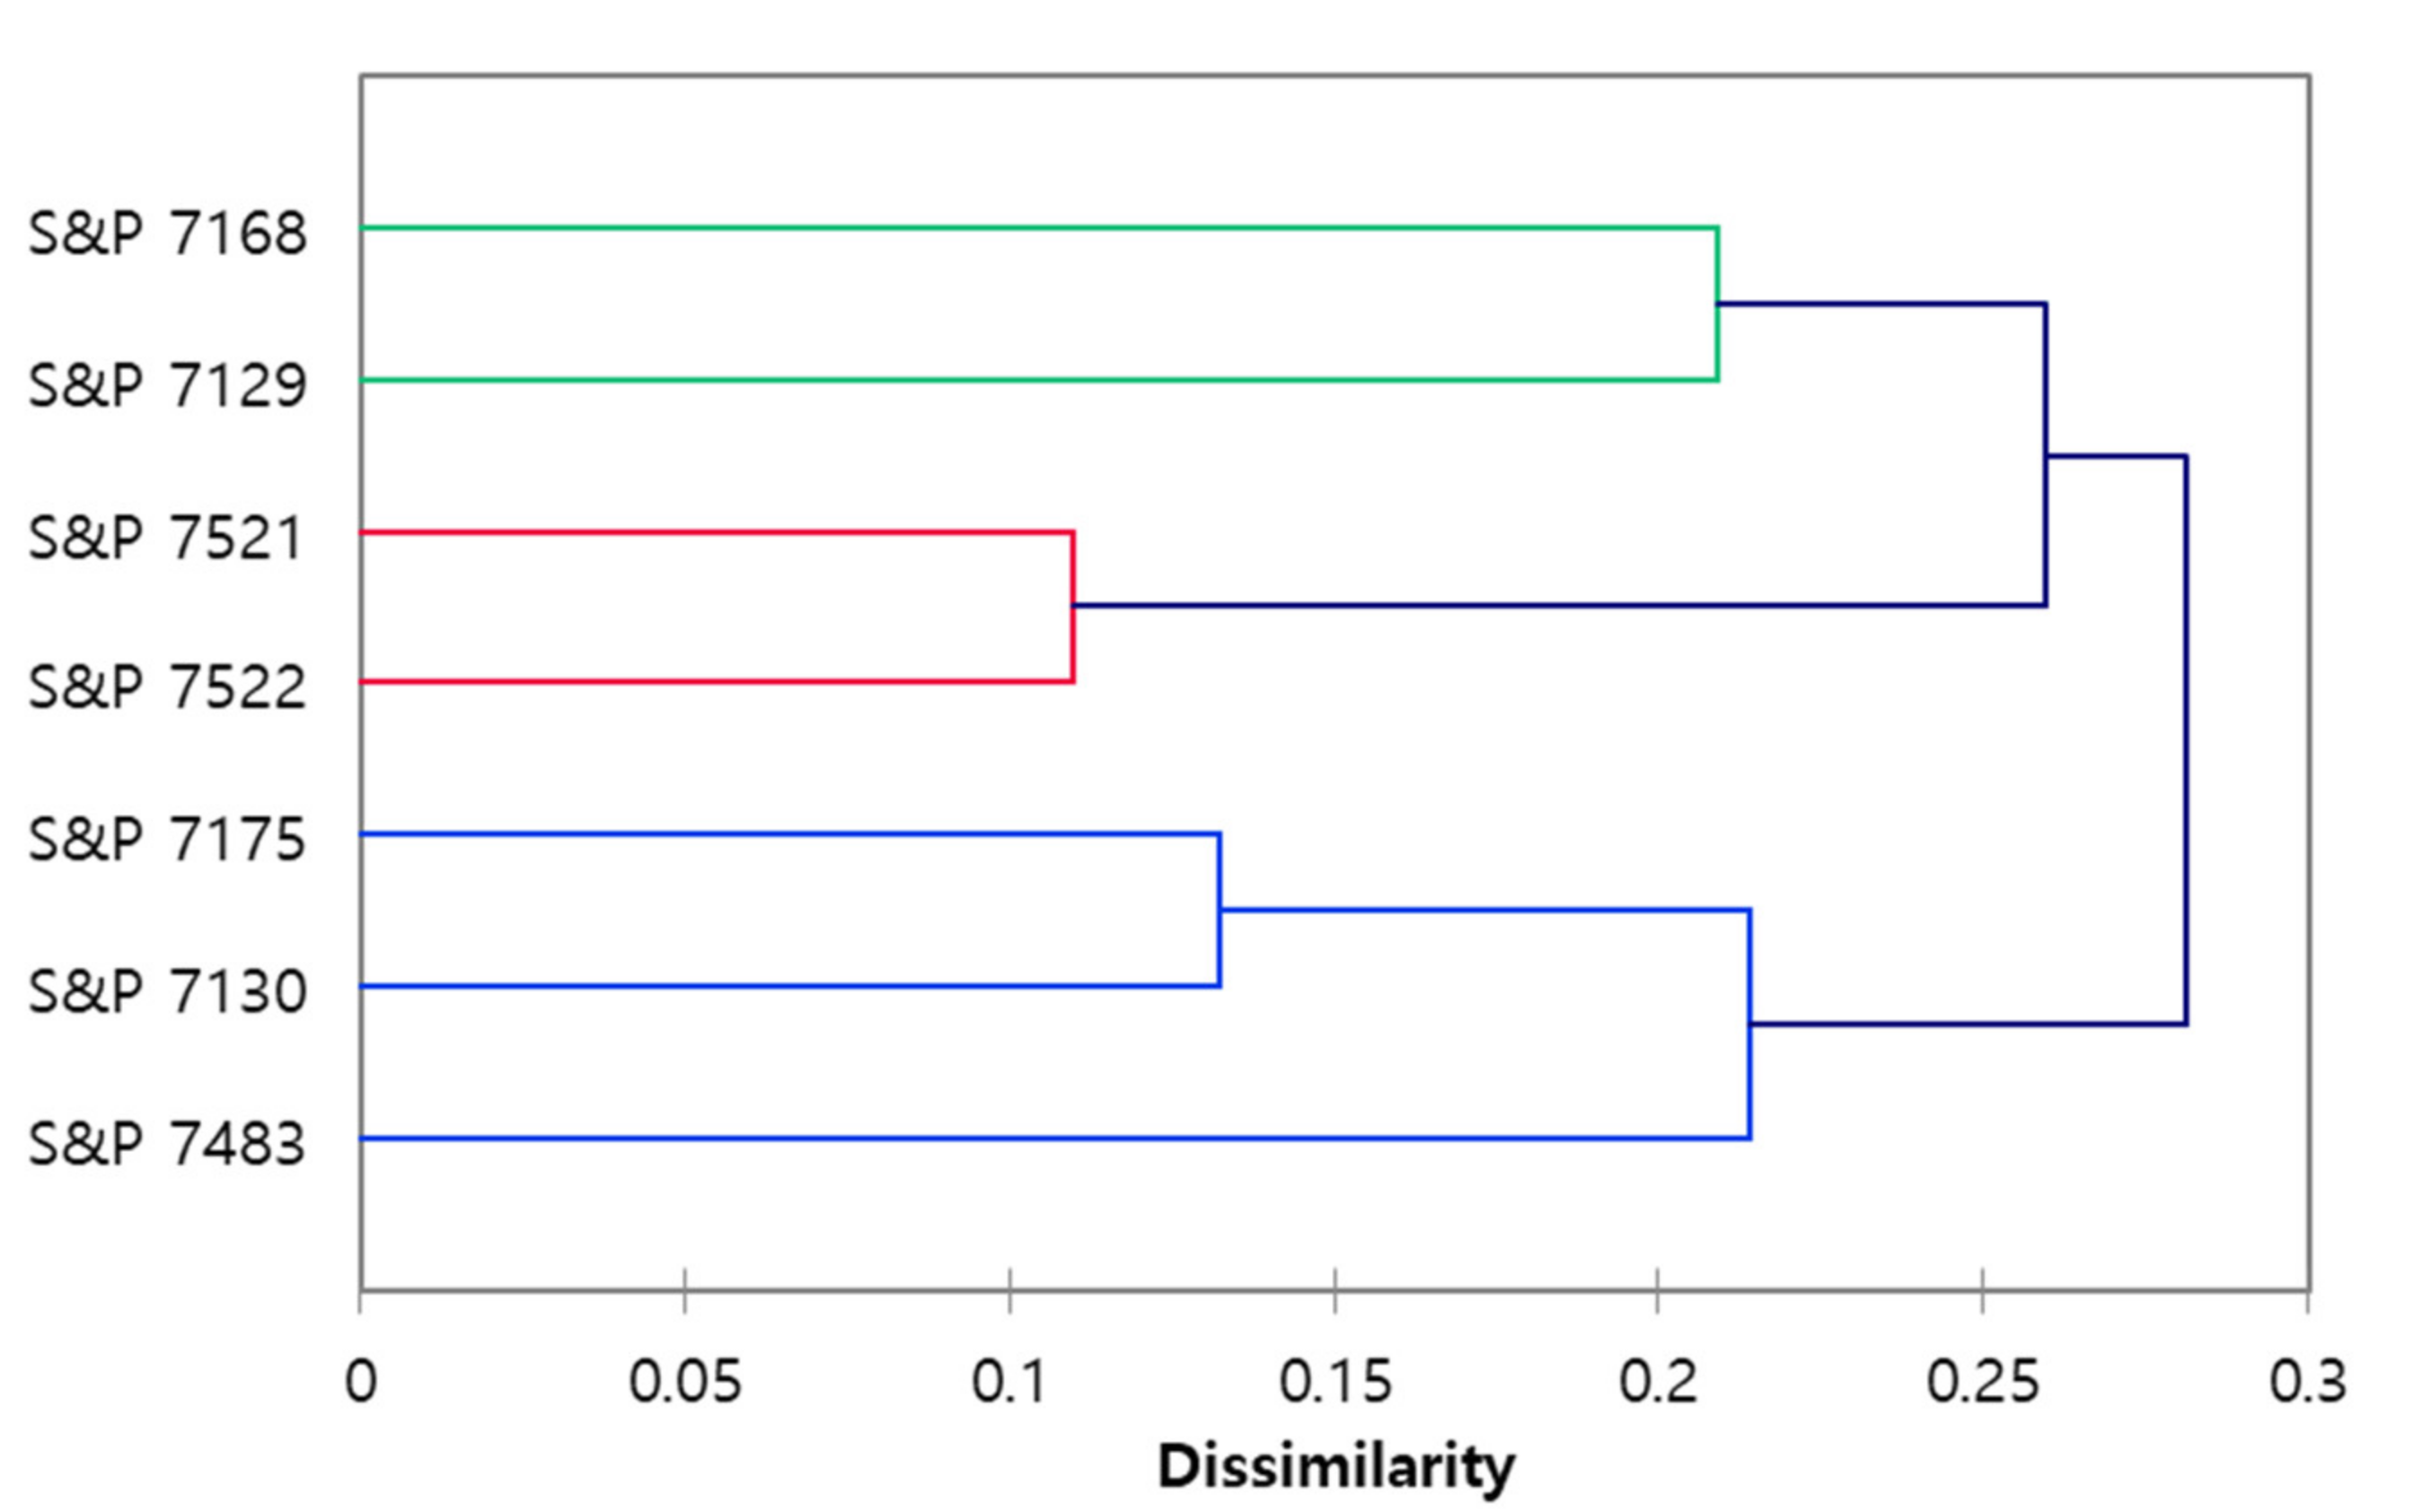
3.1. RAPD and Phylogenetic Analysis

Four (S&P 7522, S&P 7521, S&P 7129, and S&P 7168) gray mold-resistant and three (S&P 7130, S&P 7175, and S&P 7483) susceptible onion lines were amplified using 40 OPERON random primers, and the polymorphic bands were confirmed by electrophoresis. Most of the amplified band sizes ranged from 200 bp to 2500 bp, and 124 bands (38%) of the 330 bands showed polymorphisms. The RAPD analysis was repeated at least three times to obtain reproducibility, and the presence or absence of amplified bands was transformed into binary data. The binary data were converted into dendrograms by using the UPGMA methods of the XLSTAT program using Jaccard coefficients (Figure 1). The genetic similarity within the group was 78.27%, and the genetic similarity between the groups was 21.73%. Based on the phylogenetic analysis, a genetic relationship between the seven lines was confirmed. The results of the phylogenetic analysis were compared with the pedigrees of the seven breeding lines to confirm the reliability of the RAPD (Figure S1). The phylogenic analysis results were consistent with the genetic relationship of the pedigree of the breeding lines.

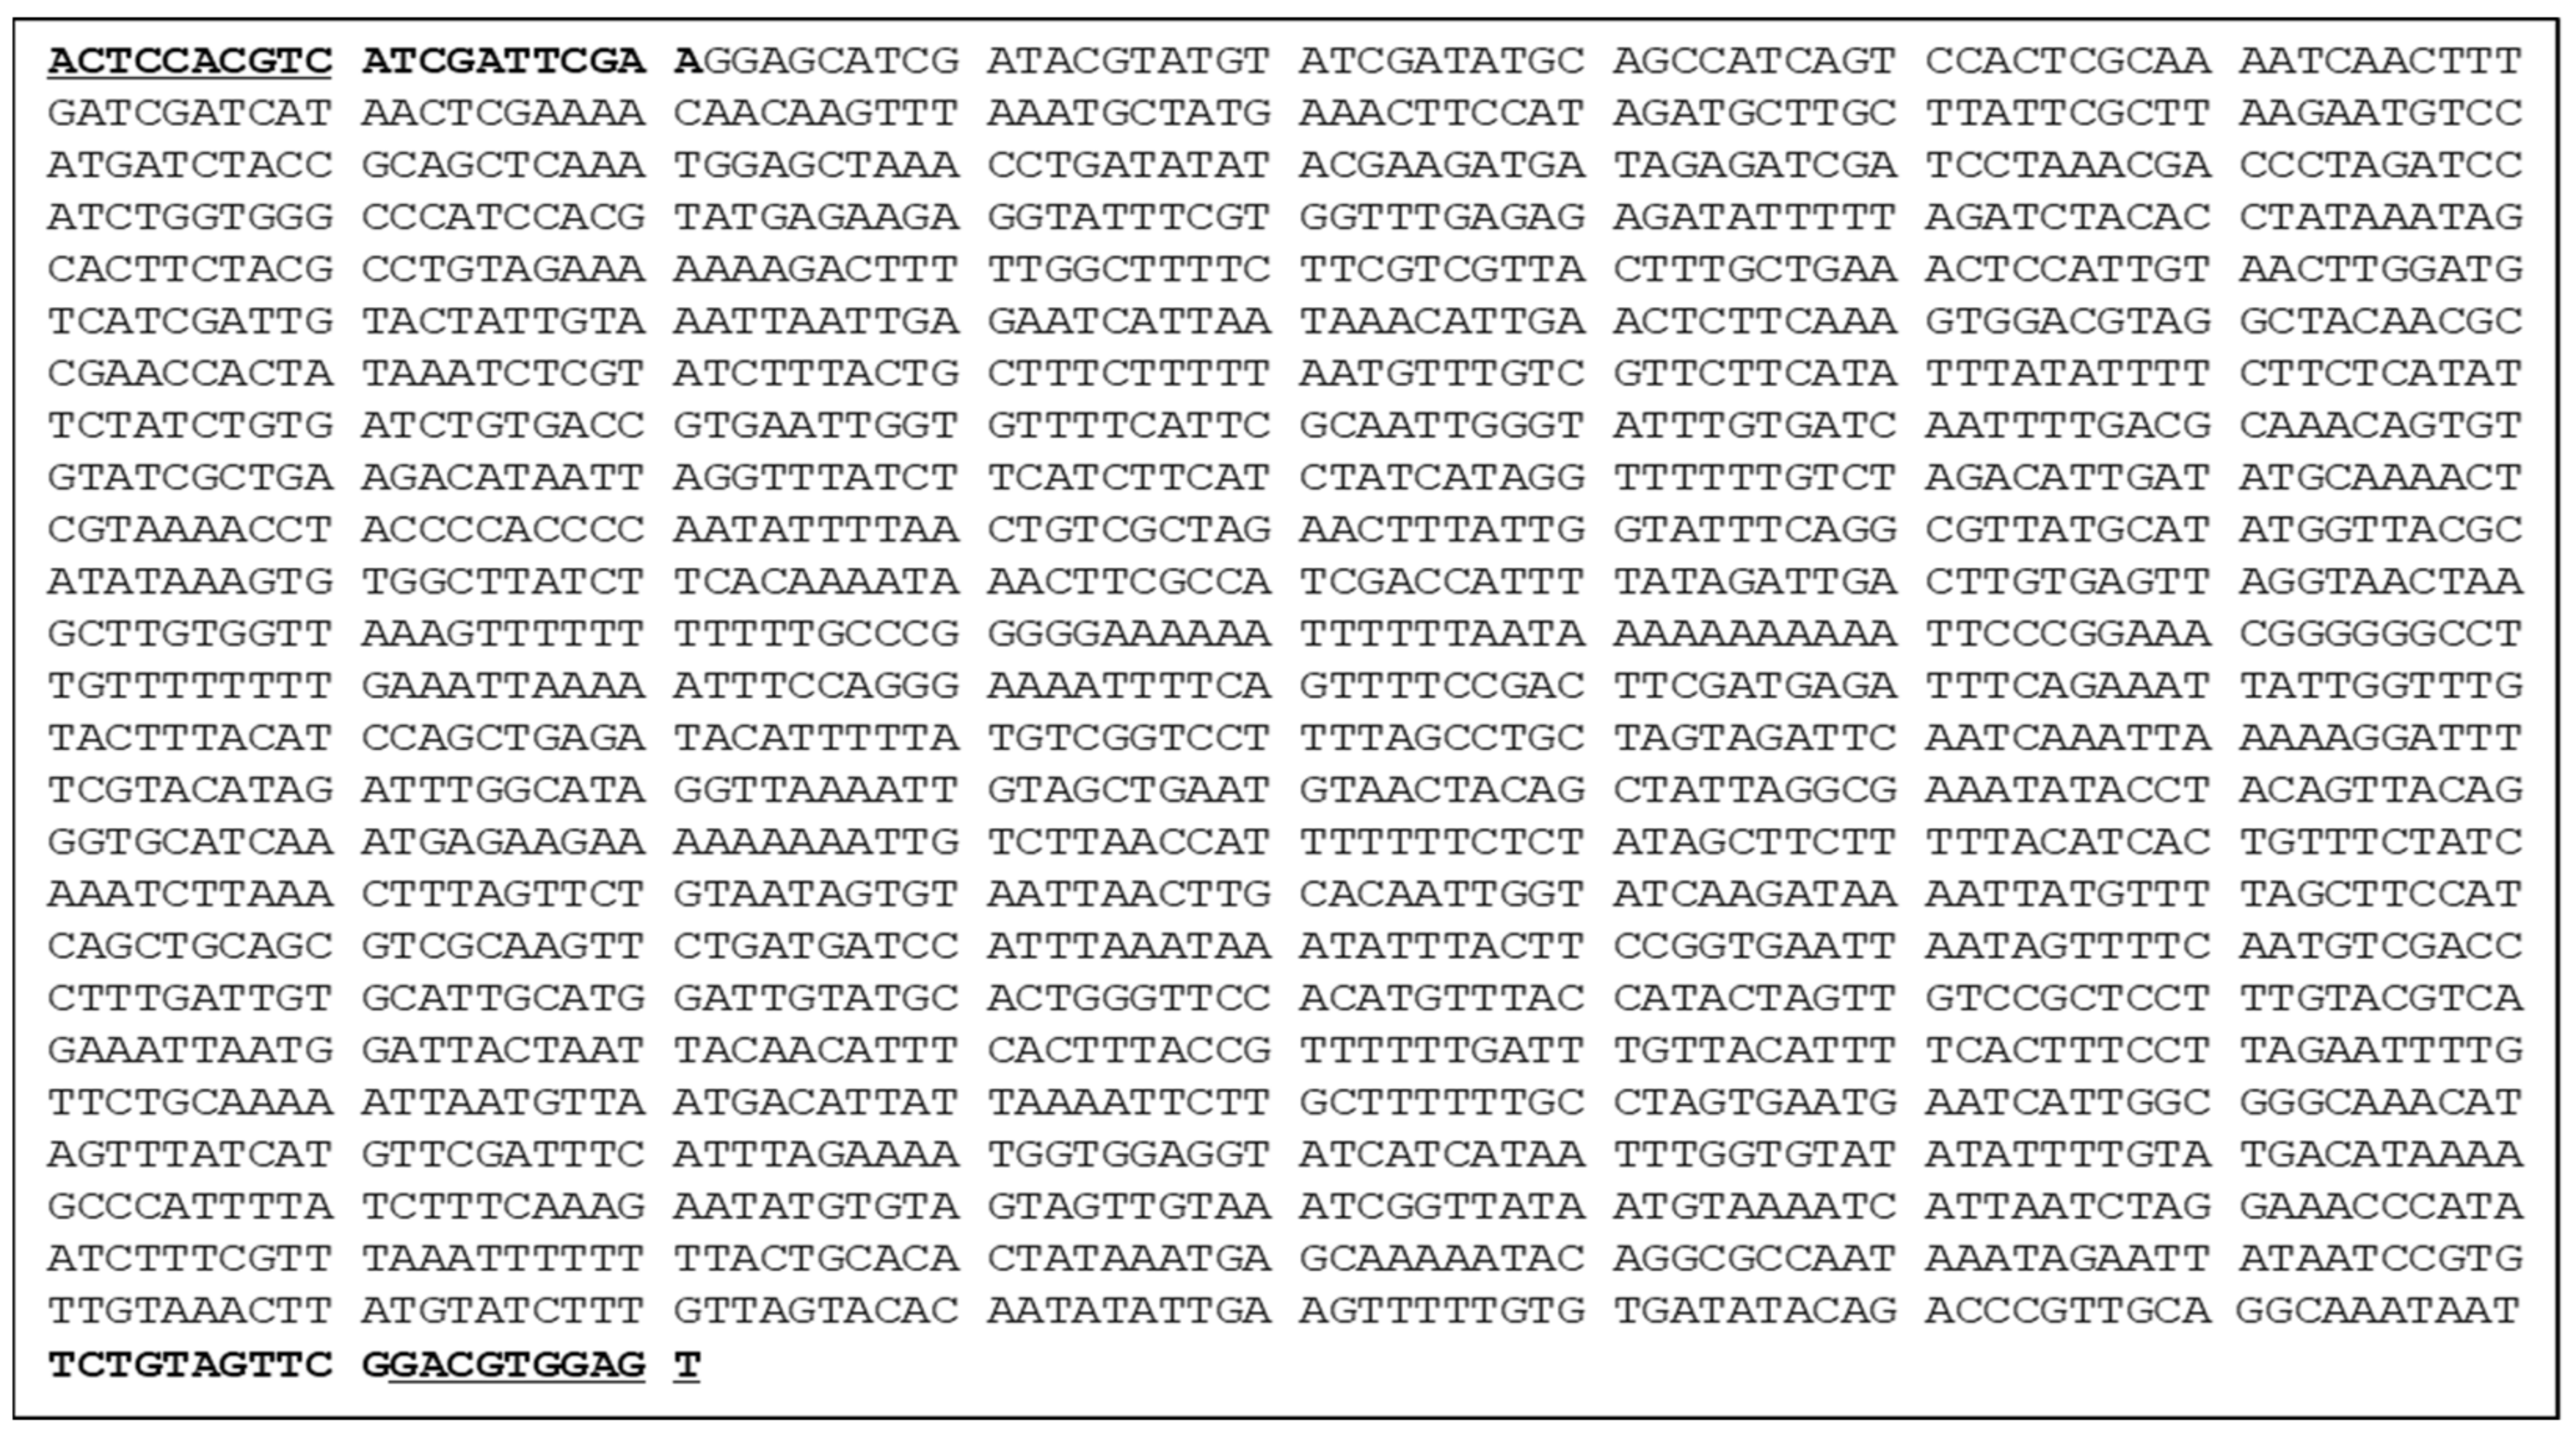
3.2. Development of a SCAR Marker for the Selection of Resistant Lines

From the RAPD results, a SCAR marker was developed using a specific RAPD product showing polymorphisms between the resistant and susceptible lines (Figure S2). The 2-Kb bands were amplified in the resistant lines S&P 7522, S&P 7521, S&P 7129, and S&P 7168 by using the OPAN-1 primer. The amplified polymorphic bands were eluted, purified, and sequenced. From the sequencing results, 5’-ACT CCA CGT C-3’, which is a sequence of random primer OPAN-1, was identified at both ends of the fragment sequence (Figure 2). In addition, the sequences were analyzed using BLAST at the National Center for Biotechnology Information (NCBI), and insignificant results were obtained. Therefore, further studies are required to analyze this unknown DNA sequence. The SCAR marker primer was designed to include the 5′-ACT CCA CGT C-3′ sequence of the OPAN-1 random primer. The forward primer was 5′-ACT CCA CGT CAT CGA TTC GAA-3′, and the reverse primer was 5′-ACT CCA CGT CCG AAC TAC AGA A-3′. The primer set for the SCAR marker was designed for considering the annealing temperature, GC content, the possibility of dimer formation, and hairpin loops. The developed SCAR marker was designated as SCAR-OPAN1.

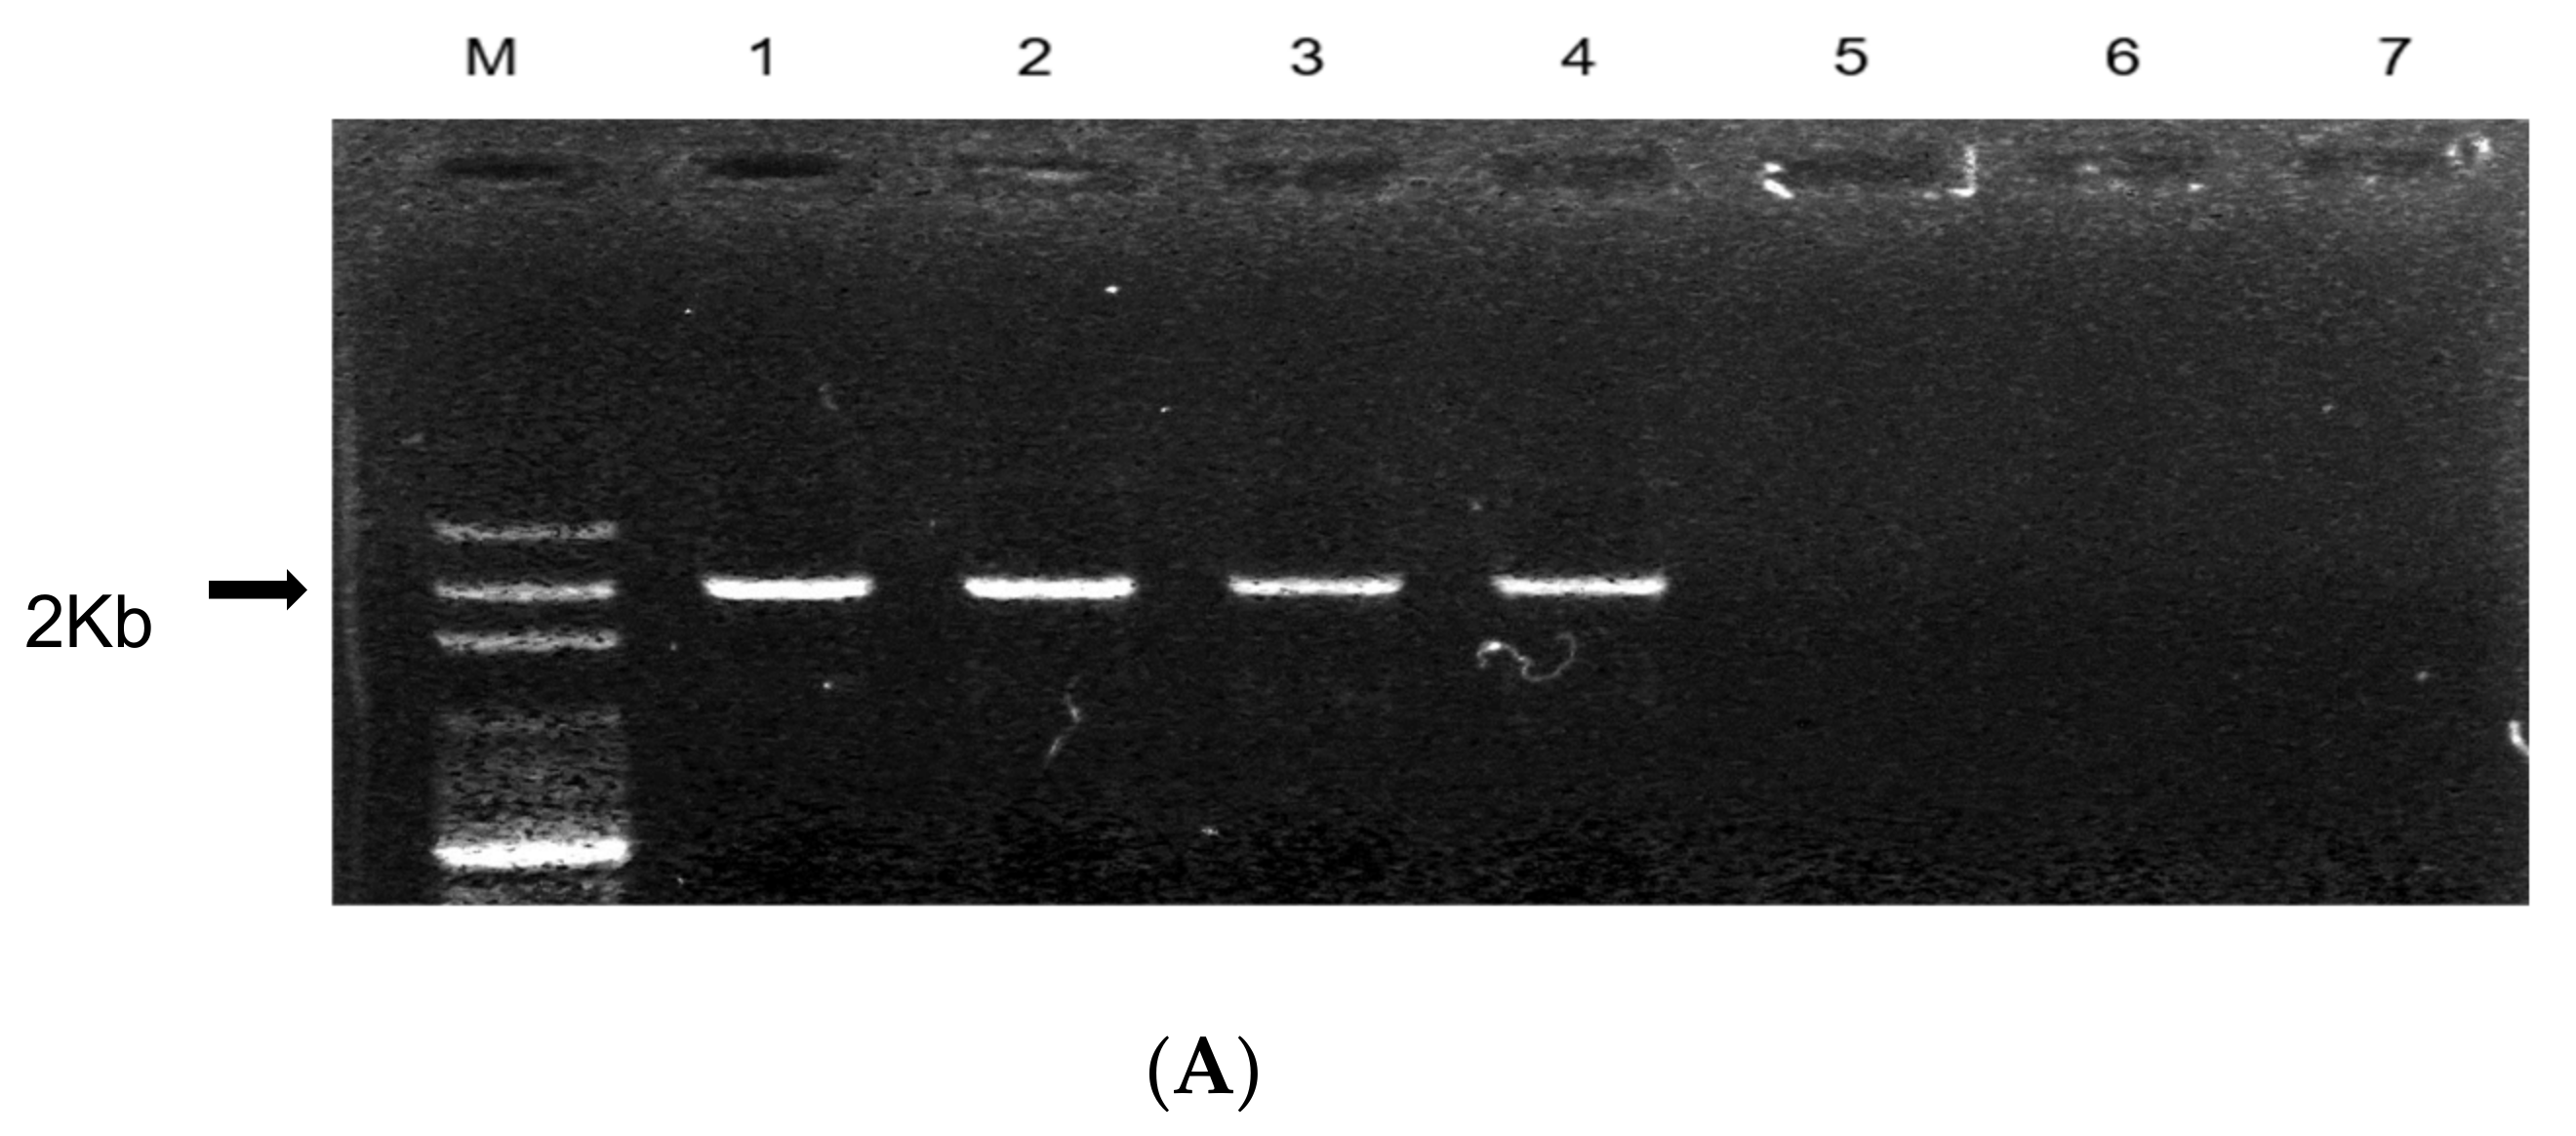
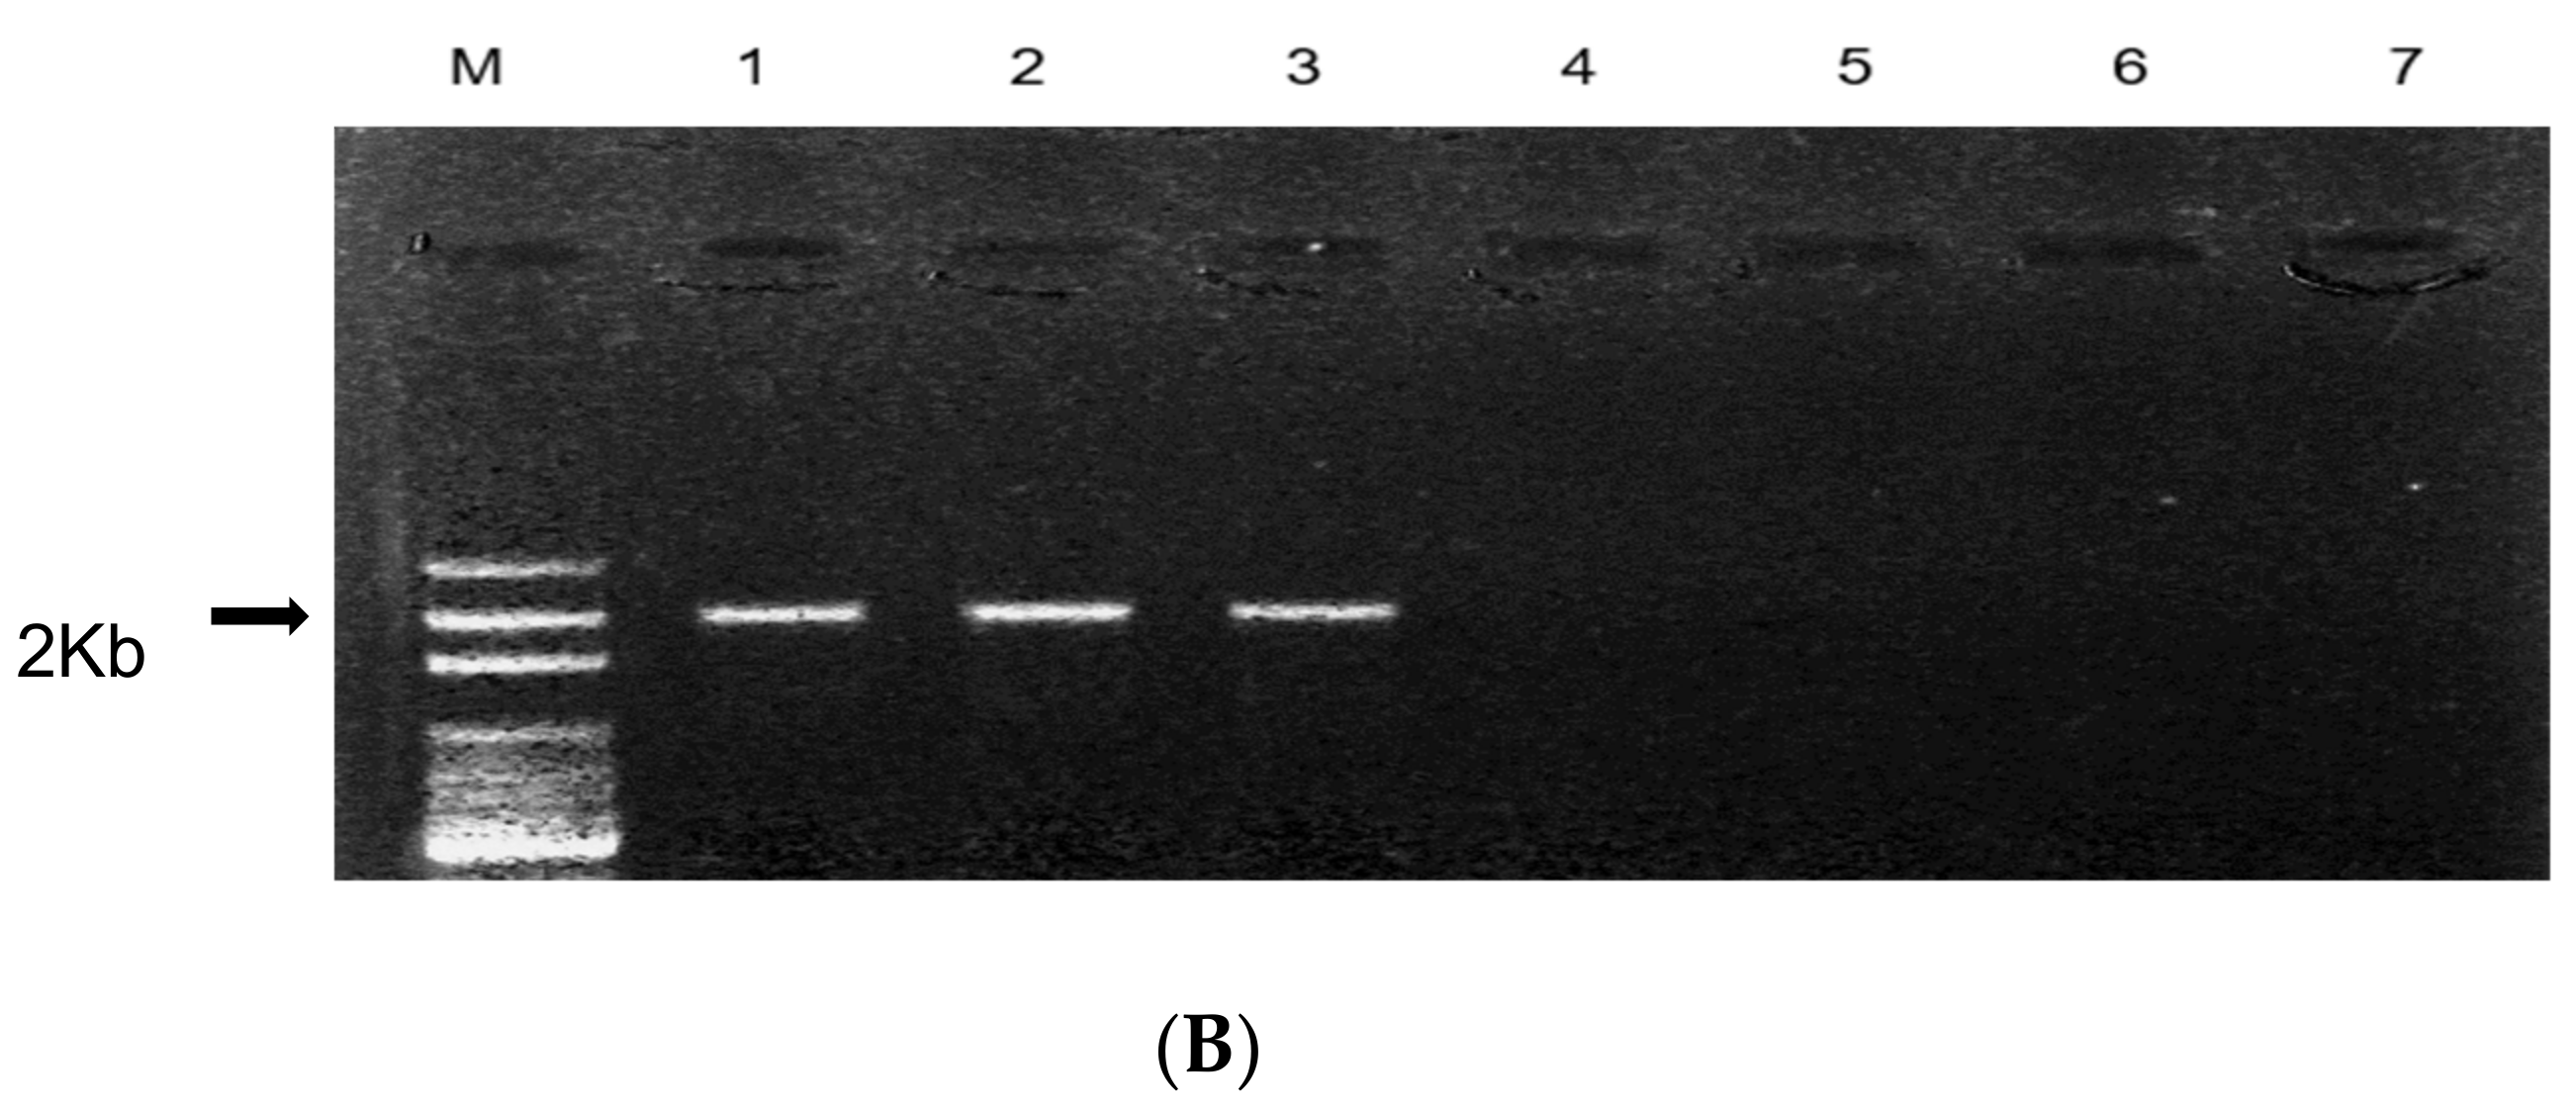
3.3. Validation of the Developed SCAR Marker Using the Resistant and Susceptible Onion Lines

The SCAR-OPAN1 marker was used to screen the resistant and susceptible lines. The 2-Kb-sized polymorphic band was amplified in the resistant lines S&P 7522, S&P 7521, S&P 7129, and S&P 7168 and was not amplified in the susceptible lines S&P 7483, S&P 7130, and S&P 7175 (Figure 3a). The developed SCAR-OPAN1 marker amplified the specific band only from the resistant lines, demonstrating its potential as a molecular marker for the selection of resistant lines. To validate the SCAR-OPAN1 marker, three resistant lines and four susceptible lines of ‘Asia Seed’ Co. were screened using the SCAR-OPAN1 marker (Figure 3b). Similar to the screening results of the ‘Seeds & People’ Co. onion lines, a product size of 2 Kb was amplified only in the resistant lines (Asia-12, Asia-42, and Asia-53). These polymorphic bands between the resistant and susceptible lines allow the selection of gray mold-resistant onion lines for breeding programs.

3.4. Preprocessing of Raw Data of the RNA Sequence

After the quality check of the extracted RNA was completed, a library was constructed, and the quality of distribution by cDNA size and concentration of the constructed library were measured using a Bioanalyzer DNA Chip (Agilent Technologies, Santa Clara, CA, USA). Thereafter, RNA sequencing was performed using the constructed library information and HiseqX (Illumina, San Diego, CA, USA), and the raw RNA sequencing data of each onion line were obtained. The raw RNA-seq data are shown in Table S3. The raw reads of the seven onion lines ranged from 28,899,894 to 41,664,542, the total reads of the trimmed reads ranged from 20,744,300 to 27,932,656, and the mapped reads ranged from 16,852,911 to 21,958,205. Trimming was performed by removing low-quality bases and Illumina adapters from the raw data. Mapping was performed on the reference data of NABIC (RDA, JeonJu, Korea, https://nabic.rda.go.kr, accessed on 7 February 2021), and the number of paired reads containing at least 50 nucleotides was confirmed. As a result of mapping, the lengths of the mapping reads ranged from 267 nucleotides to 5478 nucleotides, the average length of the reads was 2236 nucleotides, and the median was 1988 nucleotides. The mapping results determined that the length of the mapped reads was sufficient for the next analysis, and the following analysis was performed.

3.5. Variant Analysis and Filtering for Selection of Transcripts

A variant analysis was conducted to confirm the genetic variations between the gray mold disease-resistant and -susceptible lines. The total raw variants was 359,288, which was generated using haplotypeCaller of the Genome Analysis Tool Kit (GATK, Broad Institute, Cambridge, MA, USA). These variants were confirmed to have occurred in 28,602 transcripts out of a total of 87,427 acquired transcripts. To remove the low-quality genotypes, the minimum depth coverage was set to five, and the maximum depth coverage was set to 100. The minimum genotype quality was filtered to 20%. As a result, the total filtered-out variants were 28,602, including 27,303 SNPs and 1299 indels. Among them, the variants that matched the following conditions were selected: four resistant lines showed the same genotype within a group, and three susceptible lines also showed the same genotype within a group but showed differences between the resistant and susceptible groups. A total of 233 variants were obtained that matched these conditions, and 118 corresponding transcripts were selected.

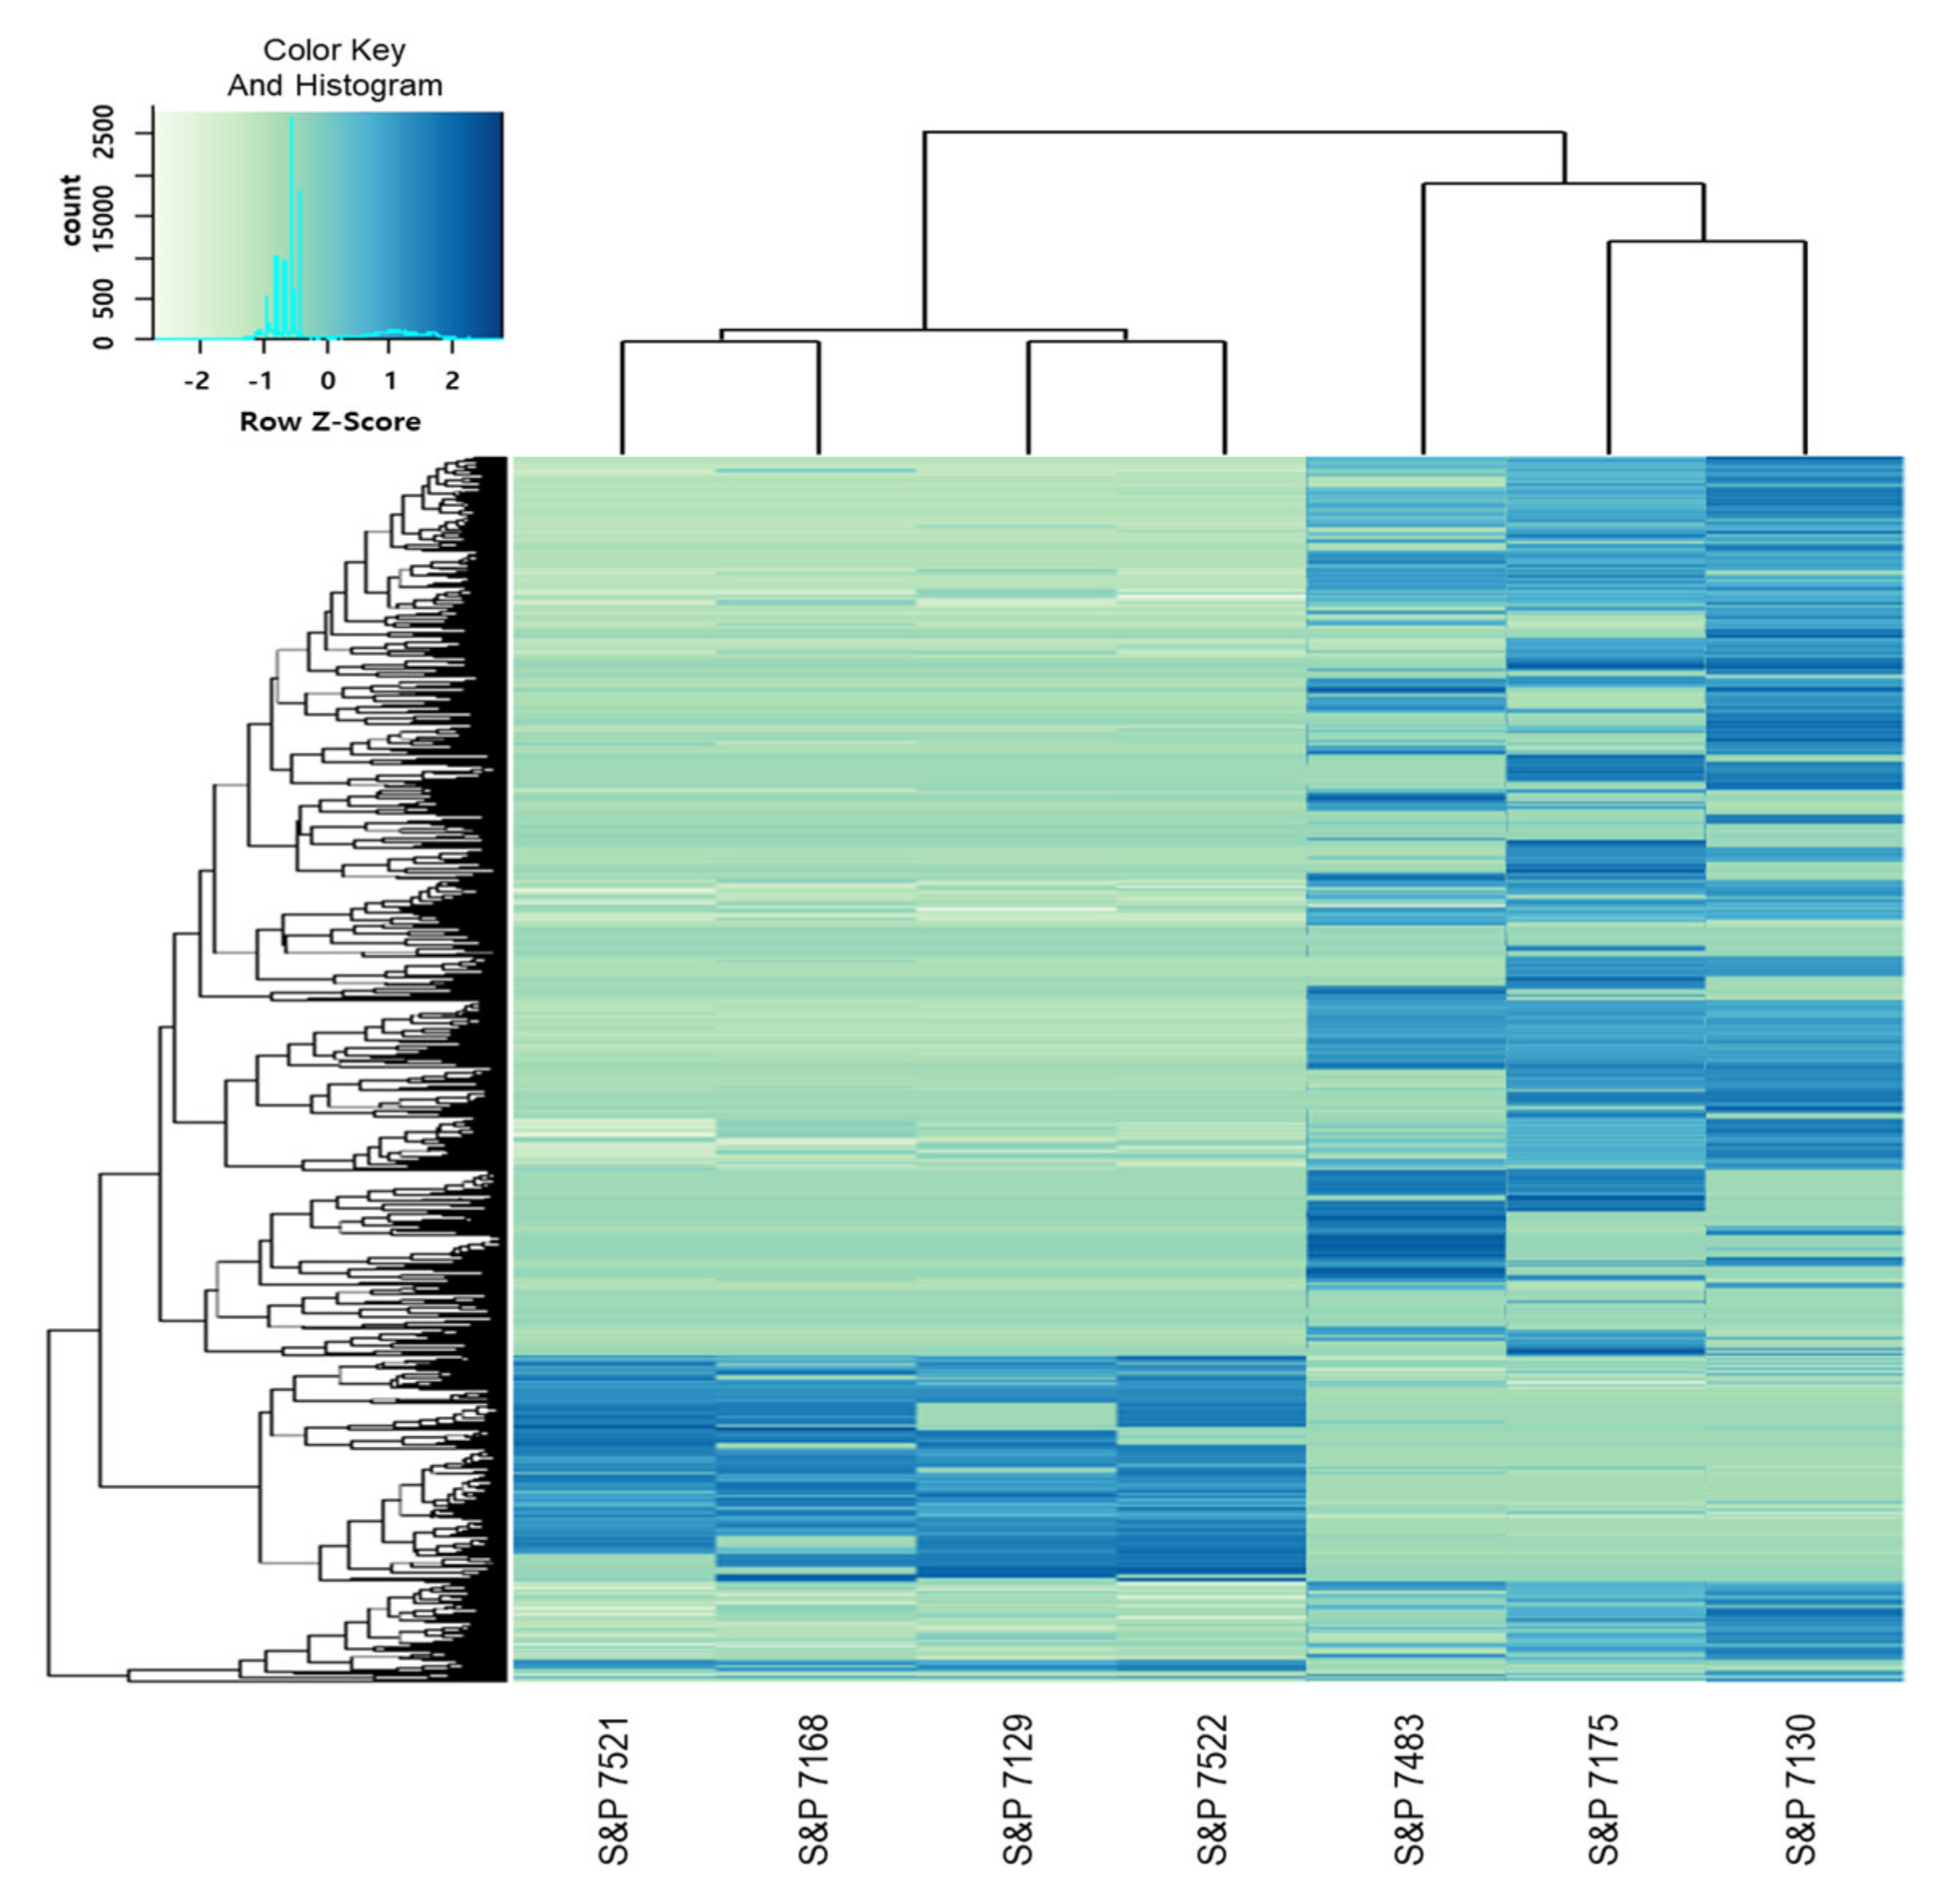
3.6. Selection of Transcripts Related to Disease Resistance through DEG Analysis and GO Annotation

A DEG analysis between the resistant and susceptible lines was performed to develop molecular markers related to disease resistance. TransDecoder was used to select 109,521 sequences with a length of 100 or more amino acids among the sequences generated using Trinity de novo assembly. As a result of calculating the read count of the transcript expression level using the StringTie program, we confirmed that the overall average mapping rate was 85%, and a total of 87,427 transcript read counts were obtained. Based on the read count of the transcript of each line, a comparative analysis between each onion line was performed using DESeq2. First, the raw read count data were normalized through size factor and dispersion. Thereafter, a correlation analysis between each line was performed based on the standardized value. In addition, from the RNA-seq results, the DEGs were analyzed for the resistant and susceptible groups. Using the DEGseq of the R package, it was confirmed that the difference in resistance versus susceptibility was statistically significant. Significantly expressed genes were verified using the MA plot results (Figure S3). In the MA plot, a false discovery rate (FDR) of less than 0.05 was indicated in red. Through the identification of the significantly expressed genes shown in red, it was confirmed that it was sufficient for use in the subsequent resistance-related gene analysis. In addition, a heatmap was constructed using z-scores to analyze the differences in expression for each line by using a group of significantly expressed genes (Figure 4). The heatmap was analyzed by comparing and analyzing the Pearson correlation coefficients for each line and gene after hierarchical clustering using the average linkage method. In addition, a volcano plot of the DEGs was obtained (Figure S4). The results of the volcano plot are shown in different colors according to the following conditions: FDR < 0.05 and |log2 fold change| ≥ 2. In the volcano plot, it was expressed in different colors according to the following conditions: red: FDR < 0.01 and |log2 fold change| ≤ 2, green: FDR < 0.01 and |log2 fold change| > 2, and orange: FDR ≥ 0.01 and |log2 fold change| > 2. Through this visualized DEG result, it was confirmed that there was a transcript showing a significant DEG difference between the gray mold-resistant and -susceptible groups.
The differences between resistant and susceptible lines of ‘Seeds & People’ Co. were significant, and it could be statistically confirmed that a resistance-related mechanism analysis was possible. Among the obtained 87,427 transcripts, the transcripts with significantly different expression levels between the resistant and susceptible lines were selected to satisfy the following conditions: PADJ < 0.05 and |log2 fold change| ≥ 2. A total of 1636 transcripts were selected. Among the 1636 transcripts, 320 transcripts showed higher expression levels in the resistant group, and 1316 showed higher expression in the susceptible group. Among the 320 transcripts that showed a higher level in the resistant group, only 182 transcripts matched to TAIR ID, while 138 did not, suggesting an unknown onion gene. In addition, among the 1316 transcripts that showed higher expression levels in the susceptible group, only 897 transcripts matched, while 419 did not. The matched transcripts were analyzed by GO annotations of the cellular components, molecular functions, and biological processes using TAIR ID.
To select genes with increased expression in relation to resistance, among the 182 transcripts with increased expression levels, 22 transcripts related to ‘response to stress’ and seven transcripts related to ‘response to biotic stimuli’ were analyzed by GO annotation (Figure S5). Finally, 29 resistance-related transcripts were confirmed to be related to disease resistance, and variants were also observed between the resistant and susceptible groups. In addition, the gene functions of the identified transcripts were analyzed using TAIR ID

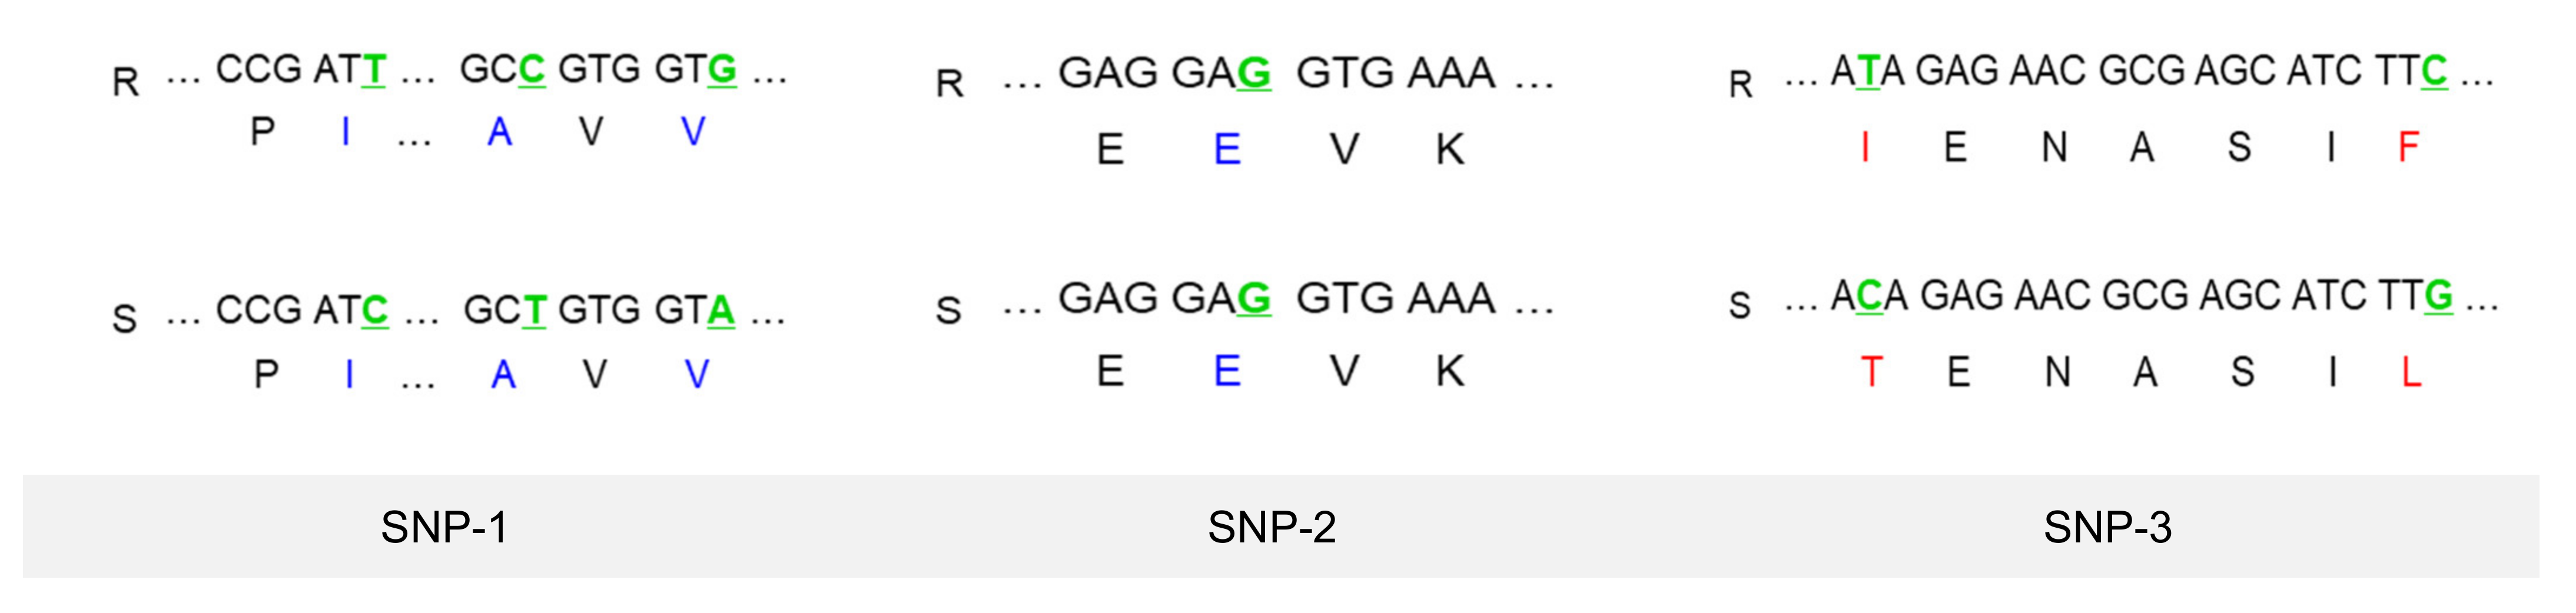
3.7. Transcripts Selection to Develop SNP Markers and a HRM Analysis

Based on variant analyses, including the DEG and GO analyses, the transcripts were selected to develop SNP markers for the screening of gray mold-resistant onions. A total of 118 transcripts with 233 variants, such as SNPs and indels, between the resistant and susceptible groups were selected by variant analyses. Thereafter, 29 transcripts that were found to be related to disease resistance through the GO analysis and showed higher gene expression levels in the resistant group than in the susceptible group in the DEG analysis were selected. Finally, a total of 14 transcripts with SNPs were selected to develop SNP markers, and HRM primers were designed from these 14 selected transcripts with SNPs that existed between the resistant and susceptible lines (Table 1). These selected transcripts were associated with genes with functions related to ‘response to biotic stimulus’ and ‘response to stress’. Plants are known to show resistance to pathogens in various ways. Although it prevents infection by pathogens structurally, such as through cell walls, it has several defense systems that show resistance to invading pathogens. The gene functions of the selected transcripts were ‘lipoxygenase 3’, ‘Glutathione S-transferase’, and ‘systemic acquired resistance’, which were genes related to plant resistance (Table 2).
Each HRM amplicon obtained from the 14 HRM primers was confirmed to match the expected size by electrophoresis. In addition, the sequence analysis confirmed that SNPs existed between the resistant and susceptible lines and revealed the amino acid sequences that were altered by the SNP (Figure 5). The SNPs targeted by the HRM primers are shown in green, and the nonsynonymous mutations are shown in red. Synonymous mutations are shown in blue and were present in SNP-1, SNP-2, SNP-4, SNP-12, and SNP 14. Nonsynonymous mutations were identified in SNP-3, SNP-5, SNP-6, SNP-7, SNP-8, SNP-9, SNP-10, SNP-11, and SNP-13. The melting peak values obtained from the HRM analysis were confirmed by ANOVA grouping. As a result, SNP-3 primers targeting the AKR gene transcript capable of distinguishing resistance and susceptibility were selected. The expected amplicon size of the SNP-3 primer was 134 bp. The HRM amplicon sizes of all seven onion lines were identified as the same. In addition, the sequences of the four resistant and three susceptible lines targeted by the SNP-3 primer were analyzed (Figure 6). Two SNPs were identified within the sequence. One SNP showed the ‘T’ allele in the resistant lines and the ‘C’ allele in the susceptible lines, while the other SNP showed the ‘C’ allele in the resistant lines and the ‘G’ allele in the susceptible ones.
In the results of the HRM analysis, which was repeated six times using the SNP-3 primer, the melting values of the resistant strains were 79.642–79.838 and those of the susceptible strains were 80.353–80.472. Upon statistically grouping these values by the Duncan method using ANOVA, significant results were obtained by grouping four resistant lines into one group (A) and three susceptibility lines into another group (B) (Table 3a). In the HRM result graph, the resistant lines (red) show a distinct curve from the susceptible lines (blue) (Figure 7a). Compared with the sequence results, it was confirmed that the resistant group that showed ‘T’ and ‘C’ at the SNP position had a lower melting temperature than the susceptible group that had ‘C’ and ‘G’. In addition, for validation, the ‘Asia Seed’ Co. onion lines were analyzed using the SNP-3 HRM marker. As a result of ANOVA grouping, the resistant lines (Asia-12, Asia-48, and Asia-53) were grouped into one group (A), and the susceptible lines (Asia-30, Asia-35, Asia-45, and Asia-50) were also grouped together (B) (Table 3b). Similar to the HRM results of the ‘Seeds & People’ Co. onion lines, the HRM curve graph of the ‘Asia Seed’ Co. onion lines showed that the resistant lines were melted at a lower temperature than the susceptible lines (Figure 7b). Based on this result, it was confirmed that the SNP-3 HRM marker is versatile and can be used to select resistant onions.

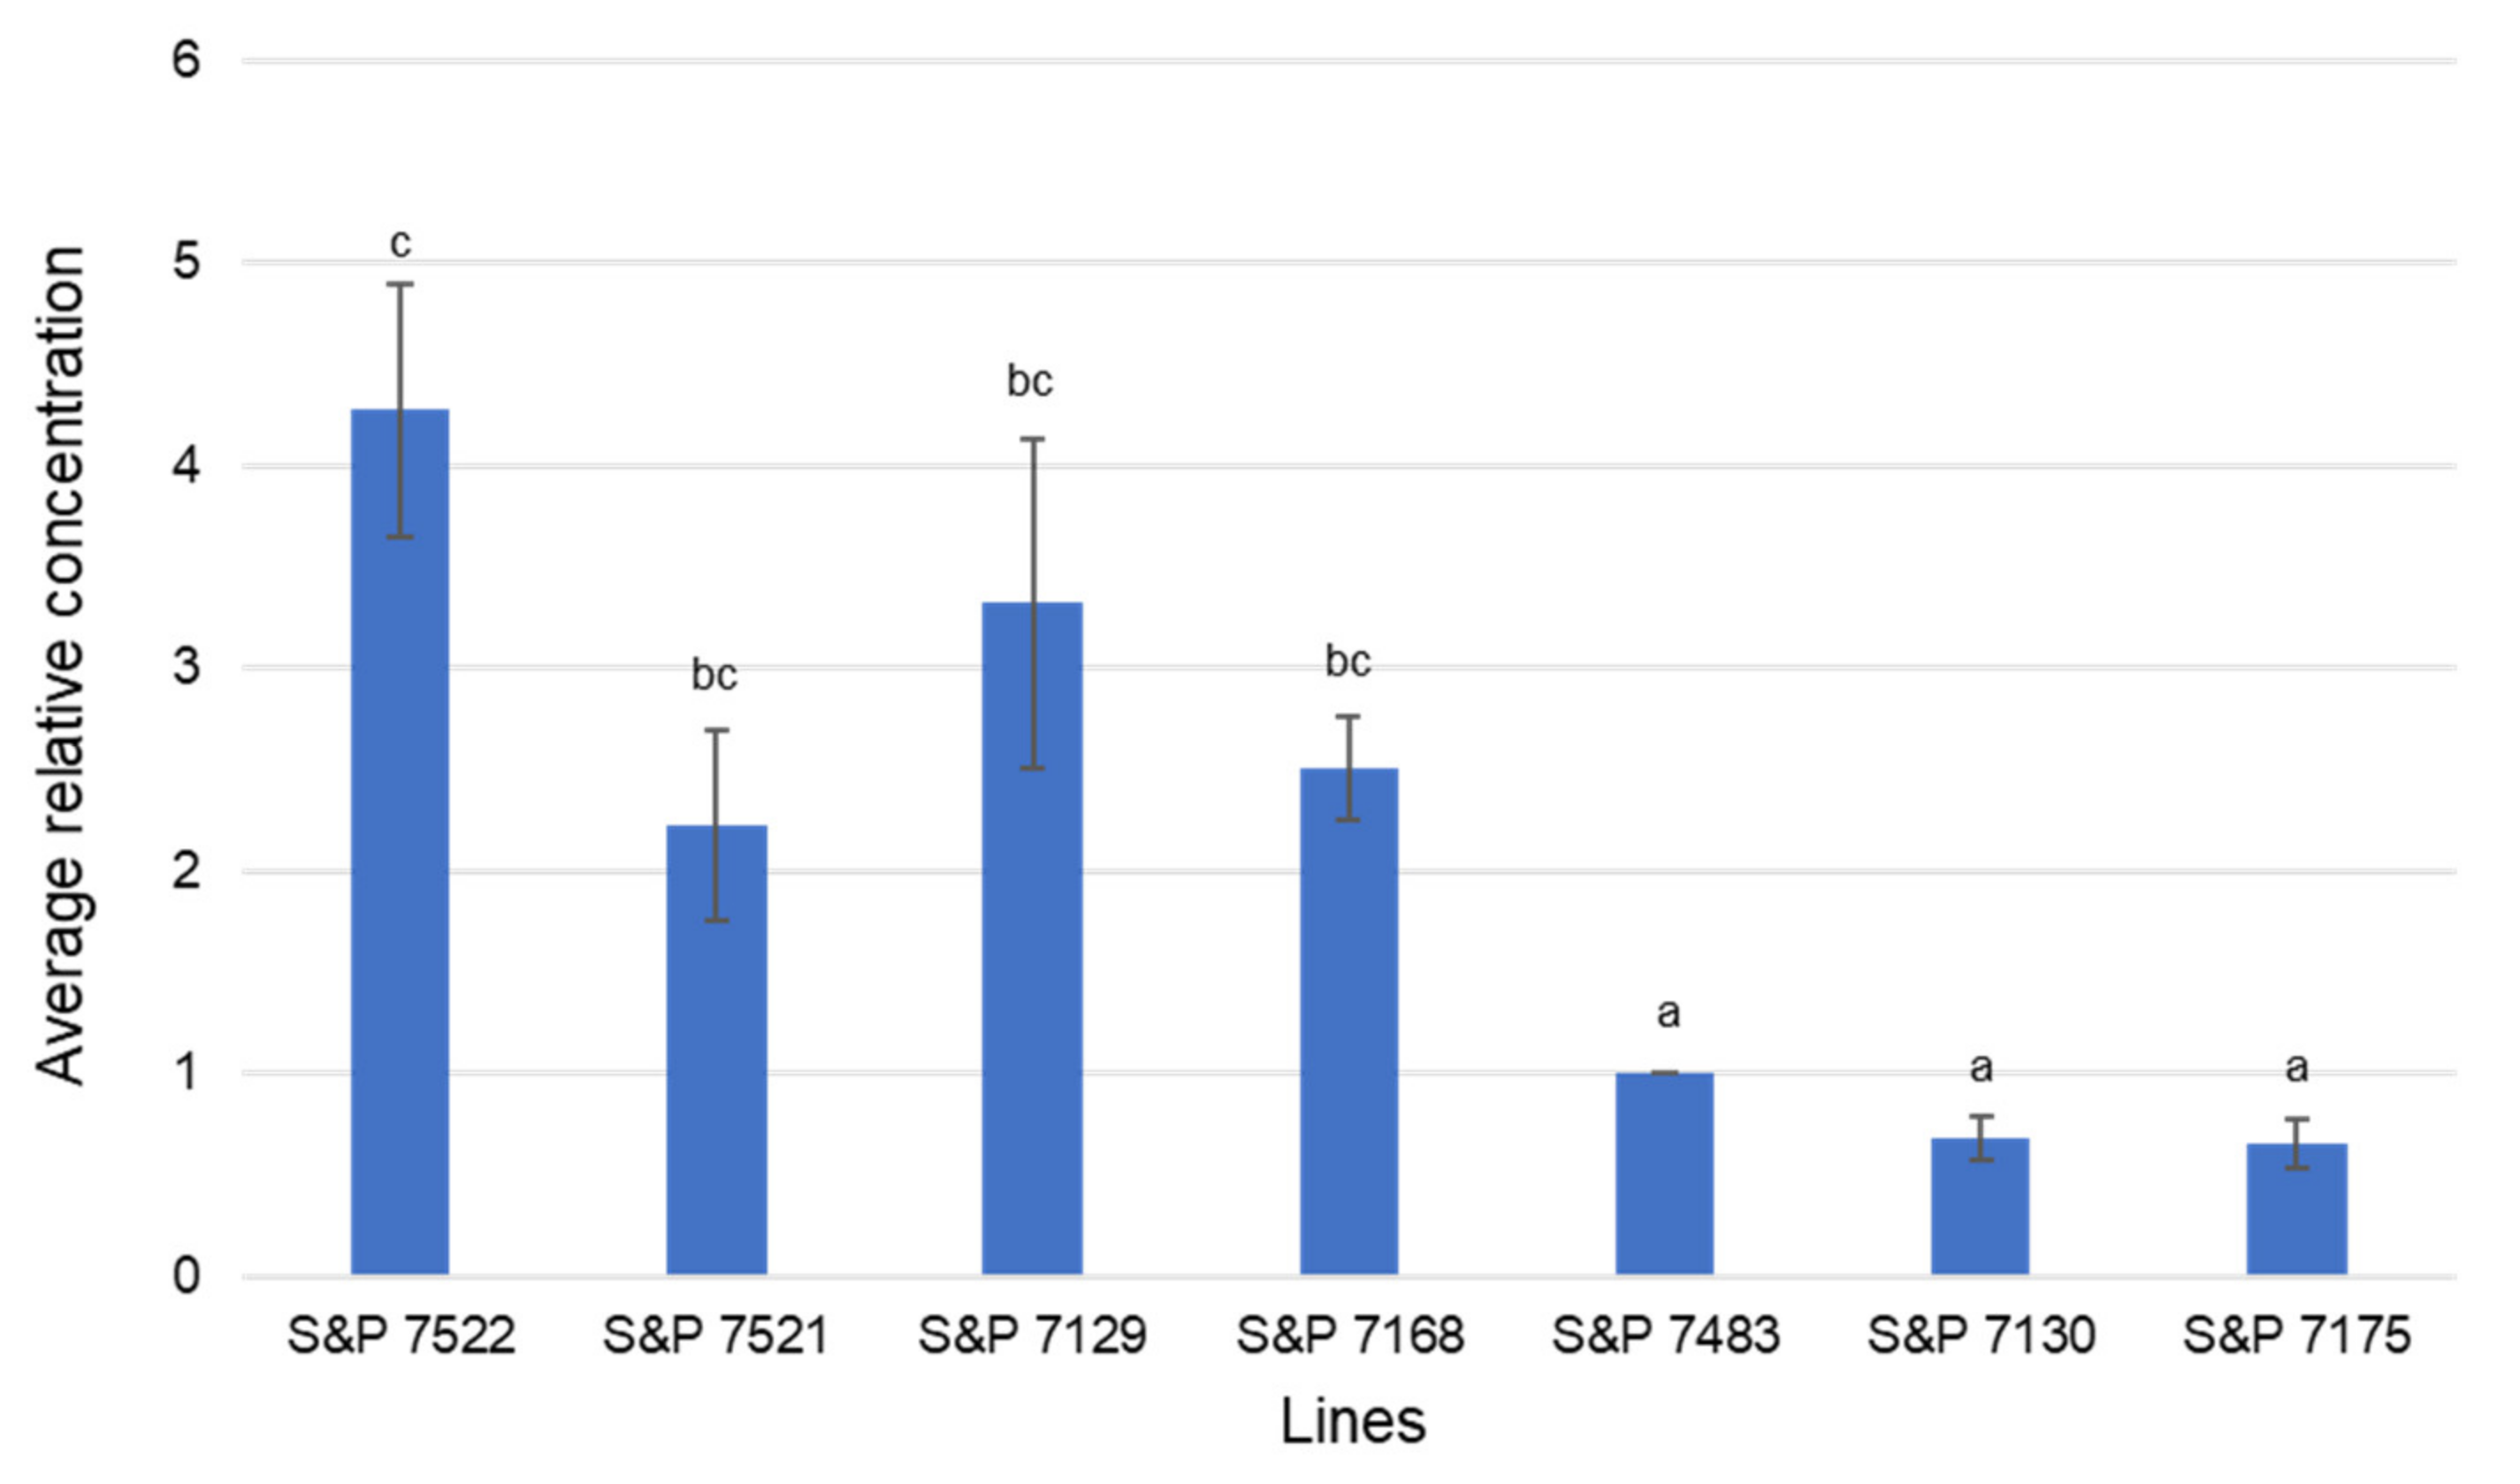
3.8. Confirmation of AKR Gene Expression Level in the Onion Lines through qPCR Analysis

The SNP-3 HRM marker was selected from the AKR transcript and showed higher expression levels in the resistant line group in the in silico data. qPCR was performed to confirm the gene expression levels of AKR. Before performing qPCR, RT-PCR was performed to confirm the amplification using the primer set designed for qPCR. RT-PCR showed that all seven onion lines were amplified into one band of 171 bp. qPCR was performed in six replicates by the SNP-3 primer, and the results were calculated using the ΔΔCt method. The gene expression level was normalized to the actin gene expression level and compared with the susceptible line S&P 7483 with the highest susceptibility (Figure 8). In the qPCR analysis, the expression level of the AKR gene was higher in the resistant group than in the susceptible group, with S&P 7522 showing the highest expression level and S&P 7130 showing the lowest expression level.

4. Discussion

Using molecular markers, genetic differences can be quickly and easily identified at the DNA level without phenotyping. RAPD markers can easily identify polymorphisms by using short random primers, commonly 10 bp in length. In addition, it does not rely on knowing the target DNA sequence information, and RAPD is inexpensive, simple, quick, and easy to use [25,26,27]. Based on the RAPD results, small genetic differences between large genomes can be identified. Genetic relationships between the onion lines can also be confirmed through the unweighted pair group method with an arithmetic mean cluster dendrogram [15,16].
In this study, a phylogenetic analysis of gray mold disease-resistant and -susceptible lines was conducted using RAPD. The phylogenic analysis obtained from the RAPD showed that the resistant lines were closely related to other resistant lines, and the susceptible lines were closely related to other susceptible lines. S&P 7522, S&P 7521, S&P 7129, and S&P 7168 belong to the gray mold disease-resistant line group, and S&P 7483, S&P 7130, and S&P 7175 belong to the gray mold disease-susceptible line group. Additionally, a close genetic relationship appeared between the resistant S&P 7522 and S&P 7521 lines and between the resistant S&P 7129 and S&P 7168 lines. Similarly, susceptible lines S&P 7483, S&P 7130, and S&P 7175 showed close genetic relationships in the phylogenic analysis. These results were similar to the pedigree of the ‘Seeds & People’ Co. onion lines. According to the pedigrees, two gray mold disease-resistant lines, S&P 7129 and S&P 7168, were bred by crossing the resistant lines S&P 7522 and S&P 7521. The gray mold disease-susceptible lines S&P 7130 and S&P 7175 were bred through the crossing of the susceptible lines S&P 7406 and S&P 7405. A comparison of the results of the phylogenetic analysis obtained from the RAPD with the pedigree of the breeding lines revealed similar genetic relationships, thereby demonstrating the reliability of the RAPD results.
The SCAR-OPAN1 marker was developed using the polymorphic fragment in the RAPD analysis. The SCAR-OPAN1 marker sequence was designed to extend longer, including the 5′-ACT CCA CGT C-3′ sequence of the OPAN-1 random primer. The primer set for the SCAR- OPAN1 marker was designed considering the annealing temperature, GC content, the possibility of the dimer formation, and the hairpin loops. A BLAST analysis was performed to analyze the products amplified by the SCAR marker. In the BLAST analysis of the DNA sequence of the fragment amplified from the SCAR marker, there was no significant percentage of sequences matched to the other sequences from onions and other species; therefore, additional analysis is required. SCAR markers have been used to distinguish between various cultivars and species [28,29]. SCAR markers can be used to select individuals with specific traits and to identify disease-resistant individuals. Using SCAR markers, the selection of male infertility-dominant Ms and -recessive ms in onions [30], anthrax resistance in grapes [31], and Acokita blight resistance in lentils [32] have been reported. It was confirmed that the selection of gray mold disease-resistant onions was possible using this SCAR- OPAN1 marker in the onion breeding lines of ‘Seeds & People’ Co.
In addition, to validate the developed SCAR-OPAN1 marker, additional gray mold disease-resistant and -susceptible lines from the ‘Asia Seed’ Co. were analyzed. In the analysis of the gray mold disease-resistant and -susceptible ‘Asia Seed’ Co. lines, it was confirmed that a product of 2Kb was amplified only in the resistant lines. Therefore, it was confirmed that the SCAR-OPAN1 marker developed in this study not only facilitates the selection of gray mold-resistant onions but also facilitates easy selection in a considerably short time.
The HRM marker was developed to select gray mold disease-resistant onion lines by using the selected transcripts through a DEG analysis from RNA sequencing. After analyzing the RNA-seq, the selected 14 transcripts were analyzed using the Arabidopsis Information Resource (TAIR) ID derived from Arabidopsis. The matched transcripts were analyzed using GO annotation and were largely divided into cellular components, molecular functions, and biological processes. Among them, the transcripts related to disease resistance, classified as ‘response to biotic stimulus’ and ‘response to stress’, were selected.
Plant cells synthesized reactive oxygen species (ROS) and pathogenesis-related proteins (PR proteins) after the detection of the presence of pathogens, along with a hypersensitive response (HR) to prevent the growth of pathogens. These resistance responses can induce a systemic acquired resistance (SAR) response, which is a resistance response of the whole plant. When SAR is activated by pathogens such as fungi, bacteria, and viruses, salicylic acid (SA) accumulates, and the accumulation of SA is essential for SAR expression [33,34].
In this study, the SAR gene was targeted by the SNP-10 transcript and showed DEGs and variants between the gray mold disease-resistant and -susceptible line groups (Table 2). After analyzing the relationship between SA accumulation and SAR in the early 1990s, SARs have been identified in Arabidopsis thaliana, tobacco, and cucumbers. The immune response by SAR is induced by PR proteins and has been studied to recognize SA as a signal [35,36,37]. When tobacco began to show resistance to B. cinerea and Psequdomonas syringae, it was confirmed that the resistance mechanism was initiated by the involvement of SAR, PR genes (PR-1 and PR-5), and SA before preparation in whole plants [38].
In contrast to SAR, the induced systemic resistance (ISR) with other signaling pathways induced by the plant hormones jasmonic acid (JA) and ethylene is also one of the resistance responses of plants. JA is a plant hormone that is related to disease resistance. The transcript targeted by SNP-1 was found to be the lipoxygenase (LOX) 3 gene (Table 2). The LOX gene is involved in JA biosynthesis. In particular, LOX3 was rapidly upregulated when the pathogen B. cinerea was inoculated in Arabidopsis thaliana. This LOX-upregulated response was shown in LOX3 and LOX4, which was presumably related to the early JA response of oligogalacturonides acting as damage-associated molecular patterns (DAMPs) [39].
In addition, the glutathione S-transferase (GST) gene, the transcript targeted by SNP-6, has been identified in many studies on disease resistance in plants (Table 2) [40,41,42]. GST plays a major role as an antioxidant and is resistant to plants in relation to a hypersensitive response to cell death. The transformed Nicotiana benthamiana was resistant to Colletotrichum destructivum and C. orbiculare by the GST gene [43].
In other selected transcripts, it was also confirmed that target genes have various functions related to plant resistance. Among them, the SNP-3 transcript developed as an HRM marker was confirmed to be an aldo-keto reductase gene (AKR) (Table 2). It was confirmed that the SNP-3 HRM marker related to the AKR gene can also select gray mold disease-resistant lines from ‘Seeds & People’ Co. and ‘Asia Seed’ Co. AKR gene expression was higher in the gray mold disease-resistant line group than in the -susceptible line group. AKR has been mentioned in previous studies and is known to increase the resistance at high expression levels [44,45].
Since the SNP-3 HRM marker was a gene-based marker, a qPCR analysis was conducted to confirm the expression level of the AKR gene. The expression level of AKR was higher in the resistant group than in the susceptible group. The qPCR results were compared with the in silico data. In the RNA-seq results, the expression level of AKR was higher in the resistant group than in the susceptible group, and S&P7522 showed the highest expression level. The similarity of the AKR gene expression levels between the qPCR analysis and in silico RNA-seq results showed that the gene was associated with resistance to gray mold disease, increasing the reliability of the in silico data used to develop the molecular markers.
It has also been identified that the AKR gene provides multiple stress tolerances in plants. In particular, there have been studies related to abiotic stresses such as herbicide resistance, heat stress tolerance, and biotic stress, such as mildew [41,46,47]. For biotic stress from pathogens such as microorganisms, the AKR gene group is mainly involved in plant secondary metabolic pathways, including flavonoid biosynthesis in plant-microbial interactions. Therefore, these AKRs primarily function as plant defense systems against biological stresses, such as a pathogen attack. However, despite reports identifying plant AKR as a potential target for developing abiotic and biotic stress-tolerant plant species, the importance of plant AKR has not yet been emphasized [46,48].
Various studies have revealed that AKR plays a stress-related role. This study also showed differences in the resistance and gene expression levels according to SNPs between the gray mold-resistant and -susceptible line groups. It was considered that the AKR gene affected the resistant group to show a resistance to gray mold disease. Therefore, further studies of AKR will be needed, and the SNP-3 HRM marker developed in this study could be used to select gray mold disease-resistant onion lines.

5. Conclusions

Onions have a large genome size, and the information on the existing DNA sequences is insufficient. In this study, a molecular marker was developed to breed resistant onions against gray mold disease. A phylogenetic analysis between the gray mold disease-resistant and -susceptible lines was performed using a dendrogram derived from the RAPD analysis. The constructed dendrogram was compared with the pedigree of the gray mold disease-resistant and -susceptible breeding lines provided by ‘Seeds & People’ Co. The results of the phylogenetic analysis were consistent with the genetic relationship of the pedigree of the breeding lines and showed the reliability of the RAPD results. Thereafter, a SCAR-OPAN1 marker was developed based on the RAPD results showing polymorphic fragments between the resistant and susceptible lines. The SCAR-OPAN1 marker only amplified the resistant lines of the specific 2-Kb product, and no product was amplified in the susceptible lines.
In addition, the RNA-seq of the gray mold disease-resistant and -susceptible onion lines was analyzed using NGS technology. Based on the RNA-seq results, DEG and GO analyses were performed to identify the variants, such as SNPs and indels. As a result, a selectable marker, SNP-3 HRM, was developed to select gray mold-resistant lines. The SNP-3 HRM marker for the selection of the resistant lines includes SNPs present in the AKR gene exhibiting high expression levels in these lines. Consequently, in this study, the SCAR-OPAN1 and SNP-3 HRM markers were developed for the selection of resistant onion lines in breeding programs to reduce the damage caused by gray mold disease. Thus, using these molecular markers, the breeding period of biennial onions can be shortened by selecting an onion line that is resistant to gray mold disease, thereby alleviating the economic loss of onions.

Supplementary Materials

The following are available online at https://www.mdpi.com/article/10.3390/horticulturae7110436/s1: Figure S1: The pedigree of the onion lines provided by ‘Seeds & People’ Co. Figure S2: RAPD analysis of the resistant and susceptible lines provided by ‘Seeds & People’ Co. by using the OPAN-1 random primer. Figure S3: MA plot to verify the significantly expressed genes in the groups of resistant and susceptible lines. Figure S4: Volcano plot of the transcripts that satisfied the following conditions: FDR < 0.05 and |log2 fold change| ≥ 2. Figure S5: GO annotation of 182 transcripts with increased expression levels. Table S1: Characteristics of the four resistant lines (S&P 7129, S&P 7168, S&P 7521, and S&P 7522) and three susceptible lines (S&P 7130, S&P 7175, and S&P 7483) provided by ‘Seeds & People’ Co., Ltd. (Yeonggwang, Korea). Table S2: Sequence information of 40 OPERON random primers used for the RAPD analysis. Table S3: Results of the raw data obtained by RNA-seq, trimming, and mapping.

Author Contributions

Conceptualization, S.-J.K., J.-S.P., and Y.-D.P.; investigation and writing—original draft preparation, S.-J.K. and J.-S.P.; resources, T.P.; data curation, H.-M.L.; investigation, J.-R.C.; and conceptualization, supervision, writing—review and editing, and funding acquisition, Y.-D.P. All authors have read and agreed to the published version of the manuscript.

Funding

This research was funded by the Ministry of Agriculture, Food and Rural Affairs (MAFRA).

Data Availability Statement

The datasets generated during and/or analyzed during the current study are available from the corresponding author upon reasonable request.

Acknowledgments

This work was carried out with the support of the Korea Institute of Planning and Evaluation for Technology in Food, Agriculture, and Forestry (IPET) through the Golden Seed Project (213007-05-5-SBB20).

Conflicts of Interest

The authors declare that they have no conflicts of interest. The funders had no role in the design of the study; in the collection, analyses, or interpretation of the data; in the writing of the manuscript; or in the decision to publish the results.

References

  1. Nam, K.H.; Baik, H.W.; Choi, T.Y.; Yoon, S.G.; Park, S.W.; Joung, H.J. Effects of ethanol extract of onion on the lipid profiles in patients with hypercholesterolemia. J. Nutr. Health 2007, 40, 242–248. [Google Scholar]
  2. Kim, J.Y.; Seo, Y.J.; Noh, S.K.; Cha, Y.J. Concentrated onion extract lowers serum lipid levels in rats fed a high-fat diet. Korean J. Food Preserv. 2010, 17, 398–404. [Google Scholar]
  3. Khosa, J.S.; McCallum, J.; Dhatt, A.S.; Macknight, R.C. Enhancing onion breeding using molecular tools. Plant. Breed. 2016, 135, 9–20. [Google Scholar] [CrossRef]
  4. Jo, J.; Purushotham, P.M.; Han, K.; Lee, H.R.; Nah, G.; Kang, B.C. Development of a genetic map for onion (Allium cepa L.) using reference-free genotyping-by-sequencing and SNP assays. Front. Plant. Sci. 2017, 8, 1606. [Google Scholar]
  5. Havey, M.J. Onion Breeding. In Plant Breeding Review; Wiley: New Jersey, NJ, USA, 2018; Volume 42, pp. 39–85. [Google Scholar]
  6. Chilvers, M.I.; du Toit, L.J. Detection and identification of Botrytis species associated with neck rot, scape blight, and umbel blight of onion. Plant. Health Prog. 2006, 7, 38. [Google Scholar] [CrossRef] [Green Version]
  7. Williamson, B.; Tudzynski, B.; Tudzynski, P.; van Kan, J.A.L. Botrytis cinerea: The cause of grey mould disease. Mol. Plant. Pathol. 2007, 8, 561–580. [Google Scholar] [CrossRef] [PubMed]
  8. Choquer, M.; Fournier, E.; Kunz, C.; Levis, C.; Pradier, J.M.; Simon, A.; Viaud, M. Botrytis cinerea virulence factors: New insights into a necrotrophic and polyphageous pathogen. FEMS Microbiol. Lett. 2007, 277, 1–10. [Google Scholar] [CrossRef] [Green Version]
  9. Carisse, O.; Tremblay, D.M.; McDonald, M.R.; Brodeur, L.; McRoberts, N. Management of botrytis leaf blight of onion: The Québec experience of 20 years of continual improvement. Plant. Dis. 2001, 95, 504–514. [Google Scholar] [CrossRef] [PubMed]
  10. Abbey, J.A.; Percival, D.; Abbey, L.; Asiedu, S.K.; Prithiviraj, B.; Schilder, A. Biofungicides as alternative to synthetic fungicide control of grey mould (Botrytis cinerea)—prospects and challenges. Biocontrol. Sci. Technol. 2018, 29, 207–228. [Google Scholar] [CrossRef]
  11. Howell, G.S. Sustainable grape productivity and the growth-yield relationship: A review. Am. J. Enol. Vitic. 2001, 52, 165–174. [Google Scholar]
  12. Tripathi, P.; Dubey, N.K.; Shukla, A.K. Use of some essential oils as post-harvest botanical fungicides in the management of grey mould of grapes caused by Botrytis cinerea. World J. Microbiol. Biotechnol. 2008, 24, 39–46. [Google Scholar] [CrossRef]
  13. Fan, F.; Hamada, M.S.; Li, N.; Li, G.Q.; Luo, C.X. Multiple fungicide resistance in Botrytis cinerea from greenhouse strawberries in Hubei province, China. Plant. Dis. 2017, 101, 601–606. [Google Scholar] [CrossRef] [Green Version]
  14. Rupp, S.; Weber, R.W.S.; Rieger, D.; Detzel, P.; Hahn, M. Spread of Botrytis cinerea strains with multiple fungicide resistance in German horticulture. Front. Microbiol. 2017, 7, 2075. [Google Scholar] [CrossRef] [Green Version]
  15. Maniruzzaman, M.; Haque, M.E.; Haque, M.M.; Sayem, M.A.; Al-Amin, M. Molecular characterization of onion (Allium cepa) using RAPD markers. Bangladesh J. Agric. Res. 2010, 35, 313–322. [Google Scholar]
  16. Sudha, G.S.; Ramesh, P.; Sekhar, A.C.; Krishna, T.S.; Bramhachari, P.V.; Riazunnisa, K. Genetic diversity analysis of selected onion (Allium cepa L.) germplasm using specific RAPD and ISSR polymorphism markers. Biocatal. Agric. Biotechnol. 2019, 17, 110–118. [Google Scholar] [CrossRef]
  17. Wang, Z.; Gerstein, M.; Snyder, M. RNA-Seq: A revolutionary tool for transcriptomics. Nat. Rev. Genet. 2009, 10, 57–63. [Google Scholar] [CrossRef] [PubMed]
  18. Han, J.; Thamllarasan, S.K.; Natarajan, S.; Park, J.I.; Chung, M.Y.; Nou, I.S. De novo assembly and transcriptome analysis of bulb onion (Allium cepa L.) during cold acclimation using contrasting genotypes. PLoS ONE 2016, 11, e0161987. [Google Scholar] [CrossRef]
  19. Graham, R.; Liew, M.; Meadows, C.; Lyon, E.; Wittwer, C.T. Distinguishing different DNA Heterozygotes by high-resolution melting. Clin. Chem. 2005, 51, 1295–1298. [Google Scholar] [CrossRef] [PubMed] [Green Version]
  20. Reed, G.H.; Kent, J.O.; Wittwer, C.T. High-resolution DNA melting analysis for simple and efficient molecular diagnostics. Pharmacogenomics 2007, 8, 597–608. [Google Scholar] [CrossRef] [Green Version]
  21. Doyle, J.J.; Doyle, J.L. Isolation of plant DNA from fresh tissue. Focus 1990, 12, 13–15. [Google Scholar]
  22. Sokal, R.R.; Michener, C.D. A statistical method for evaluation systematic relationships. Univ. Kans. Sci. Bull. 1958, 28, 1409–1438. [Google Scholar]
  23. Jaccard, P. Étude comparative de la distribution florale dans une portion des Alpes et des Jura. Bull. Soc. Vaud. Sci. Nat. 1901, 37, 547–579. [Google Scholar]
  24. Wang, L.; Feng, Z.; Wang, X.; Wang, X.; Zhang, X. DEGseq: An R package for identifying differentially expressed genes from RNA-seq data. Bioinformatics 2010, 26, 136–138. [Google Scholar] [CrossRef]
  25. Welsh, J.; McClelland, M. Fingerprinting genomes using PCR with arbitrary primers. Nucleic. Acids Res. 1990, 18, 7213–7218. [Google Scholar] [CrossRef] [Green Version]
  26. Williams, J.G.K.; Kubelik, A.R.; Livak, K.J.; Rafalski, J.A.; Tingey, S.V. DNA polymorphisms amplified by arbitrary primers are useful as genetic markers. Nucleic. Acids Res. 1990, 18, 6531–6535. [Google Scholar] [CrossRef] [Green Version]
  27. Sidiq, Y.; Subiastuti, A.S.; Wibowo, W.A.; Daryono, B.S. Development of SCAR marker linked to begomovirus resistance in melon (Cucumis melo L.). Jordan J. Biol. Sci. 2020, 13, 145–151. [Google Scholar]
  28. Baite, M.S.; Upadhyay, B.K.; Dube, S.C. Development of a sequence-characterized amplified region marker for detection of Ascochyta rabiei causing Ascochyta blight in chickpea. Folia Microbiol. 2020, 65, 103–108. [Google Scholar] [CrossRef] [PubMed]
  29. Mei, Z.; Khan, M.A. Genetic authentication of Eclipta prostrate (Asteraceae) from Penthorum chinense (Penthoraceae) by sequence characterized amplified region (SCAR) markers. Rev. Biol. Trop. 2020, 68, 180–188. [Google Scholar] [CrossRef] [Green Version]
  30. Yang, Y.Y.; Huo, Y.M.; Miao, J.; Liu, B.J.; Kong, S.P.; Gao, L.M.; Liu, C.; Wang, Z.B.; Tahara, Y.; Kitano, H.; et al. Identification of two SCAR markers co-segregated with the dominant Ms and recessive ms alleles in onion (Allium cepa L.). Euphytica 2013, 190, 267–277. [Google Scholar] [CrossRef]
  31. Kim, G.H.; Yun, H.K.; Choi, C.S.; Park, J.H.; Jung, Y.J.; Park, K.S.; Dane, F.; Kang, K.K. Identification of AFLP and RAPD markers linked to anthracnose resistance in grapes and their conversion to SCAR markers. Plant. Breed. 2008, 127, 418–423. [Google Scholar] [CrossRef]
  32. Chowdhury, M.A.; Andrahennadi, C.P.; Slinkard, A.E.; Vandenberg, A. RAPD and SCAR markers for resistance to acochyta blight in lentil. Euphytica 2001, 118, 331–337. [Google Scholar] [CrossRef]
  33. Hunt, M.D.; Ryals, J.A.; Reinhardt, D. Systemic acquired resistance signal transduction. Crit. Rev. Plant. Sci. 1996, 15, 583–606. [Google Scholar] [CrossRef]
  34. Durrant, W.E.; Dong, X. Systemic acquired resistance. Annu. Rev. Phytopathol. 2004, 42, 185–209. [Google Scholar] [CrossRef] [PubMed]
  35. Ward, E.R.; Uknes, S.J.; Williams, S.C.; Dincher, S.S.; Wiederhold, D.L.; Alexander, D.C.; Aphl-Goy, P.; Metraux, J.P.; Ryals, J.A. Coordinate gene activity in response to agents that induce systemic acquired resistance. Plant. Cell 1991, 3, 1085–1094. [Google Scholar] [CrossRef] [PubMed]
  36. Sticher, L.; Mauch-Mani, B.; Métraux, A.J. Systemic acquired resistance. Annu. Rev. Phytopathol. 1997, 35, 235–270. [Google Scholar] [CrossRef] [PubMed]
  37. Mauch-Mani, B.; Métraux, J.P. Salicylic acid and systemic acquired resistance to pathogen attack. Ann. Bot. 1998, 82, 535–540. [Google Scholar] [CrossRef] [Green Version]
  38. Frías, M.; Brito, N.; González, C. The Botrytis cinerea cerato-platanin BcSpl1 is a potent inducer of systemic acquired resistance (SAR) in tobacco and generates a wave of salicylic acid expanding from the site of application. Mol. Plant. Pathol. 2013, 14, 191–196. [Google Scholar] [CrossRef] [PubMed]
  39. Windram, O.; Madhou, P.; McHattie, S.; Hill, C.; Hickman, R.; Cooke, E.; Jenkins, D.J.; Penfold, C.A.; Baxter, L.; Breeze, E.; et al. Arabidopsis defense against Botrytis cinerea: Chronology and regulation deciphered by high-resolution temporal transcriptomic analysis. Plant. Cell 2012, 24, 3530–3557. [Google Scholar] [CrossRef] [PubMed] [Green Version]
  40. Poland, C.A.; Duffin, R.; Kinloch, I.; Maynard, A.; Wallace, W.A.; Seaton, A.; Stone, V.; Brown, S.; MacNee, W.; Donaldson, K. Carbon nanotubes introduced into the abdominal cavity of mice show asbestos-like pathogenicity in a pilot study. Nat. Nanotechnol. 2008, 3, 423–428. [Google Scholar] [CrossRef] [PubMed]
  41. Turóczy, Z.; Kis, P.; Török, K.; Cserháti, M.; Lendvai, Á.; Dudits, D.; Horváth, G.V. Overproduction of a rice aldo-keto reductase increases oxidative and heat stress tolerance by malondialdehyde and methylglyoxal detoxification. Plant. Mol. Biol. 2011, 75, 399–412. [Google Scholar] [PubMed]
  42. Gullner, G.; Komives, T.; Király, L.; Schröder, P. Glutathione S-transferase enzymes in plant-pathogen interactions. Front. Plant Sci. 2018, 9, 1836. [Google Scholar] [CrossRef] [Green Version]
  43. Dean, J.D.; Goodwin, P.H.; Hsiang, T. Induction of glutathione S-transferase genes of Nicotiana benthamiana following infection by Colletotrichum destructivum and C. orbiculare and involvement of one in resistance. J. Exp. Bot. 2005, 56, 1525–1533. [Google Scholar] [CrossRef] [PubMed] [Green Version]
  44. Simpson, P.J.; Tantitadapitak, C.; Reed, A.M.; Mather, O.C.; Bunce, C.M.; White, S.A.; Ride, J.P. Characterization of two novel aldo—keto reductases from Arabidopsis: Expression patterns, broad substrate specificity, and an open active-site structure suggest a role in toxicant metabolism following stress. J. Mol. Biol. 2009, 392, 465–480. [Google Scholar] [CrossRef]
  45. Kanayama, Y.; Mizutani, R.; Yaguchi, S.; Hojo, A.; Ikeda, H.; Nishiyama, M.; Kanahama, K. Characterization of an uncharacterized aldo-keto reductase gene from peach and its role in abiotic stress tolerance. Phytochemistry 2014, 104, 30–36. [Google Scholar] [CrossRef] [PubMed]
  46. Sengupta, D.; Naik, D.; Reddy, A.R. Plant aldo-keto reductases (AKRs) as multi-tasking soldiers involved in diverse plant metabolic processes and stress defense: A structure-function update. J. Plant. Physiol. 2015, 179, 40–55. [Google Scholar] [CrossRef] [PubMed]
  47. Vemanna, R.S.; Vennapusa, A.R.; Easwaran, M.; Chandrashekar, B.K.; Rao, H.; Ghanti, K.; Sudhakar, C.; Mysore, K.S.; Makarla, U. Aldo-keto reductase enzymes detoxify glyphosate and improve herbicide resistance in plants. Plant. Biotechnol. J. 2017, 15, 794–804. [Google Scholar] [CrossRef]
  48. Wang, H.; He, Z.; Luo, L.; Zhao, X.; Lu, Z.; Luo, T.; Li, M.; Zhang, Y. An aldo-keto reductase, Bbakr1, is involved in stress response and detoxification of heavy metal chromium but not required for virulence in the insect fungal pathogen, Beauveria bassiana. Fungal Genet. Biol. 2018, 111, 7–15. [Google Scholar] [CrossRef]
Figure 1. Phylogenetic tree of the resistant and susceptible lines provided by ‘Seeds & People’ Co. by a RAPD analysis. The resistant lines S&P 7168 and S&P 7129 showed a close genetic relationship, and also, resistant lines S&P 7522 and S&P 7521 showed a close genetic relationship. The susceptible onion lines S&P 7175, S&P 7130, and S&P 7483 appeared to have a closer genetic relationship.
Horticulturae 07 00436 g001
Figure 2. The SCAR-OPAN-1 primer and sequence of a 2-Kb product amplified in four resistant lines by an OPAN-1 random primer. The SCAR-OPAN-1 primer contained the OPAN-1 random primer sequence. The sequence of the designed SCAR-OPAN-1 primer is shown in bold. The underlined sequence is the sequence of OPAN-1 random primer, 5′-ACT CCA CGT C-3′.
Horticulturae 07 00436 g002
Figure 3. Identification of resistant onion lines of ‘Seeds & People’ Co. and ‘Asia Seed’ Co. using the SCAR-OPAN1 marker. (A) The 2-Kb-sized polymorphic products were amplified in the resistant lines (S&P 7522, S&P 7521, S&P 7129, and S&P 7168) and were not amplified in the susceptible lines (S&P 7483, S&P 7130, and S&P 7175). M: 100-bp DNA ladder marker, Lane 1: S&P 7522, Lane 2: S&P 7521, Lane 3: S&P 7129, Lane 4: S&P 7168, Lane 5: S&P 7483, Lane 6: S&P 7130, and Lane 7: S&P 7175. (B) The 2-Kb products were amplified only in the resistant lines (Asia-12, Asia-42, and Asia-53) and were not amplified in the susceptible lines (Asia-30, Asia-35, Asia-45, and Asia-50). M: 100-bp DNA ladder marker, Lane 1: Asia-12, Lane 2: Asia-42, Lane 3: Asia-53, Lane 4: Asia-30, Lane 5: Asia-35, Lane 6: Asia-45, and Lane 7: Asia-50.
Horticulturae 07 00436 g003aHorticulturae 07 00436 g003b
Figure 4. The heatmap constructed using z-scores to analyze the differences of expression in each line by using a group of significantly expressed genes.
Horticulturae 07 00436 g004
Figure 5. SNPs and amino acid sequences targeted by the HRM primers in the resistant and susceptible lines. The SNPs targeted by HRM primers are shown in green. The synonymous mutations are shown in blue, and the nonsynonymous mutations between the resistant and susceptible groups are shown in red.
Horticulturae 07 00436 g005aHorticulturae 07 00436 g005b
Figure 6. Sequences of the products amplified with the SNP-3 HRM primer in four resistant and three susceptible onion lines. Two SNPs were identified within the sequence. One SNP showed the ‘T’ allele in the resistant lines and the ‘C’ allele in the susceptible lines, while the other SNP showed the ‘C’ allele in the resistant lines and the ‘G’ allele in the susceptible ones. The forward (F) and reverse (R) primers for the SNP-3 HRM marker are underlined with the arrow.
Horticulturae 07 00436 g006
Figure 7. HRM analysis of the ‘Seeds & People’ Co. and ‘Asia Seed’ Co. onion lines. (A) HRM curve of the ‘Seeds & People’ Co. onion lines. Red: resistant lines (S&P 7522, S&P 7521, S&P 7129, and S&P 7168) and blue: susceptible lines (S&P 7130, S&P 7175, and S&P 7483). (B) HRM curve of the ‘Asia Seed’ Co. onion lines. Red: resistant lines (Asia-12, Asia-42, and Asia-53) and, blue: susceptible lines (Asia-30, Asia-35, Asia-45, and Asia-50).
Horticulturae 07 00436 g007
Figure 8. The gene expression level of the aldo-keto reductase (ARK) gene in the seven onion lines using the SNP-3 primer by the qPCR analysis. Four resistant lines (S&P 7522, S&P 7521, S&P 7129, and S&P 7168) and three susceptible lines (S&P 7483, S&P 7130, and S&P 7175) were analyzed. The qPCR analysis was performed in six replicates, and the standard errors are indicated as bars. Means with the same letter on the bar were not significantly different according to Duncan’s multiple comparison test.
Horticulturae 07 00436 g008
Table 1. HRM primers designed from 14 selected transcripts with SNPs that exist between the resistant and susceptible lines.
No.SNP NamePrimer NameSequence (5′→3′)TmPCR Product Size
1SNP-1SNP 1 FCTTTGAACTTCGGGCAATACCCG60.5199 bp
SNP 1 RCCTCATCAGGCGAGTGAGTGGAC59.6
2SNP-2SNP 2 FAACGTCCGCCGAAGAAGCTGA60.7204 bp
SNP 2 RTTTGCTGGAGGAGGTGGTGGTG60.1
3SNP-3SNP 3 FCGTTAGCTCAAGTGGGTTTGAGGTG59.9134 bp
SNP 3 RTTCTTCCAGCTCTTCTTCGCT59.2
4SNP-4SNP 4 FAGGGTTCAGAACCAAAACAGCATCA59.8163 bp
SNP 4 RCGATGCTTTTTTGGTAACTGGGAAG59.1
5SNP-5SNP 5 FTCGATGGCATTAAGGATGCTAAGGA59.8163 bp
SNP 5 RATTGCCTTTGCTAGGGAGCCATAA59.1
6SNP-6SNP 6 FTGGTGACAAGAAATTCTTCAACGGC60.2158 bp
SNP 6 RTCTCCATGCATCTCTTTCCCCACT59.8
7SNP-7SNP 7 FTGAGCTCCTTTCAGACTCCTTTCCC60.1170 bp
SNP 7 RCGACCACCTTAACAGCTTGATCGTC59.9
8SNP-8SNP 8 FCTTTCTCAGGGTTAATAGAGGCGGG60.1171 bp
SNP 8 RGCCAAACTGGCTGAAAACCTTTTCT59.9
9SNP-9SNP 9 FTTCATGGTCACAGAAACGCCAAGA60.1181 bp
SNP 9 RGGCAGAACTTCTTTGTTCATCCGCT59.9
10SNP-10SNP 10 FAATCTCACAATCGAACCTCACTGCC59.4175 bp
SNP 10 RTGCGAGGTGAATTCCAGTCAAAGAG60.4
11SNP-11SNP 11 FGCAACAAGGGCTGCAAATTACAGTT60.1169 bp
SNP 11 RGTTTGTGTGCATGAATCTGTGCAGG59.9
12SNP-12SNP 12 FCGACTATGGCTGGGACACTGCA59.6164 bp
SNP 12 RTCCCCGAACTTGACCCCGTTAC60.7
13SNP-13SNP 13 FAGCAATGTTGTCCGGTACTCCAAAG59.4185 bp
SNP 13 RCGCTCAAAAACCCAGCTCGTACA60.1
14SNP-14SNP 14 FTATCGTACCTTCCTACCCTGAGCGA60.1182 bp
SNP 14 RTCCGAACATGGGCAGCTTCC59.9
Table 2. Gene functions of 14 selected transcripts with SNPs that exist between the resistant and susceptible lines.
NoTranscripts NoTAIR ID zGene Function
1SNP-1 transcriptAT1G17420Lipoxygenase 3
2SNP-2 transcriptAT1G42970Glyceraldehyde-3-phosphate dehydrogenase B subunit
3SNP-3 transcriptAT1G59960Aldo/keto reductase
4SNP-4 transcriptAT1G67090Ribulose bisphosphate carboxylase small chain 1A
5SNP-5 transcriptAT1G68090Annexin Arabidopsis thaliana 5
6SNP-6 transcriptAT1G78380Glutathione S-transferase
7SNP-7 transcriptAT3G16640Translationally controlled tumor protein
8SNP-8 transcriptAT4G39260Glycine-rich protein
9SNP-9 transcriptAT5G13750Zinc induced facilitator-like 1
10SNP-10 transcriptAT5G52810Systemic acquired resistance
11SNP-11 transcriptAT1G14290Sphingoid base hydroxylase2
12SNP-12 transcriptAT1G29930Chlorophyll A/B protein
13SNP-13 transcriptAT5G25220KNAT3
14SNP-14 transcriptAT5G38430Rubisco small subunit 1B
z The Arabidopsis Information Resource ID.
Table 3. HRM analysis with the SNP-3 primers and statistically grouped by using ANOVA.
(A) HRM analysis results of the ‘Seeds & People’ Co. onion lines.
HRM Marker Line LS Means Group *
SNP-3S&P 752279.642A
S&P 752179.768A
S&P 712979.782A
S&P 716879.838A
S&P 748380.388 B
S&P 713080.353 B
S&P 717580.472 B
(B) HRM analysis results of the ‘Asia seed’ Co. onion lines.
HRM Marker Line LS Means Group *
SNP-3Asia-1282.183A
Asia-5382.217A
Asia-4882.253A
Asia-5082.473 B
Asia-3582.500 B
Asia-4582.527 B
Asia-3082.550 B
* In each column, means with the same letter are not significantly different.
Publisher’s Note: MDPI stays neutral with regard to jurisdictional claims in published maps and institutional affiliations.

