
Drone Noise Emission Characteristics and Noise Effects on Humans—A Systematic Review


Abstract
:1. Introduction
2. Systematic Review of Studies on Noise Emission Characteristics: Methodology
2.1. Research Question and Study Selection Criteria
Which experimental methods can be used to measure the acoustic emissions of drones and convert them into an empirical model, and which emission data are already known and documented?
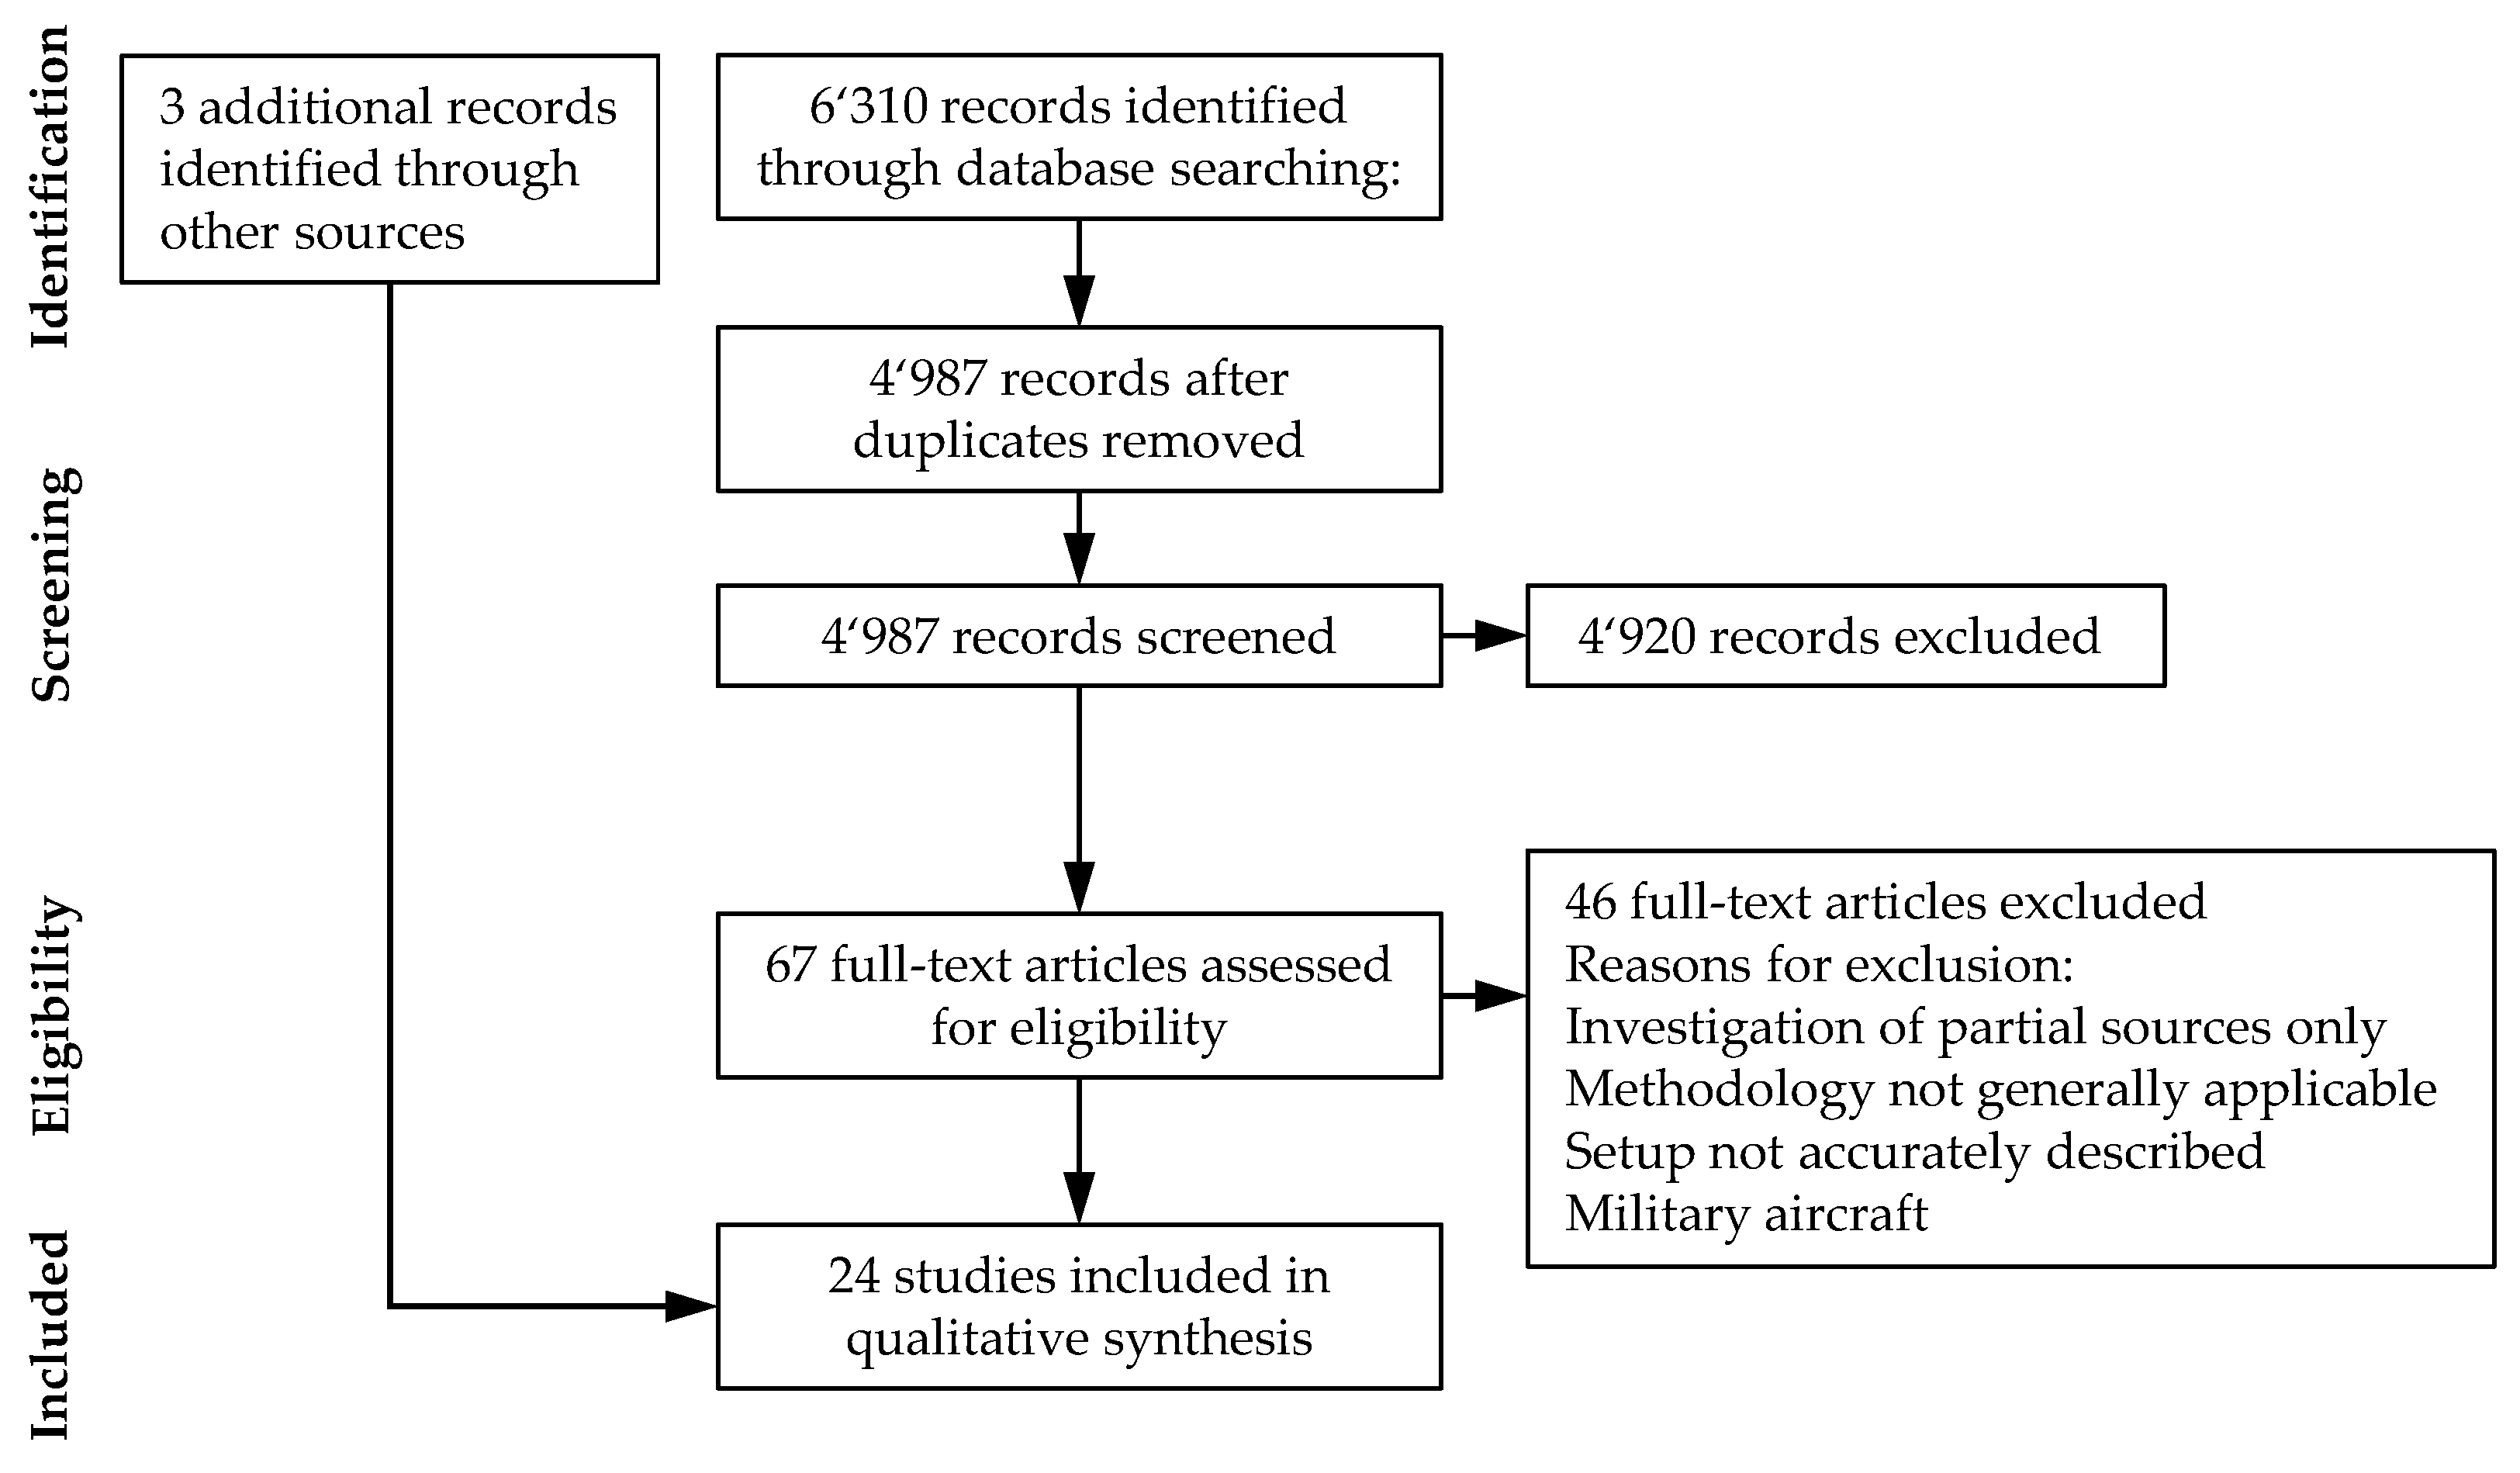
2.2. Formalism of the Database Search
(“drone*” OR “quadcopter” OR “multirotor” OR “multicopter” OR “UAV” OR “UAS” OR “unmanned air*” OR “unmanned aer*”) AND (“acoustic” OR “sound” OR “noise” OR “auralization*”)
- Web of Science (via EndNote): 1891
- Scopus: 3594
- ScienceDirect: 193
- Ingenta-Connect: 151
- Google Scholar: 481
2.3. Title–Abstract and Full-Text Screening of the Database Search
- Refer to a partial aspect of the sound generation (e.g., blade investigation) and not to the drone system as a whole;
- Have nothing to do with the acoustic emission of drones (e.g., when the term “noise” refers to noise in a signal or when the drone is used as a tool to investigate some other aspect);
- Refer to drone noise captured by microphones flying with the drone;
- Deal with the localization or identification of drones by means of microphone arrays without being directly related to the determination of emission data;
- Investigate the noise reduction of drones; or
- Use the term “drone” in a different context.
2.4. Other Sources
2.5. Summary of the Literature Search
2.6. Data Extraction
3. Systematic Review of Studies on Drone Noise Effects on Humans: Methodology
3.1. General Approach and Methodology
3.2. Research Question and Study Selection Criteria
Are individuals exposed to environmental drone noise at an increased risk of noise annoyance and/or acquiring other non-auditory health effects?
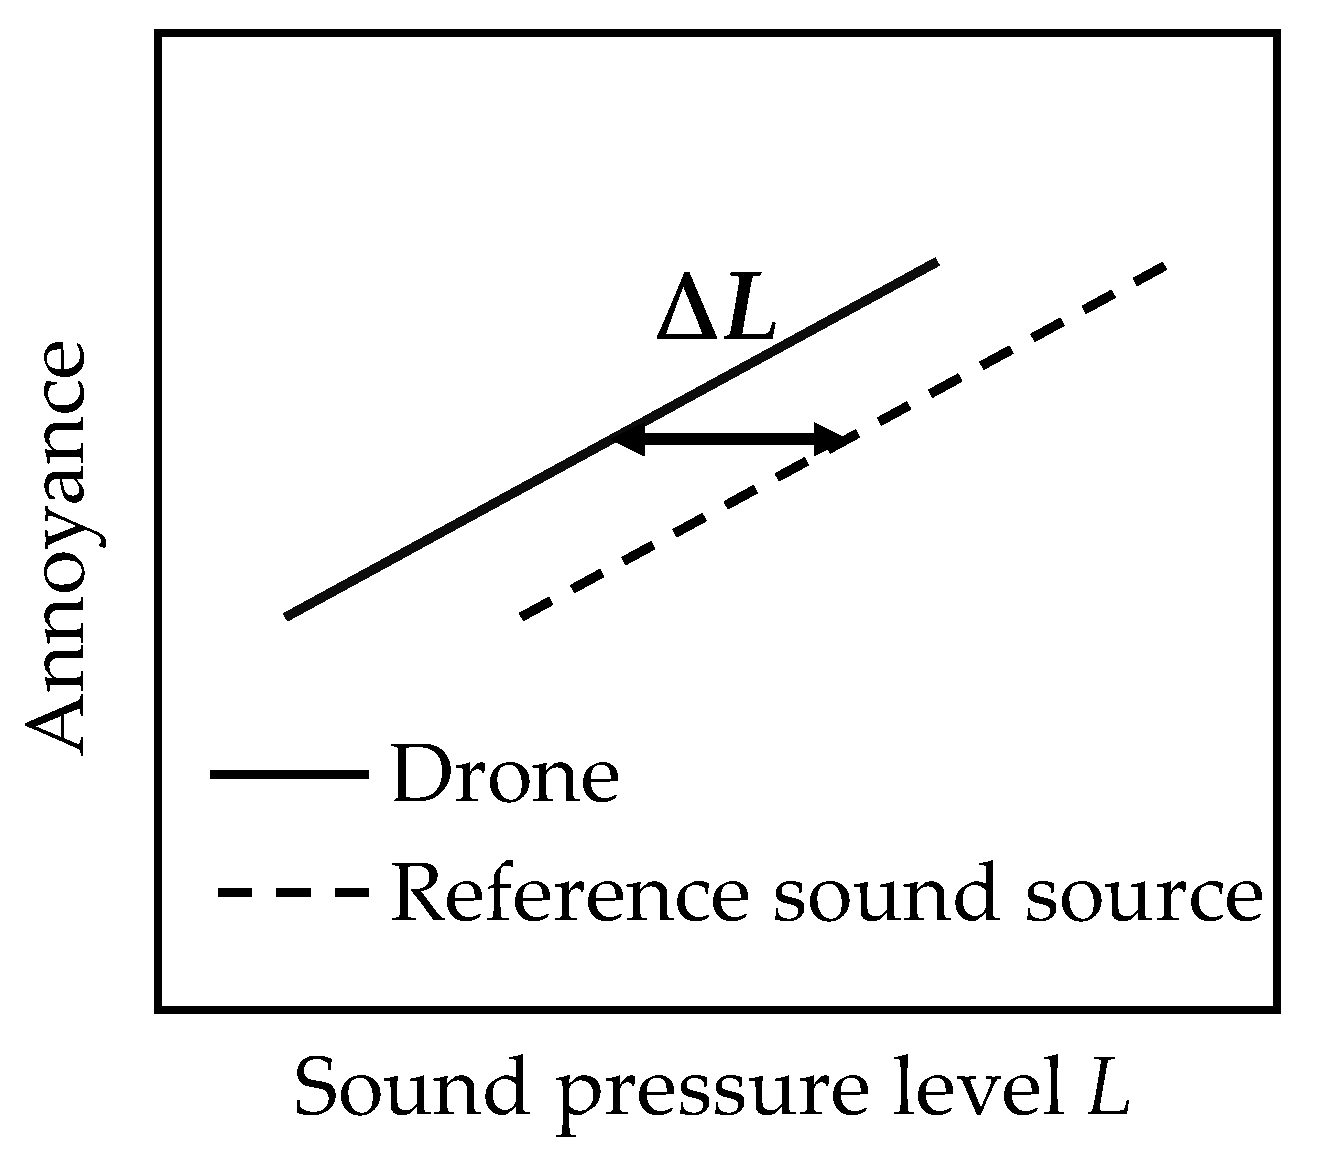
May level corrections be identified to account for stronger noise effects compared to reference noise sources such as road traffic?
Which acoustic metrics or psychoacoustic parameters are particularly suitable to predict the noise effects of drones?
Do the non-acoustic moderators visual–acoustic interactions and context (or acceptance) affect noise effects of drones?
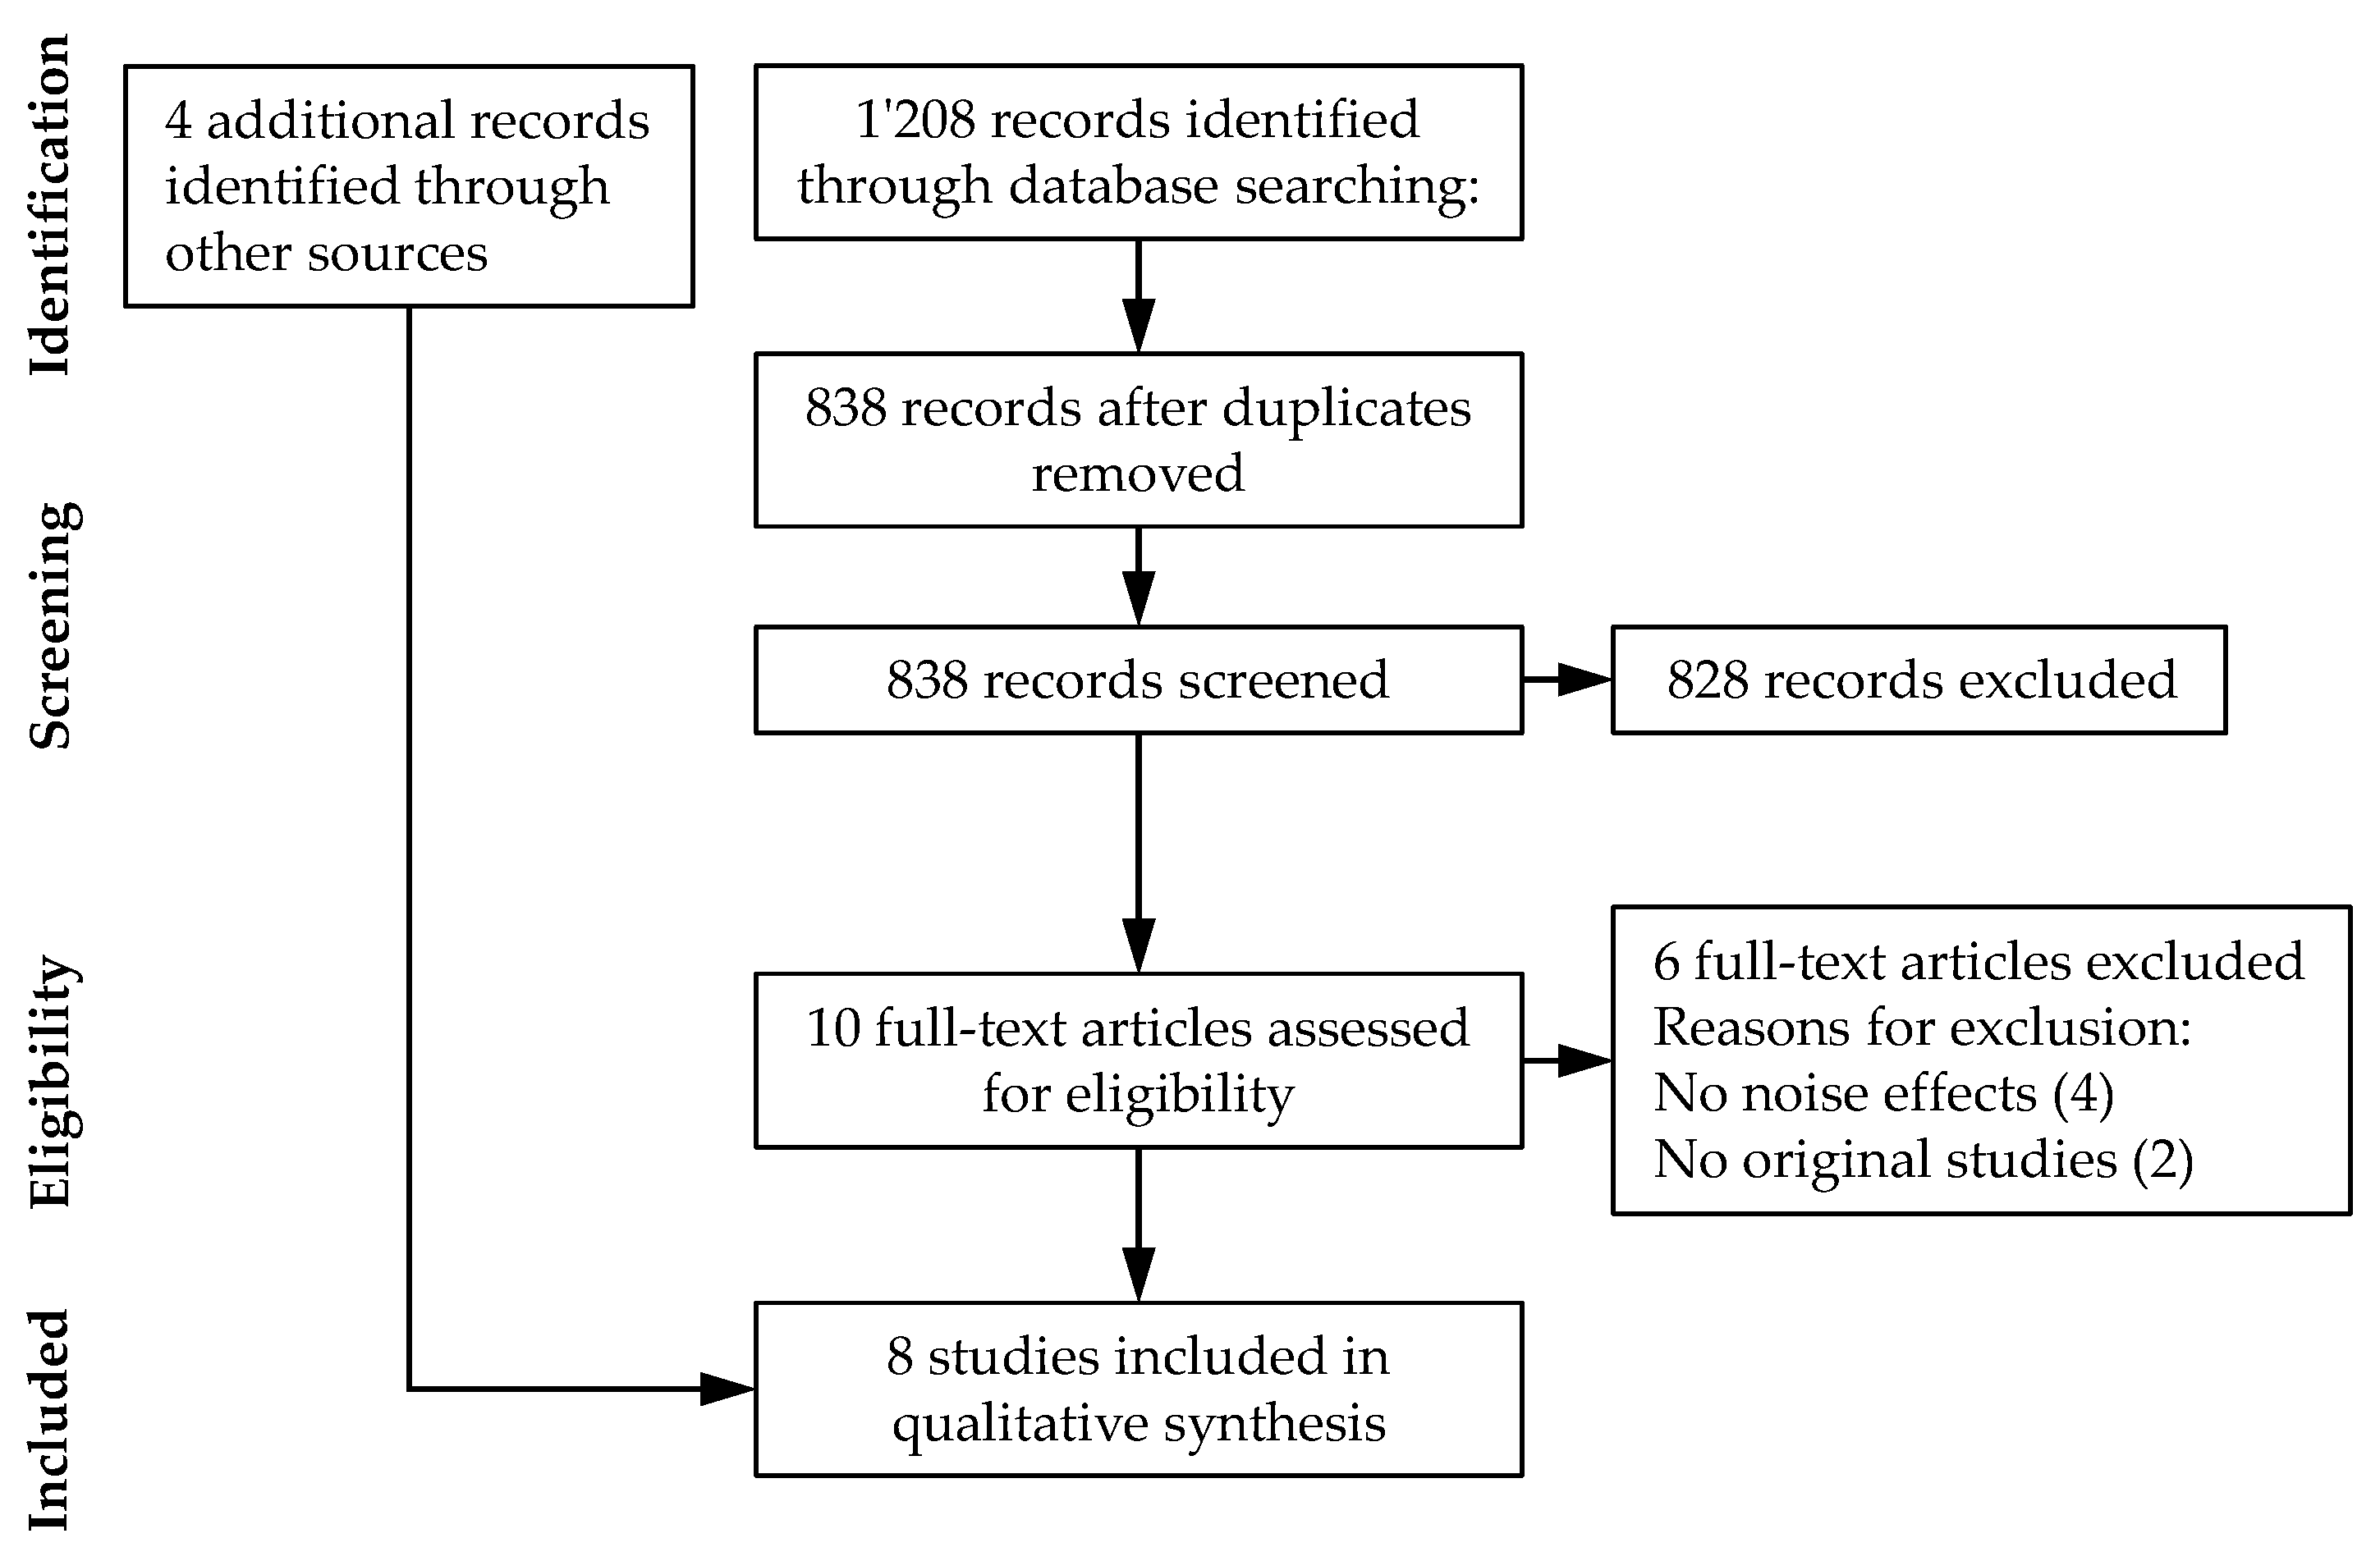
3.3. Formalism of the Database Search
(“drone*” OR “quadcopter” OR “multirotor” OR “multicopter” OR “UAV” OR “UAS” OR “RPA” OR “unmanned air*” OR “unmanned aer*”) AND (“acoust*” OR “sound” OR “noise” OR “psychoac*” OR “loud*” OR “sharp*” OR” rough*” OR “tonal*” OR “tone*”) AND (“annoy*” OR “disturb*” OR “affective” OR “psychol*” OR “stress” OR “risk” OR “health”)
- Web of Science: 350;
- Scopus (incl. Embase): 669;
- MEDLINE (via PubMed): 48;
- PsycInfo (via ProQuest): 113;
- Ingenta-Connect: 24;
- Psyndex (via PubPsych): 0;
- Google Scholar: 3;
- Conferences: 1.
3.4. Title–Abstract and Full-Text Screening of the Database Search
3.5. Other Sources
3.6. Summary of the Literature Search
3.7. Data Extraction and Quality Rating of Studies
4. Drone Noise Emission Characteristics: Results
4.1. Measurement Methods for Noise Emissions of Drones
4.1.1. Standard Sound Pressure Laboratory Measurements
4.1.2. Special Laboratory Measurements
4.1.3. Field Measurements
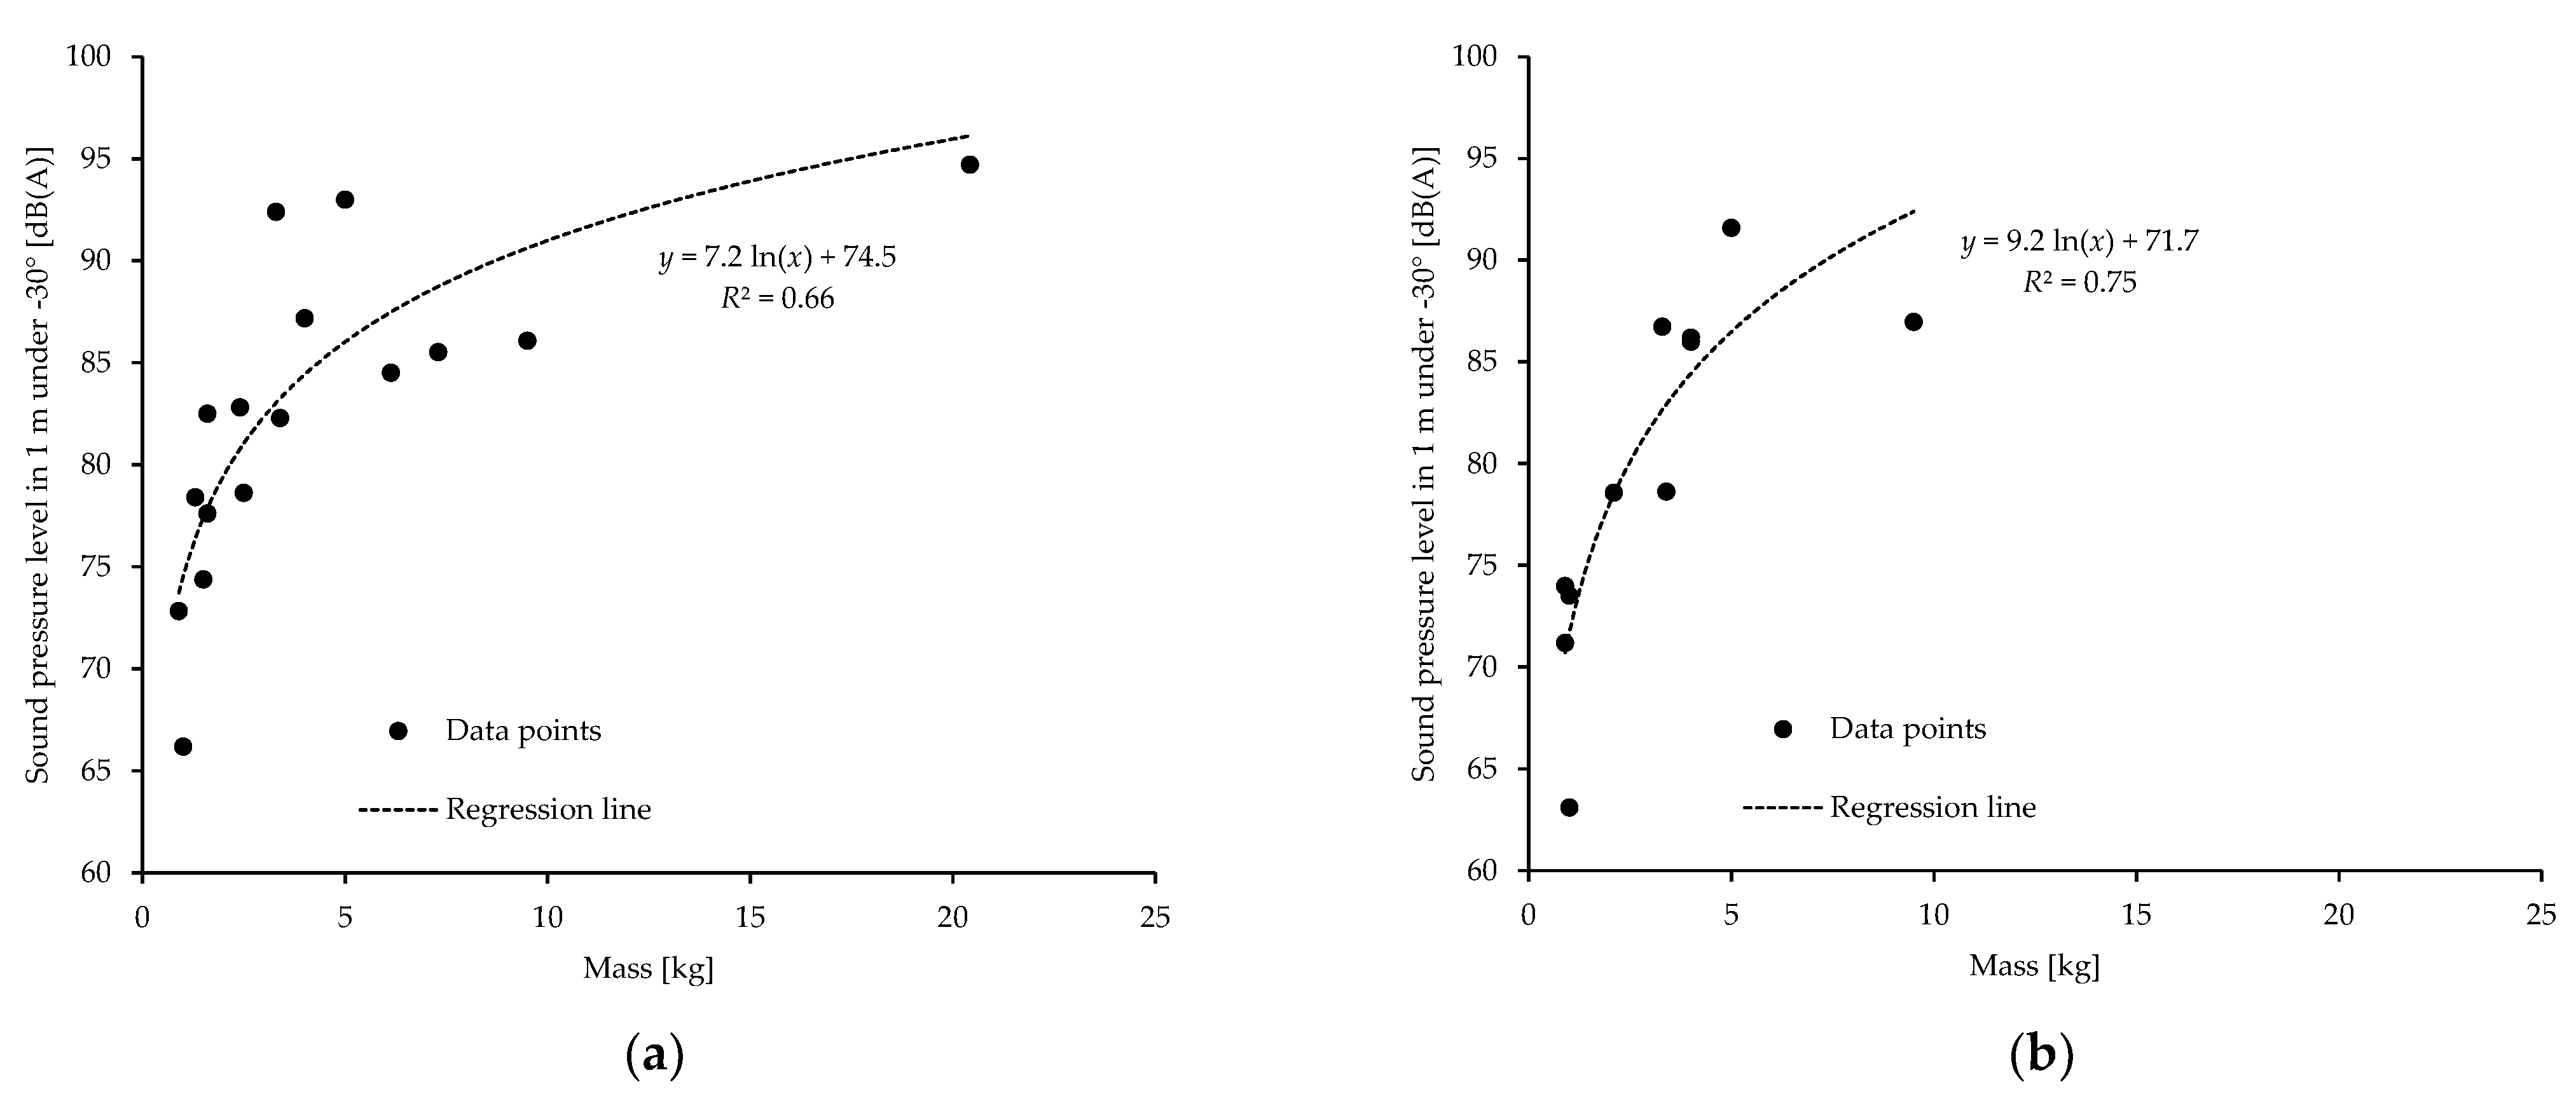
4.2. Noise Emission Levels of Drones
- Translation dB(Z) into dB(A): For a typical drone emission spectrum, the two sum levels differ only slightly, so where necessary they were set equal.
- Geometrical spreading: Point source far-field behavior in the form −20log(d).
- For a pressure zone microphone mounting on a ground plate, a sound pressure doubling or level increase by 6 dB is assumed with respect to free field.
- The drone is assumed to emit 3 dB more in the A-weighted level vertically downwards than at −30° [27].
- The emission level is estimated from the sound power level by: Lp,A,1m,−30° = LW,A − 11 dB.
- The amplification effect of the ground for a microphone at a height of 1.0 to 1.2 m is assumed to be 1 dB(A) above grassland and 3 dB(A) above hard ground.
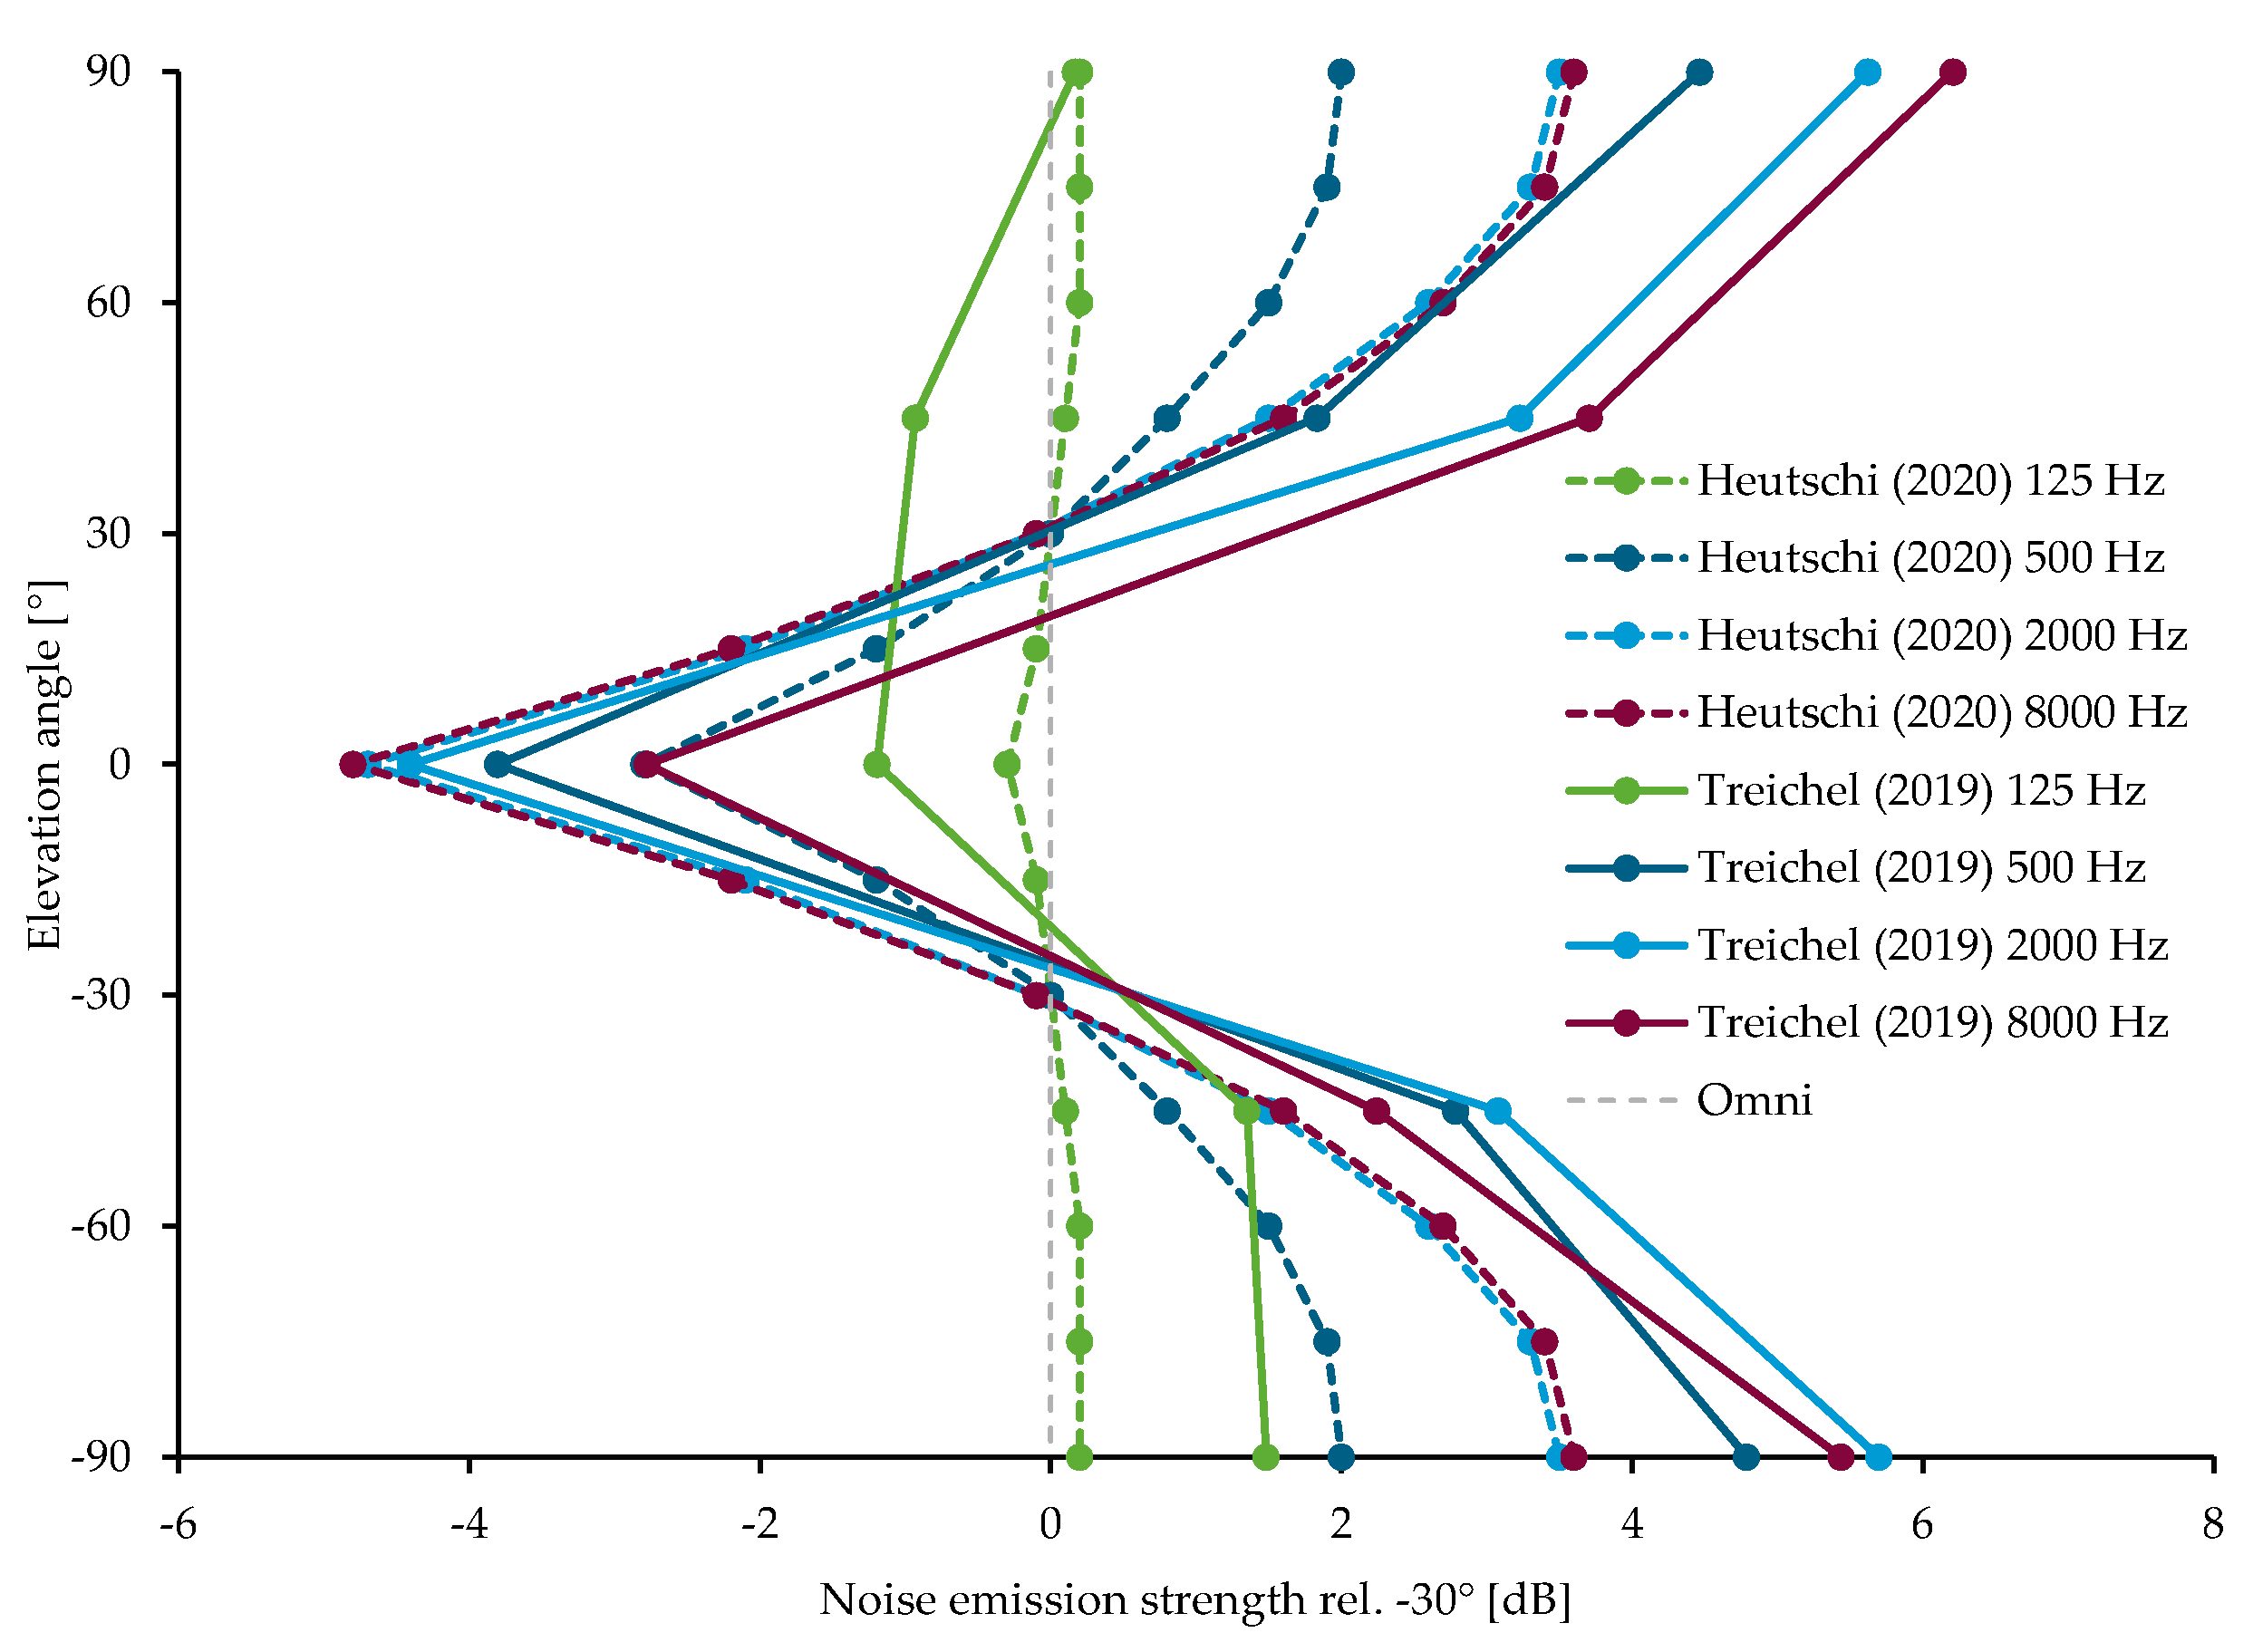
4.3. Vertical Source Directivity
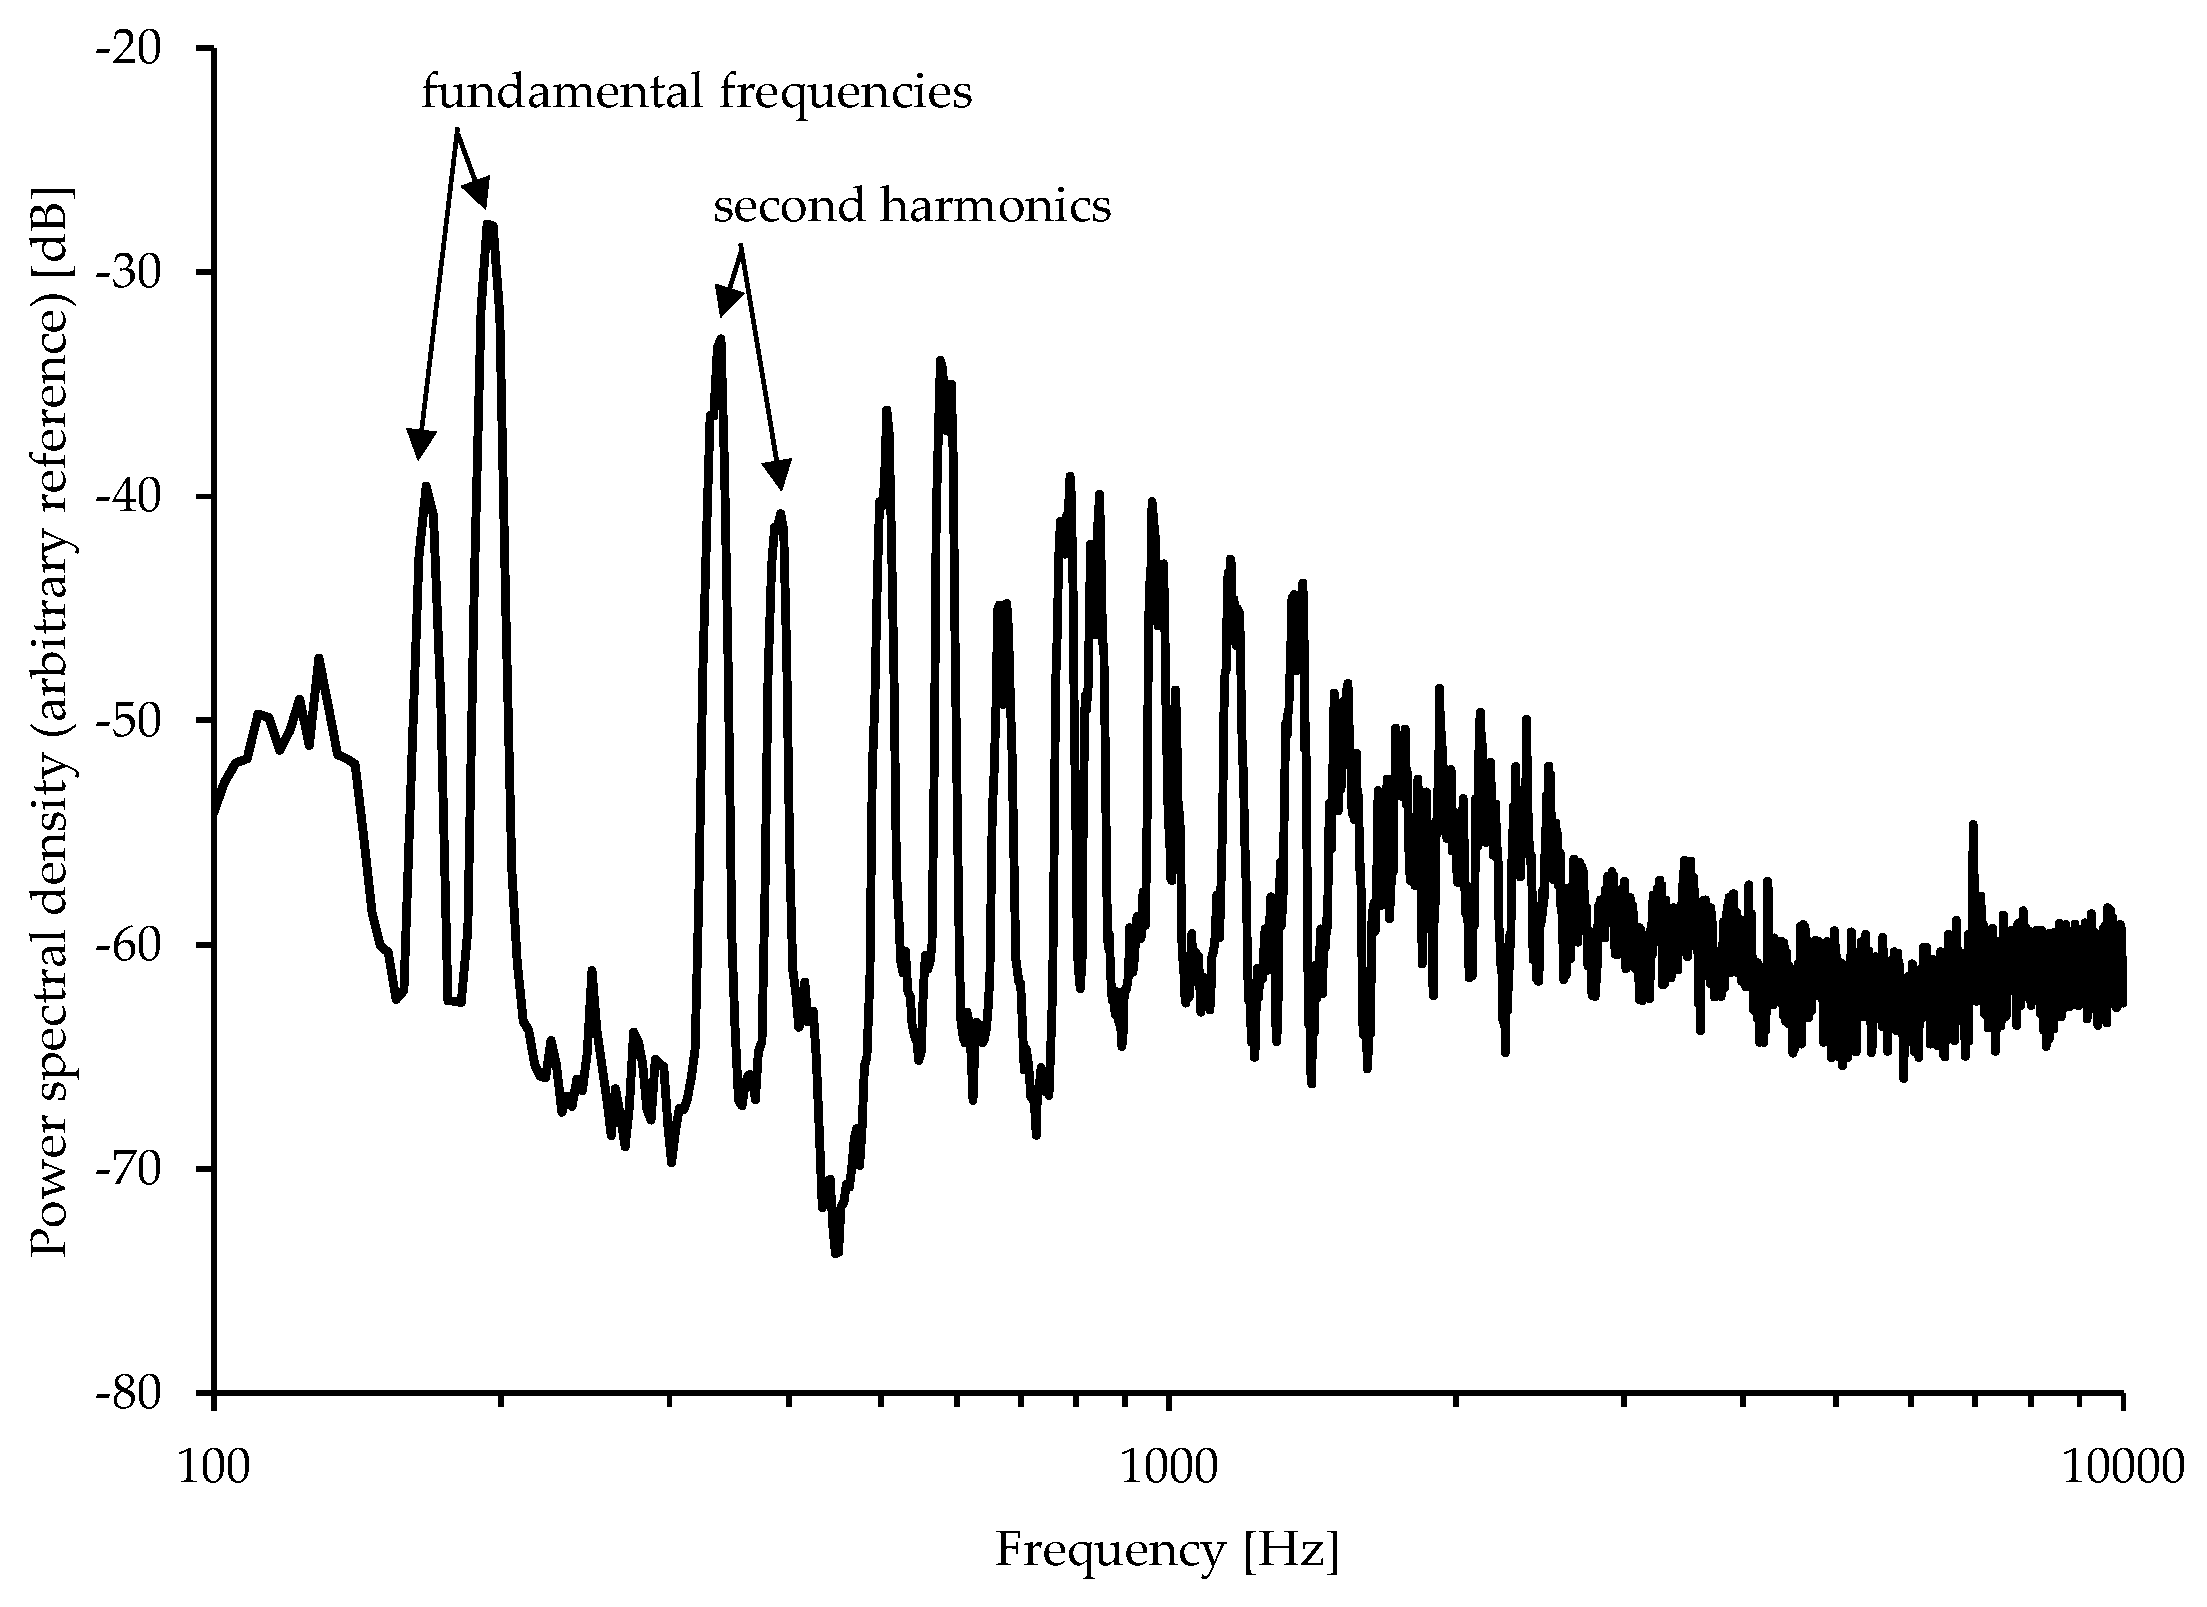
4.4. Excursus: Spectral Noise Emission Characteristics of Drones
5. Drone Noise Effects on Humans: Results
5.1. Drone Noise Annoyance
5.2. Effect of Design and Operation of Drones on Noise Annoyance
5.3. Further Health Outcomes
6. Discussion
6.1. Drone Noise Emission Characteristics
6.1.1. Current Measurement Methods
6.1.2. Noise Emission Characteristics
6.1.3. Emission Model and Data Acquisition: A Proposition
6.2. Drone Noise Effects on Humans
6.2.1. Noise Effects and Implications
6.2.2. Limitations of the Studies of the Systematic Review
6.2.3. Knowledge Gaps and Future Research
6.3. Bringing Both Reviews Together: A Step towards Strategic Noise Mapping?
7. Conclusions
Author Contributions
Funding
Institutional Review Board Statement
Informed Consent Statement
Data Availability Statement
Acknowledgments
Conflicts of Interest
References
- Aydin, B. Public acceptance of drones: Knowledge, attitudes, and practice. Technol. Soc. 2019, 59, 101180. [Google Scholar] [CrossRef]
- FAA. FAA Aerospace Forecast, Fiscal Years 2019–2039; Federal Aviation Administration: Washington, DC, USA, 2020; p. 105. Available online: https://www.faa.gov/data_research/aviation/aerospace_forecasts (accessed on 29 May 2021).
- ANSI. Standardization Roadmap for Unmanned Aircraft Systems, Version 2.0., Prepared by the ANSI Unmanned Aircraft Systems Standardization Collaborative (UASSC): June 2020; American National Standards Institute: New York, NY, USA, 2020; p. 410. Available online: https://www.ansi.org/standards-coordination/collaboratives-activities/unmanned-aircraft-systems-collaborative (accessed on 29 May 2021).
- Eißfeldt, H.; Vogelpohl, V.; Stolz, M.; Papenfuß, A.; Biella, M.; Belz, J.; Kügler, D. The acceptance of civil drones in Germany. CEAS Aeronaut. J. 2020, 11, 665–676. [Google Scholar] [CrossRef] [Green Version]
- Christen, M.; Guillaume, M.; Jablonowski, M.; Lenhart, P.; Moll, K. Zivile Drohnen—Herausforderungen und Perspektiven; VDF Hochschulverlag AG an der ETH Zürich: Zürich, Schweiz, 2018; Available online: https://vdf.ch/zivile-drohnen-herausforderungen-und-perspektiven.html (accessed on 29 May 2021).
- International Transport Forum (ITF). Ready for Take Off? Integrating Drones into the Transport System; OECD Publishing: Paris, France, 2021; p. 96. Available online: https://www.itf-oecd.org/integrating-drones-transport-system (accessed on 29 May 2021).
- NASA. Urban Air Mobility Noise: Current Practice, Gaps, and Recommendations; National Aeronautics and Space Administration (NASA), Langley Research Center: Hampton, VA, USA, 2020; p. 49.
- Torija, A.; Clark, C.A. Psychoacoustic Approach to Building Knowledge about Human Response to Noise of Unmanned Aerial Vehicles. Int. J. Environ. Res. Public Health 2021, 18, 682. [Google Scholar] [CrossRef] [PubMed]
- Moher, D.; Liberati, A.; Tetzlaff, J.; Altman, D.G.; The PRISMA Group. Preferred reporting items for systematic reviews and meta-analyses: The PRISMA statement. PLoS Med. 2009, 6, e1000097. [Google Scholar] [CrossRef] [PubMed] [Green Version]
- Seidler, A.; Weihofen, V.M.; Wagner, M.; Swart, E.; Hegewald, J.; Euler, U.; Schmitt, J.; Zeeb, H. Systematic Review: Environmental Aircraft Noise and Non-Auditory Health Complaints and Diseases. PROSPERO 2013 CRD42013006004. 2013. Available online: https://www.crd.york.ac.uk/prospero/display_record.php?ID=CRD42013006004 (accessed on 29 May 2021).
- Weihofen, V.M.; Hegewald, J.; Euler, U.; Schlattmann, P.; Zeeb, H.; Seidler, A. Aircraft Noise and the Risk of Stroke A Systematic Review and Meta-analysis. Dtsch. Ärztebl. Int. 2019, 116, 237–244. [Google Scholar]
- Hegewald, J.; Schubert, M.; Freiberg, A.; Starke, K.R.; Augustin, F.; Riedel-Heller, S.G.; Zeeb, H.; Seidler, A. Traffic Noise and Mental Health: A Systematic Review and Meta-Analysis. Int. J. Environ. Res. Public Health 2020, 17, 6175. [Google Scholar] [CrossRef] [PubMed]
- Michaud, D.S.; Keith, S.E.; Feder, K.; Voicescu, S.A.; Marro, L.; Than, J.; Guay, M.; Bower, T.; Denning, A.; Lavigne, E.; et al. Personal and situational variables associated with wind turbine noise annoyance. J. Acoust. Soc. Am. 2016, 139, 1455–1466. [Google Scholar] [CrossRef] [PubMed] [Green Version]
- Schäffer, B.; Pieren, R.; Hayek, U.W.; Biver, N.; Grêt-Regamey, A. Influence of visibility of wind farms on noise annoyance—A laboratory experiment with audio-visual simulations. Landsc. Urban Plan. 2019, 186, 67–78. [Google Scholar] [CrossRef]
- Bajde, D.; Woermann, N.; Bruun, M.H.; Gahrn-Andersen, R.; Sommer, J.K.; Nøjgaard, M.; Christensen, S.H.; Kirschner, H.; Skaarup Jensen, R.H.; Bucher, J.H. Public Reactions to Drone Use in Residential and Public Areas; University of Southern Denmark: Odense, Denmark; Aalborg University: Aalborg, Denmark, 2017. [Google Scholar]
- Fastl, H.; Zwicker, E. Psychoacoustics: Facts and Models, 3rd ed.; Springer: Berlin/Heidelberg, Germany, 2007. [Google Scholar]
- Nordtest. Acoustics: Human Sound Perception—Guidelines for Listening Tests. Nordtest Method, NT ACOU 111; Nordtest: Espoo, Finland, 2002; p. 13. [Google Scholar]
- Ouzzani, M.; Hammady, H.; Fedorowicz, Z.; Elmagarmid, A. Rayyan—A web and mobile app for systematic reviews. Syst. Rev. 2016, 5, 210. [Google Scholar] [CrossRef] [Green Version]
- Alexander, W.N.; Whelchel, J. Flyover Noise of Multi-Rotor sUAS. In Proceedings of the Inter-Noise 2019, 48th International Congress and Exhibition on Noise Control Engineering, Madrid, Spain, 16–19 June 2019. [Google Scholar]
- Alexander, W.N.; Whelchel, J.; Intaratep, N.; Trani, A. Predicting Community Noise of sUAS. In Proceedings of the25th AIAA/CEAS Aeroacoustics Conference, Delft, The Netherlands, 20–23 May 2019; American Institute of Aeronautics and Astronautics (AIAA): Reson, VA, USA, 2019. [Google Scholar]
- Besnea, I. Acoustic Imaging and Spectral Analysis for Assessing UAV Noise. Master’s Thesis, Delft University of Technology, Delft, The Netherlands, 2020. [Google Scholar]
- Cabell, R.; Grosveld, F.; McSwain, R. Measured Noise from Small Unmanned Aerial Vehicles. In Proceedings of the Noise-Con, Providence, RI, USA, 13–15 June 2016; pp. 345–354. [Google Scholar]
- Cheng, G.; Herrin, D. Noise Level Prediction of a Small UAV Using Panel Contribution Analysis. In Proceedings of the Inter-Noise 2018, 47th International Congress and Exposition on Noise Control Engineering, Chicago, IL, USA, 26–29 August 2018; pp. 6084–6090. [Google Scholar]
- EU. Regulation 2019/945 on Unmanned Aircraft Systems and on Third-Country Operators of Unmanned Aircraft Systems; Official Journal of the European Union: Bruxelles, Belgium, 2019; Available online: https://eur-lex.europa.eu/legal-content/EN/TXT/?uri=CELEX:32019R0945 (accessed on 29 May 2021).
- Fattah, R.; Zhang, X.; Huang, X. Noise assessment of multi-rotor flying vehicles. In Proceedings of the 26th International Congress on Sound and Vibration, Montreal, QC, Canada, 7–11 July 2019. [Google Scholar]
- Herreman, K. Proposed measurement method for UAV sound levels. In Proceedings of the Noise-Con, Providence, RI, USA, 13–15 June 2016; pp. 15–622. [Google Scholar]
- Heutschi, K.; Ott, B.; Nussbaumer, T.; Wellig, P. Synthesis of real world drone signals based on lab recordings. Acta Acust. 2020, 4, 24. [Google Scholar] [CrossRef]
- Humphreys, W.M.; Lockard, D.P.; Khorrami, M.R.; Culliton, W.; McSwain, R.; Ravetta, P.A.; Johns, Z. Development and Calibration of a Field-Deployable Microphone Phased Array for Propulsion and Airframe Noise Flyover Measurements. In Proceedings of the 22nd AIAA/CEAS Aeroacoustics Conference, Lyon, France, 30 May–1 June 2016; American Institute of Aeronautics and Astronautics (AIAA): Reson, VA, USA, 2016. [Google Scholar]
- Intaratep, N.; Alexander, W.N.; Devenport, W.J.; Grace, S.M.; Dropkin, A. Experimental Study of Quadcopter Acoustics and Performance at Static Thrust Conditions. In Proceedings of the 22nd AIAA/CEAS Aeroacoustics Conference, Lyon, France, 30 May–1 June 2016; American Institute of Aeronautics and Astronautics (AIAA): Reson, VA, USA, 2016. [Google Scholar]
- Kloet, N.; Watkins, S.; Clothier, R. Acoustic signature measurement of small multi-rotor unmanned aircraft systems. Int. J. Micro Air Veh. 2017, 9, 3–14. [Google Scholar] [CrossRef]
- Klug, J.; Hollosi, D.; Volgenandt, A.; Rollwage, C.; Bitzer, J. Analyse Akustischer Emissionen und Profile ziviler Drohnen; Poster, 42. In Proceedings of the Jahrestagung für Akustik (DAGA), Aachen, Germany, 14–17 March 2016. [Google Scholar]
- Mobley, F. Aeroacoustic Emissions from Quadcopter Unmanned Aircraft Systems as Quadrupoles. In Proceedings of the Inter-Noise 2018, 47th International Congress and Exposition on Noise Control Engineering, Chicago, IL, USA, 26–29 August 2018; pp. 212–223. [Google Scholar]
- Papa, U.; Core, G.D.; Giordano, G. Determination of Sound Power Levels of a Small UAS during Flight Operations. In Proceedings of the Inter-Noise 2016, 45th International Congress and Exposition on Noise Control Engineering, Hamburg, Germany, 21–24 August 2016; pp. 692–702. [Google Scholar]
- Putzu, R.; Boulandet, R.; Rutschmann, B.; Bujard, T.; Noca, F.; Catry, G.; Bosson, N. Aeroacoustic Measurements on a Free-Flying Drone in a Windshaper Wind Tunnel. In Proceedings of the Quiet Drones 2020—International e-Symposium on Noise of UAV and UAS, Paris, France, 19–21 October 2020. [Google Scholar]
- Read, D.R.; Senzig, D.A.; Cutler, C.; Elmore, E.; He, H. Noise Measurement Report: Unconventional Aircraft—Choctaw Nation of Oklahoma; July 2019; Volpe National Transportation Systems Center: Cambridge, MA, USA, 2020. [Google Scholar]
- Senzig, D.; Marsan, M. UAS noise certification. In Proceedings of the Inter-Noise 2018, 47th International Congress and Exposition on Noise Control Engineering, Chicago, IL, USA, 26–29 August 2018; pp. 3718–3726. [Google Scholar]
- Senzig, D.A.; Marsan, M.; Cutler, C.J.; Read, D.R. Sound Exposure Level Duration Adjustments in UAS Rotorcraft Noise Certification Tests. Report DOT-VNTSC-FAA-18-07; John A Volpe National Transportation Systems Center: Cambridge, MA, USA, 2018. [Google Scholar]
- Tinney, C.E.; Sirohi, J. Multirotor Drone Noise at Static Thrust. AIAA J. 2018, 56, 2816–2826. [Google Scholar] [CrossRef]
- Treichl, J.; Körper, S. Untersuchung der Geräuschemission von Drohnen/Investigation of the noise emission of drones. Lärmbekämpfung 2019, 14, 108–114. [Google Scholar] [CrossRef]
- Zawodny, N.; Pettingill, N. Acoustic Wind Tunnel Measurements of a Quadcopter in Hover and Forward Flight Conditions. In Proceedings of the Inter-Noise 2018, 47th International Congress and Exposition on Noise Control Engineering, Chicago, IL, USA, 26–29 August 2018; pp. 487–500. [Google Scholar]
- Zhang, Y.; Lee, I.; Lin, D. Measurement of noise from a moving drone using a phased array microphone system. In Proceedings of the 2017 Asia-Pacific International Symposium on Aerospace Technology, Seoul, Korea, 16–18 October 2017. [Google Scholar]
- Zhou, T.; Jiang, H.; Sun, Y.; Fattah, R.J.; Zhang, X.; Huang, B.; Cheng, L. Acoustic Characteristics of a Quad-Copter under Realistic Flight Conditions. In Proceedings of the25th AIAA/CEAS Aeroacoustics Conference, Delft, The Netherlands, 20–23 May 2019; American Institute of Aeronautics and Astronautics (AIAA): Reson, VA, USA, 2019. [Google Scholar]
- Heutschi, K.; Ott, B.; Nussbaumer, T.; Wellig, P. Virtual microphone signals of flying drones. In Proceedings of the NATO STO MSG-SET-183 Specialists’ Meeting on Drone Detectability: Modelling the Relevant Signature, Wakefield, MA, USA, 27–29 April 2021. [Google Scholar]
- Torija, A.J.; Self, R.H.; Lawrence, J.L.T. Psychoacoustic Characterisation of a Small Fixed-Pitch Quadcopter. In Proceedings of the Inter-Noise 2019, 48th International Congress and Exhibition on Noise Control Engineering, Madrid, Spain, 16–19 June 2019. [Google Scholar]
- Rizzi, S.A.; Palumbo, D.L.; Rathsam, J.; Christian, A.W.; Rafaelof, M. Annoyance to Noise Produced by a Distributed Electric Propulsion High-Lift System. In Proceedings of the 23rd AIAA/CEAS Aeroacoustics Conference, American Institute of Aeronautics and Astronautics, Denver, CO, USA, 5–9 June 2017. [Google Scholar]
- Callanan, J.; Ghassemi, P.; DiMartino, J.; Dhameliya, M.; Stocking, C.; Nouh, M.; Chowdhury, S. Ergonomic Impact of Multi-rotor Unmanned Aerial Vehicle Noise in Warehouse Environments. J. Intell. Robot. Syst. 2020, 100, 1309–1323. [Google Scholar] [CrossRef]
- Torija, A.J.; Li, Z.; Self, R.H. Effects of a hovering unmanned aerial vehicle on urban soundscapes perception. Transp. Res. Part D Transp. Environ. 2020, 78, 102195. [Google Scholar] [CrossRef]
- Torija, A.J.; Li, Z. Metrics for Assessing the Perception of Drone Noise. Paper No. 18. In Proceedings of the e-Forum Acusticum 2020, Lyon, France, 7–11 December 2020; Société Française d’Acoustique and European Acoustics Association: Lyon, France, 2020; pp. 2793–2798. [Google Scholar]
- Gwak, D.Y.; Han, D.; Lee, S. Sound quality factors influencing annoyance from hovering UAV. J. Sound Vib. 2020, 489, 115651. [Google Scholar] [CrossRef]
- Christian, A.W.; Cabell, R. Initial Investigation into the Psychoacoustic Properties of Small Unmanned Aerial System Noise. In Proceedings of the 23rd AIAA/CEAS Aeroacoustics Conference; American Institute of Aeronautics and Astronautics, Denver, CO, USA, 5–9 June 2017. [Google Scholar]
- Begault, D.R. Psychoacoustic Measures for UAM Noise in the Context of Ambient Sound. Vertical Flight Society San Francisco Bay Area Chapter. Available online: https://vtol.org/files/dmfile/20200611---psychoacoustics---begault_v6.3.pdf (accessed on 29 May 2021).
- Guski, R.; Bosshardt, H.-G. Gibt es eine “unbeeinflußte” Lästigkeit? Z. Lärmbekämpf. Z. Für Lärmbekämpf. 1992, 39, 67–74. [Google Scholar]
- Di, G.-Q.; Chen, X.-W.; Song, K.; Zhou, B.; Pei, C.-M. Improvement of Zwicker’s psychoacoustic annoyance model aiming at tonal noises. Appl. Acoust. 2016, 105, 164–170. [Google Scholar] [CrossRef]
- More, S.R. Aircraft Noise Characteristics and Metrics; Purdue University: West Lafayette, IN, USA, 2011. [Google Scholar]
- Bolin, K.; Nilsson, M.; Khan, S. The Potential of Natural Sounds to Mask Wind Turbine Noise. Acta Acust. United Acust. 2010, 96, 131–137. [Google Scholar] [CrossRef]
- Pierrette, M.; Marquis-Favre, C.; Morel, J.; Rioux, L.; Vallet, M.; Viollon, S.; Moch, A. Noise annoyance from industrial and road traffic combined noises: A survey and a total annoyance model comparison. J. Environ. Psychol. 2012, 32, 178–186. [Google Scholar] [CrossRef]
- Miedema, H.M.E.; Oudshoorn, C.G.M. Annoyance from transportation noise: Relationships with exposure metrics DNL and DENL and their confidence intervals. Environ. Health Perspect. 2001, 109, 409–416. [Google Scholar] [CrossRef]
- Brink, M.; Schäffer, B.; Vienneau, D.; Foraster, M.; Pieren, R.; Eze, I.C.; Cajochen, C.; Probst-Hensch, N.; Röösli, M.; Wunderli, J.-M. A survey on exposure-response relationships for road, rail, and aircraft noise annoyance: Differences between continuous and intermittent noise. Environ. Int. 2019, 125, 277–290. [Google Scholar] [CrossRef]
- Senzig, D.A.; Marsan, M. UAS Noise Certification, Paper No. 1855. In Proceedings of the Inter-Noise 2018, 47th International Congress and Exposition on Noise Control Engineering, Chicago, IL, USA, 26–29 August 2018; pp. 1–9. [Google Scholar]
- Rizzi, S.A. Toward Reduced Aircraft Community Noise Impact via a Perception-Influenced Design Approach, Paper No. 33. In Proceedings of the Inter-Noise 2016, 45th International Congress and Exposition on Noise Control Engineering, Hamburg, Germany, 21–24 August 2016; pp. 2–26. [Google Scholar]
- Burgess, M. Drone delivery and noise regulation in the Australian context. In Proceedings of the Quiet Drones 2020—International e-Symposium on Noise of UAV and UAS, Paris, France, 19–21 October 2020. [Google Scholar]
- Bangjun, Z.; Lili, S.; Guoqing, D. The influence of the visibility of the source on the subjective annoyance due to its noise. Appl. Acoust. 2003, 64, 1205–1215. [Google Scholar] [CrossRef]
- Pedersen, E.; Larsman, P. The impact of visual factors on noise annoyance among people living in the vicinity of wind turbines. J. Environ. Psychol. 2008, 28, 379–389. [Google Scholar] [CrossRef]
- Cohen, B.H. Explaining Psychological Statistics, 4th ed.; John Wiley and Sons, Inc.: Hoboken, NJ, USA, 2013. [Google Scholar]
- WHO. Burden of Disease from Environmental Noise. Quantification of Healthy Life Years Lost in Europe; World Health Organization (WHO), Regional Office for Europe: Copenhagen, Denmark, 2011; p. 106. Available online: https://www.euro.who.int/__data/assets/pdf_file/0008/136466/e94888.pdf (accessed on 29 May 2021).
- Can, A.; L’Hostis, A.; Aumond, P.; Botteldooren, D.; Coelho, M.; Guarnaccia, C.; Kang, J. The future of urban sound environments: Impacting mobility trends and insights for noise assessment and mitigation. Appl. Acoust. 2020, 170, 107518. [Google Scholar] [CrossRef]
- Aletta, F.; Kang, J. Towards an Urban Vibrancy Model: A Soundscape Approach. Int. J. Environ. Res. Public Health 2018, 15, 1712. [Google Scholar] [CrossRef] [PubMed] [Green Version]
- Andringa, T.C.; Lanser, J.J.L. How peasant sounds promote and annoying sounds impede health: A cognitive approach. Int. J. Environ. Res. Public Health 2013, 10, 1439–1461. [Google Scholar] [CrossRef] [PubMed] [Green Version]
- Kang, J.; Aletta, F.; Gjestland, T.T.; Brown, L.A.; Botteldooren, D.; Schulte-Fortkamp, B.; Lercher, P.; van Kamp, I.; Genuit, K.; Fiebig, A.; et al. Ten questions on the soundscapes of the built environment. Build. Environ. 2016, 108, 284–294. [Google Scholar] [CrossRef] [Green Version]
- EU Directive 2002/49/EC of the European Parliament and of the Council of 25 June 2002 Relating to the Assessment and Management of Environmental Noise; European Union (EU): Bruxelles, Belgium, 2002; p. 14. Available online: https://eur-lex.europa.eu/legal-content/EN/TXT/?uri=celex:32002L0049 (accessed on 29 May 2021).
- EU. Commission Directive (EU) 2015/996 of 19 May 2015 Establishing Common Noise Assessment Methods According to Directive 2002/49/EC of the European Parliament and of the Council. Official Journal of the European Union (Text with EAA Relevance); European Union (EU): Bruxelles, Belgium, 2018; p. 823. Available online: https://eur-lex.europa.eu/eli/dir/2015/996/oj (accessed on 29 May 2021).
- WHO. Environmental Noise Guidelines for the European Region; World Health Organization (WHO), Regional Office for Europe: Copenhagen, Denmark, 2018; p. 181. Available online: http://www.euro.who.int/en/health-topics/environment-and-health/noise/environmental-noise-guidelines-for-the-european-region (accessed on 29 May 2021).


| Category | Inclusion Criterion | Exclusion Criterion |
|---|---|---|
| Population (P) | Population (humans, i.e., children and adults) | Animals |
| Exposure (E) | Drone noise/sound | Other environmental noise sources |
| Outcomes (O) | Noise annoyance, general health | - |
| Other | - | Review articles, newspaper articles, letters, etc.; references to full conference proceedings instead of individual conference articles. |
| Study | Drones | Maneuver | Lab/Field | Microphones | Emission Data |
|---|---|---|---|---|---|
| Alexander and Whelchel [19] | DJI Matrice 600 Pro, Hexa, 15.5 kg | Hovering, slow flyover (3.2 m/s) | F | 5 mics on 1 m ground plates on grass on line perpendicular to flight path | LE [dB(Z)] and power spectral density |
| Alexander, et al. [20] | DJI Matrice 600 Pro, Hexa, 15.5 kg | Hovering, slow flyover (3.2 m/s) | F | 5 mics on 1 m ground plates on grass on line perpendicular to flight path | LE [dB(Z)] and power spectral density |
| Besnea [21] | Various | Hovering, Climb, Forward flight | F | Microphone array | |
| Cabell, et al. [22] | Various up to 7 kg | Hovering, Forward flight | F | 4 mics on 43 cm ground plates on line perpendicular to flight path | LAmax, Effective Perceived Noise Level (EPNL), spectrograms |
| Cheng and Herrin [23] | DJI Mavic Pro | Hovering | L | Intensity probe | 1/3 octave band sound pressure at 5.5 m |
| EU [24] | Not specified | Hovering | L | Hemispherical measuring surface according to ISO 3744 | Sound power |
| Fattah, et al. [25] | Quadcopter, 1.4 kg | Hovering, slow flight | L | Microphone array | |
| Herreman [26] | KittyHawk HDX15,17, GPX SkyKing | Fixed, 10, 50, 60, 70, 80% power | L | 20 mics on sphere of radius 0.9 m | Sound power |
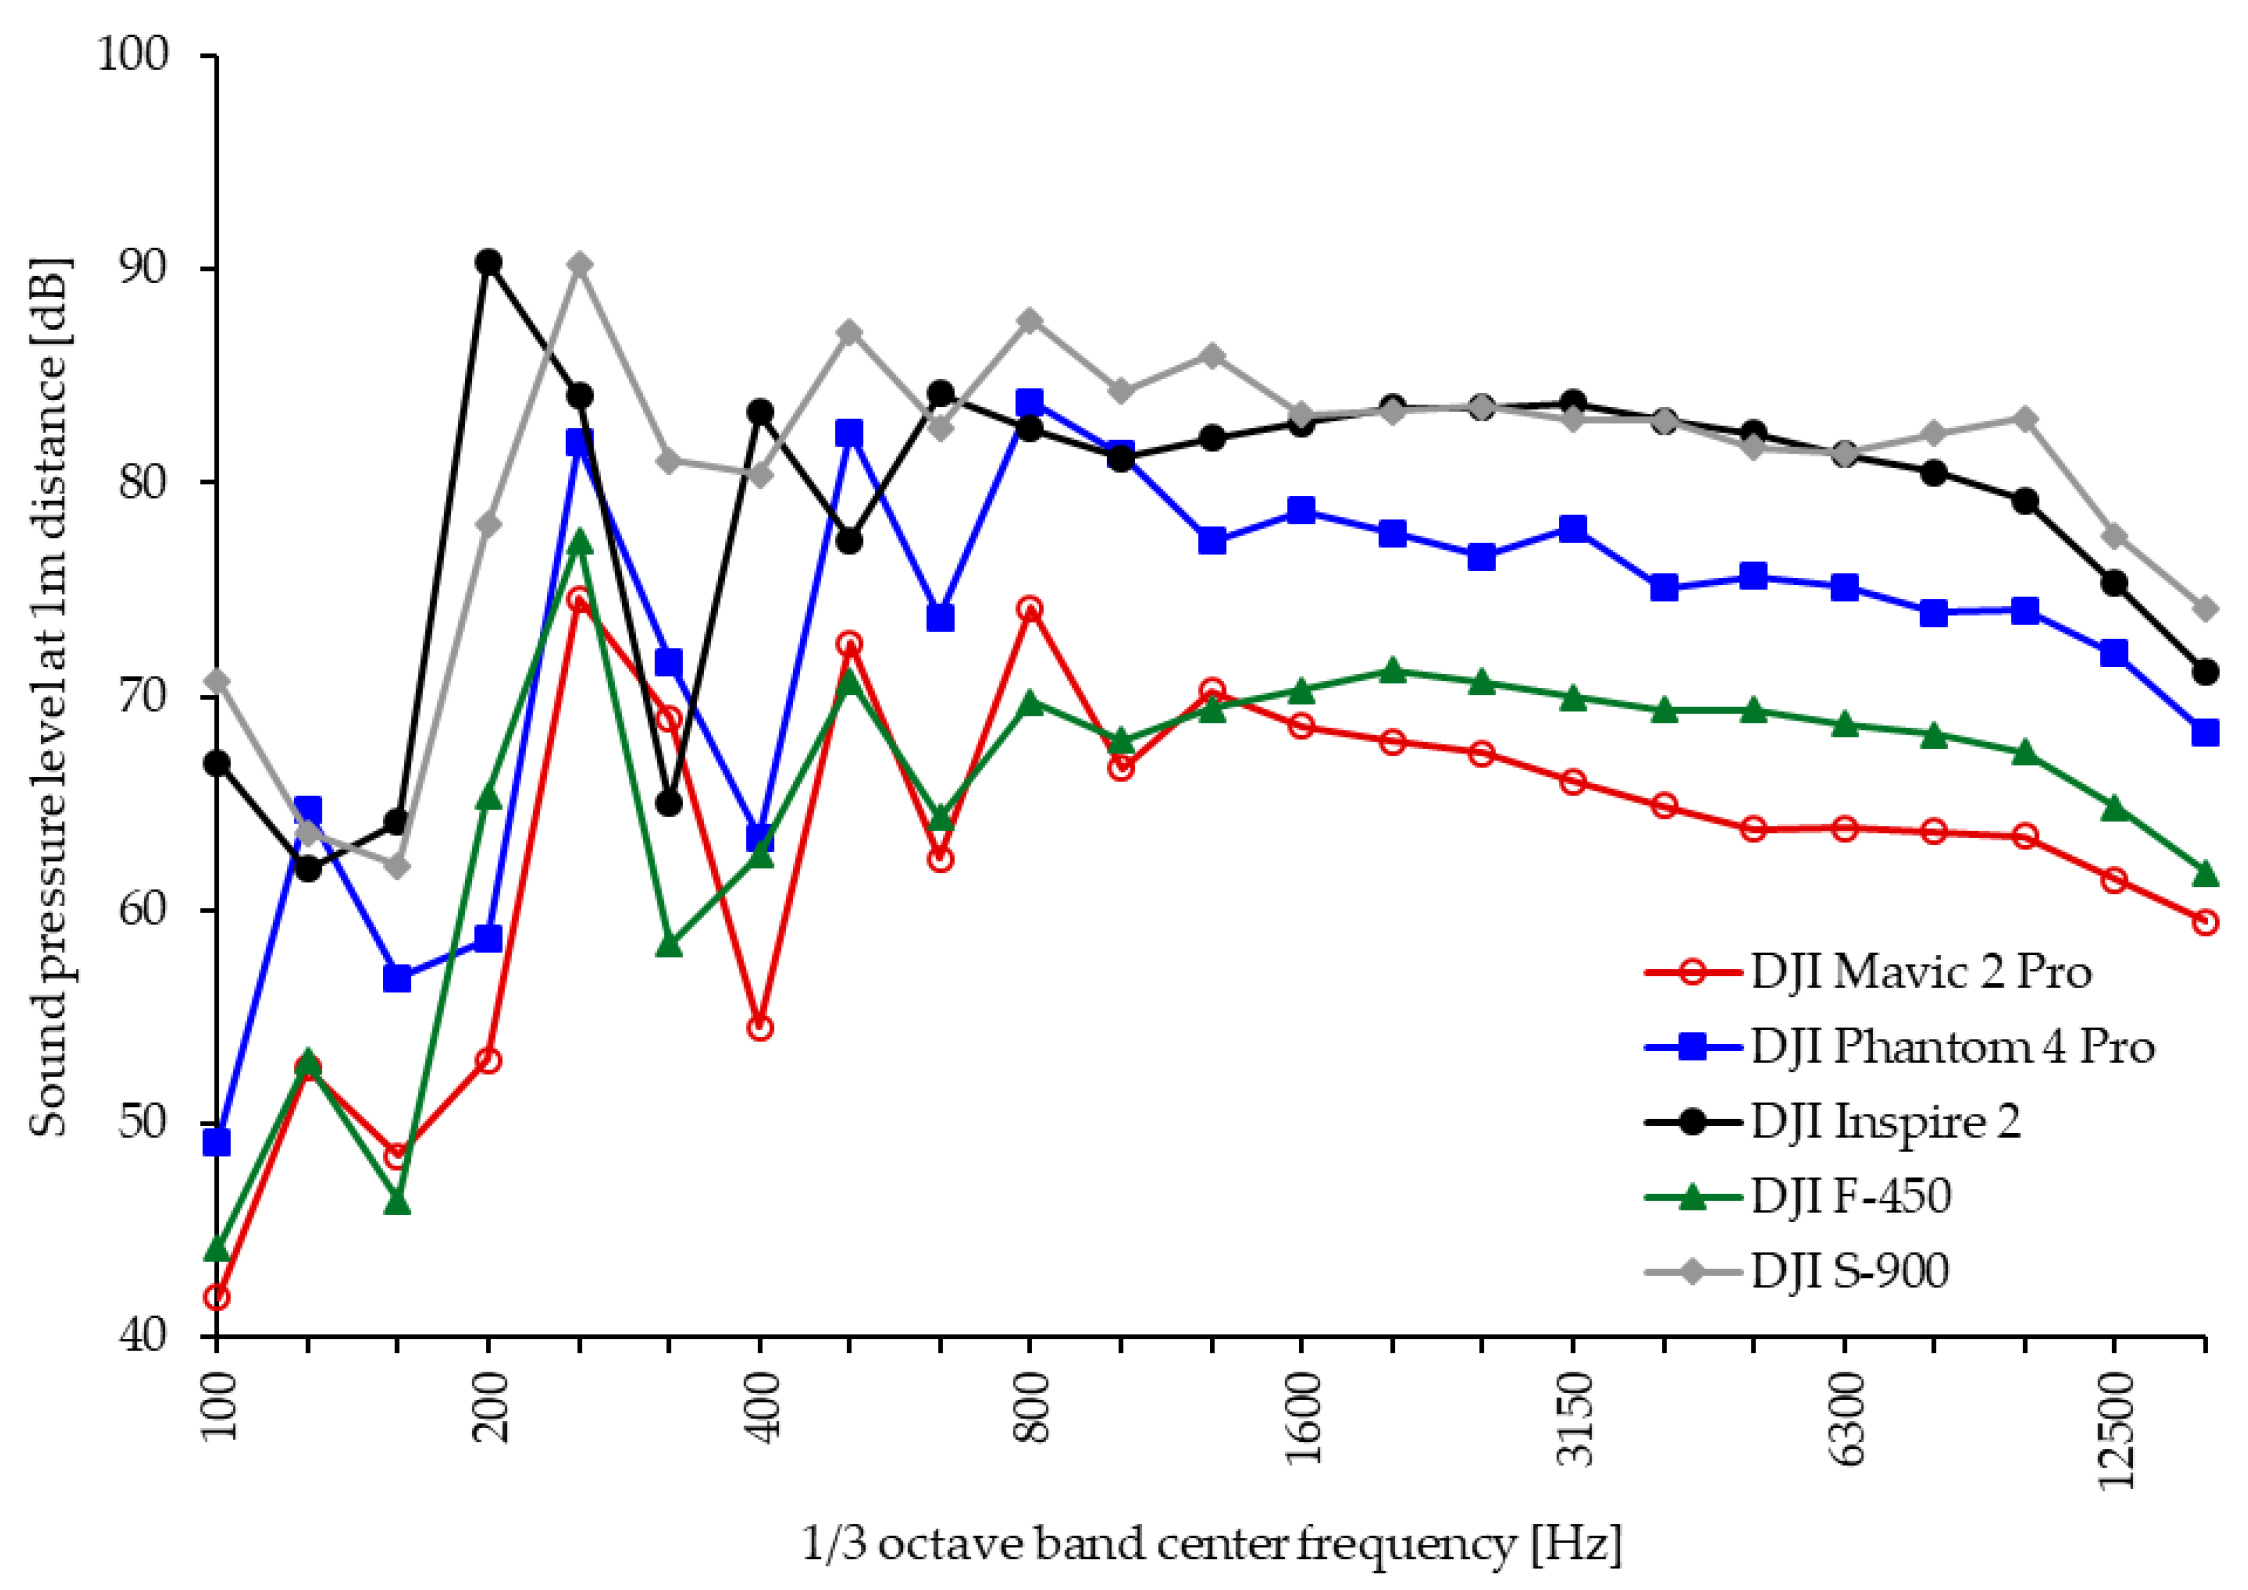
| Heutschi, et al. [27] | DJI Mavic 2 Pro, DJI Inspire 2, DJI S-900, DJI F-450 | Hovering, varying payload | L | 5 mics on vertical arc with elevations −80 to +30° at 1.5 m | 1/3 octave band sound pressure at 1.5 m |
| Humphreys, et al. [28] | Not specified | F | Microphone array | ||
| Intaratep, et al. [29] | DJI Phantom II | Fixed | L | 1 mic at elevation −40° at 1.5 m | Sound pressure dB(A) and power spectral density |
| Kloet, et al. [30] | Quadcopter | Hovering in field; Fixed in lab with 50% power | L + F | Field: 1 mic 1 m above grass; Lab: Microphone array | Sound pressure dB(A) |
| Klug, et al. [31] | Little Spyder, Align M480L, FPV-Racingcopter | Fixed, various rpms | L | 10 mics on vertical arc in 10° steps at 1.5 m | Sound power |
| Mobley [32] | KittyHawk HDX15,17 | Fixed, various power settings | L | 20 mics on sphere of radius 1.8 m | Sound pressure |
| Papa, et al. [33] | Syma X5C, RC Eye One Xtreme | Fixed, 25 to 100% power | L | 11 mics on hemisphere | Sound power |
| Putzu, et al. [34] | Parrot Bebop 2, DJI Mavic Pro | Airflow simulated forward flight | L | 1 mic | Sound pressure |
| Read, et al. [35] | Yuneec Typhoon, DJI M200, Gryphon Dynamics GD28X | Flyover, hovering, take-off, landing | F | 1 mic 1.2 m above ground and 1 mic on ground plate | LAmax at 400 feet and LAE |
| Senzig and Marsan [36] | DJI Phantom 2, Prioria Hex | Flyover at 150 m | F | 1 mic on ground plate | LAmax at 400 feet |
| Senzig, et al. [37] | DJI Phantom 3 Advanced | Flyover at 25, 50, 100 and 200 feet | F | 1 mic 1.2 m above ground and 1 mic on ground plate | LAmax at 400 feet and LAE |
| Tinney and Sirohi [38] | Universal platform, quad, hexa | Fixed, various rpm | L | 8 mics sequentially at different elevations and distances | Sound pressure |
| Treichel and Körper [39] | Not specified models | Hovering, climb, descent, flyover, maneuvering | F | 1 mic, or 8 mics for directivity | Sound pressure, sound power |
| Zawodny and Pettingill [40] | SUI Endurance | Fixed, in wind tunnel to simulate hovering and forward flight at 15.5 m/s | L | Microphone array | Sound pressure |
| Zhang, et al. [41] | DJI Inspire-1 T600 | Hovering and forward flight | F | Microphone array | |
| Zhou, et al. [42] | DJI Phantom 4 | Hovering, climb, descent, forward flight | L | Microphone array on ground and vertical line |
| Study | Drone Model | Take-Off Mass [kg] | Measurement Values |
|---|---|---|---|
| Alexander and Whelchel [19] | DJI Matrice 600 Pro, Hexa | 9.5 | Sound exposure level during 14 s on ground plate: −30°, in 18.29 m: 79.2 dB(Z) −45°, in 12.93 m: 83.7 dB(Z) −60°, in 10.56 m: 87.3 dB(Z) −75°, in 9.46 m: 88.7 dB(Z) −90°, in 9.14 m: 89.6 dB(Z) |
| EU [24] | Not specified | 0.9 * | Maximum allowed sound power level as from entry of regulation into force LW,A: 85 dB(A) |
| EU [24] | Not specified | 4.0 * | Maximum allowed sound power level as from entry of regulation into force LW,A: 97 dB(A) |
| Herreman [26] | KittyHawk HDX17 | ~5.0 | Sound power level LW,A: 102.6 dB(A) |
| Herreman [26] | KittyHawk HDX15 | ~4.0 | Sound power level LW,A: 97.2 dB(A) |
| Herreman [26] | SkyKing | ~1.0 | Sound power level LW,A: 74.1 dB(A) |
| Heutschi, et al. [27] | DJI Mavic 2 Pro | 0.9 | Sound pressure level −30° in 1 m: 71.2 dB(A) |
| Heutschi, et al. [27] | DJI Inspire 2 | 3.4 | Sound pressure level −30° in 1 m: 78.6 dB(A) |
| Heutschi, et al. [27] | DJI S-900 | 3.3 | Sound pressure level −30° in 1 m: 86.7 dB(A) |
| Intaratep, et al. [29] | DJI Phantom II | 1.0 | Sound pressure level −40° in 1.5 m: 70 dB(A) |
| Kloet, et al. [30] | Self-build | 2.1 | Sound pressure level −30° in 19 m, 1 m above grass: 54 dB(A) |
| Study | Drone Model | Take-Off Mass [kg] | Measurement Values |
|---|---|---|---|
| Alexander and Whelchel [19] | DJI Matrice 600 Pro, Hexa | 9.5 | Sound exposure level during 14 s measured on ground plate for fly-by with 3.2 m/s at 7.5 m height: lateral distance 15.8 m: 79.9 dB(A) lateral distance 9.1 m: 79.6 dB(A) lateral distance 5.3 m: 82.7 dB(A) lateral distance 2.5 m: 84.0 dB(A) lateral distance 0.0 m: 85.3 dB(A) |
| Cabell, et al. [22] | DJI Phantom 2 | 1.6 | Maximum sound pressure level for fast flyover at 15 m height: 62 dB(A) |
| Cabell, et al. [22] | Prioria Hex | 7.3 | Maximum sound pressure level for fast flyover at 15 m height: 65 dB(A) |
| Herreman [26] | KittyHawk HDX17 | ~5.0 | Sound power level for slow flight LW,A: 104.0 dB(A) |
| Herreman [26] | KittyHawk HDX15 | ~4.0 | Sound power level for slow flight LW,A: 97.6 dB(A) |
| Herreman [26] | KittyHawk HDX15 | ~4.0 | Sound power level for fast flight LW,A: 98.2 dB(A) |
| Senzig and Marsan [36] | DJI Phantom 2 | 1.6 | Maximum sound pressure level on ground plate for flyover at 400 feet: 44.9 dB(A) |
| Senzig and Marsan [36] | Prioria Hex | 2.5 | Maximum sound pressure level on ground plate for flyover at 400 feet: 45.9 dB(A) |
| Senzig, et al. [37] | DJI Phantom 3 Advanced | 1.3 | Maximum sound pressure level on ground plate for flyover at 25 feet: 69.8 dB(A) |
| Treichel and Körper [39] | Average over multiple models | ~1.5 | Maximum sound pressure level at 1.2 m above hard ground for flyover at 5 m: 68.8 dB(A) |
| Heutschi, et al. [27] | DJI Mavic 2 Pro | 0.9 | Sound pressure level estimated from hover with payload −30° at 1 m: 72.8 dB(A) |
| Heutschi, et al. [27] | DJI Inspire 2 | 3.4 | Sound pressure level estimated from hover with payload −30° at 1 m: 82.3dB(A) |
| Heutschi, et al. [27] | DJI S-900 | 3.3 | Sound pressure level estimated from hover with payload −30° at 1 m: 92.4dB(A) |
| Read, et al. [35] | Yuneec Typhoon | 2.4 | Maximum sound pressure level on ground plate for flyover at 400 feet: 50.1 dB(A) |
| Read, et al. [35] | DJI M200 | 6.1 | Maximum sound pressure level on ground plate for flyover at 400 feet: 51.8 dB(A) |
| Read, et al. [35] | Gryphon Dynamics GD28X | 20.4 | Maximum sound pressure level on ground plate for flyover at 400 feet: 62.0 dB(A) |
| Study | Drones; Maneuver | Further Sound Sources | Region; Study Design; Quality | Population | Outcome and Measurement * | (Psycho-)Acoustic Characteristics † | Psychoacoustic Sound Pressure Level Difference |
|---|---|---|---|---|---|---|---|
| Begault [51] | NASA EVTOL concept; flyover | Different urban soundscapes | USA; study design: n.s., only exp. concept (++) | n.s. | Annoyance, blend, detection: 2-AFC tests; consideration of background sound | Sound level difference (signal-to-noise) | - |
| Callanan, et al. [46] | 2 quadcopters; hovering | Loudspeaker (speech test material) | USA; lab experiment; (+) | n = 30 (M = 15, F = 15), 18–34 y; exclusion n = 2 | Annoyance, loudness, hearing/understanding, ability to listen to voice: 10-point scale; performance: HINT und Alpha-Test | Level-time histories; spectra; LAeq | - |
| Christian and Cabell [50] | 3 quadcopters, 1 octocopter; straight flyover | Road vehicles (car, utility van, box truck, step van) | USA; lab experiment; (++) | n = 38 (~2/3 M, ~1/3 F), ~18–50 y | Annoyance: ICBEN 5-point scale | LAE, LCE; EPNL; L5 | ∆ LAE = 5.6 dB; ∆ LCE = 12.8 dB; ∆EPNL = 7.6 dB; ∆L5 = 7.5 dB (drone vs. vehicle) |
| Gwak, et al. [49] | 2 quadcopters, 1 octocopter; hovering | Jet aircraft | South Korea; 2 lab experiments; (++) | Exp. 1: n = 50 (M = 35, F = 15), 19–30 y; Exp. 2: n = 25 (M = 13, F = 12), 20–30 y | %HA from annoyance: ICBEN 11-point scale; adjectives related to senses and feelings for the sounds: 51-point scale | Spectrograms; spectra; LAeq & further acoustic metrics; L, S, R, FS | ∆LAeq ~10 dB (large drone vs. aircraft); ∆LAeq ~6 dB (large vs. small drone); ∆LAeq ~4 dB (small drone vs. aircraft) |
| Rizzi, et al. [45] | Fixed-wing (electric propulsion); straight flyover | - | USA; lab experiment; (++) | n = 32 | Annoyance: ICBEN 11-point scale | LA5; N5, S5, R5, FS5, T5 | - |
| Torija, et al. [44] | 1 quadcopter; straight flyover, hover | Road vehicles (car, motorcycle), jet aircraft (A320, A320neo) | Great Britain; calculations (no experiment); (++) | - | “Psychoacoustic Annoyance” models: (1) PA, Fastl and Zwicker [16] (2) PAmod, Di, et al. [53] (3) PAmod for aircraft noise, More [54] | Spectra; N5, S5, R5, FS5, T5 | - |
| Torija, et al. [47] | 1 quadcopter; hover | 7 urban soundscapes (parks at different distances from roads) | Great Britain; lab experiment (3 parts); (+) | n = 30 (M = 16, F = 14), 21–59 y | Loudness, annoyance, pleasantness: (ICBEN) 11-point scale; Consideration of audio-visual interactions and background sounds | LAeq; spectra | ∆LAeq = 6 dB (annoyance with drone noise vs. background noise only) |
| Torija and Li [48] | 1 quadcopter; straight flyover | Road vehicles (car, motorcycle, moped), jet aircraft (A320, A320neo), reference jet aircraft (B767, B787), [helicopter] | Great Britain; lab experiment: part 2 of [47] (+) | n = 30 (M = 16, F = 14), 21–59 y | Ranking in terms of preference: 101-point scale | LAeq, LA5; N5, S5, R5, FS5, T5; EPNL | - |
Publisher’s Note: MDPI stays neutral with regard to jurisdictional claims in published maps and institutional affiliations. |
© 2021 by the authors. Licensee MDPI, Basel, Switzerland. This article is an open access article distributed under the terms and conditions of the Creative Commons Attribution (CC BY) license (https://creativecommons.org/licenses/by/4.0/).
Share and Cite
Schäffer, B.; Pieren, R.; Heutschi, K.; Wunderli, J.M.; Becker, S. Drone Noise Emission Characteristics and Noise Effects on Humans—A Systematic Review. Int. J. Environ. Res. Public Health 2021, 18, 5940. https://doi.org/10.3390/ijerph18115940
Schäffer B, Pieren R, Heutschi K, Wunderli JM, Becker S. Drone Noise Emission Characteristics and Noise Effects on Humans—A Systematic Review. International Journal of Environmental Research and Public Health. 2021; 18(11):5940. https://doi.org/10.3390/ijerph18115940
Chicago/Turabian StyleSchäffer, Beat, Reto Pieren, Kurt Heutschi, Jean Marc Wunderli, and Stefan Becker. 2021. "Drone Noise Emission Characteristics and Noise Effects on Humans—A Systematic Review" International Journal of Environmental Research and Public Health 18, no. 11: 5940. https://doi.org/10.3390/ijerph18115940