
Phase Angle Is a Marker of Muscle Quantity and Strength in Overweight/Obese Former Athletes


 , , ,
, , ,  ,
,  ,
,
Abstract
:1. Introduction
2. Methods
2.1. Participants and Study Design
2.2. Procedures
2.3. Statistical Analysis
3. Results
4. Discussion
5. Conclusions
Author Contributions
Funding
Institutional Review Board Statement
Informed Consent Statement
Data Availability Statement
Conflicts of Interest
References
- Haskell, W.L.; Lee, I.-M.; Pate, R.R.; Powell, K.E.; Blair, S.N.; Franklin, B.A.; Macera, C.A.; Heath, G.W.; Thompson, P.D.; Bauman, A. Physical activity and public health: Updated recommendation for adults from the American College of Sports Medicine and the American Heart Association. Med. Sci. Sports Exerc. 2007, 39, 1423–1434. [Google Scholar] [CrossRef] [PubMed] [Green Version]
- Cruz-Jentoft, A.J.; Bahat, G.; Bauer, J.; Boirie, Y.; Bruyère, O.; Cederholm, T.; Cooper, C.; Landi, F.; Rolland, Y.; Sayer, A.A.; et al. Sarcopenia: Revised European consensus on definition and diagnosis. Age Ageing 2019, 48, 16–31. [Google Scholar] [CrossRef] [PubMed] [Green Version]
- Yao, P.-L.; Laurencelle, L.; Trudeau, F. Former athletes’ lifestyle and self-definition changes after retirement from sports. J. Sport Heal. Sci. 2020, 9, 376–383. [Google Scholar] [CrossRef]
- Faulkner, J.A.; Davis, C.S.; Mendias, C.L.; Brooks, S. V The aging of elite male athletes: Age-related changes in performance and skeletal muscle structure and function. Clin. J. Sport Med. 2008, 18, 501–507. [Google Scholar] [CrossRef]
- Silva, A.M. Structural and functional body components in athletic health and performance phenotypes. Eur. J. Clin. Nutr. 2019, 73, 215–224. [Google Scholar] [CrossRef] [PubMed]
- Lukaski, H.; Raymond-Pope, C.J. New Frontiers of Body Composition in Sport. Int. J. Sports Med. 2021. [Google Scholar] [CrossRef]
- Rogers, M.A.; Hagberg, J.M.; Martin, W.H., 3rd; Ehsani, A.A.; Holloszy, J.O. Decline in VO2max with aging in master athletes and sedentary men. J. Appl. Physiol. 1990, 68, 2195–2199. [Google Scholar] [CrossRef]
- Katzel, L.I.; Sorkin, J.D.; Fleg, J.L. A comparison of longitudinal changes in aerobic fitness in older endurance athletes and sedentary men. J. Am. Geriatr. Soc. 2001, 49, 1657–1664. [Google Scholar] [CrossRef]
- Kim, J.; Wang, Z.; Heymsfield, S.B.; Baumgartner, R.N.; Gallagher, D. Total-body skeletal muscle mass: Estimation by a new dual-energy X-ray absorptiometry method. Am. J. Clin. Nutr. 2002, 76, 378–383. [Google Scholar] [CrossRef] [Green Version]
- Wilder, R.P.; Greene, J.A.; Winters, K.L.; Long, W.B., 3rd; Gubler, K.; Edlich, R.F. Physical fitness assessment: An update. J. Long. Term. Eff. Med. Implants 2006, 16, 193–204. [Google Scholar] [CrossRef]
- Martins, P.C.; Hansen, F.; Silva, A.M.; Silva, D.A.S. Fluid distribution and cell integrity indicators evaluated by bioelectrical impedance in university athletes: Comparison between team sports and individual sports. Physiol. Meas. 2019, 40, 15004. [Google Scholar] [CrossRef] [PubMed]
- Mattiello, R.; Amaral, M.A.; Mundstock, E.; Ziegelmann, P.K. Reference values for the phase angle of the electrical bioimpedance: Systematic review and meta-analysis involving more than 250,000 subjects. Clin. Nutr. 2020, 39, 1411–1417. [Google Scholar] [CrossRef] [PubMed]
- Nunes, J.P.; Ribeiro, A.S.; Silva, A.M.; Schoenfeld, B.J.; Dos Santos, L.; Cunha, P.M.; Nascimento, M.A.; Tomeleri, C.M.; Nabuco, H.C.G.; Antunes, M.; et al. Improvements in Phase Angle Are Related With Muscle Quality Index After Resistance Training in Older Women. J. Aging Phys. Act. 2019, 27, 515–520. [Google Scholar] [CrossRef] [PubMed]
- Campa, F.; Toselli, S.; Mazzilli, M.; Gobbo, L.A.; Coratella, G. Assessment of Body Composition in Athletes: A Narrative Review of Available Methods with Special Reference to Quantitative and Qualitative Bioimpedance Analysis. Nutrients 2021, 13, 1620. [Google Scholar] [CrossRef]
- Micheli, M.L.; Pagani, L.; Marella, M.; Gulisano, M.; Piccoli, A.; Angelini, F.; Burtscher, M.; Gatterer, H. Bioimpedance and impedance vector patterns as predictors of league level in male soccer players. Int. J. Sports Physiol. Perform. 2014, 9, 532–539. [Google Scholar] [CrossRef] [PubMed]
- Nabuco, H.C.G.; Silva, A.M.; Sardinha, L.B.; Rodrigues, F.B.; Tomeleri, C.M.; Ravagnani, F.C.P.; Cyrino, E.S.; Ravagnani, C.F.C. Phase Angle is Moderately Associated with Short-term Maximal Intensity Efforts in Soccer Players. Int. J. Sports Med. 2019, 40, 739–743. [Google Scholar] [CrossRef]
- Khalil, S.F.; Mohktar, M.S.; Ibrahim, F. The theory and fundamentals of bioimpedance analysis in clinical status monitoring and diagnosis of diseases. Sensors 2014, 14, 10895–10928. [Google Scholar] [CrossRef]
- Campa, F.; Semprini, G.; Judice, P.B.; Messina, G.; Toselli, S. Anthropometry, Physical and Movement Features, and Repeated-sprint Ability in Soccer Players. Int. J. Sports Med. 2019, 40, 100–109. [Google Scholar] [CrossRef]
- Stone, N.M.; Kilding, A.E. Aerobic conditioning for team sport athletes. Sports Med. 2009, 39, 615–642. [Google Scholar] [CrossRef]
- Barrea, L.; Muscogiuri, G.; Laudisio, D.; Di Somma, C.; Salzano, C.; Pugliese, G.; de Alteriis, G.; Colao, A.; Savastano, S. Phase Angle: A Possible Biomarker to Quantify Inflammation in Subjects with Obesity and 25(OH)D Deficiency. Nutrients 2019, 11, 1747. [Google Scholar] [CrossRef] [Green Version]
- Tallis, J.; Shelley, S.; Degens, H.; Hill, C. Age-Related Skeletal Muscle Dysfunction Is Aggravated by Obesity: An Investigation of Contractile Function, Implications and Treatment. Biomolecules 2021, 11, 372. [Google Scholar] [CrossRef] [PubMed]
- De Subijana, C.L.; Galatti, L.; Moreno, R.; Chamorro, J.L. Analysis of the Athletic Career and Retirement Depending on the Type of Sport: A Comparison between Individual and Team Sports. Int. J. Environ. Res. Public Health 2020, 17, 9265. [Google Scholar] [CrossRef] [PubMed]
- Campa, F.; Matias, C.N.; Nunes, C.L.; Monteiro, C.P.; Francisco, R.; Jesus, F.; Marini, E.; Sardinha, L.B.; Martins, P.; Minderico, C.; et al. Specific Bioelectrical Impedance Vector Analysis Identifies Body Fat Reduction after a Lifestyle Intervention in Former Elite Athletes. Biology 2021, 10, 524. [Google Scholar] [CrossRef]
- Boileau, R.A.; Horswill, C.A. Body composition in sports: Measurement and applications for weight gain and loss. In Exercise and Sport Science; Garret, W.E., Jr., Kinkendall, D.T., Eds.; Lippincott Williams & Wilkins: Philadelphia, PA, USA, 2000; pp. 319–338. [Google Scholar]
- Bosch, T.A.; Burruss, T.P.; Weir, N.L.; Fielding, K.A.; Engel, B.E.; Weston, T.D.; Dengel, D.R. Abdominal body composition differences in NFL football players. J. Strength Cond. Res. 2014, 28, 3313–3319. [Google Scholar] [CrossRef] [PubMed] [Green Version]
- Silva, A.M.; Nunes, C.L.; Matias, C.N.; Jesus, F.; Francisco, R.; Cardoso, M.; Santos, I.; Carraça, E.V.; Silva, M.N.; Sardinha, L.B.; et al. Champ4life Study Protocol: A One-Year Randomized Controlled Trial of a Lifestyle Intervention for Inactive Former Elite Athletes with Overweight/Obesity. Nutrients 2020, 12, 286. [Google Scholar] [CrossRef] [Green Version]
- Ferguson, B. ACSM’s Guidelines for Exercise Testing and Prescription 9th Ed. 2014. J. Can. Chiropr. Assoc. 2014, 58, 328. [Google Scholar]
- Edvardsen, E.; Hem, E.; Anderssen, S.A. End criteria for reaching maximal oxygen uptake must be strict and adjusted to sex and age: A cross-sectional study. PLoS ONE 2014, 9, e85276. [Google Scholar] [CrossRef] [PubMed] [Green Version]
- Hopkins, W.G.; Marshall, S.W.; Batterham, A.M.; Hanin, J. Progressive statistics for studies in sports medicine and exercise science. Med. Sci. Sports Exerc. 2009, 41, 3–13. [Google Scholar] [CrossRef] [PubMed] [Green Version]
- Marquet, L.; Brown, M.; Tafflet, M.; Nassif, H.; Mouraby, R.; Bourhaleb, S.; Toussaint, J.-F.; Desgorces, F.-D. No effect of weight cycling on the post-career BMI of weight class elite athletes. BMC Public Health 2013, 13, 510. [Google Scholar] [CrossRef] [Green Version]
- Hyman, M.H.; Dang, D.L.; Liu, Y. Differences in obesity measures and selected comorbidities in former National Football League professional athletes. J. Occup. Environ. Med. 2012, 54, 816–819. [Google Scholar] [CrossRef]
- Campa, F.; Toselli, S. Bioimpedance Vector Analysis of Elite, Subelite, and Low-Level Male Volleyball Players. Int. J. Sports Physiol. Perform. 2018, 13, 1250–1253. [Google Scholar] [CrossRef]
- Giorgi, A.; Vicini, M.; Pollastri, L.; Lombardi, E.; Magni, E.; Andreazzoli, A.; Orsini, M.; Bonifazi, M.; Lukaski, H.; Gatterer, H. Bioimpedance patterns and bioelectrical impedance vector analysis (BIVA) of road cyclists. J. Sports Sci. 2018, 36, 2608–2613. [Google Scholar] [CrossRef]
- Campa, F.; Matias, C.N.; Marini, E.; Heymsfield, S.B.; Toselli, S.; Sardinha, L.B.; Silva, A.M. Identifying athlete body fluid changes during a competitive season with bioelectrical impedance vector analysis. Int. J. Sports Physiol. Perform. 2020, 15, 361–367. [Google Scholar] [CrossRef]
- Marini, E.; Campa, F.; Buffa, R.; Stagi, S.; Matias, C.N.; Toselli, S.; Sardinha, L.B.; Silva, A.M. Phase angle and bioelectrical impedance vector analysis in the evaluation of body composition in athletes. Clin. Nutr. 2020, 39, 447–454. [Google Scholar] [CrossRef] [PubMed]
- Wang, D.X.M.; Yao, J.; Zirek, Y.; Reijnierse, E.M.; Maier, A.B. Muscle mass, strength, and physical performance predicting activities of daily living: A meta-analysis. J. Cachexia. Sarcopenia Muscle 2020, 11, 3–25. [Google Scholar] [CrossRef] [PubMed] [Green Version]
- Suchomel, T.J.; Nimphius, S.; Stone, M.H. The Importance of Muscular Strength in Athletic Performance. Sports Med. 2016, 46, 1419–1449. [Google Scholar] [CrossRef]
- Bays, H.E. “Sick fat,” metabolic disease, and atherosclerosis. Am. J. Med. 2009, 122, S26–S37. [Google Scholar] [CrossRef]
- Albuquerque, F.N.; Kuniyoshi, F.H.S.; Calvin, A.D.; Sierra-Johnson, J.; Romero-Corral, A.; Lopez-Jimenez, F.; George, C.F.; Rapoport, D.M.; Vogel, R.A.; Khandheria, B.; et al. Sleep-disordered breathing, hypertension, and obesity in retired National Football League players. J. Am. Coll. Cardiol. 2010, 56, 1432–1433. [Google Scholar] [CrossRef] [Green Version]
- Chang, A.Y.; FitzGerald, S.J.; Cannaday, J.; Zhang, S.; Patel, A.; Palmer, M.D.; Reddy, G.P.; Ordovas, K.G.; Stillman, A.E.; Janowitz, W.; et al. Cardiovascular risk factors and coronary atherosclerosis in retired National Football League players. Am. J. Cardiol. 2009, 104, 805–811. [Google Scholar] [CrossRef] [PubMed] [Green Version]
- Hurst, R.T.; Burke, R.; Wissner, E.; Roberts, A.; Kendall, C.B.; Lester, S.; Somers, V.; Goldman, M.; Wu, Q.; Khandheria, B. Incidence of subclinical atherosclerosis as a marker of cardiovascular risk in retired professional football players. Am. J. Cardiol. 2010, 105, 1107–1111. [Google Scholar] [CrossRef] [PubMed]
- Miller, M.A.; Croft, L.B.; Belanger, A.R.; Romero-Corral, A.; Somers, V.K.; Roberts, A.J.; Goldman, M.E. Prevalence of metabolic syndrome in retired National Football League players. Am. J. Cardiol. 2008, 101, 1281–1284. [Google Scholar] [CrossRef] [PubMed]
- Freitas, S.P.; Júdice, P.B.; Hetherington-Rauth, M.; Magalhães, J.P.; Correia, I.R.; Lopes, J.M.; Strong, C.; Matos, D.; Sardinha, L.B. The impact of 2 weeks of detraining on phase angle, BIVA patterns, and muscle strength in trained older adults. Exp. Gerontol. 2021, 144, 111175. [Google Scholar] [CrossRef] [PubMed]
- Cox, A.J.; West, N.P.; Cripps, A.W. Obesity, inflammation, and the gut microbiota. Lancet Diabetes Endocrinol. 2015, 3, 207–215. [Google Scholar] [CrossRef]


| Variable | Men (n = 62) | Women (n = 32) | All (n = 94) |
|---|---|---|---|
| Age (years) | 42.8 ± 9.8 | 43.5 ± 8.7 | 43.1 ± 9.4 |
| Body mass (kg) * | 98.2 ± 17.9 | 81.7 ± 12.2 | 92.7 ± 18.0 |
| Height (cm) * | 175.9 ± 6.7 | 163.0 ± 6.3 | 171.6 ± 9.0 |
| Body mass index (kg/m2) | 31.7 ± 5.1 | 30.7 ± 3.9 | 31.4 ± 4.8 |
| Fat mass (kg) * | 27.6 ± 7.5 | 33.7 ± 6.9 | 33.7 ± 6.9 |
| Fat mass (%) * | 29.3 ± 5.5 | 43.0 ± 3.9 | 33.9 ± 8.2 |
| Fat free mass (kg) * | 70.6 ± 8.9 | 48.0 ± 3.9 | 60.3 ± 12.6 |
| ALST (kg) * | 28.9 ± 4.5 | 18.8 ± 2.9 | 25.4 ± 6.3 |
| Skeletal muscle mass (kg) * | 33.4 ± 5.2 | 21.3 ± 3.4 | 29.3 ± 7.4 |
| Resistance (ohm) * | 439.6 ± 47.3 | 561.6 ± 69.7 | 480.2 ± 80.1 |
| Reactance (ohm) * | 54.5 ± 7.7 | 61.2 ± 7.4 | 56.7 ± 8.2 |
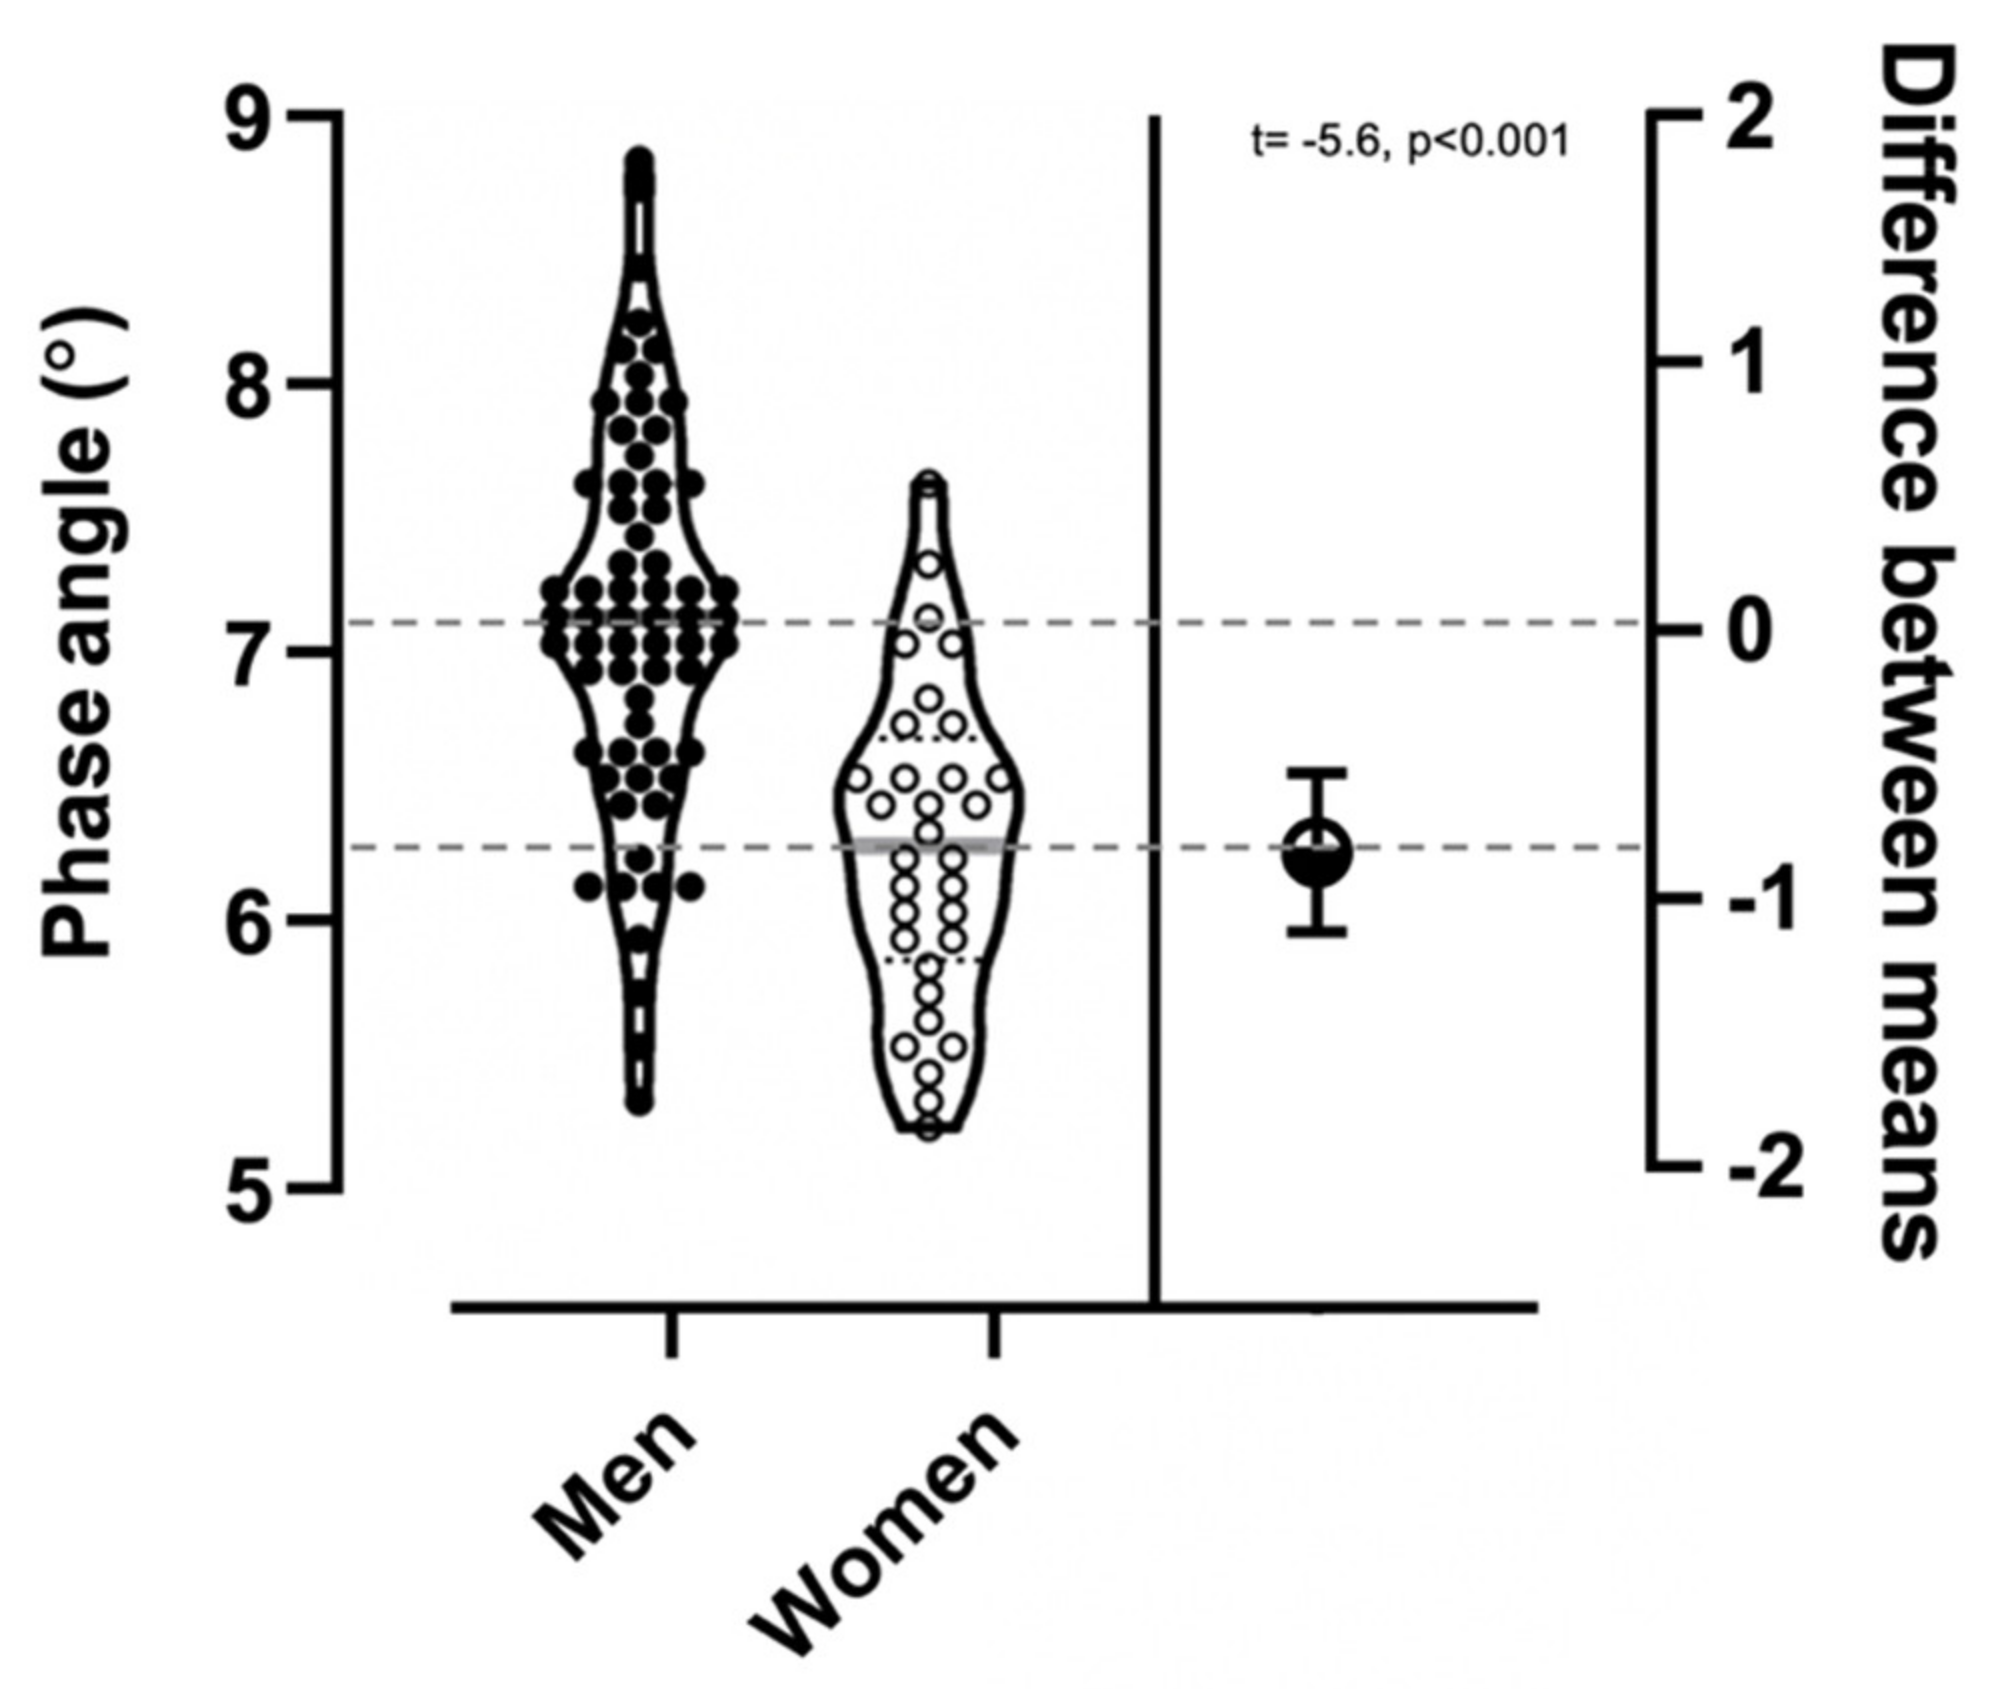
| Phase angle (°)* | 7.1 ± 0.7 | 6.2 ± 0.6 | 6.8 ± 0.8 |
| Upper-body strength (kg) * | 55.1 ± 8.0 | 35.2 ± 5.1 | 48.4 ± 11.9 |
| Lower-body strength (kg) * | 264.5 ± 74.7 | 196.1 ± 67.7 | 241.4 ± 79.4 |
| VO2max (mL/kg/min) *,# | 38.0 ± 7.2 | 29.3 ± 3.7 | 35.2 ± 7.4 |
| Model | R2 | Std. Error | β | 95% CI | p-value |
|---|---|---|---|---|---|
| Skeletal muscle mass | |||||
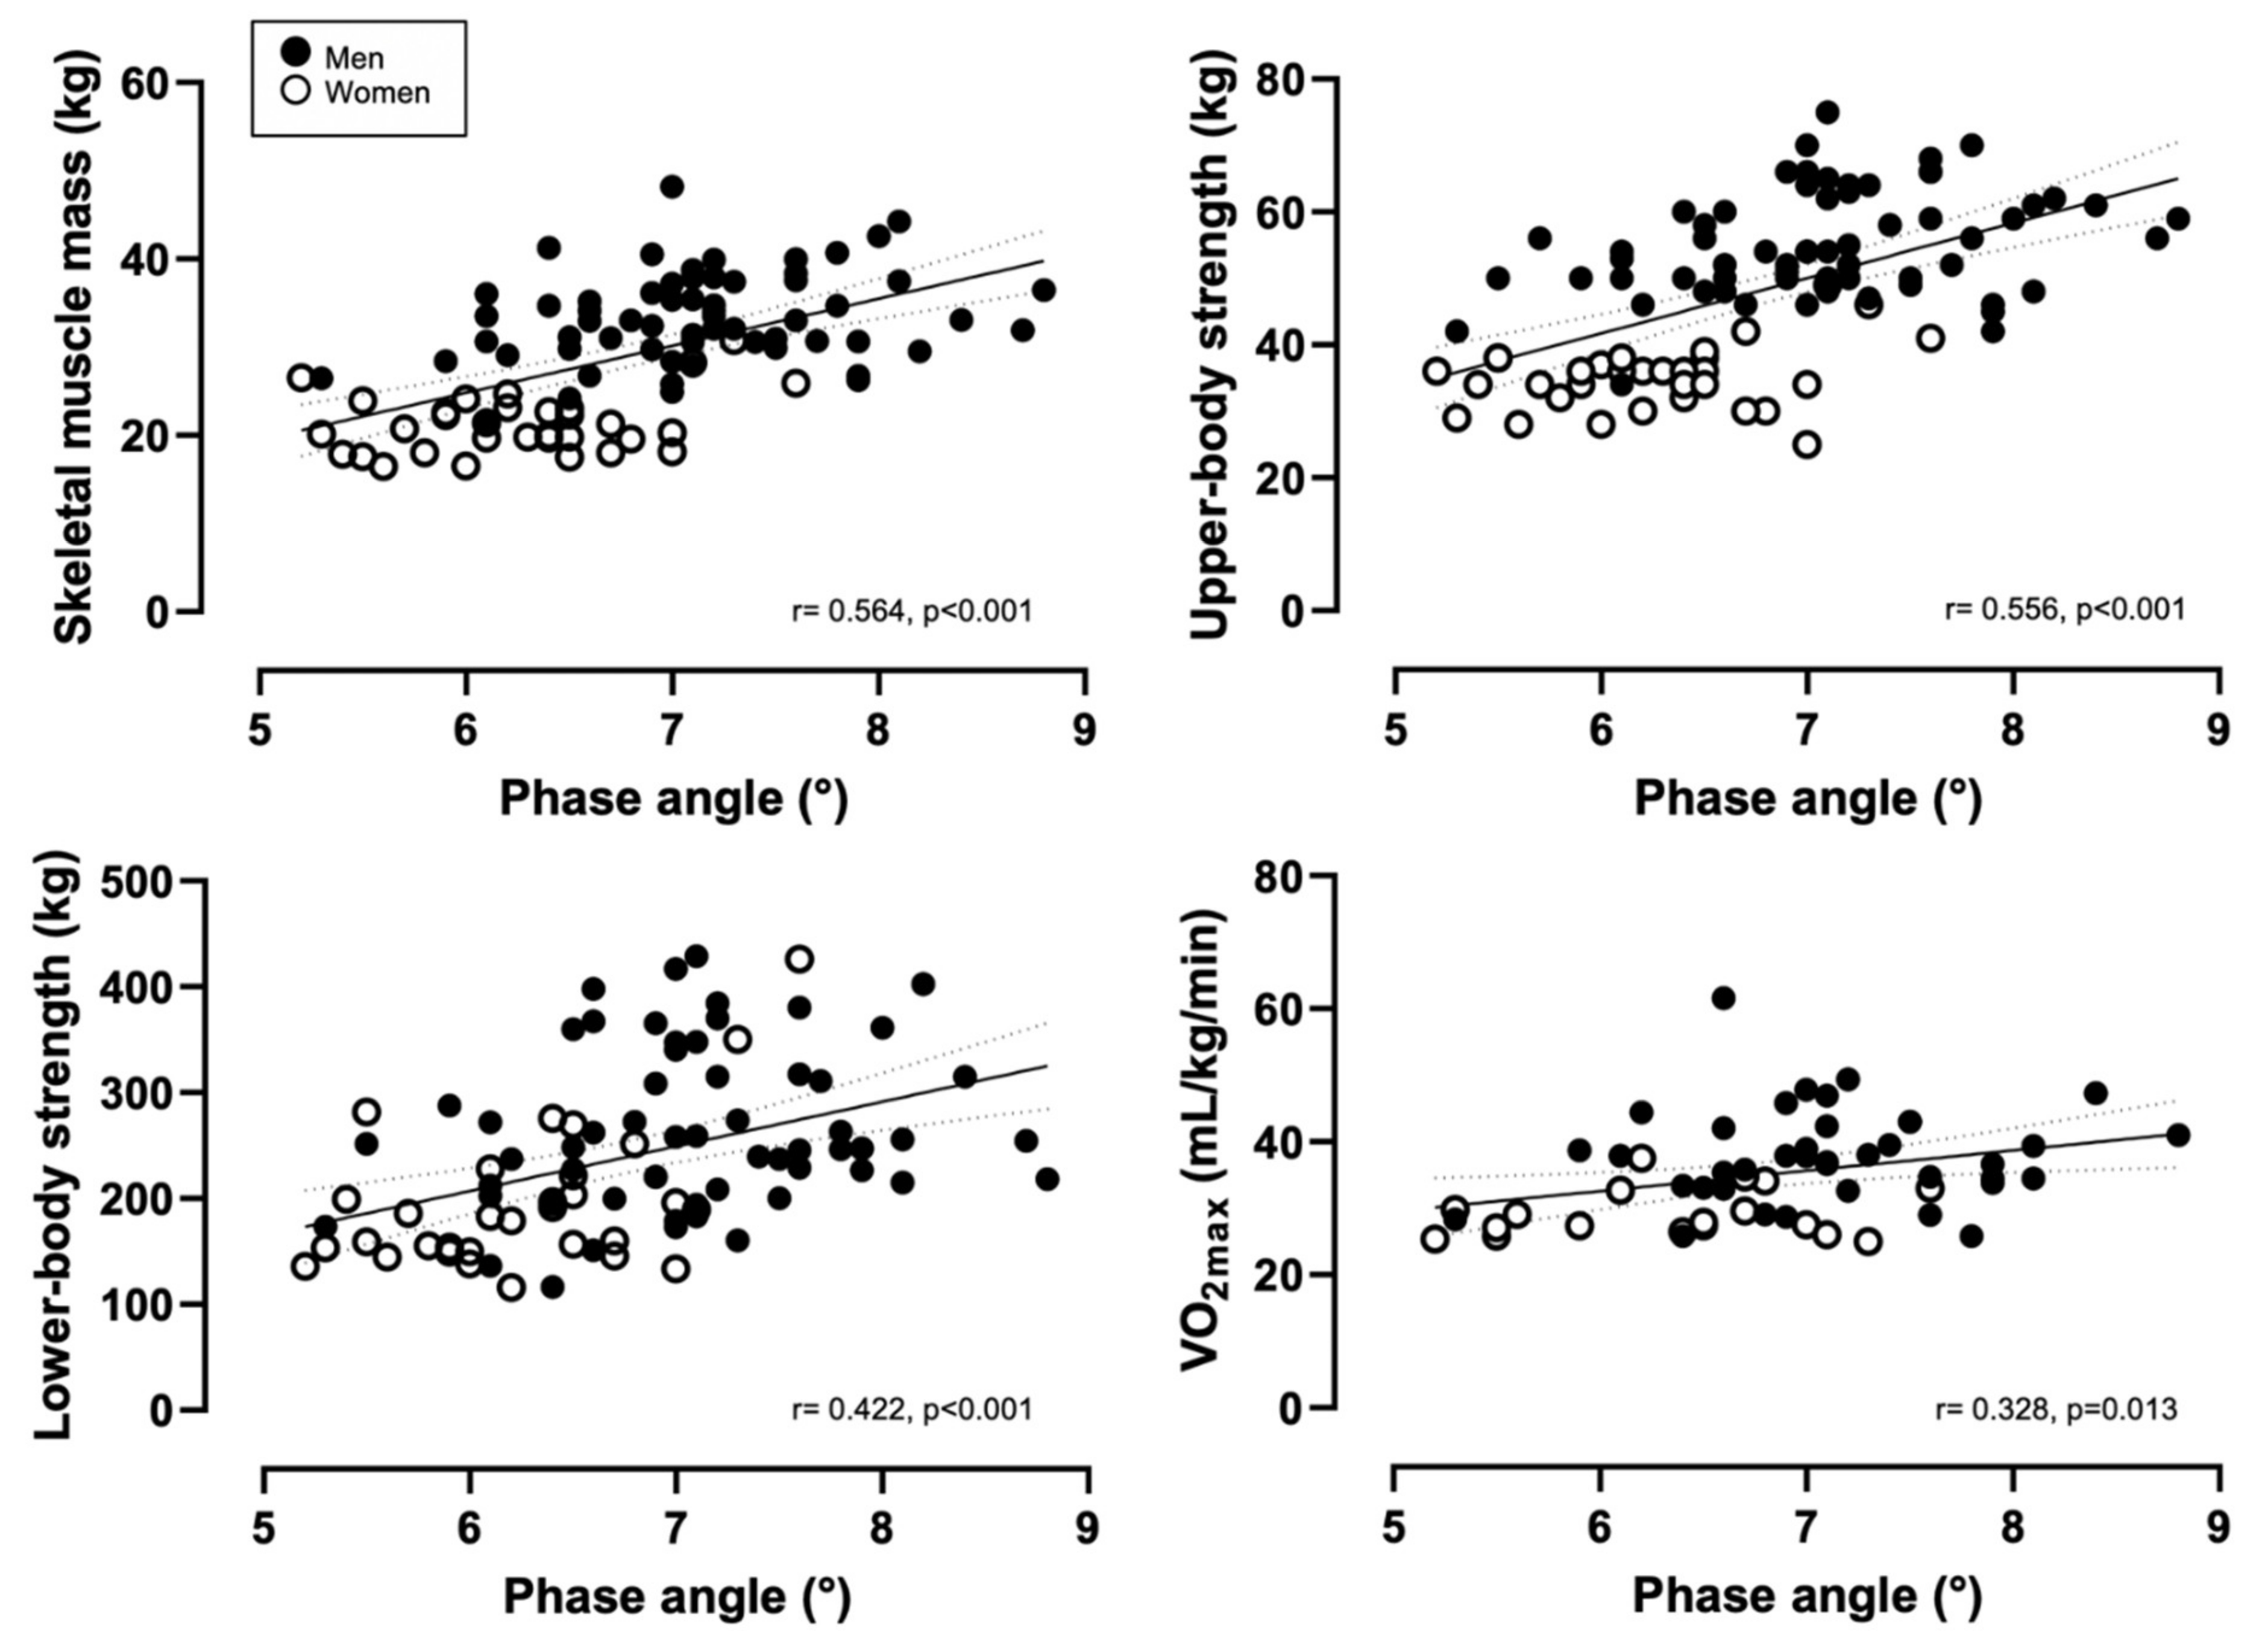
| Phase angle | 0.318 | 6.11 | 5.338 | 3.71, 6.95 | <0.001 |
| Model 1 a | 0.664 | 4.33 | 1.410 | −0.01, 2.82 | 0.050 |
| Model 1 b | 0.752 | 3.74 | 2.158 | 0.91, 3.40 | 0.001 |
| Upper-body strength | |||||
| Phase angle | 0.309 | 9.90 | 8.315 | 5.75, 10.87 | <0.001 |
| Model 1 a | 0.701 | 6.59 | 2.245 | 0.44, 4,47 | 0.018 |
| Model 1 b | 0.708 | 6.60 | 2.846 | 0.64, 5.05 | 0.012 |
| Lower-body strength | |||||
| Phase angle | 0.115 | 79.73 | 35.782 | 15.09, 56.47 | 0.001 |
| Model 1 a | 0.275 | 68.75 | 22.935 | 1.32, 44.54 | 0.038 |
| Model 1 b | 0.275 | 69.509 | 24.209 | 1.02, 47.39 | 0.041 |
| VO2max | |||||
| Phase angle | 0.107 | 7.11 | 3.090 | 0.682, 5.49 | 0.013 |
| Model 1 a | 0.310 | 6.33 | 0.757 | −1.79, 3.31 | 0.555 |
| Model 1 b | 0.655 | 4.52 | −0.163 | −3.03, 0.47 | 0.098 |
Publisher’s Note: MDPI stays neutral with regard to jurisdictional claims in published maps and institutional affiliations. |
© 2021 by the authors. Licensee MDPI, Basel, Switzerland. This article is an open access article distributed under the terms and conditions of the Creative Commons Attribution (CC BY) license (https://creativecommons.org/licenses/by/4.0/).
Share and Cite
Matias, C.N.; Campa, F.; Nunes, C.L.; Francisco, R.; Jesus, F.; Cardoso, M.; Valamatos, M.J.; Homens, P.M.; Sardinha, L.B.; Martins, P.; et al. Phase Angle Is a Marker of Muscle Quantity and Strength in Overweight/Obese Former Athletes. Int. J. Environ. Res. Public Health 2021, 18, 6649. https://doi.org/10.3390/ijerph18126649
Matias CN, Campa F, Nunes CL, Francisco R, Jesus F, Cardoso M, Valamatos MJ, Homens PM, Sardinha LB, Martins P, et al. Phase Angle Is a Marker of Muscle Quantity and Strength in Overweight/Obese Former Athletes. International Journal of Environmental Research and Public Health. 2021; 18(12):6649. https://doi.org/10.3390/ijerph18126649
Chicago/Turabian StyleMatias, Catarina N., Francesco Campa, Catarina L. Nunes, Rubén Francisco, Filipe Jesus, Miguel Cardoso, Maria J. Valamatos, Pedro Mil Homens, Luís B. Sardinha, Paulo Martins, and et al. 2021. "Phase Angle Is a Marker of Muscle Quantity and Strength in Overweight/Obese Former Athletes" International Journal of Environmental Research and Public Health 18, no. 12: 6649. https://doi.org/10.3390/ijerph18126649