
A Vegan Diet Is Associated with a Significant Reduction in Dietary Acid Load: Post Hoc Analysis of a Randomized Controlled Trial in Healthy Individuals

 , , ,
, , , 
Abstract
:1. Introduction
2. Materials and Methods
2.1. Study Design
2.2. Dietary Acid Load Calculations
2.3. Statistical Analysis
3. Results
4. Discussion
5. Conclusions
Author Contributions
Funding
Institutional Review Board Statement
Informed Consent Statement
Data Availability Statement
Acknowledgments
Conflicts of Interest
References
- Remer, T. Acid-Base in Renal Failure: Influence of Diet on Acid-Base Balance. Semin. Dial. 2001, 13, 221–226. [Google Scholar] [CrossRef]
- Kahleova, H.; McCann, J.; Alwarith, J.; Rembert, E.; Tura, A.; Holubkov, R.; Barnard, N.D. A plant-based diet in overweight adults in a 16-week randomized clinical trial: The role of dietary acid load. Clin. Nutr. ESPEN 2021, 44, 150–158. [Google Scholar] [CrossRef]
- Lee, K.W.; Shin, D. Positive association between dietary acid load and future insulin resistance risk: Findings from the Korean Genome and Epidemiology Study. Nutr. J. 2020, 19, 137. [Google Scholar] [CrossRef]
- Hayhoe, R.P.G.; Abdelhamid, A.; Luben, R.N.; Khaw, K.-T.; Welch, A.A. Dietary acid–base load and its association with risk of osteoporotic fractures and low estimated skeletal muscle mass. Eur. J. Clin. Nutr. 2020, 74, 33–42. [Google Scholar] [CrossRef]
- Daneshzad, E.; Haghighatdoost, F.; Azadbakht, L. Dietary acid load and cardiometabolic risk factors: A systematic review and meta-analysis of observational studies. Public Health Nutr. 2019, 22, 2823–2834. [Google Scholar] [CrossRef]
- Rebholz, C.M.; Coresh, J.; Grams, M.; Steffen, L.M.; Anderson, C.A.; Appel, L.J.; Crews, D.C. Dietary Acid Load and Incident Chronic Kidney Disease: Results from the ARIC Study. Am. J. Nephrol. 2015, 42, 427–435. [Google Scholar] [CrossRef] [Green Version]
- Daneshzad, E.; Keshavarz, S.-A.; Qorbani, M.; Larijani, B.; Bellissimo, N.; Azadbakht, L. Association of dietary acid load and plant-based diet index with sleep, stress, anxiety and depression in diabetic women. Br. J. Nutr. 2019, 123, 901–912. [Google Scholar] [CrossRef]
- Osuna-Padilla, I.; Leal-Escobar, G.; Garza-García, C.; Rodríguez-Castellanos, F. Carga ácida de la dieta; mecanismos y evidencia de sus repercusiones en la salud. Nefrologia 2019, 39, 343–354. [Google Scholar] [CrossRef] [PubMed]
- Adeva, M.M.; Souto, G. Diet-induced metabolic acidosis. Clin. Nutr. 2011, 30, 416–421. [Google Scholar] [CrossRef] [PubMed]
- Cosgrove, K.; Johnston, C.S. Examining the Impact of Adherence to a Vegan Diet on Acid-Base Balance in Healthy Adults. Plant Foods Hum. Nutr. 2017, 72, 308–313. [Google Scholar] [CrossRef] [PubMed]
- McCarty, M.F.; Barroso-Aranda, J.; Contreras, F. The low-methionine content of vegan diets may make methionine restriction feasible as a life extension strategy. Med. Hypotheses 2009, 72, 125–128. [Google Scholar] [CrossRef] [PubMed]
- Scialla, J.J.; Anderson, C.A.M. Dietary Acid Load: A Novel Nutritional Target in Chronic Kidney Disease? Adv. Chronic Kidney Dis. 2013, 20, 141–149. [Google Scholar] [CrossRef] [PubMed] [Green Version]
- Fagherazzi, G.; Vilier, A.; Bonnet, F.; Lajous, M.; Balkau, B.; Boutron-Ruault, M.-C.; Clavel-Chapelon, F. Dietary acid load and risk of type 2 diabetes: The E3N-EPIC cohort study. Diabetologia 2013, 57, 313–320. [Google Scholar] [CrossRef] [Green Version]
- Remer, T.; Manz, F. Potential Renal Acid Load of Foods and its Influence on Urine pH. J. Am. Diet. Assoc. 1995, 95, 791–797. [Google Scholar] [CrossRef]
- Engberink, M.F.; Bakker, S.J.; Brink, E.J.; van Baak, M.A.; van Rooij, F.J.; Hofman, A.; Witteman, J.C.; Geleijnse, J.M. Dietary acid load and risk of hypertension: The Rotterdam Study. Am. J. Clin. Nutr. 2012, 95, 1438–1444. [Google Scholar] [CrossRef] [PubMed] [Green Version]
- Ströhle, A.; Waldmann, A.; Koschizke, J.; Leitzmann, C.; Hahn, A. Diet-Dependent Net Endogenous Acid Load of Vegan Diets in Relation to Food Groups and Bone Health-Related Nutrients: Results from the German Vegan Study. Ann. Nutr. Metab. 2011, 59, 117–126. [Google Scholar] [CrossRef]
- Knurick, J.R.; Johnston, C.S.; Wherry, S.J.; Aguayo, I. Comparison of Correlates of Bone Mineral Density in Individuals Ad-hering to Lacto-Ovo, Vegan, or Omnivore Diets: A Cross-Sectional Investigation. Nutrients 2015, 7, 3416–3426. [Google Scholar] [CrossRef] [Green Version]
- Deriemaeker, P.; Aerenhouts, D.; Hebbelinck, M.; Clarys, P. Nutrient Based Estimation of Acid-Base Balance in Vegetarians and Non-vegetarians. Plant Foods Hum. Nutr. 2010, 65, 77–82. [Google Scholar] [CrossRef]
- Lederer, A.-K.; Hannibal, L.; Hettich, M.; Behringer, S.; Spiekerkoetter, U.; Steinborn, C.; Gründemann, C.; Zimmermann-Klemd, A.M.; Müller, A.; Simmet, T.; et al. Vitamin B12 Status Upon Short-Term Intervention with a Vegan Diet—A Randomized Controlled Trial in Healthy Participants. Nutrients 2019, 11, 2815. [Google Scholar] [CrossRef] [Green Version]
- Kohnert, E.; Kreutz, C.; Binder, N.; Hannibal, L.; Gorkiewicz, G.; Müller, A.; Storz, M.A.; Huber, R.; Lederer, A.-K. Changes in Gut Microbiota after a Four-Week Intervention with Vegan vs. Meat-Rich Diets in Healthy Participants: A Randomized Con-trolled Trial. Microorganisms 2021, 9, 727. [Google Scholar] [CrossRef]
- Beyer, I.; Mets, T.; Bautmans, I. Chronic low-grade inflammation and age-related sarcopenia. Curr. Opin. Clin. Nutr. Metab. Care 2012, 15, 12–22. [Google Scholar] [CrossRef]
- Saltiel, A.R.; Olefsky, J.M. Inflammatory mechanisms linking obesity and metabolic disease. J. Clin. Investig. 2017, 127, 1–4. [Google Scholar] [CrossRef]
- Kluthe, B. Freiburger Ernaehrungsprotokoll. Available online: www.ernaehrung.de/static/pdf/freiburger-ernaehrungsprotokoll.pdf (accessed on 20 July 2021).
- Willett, W. Nutritional Epidemiology, 3rd ed.; Oxford University Press: New York, NY, USA, 2013. [Google Scholar]
- Deutsche Gesellschaft für Ernährung. Vollwertige Ernährung. 2018. Available online: https://www.dge.de/ernaehrungspraxis/vollwertige-ernaehrung/ (accessed on 20 July 2021).
- Frassetto, L.A.; Todd, K.M.; Morris, R.C.; Sebastian, A. Estimation of Net Endogenous Noncarbonic Acid Production in Hu-mans from Diet Potassium and Protein Contents. Am. J. Clin. Nutr. 1998, 68, 576–583. [Google Scholar] [CrossRef] [PubMed] [Green Version]
- Remer, T.; Dimitriou, T.; Manz, F. Dietary potential renal acid load and renal net acid excretion in healthy, free-living children and adolescents. Am. J. Clin. Nutr. 2003, 77, 1255–1260. [Google Scholar] [CrossRef] [PubMed] [Green Version]
- Frassetto, L.A.; Lanham-New, S.A.; Macdonald, H.M.; Remer, T.; Sebastian, A.; Tucker, K.; Tylavsky, F.A. Standardizing Terminology for Estimating the Diet-Dependent Net Acid Load to the Metabolic System. J. Nutr. 2007, 137, 1491–1492. [Google Scholar] [CrossRef] [PubMed] [Green Version]
- R Core Team. R: A Language and Environment for Statistical Computing; R Foundation for Statistical Computing: Vienna, Austria, 2015; Available online: https://www.R-project.org/ (accessed on 15 September 2020).
- Dehghan, P.; Farhangi, M.A. Dietary Acid Load, Blood Pressure, Fasting Blood Sugar and Biomarkers of Insulin Resistance among Adults: Findings from an Updated Systematic Review and Meta-Analysis. Int. J. Clin. Pract. 2020, 74, e13471. [Google Scholar] [CrossRef]
- Jayedi, A.; Shab-Bidar, S. Dietary acid load and risk of type 2 diabetes: A systematic review and dose–response meta-analysis of prospective observational studies. Clin. Nutr. ESPEN 2018, 23, 10–18. [Google Scholar] [CrossRef]
- Arisawa, K.; Katsuura-Kamano, S.; Uemura, H.; Van, T.N.; Hishida, A.; Tamura, T.; Kubo, Y.; Tsukamoto, M.; Tanaka, K.; Hara, M.; et al. Association of Dietary Acid Load with the Prevalence of Metabolic Syndrome among Participants in Baseline Survey of the Japan Multi-Institutional Collaborative Cohort Study. Nutrients 2020, 12, 1605. [Google Scholar] [CrossRef] [PubMed]
- Ko, B.-J.; Chang, Y.; Ryu, S.; Kim, E.M.; Lee, M.Y.; Hyun, Y.Y.; Lee, K.-B. Dietary acid load and chronic kidney disease in elderly adults: Protein and potassium intake. PLoS ONE 2017, 12, e0185069. [Google Scholar] [CrossRef] [Green Version]
- Jafari, A.; Ghanbari, M.; Shahinfar, H.; Bellissimo, N.; Azadbakht, L. The association between dietary acid load with cardiometabolic risk factors and inflammatory markers amongst elderly men: A cross-sectional study. Int. J. Clin. Pract. 2021, 75, e14109. [Google Scholar] [CrossRef]
- D’Alessandro, C.; Piccoli, G.B.; Cupisti, A. The “phosphorus pyramid”: A visual tool for dietary phosphate management in dialysis and CKD patients. BMC Nephrol. 2015, 16, 9. [Google Scholar] [CrossRef] [PubMed]
- Sobiecki, J.G.; Appleby, P.N.; Bradbury, K.E.; Key, T.J. High compliance with dietary recommendations in a cohort of meat eaters, fish eaters, vegetarians, and vegans: Results from the European Prospective Investigation into Cancer and Nutrition–Oxford study. Nutr. Res. 2016, 36, 464–477. [Google Scholar] [CrossRef] [PubMed] [Green Version]
- Allès, B.; Baudry, J.; Méjean, C.; Touvier, M.; Péneau, S.; Hercberg, S.; Kesse-Guyot, E. Comparison of Sociodemographic and Nutritional Characteristics between Self-Reported Vegetarians, Vegans, and Meat-Eaters from the NutriNet-Santé Study. Nutrients 2017, 9, 1023. [Google Scholar] [CrossRef] [PubMed]
- Carnauba, R.A.; Baptistella, A.B.; Paschoal, V.; Hübscher, G.H. Diet-Induced Low-Grade Metabolic Acidosis and Clinical Outcomes: A Review. Nutrients 2017, 9, 538. [Google Scholar] [CrossRef] [Green Version]
- Gannon, R.H.T.; Millward, D.J.; Brown, J.E.; Macdonald, H.M.; Lovell, D.P.; Frassetto, L.A.; Remer, T.; Lanham-New, S.A. Estimates of daily net endogenous acid production in the elderly UK population: Analysis of the National Diet and Nutrition Survey (NDNS) of British adults aged 65 years and over. Br. J. Nutr. 2008, 100, 615–623. [Google Scholar] [CrossRef] [Green Version]
- Pérez Rodrigo, C.; Aranceta, J.; Salvador, G.; Varela-Moreiras, G. Food Frequency Questionnaires. Nutr. Hosp. 2015, 31, 49–56. [Google Scholar] [CrossRef]
- Dyett, P.; Rajaram, S.; Haddad, E.H.; Sabaté, J. Evaluation of a Validated Food Frequency Questionnaire for Self-Defined Vegans in the United States. Nutrients 2014, 6, 2523–2539. [Google Scholar] [CrossRef] [Green Version]
- Storz, M.A. The Role of Vegan Diets in Lipotoxicity-induced Beta-cell Dysfunction in Type-2-Diabetes: A Narrative Review. J. Popul. Ther. Clin. Pharmacol. 2020, 27, e22–e38. [Google Scholar] [CrossRef]
- Najjar, R.S.; Feresin, R.G. Plant-Based Diets in the Reduction of Body Fat: Physiological Effects and Biochemical Insights. Nutrients 2019, 11, 2712. [Google Scholar] [CrossRef] [Green Version]
- Klementova, M.; Thieme, L.; Haluzik, M.; Pavlovicova, R.; Hill, M.; Pelikanova, T.; Kahleova, H. A Plant-Based Meal Increases Gastrointestinal Hormones and Satiety More Than an Energy- and Macronutrient-Matched Processed-Meat Meal in T2D, Obese, and Healthy Men: A Three-Group Randomized Crossover Study. Nutrients 2019, 11, 157. [Google Scholar] [CrossRef] [Green Version]
- Alam, I.; Ibrar, A.; Pawelec, G.; Paracha, P. Higher estimates of daily dietary net endogenous acid production (NEAP) in the elderly as compared to the young in a healthy, free-living elderly population of Pakistan. Clin. Interv. Aging 2012, 7, 565–573. [Google Scholar] [CrossRef] [PubMed] [Green Version]


| Variable | Vegan Diet Group (n = 23) | Meat-Rich Diet Group (n = 22) | p-Value |
|---|---|---|---|
| Gender | 0.098 | ||
| Male | n = 6 | n = 11 | |
| Female | n = 17 | n = 11 | |
| Age (years) | 30 (11.45) | 26.5 (11.25) | 0.241 |
| Weight (kg) | 68.73 ± 11.18 | 69.35 ± 13.30 | 0.864 |
| Height (cm) | 172.26 ± 9.20 | 173.45 ± 10.93 | 0.693 |
| Body mass index (kg/m2) | 22 (2.10) | 23.00 (3.15) | 0.937 |
| Variable | Vegan Diet Group (Total n = 23) | Meat-Rich Diet Group (Total n = 22) | p-Value |
|---|---|---|---|
| Run-in-phase | |||
| Total Energy Intake (kcal/d) a | 2085.00 (770) | 2220.50 (955.75) | 0.930 “†” |
| Protein intake (g/d) b | 81.66 (26.73) | 90.62 (42.31) | 0.974 |
| Potassium intake (mg/d) c | 3613.74 (1027.26) | 3495.24 (802.91) | 0.998 “†” |
| Magnesium intake (mg/d) d | 380.12 (143.95) | 375.77 (151.93) | 0.999 |
| Calcium intake (mg/d) e | 862.40 (457.99) | 876.11 (423.48) | 0.989 |
| Phosphorus intake (mg/d) f | 1238.74 (318.50) | 1453.64 (485.57) | 0.956 |
| Week 3 | |||
| Total Energy Intake (kcal/d) a | 1811 (1274) | 2083.5 (1034) | 0.811 “†” |
| Protein intake (g/d) b | 61.28 (51.11) | 99.30 (42.76) | <0.001 |
| Potassium intake (mg/d) c | 3936.49 (2841.44) | 3048.58 (975.41) | 0.486 “†” |
| Magnesium intake (mg/d) d | 390.01 (321.39) | 325.54 (178.19) | 0.314 |
| Calcium intake (mg/d) e | 478 (355.73) | 871.12 (531.97) | 0.059 |
| Phosphorus intake (mg/d) f | 918.99 (756.64) | 1375.69 (597.34) | 0.096 |
| Week 4 | |||
| Total Energy Intake (kcal/d) a | 2137.30 ± 866.952 | 2401.36 ± 868.155 | 0.895 “†” |
| Protein intake (g/d) b | 67.10 ± 30.05 | 110.44 ± 39.72 | <0.001 |
| Potassium intake (mg/d) c | 3842.08 ± 1747.23 | 3444.42 ± 1102.35 | 0.990 “†” |
| Magnesium intake (mg/d) d | 463.33 ± 216.77 | 384.33 ± 157.48 | 0.767 |
| Calcium intake (mg/d) e | 515.42 (372.28) | 917.38 (558.34) | 0.003 |
| Phosphorus intake (mg/d) f | 1122.06 ± 509.82 | 1595.65 ± 620.08 | 0.015 |
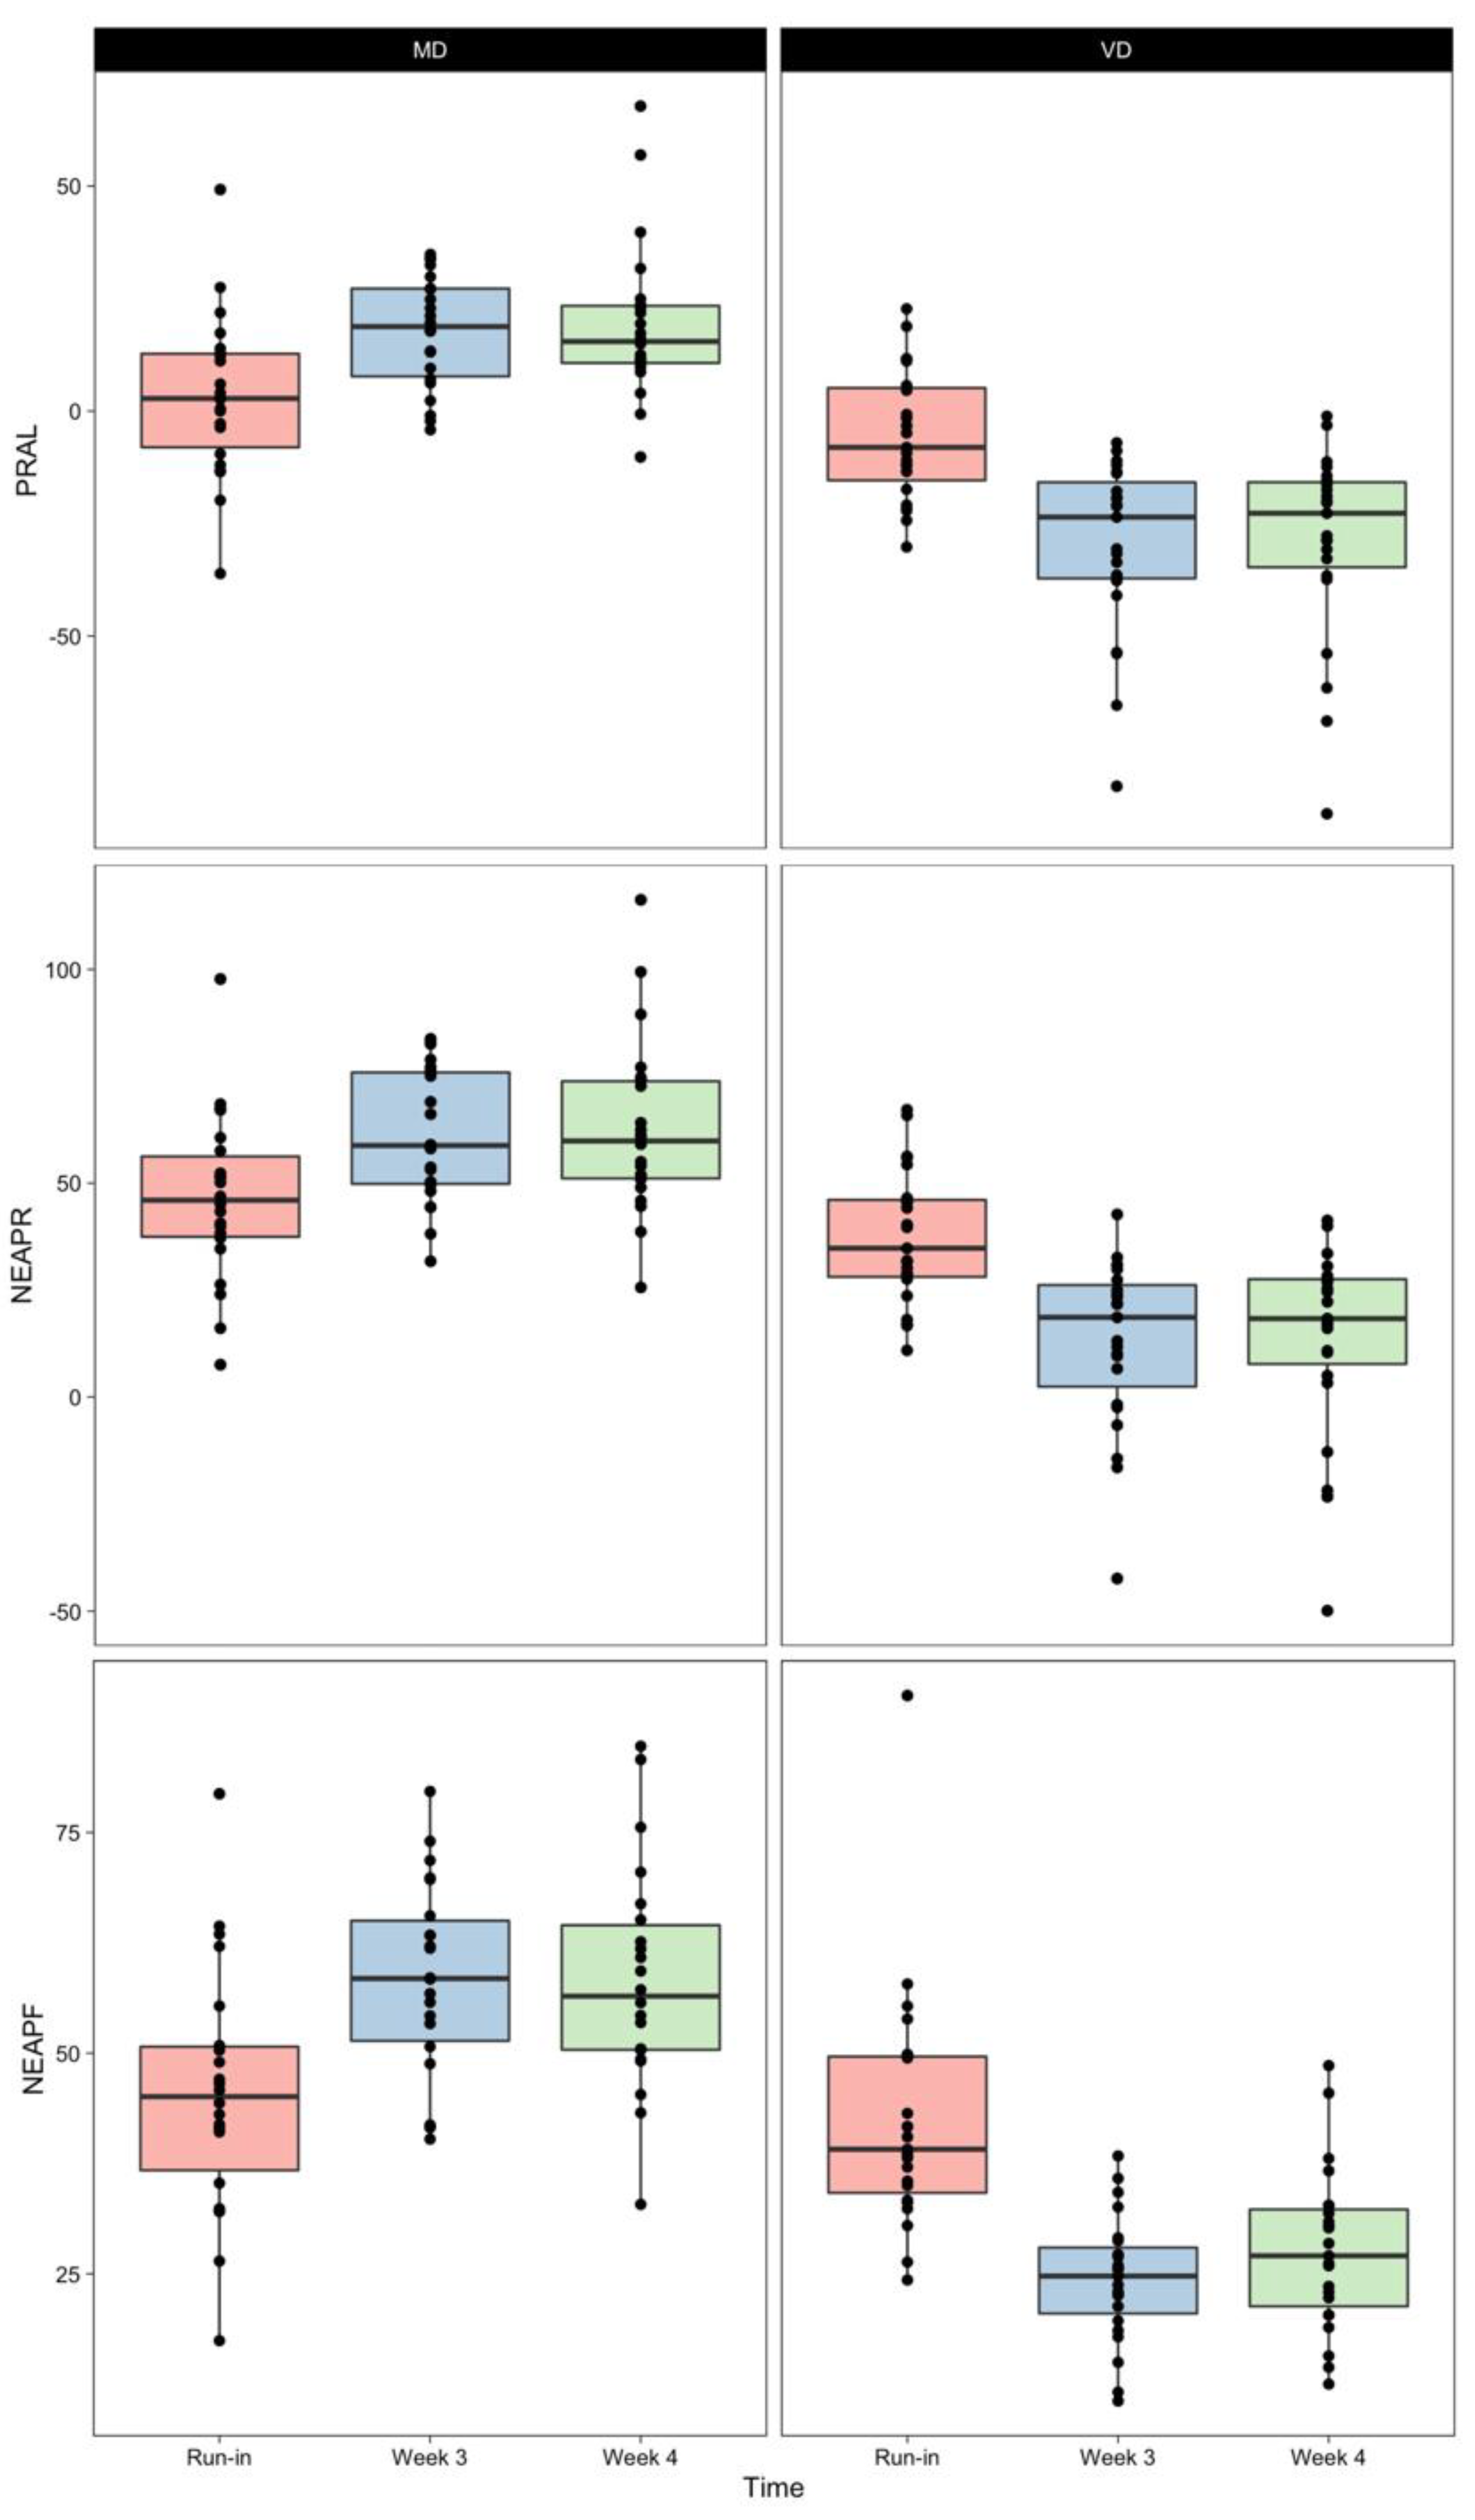
| Variable | Vegan Diet Group (Total n = 23) | Meat-Rich Diet Group (Total n = 22) | p-Value |
|---|---|---|---|
| Run-in-phase | |||
| PRAL (mEq/day) a | −5.26 ± 4.45 | 3.26 ± 17.91 | 0.492 |
| NEAPR (mEq/day) b | 37.45 ± 15.73 | 46.57 ± 19.69 | 0.574 |
| NEAPF (mEq/day) c | 39.11 (16.45) | 45.07 (17.44) | 0.944 |
| Week 3 | |||
| PRAL (mEq/day) a | −23.57 (23.87) | 18.78 (21.04) | <0.001 |
| NEAPR (mEq/day) b | 12.85 ± 19.71 | 60.93 ± 15.51 | <0.001 |
| NEAPF (mEq/day) c | 24.39 ± 7.1 | 58.32 ± 11.19 | <0.001 |
| Week 4 | |||
| PRAL (mEq/day) a | −22.71 (21.25) | 15.47 (13.51) | <0.001 |
| NEAPR (mEq/day) b | 18.31 (22.83) | 59.87 (23.91) | <0.001 |
| NEAPF (mEq/day) c | 27.65 ± 9.1 | 58.29 ± 12.67 | <0.001 |
Publisher’s Note: MDPI stays neutral with regard to jurisdictional claims in published maps and institutional affiliations. |
© 2021 by the authors. Licensee MDPI, Basel, Switzerland. This article is an open access article distributed under the terms and conditions of the Creative Commons Attribution (CC BY) license (https://creativecommons.org/licenses/by/4.0/).
Share and Cite
Müller, A.; Zimmermann-Klemd, A.M.; Lederer, A.-K.; Hannibal, L.; Kowarschik, S.; Huber, R.; Storz, M.A. A Vegan Diet Is Associated with a Significant Reduction in Dietary Acid Load: Post Hoc Analysis of a Randomized Controlled Trial in Healthy Individuals. Int. J. Environ. Res. Public Health 2021, 18, 9998. https://doi.org/10.3390/ijerph18199998
Müller A, Zimmermann-Klemd AM, Lederer A-K, Hannibal L, Kowarschik S, Huber R, Storz MA. A Vegan Diet Is Associated with a Significant Reduction in Dietary Acid Load: Post Hoc Analysis of a Randomized Controlled Trial in Healthy Individuals. International Journal of Environmental Research and Public Health. 2021; 18(19):9998. https://doi.org/10.3390/ijerph18199998
Chicago/Turabian StyleMüller, Alexander, Amy Marisa Zimmermann-Klemd, Ann-Kathrin Lederer, Luciana Hannibal, Stefanie Kowarschik, Roman Huber, and Maximilian Andreas Storz. 2021. "A Vegan Diet Is Associated with a Significant Reduction in Dietary Acid Load: Post Hoc Analysis of a Randomized Controlled Trial in Healthy Individuals" International Journal of Environmental Research and Public Health 18, no. 19: 9998. https://doi.org/10.3390/ijerph18199998