2. Non-life Insurance Industry in Turkey
The insurance industry constitutes one of the fundamental building blocks of the global financial system. The importance given to insurance has been increasing every day in both developed and developing countries. The basic reason for this is the contribution provided by the insurance industry on the economic growth process and on the level of national wealth (Öner Kaya [
1]). By the end of 2013, direct premiums written in the global insurance industry amounted to USD 4641 billion. Of this figure, 56.2% (USD 2608 billion) comprise premiums collected under life insurance, and 43.8% (USD 2033 billion) under non-life insurance. In Turkey, as of the end of 2013, the direct premium volume of the insurance industry was realized at USD 12.5 billion. Around 86% of the total premium volume (USD 10.7 billion) comprise premiums generated from non-life insurance, and the remaining 14% (USD 1.8 billion) from premiums generated in life insurance (Swiss Re [
2]).
Some international indicators could be used for measuring the level of development of the insurance industry. Premium volume, premiums per capita, and premiums in % of gross domestic product (GDP) are among the leading indicators. When the Turkish insurance industry was evaluated in line with these indicators, as of the end of 2013, the following were observed (Swiss Re [
2]):
Turkey’s share in the world direct premium volume was realized at 0.27% (0.53% in non-life insurance and 0.07% in life insurance).
Premiums in % of GDP, which is also known as insurance penetration, was 6.3% overall, in the world, while it was 1.5% in Turkey.
Premiums per capita, which is also known as insurance density, was USD 652 in the world, while it was USD 166 in Turkey.
All these data demonstrate that the Turkish insurance industry has a small share in the global insurance industry in terms of premium volume, premiums per capita, and premiums in % of GDP.
In Turkey, as of the end of 2013, gross domestic product (GDP) amounted to USD 821 billion. Real change in gross domestic product in 2013 was realized at 4.2% (Swiss Re [
2]). Additionally, at the end of 2013, GDP per capita has reached to USD 10,712 with a 2.5% increase over the previous year (the Undersecretariat of Treasury [
3]).
As of 2013 year-end, in total, 61 insurance, pension, and reinsurance companies operate in Turkey. Out of 61, 36 of these companies are non-life insurance, 6 are life insurance, and 18 are pension companies. There is also one active reinsurance company. From 61 insurance, reinsurance, and pension companies actively operating in Turkey, 58 of them are joint-stock companies, one is a cooperative company, and two are branches of international companies (the Undersecretariat of Treasury [
3]).
The Turkish insurance industry has a great growth potential due to its low penetration rate despite the young population. This situation increases the interest of foreign investors in the Turkish insurance market. Indeed, the number of internationally shared insurance companies has reached 44 at the end of 2013. Of which, 26 of the 36 active non-life insurance companies and 18 of the 24 active life and pension companies have international capital directly or indirectly. The share of international capital is 50% or above in 39 of these companies. Moreover, at the end of 2013, the share of international capital reached 63.46% as of premium production overall, and 71.94% in terms of total paid-in capital (the Undersecretariat of Treasury [
3]).
Parallel with the global insurance market, there are two basic insurance groups, life insurance and non-life insurance, according to the Turkish Insurance Regulation (the Undersecretariat of Treasury [
3]). Since 1998, insurance companies have been obliged to act either in the life or non-life insurance groups. According to the Insurance Law (No.: 5684) that came into effect in 2007, non-life insurance companies started to operate in some or all 18 non-life insurance branches, and life insurance companies started to operate in some or all eight life insurance branches as at 1 January 2008 (the Undersecretariat of Treasury [
3]).
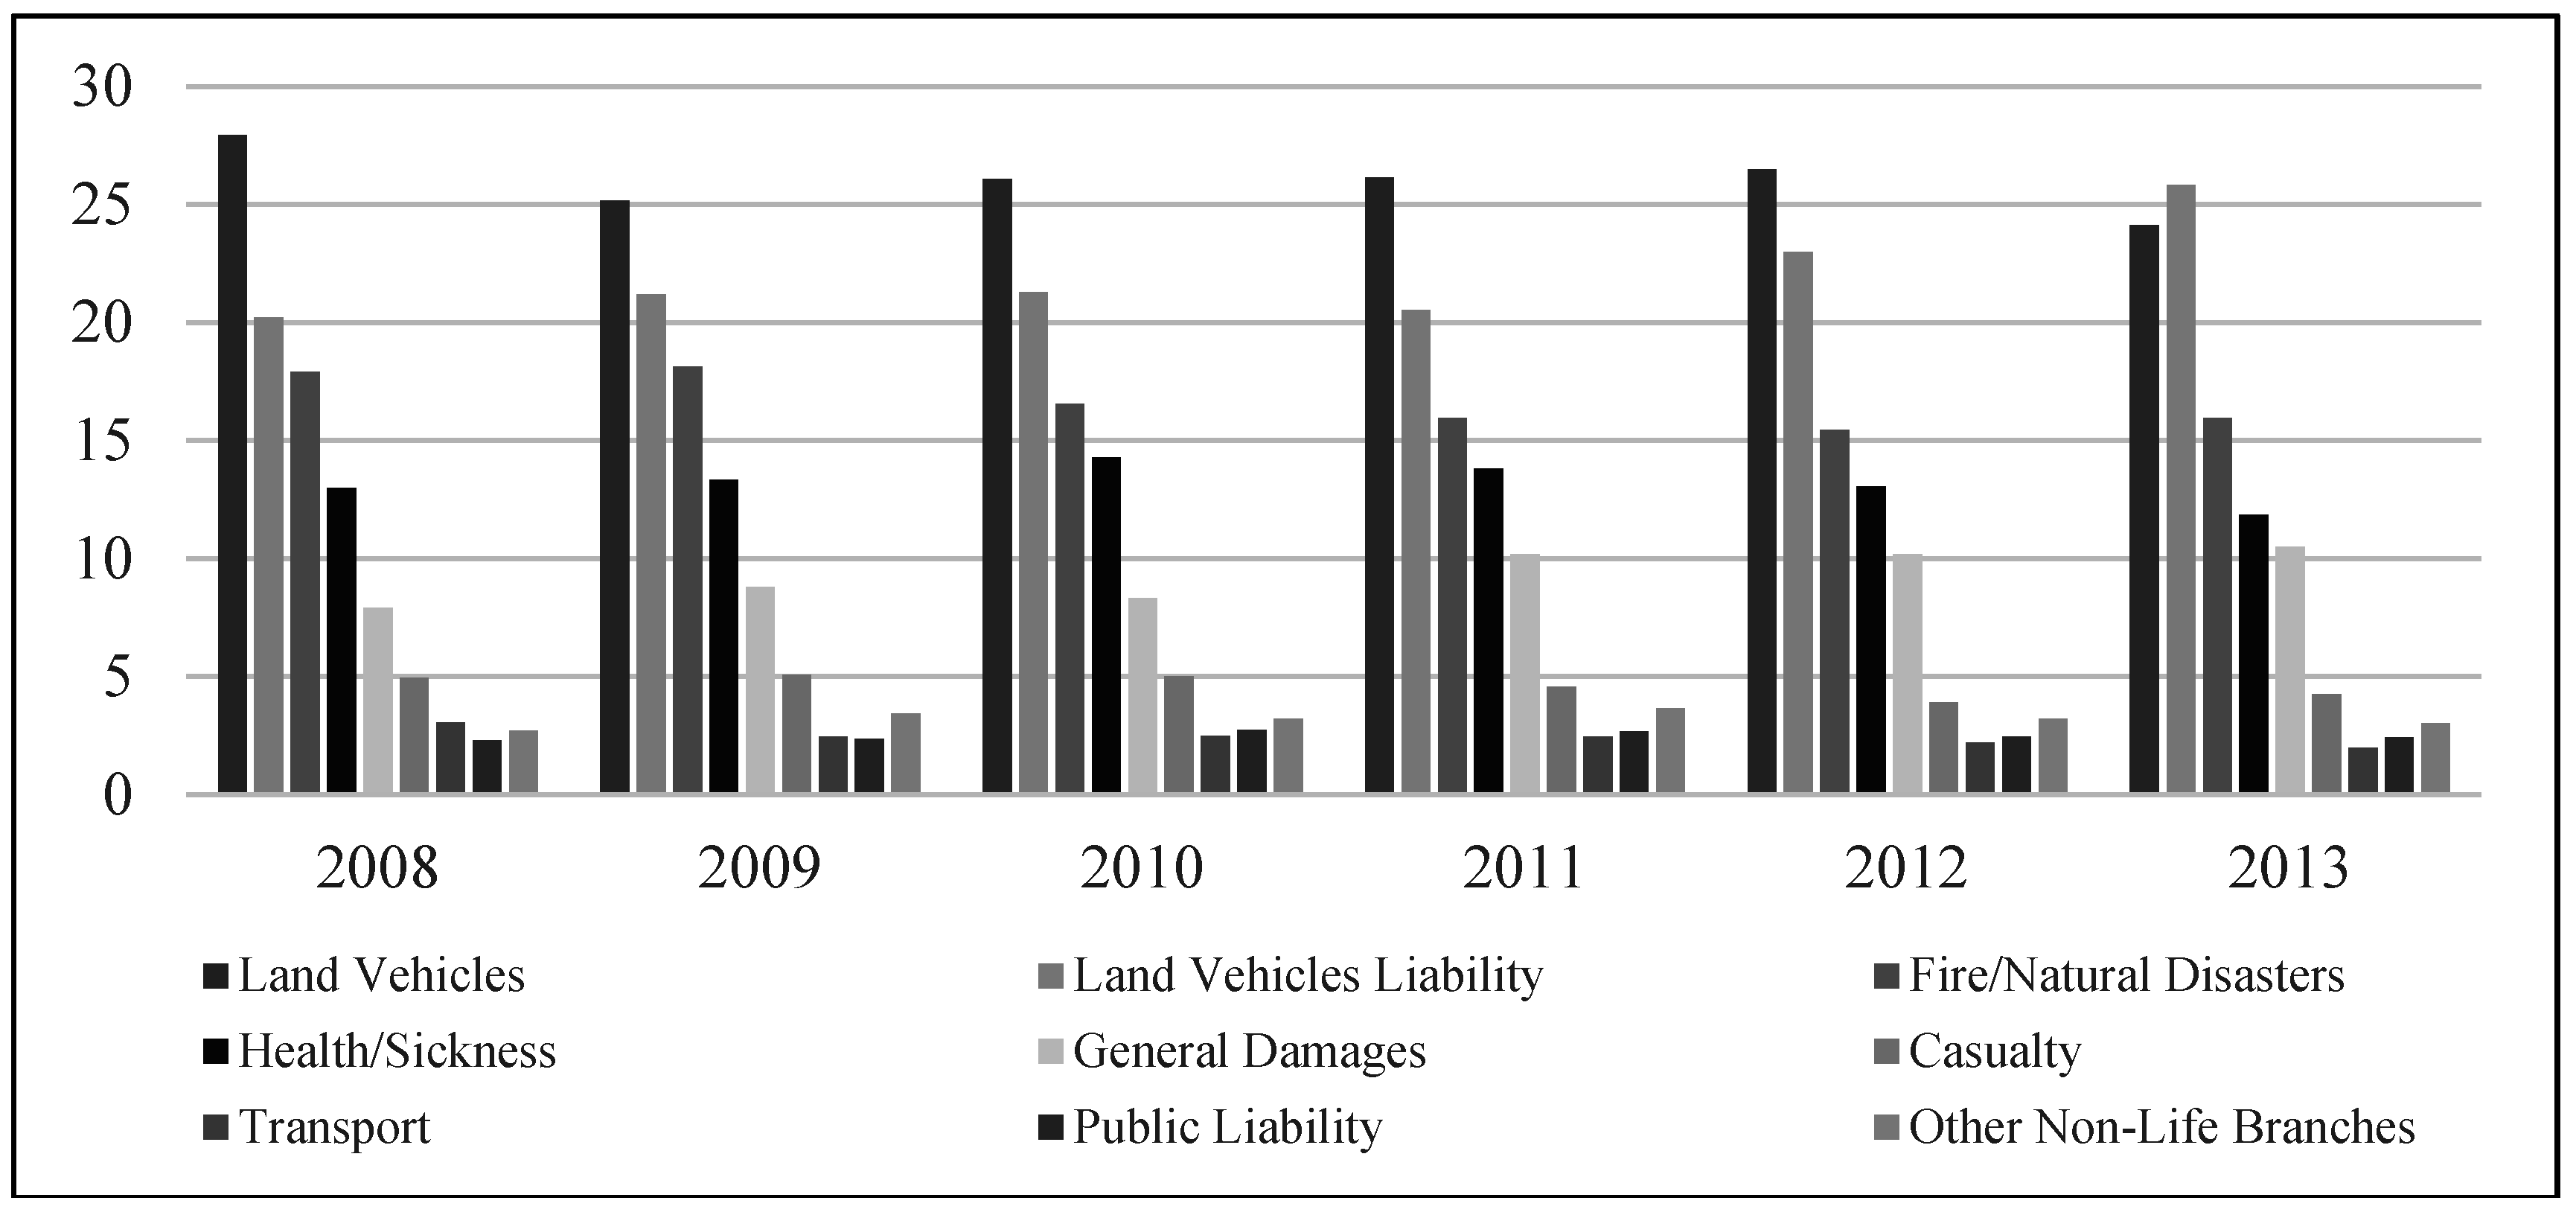
Figure 1 shows the share of non-life insurance branches in total non-life insurance premiums generated in Turkey for the period 2008–2013.
Figure 1.
The share of premium for each non-life insurance branch in the Turkish non-life insurance industry (%). Source: own graphic based on the Undersecretariat of Treasury’s Annual Reports about Insurance and Private Pension Activities (the Undersecretariat of Treasury [
3,
4,
5,
6]).
Figure 1.
The share of premium for each non-life insurance branch in the Turkish non-life insurance industry (%). Source: own graphic based on the Undersecretariat of Treasury’s Annual Reports about Insurance and Private Pension Activities (the Undersecretariat of Treasury [
3,
4,
5,
6]).
Analysis of the total non-life premium production per branch in Turkey for the period 2008–2013 shows that the share of premium for each branch of land vehicles, land vehicle liability, fire/natural disasters, health/sickness, and general damages exceeds 5% in total non-life insurance premium generated in each year. Additionally, motor insurance (including land vehicle and land vehicle liability branches) accounts for approximately half of the premiums written in non-life business in each year for the period 2008–2013 (the Undersecretariat of Treasury [
3]). In other words, motor insurance continues to keep its weight in the non-life premium portfolio of the Turkish insurance industry. On the other hand, the share of other non-life branches in total non-life premium production is quite low.
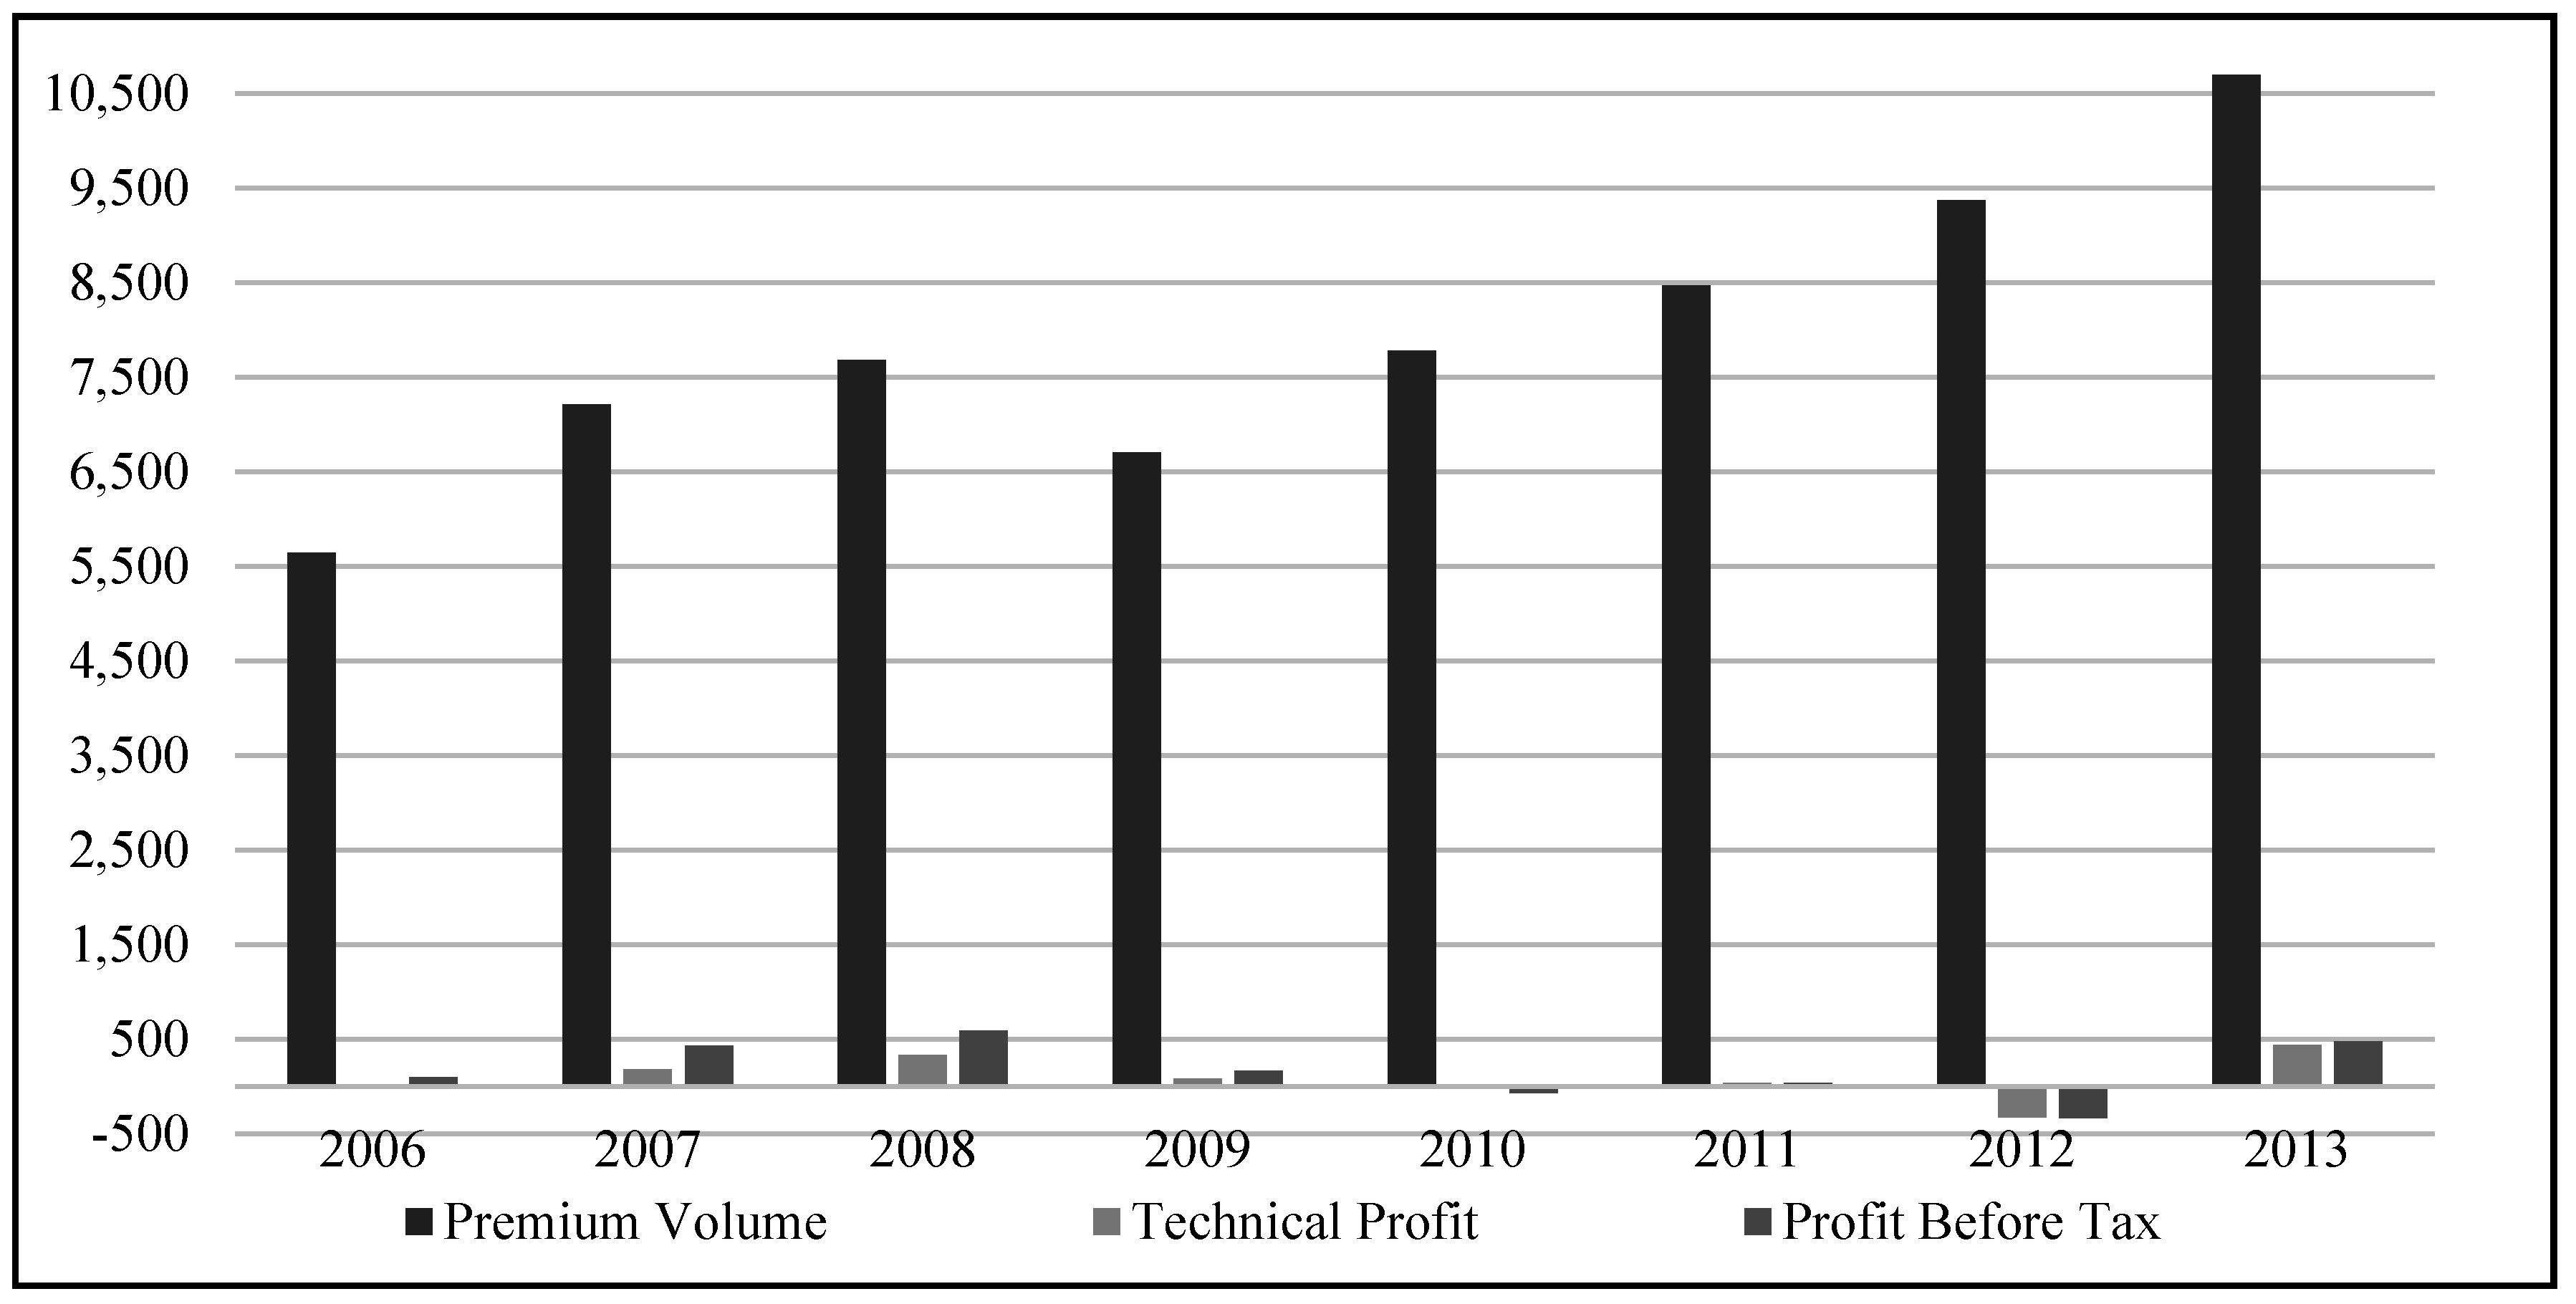
For the period 2006–2013, the indicators relating to the financial performance of the Turkish non-life insurance industry are shown in
Figure 2.
Figure 2.
Financial performance of the non-life insurance industry in Turkey for the period of 2006–2013 (in millions of USD). Source: own graphic based on the Undersecretariat of Treasury’s Annual Reports about Insurance and Private Pension Activities (the Undersecretariat of Treasury [
3,
4,
5,
6]).
Accordingly, the financial performance of non-life insurance companies has shown fluctuating trend between the years of 2006 and 2013. The total technical profit and total profit before tax for non-life insurance companies have increased significantly compared with the previous year in 2013, reaching USD 438.1 million and USD 476.5 million, respectively.
3. Literature Review
Relevant previous studies relating to the determinants of the profitability of insurance companies are as follows:
By using panel data for the years 1993 through 1997, Adams and Buckle [
7] have examined empirically the determinants of corporate financial performance among insurance/reinsurance companies operating in Bermuda. The independent variables used in this study are company size, underwriting risk, leverage, liquidity, type of company, and scope of operations. According to the results, financial performance is positively and significantly influenced by the leverage, type of company, and underwriting risk. In contrast, liquidity has a negative and significant impact on financial performance. Additionally, company size and scope of operations are not significantly correlated with financial performance.
Using the data of all insurance companies listed on the Amman Stock Exchange during 2002–2007, Almajali
et al. [
8] have investigated the factors that affect the financial performance of Jordanian insurance companies. In this study, the financial performance of insurance companies is measured by return on assets (ROA). The results of regression analysis reveal that liquidity, leverage, size of the company, and management competence index have a significant and positive effect on the financial performance of Jordanian insurance companies. Results also suggest that there is no significant relationship between the age of the company and ROA.
Burca and Batrînca [
9] have investigated the factors that influence the financial performance of 21 insurance companies operating in the Romanian insurance market during the interval 2008–2012. For this purpose, 13 explanatory variables have been empirically tested: financial leverage in insurance, company size, number of years of operations in the Romanian market, growth of gross written premiums, equity, total market share, diversification, underwriting risk, investment ratio, reinsurance dependence, retained risk ratio, solvency margin, and growth of GDP/capita. As an indicator of the financial performance, the return on total assets ratio has been used. By applying specific panel data techniques, the authors have shown that the determinants of the financial performance in the Romanian insurance market are financial leverage in insurance, company size, growth of gross written premiums, underwriting risk, risk retention ratio, and solvency margin.
Chidambaran
et al. [
10] have analyzed the economic performance of U.S. property-liability insurance industry for the period 1984–1993. The results of the analysis reveal that the concentration ratio for the line and the share of direct writers in the line are both significant determinants of insurers’ performance.
Ćurak
et al. [
11] have investigated both the firm-specific and economic characteristics as determinants of the Croatian composite insurance companies’ financial performance during the period from 2004 to 2009. Based on the results of panel data analysis, the authors have shown that size, underwriting risk, inflation, and equity returns have a significant influence on the insurance companies’ performance, which is measured by ROA.
Doğan [
12] has examined the influence of firm-specific factors (loss ratio, leverage ratio, liquidity, size of the company, and age of the company) on the profitability of insurance companies listed on the Istanbul Stock Exchange for the period 2005–2011. According to the results of multiple regression and correlation methods used in the study, there is a positive and significant relationship between the size and profitability of insurance companies. However, profitability is influenced significantly and negatively by loss ratio, leverage ratio, current ratio, and age of the company.
Using the sample of 2176 property and casualty insurance companies operating in 91 countries between 2005 and 2009, Doumpos
et al. [
13] have examined the firm-specific and country-specific characteristics that affect the financial performance of non-life insurance companies. They have found that higher GDP growth, lower inflation rate, lower income inequality, and more developed stock markets increase the performance of property and casualty insurance companies.
Hrechaniuk
et al. [
14] have investigated the performance of Spanish, Lithuanian, and Ukrainian insurance companies at different periods. These three countries were chosen as representatives of the countries of the “old” EU, the “new” EU, and non-EU members, respectively. The research results indicate that there are systematic differences across these three countries’ insurance industries.
Kozak [
15] has analyzed the main factors which influence the profitability and cost efficiency of 25 non-life insurance companies in Poland during the period of financial integration with the European markets. The research covered the years 2002–2009. In this study, profitability and cost efficiency are measured by four different variables: profitability ratio of technical activity, profitability ratio of investment activity, sales profitability ratio, and net-operating expenses ratio. The results of the analysis indicate that the total gross written premiums collected by the company, the market share of the foreign-owned companies, and the growth of GDP positively affect the profitability and cost efficiency of non-life insurance companies. However, profitability is affected negatively by the level of the company’s operating costs, the share of motor insurance in the company’s portfolio, and the number of insurance classes offered by the company.
The study conducted by Lee [
16] primarily focuses on the investigation of the firm-specific factors and macroeconomics that affect the profitability of Taiwanese property-liability insurance companies. In this study, covering the period from 1999 to 2009, profitability is measured by operating ratio and ROA. According to the empirical results, operating ratio and ROA are affected significantly by the underwriting risk, reinsurance usage, input cost, return on investment, and a member of a financial holdings group. Additionally, the economic growth rate has a statistically significant relationship with operating ratio. The results also show that the market share has a negative and significant effect on operating ratio, while financial leverage is significantly and negatively related to ROA. Moreover, firm size, firm growth, diversification, and inflation rates are not significantly correlated with operating ratio and ROA.
Malik [
17] has investigated the firm-specific factors determining the profitability of 34 insurance companies in Pakistan during the period 2005–2009. Research results indicate that the volume of capital and the size of the company are positively and significantly related with profitability. However, loss ratio and leverage ratio show a significant and inverse relationship with profitability. In addition, it has been identified that there is no relationship between the age of the company and profitability.
To determine the factors affecting the financial performance of insurance companies in Ethiopia, Mehari and Aemiro [
18] have analyzed the impact of firm-specific factors (size of the company, leverage, tangibility of assets, loss ratio, growth in writing premium, liquidity, and age of the company) on the ROA of nine Ethiopian insurance companies during the period from 2005 to 2010. According to the results, the financial performance of Ethiopian insurance companies is significantly and positively influenced by the size of the company, tangibility of assets, and leverage, while loss ratio has a negative and significant influence on financial performance. The results also show that the age of the company, growth in writing premium, and liquidity are not significantly related to financial performance.
By using a dynamic panel model, Pervan
et al. [
19] have investigated the determinants of profitability in the Bosnia and Herzegovina insurance industry between the years of 2005–2010. According to their results, age of company, market share, and past performance are positively and significantly related with current profitability; and claims ratio has a negative and significant influence on profitability. They have also found that foreign-owned companies perform better than domestically owned companies; and there is no significant relationship between diversification and profitability.
Pervan and Pavić Kramarić [
20] have investigated the determinants of the Croatian non-life insurance companies’ profitability during the period from 2003 to 2009. The determinants of profitability, in other words, the chosen explanatory variables include insurance-specific, industry-specific, and macroeconomic variables. The results of the study indicate that ownership, expense ratio, and inflation have a negative and significant influence on profitability. However, past profitability has a positive and significant impact on Croatian non-life insurance companies’ profitability.
Shiu [
21] has analyzed the determinants of the general insurance companies’ performance over the period 1986–1999 in the United Kingdom. In this study, performance has been measured by three different indicators: investment yield, percentage change in shareholders’ funds, and return on shareholders’ funds. By empirically testing economic and company-specific variables, the author has revealed that liquidity, unexpected inflation, interest rate level, and underwriting profits are statistically significant determinants of UK’s general insurance companies’ performance.
4. Research Methodology
This section of the study describes the research design, including definition of the variables used in the analysis, the source of data, and the research model.
4.1. Definition of Variables
Two variables were used in this study as the profitability measure of non-life insurance companies. One of these is technical profitability ratio, and the other is sales profitability ratio. Technical profitability ratio assesses the effectiveness of the core insurance activities of the insurance company (Kozak [
15]). In this study, technical profitability ratio is calculated by dividing the technical profit to gross written premiums. Technical profit means the result generated from the core insurance activities of the insurance company. Sales profitability ratio associates net income before taxes obtained by the insurance company with gross written premiums, and in this study, it is calculated by dividing net income before taxes to gross written premiums.
Factors that affect the profitability of insurance companies could be divided into two groups, being internal and external factors. Internal factors mean the firm-specific variables, and external factors refer to the sector-specific and macroeconomic variables. When the profitability data for the period 2006–2013 of 24 non-life insurance companies included in the research were analyzed, large fluctuations were seen between insurance companies. These fluctuations could be interpreted in such a way that firm-specific factors are effective on the profitability of non-life insurance companies (Malik [
17]). For this reason, it is important that firm-specific factors affecting profitability be determined and the relationship between these factors and profitability be demonstrated.
Eight independent variables were tested in the study to determine the firm-specific factors that affect the profitability of non-life insurance companies that operate in Turkey. These are size of the company, age of the company, loss ratio, insurance leverage ratio, current ratio, premium growth rate, motor insurance, and premium retention ratio. All variables used in the analysis were selected taking into account the availability of data and relying on relevant theory and literature. Explanations related to these variables and the impact of each on the profitability of non-life insurance companies are detailed below.
Size of the Company: This has been used as an explanatory variable in many other studies which were conducted to determine factors that affect the profitability of insurance companies. In this study, the size of the company was measured with the natural logarithm of total assets. The logarithmic transformation helped eliminate extreme values in the data (Adams and Buckle [
7]). There are different opinions in relation to the impact of company size on profitability. Major insurance companies are expected to respond quickly to changes in the market conditions compared with small companies, diversify the risks they accept in an effective way, employ more qualified labor power in an easier way, and in particular, benefit from the economies of scale concerning labor cost (Shiu [
21]). However, companies which become bigger could also encounter problems related to inefficiency (Almajali
et al. [
8]). Besides, it generally becomes harder to monitor and control efficiently and effectively the aberrant behaviors of managers by owners of companies which become bigger (Adams and Buckle [
7]). Consequently, the theory is equivocal on the precise relationship between size and profitability (Majumdar [
22]). Accordingly, the expected effect of company size on profitability is unclear.
Age of the Company: In this study, age of the company represents the number of years during which the non-life insurance companies have been operating in the Turkish insurance industry. It is expected that in connection with the increase in years of operations for the insurance companies that operate in the industry, both their experiences in relation to the Turkish insurance industry and their reputation in the industry will also increase. Therefore, it is possible that there is a positive relationship between the company age and profitability. On the other hand, it is stated that depending on the increase in the age of the company, the company will lose its flexibility and will experience problems in harmonization with the rapidly changing environmental conditions (Sørensen and Stuart [
23]). In this situation, it is possible that there is a reverse relationship between the age of the company and profitability. Consequently, there is no prior expectation about the direction of the relationship between the age of the company and profitability.
Loss Ratio: This ratio is one of the most important performance criteria for insurance companies. Loss ratio, which is also expressed as the underwriting risk in the relevant literature, demonstrates the effectiveness of the underwriting activities of insurance companies. In this study, loss ratio is calculated by dividing the incurred claims with the earned premiums. In general, all insurance companies purpose that their premiums increase, and that the claims they are required to compensate decrease. Accordingly, the expected effect of loss ratio on profitability is negative.
Insurance Leverage Ratio: Insurance leverage is defined as reserves to surplus by Chen and Wong [
24]. This ratio demonstrates the potential impact of deficiencies in technical reserves due to occurrence of unexpected losses on the equity (Adams and Buckle [
7]). In this study, insurance leverage ratio is calculated by dividing the net technical reserves to the equity. Capital structure literature suggests that as the leverage increases up to an optimum point, so will the firm value and after surpassing this optimum level, the firm value will decline and the likelihood of insolvency will increase depending on the increased leverage (Carson and Hoyt [
25]). Therefore, it is expected that excessive insurance leverage may have a negative impact on profitability.
Current Ratio: Liquidity is the capability of an insurer to pay liabilities, which include operating expenses and payment for losses/benefits under insurance policies, when due (Chen and Wong [
24]). Liquidity ratios are used to measure a company’s ability to pay liabilities. Current ratio, which is one of the frequently used liquidity ratios, is calculated by dividing the current assets to short-term liabilities. Because the liquidity risk will decrease due to the increase in the current ratio, it is expected that there will be a reverse relationship between the current ratio and the profitability of non-life insurance companies.
Premium Growth Rate: In this study, premium growth rate is calculated using the following equation:
where GWP is the gross written premiums and
is the index of time periods (years). The main source of income earned by insurance companies resulting from insurance activities is the gross written premiums. The increase in premium growth rate will ensure the growth of the company and increase of its market share. On the other hand, excessive or poorly coordinated growth of premium volume causes or aggravates other risks that may endanger the company’s existence (Janotta-Simons [
26]). Insurance companies may have weak financial positions if underwriting is excessive, if risk selection or pricing is not done carefully, and if financial resources are insufficient to cover risk (Leflaive [
27]). Kim
et al. [
28] found that rapid growth of premium volume is one of the causal factors in insolvency. Therefore, being excessively obsessive about the increase in the volume of the gross written premiums especially in an economic downturn may lead to the negligence of other important targets and self-destruction (Chen and Wong [
24]). Consequently, it is expected that the increase in premium growth rate will increase the profitability of insurance companies together with a strong financial structure, suitable reinsurance policies, and a low loss ratio.
Motor Insurance: Motor insurance, which has a significant share in the non-life premium portfolio of the Turkish insurance industry, appears as an insurance in which competition is intense worldwide and insurance companies find it difficult to gain profit from this portfolio (Özer [
29]). It is possible to state that this situation arises from the high loss payments and marketing costs in motor insurance (Kozak [
15]) and the fact that companies make pricing according to the prices of competitive companies with the concern that they could lose market share (Öner Kaya [
1]). Within this framework, it is expected that there is a reverse relationship between the share of motor insurance in the insurance portfolio of a company and the company’s profitability. However, it is possible to make motor insurance profitable and sustainable with the correct pricing of risks and an effective damage and cost management.
Premium Retention Ratio: The insurance provided to insurance companies is expressed as reinsurance. Risks that are transferred to insurance companies from individuals and enterprises could be transferred to reinsurers from insurance companies through reinsurance (Öner Kaya [
1]). Reinsurance provides insurance companies with the ability to mitigate the impact of unexpected major losses, to ensure stability of earnings, and to increase underwriting capacities (Swiss Re [
30]). However, reinsurance also has a cost. For this reason, insurance companies are required to determine an appropriate retention level and establish a balance between decreasing insolvency risk and reducing potential profitability (Shiu [
21]). It is expected that a higher premium retention ratio will positively affect profitability with a lower loss ratio.
4.2. Data Sources
This study covers a period of eight years between 2006 and 2013. Depending on the existence of data, 24 out of 36 non-life insurance companies operating in Turkey as of 2013 have been selected for this study. These companies represent more than 90% of the Turkish non-life insurance industry in terms of premium size for each year in the period 2006–2013. Companies which have begun operating or obtained the permission to operate again in the last years of the analysis period constitute the majority of the companies which have not been included in the study. The data related to the first years these companies began to operate exhibit great fluctuations. Furthermore, insurance companies that operate in Turkey as the branch of a company with headquarters abroad have not been included in the scope of the study.
Annual data of non-life insurance companies were used in the study. These data were obtained from secondary data resources, namely, the financial statements and accompanying notes of the companies. Besides, the data published by the Insurance Association of Turkey and the Undersecretariat of Treasury were used. The data of 24 non-life insurance companies operating in Turkey in 2006–2013 period were brought together to obtain 192 observed panel data sets. The descriptive statistics related to each dependent and independent variables calculated on the basis of this panel data set are presented in
Table 1.
Table 1.
Descriptive Statistics.
Table 1.
Descriptive Statistics.
| Variable | Mean | Median | Maximum | Minimum | Std. Dev. | Observations |
|---|
| TPROF | −0.045 | 0.013 | 0.152 | −2.833 | 0.256 | 192 |
| SPROF | −0.028 | 0.019 | 0.318 | −2.368 | 0.229 | 192 |
| SIZE | 19.621 | 19.661 | 22.117 | 15.665 | 1.218 | 192 |
| AGE | 40.71 | 42.5 | 90 | 5 | 23.169 | 192 |
| LOSS | 0.759 | 0.742 | 1.994 | 0.268 | 0.209 | 192 |
| ILEV | 2.992 | 1.682 | 170.06 | −2.852 | 12.375 | 192 |
| CR | 1.469 | 1.330 | 7.975 | 0.385 | 0.725 | 192 |
| PGR | 0.289 | 0.143 | 14.723 | −0.916 | 1.225 | 192 |
| MOTOR | 0.523 | 0.530 | 0.950 | 0.040 | 0.198 | 192 |
| RETENTION | 0.655 | 0.667 | 0.869 | 0.343 | 0.133 | 192 |
Table 1 demonstrates that the mean values of technical profitability ratio and sales profitability ratio are negative. This situation continues to be one of the basic problems of non-life insurance companies in Turkey. The reason for this situation could be insufficient pricing of the companies with the concern of losing the market share (Öner Kaya [
1]). The share of motor insurance in the companies’ insurance portfolio ranges between a minimum of 4% and maximum of 95% with a mean value of 52.3%. This indicates that motor insurance is still dominant in the Turkish non-life insurance industry.
Table 2 demonstrates the correlation coefficients between the independent variables. The low correlation coefficients display one of the main benefits of using panel data-the reduction in collinearity among the explanatory variables (Shiu [
21]).
Table 2.
Correlation Coefficients between Independent Variables.
Table 2.
Correlation Coefficients between Independent Variables.
| | SIZE | AGE | LOSS | ILEV | CR | PGR | MOTOR | RETENTION |
|---|
| SIZE | 1 | 0.500 | −0.159 | 0.094 | −0.097 | −0.184 | −0.277 | 0.376 |
| AGE | | 1 | 0.112 | 0.006 | −0.068 | −0.123 | −0.068 | 0.220 |
| LOSS | | | 1 | 0.163 | 0.100 | −0.043 | 0.495 | 0.059 |
| ILEV | | | | 1 | −0.090 | −0.010 | 0.096 | 0.096 |
| CR | | | | | 1 | 0.150 | 0.007 | −0.024 |
| PGR | | | | | | 1 | 0.112 | −0.034 |
| MOTOR | | | | | | | 1 | 0.262 |
| RETENTION | | | | | | | | 1 |
4.3. Research Model
Panel data refer to the pooling of observations on a cross-section of households, countries, firms,
etc. over several time periods (Baltagi [
31]). Panel data analysis is the determination of economic relations between the variables with the help of panel data models created by using cross-sectional data which have a time dimension (Yerdelen Tatoğlu [
32]).
A panel data set which includes time series having the same length for all cross-section units is referred to as balanced panel (Wooldridge [
33]). The unbalanced panel occurs when some times in a series are missing for some cross-sections. In this study, since eight-year data exist for all cross-sections, there is a balanced panel.
A panel data regression model can be shown in its most general form as follows (Baltagi [
31]):
where
i denotes the cross-section dimension and
t denotes the time dimension;
represents the dependent variable;
represents the explanatory variable;
is the regression coefficient of explanatory variable;
is the intercept; and
is the error term.
The models developed to measure the impact of firm-specific factors on the profitability of non-life insurance companies in Turkey are as follows:
Model II:
where
is the index of non-life insurance companies;
is the index of time periods (years);
is the regression coefficient to be estimated (k is the index of explanatory variables and k = 1, 2, 3,…,8);
TPROF is the technical profitability ratio;
SPROF is the sales profitability ratio;
SIZE is the size of the company;
AGE is the age of the company;
LOSS is the loss ratio;
ILEV is the insurance leverage ratio;
CR is the current ratio;
PGR is the premium growth rate;
MOTOR is the motor insurance (including land vehicle and land vehicle liability branches); and
RETENTION is the premium retention ratio. The definitions of variables included in the models are summarized in
Table 3.
A panel data regression model can be estimated in different ways depending on the assumptions made about the intercept, regression coefficients, and error term. Accordingly, the pooled regression model, the fixed effects model, and the random effects model are widely used models in panel data analysis.
The pooled regression model is estimated by ordinary least squares method. The pooled ordinary least squares estimation method expresses that there is no difference between individuals (non-life insurance companies) in practice. In this situation, the data are pooled to make a single individual and ordinary least squares (OLS) method is applied. However, such a situation is restrictive in terms of demonstrating various impacts specific to time and individual (Asteriou and Hall [
34]).
Table 3.
Definitions of Variables and Expected Signs.
Table 3.
Definitions of Variables and Expected Signs.
| Dependent Variables | Formulas/Explanations |
| Technical Profitability Ratio (TPROF) | the ratio of technical profit to the gross written premiums |
| Sales Profitability Ratio (SPROF) | the ratio of net income before taxes to the gross written premiums |
| Independent Variables | Formulas/Explanations | Expected Signs |
| TPROF | SPROF |
| Size of the Company (SIZE) | the natural logarithm of total assets | ? | ? |
| Age of the Company (AGE) | the number of years during which the non-life insurance companies have been operating in the Turkish insurance industry | ? | ? |
| Loss Ratio (LOSS) | the ratio of incurred claims to the earned premiums | − | − |
| Insurance Leverage Ratio (ILEV) | the ratio of net technical reserves to equity | − | − |
| Current Ratio (CR) | the ratio of current assets to current liabilities | − | − |
| Premium Growth Rate (PGR) | the percentage increase in gross written premiums (GWP) PGR = (GWP(t) − GWP(t−1))/GWP(t−1) | + | + |
| Motor Insurance (including land vehicle and land vehicle liability branches) (MOTOR) | the ratio of GWP in motor insurance to total GWP of the company | − | − |
| Premium Retention Ratio (RETENTION) | the ratio of net written premiums to gross written premiums | + | + |
The random effects model is an appropriate specification, if the cross-section dimension is drawn randomly from a large population (Baltagi [
31]; Yerdelen Tatoğlu [
32]). On the other hand, if there is a narrower and specific data set, the fixed effects model is an appropriate specification and the inferences are restricted to this specific data set (Baltagi [
31]; Yerdelen Tatoğlu [
32]). The one-way models are estimated in this study taking into account the number of variables and the number of observations.
Accordingly, the ordinary least squares (OLS) regression model, the one-way fixed effects model, and the one-way random effects model are employed in this study for the analysis of panel data to examine the effects of firm-specific factors on the profitability of non-life insurance companies in Turkey. These models are estimated using EViews (Version 8) and STATA (Version 12.0).
5. Empirical Analysis
Within the scope of the analysis, it should first be tested whether the series is stationary (Yerdelen Tatoğlu [
35]). For this purpose, the panel unit root test by Levin, Lin, and Chu [
36] was used in this study. With Levin, Lin, and Chu’s test, a null hypothesis was tested on the existence of a common unit root, and acceptance of the null hypothesis indicates the existence of a common unit root. On the other hand, acceptance of the alternative hypothesis indicates that the unit root does not exist. In other words, the acceptance of alternative hypothesis demonstrates that the panels are stationary.
Based on the result of Levin, Lin, and Chu’s panel unit root test, because the probability values calculated are lower than the significance level of 5%, the null hypothesis was rejected for each variable. According to the results in
Table 4, it is possible to state that the series used in the analysis is stationary.
Table 4.
Panel Unit Root Test Results.
Table 4.
Panel Unit Root Test Results.
| Variable | t Statistic | Probability |
|---|
| TPROF | −7.79854 | 0.0000 |
| SPROF | −6.60852 | 0.0000 |
| SIZE | −3.71759 | 0.0001 |
| AGE | - | - |
| LOSS | −8.35953 | 0.0000 |
| ILEV | −18.8023 | 0.0000 |
| CR | −6.17988 | 0.0000 |
| PGR | −12.3559 | 0.0000 |
| MOTOR | −3.92016 | 0.0000 |
| RETENTION | −9.21306 | 0.0000 |
To choose among estimation methods of panel data models, F test, Breusch-Pagan LaGrange Multiplier (LM) test, and Hausman test were conducted (see
Table 5). F test is used to test the validity of the pooled ordinary least squares model (Yerdelen Tatoğlu [
32]). According to the results of the F test, because the F-statistic values are significant at the 1% level for both models, the null hypothesis was rejected. This situation demonstrates that there is a difference between the cross-sectional units. Hence, the pooled ordinary least squared model is not appropriate for both profitability measures.
Table 5.
The results of F, LM and Hausman tests.
Table 5.
The results of F, LM and Hausman tests.
| Tests | Model I (TPROF) | Model II (SPROF) |
|---|
| F test | F Statistic | 4.48 | 8.15 |
| Probability | 0.0000 | 0.0000 |
| LM test | Chi-square Statistic | 14.31 | 51.07 |
| Probability | 0.0001 | 0.0000 |
| Hausman test | Chi-square Statistic | 34.54 | 57.71 |
| Probability | 0.0000 | 0.0000 |
The LaGrange Multiplier (LM) test by Breusch and Pagan [
37] is used to test whether pooled ordinary least squares model is appropriate against the random effects model (Yerdelen Tatoğlu [
32]). According to the results of the LM test, because the chi-square values are significant at the 1% level for both profitability measures, the null hypothesis was rejected. These results indicate that the individual effects exist and the pooled models are not appropriate against the random effects models.
Following the determination of the existence of individual effects, it should be decided whether this effect is fixed or random. In this direction, Hausman’s [
38] specification test was used to choose between the fixed effects estimator and the random effects estimator (Yerdelen Tatoğlu [
32]). According to the results of the Hausman test, because the chi-square values are significant at the 1% level for both profitability measures, the null hypothesis was rejected. In clearer terms, random effects estimator is not appropriate for both profitability measures, and fixed effects estimator should be preferred.
The results of the F, LM, and Hausman tests suggest that the most appropriate models for the two profitability measures (technical profitability ratio and sales profitability ratio) are the one-factor fixed effects models. In fixed effects models, the Modified Wald test (Greene [
39]) is applied to determine whether groupwise heteroskedasticity exists. According to the results of the Modified Wald test, because the chi-square values are significant at the 1% level, the null hypothesis, which states that there is no groupwise heteroskedasticity, was rejected. Thus, there is the problem of groupwise heteroskedasticity in both fixed effects models. To determine whether autocorrelation problem exists in the fixed effects models, the Durbin-Watson (DW) test by Bhargava, Franzini, and Narendranathan [
40] and the locally best invariant (LBI) test by Baltagi and Wu [
41] were employed. Results of the tests demonstrate that there is no autocorrelation problem in the models. The results of the tests applied to determine whether heteroskedasticity and autocorrection problems exist in the fixed effects models are presented at the bottom of
Table 6.
Because heteroskedasticity problem was encountered in both models, to obtain heteroskedasticity-consistent standard errors, the fixed effects models were estimated using heteroskedasticity-consistent covariance matrix estimator developed by Huber [
42], Eicker [
43], and White [
44].
Table 6 shows the results of the one-way fixed effects models with heteroskedasticity-consistent standard errors for the two profitability measures (technical profitability ratio and sales profitability ratio).
According to these results, a positive relationship between the size of the company and both technical profitability ratio and sales profitability ratio is determined at a statistically significant level of 1%. Correspondingly, the increase in total assets of non-life insurance companies operating in Turkey increases the profitability of these companies. The results for the size of the company variable are consistent with the findings of Almajali
et al. [
8], Burca and Batrînca [
9], Doğan [
12], Malik [
17], and Mehari and Aemiro [
18]. Hence, the size of the company is a significant factor affecting the profitability of insurance companies in emerging insurance markets. Moreover, the positive relationship which has been established between the size of the company and profitability can be interpreted as the existence of the effects of economies of scale and scope in the activities of non-life insurance companies operating in Turkey.
The age of the company, in other words, the number of years during which non-life insurance companies operate in the Turkish insurance sector, has a negative effect at a statistically significant level of 1% on both technical profitability ratio and sales profitability ratio. The reverse relation between the company age and profitability of non-life insurance companies demonstrates that profitability decreases as the company age increases. These results support the findings of Doğan [
12]. These results also support the notion that the company may lose its flexibility, may experience problems in adapting to changing conditions and, hence, its performance may drop depending on the increase in the company age.
According to the results of the one-way fixed effects models, there is a reverse relationship between the loss ratio and both profitability measures, as expected. These results demonstrate that companies with a higher loss ratio have a lower technical profitability ratio and similarly, a lower sales profitability ratio. Negative influence of the loss ratio on the profitability is confirmed in empirical studies by Burca and Batrînca [
9], Doğan [
12], Hrechaniuk
et al. [
14], Lee [
16], Malik [
17], Mehari and Aemiro [
18], and Pervan
et al. [
19]. However, these results conflict with that of Adams and Buckle [
7], who found that Bermuda-based insurance and reinsurance companies engaged in high-risk underwriting activities have better financial performance than those companies that are less inclined to take underwriting risks. Consequently, the loss ratio is an important determinant of the profitability of insurance companies in emerging insurance markets.
Table 6.
The Results of Fixed Effects Models.
Table 6.
The Results of Fixed Effects Models.
| Variable | Model I | Model II |
|---|
| Dependent Variable: TPROF | Dependent Variable: SPROF |
|---|
| SIZE | 0.190 | 0.154 |
| (3.71) ** | (3.04) ** |
| AGE | −0.035 | −0.035 |
| (4.89) ** | (4.88) ** |
| LOSS | −0.679 | −0.702 |
| (16.42) ** | (21.16) ** |
| ILEV | −0.0003 | −0.000 |
| (2.76) * | (0.82) |
| CR | −0.161 | −0.118 |
| (4.76) ** | (4.03) ** |
| PGR | 0.032 | 0.023 |
| (15.16) ** | (11.33) ** |
| MOTOR | −0.255 | −0.130 |
| (1.70) | (1.28) |
| RETENTION | 0.131 | 0.101 |
| (0.90) | (1.01) |
| Constant | −1.536 | −0.940 |
| (2.07) | (1.35) |
| Observations | 192 | 192 |
| Number of Company | 24 | 24 |
| R-squared | 0.77 | 0.80 |
| Modified Wald test | Chi-square Statistic | 20081.98 | Chi-square Statistic | 23128.07 |
| Probability | 0.0000 | Probability | 0.0000 |
| Modified Bhargava et al. Durbin-Watson statistic | 2.2534807 | 2.1195201 |
| Baltagi-Wu LBI test statistic | 2.5775481 | 2.4789096 |
There is a negative relationship between the insurance leverage ratio and both profitability measures at a very low level. The relationship between insurance leverage ratio and technical profitability ratio is significant at the 5% level. However, the relationship between insurance leverage ratio and sales profitability ratio is not statistically significant. These results, therefore, did not support the findings of Adams and Buckle [
7], Burca and Batrînca [
9], Doğan [
12], Malik [
17], and Mehari and Aemiro [
18].
The current ratio has a negative effect, as expected, at a statistically significant level of 1% on both technical profitability ratio and sales profitability ratio. Accordingly, depending on the increase in the current ratio, the liquidity risk of the non-life insurance companies and hence, their technical profitability and sales profitability ratios will decrease. This negative relationship is congruent with the findings of Adams and Buckle [
7] and Doğan [
12]. However, this finding conflicts with that of Shiu [
21], who found that the performance of non-life insurance companies is positively related to asset liquidity.
The premium growth rates of non-life insurance companies have a positive effect, as expected, at a statistically significant level of 1% on both profitability measures of these companies. These findings are in line with the results obtained by Hrechaniuk
et al. [
14] for Lithuanian insurance market and against the results obtained for Spanish and Ukrainian insurance markets. These results also conflict with that of Burca and Batrînca [
9], who found that financial performance was negatively related to the growth of gross written premiums in the Romanian insurance market. In this study, however, the positive relationship which has been established between growth in gross written premiums and profitability can be interpreted as the capability of companies with increasing market share in the Turkish non-life insurance market in benefiting from the economies of scale and scope compared to small companies.
According to the results, there is a negative relationship, as expected, between the share of motor insurance in the insurance portfolio of non-life insurance companies and both profitability measures of these companies. In other words, the increase in the share of motor insurance in the companies’ insurance portfolio reduces the profitability of these companies. However, it is determined that this relationship is not statistically significant. These results, therefore, did not support the findings of Kozak [
15].
The last variable impact, tested on the profitability of non-life insurance companies, is the premium retention ratio. Based on the results of the analysis, the premium retention ratio has a positive effect, as expected, on both profitability measures. However, it is determined that this relationship between the premium retention ratio and profitability is not statistically significant. Hence, these results did not support the findings of Burca and Batrînca [
9] and Lee [
16].
6. Conclusions
This study investigated the effects of firm-specific factors on the profitability of non-life insurance companies operating in Turkey over the period of 2006 to 2013 using the data drawn from publicly available corporate financial reports. The main results of the study demonstrate that the profitability of non-life insurance companies is statistically significant and positively related to the size of the company and premium growth rate, whereas profitability is statistically significant and negatively related to the age of the company, loss ratio, and current ratio. However, the share of motor insurance in the companies’ insurance portfolio and the premium retention ratio are not found to be important explanatory variables. The results of the study have several implications for the Turkish non-life insurance companies.
First, the results obtained for the size of the company variable demonstrate that large non-life insurance companies have higher profitability than small non-life insurance companies. Therefore, the managers of non-life insurance companies should give importance to their growth strategies. In addition, merger and acquisition alternatives should be considered.
Second, the results obtained for the loss ratio variable indicate that non-life insurance companies with low underwriting risk have higher profitability than non-life insurance companies with high underwriting risk. Therefore, non-life insurance companies should give special attention to their exposure to underwriting risk. Non-life insurance companies that underwrite high-risk business will be required to purchase more reinsurance or to utilise alternative risk transfer techniques (insurance derivatives, insurance linked securities, etc.) to mitigate the impact of unexpected underwriting losses, ensure stability of earnings, increase underwriting capacities, and avoid insolvency.
Third, the results obtained for the current ratio variable indicate that non-life insurance companies with low liquidity will have higher profitability than highly liquid non-life insurance companies. These results also support the notion that effective management of liquidity risk plays an important role in the profitability of non-life insurance companies. Hence, managers of non-life insurance companies should strike a balance between liquidity risk and profitability.
To confirm the robustness of the results, profitability is measured by two different variables: the technical profitability ratio and the sales profitability ratio. The results obtained are similar for both profitability measures. However, the study covers a specific period (2006–2013). Thus, the results obtained may reflect the characteristics of this period. Therefore, the results of this study are valid only for the non-life insurance companies operating in Turkey over the period of 2006 to 2013. Nevertheless, the authors feel that the results have ensured some genuine insights for managers of non-life insurance companies and for those in the academe.


