
TriangleConv: A Deep Point Convolutional Network for Recognizing Building Shapes in Map Space


1
School of Computer and Information Engineering, Henan University, Kaifeng 475000, China
2
Henan Industrial Technology Academy of Spatio-Temporal Big Data, Henan University, Zhengzhou 450046, China
3
College of Geography and Environmental Science, Henan University, Kaifeng 475000, China
*
Author to whom correspondence should be addressed.
ISPRS Int. J. Geo-Inf. 2021, 10(10), 687; https://doi.org/10.3390/ijgi10100687
Submission received: 31 July 2021
/
Revised: 9 October 2021
/
Accepted: 11 October 2021
/
Published: 13 October 2021
Abstract
:The classification and recognition of the shapes of buildings in map space play an important role in spatial cognition, cartographic generalization, and map updating. As buildings in map space are often represented as the vector data, research was conducted to learn the feature representations of the buildings and recognize their shapes based on graph neural networks. Due to the principles of graph neural networks, it is necessary to construct a graph to represent the adjacency relationships between the points (i.e., the vertices of the polygons shaping the buildings), and extract a list of geometric features for each point. This paper proposes a deep point convolutional network to recognize building shapes, which executes the convolution directly on the points of the buildings without constructing the graphs and extracting the geometric features of the points. A new convolution operator named TriangleConv was designed to learn the feature representations of each point by aggregating the features of the point and the local triangle constructed by the point and its two adjacency points. The proposed method was evaluated and compared with related methods based on a dataset consisting of 5010 vector buildings. In terms of accuracy, macro-precision, macro-recall, and macro-F1, the results show that the proposed method has comparable performance with typical graph neural networks of GCN, GAT, and GraphSAGE, and point cloud neural networks of PointNet, PointNet++, and DGCNN in the task of recognizing and classifying building shapes in map space.
1. Introduction
As an indispensable part of geographic objects, buildings are widely distributed in large and medium-sized maps [1,2]. The classification and recognition of the shapes of buildings in map space play an important role in spatial cognition, cartographic generalization, and map updating [3,4,5,6].
In practice, it is challenging to describe the shapes of buildings due to their irregular outline. Researchers have proposed many methods for this purpose, such as coding the shapes of buildings according to the left and right directions of buildings [7] or using letter symbols as templates for shape matching [8]. Moreover, the cognition of building shapes is subjective and may be affected by many factors in practice, such as personal bias. Thus, many methods have also been presented to extract the geometric features of the buildings from different perspectives for the cognition of the building shapes, such as the smallest bounding rectangle (SBR) [9] and the triangular centroid distances (TCDs) [10]. Although these methods are intuitive to understand, they often fail to obtain deeper feature information about the objects.
Deep learning, due to its state-of-the art feature extraction ability, has gained much attention in recent years. The typical deep learning models of convolutional neural networks [11,12,13,14] have become major players in many fields, such as natural language processing [15,16], visual image processing [13,17,18], and other fields in which the data are often located in the Euclidean space and have a regular structure. However, there exist many other kinds of non-Euclidean data that do not have regular structures in our lives [19]. One typical example is social network data, which are graphs. The convolutional neural networks cannot run on the irregular graph data because the convolution operators, i.e., the fundamental building blocks of convolutional neural networks, cannot be applied to the graphs [20]. Therefore, graph neural networks, such as GCN [21,22,23], GAT [24], and GraphSAGE [25] have been proposed for deep learning on the graph data [26]. Different convolution operators have been designed for graphs.
In map space, buildings are often represented with vector data. Similar to social networks, these buildings in the form of non-Euclidean vector data also do not have a regular structure. Therefore, related work has been done to extract the deep feature representations of the buildings and recognize their shapes based on graph neural networks. For example, Yan et al. used graph Fourier transform and the convolution theorem to extract the shape features of building groups [27] and used the graph neural network of the spectral domain to construct a graph convolutional autoencoder (GCAE) model to extract the shape features of the buildings [28].
Due to the principles of graph neural networks, when extracting shape features from buildings, it is necessary to first construct the graph for each building to represent the adjacency relationships between the points (i.e., the vertices of the polygons shaping the buildings). The points are taken as the vertices of the graph and the adjacency between points as the edges. Moreover, the geometric features of each point also need to be extracted in advance to improve the feature learning performance. For example, 14 features were designed and extracted for each point in the work of reference [28].
This paper–different from these existing works–proposes a deep point convolutional network (DPCN) to learn the deep shape feature representations of the buildings in map space and recognize their shapes. DPCN executes the convolution directly on the points of the buildings without constructing the graphs and extracting the initial geometric features for the points. A new convolution operator named TriangleConv wass designed to perform convolution on the points. We note that the convolution operation in deep learning can be viewed as an aggregation of the features of a point and its neighbor points in the receptive field. Accordingly, the main idea of the TriangleConv operator was to aggregate the features of a point and its two adjacency points to generate the new features of the point. Particularly, in order to obtain more information from the adjacency points, the features of the local triangle constructed by the point and its two adjacency points are used for the aggregation instead of using the features of two adjacency points directly.
The proposed method is inspired by the deep learning methods for point clouds. Similar to 2D vector data, a point cloud is also a collection of points. However, unlike vector data, point cloud data are position invariant. Changing the position of a point in the collection does not affect the shape represented by the point cloud data. Before Qi et al. proposed the PointNet method [29], the deep learning methods for point clouds usually first projected the 3D point cloud data to a regular structure, such as a 2D plane or the voxels, without performing operations directly on the points. Following PointNet, many new neural networks have been proposed for performing operations on the points, such as the PointNet++ [30] and the DGCNN [31]. Although the vector data are similar to the point cloud data, the neural networks for point cloud data are not applicable for the vector data. This is because they do not consider the point order that represents the adjacency between the points in vector data. The same feature representations will be learned for two different vector objects, which have the same set of points, but with different orders.
To evaluate the proposed method, these vector polygon data representing the buildings that have been used in the work of [28] are taken as the experimental dataset. This dataset contains 5010 buildings. Based on the similarity between the buildings and the letters in the alphabet, the buildings were labeled with similar letters. Based on this dataset, we compared our method with commonly used graph neural networks and point cloud neural networks. The experimental results show that in the task of classifying the shapes of buildings in map space, the proposed method achieves comparable performance in terms of accuracy, macro-precision, macro-recall, and macro-F1, which are often used in multi-classification tasks.
The main contribution of this paper is that we propose a new convolution operator TriangleConv, which can execute the convolution directly on the points of the buildings and build a deep point convolutional network to classify the shapes of the buildings in map space. The remainder of this paper is structured as follows. Section 2 introduces the proposed DPCN method, including the framework of DPCN, the TriangleConv operator, and the implementation and the parameters of training. Section 3 details the dataset and metrics. Section 4 analyzes the results of the experiments and describes the application of the proposed method to recognize the shapes of the buildings in the Open Street Map. Finally, Section 5 concludes the work.
2. The Deep Point Convolutional Network
Inspired by point cloud neural networks, this paper proposes a deep point convolutional network (DPCN) to recognize the shapes of the buildings in map space. The proposed model can execute the convolution directly on the points of the buildings with the TriangleConv convolution operator. In this section, we introduce the framework of the proposed DPCN, the details of the TriangleConv convolution operator, and the implementation and training of the network.
2.1. The Framework of DPCN
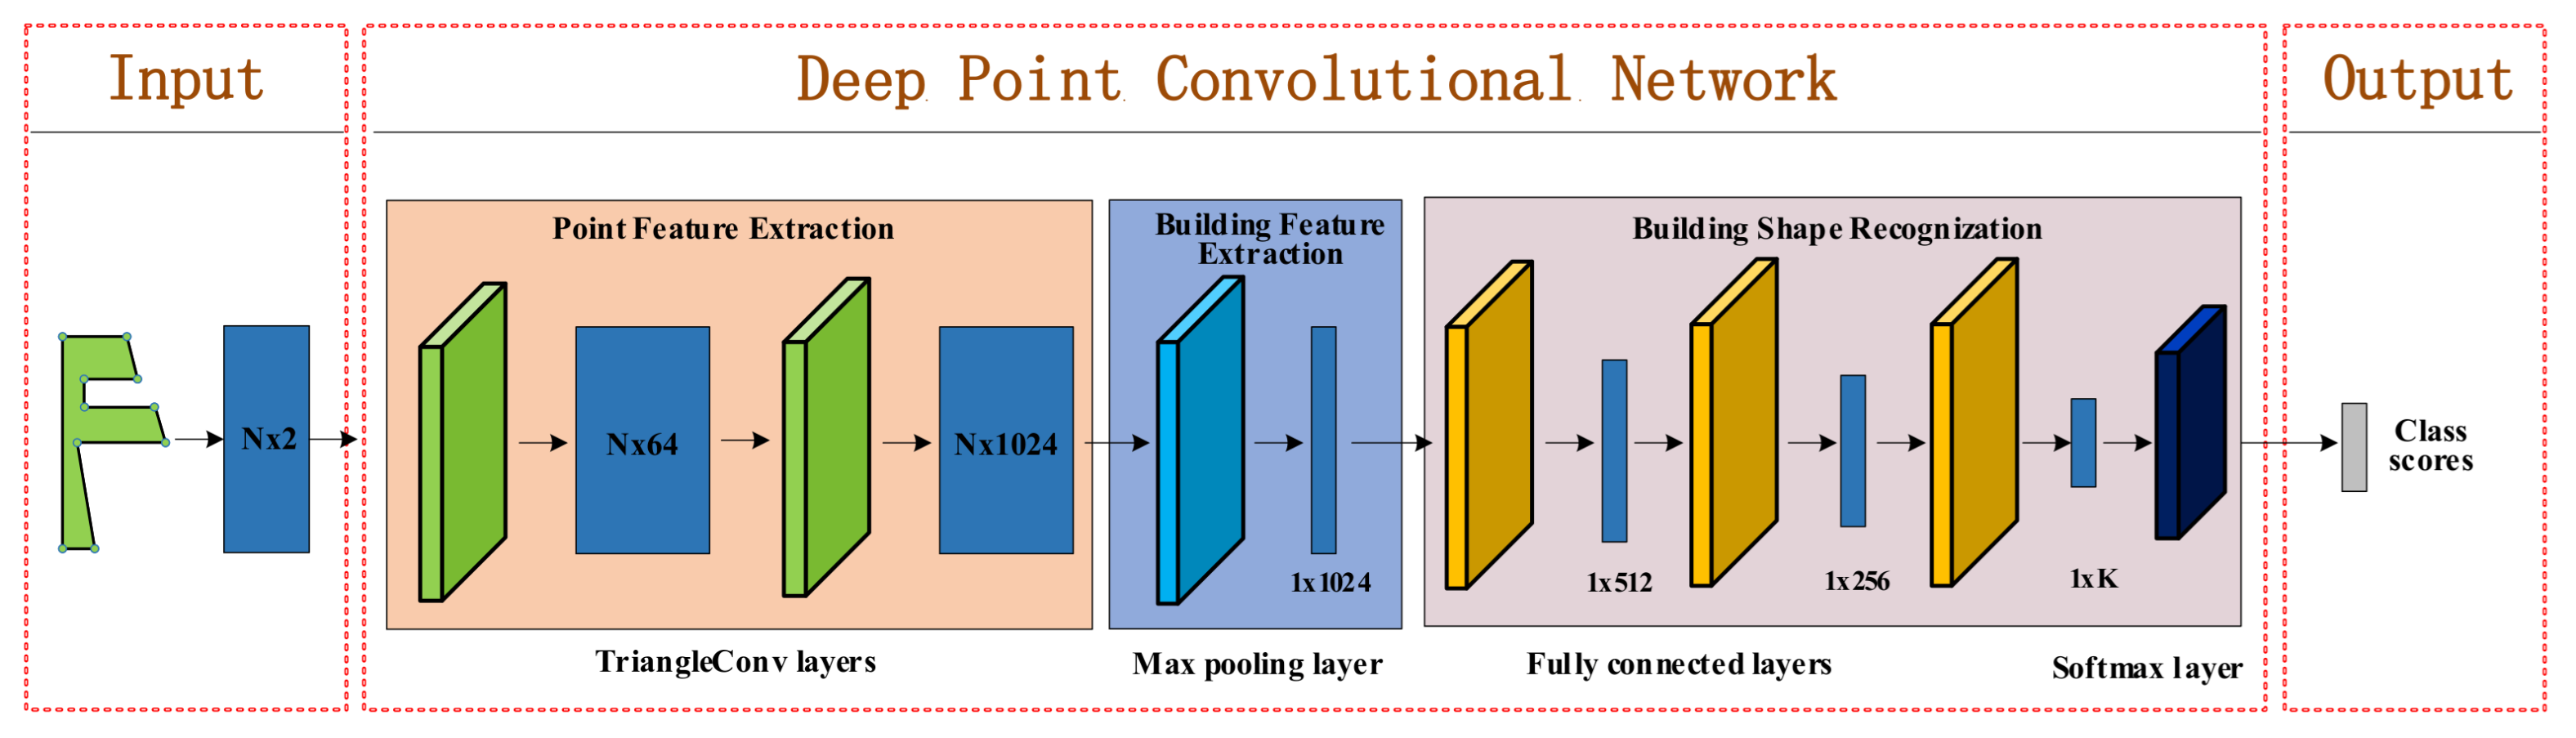
The framework of DPCN is shown in Figure 1. The inputs are the buildings in the form of an ordered list of points . In particular, all of the buildings were preprocessed with the same number of points. The points in the list correspond directly to the vertices of the polygons shaping the buildings, and the order between them represents the adjacency relationships between the vertices. Each point contains a two-dimensional coordinate, i.e., . The outputs are the score vectors of which each dimension shows the possibility that buildings belong to a certain class. Given the vector data of buildings, DPCN consists of three modules: point feature extraction, building feature extraction, and building shape recognition.
- Point feature extraction module: this module aims to learn and extract the feature representations of each point of the input building. As shown in Figure 1, it stacks two TriangleConv layers. Each TriangleConv layer performs the TriangleConv operator on the points. The first TriangleConv layer generates a feature representation with 64 dimensions for each point. Taking this new feature representation as input, the second TriangleConv layer extracts a higher dimensional feature representation with 1024 dimensions for each point. Through these TriangleConv layers, DPCN embeds each point of the input building into a high dimensional space.
- Building feature extraction module: this module is to aggregate the features of the points and obtain the feature representation of the input building. To achieve this purpose, a max pooling layer is used, which executes the max operation on each dimension of the feature representations of the points. Accordingly, a tensor with 1024 dimensions is derived to represent the deep features of the shape of the building. This feature representation will be used by the building shape recognition module to predict the shape of the input building.
- Building shape recognition module: this module aims to predict the shape of the input building with its feature representation. It usually stacks several fully connected layers and one softmax layer. As shown in Figure 1, there are three fully connected layers in DPCN. The fully connected layers transform a feature of one space into a new feature of another space and aggregate the information of different dimensions in this process. With three fully connected layers, the building shape feature representation with 1024 dimensions is transformed into a k dimensional representation where k is the number of shape classes. Finally, the softmax layer executes the softmax operation on the k dimensional representation to output the possibility scores that the input object belongs to different shape classes.
2.2. The TriangleConv Operator
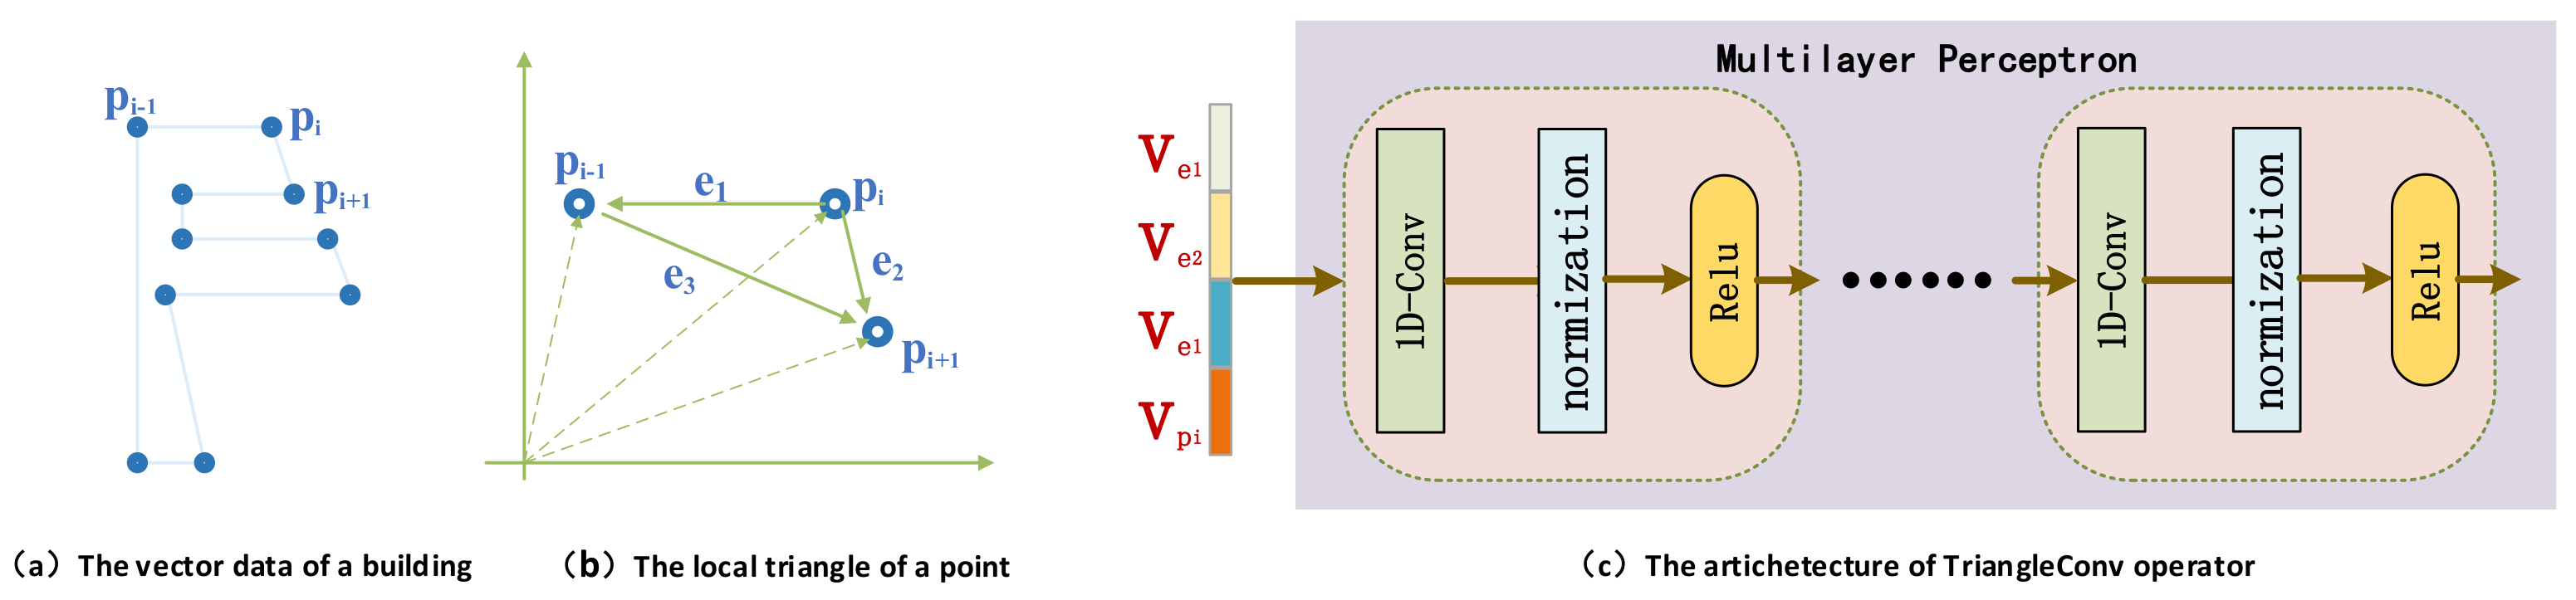
In DPCN, each TriangleConv layer performs the TriangleConv operator on the points. The TriangleConv operator is designed to execute the convolution directly on the points of the buildings without constructing the graphs and extracting the initial geometric features for the points. It aims to generate new feature representations for each point during the convolution operation. As convolution operation in deep learning can be viewed as an aggregation of the features of a point and its neighbor points in a receptive field, to generate new feature representations of a point of the buildings, the TriangleConv operator aggregates the features of the point and the local triangle constructed by the point and its two adjacency points. As shown in Figure 2a, each building in map space is represented by an ordered point list. By treating this point list as an end-to-end list, the neighbors of either point are the adjacency points and , which are before and after in the list. When learning the feature representations of , we take the features of an invisible local triangle, such as Figure 2b constructed by and its two adjacency points rather than just take the features of the two adjacency points. This local triangle contains more information about the local relationships between and its two adjacency points. For example, such feature information includes the distance between the points, the size of the triangle, the angle between the sides. Thus, given the features of the point and its local triangle , TriangleConv operator is a function of these features as shown by Formula (1).
As shown in Formula (1), denotes the feature representation of point . Initially, is the coordinate of . The function f means the feature representation extraction process from the local triangle . There are many kinds of information about the triangle that can be used for generating its feature representation. In this paper, we take the information of the three sides of the triangle into consideration as shown in Formula (2).
As shown in Figure 2b, the representations of the three sides can be derived by the subtraction between the feature representations of the three points. From the perspective of vector operation, the subtraction can capture the information of the distance and the angles between the three points. Given the list of points shaping the polygon of a building, such information can better encode the local structure of the polygon around a point.
Given the feature representations of three sides, we concatenate them together as the feature representation of the local triangle . This means the concatenation function is used as the implementation of function f in Formula (2). This concatenation is to aggregate the feature information of three sides together, which will be used by the function h to generate the new feature representation of the point .
For the function h in the formula (1), there are many candidate implementations. In this paper, we implement it with multilayer perceptron (MLP). We first concatenate the feature representation of point with that of the local triangle and then input them into the MLP as shown in Figure 2c. The MLP is implemented as the connection of several convolution components. Each component stacks a 1D-Conv module (kernel_size = 1), a batch normalization module, and a Relu module. More accurately, there are three such components in the MLP of the first TriangleConv layer and two components in the second TriangleConv layer. We will detail their implementations in the following section.
From the above definition of the TriangleConv operator, it should be noted that since the TriangleConv operator is designed for the buildings, which can be shaped by polygons, the proposed method may not apply to all kinds of vector objects.
2.3. The Implementation and the Parameters of Training
For the first TriangleConv layer, the MLP consists of three convolution components as shown in Figure 2c. The numbers of input channels and output channels of the 1D-Conv modules in the components are (8,64), (64,64), (64,64). For the second TriangleConv layer, there are two convolution components in the MLP, and the numbers of input channels and out channels of the 1D-Conv modules in the components are (256,512), (512,1024). The numbers of input channels and out channels of the linear modules in these fully connected layers are set to (1024,512), (512,256), (256,10). Moreover, there are two dropout modules following the first and second fully connected layers.
Our implementation of the proposed DPCN was based on the Pytorch [32] library, version 1.6.0. When training the network, we used 4000 of the buildings in the dataset as the training set and 1010 buildings as the test set. This also means that training set was about 80% and the ratio of the test set was about 20%. The network was trained for 150 epochs. The cross loss function was used, and the Adam optimizer [33] with the initial parameter of 0.01 was adopted, and this parameter will change with the increase of the training epoch. Meanwhile, the StepLR mechanism was adopted to constantly adjust the learning rate of the network with a step size of 20 and the gamma parameter was set to 0.5. The batch size of the training was set to 32. What is more, all experiments were conducted on a computer with Intel Core i5-7500 and NVIDIA GeForce RTX 2080Ti.
3. Dataset and Metrics
To evaluate the performance of the proposed method, this section introduces the dataset and metrics we used for the experiments.
3.1. Experimental Dataset and Preprocessing
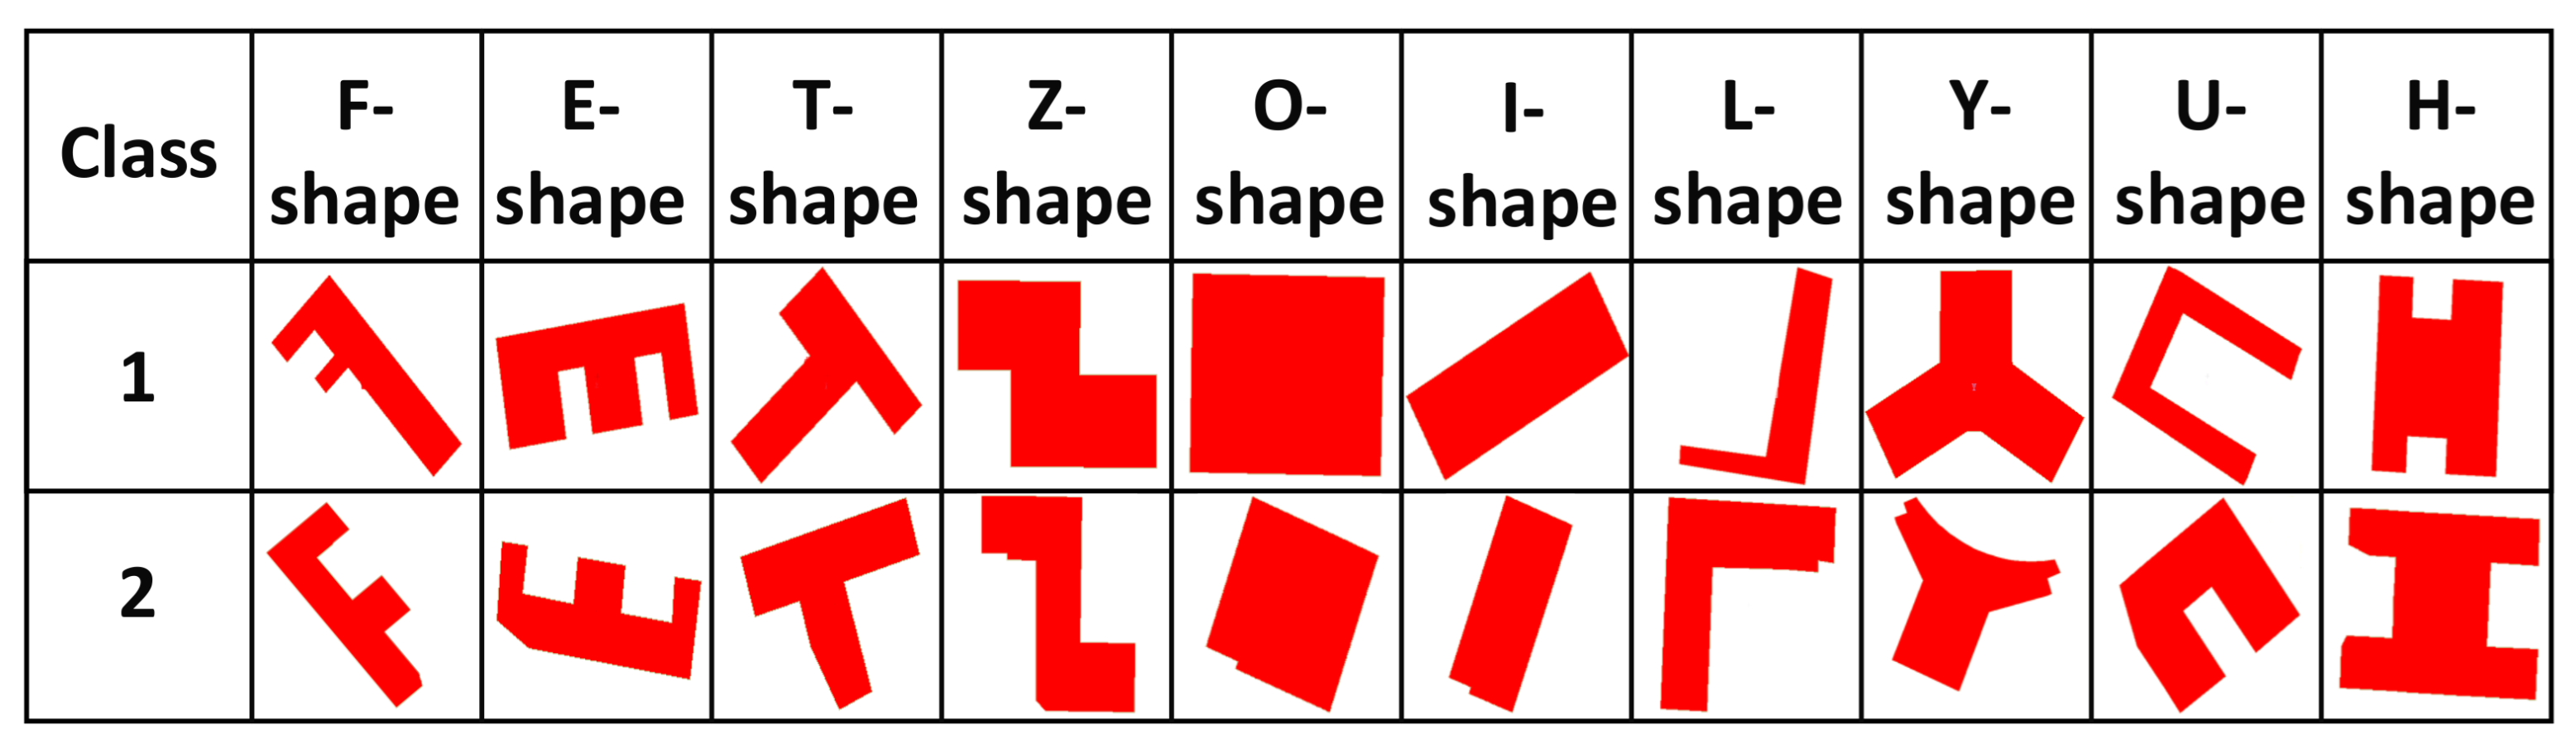
We took the dataset used by the work of [28] as the experimental dataset. This dataset was filtered from different types of areas on OpenStreetMap. It consists of a total of 5010 buildings. According to their shapes, each building was labeled with a similar letter in the alphabet as shown in Figure 3 [34]. Finally, there were 10 different shape types in the dataset, such as O-shape, Y-shape, and F-shape. That is, there were 501 buildings for each type.
We followed the methods used by [28] to preprocess the dataset. The buildings in the dataset have a different number of points. Similar to the usual convolutional neural networks and graph neural networks, the dimensionality of the data input to DPCN should be consistent. Therefore, we need to preprocess all of the buildings in the dataset with the same number of points. Specially, the Douglas–Peucker method [35] with a conservative and empirical threshold of 0.1 m was used to first simplify the original data. This method is an algorithm that approximates the curve as a series of points and reduces the number of points. Then, the equally spaced interpolation method was performed on the simplified data to unify the number of points of different buildings. This method is performed on a curve composed of a list of points. According to the preset number of points, it sets new points at equal intervals between two points on the curve or deletes the extra points in the list. In addition, considering the large variation of the coordinate values of the points of different buildings, the Z-score method was further used to normalize the coordinate values of the points of all buildings into decimals between (0,1) [28].
3.2. The Evaluation Metrics
To evaluate the performance of the proposed method, the metrics, which are often used by the multi-classification tasks, were adopted in this paper. They are the macro-precision, the macro-recall, the macro-F1, and the accuracy, which are defined as follows.
In the above definitions, the , and means the precision, the recall, and the F1 for class k. The definitions of them are as follows.
In the definitions, means the number of positive samples correctly classified, is the number of negative samples incorrectly labeled as positive samples, and is the number of positive samples incorrectly labeled as negative samples. This means that measures how many samples are correctly classified among these samples predicted as positive samples for class k, measures how many positive samples are correctly classified for class k, and combines the values of and . Based on these definitions, we can see that macro-precision, macro-recall and macro-F1 measure the average values of the precision, the recall and the F1 among the n classes.
For the metric of accuracy, its definition is as Formula (12), and it measures the proportion of all correctly classified samples to the total number of samples.
In the above definition, m is the total number of samples, and correspond to the i-th sample and its class label, and is the label predicted.
The values of all the metrics above range between 0 and 1. The higher the values, the better the performance of the methods.
4. Results and Analysis
To evaluate the proposed method, several experiments were done to compare the method with a variety of related methods, including graph neural networks and point cloud neural networks. We present and analyze the results of these experiments in this section. All results in this section are derived from the epoch with best accuracy after model convergence.
4.1. The Sensitivity Analysis of the Number of Input Points of Each Building
The proposed method executes the convolution directly on the points of the buildings to learn the feature representations of each point and derives the shape feature representation of building through a max pooling operation. Thus, the number of points of the input buildings actually affects the performance of building shape recognition. For example, it is often assumed that more points will contribute to the recognition because more information is present. To evaluate the effects of the number of the points, we preprocessed the input buildings with the different number of points and observed the recognition performance. In practice, two points can shape a line, four points can shape a polygon-like I-shape and O-shape, eight points can shape a polygon-like T-shape and U-shape, and twelve points can shape all types of standard (simplest) shapes in Figure 3. Therefore, we start with two points to validate the influence of different numbers of points on the performance of our proposed method in recognizing building shapes. The results are shown in Table 1.
The result shows that when there are two points in each building, the performance is very poor. When the number is increased to four, the performance is greatly improved. The accuracy is improved significantly, which reaches 86.24%, but the results of macro-precision and macro-F1 are still unsatisfactory. When the number is up to eight, the values of all metrics are further improved and the macro-F1 value is over 80%. When the number of points is 16, the performance of each evaluation metric reaches an optimal result. When the number of points is 32 or more, the performance of the evaluation metric decreases instead. This may be because when the number of points is more than 12 points, some details of the shapes can be supplemented, but if the number of points is too large, it will cause redundancy of input information. When there are too many points for a building, there will be many points distributed on the straight line. For these points, distributed on the straight lines, it is impossible to construct the effective triangles required by the TriangleConv operator of our method. Instead, the information extracted from these points will interfere with the performance of the whole method. This may explain why the performance decreases when the number of points of the buildings is 32 or more. These results also show that it will not always contribute to the shape recognition by increasing the number of points. Accordingly, we preprocessed the buildings with 16 points in our experiments.
4.2. The Performance Analysis of the Candidate Convolution Methods
Because buildings in map space are in the form of an ordered list of points, the convolution on points can be done by aggregating the features of one point and its two adjacency points. Instead, we proposed to aggregate the features of the point and the local triangle constructed by the point and its two adjacency points. To validate the choice, we conducted the experiment to compare the performance of the two different convolution implementations.
Table 2 shows the results of the performance comparison between the two convolution implementations, where the DPCN-3 point denotes the method to execute the convolution on points by directly aggregating the features of the points and their two adjacency points. The comparison results show that the proposed method outperforms the DPCN-3 point. The possible reason is that the triangle contains more local information than the two adjacency points. In the proposed method, the feature information of three sides are taken into the convolution for generating the new feature of a point. The features of three sides are generated by the subtraction between the features of the three points constructing the triangle. From the perspective of vector operation, the subtraction can capture the information of the distance and the angles between the three points. The information can better express the local shape of the polygon shaping a building. The comparison results also confirm the contribution of the information.
4.3. Comparison with Related Methods
Because there are some works used to apply graph neural networks, such as GCN, to extract the shape features of buildings in map space [28], and relevant experiments have shown that GAT [24] and GraphSAGE [25] perform better than GCN, we have selected the graph neural networks of GCN, GAT, and GraphSAGE for comparison. Their implementations in the Deep Graph Library (DGL) [36] are used; DGL is a Python package built for easy implementation of the graph neural network method family. All of the buildings in the experiment dataset were preprocessed with 16 input points to ensure the fairness of the comparison. In practice, all of these networks take a feature matrix describing the feature representations of the vertices of the graph as input. For example, the work in [28] defined and extracted 14 geometric features for each point constructing the graph. However, similar to our method, these graph neural networks can also take the coordinates as the initial features of each point without using these manually defined geometric features. Considering that, we conduct comparisons with these selected graph neural networks in two cases. In the first case, we compare our method with these graph neural networks by taking the 14 geometric features defined in [28] as the features of each point. In the second case, we compare with these networks by directly taking the coordinates as the initial features of each point. To distinguish these networks in the two cases, we call these graph neural networks in the first case GCN+F, GAT+F, and GraphSAGE+F.
Moreover, the proposed method is inspired by the point cloud neural networks. A point cloud is also a collection of points, which is similar to 2D vector data. This means that point cloud neural networks can also run on the 2D vector data. To evaluate the performance of these point cloud neural networks on the buildings, we also selected these typical point cloud neural networks of PointNet [29], PointNet++ [30], and DGCNN [31] for comparison. Their implementations on the GitHub were adopted. All of the buildings are still preprocessed with 16 points.
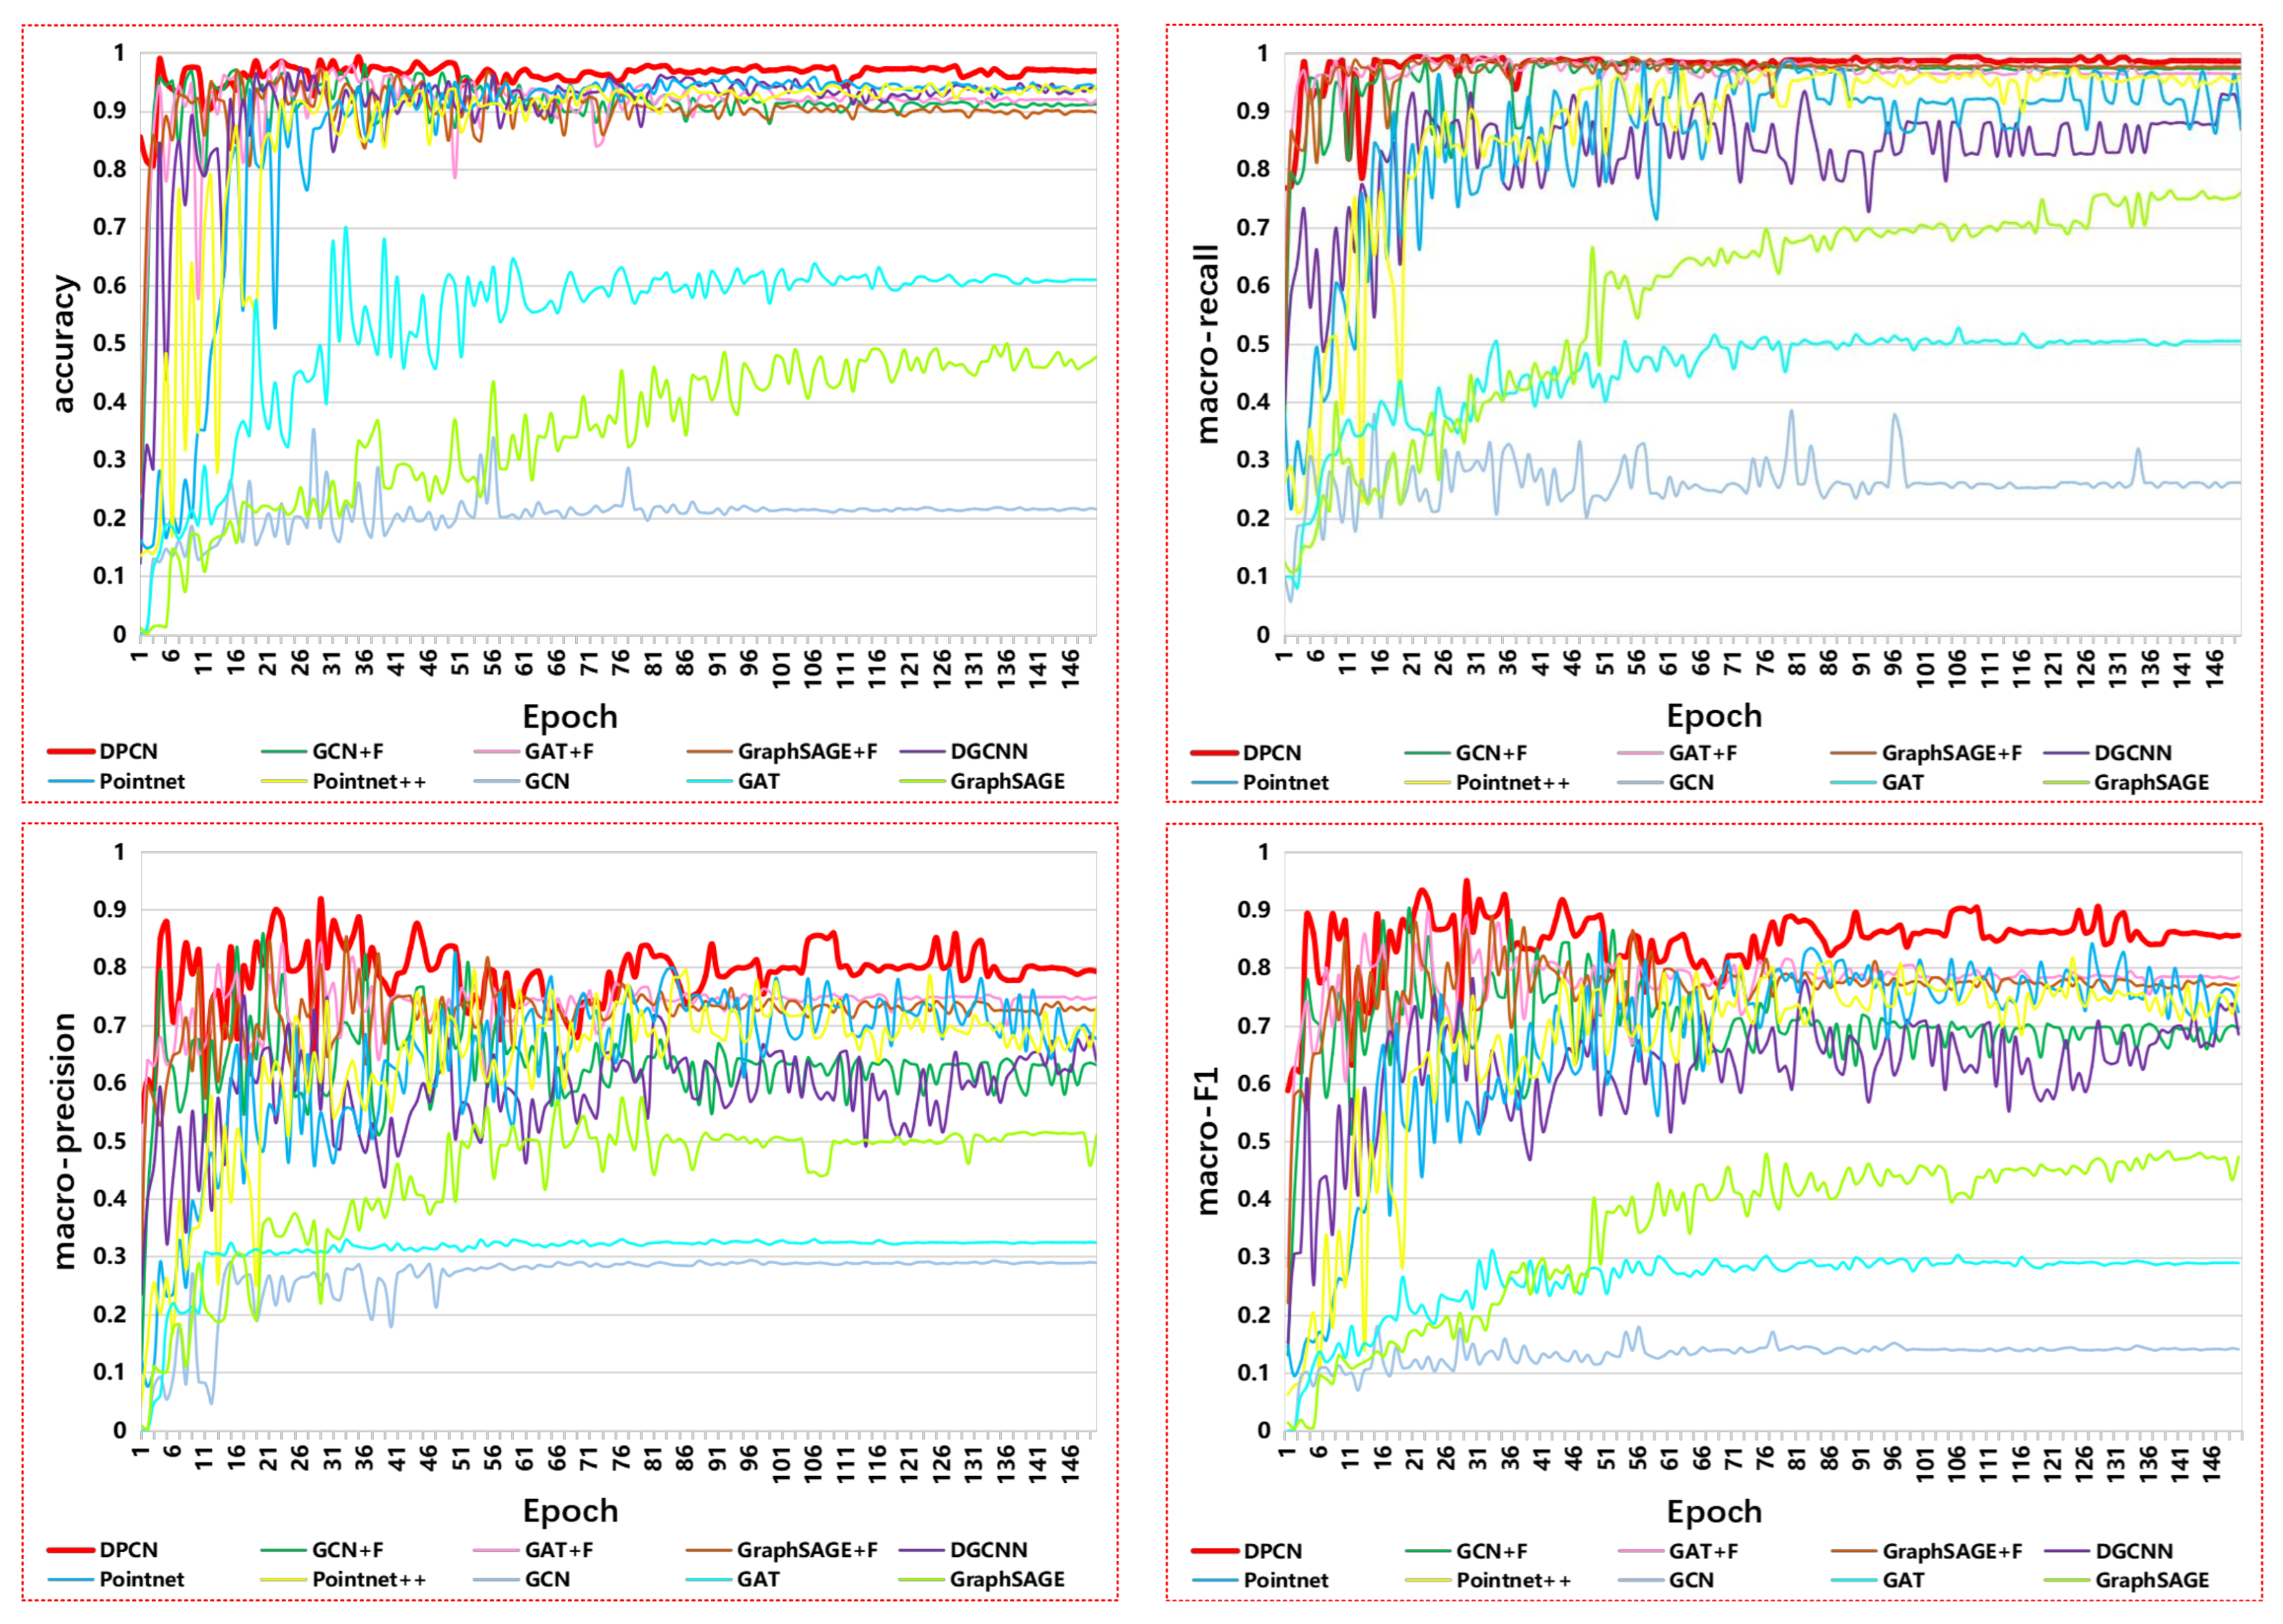
The results of the comparison are shown in Table 3. Figure 4 also shows the value change of the metrics along with the increase in the number of epochs. The results of the comparison with GCN, GAT, and GraphSAGE show that when taking these manually defined geometric features for each point, these graph neural networks(GCN+F, GAT+F, GraphSAGE+F) work well for classifying building shapes in map space, for example, their accuracies are over 95% directly, but when directly taking the coordinates as the initial features of the points, the performances of these graph neural networks(GCN, GAT, GraphSAGE) fall a lot. This indicates that it is necessary to define and extract these geometric features for each point. However, these results also show that although the proposed method has not explicitly extracted the geometric features for each point, it still achieves comparable performance with the TriangleConv operator. This means that the proposed point convolutional network can also capture deep feature information of the building shapes compared with these graph neural networks. In addition, for these point cloud neural networks, the results show that they have also achieved good performance in the task of classifying the buildings in map space, but still fall behind the method proposed in this work. For example, the performance of DPCN is 2.28%, 3.37%, and 2.08% higher than that of PointNet, PointNet++, and DGCNN in accuracy. Particularly, in terms of the metric of macro-F1, DPCN performs better than PointNet by 8.26%, PointNet++ by 12.51% and DGCNN by 10.84%. The reason for this result may be that, unlike vector data, point cloud data are position invariant, and these point cloud neural networks do not consider the point order that represents the adjacency between the points constituting the buildings. When using these networks to extract the shape feature representations of the buildings, the same feature representations will be learned for two different buildings, which have the same set of points but with different orders.
4.4. The Application of DPCN
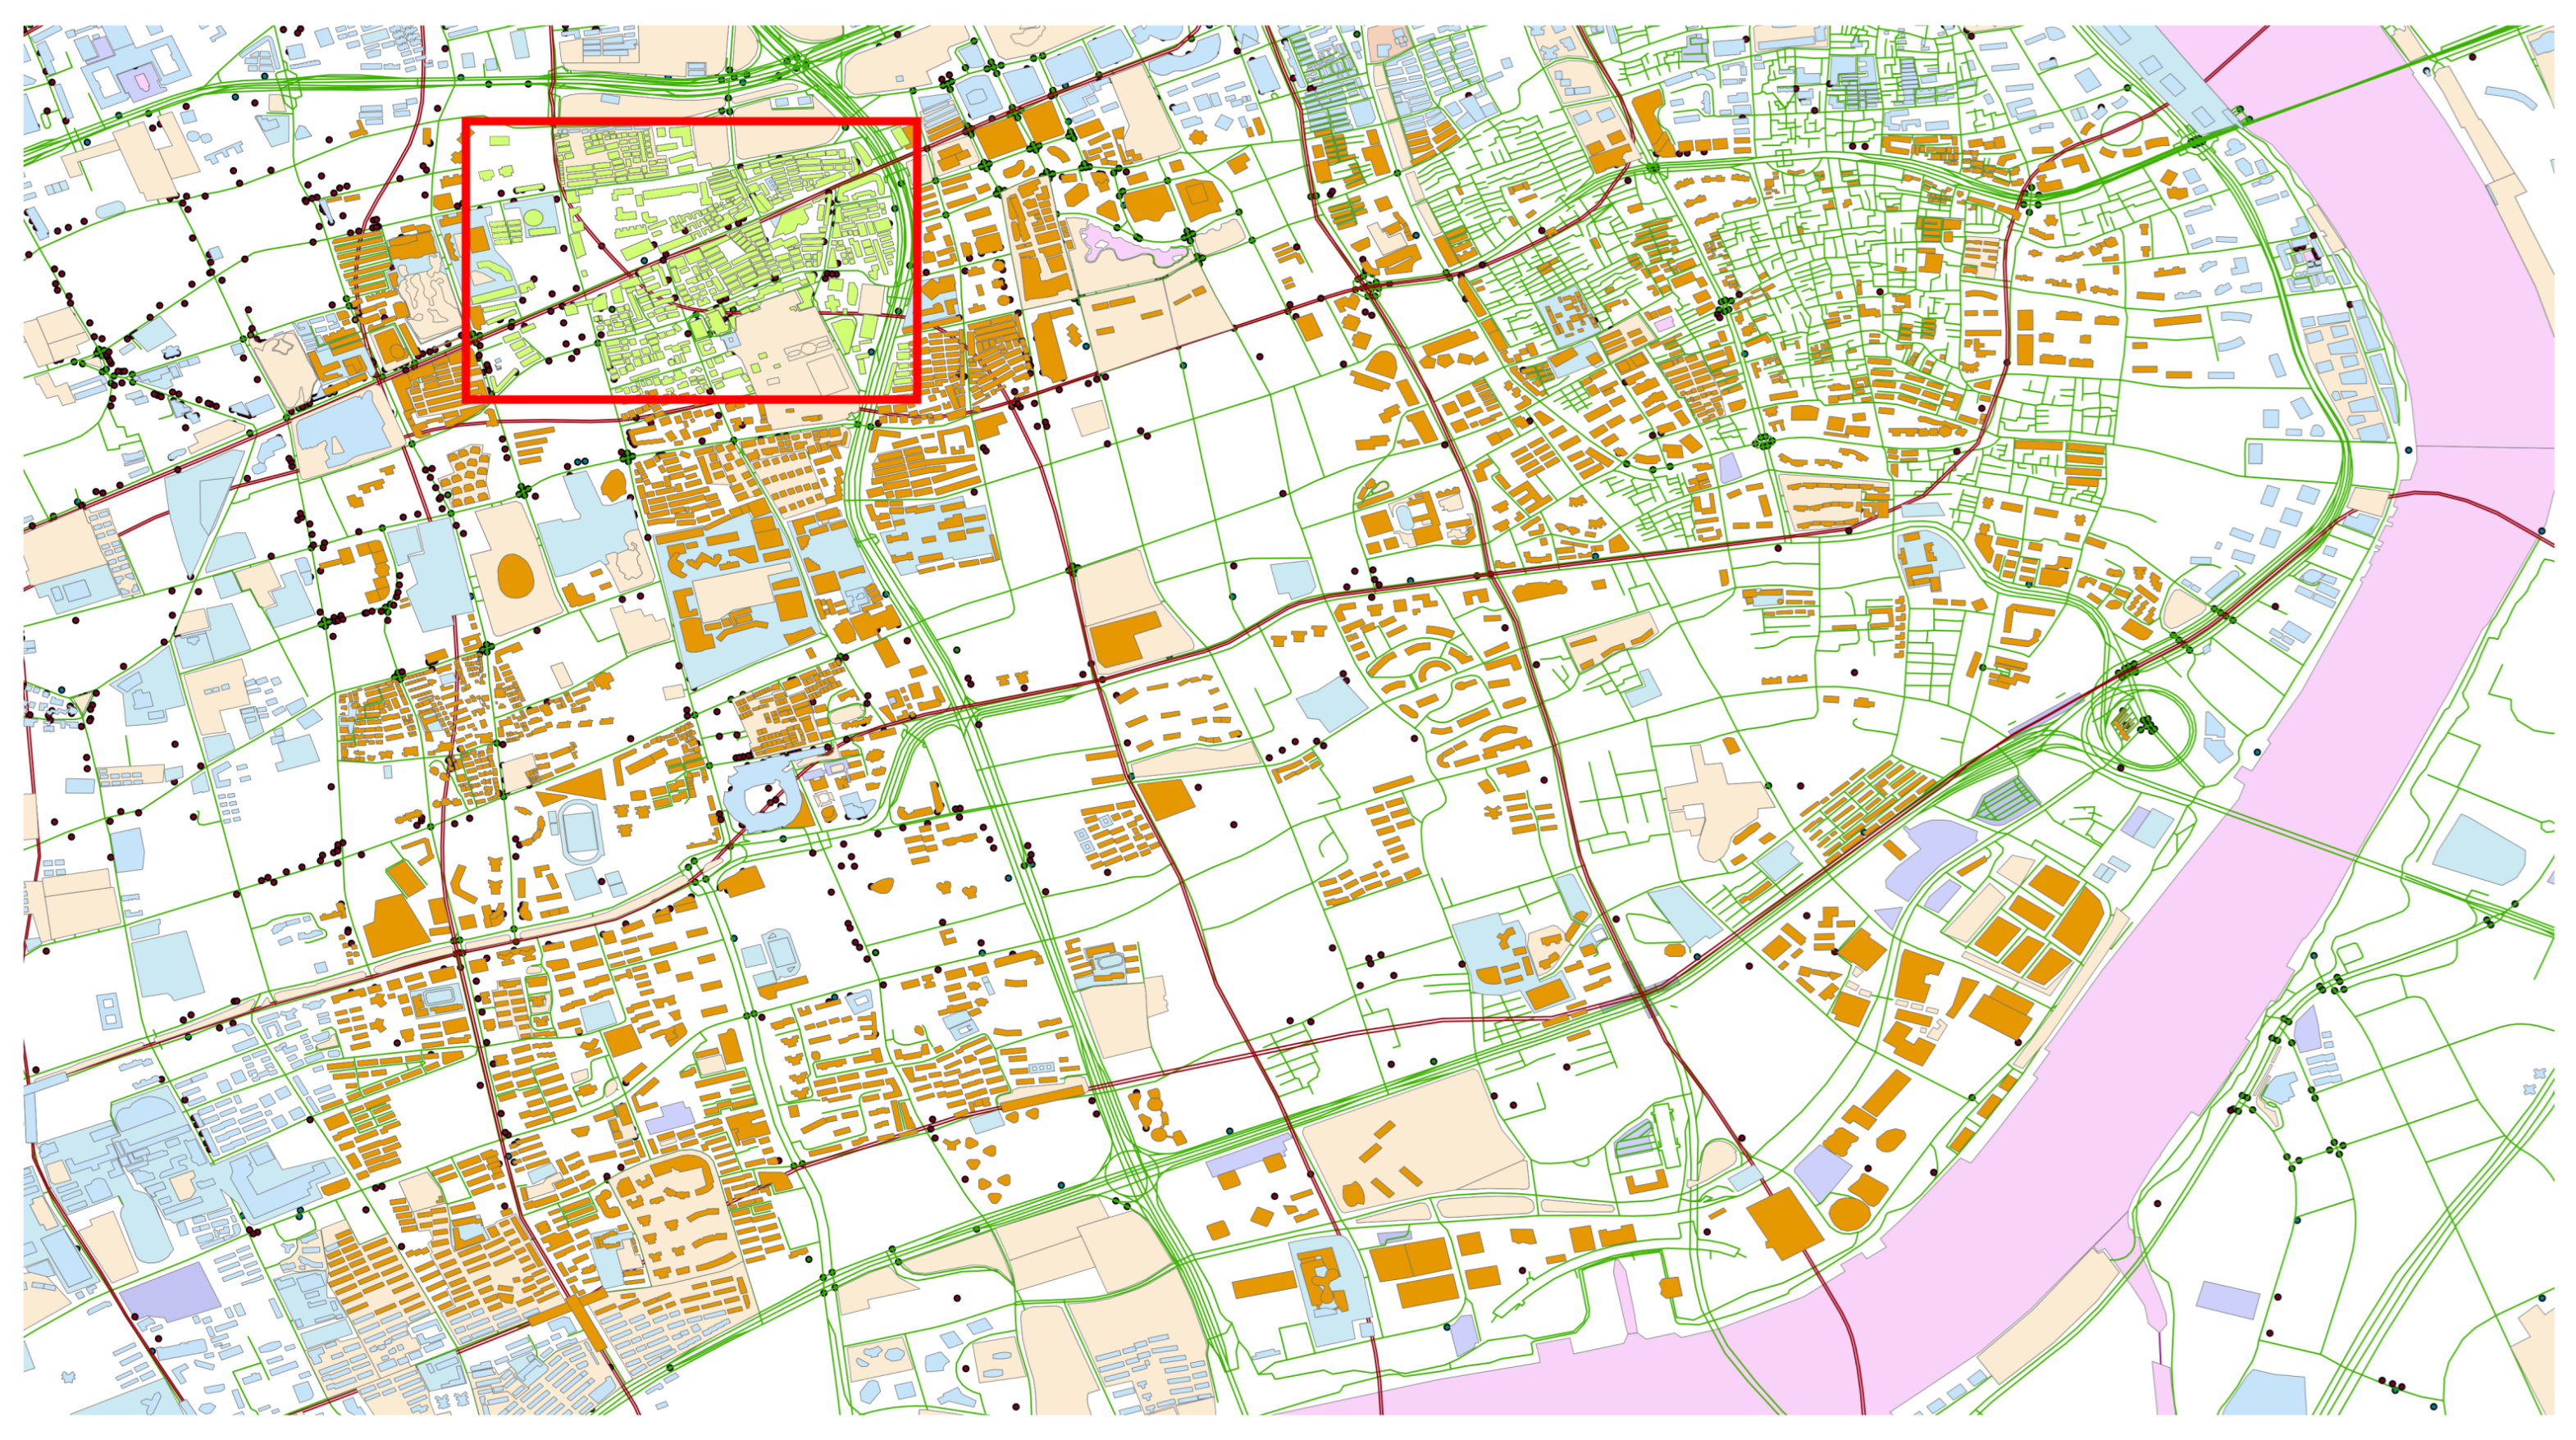
To further evaluate the proposed approach of DPCN, we also applied it to the shape recognition of buildings in the map from the Open Street Map. The selected area is shown in Figure 5. There are a total of 3059 buildings in this area. Most of them are shown in orange. However, the ones in the red box are in bright green, and they are in various shapes, such as I-shape and O-shape.
We have preprocessed all 3059 buildings with 16 input points. After training DPCN with the experimental data described in the above section, we applied DPCN to these buildings and predicted their shapes. Because DPCN has learned the feature extraction and shape recognition ability of the ten types of buildings as shown in Figure 3, the outputs are also the shapes of the ten types with which the buildings are most similar.
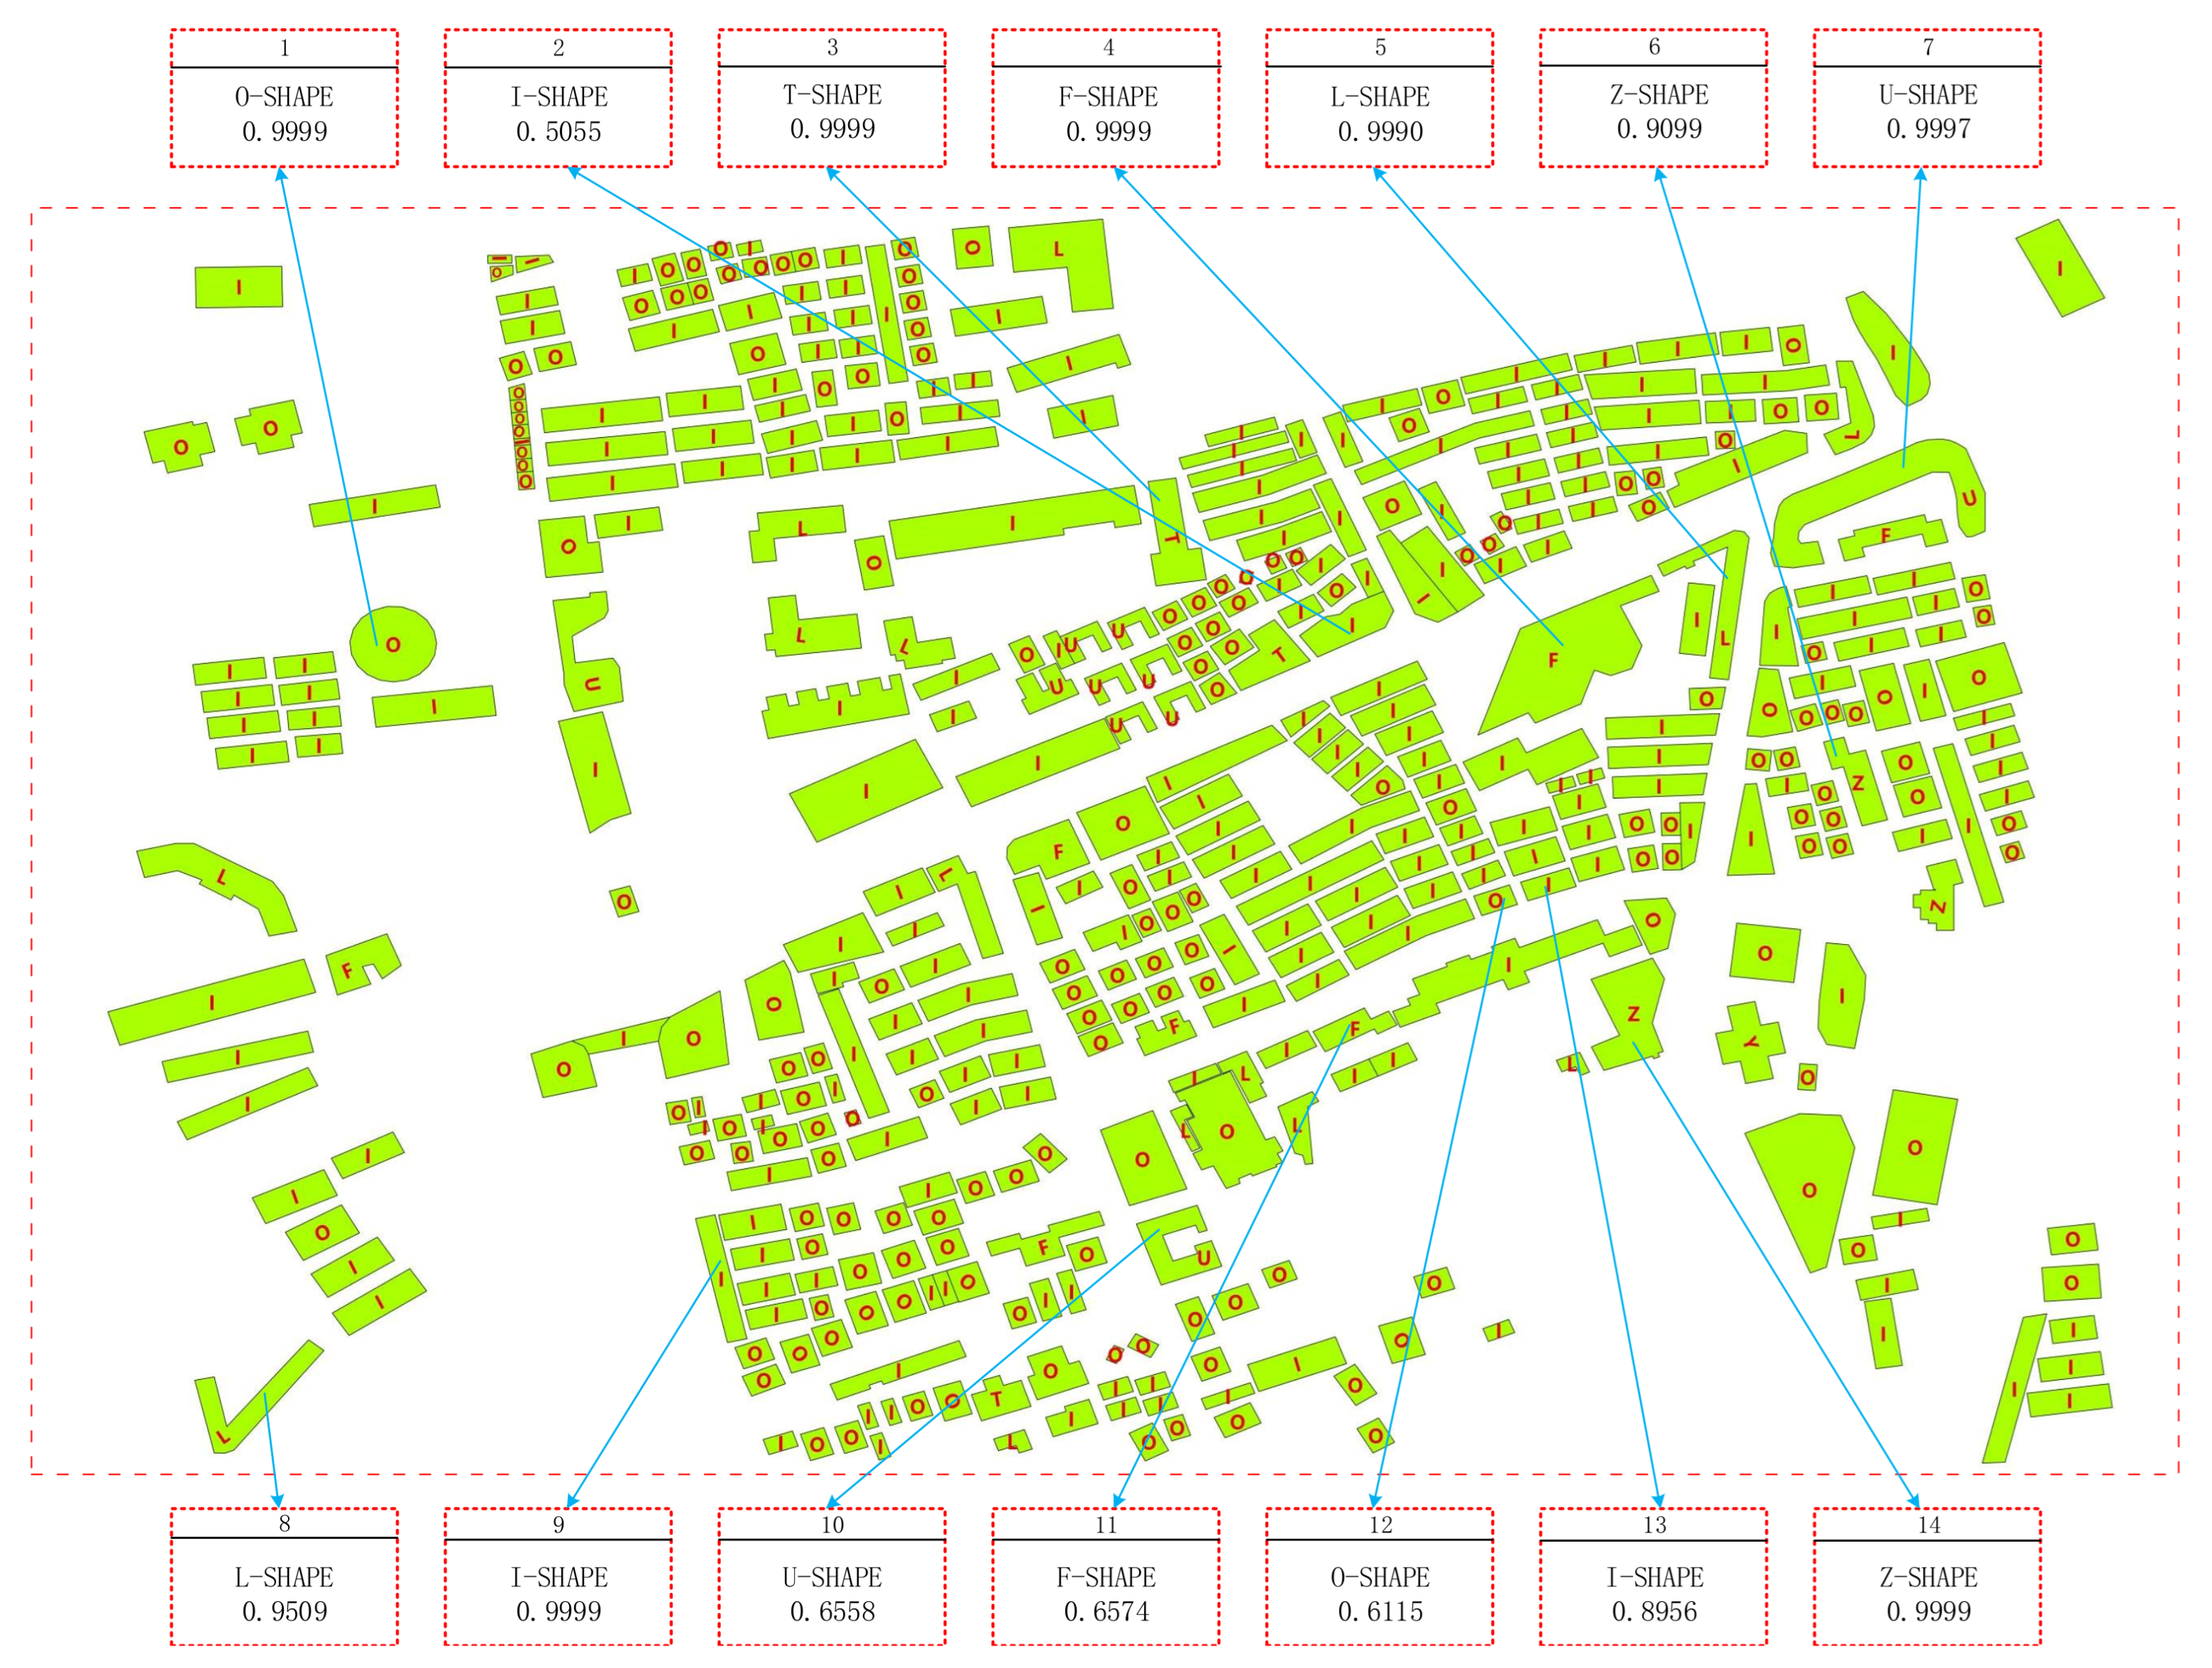
The prediction results for all the bright buildings in the red box in Figure 5 are shown in Figure 6. We can find that our method is able to correctly classify the shapes of most of the buildings. For example, for buildings with significant visual features such as 1, 3, 5, 9, their shapes can be correctly recognized by DPCN, and the prediction probabilities are close to 1. For some visually ambiguous buildings, such as 2, 4, 14, DPCN is also able to select the shape types with which there is the greatest similarity. By comparing the results between 5 and 8, and 7 and 10, we can see that DPCN is not sensitive to the orientation of buildings. For object 12, it looks like object 13, i.e., I-shape, but is predicted as an O-shape, which is not consistent with our visual perception. In the training dataset used in our experiments, the square shape buildings are labeled as O-shape. This may show that our method has learned to distinguish the O-shape from the I-shape according to the ratio of the long axis to the short axis of the building. When this ratio is less than the threshold learned by DPCN through training, DPCN assumes that the probability of the building belonging to the O-shape is greater than that of the I-shape. Therefore, with a probability of 0.6115, the building of 12 is predicted as O-shape instead of I-shape.
The results also show that some classification results do not match our visual perception. We believe there are several reasons for this phenomenon. First, the dataset we used to train DPCN was not rich enough, which led to DPCN not being able to classify buildings with less distinctive shape features. Second, because the shapes of some buildings do not belong to any of the 10 categories learned by DPCN, then DPCN can only give the result with the highest probability.
5. Conclusions
To better recognize the shapes of buildings in map space, this paper proposes a deep point convolutional network, which can execute the convolution directly on the points of the vector data. It does not require any intermediate representations, such as adjacency matrices and the geometric features of the points. A new convolution operator named TriangleConv is designed to perform the convolution on the points. It learns the feature representations of each point of the building by aggregating the features of the point and the local triangle constructed by the point and its two adjacency points.
To evaluate the proposed method, the dataset from the work of [28] was used, which consisted of 5010 vector buildings. Under the experimental conditions we used, compared with the typical graph neural networks of GCN, GAT, and GraphSAGE, and the point cloud neural networks of PointNet, PointNet++, and DGCNN, the proposed method has shown comparable performance on classifying the shapes of the buildings in map space in terms of accuracy, macro-precision, macro-recall, and macro-F1. The parameter sensitivity analysis also shows that too many or too few points for buildings will affect the shape recognition. Too few points make our method unable to obtain the shape features of the building well. Too many points will cause redundancy of information, thereby weakening the ability of our method to extract shape features.
Author Contributions
Conceptualization, Chun Liu, Yaohui Hu, and Junkui Xu; methodology, Chun Liu and Yaohui Hu; software, Chun Liu and Yaohui Hu; validation, Yaohui Hu and Zheng Li; investigation, Zheng Li; resources, Chun Liu and Zhigang Han; data curation, Yaohui Hu; writing—original draft preparation, Yaohui Hu and Chun Liu; writing—review and editing, Jianzhong Guo and Junkui Xu; supervision, Jianzhong Guo and Zhigang Han; project administration, Chun Liu; funding acquisition, Zhigang Han. All authors have read and agreed to the published version of the manuscript.
Funding
This research was funded by the National Natural Science Foundation of China (no. 41871316).
Institutional Review Board Statement
Not applicable for studies not involving humans and or animals.
Informed Consent Statement
Not applicable for studies not involving humans or animals.
Data Availability Statement
The source codes and dataset are available for downloading at the link: https://github.com/Huyaohui122/DPCN, accessed on 8 June 2021.
Acknowledgments
The authors would like to thank the editor, associate editor, and anonymous reviewers for processing our manuscript.
Conflicts of Interest
The authors declare no conflict of interest.
References
- Du, S.; Zhang, F.; Zhang, X. Semantic classification of urban buildings combining VHR image and GIS data: An improved random forest approach. ISPRS J. Photogramm. Remote Sens. 2015, 105, 107–119. [Google Scholar] [CrossRef]
- Zhou, X.; Chen, Z.; Zhang, X.; Ai, T. Change Detection for Building Footprints with Different Levels of Detail Using Combined Shape and Pattern Analysis. ISPRS Int. J. Geo-Inf. 2018, 7, 406. [Google Scholar] [CrossRef] [Green Version]
- Shea, K.S.; Mcmaster, R.B. Cartographic Generalization in a Digital Environment: When and How to Generalize. J. Fluid Mech. 1989, 1, 56–67. [Google Scholar]
- Mark, D.M.; Freksa, C.; Hirtle, S.C.; Lloyd, R.; Tversky, B. Cognitive models of geographical space. Int. J. Geogr. Inf. Sci. 1999, 13, 747–774. [Google Scholar] [CrossRef]
- Matikainen, L.; Hyyppä, J.; Ahokas, E.; Markelin, L.; Kaartinen, H. Automatic Detection of Buildings and Changes in Buildings for Updating of Maps. Remote Sens. 2010, 2, 1217–1248. [Google Scholar] [CrossRef] [Green Version]
- Touya, G.; Zhang, X.; Lokhat, I. Is deep learning the new agent for map generalization? Int. J. Cartogr. 2019, 5, 142–157. [Google Scholar] [CrossRef] [Green Version]
- Rainsford, D.; Mackaness, W. Template Matching in Support of Generalisation of Rural Buildings. In Advances in Spatial Data Handling; Richardson, D.E., van Oosterom, P., Eds.; Springer: Berlin/Heidelberg, Germany, 2002; pp. 137–151. [Google Scholar]
- Wang, H.L.; Wu, F.; Zhang, L.L.; Deng, H.Y. The application of mathematical morphology and pattern recognition to building polygon simplification. Acta Geod. Cartogr. Sin. 2005, 34, 269–276. [Google Scholar]
- Basaraner, M.; Cetinkaya, S. Performance of shape indices and classification schemes for characterising perceptual shape complexity of building footprints in GIS. Int. J. Geogr. Inf. Sci. 2017, 31, 1952–1977. [Google Scholar] [CrossRef]
- Yang, C.; Wei, H.; Yu, Q. A novel method for 2D nonrigid partial shape matching. Neurocomputing 2018, 275, 1160–1176. [Google Scholar] [CrossRef]
- Niu, X.X.; Suen, C.Y. A novel hybrid CNN-SVM classifier for recognizing handwritten digits. Pattern Recognit. 2012, 45, 1318–1325. [Google Scholar] [CrossRef]
- Simonyan, K.; Zisserman, A. Very Deep Convolutional Networks for Large-Scale Image Recognition. arXiv 2015, arXiv:1409.1556. [Google Scholar]
- Russakovsky, O.; Deng, J.; Su, H.; Krause, J.; Satheesh, S.; Ma, S.; Huang, Z.; Karpathy, A.; Khosla, A.; Bernstein, M. Imagenet large scale visual recognition challenge. Int. J. Comput. Vis. 2015, 115, 211–252. [Google Scholar] [CrossRef] [Green Version]
- Szegedy, C.; Liu, W.; Jia, Y.; Sermanet, P.; Reed, S.; Anguelov, D.; Erhan, D.; Vanhoucke, V.; Rabinovich, A. Going deeper with convolutions. In Proceedings of the IEEE Conference on Computer Vision and Pattern Recognition, Boston, MA, USA, 7–12 June 2015; pp. 1–9. [Google Scholar]
- Kalchbrenner, N.; Grefenstette, E.; Blunsom, P. A Convolutional Neural Network for Modelling Sentences. arXiv 2014, arXiv:1404.2188. [Google Scholar]
- Kim, Y.; Jernite, Y.; Sontag, D.; Rush, A.M. Character-Aware neural language models. In Proceedings of the 30th AAAI Conference on Artificial Intelligence, AAAI 2016, Phoenix, AZ, USA, 12–17 February 2016; AAAI Press: San Francisco, CA, USA, 2016; pp. 2741–2749. [Google Scholar]
- LeCun, Y.; Bengio, Y. Convolutional networks for images, speech, and time series. Handb. Brain Theory Neural Netw. 1995, 3361, 1995. [Google Scholar]
- Li, X.; Zheng, H.; Han, C.; Zheng, W.; Chen, H.; Jing, Y.; Dong, K. SFRS-Net: A Cloud-Detection Method Based on Deep Convolutional Neural Networks for GF-1 Remote-Sensing Images. Remote Sens. 2021, 13, 2910. [Google Scholar] [CrossRef]
- Lazer, D.; Pentland, A.S.; Adamic, L.; Aral, S.; Barabasi, A.L.; Brewer, D.; Christakis, N.; Contractor, N.; Fowler, J.; Gutmann, M. Life in the network: The coming age of computational social science. Science 2009, 323, 721–723. [Google Scholar] [CrossRef] [Green Version]
- Xu, B.; Cen, K.; Huang, J.; Shen, H.; Cheng, X. A survey on graph convolutional neural network. Chin. J. Comput. 2020, 43, 755–780. [Google Scholar]
- Bruna, J.; Zaremba, W.; Szlam, A.; LeCun, Y. Spectral Networks and Locally Connected Networks on Graphs. arXiv 2014, arXiv:1312.6203. [Google Scholar]
- Abdel-Hamid, O.; Mohamed, A.R.; Jiang, H.; Deng, L.; Penn, G.; Yu, D. Convolutional Neural Networks for Speech Recognition. IEEE/ACM Trans. Audio Speech Lang. Process. 2014, 22, 1533–1545. [Google Scholar] [CrossRef] [Green Version]
- Kipf, T.N.; Welling, M. Semi-Supervised Classification with Graph Convolutional Networks. arXiv 2017, arXiv:1609.02907. [Google Scholar]
- Veličković, P.; Cucurull, G.; Casanova, A.; Romero, A.; Liò, P.; Bengio, Y. Graph Attention Networks. arXiv 2018, arXiv:1710.10903. [Google Scholar]
- Hamilton, W.L.; Ying, R.; Leskovec, J. Inductive Representation Learning on Large Graphs. arXiv 2018, arXiv:1706.02216. [Google Scholar]
- Zhang, C.; Wang, J.; Yao, K. Global Random Graph Convolution Network for Hyperspectral Image Classification. Remote Sens. 2021, 13, 2285. [Google Scholar] [CrossRef]
- Yan, X.; Ai, T.; Yang, M.; Yin, H. A graph convolutional neural network for classification of building patterns using spatial vector data. ISPRS J. Photogramm. Remote Sens. 2019, 150, 259–273. [Google Scholar] [CrossRef]
- Yan, X.; Ai, T.; Yang, M.; Tong, X. Graph convolutional autoencoder model for the shape coding and cognition of buildings in maps. Int. J. Geogr. Inf. Sci. 2021, 35, 490–512. [Google Scholar] [CrossRef]
- Qi, C.R.; Su, H.; Mo, K.; Guibas, L.J. PointNet: Deep learning on point sets for 3D classification and segmentation. In Proceedings of the IEEE Conference on Computer Vision and Pattern Recognition, Honolulu, HI, USA, 21–26 July 2017; pp. 652–660. [Google Scholar]
- Qi, C.R.; Yi, L.; Su, H.; Guibas, L.J. PointNet++: Deep Hierarchical Feature Learning on Point Sets in a Metric Space. arXiv 2017, arXiv:1706.02413. [Google Scholar]
- Wang, Y.; Sun, Y.; Liu, Z.; Sarma, S.E.; Bronstein, M.M.; Solomon, J.M. Dynamic Graph CNN for Learning on Point Clouds. ACM Trans. Graph. 2019, 38. [Google Scholar] [CrossRef] [Green Version]
- Paszke, A.; Gross, S.; Massa, F.; Lerer, A.; Bradbury, J.; Chanan, G.; Killeen, T.; Lin, Z.; Gimelshein, N.; Antiga, L.; et al. PyTorch: An Imperative Style, High-Performance Deep Learning Library. arXiv 2019, arXiv:1912.01703. [Google Scholar]
- Kingma, D.P.; Ba, J. Adam: A Method for Stochastic Optimization. arXiv 2017, arXiv:1412.6980. [Google Scholar]
- Yan, X.; Ai, T.; Zhang, X. Template Matching and Simplification Method for Building Features Based on Shape Cognition. ISPRS Int. J. Geo-Inf. 2017, 6, 250. [Google Scholar] [CrossRef] [Green Version]
- Douglas, D.H.; Peucker, T.K. Algorithms for the reduction of the number of points required to represent a digitized line or its caricature. Cartogr. Int. J. Geogr. Inf. Geovis. 1973, 10, 112–122. [Google Scholar] [CrossRef] [Green Version]
- DGL Development Team. Deep Graph Library. 2018. Available online: https://docs.dgl.ai/en/0.5.x/index.html (accessed on 3 February 2021).
Figure 1.
The framework of DPCN. The left-most side indicates that the input of DPCN is a list of points with the coordinates as their initial features. The middle part is the network used by DPCN to learn the feature representations of the input buildings and predict their classes. The right-most part shows the output of DPCN, which is a score vector of which each dimension means the possibility that the input building belongs to a certain shape class.

Figure 2.
TriangleConv operator. (a) The vector data of a building; (b) the local triangle constructed by a point and its two adjacency points; (c) the architecture of the TriangleConv operator.
Figure 2.
TriangleConv operator. (a) The vector data of a building; (b) the local triangle constructed by a point and its two adjacency points; (c) the architecture of the TriangleConv operator.

Figure 3.
Examples of 10 different types of data in the experiment.

Figure 4.
The values of each evaluation metric of our proposed DPCN, graph neural network methods(GCN+F, GAT+F, GraphSAGE+F, GCN, GAT, GraphSAGE), and point cloud neural network methods(PointNet, PointNet++, DGCNN) vary with the increase of the number of epochs.
Figure 4.
The values of each evaluation metric of our proposed DPCN, graph neural network methods(GCN+F, GAT+F, GraphSAGE+F, GCN, GAT, GraphSAGE), and point cloud neural network methods(PointNet, PointNet++, DGCNN) vary with the increase of the number of epochs.

Figure 5.
The selected area from Open Street Map, which is a part of the urban area of Shanghai, China. Using the WGS84 coordinate system, this area is in the extent of 31.225670 dd (Up), 31.225670 dd (Down), 121.452669 dd (Left), and 121.498787 dd (Right).
Figure 5.
The selected area from Open Street Map, which is a part of the urban area of Shanghai, China. Using the WGS84 coordinate system, this area is in the extent of 31.225670 dd (Up), 31.225670 dd (Down), 121.452669 dd (Left), and 121.498787 dd (Right).

Figure 6.
The predicted results of the buildings in the selected area of Figure 5, which is marked with the red box.
Figure 6.
The predicted results of the buildings in the selected area of Figure 5, which is marked with the red box.


Table 1.
The results of the sensitivity analysis of the number of input points of each building.
| Point Number | Accuracy | Macro-Recall | Macro-Precision | Macro-F1 |
|---|---|---|---|---|
| 2 | 0.3941 | 0.6731 | 0.3689 | 0.3273 |
| 4 | 0.8624 | 0.8537 | 0.5437 | 0.5955 |
| 8 | 0.9624 | 0.9872 | 0.7486 | 0.8137 |
| 16 | 0.9842 | 0.9902 | 0.8376 | 0.8874 |
| 32 | 0.9752 | 0.9882 | 0.8079 | 0.8664 |
| 64 | 0.9762 | 0.9881 | 0.7914 | 0.8509 |
| 128 | 0.9733 | 0.9871 | 0.7300 | 0.8077 |
Table 2.
The results of the sensitivity analysis of the candidate convolution methods.
| Accuracy | Macro-Recall | Macro-Precision | Macro-F1 | |
|---|---|---|---|---|
| DPCN-3point | 0.9653 | 0.9858 | 0.7443 | 0.817 |
| DPCN | 0.9842 | 0.9902 | 0.8376 | 0.8874 |
Table 3.
The results of graph neural network methods(two cases), point cloud neural network methods, and our proposed DPCN using the same experimental environment and parameters.
Table 3.
The results of graph neural network methods(two cases), point cloud neural network methods, and our proposed DPCN using the same experimental environment and parameters.
| Accuracy | Macro-Recall | Macro-Precision | Macro-F1 | |
|---|---|---|---|---|
| GCN+F | 0.9505 | 0.9827 | 0.6877 | 0.7689 |
| GAT+F | 0.9505 | 0.9886 | 0.7455 | 0.8041 |
| GraphSAGE+F | 0.9574 | 0.9902 | 0.7498 | 0.8173 |
| GCN | 0.3396 | 0.3224 | 0.2835 | 0.1802 |
| GAT | 0.6465 | 0.4544 | 0.3298 | 0.3015 |
| GraphSAGE | 0.5010 | 0.7598 | 0.5116 | 0.4780 |
| PointNet | 0.9614 | 0.9243 | 0.7622 | 0.8048 |
| PointNet++ | 0.9505 | 0.9637 | 0.6999 | 0.7623 |
| DGCNN | 0.9634 | 0.9348 | 0.7135 | 0.7790 |
| DPCN | 0.9842 | 0.9902 | 0.8376 | 0.8874 |
Publisher’s Note: MDPI stays neutral with regard to jurisdictional claims in published maps and institutional affiliations. |
© 2021 by the authors. Licensee MDPI, Basel, Switzerland. This article is an open access article distributed under the terms and conditions of the Creative Commons Attribution (CC BY) license (https://creativecommons.org/licenses/by/4.0/).
Share and Cite
MDPI and ACS Style
Liu, C.; Hu, Y.; Li, Z.; Xu, J.; Han, Z.; Guo, J. TriangleConv: A Deep Point Convolutional Network for Recognizing Building Shapes in Map Space. ISPRS Int. J. Geo-Inf. 2021, 10, 687. https://doi.org/10.3390/ijgi10100687
AMA Style
Liu C, Hu Y, Li Z, Xu J, Han Z, Guo J. TriangleConv: A Deep Point Convolutional Network for Recognizing Building Shapes in Map Space. ISPRS International Journal of Geo-Information. 2021; 10(10):687. https://doi.org/10.3390/ijgi10100687
Chicago/Turabian StyleLiu, Chun, Yaohui Hu, Zheng Li, Junkui Xu, Zhigang Han, and Jianzhong Guo. 2021. "TriangleConv: A Deep Point Convolutional Network for Recognizing Building Shapes in Map Space" ISPRS International Journal of Geo-Information 10, no. 10: 687. https://doi.org/10.3390/ijgi10100687
Note that from the first issue of 2016, this journal uses article numbers instead of page numbers. See further details here.