Exploring the Characteristics of an Intra-Urban Bus Service Network: A Case Study of Shenzhen, China


1
School of Geography and Tourism, Shaanxi Normal University, Xi’an 710119, China
2
Geomatics Technology and Application key Laboratory of Qinghai Province, Xining 810001, China
3
Shaanxi Key Laboratory of Tourism Informatics, Xi’an 710119, China
4
School of Architecture and Urban Planning, Huazhong University of Science and Technology, Wuhan 430074, China
5
Key Laboratory of Urban Land Resources Monitoring and Simulation, Ministry of Land and Resources of China, Shenzhen 518034, China
6
Beijing Key Laboratory of Urban Spatial Information Engineering, Beijing 100038, China
7
College of Geology Engineering and Geomantics, Chang’an University, Xi’an 710054, China
8
Academy of Digital China (Fujian) and Fujian Collaborative Innovation Center for Big Data Applications in Governments, Fuzhou University, Fuzhou 350002, China
*
Author to whom correspondence should be addressed.
ISPRS Int. J. Geo-Inf. 2019, 8(11), 486; https://doi.org/10.3390/ijgi8110486
Submission received: 15 August 2019
/
Revised: 24 October 2019
/
Accepted: 28 October 2019
/
Published: 29 October 2019
Abstract
:The urban bus service system is one of the most important components of a public transport system. Thus, exploring the spatial configuration of the urban bus service system promotes an understanding of the quality of bus services. Such an understanding is of great importance to urban transport planning and policy making. In this study, we investigated the spatial characteristics of an urban bus service system by using the complex network approach. First, a three-step workflow was developed to collect a bus operating dataset from a public website. Then, we utilized the P-space method to represent the bus service network by connecting all bus stop pairs along each bus line. With the constructed bus network, a set of network analysis indicators were calculated to quantify the role of nodes in the network. A case study of Shenzhen, China was implemented to understand the statistical properties and spatial characteristics of the urban bus network configuration. The empirical findings can provide insights into the statistical laws and distinct convenient areas in a bus service network, and consequently aid in optimizing the allocation of bus stops and routes.
1. Introduction
A city can be considered as a place where people are more densely distributed, with developed industrial and commercial activities. Therefore, it is a place of aggregated people, resources, energy, and their interactions, and has been treated as a complex system since the 1950s. Recently, with the rapid growth of population and expansion of urban areas, the demand for urban mobility has been increasing. Consequently, big cities around the world have encountered a common challenge—traffic congestion. The development and improvement of urban public transport is an effective approach to alleviate urban traffic pressure. In a public transport system, the bus service system is a primary travel mode that attracts a large number of people because of its convenience and low cost. Therefore, when optimizing bus stops and lines, urban policy makers must understand the spatial configuration of urban bus systems to improve the service efficiency of these transport systems [1,2,3].
In a transport system, spatial interaction activity is a common phenomenon because people and cargo need to be transported from one place to another. Thus, different types of transport network systems are generated such as urban bus or metro networks, railroad networks, maritime networks, and aviation network systems. As a result, the network data model has become an effective tool for representing and extracting the latent topological properties of public transport networks [4,5,6,7]. In a network system, places and interaction activities can be modeled as nodes and edges, respectively. Complex network theory has been developed to investigate the network characteristics of the connections and interactions between elements in the last few decades [8,9]. More recently, this theory has been widely applied by researchers to urban transport-related studies for exploring urban polycentric spatial structures [10,11,12] or commuting structures [13,14,15], revealing human mobility patterns [16,17], identifying critical locations or the backbone of urban streets [18,19,20,21], and evaluating the vulnerability of urban metro networks [22,23,24]. Therefore, complex network analysis can be powerful for examining the underlying characteristics of systems that represent spatial interaction activities such as public transport systems.
For urban bus service systems, a body of literature has utilized the sophisticated complex network theory to uncover the raw statistics of bus networks by calculating a set of indicators such as degree, centrality, and clustering coefficient [9,25,26,27]. For example, researchers can compare bus networks in different cities by quantifying their configurations with these indicators [28,29,30]. In statistical analysis, an important measurement method is to examine the degree distribution of nodes to determine whether the bus network is a scale-free network [31,32]. The scale-free property indicates that heterogeneity exists in the network [9,33]. Another important measurement is to analyze the small-world property of bus networks, which can be detected through the clustering coefficient and average path length [9,34,35,36]. For example, a spatial representation model based on the geographical location of bus stops and routes was proposed to perform a statistical study on the network features of the bus network in [37], however, the geographical spatial distribution characteristics (e.g., spatial interaction communities of bus networks) of the network indicators were not revealed. Obviously, these existing studies have mainly focused on investigating the statistical properties (e.g., degree distribution model, and small-world and scale-free laws) of urban bus networks, and the methods used in these studies were very similar; that is, some network indicators were defined to analyze the topological statistical laws of these indicators. Another study utilized the network analysis methods to detect the dynamics of urban structures, which mainly concentrated on identifying the temporal changes of an urban spatial structure by using big smart card data [12]. However, this study did not focus on the bus network configuration structure. Thus, the present study aimed to investigate the spatial characteristics of bus networks to determine nodes with dominant or low accessibility and connections in urban space, the spatial interaction structure generated by bus lines, and the relationship between the bus and road networks. Understanding these characteristics would provide a deep spatial insight of bus networks, which is meaningful to urban transportation and planners to optimize the original network such as by changing the route of some bus lines to improve the accessibility of areas with few buses passing through.
In this study, we not only analyzed the statistical characteristics of the bus network, but also mapped these statistical indicators onto spatial areas to explore the spatial characteristics of the bus service system by using complex network methods. Like in previous studies, the typical degree distribution and small-world property were analyzed to quantify the whole topological features of the bus network. In addition, we also focused on the spatial distribution of three centrality indicators and the closely interacting communities formed by the bus service network. Specifically, we first developed a program to crawl the urban bus operating dataset from a public transport inquiry website and projected these bus stops onto a geographic space using a public map service platform. Next, the bus service spatial network was constructed using the P-space graph method to represent the linking relation between bus stops. Such a relation is implied in the configuration of bus lines. Finally, a set of network analysis indicators, namely, degree, clustering coefficient, average path length, and centrality, were calculated to evaluate the network properties and quantify the importance of nodes in the bus service network. A case study of Shenzhen, China was implemented to enhance our understanding of the statistical and spatial characteristics of the allocation of the bus service system on the basis of the spatial units of traffic analysis zones (TAZs).
The contributions of this study are two-fold. First, it provides a deep insight into the statistical and spatial characteristics of an intra-urban bus service system in a metropolis of China through the classical complex network approach. Second, evaluation of the network properties and the importance of nodes in the bus service network can help urban governments, transportation and planning departments, and planners learn more about intra-urban bus networks. For example, by mapping the centrality of the bus network onto TAZs, planners could identify the TAZs with high or low accessibility, connectivity, and influence on others in the bus service network.
2. Study Area and Dataset
2.1. Study Area
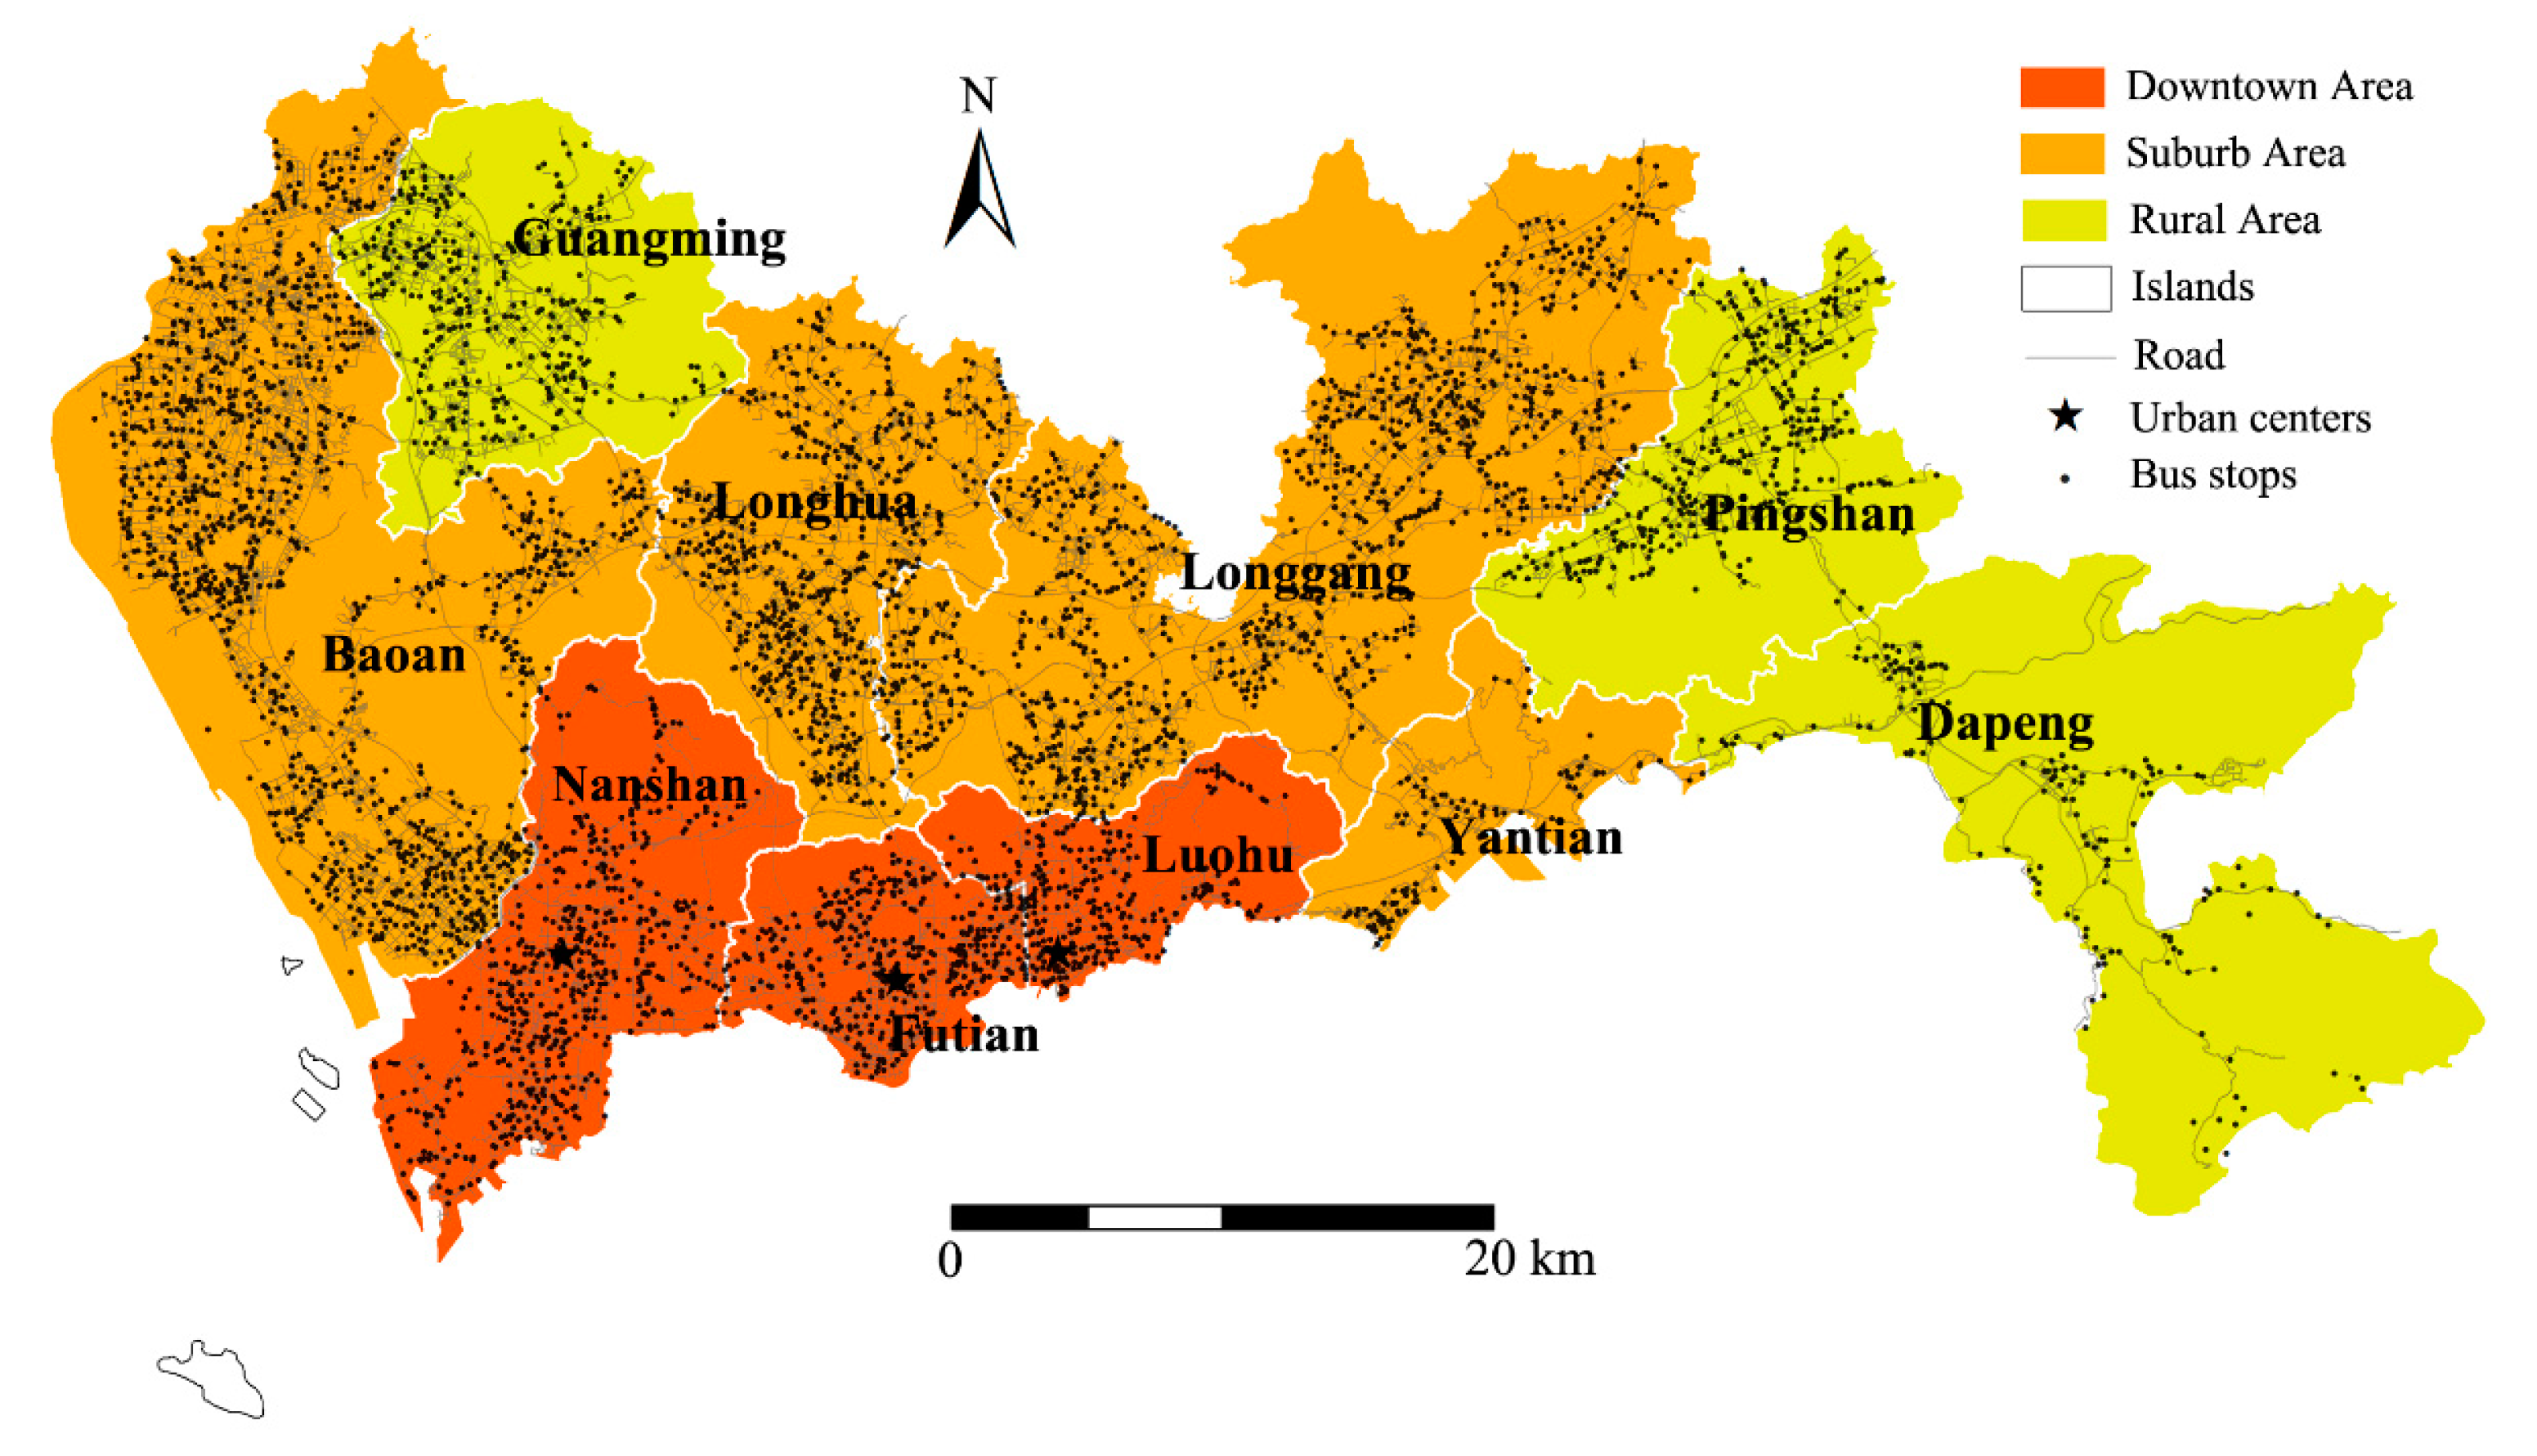
The case study area of this work was Shenzhen, which is located in the southeast of China, near Hong Kong. It was designated as the first special economic zone after the launch of the reform and opening-up policy of China. Shenzhen is considered as a special economic zone; this means that it benefits from a number of welfare policies in economic development (e.g., creating a favorable investment environment, reducing customs duty, and allowing the introduction of advanced technologies). This city has experienced tremendous change after being developed into a famous international metropolis from three fishing villages over the past four decades. Currently, it encompasses 10 administrative districts, which are further divided into downtown areas, suburbs, and rural areas according to the economic development (Figure 1). Shenzhen covers an area of approximately 2000 km2 and has a population of more than 15 million, making it the most densely populated among Chinese cities [15,38]. The unique socioeconomic and demographic status of Shenzhen makes it an interesting area for the study of urban bus networks.
To meet the massive daily travel demand of citizens, the government has constructed a multimodal public transport service system comprised of buses, subways, taxis, and bicycles. This study focused on the bus service system. The service area generated by bus stops has a radius of 500 m, accounting for more than 80% of the entire area of Shenzhen. This coverage is outstanding when compared with other large cities in China. Due to the convenience and low fare of buses, approximately 55.6% of passengers in Shenzhen have opted to travel by bus. Therefore, Shenzhen was selected as the case study to explore the characteristics of a bus service system. The results of this study can be referenced by other cities to improve the efficiency of their bus services.
2.2. Dataset Collection
The bus dataset used in this study was acquired from a public transport inquiry website (www.8684.cn/) that provides bus query services for most Chinese cities. The website updates in real time, that is, once the operation of buses (e.g., bus stops and bus lines) shows a change in the city. The website is linked to the homepage of the Shenzhen Bus Company (the company in charge of Shenzhen’s bus system) to provide a bus inquiry service for citizens. Thus, the dataset collected from this website is reliable for exploring characteristics of the urban bus system. A three-step workflow was proposed to collect the bus data based on this website. First, we developed a web crawler program to crawl all bus lines from the website including every bus line number and bus stop name that each bus passed. Consequently, we generated a set of bus stops. Second, we projected these stops onto a spatial map. To achieve this goal, we utilized the Amap platform, which is a famous map service operator in China to obtain the geographic coordinates of each stop [39]. The platform provides the service of a geocoding API (application programming interface) to interpret an address into the corresponding latitude and longitude on the basis of its coordinate system. Finally, we transformed the latitude and longitude into a universal WGS84 (World Geodetic System 1984) coordinate system to match the other geospatial data of the study area.
Through this workflow, a total of 1016 bus lines were obtained in Shenzhen. Each bus line operates in a two-way fashion, which implies that the buses take the same route in outward and return directions. Thus, two bus stops are located on both sides of the road for the same stop. This study did not consider the directions of the bus lines, and pairs of bus stops with the same name on either side of the road were merged into one stop. Accordingly, a total of 5334 bus stops were generated. Figure 1 shows the spatial distribution of the extracted bus stops, which were mainly distributed along the road network.
3. Complex Network Analysis
In this section, the construction of the proposed complex network based on the bus lines and bus stops is initially described. Then, some network indicators are introduced to quantify the structure and centrality of the urban bus service network.
3.1. Network Construction
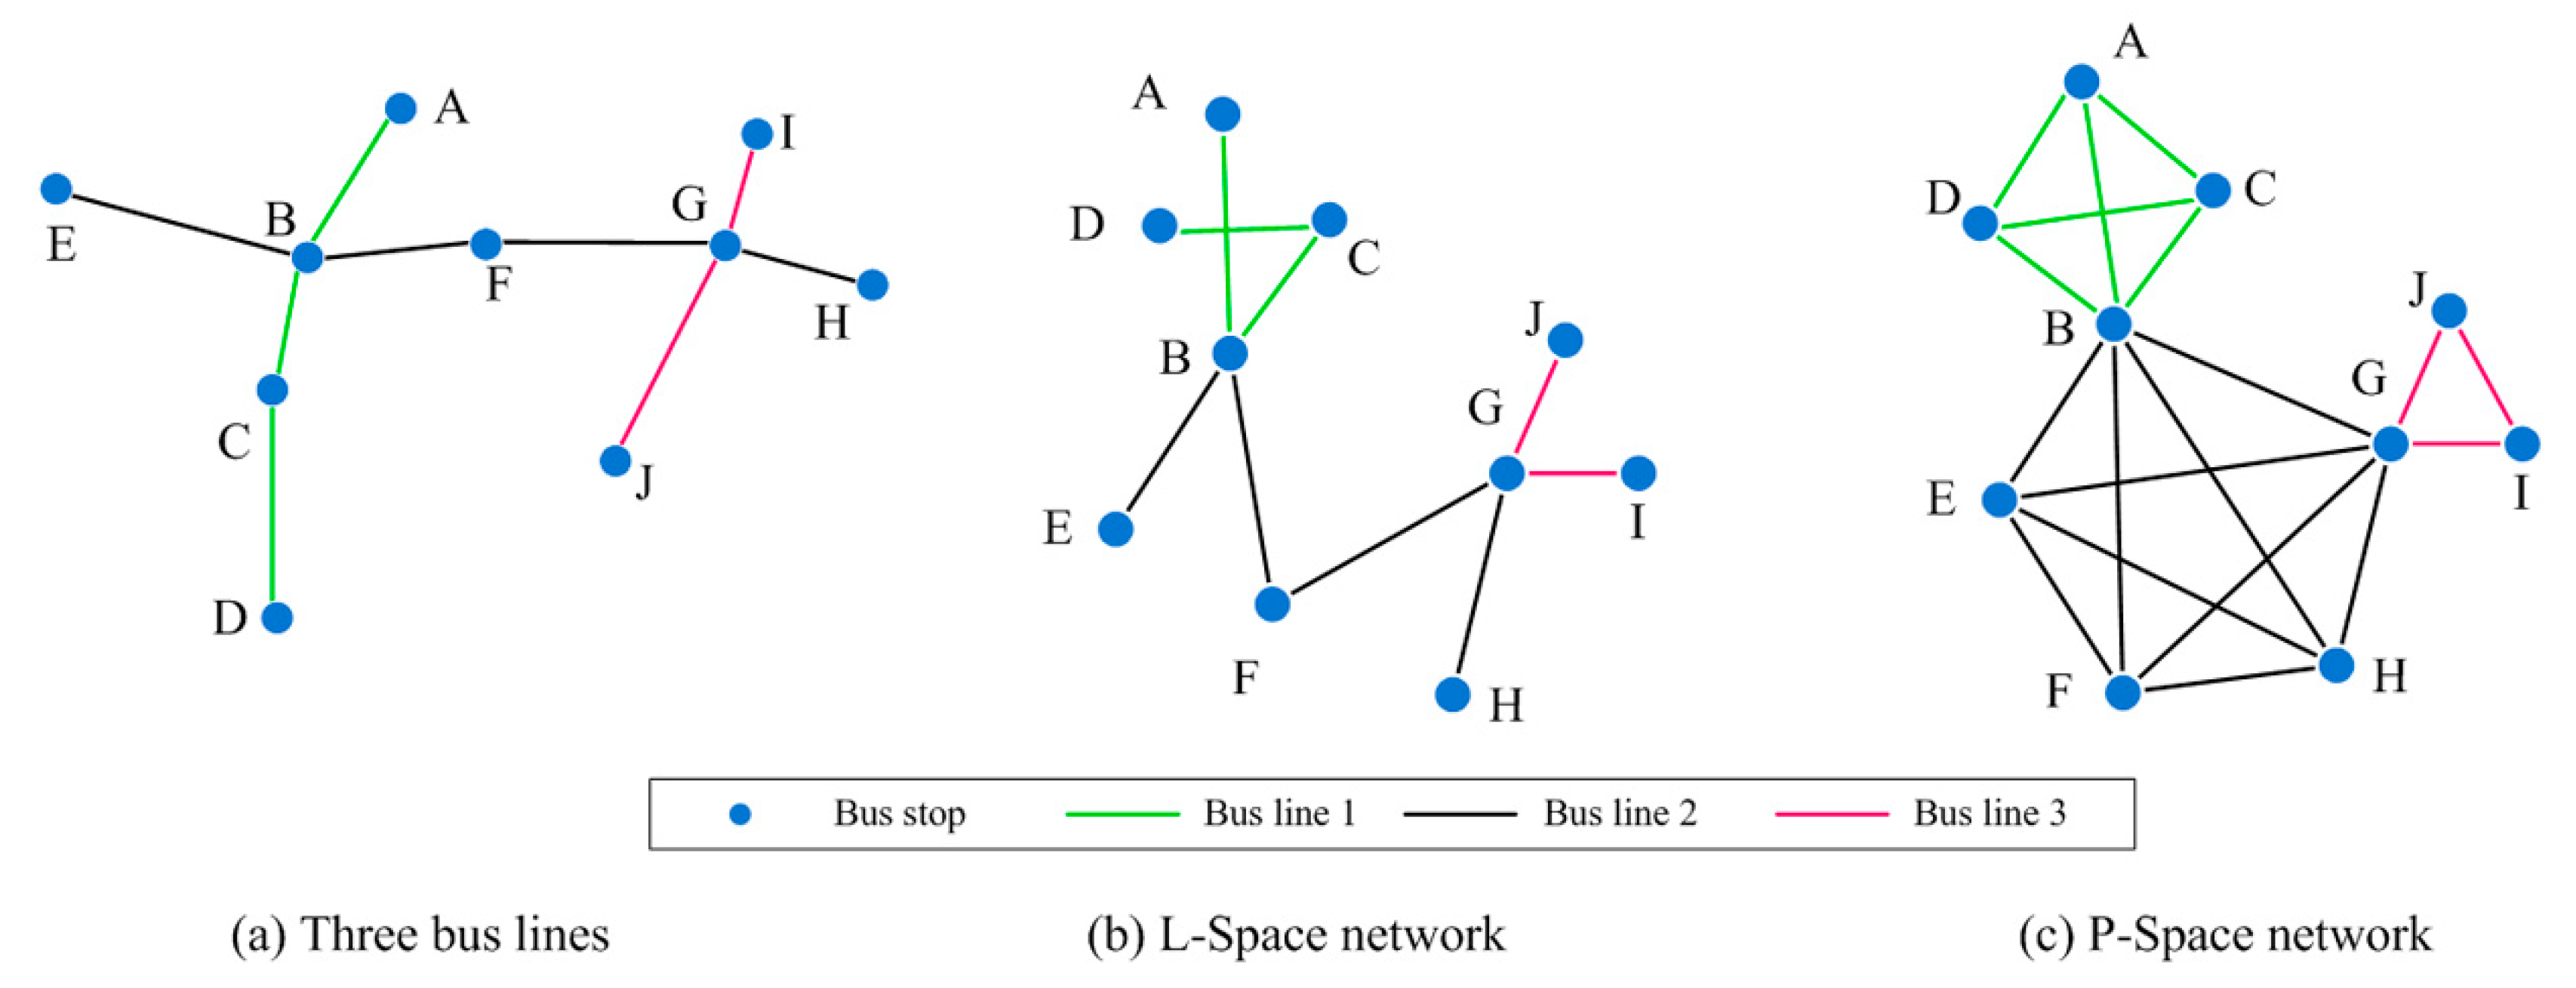
Generally, two popular methods are used to represent transport network systems, namely, L-space and P-space methods. The L-space method directly connects the adjacent bus stops along the same bus line, as shown in Figure 2b, which could only represent the original configuration of the bus network. The P-space method connects all bus stop pairs that pass along the same bus line (Figure 2c). Unlike the L-space method, this method is used to measure whether two stops are accessible by the same bus line, thus it generates a completely connected graph [9,40]. For example, bus line 3 in Figure 2 passes three stops, namely I, G, and J. In L-space, there is no direct connection between stop I and stop J (Figure 2b), but there is a direct connection between the two stops in the P-space because they can access each other through bus line 3 (Figure 2c). Therefore, the P-space method is more suitable for analyzing the spatial transfer and correlation of bus stops. This study utilized the P-space method to construct the bus service network.
In the P-space bus service network G = (V, E, W), a node vi is a bus stop i, and a weight is assigned to each link of a bus line. First, the weight wij of edge eij between vi and vj in the network is initialized as wij = 0. For every bus line, the specific rule to obtain the weight matrix W is as follows:
(1) If two nodes vi and vj can be accessed without any transfer, it is considered that the two nodes are connected to each other, and the corresponding weight wij between vi and vj is set to plus 1.
(2) For each pair of nodes on the same bus line, there is no need to make any transfer, as shown in Figure 2c. For instance, bus line 1 passes through the four stops of A, B, C, and D. This line can be converted into six links: A–B, A–C, A–D, B-C, B–D, and C–D. Finally, the weight matrix of a bus service network derived from P-space method is W = {wij}.
The spatial analysis units in this study were the TAZs (traffic analysis zones). TAZs are the basic spatial analysis units used in transportation planning to forecast the trip generation and travel demand. It is assumed that people living in the same TAZ show similar demographic characteristics [41,42]. The design of TAZs is usually implemented by urban planners or transport geographers. Therefore, it is reasonable for planners and researchers to adopt the TAZ as a basic unit for researching urban transportation problems. In this study, we obtained the TAZ file from the local transport department. We aggregated the constructed stop-based network by excluding the edges when both stops were located in the same TAZ and generated the new TAZ-based network GTAZ = (V, E, W). In this network, node Vi represents TAZ , edge Eij represents the connection between TAZ i and TAZ j, and weight wij represents the number of bus lines that pass through the two TAZs. Ultimately, a TAZ-based network with more than 965 nodes and 71,000 links was constructed for use in the subsequent analysis.
3.2. Topological Analysis of the Bus Service Network Structure
In the field of complex network theory, a network can be classified into different types (e.g., random, small-world, and free-scale networks), according to their statistical characteristics such as degree distribution, clustering coefficient, and average path length. Therefore, this section presents the probe into the overall topological features of the bus service network by calculating the three basic indicators. The weight of edge is not considered in the topological analysis.
(1) Degree and degree distribution
Degree is a basic measurement index in network analysis and represents the total number of edges connected to a node [8]. For an undirected network, the degree of node can be defined as follows:
In this study, N represents the total number of TAZs, and the degree ki of a TAZ represents the number of TAZs connected directly to the TAZ by at least one bus line. The degree distribution can be calculated as follows:
where nk represents the number of TAZs whose degree is equal to k.
(2) Average path length
The average path length presents the average number of edges along the shortest paths between all possible node pairs in the network [43]. This parameter can be calculated as
where dij is the number of edges of the shortest path between nodes i and j. A small average path length indicates good network accessibility.
(3) Clustering coefficient
The clustering coefficient is used to measure the extent of the local aggregation in the network [43]. The clustering coefficient of a node can be defined as the proportion of the actual edges Ei between nodes within its neighborhood divided by the maximal possible edges between them:
The clustering coefficient of the entire network is the average of all nodes in the network. The larger the clustering coefficient of the network, the greater the local aggregation. This parameter can be expressed as follows:
3.3. Nodes’ Centrality Measurement of the Weighted Bus Network Structure
In this section, weight is considered in measuring the importance of nodes (TAZs) in the configuration of the bus service network. Generally, centrality is used to quantify the extent of importance of the nodes in the network. Therefore, the node of closeness centrality, betweenness centrality, and PageRank score were used to represent the TAZs’ accessibility, connectivity, and influence on others in the network, respectively.
(1) Closeness centrality
The closeness centrality of a node is used to quantify how close the node is to others by using the shortest path [44], which is defined as the reciprocal of the average shortest path length from the node to others:
where dij is the shortest path length between TAZ i and TAZ j. The larger the closeness centrality, the more conveniently TAZ i can be accessed from other TAZs by taking a bus. Thus, closeness centrality can represent the accessibility of TAZs.
(2) Betweenness centrality
Betweenness centrality measures the connectivity of a node, which reflects the capacity of the intermediate transitivity of the node in the network [45]. The index is defined as follows:
where njk represents the number of all shortest paths between TAZ j and TAZ k, and njk(i) is the number of shortest paths that pass through TAZ i. The larger the betweenness centrality, the more critical the TAZ in connecting TAZ pairs by taking the shortest path. Thus, betweenness centrality reflects the importance of a TAZ as a critical bridge in the bus service network.
(3) PageRank score
PageRank score is used to measure the importance of nodes by comprehensively considering the importance of the nodes it connects [46]. It considers a strongly connected node to be more important than nodes with few connections. Therefore, a PageRank score can differentiate the importance of nodes with the same degree or strength. For an undirected and weighted network, the PageRank score can be calculated as follows:
where λ is a free parameter, and the value of 0.85 was used in this study for the calculation [45]; Ei is the set of edges that connects with node i; ki represents the degree of node i; and PRi represents the PageRank score of node i, and its calculation is an iterative process. The larger the score, the more important the TAZ in the bus service network.
4. Result and Discussion
4.1. Statistical Characteristic of the Bus Service Network
4.1.1. Degree Distribution
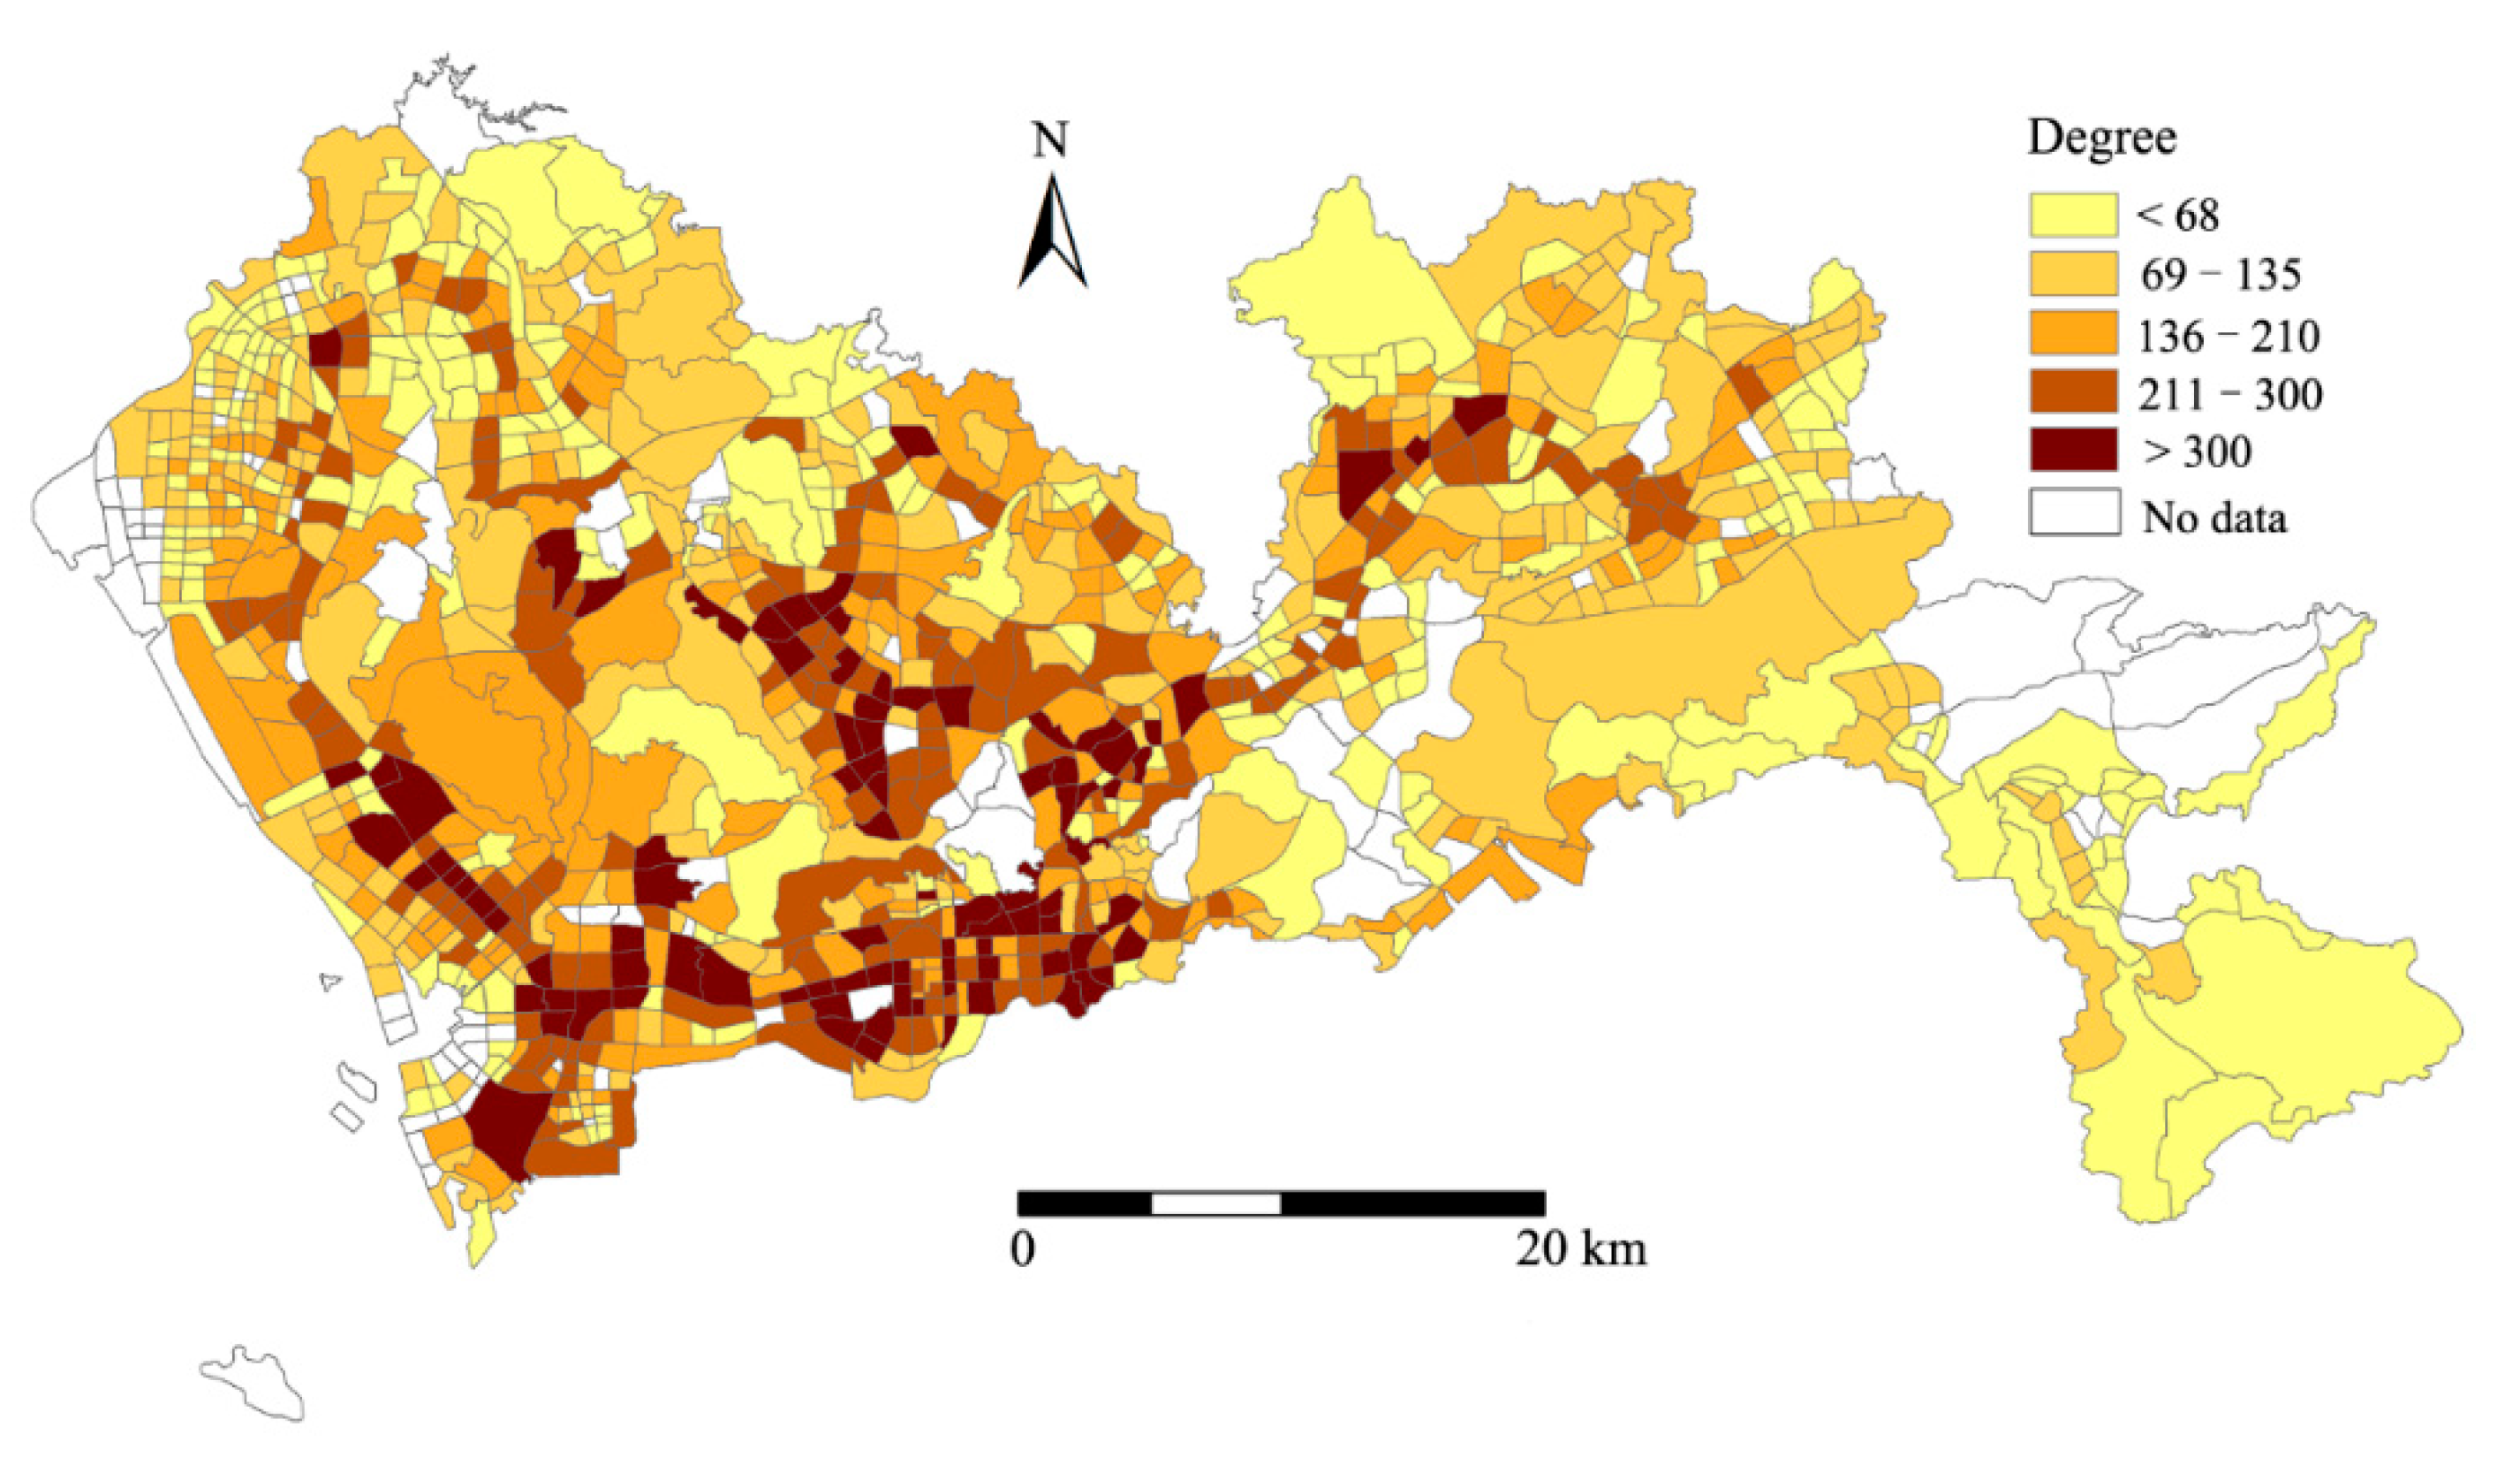
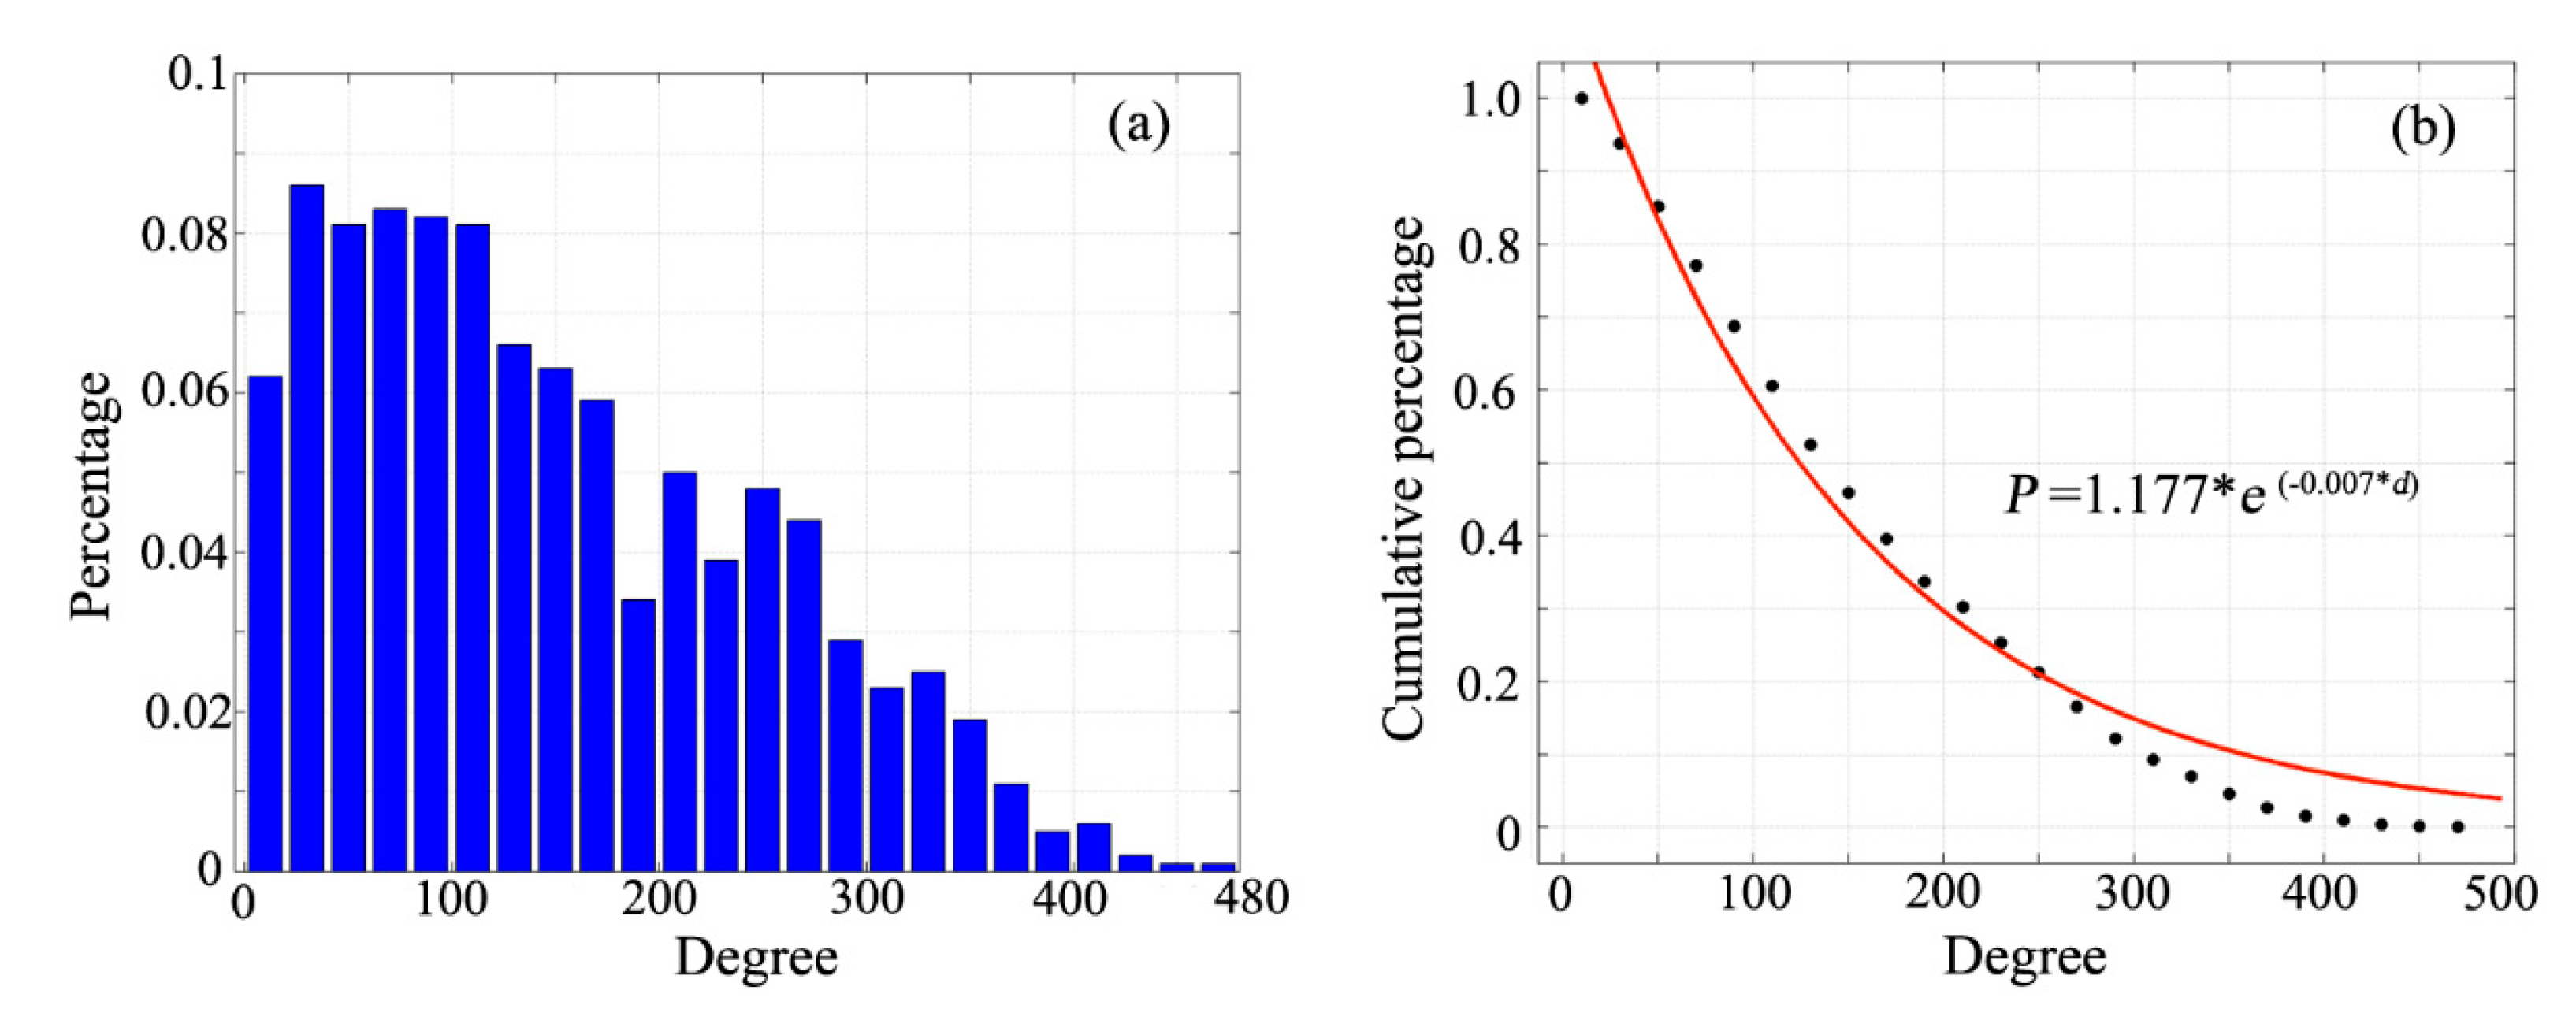
Figure 3 shows the degree of spatial distribution. On the basis of the method of network construction, the degree of a TAZ indicates the number of directly connected TAZs, that is, at least one bus line runs between the TAZ and others. Thus, the larger the degree of the TAZ, the greater the number of other TAZs that can be reached by taking a bus without transfer. As shown in Figure 3, the TAZs located in the southern part of Shenzhen have more degree distributions than those in the northern part (downtown areas). Figure 4a displays the statistical degree distribution, the minimum and maximum values of degree were 3 and 466, respectively, and the average value of degree was 148. For the cumulative degree distribution (Figure 4b), the distribution appears as an approximate process of linear decline, and the decay process can be well fitted by an exponential function, which is consistent with previous studies [28,32,47]. This result demonstrates that the degree does not follow the power law distribution in Shenzhen, indicating that the bus service network does not show a scale-free network property. Moreover, this observation is consistent with the results in [48], which implies that urban public transport systems rule out the law of scale-free because the stops are connected nearly randomly in P-space representation [9,31]. Furthermore, the results illustrate that the configuration of the bus service system in Shenzhen is relatively fair in terms of the direct arrival of buses to few TAZs with enormous reachability.
4.1.2. Small-World Property
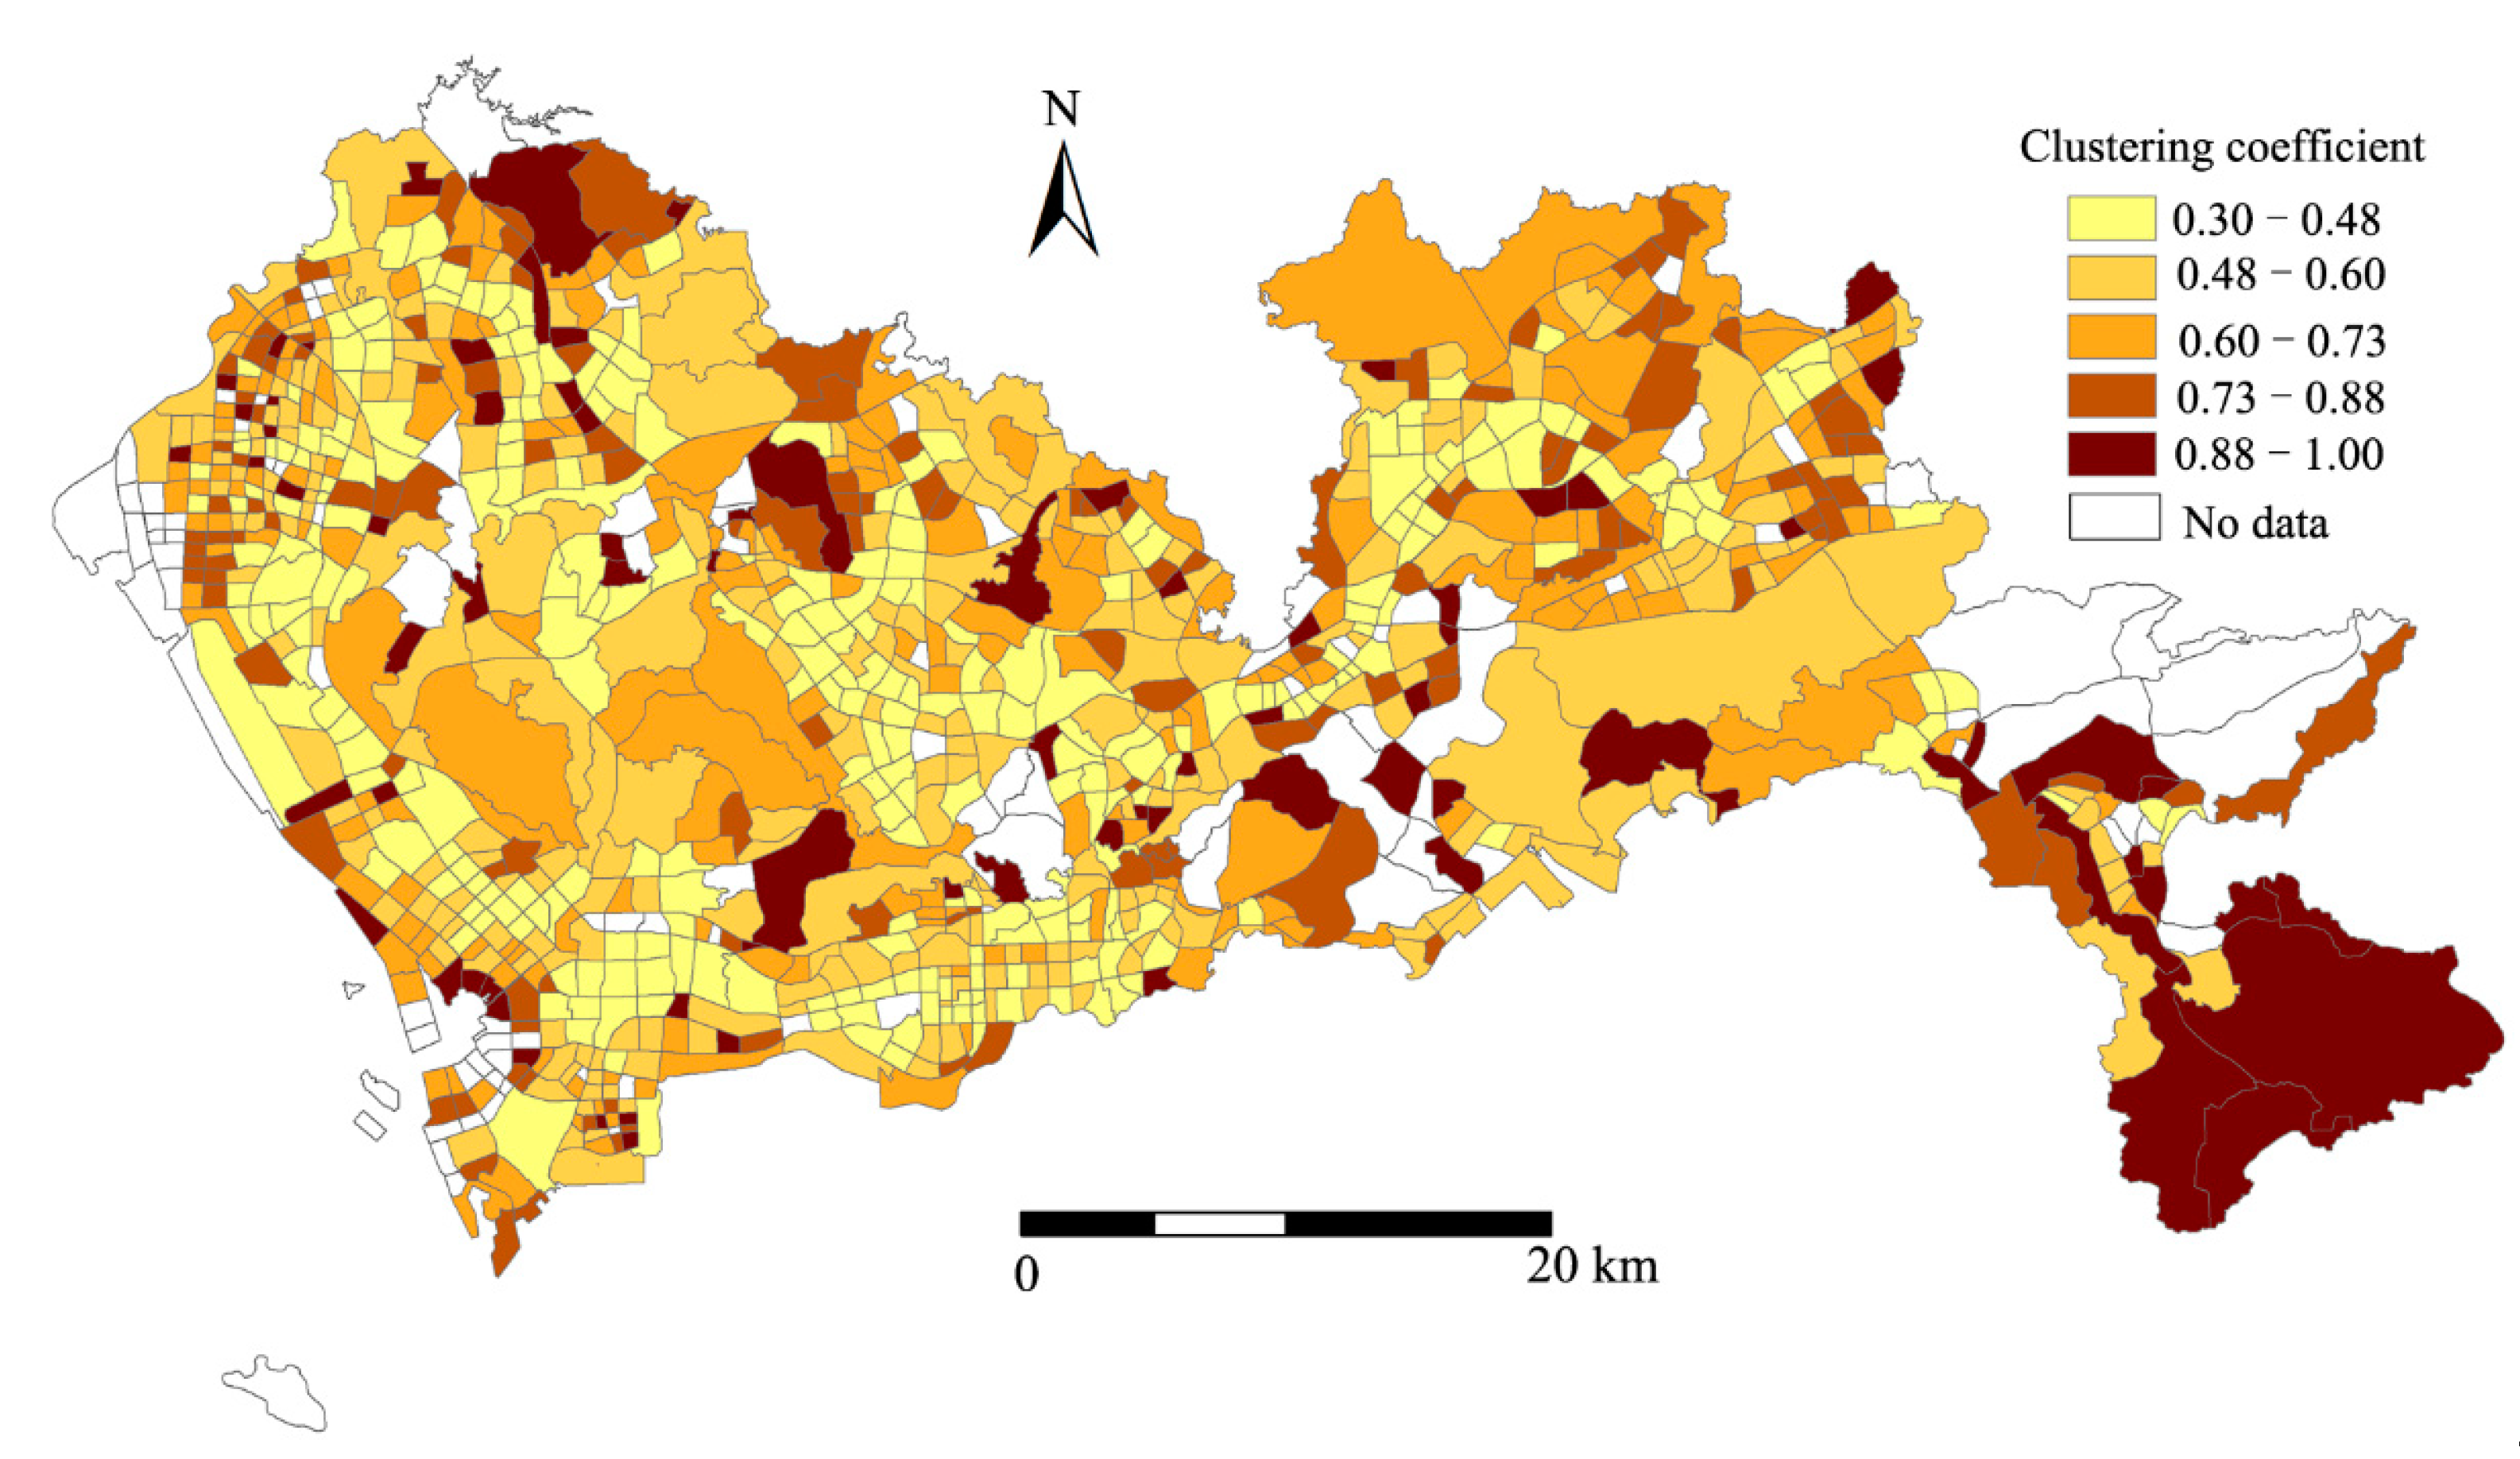
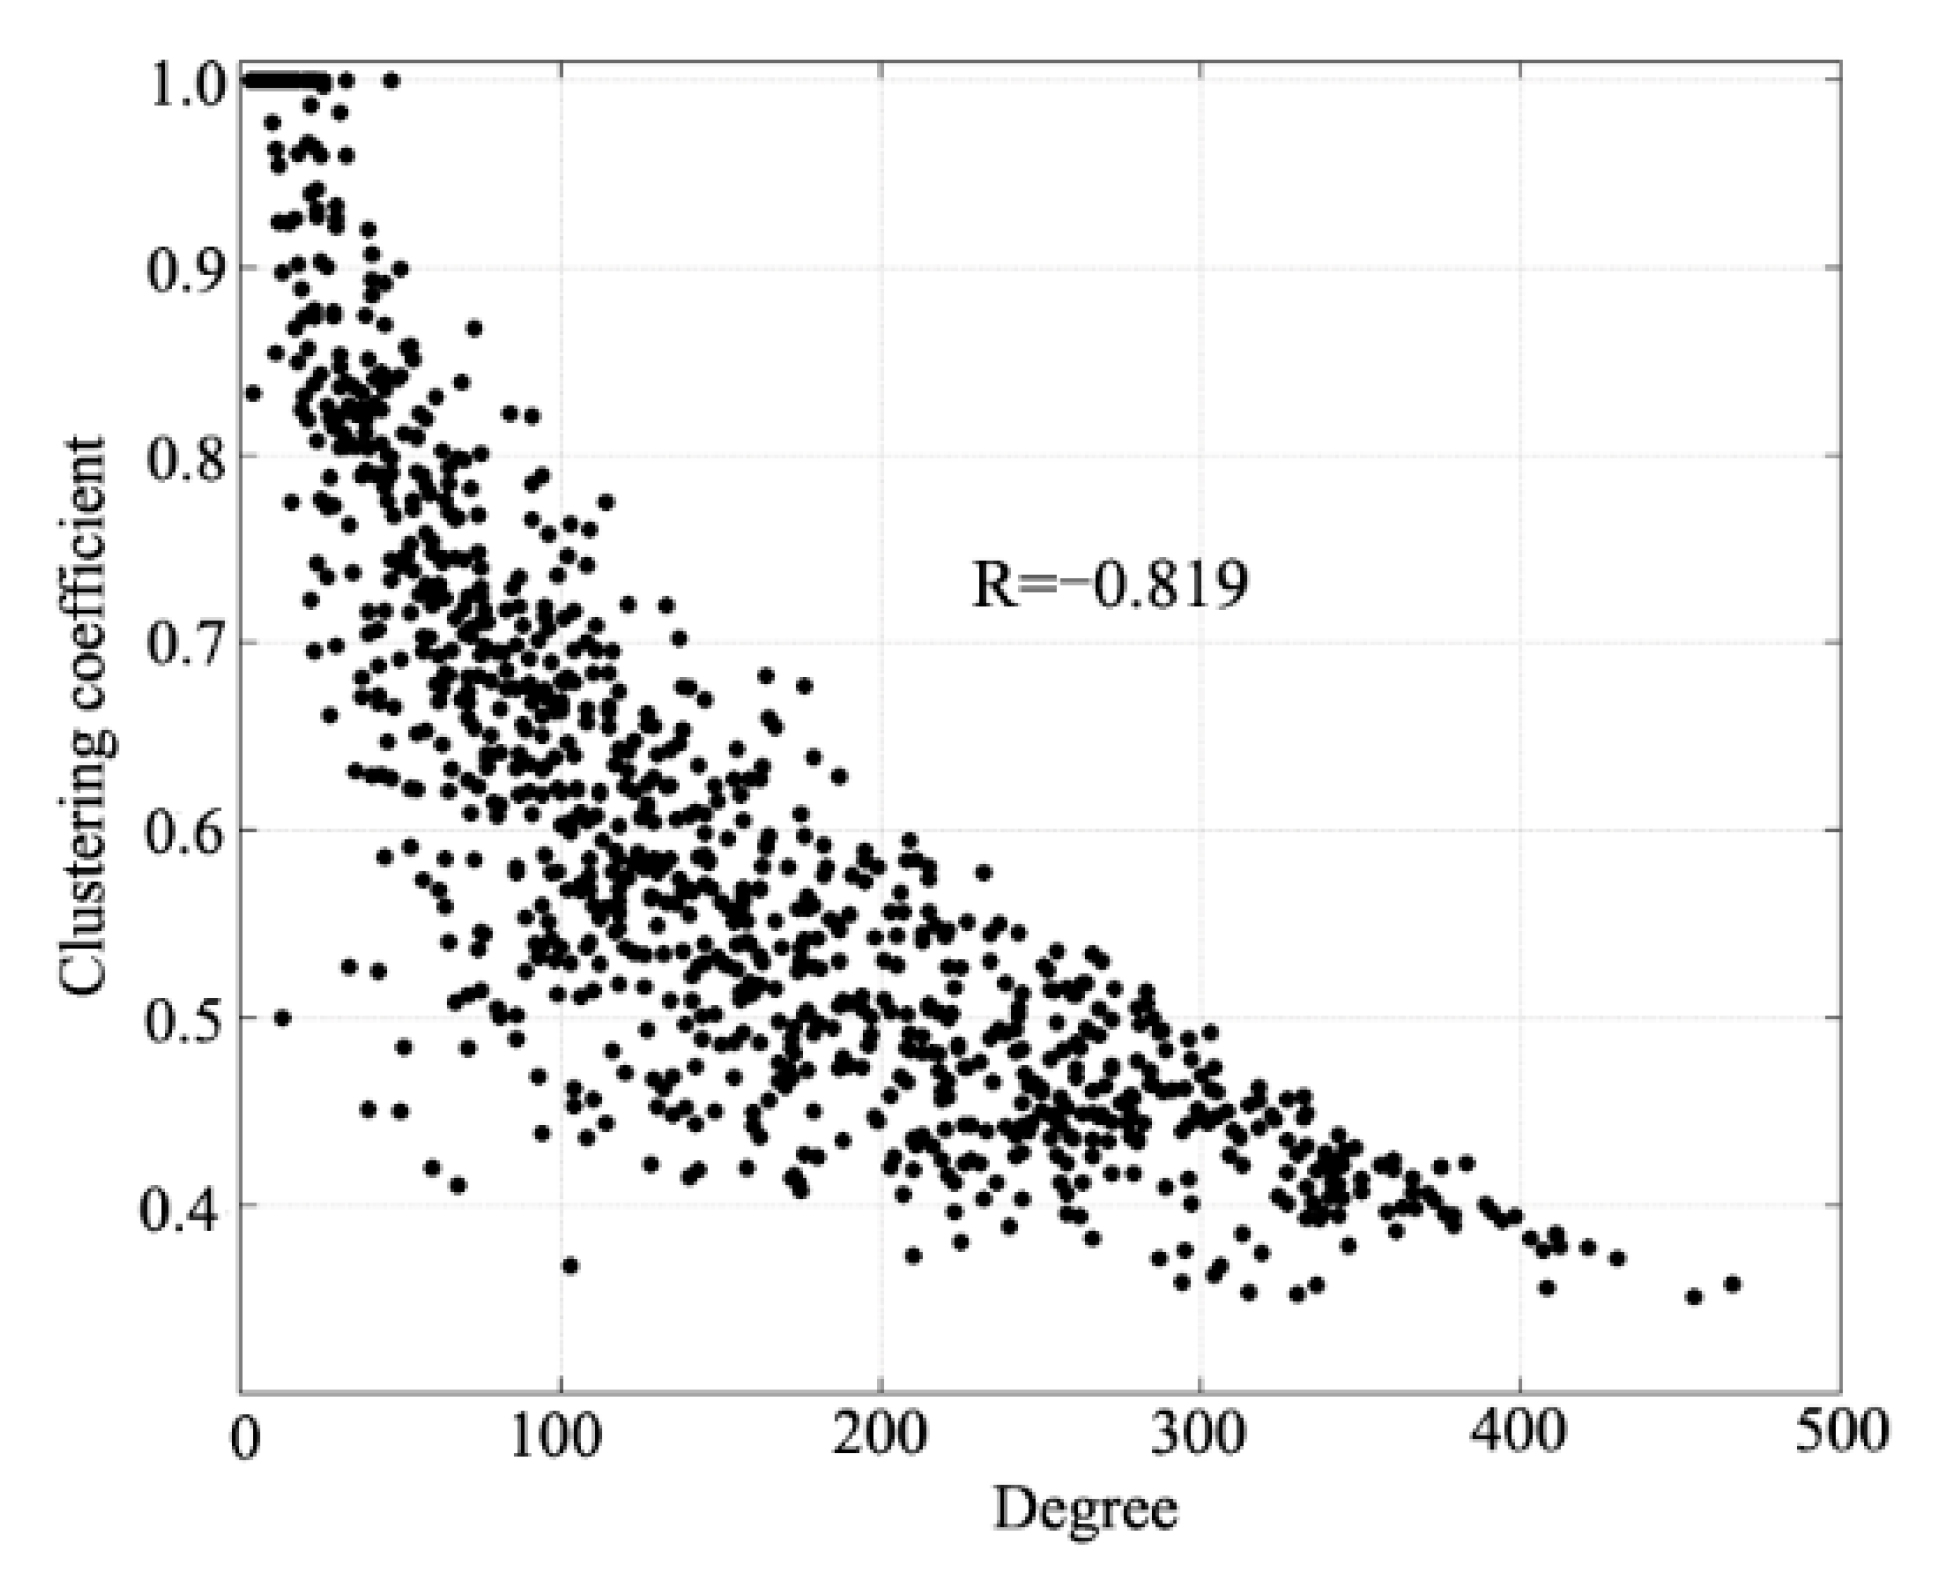
In complex network theory, the average path length and clustering coefficient are the two main measurements of small-world property network. A small-world network generally has a similar average path length and a larger clustering coefficient compared to a random network of the same size [43]. The average path length of the bus service network was 2.01, which indicates that people only need one transfer on average to reach any TAZ of the city by taking buses. For the clustering coefficient of the entire network, the value of Shenzhen was 0.47. The average path length and clustering coefficient of a random network with the same size were 1.85 and 0.15, respectively. Thus, the bus service network of Shenzhen presents the small-world property, which is beneficial for improving both robustness and stability in network planning and protection, and can be used to understand and interpret the bus service network. Figure 5 shows the spatial distribution of the clustering coefficient of TAZs. The high clustering coefficient of TAZs are mainly located at the edge of the city. Such places including mountains, forests and farmland are sparsely populated areas. In comparison with Figure 3, the TAZs with a large degree had a low clustering coefficient, and the correlation between degree and clustering coefficient showed a nearly opposite tendency (Figure 6). In other words, the larger the degree of the TAZ, the smaller the clustering coefficient, which is consistent with studies of the Chinese aviation system and railway network [4,49].
4.2. Spatial Characteristic of the Bus Service Network
4.2.1. Charactering Edge Weight of Bus Service Network
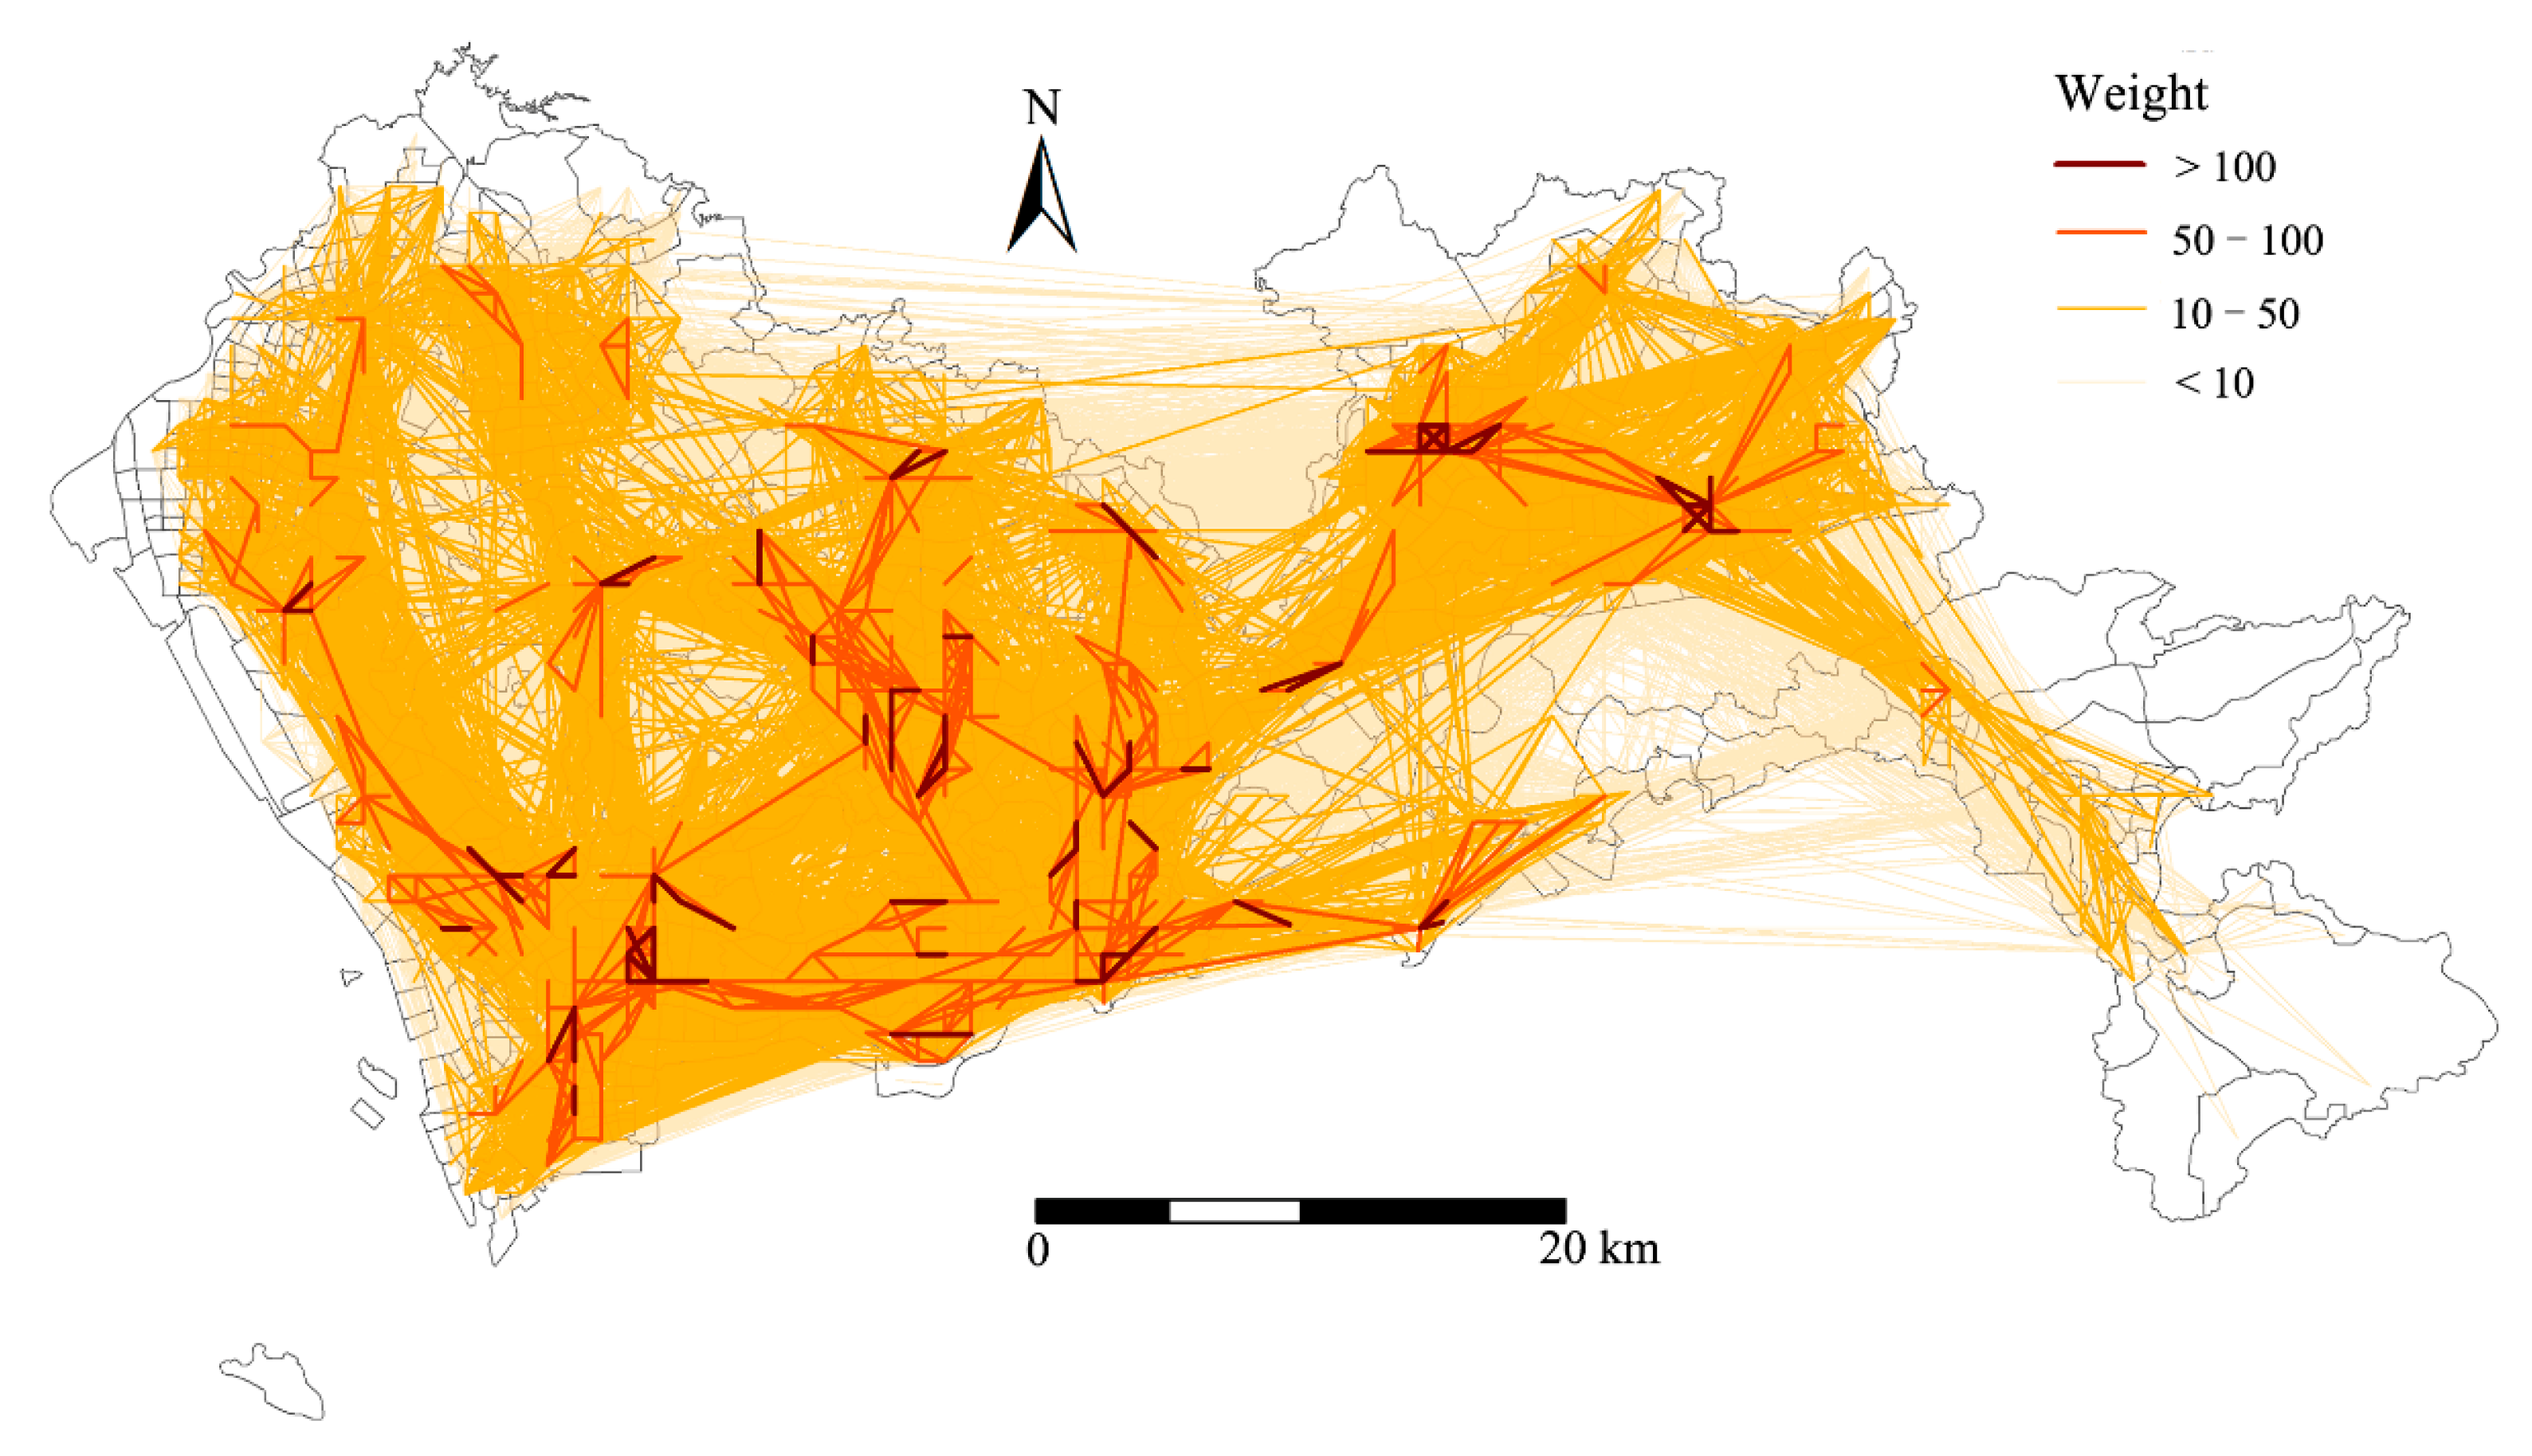
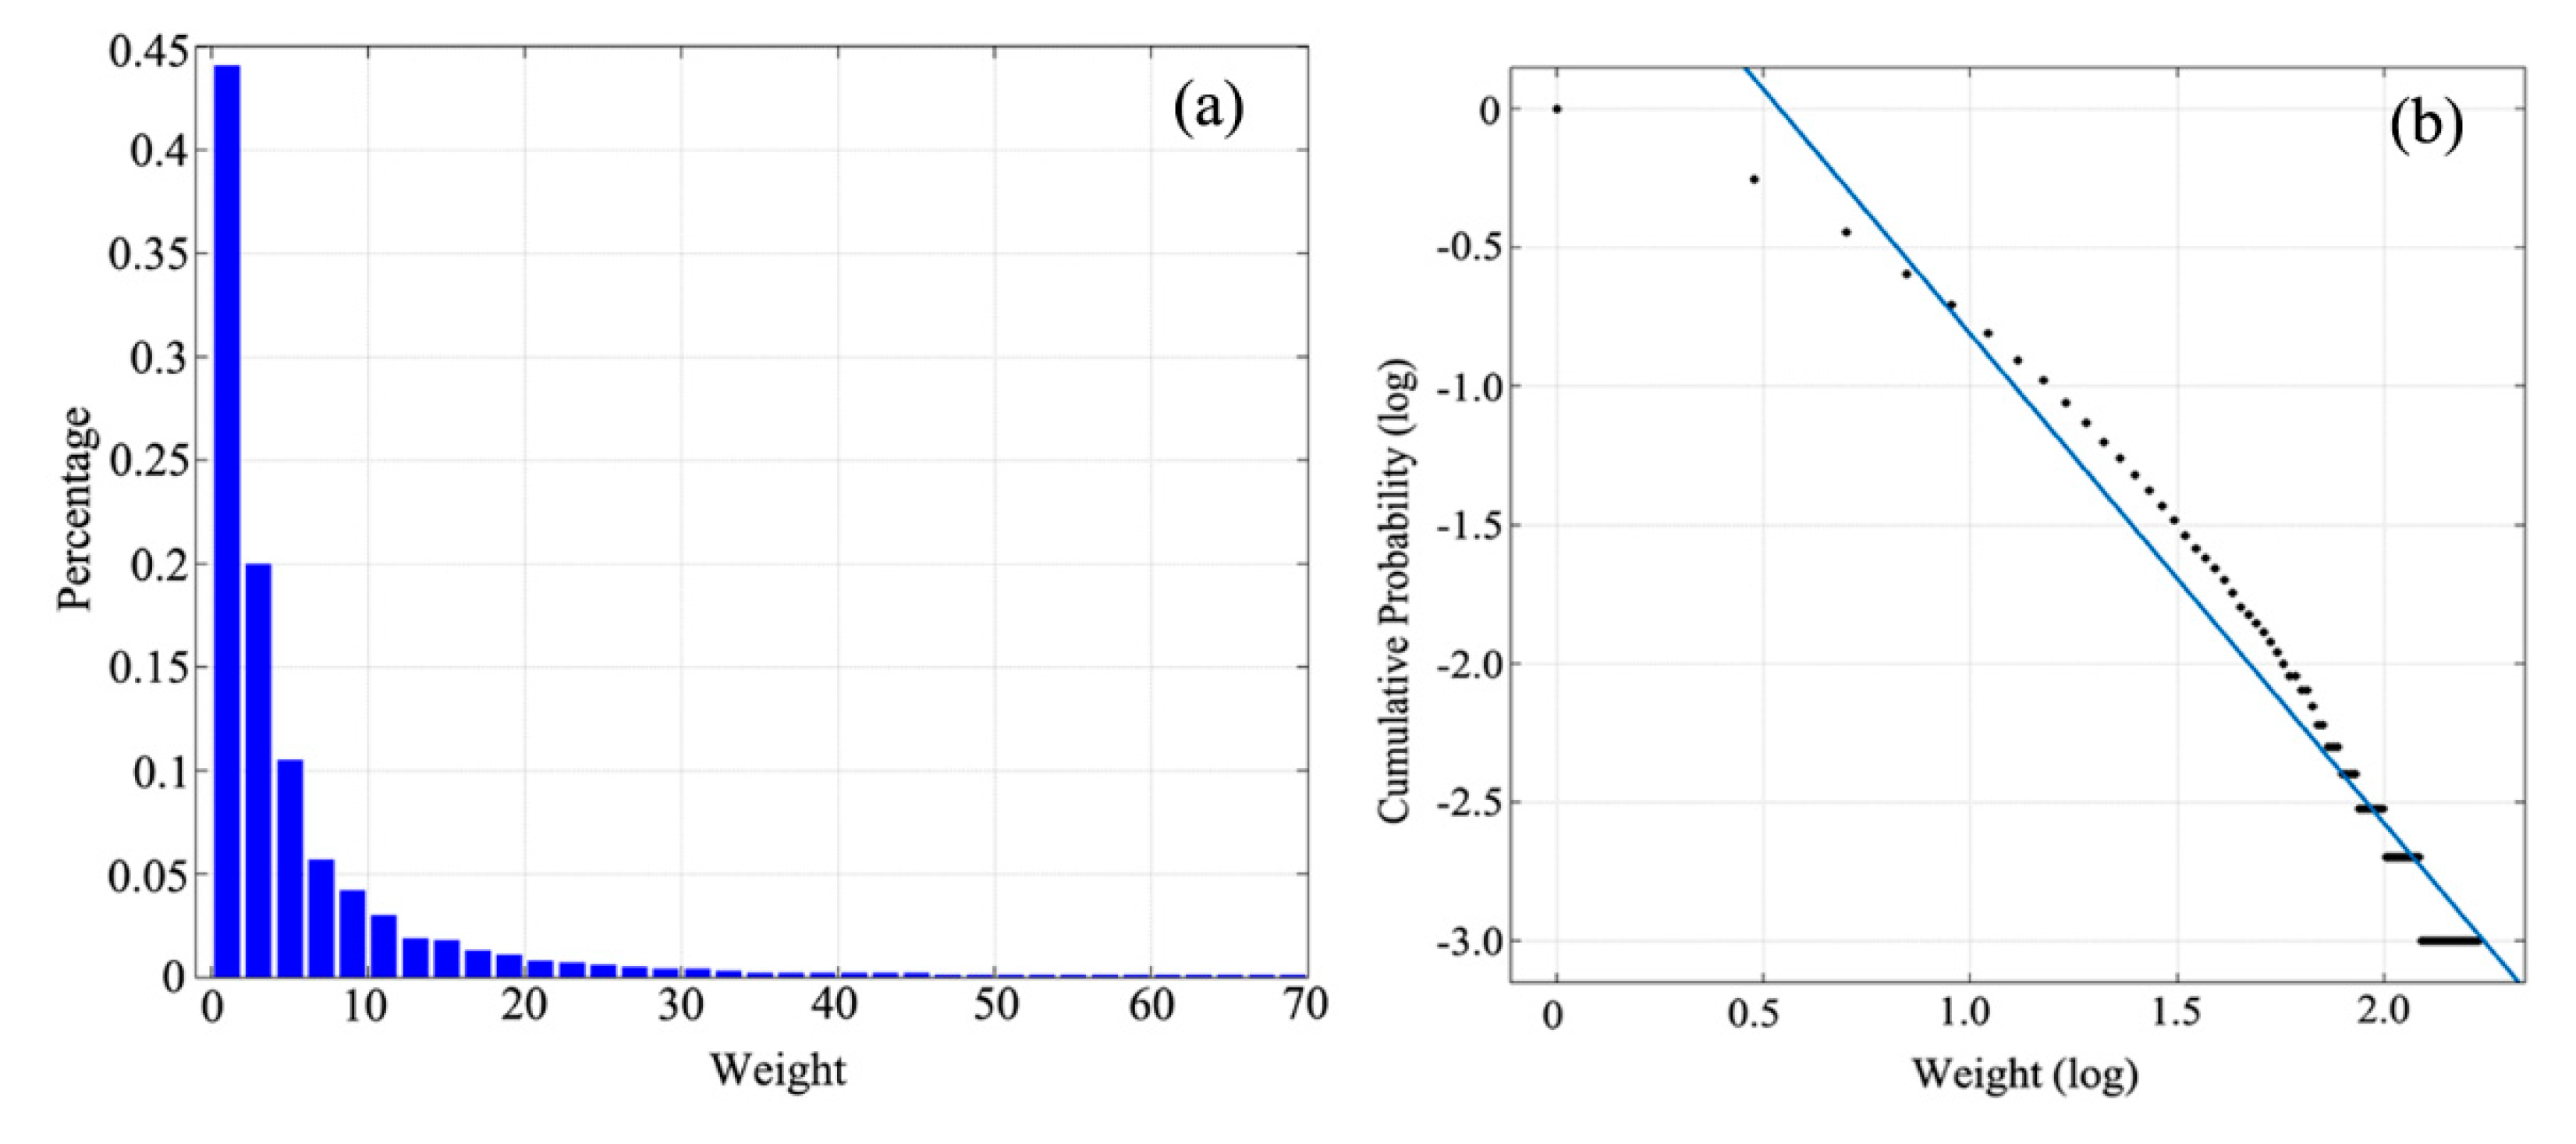
In this section, the weight of edges is considered in analyzing the importance of each TAZ in a bus service network. As described in Section 3.1, the weight represents the number of bus lines. Figure 7 shows the constructed weighted network, and the color represents the weight of edges. Figure 8 shows the statistical distribution of weight. The weight exhibits a long-tailed distribution (Figure 8a); that is, only a few TAZ pairs have an extremely large number of bus lines that pass through, whereas the majority of TAZ pairs have few bus lines. We utilized a typical power law function to capture the long-tailed distribution, where represents the cumulative probability of weight , and represents the friction coefficient of decay. As shown in Figure 8b, the distribution can be approximately fitted using a straight line on a log–log scale, which implies that the weight follows a power law distribution and the friction coefficient is 1.764. Detecting the distribution decay in bus service network connections is a prerequisite for understanding constrained complex networks from a geospatial perspective.
In addition, it is apparent that distance decay also exists in the bus service network. As shown in Figure 7, most edges with larger weights usually have a shorter distance between the two TAZs, which follows a typical geographical phenomenon, namely, distance decay. Moreover, community detection is implemented for the bus service network in order to check whether adjacent TAZs can be classified into the same community. In complex networks, community detection can partition the whole network into several densely connected subnetworks based on the weight of edges, and a community is constituted by some tightly connected nodes. Therefore, community detection has been introduced into geographical research to divide the spatial interaction of cohesive communities. In this study, TAZs within the same community represent those that can be closely connected by bus lines. The community detection algorithm utilized in this study was the fast modularity maximization algorithm, which shows better performance in detecting weighted and undirected networks; a detailed description of this algorithm can be found in [50].
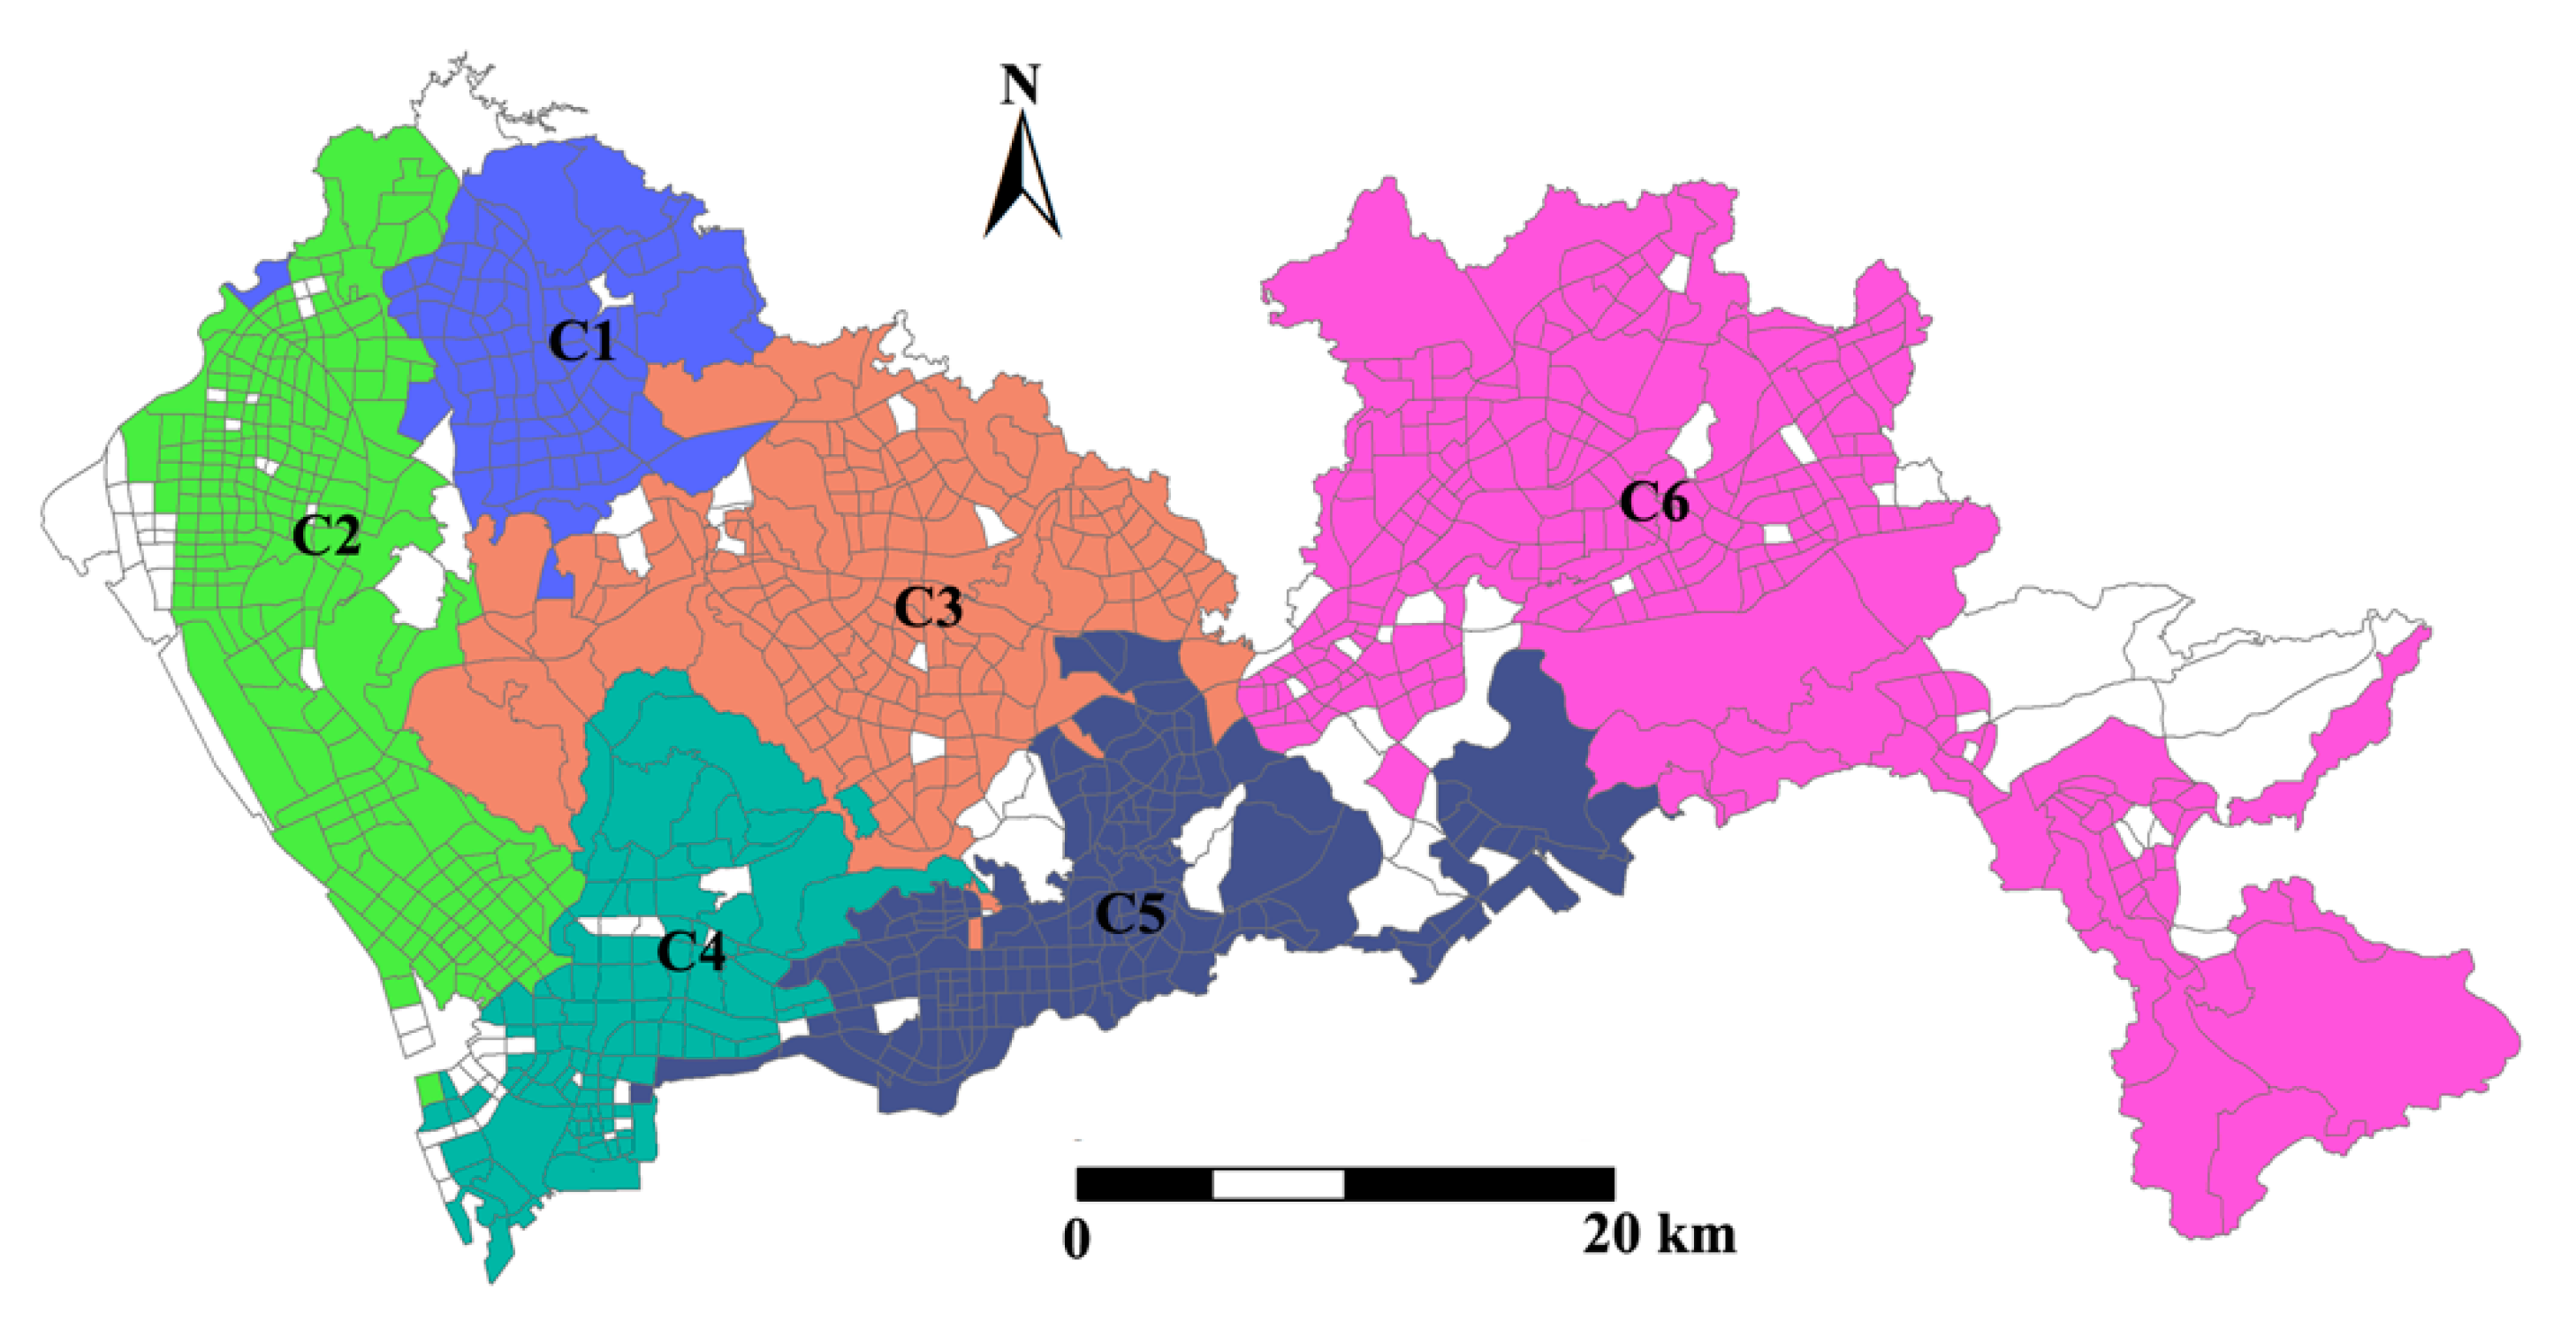
The result of community detection is shown in Figure 9, in which all TAZs were grouped into six communities. It can be seen that spatially adjacent TAZs have been classified as the same community, which indicates that spatial distance influences the connection relationships of an intra-urban bus network. Through a comparison with Figure 1, the detected communities were similar to Shenzhen’s administrative divisions. For example, communities C1, C2, and C4 cover most of the TAZs in the Guangming, Baoan, and Nanshan districts, respectively. The community C3 mainly includes the TAZs of the Longhua district. However, the three districts (Futian, Luohu, and Yantian) in the south of Shenzhen were identified as community C5, which indicates that the bus lines could connect bus stops between the three districts very well. Similarly, the bus lines also tightly connect the bus stops in Dapeng, Pingshan, and the north of Longgang (Community C6).
4.2.2. Charactering Centrality of Traffic Analysis Zones in Bus Service Network
We calculated the closeness centrality, betweenness centrality, and PageRank score based on the weighted bus service network to measure the centrality of the TAZs in the bus service system. In order to visualize the spatial distribution of the three centrality indicators, for each centrality indicator, the famous approach of natural breaks classification was utilized to classify TAZs into six classes according to their statistical characteristics. Natural breaks are designed to determine the best arrangement of values into different classes according to their statistical characteristics; their determination requires an iterative process that seeks to minimize the variance within classes and maximize the variance between classes of groups with similar elements according to their statistical features [51]. Thus, this method has been extensively used to classify and visualize geographic data. After classification, the dataset can be classified into different groups in ascending order. Therefore, the six classes are hierarchical levels, and were denoted as L1, L2, L3, L4, L5, L6, where L1 and L6 represent the lowest and highest classes, respectively. Figure 9 and Figure 10 show the statistical and spatial distributions of the six levels of groups for the closeness centrality, betweenness centrality, and PageRank score of TAZs, respectively. Note that this study did not use the same standard for classifying the three indicators; we executed the natural breaks for each centrality indicator separately. Therefore, the natural breaks method was used to help visualize the spatial hierarchical differences of TAZs for each centrality indicator.
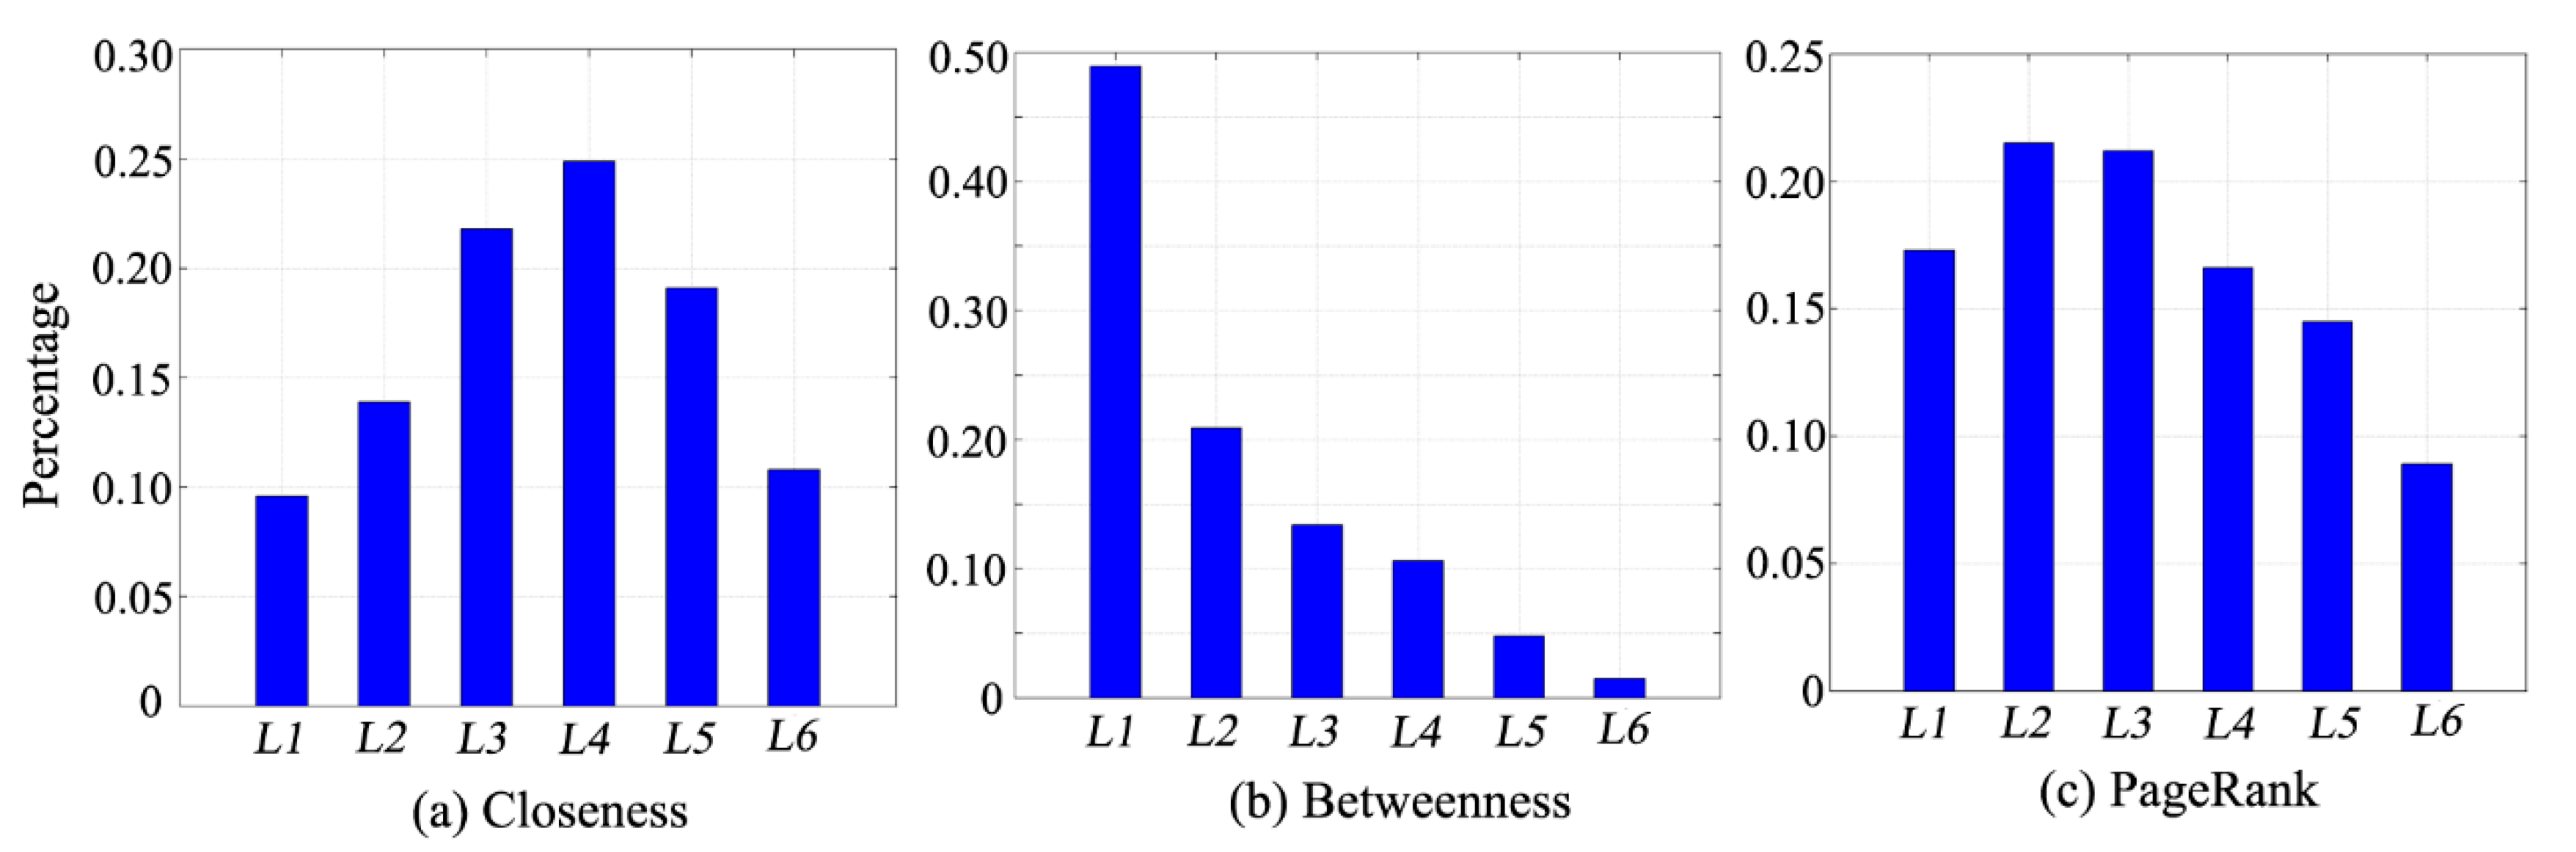
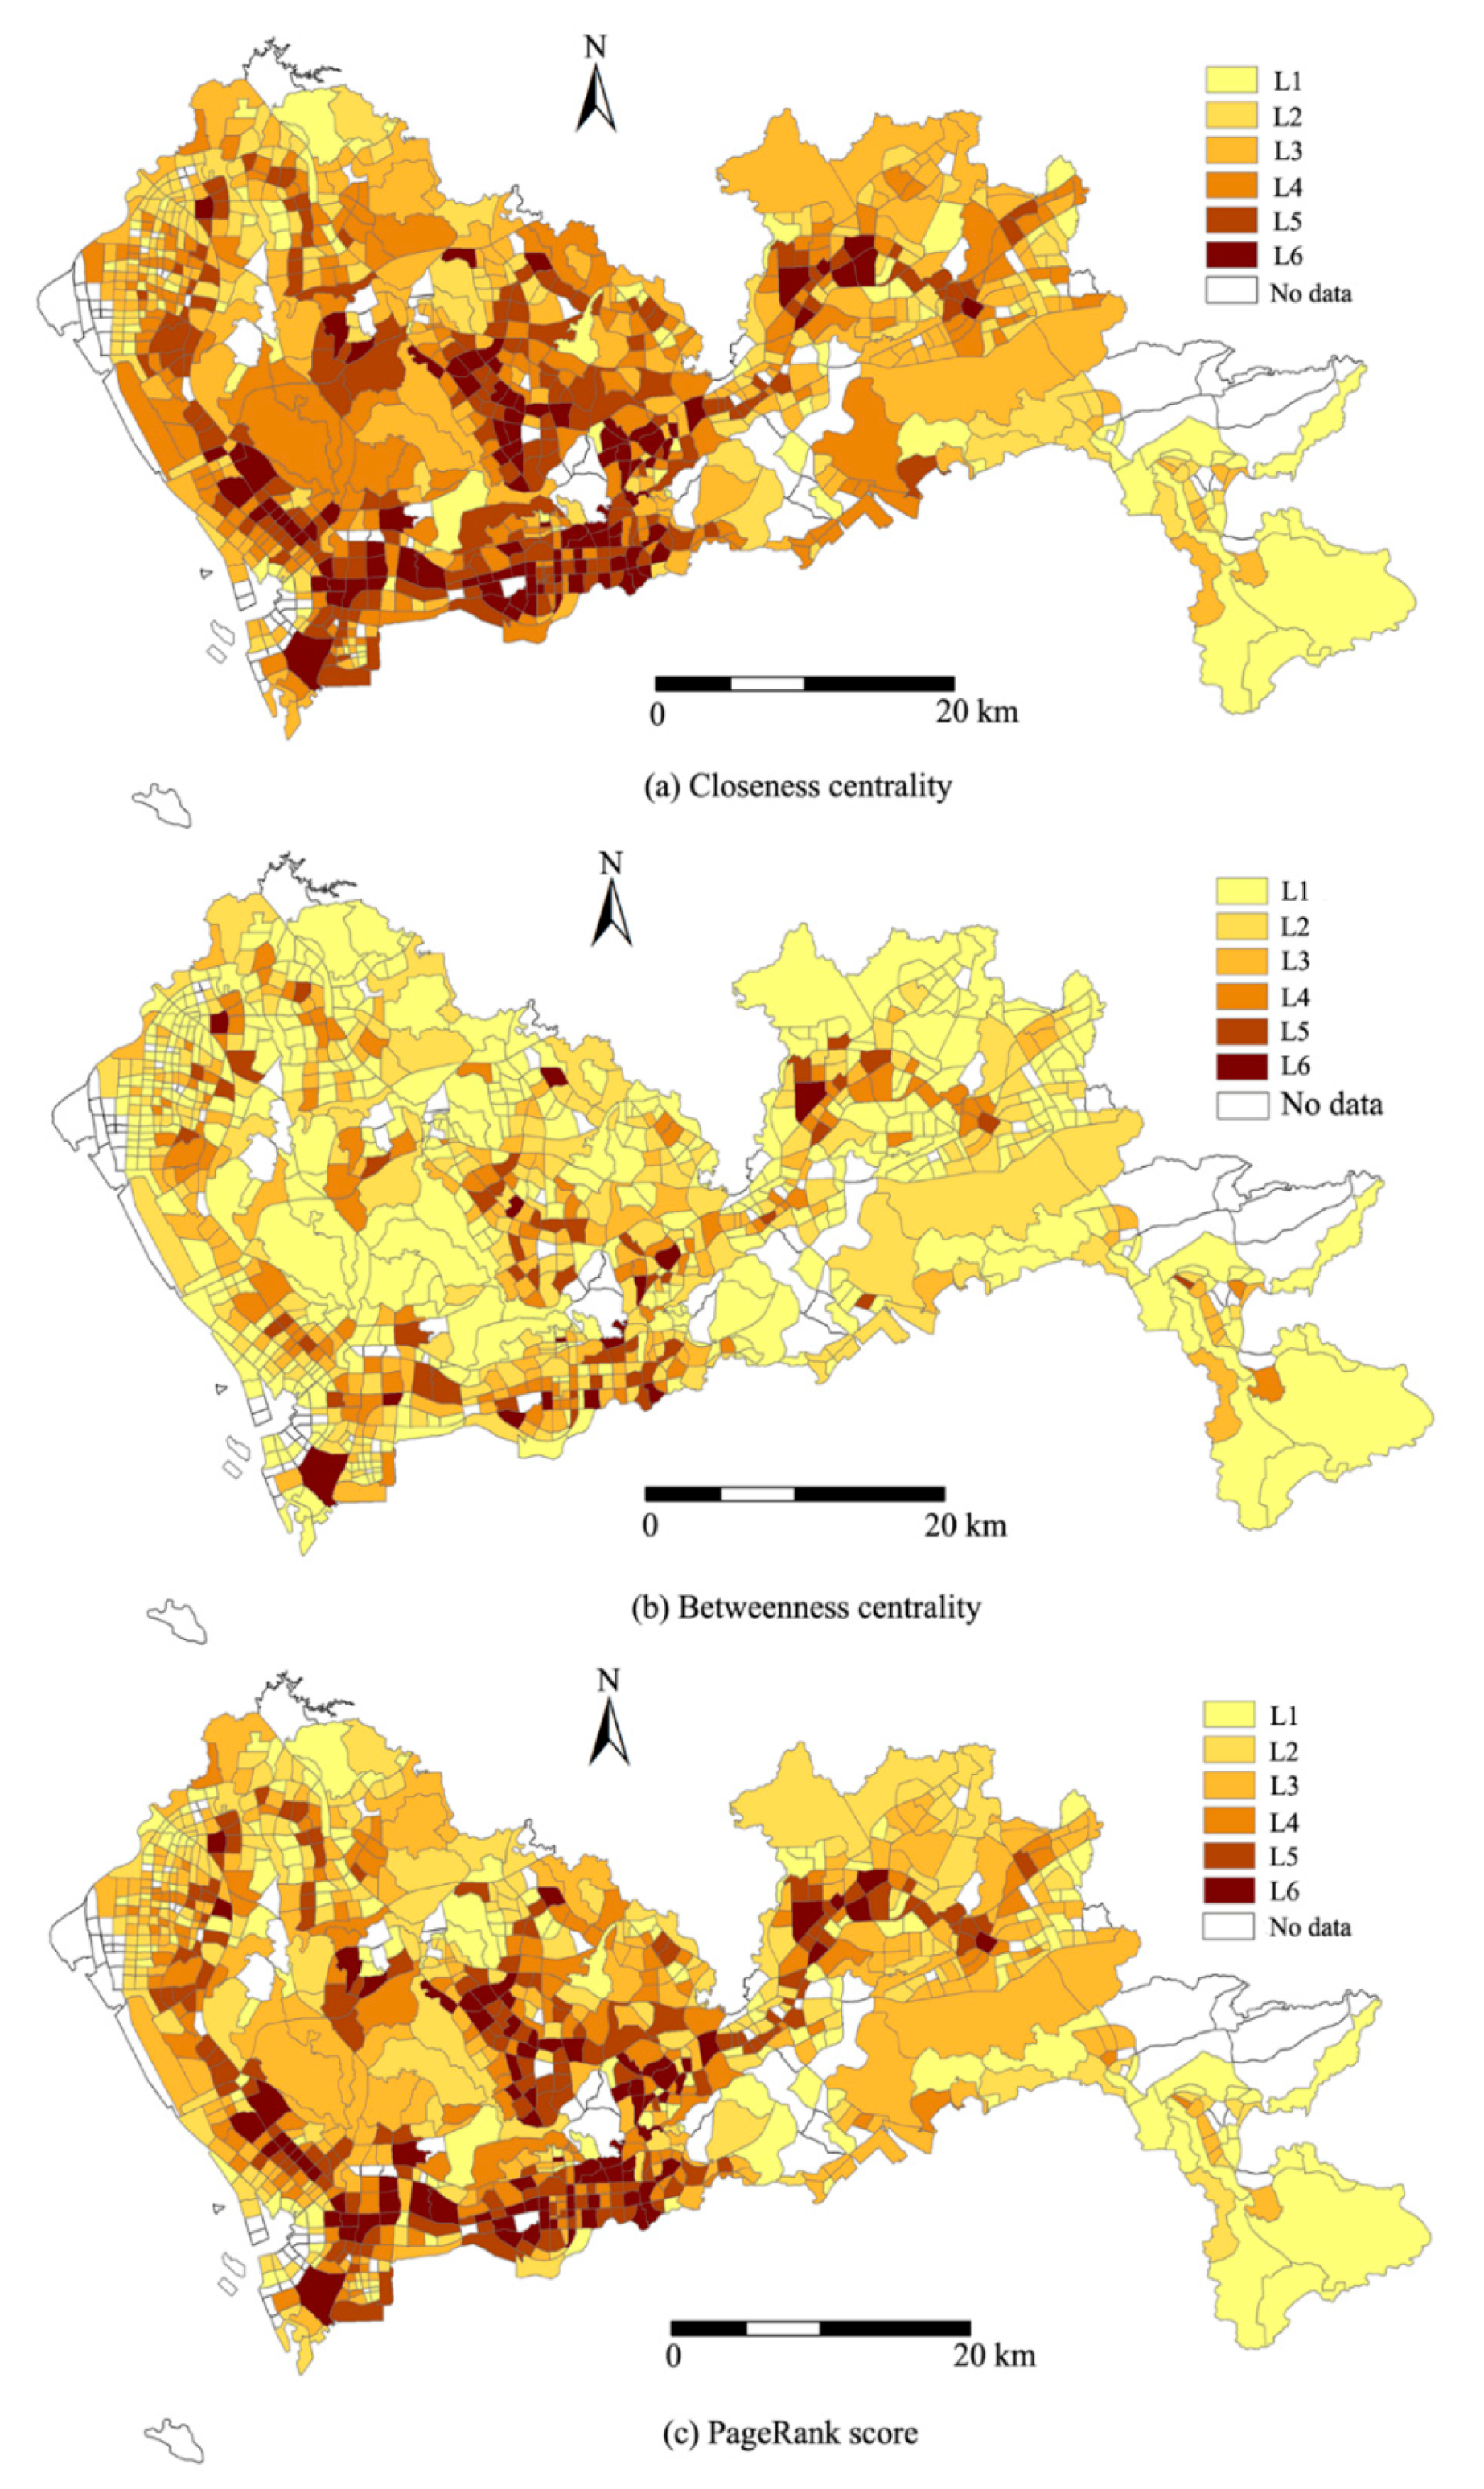
As previously mentioned, closeness measures the extent of ease in accessing other TAZs by taking a bus. The percentage of closeness in the six groups was close to a normal distribution, and the number of TAZs equal and greater than level L4 accounted for more than 55% of the total (Figure 10). TAZs with high bus accessibility were mainly concentrated in the southern areas of Shenzhen (Figure 11). For betweenness centrality, the distribution in the six groups showed a declining trend, and the number of TAZs in level L1 accounted for approximately 50% of all TAZs. The betweenness index quantifies the connectivity and transitivity capabilities of the TAZ in the bus service network, and the percentage of TAZs with high bus connectivity (being equal and greater than L4) only accounted for less than 17% of all TAZs (Figure 10). As shown in Figure 11, these high bus connectivity areas were mainly scattered over different districts of the city to connect various urban areas. The statistical distribution of the PageRank score was similar to that of the closeness centrality; the main difference is that the number of TAZs lying in less than level L4 was dominant and accounted for approximately 60% of all TAZs (Figure 10). The PageRank score evaluates the importance and influence of TAZs in the bus service network. The spatial distribution of PageRank was similar to the closeness centrality. The TAZs with a high PageRank score were mainly concentrated in the Southern Nanshan, Futian, and Luohu administrative districts (Figure 11). Moreover, the important TAZs were those that play important roles in the geospatial bus network and represent regions that need to be protected, which could further assist decision makers in identifying potentially important areas.
4.2.3. Correlation of Centrality between Bus Network and Road Network
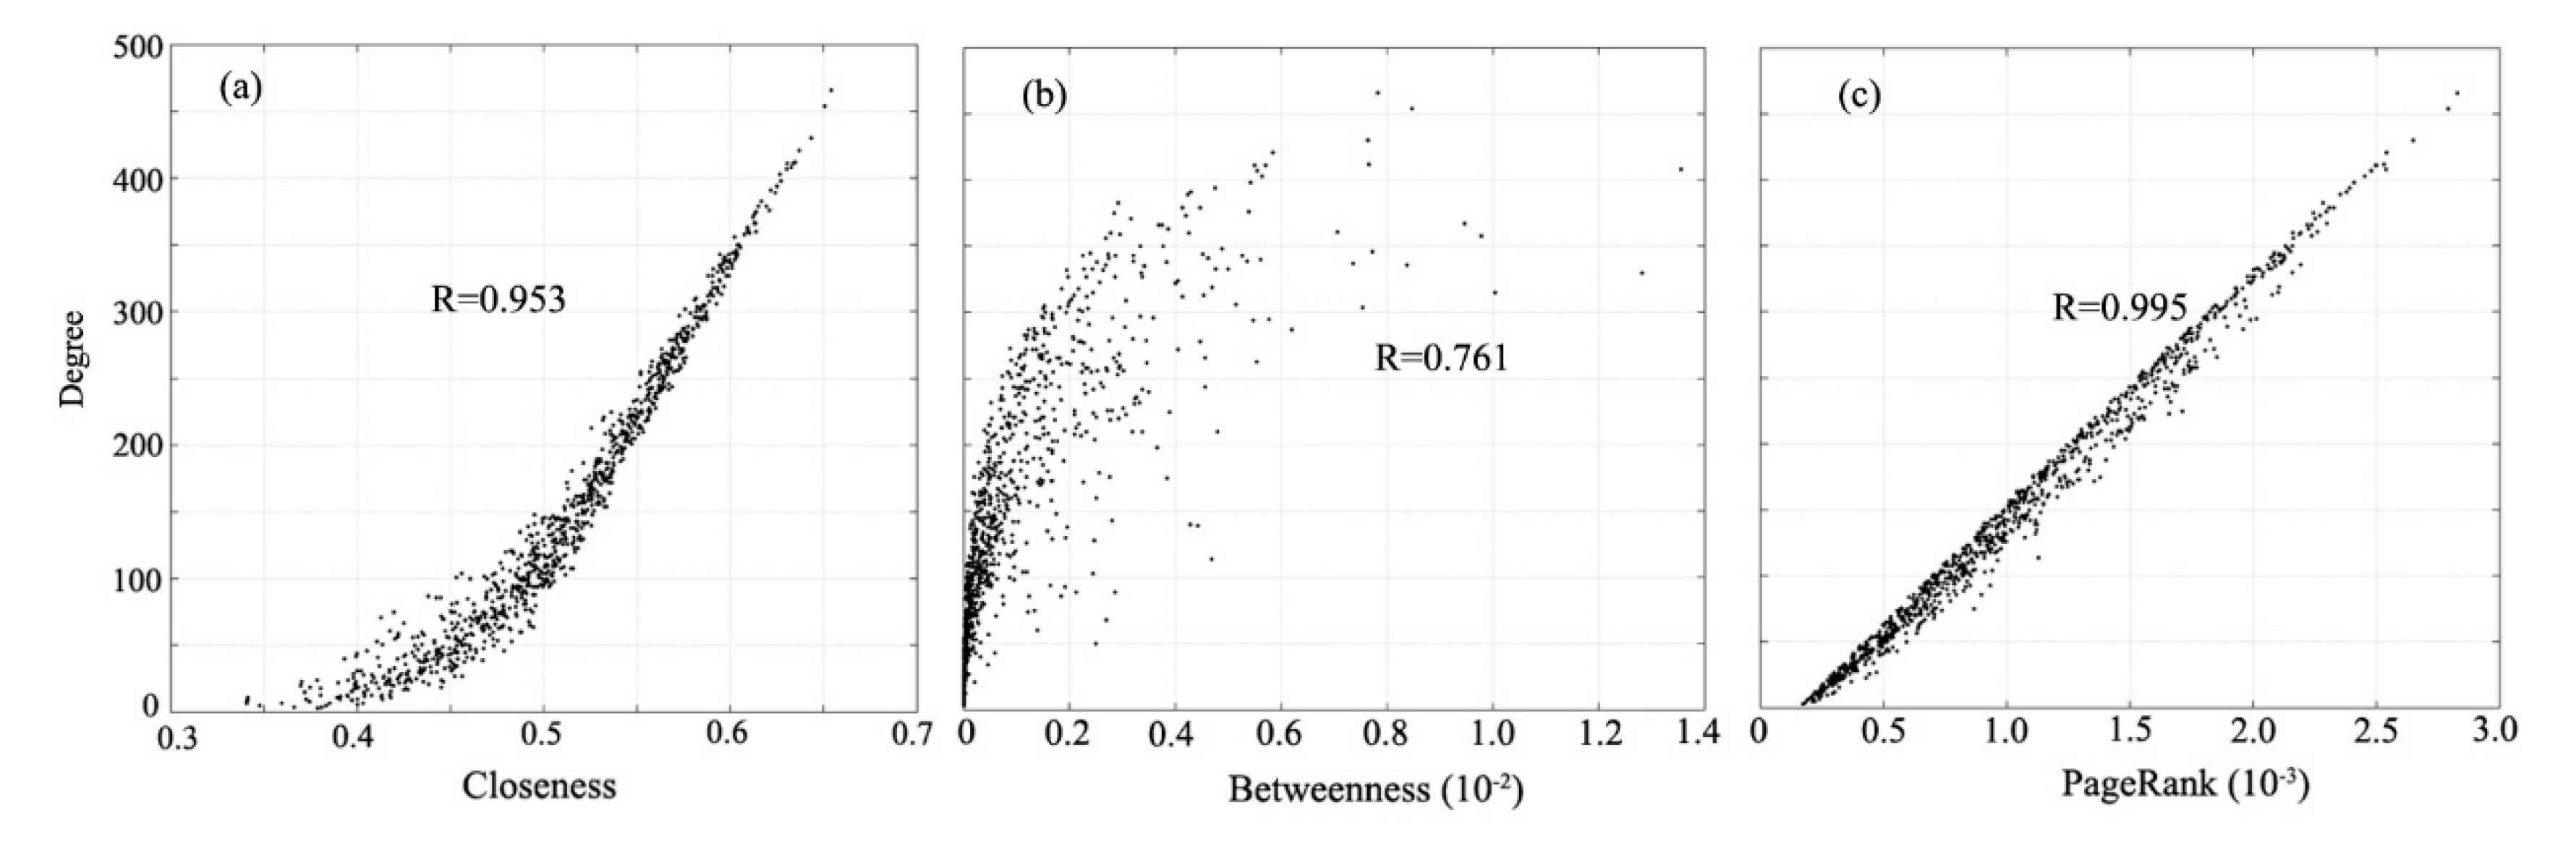
As previously described, the degree reflects the number of TAZs that can be reached by taking a bus without any transfers. Meanwhile, the closeness, betweenness, and PageRank measure the TAZs’ accessibility, connectivity, and influence on others in the network, respectively. In this section, we further examined the relationship between the degree and the three centrality indexes, as shown in Figure 12. The Pearson’s correlation coefficients of closeness, betweenness, and PageRank were 0.953, 0.761, and 0.995, respectively, which demonstrates the strong correlation between the degree and these three indexes. Therefore, in the bus service network, a TAZ with a high degree usually has great accessibility, connectivity, and influence.
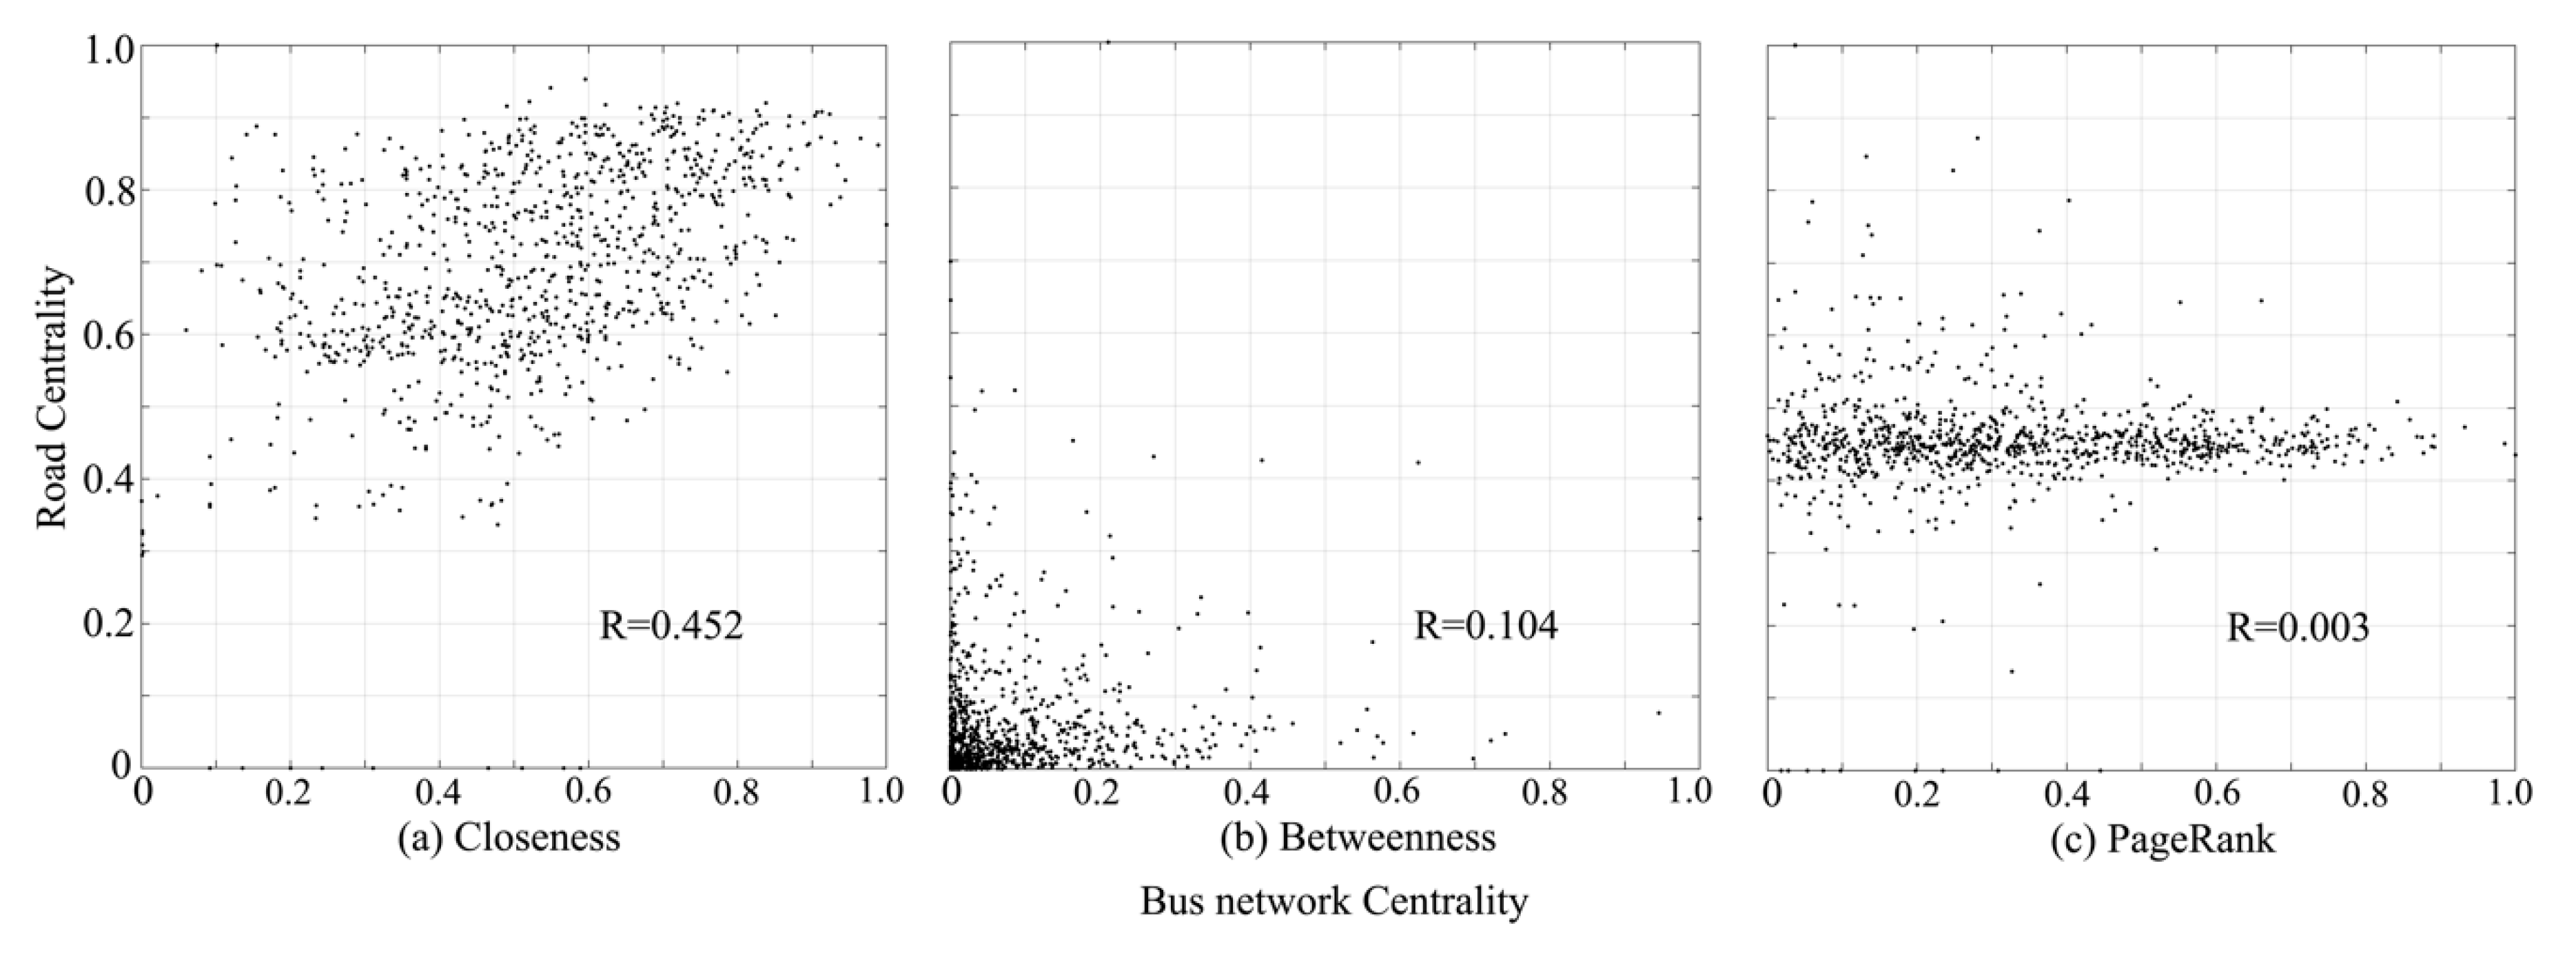
In a city, because the bus travels along the urban network of roads, it is of interest whether the structure of the urban road network is correlated with the bus service network. In order to address this gap, we examined the correlation of the three centrality indicators between the bus service network and road network. Based on the theory presented in Section 3.3, we calculated the closeness, betweenness, and PageRank of urban road nodes and aggregated the average value for each TAZ. Similarly, Pearson’s correlation coefficient was used to measure the correlation between the bus network and road network, and we normalized the centrality indicators by using the maximum and minimum before calculating the correlation coefficient. As shown in Figure 13, the correlation coefficients of closeness, betweenness, and PageRank were 0.452, 0.104, and 0.003, respectively. The correlation coefficient indicates that there was some correlation of closeness between the bus network and road network, which indicates that the convenience of the road network may be correlated with the bus network in some TAZs. For betweenness, the coefficient indicates that the connectivity of the bus network has a low correlation with the intermediate transitivity of the urban road network. However, the PageRank of the bus network was nearly unrelated with that of the road network. In the road network, the nodes connect with their adjacent nodes by road segments; usually the influence of road nodes is very small, which results in a relatively concentrated PageRank score (about 0.45 in Figure 13c) of nodes in the road network. In contrast, in the bus network, a bus stop can connect with many other stops only if there are bus lines passing through these stops. Therefore, the PageRank of the bus network is more dispersed.
5. Conclusions and Future Work
This study aimed to investigate the spatial structure of urban bus networks using complex network theory. We took Shenzhen as a case study and developed a three-step workflow to collect the bus service dataset from a public transport inquiry website. On the basis of the operating configuration of bus lines, the P-space graph principle was used to establish the bus service network to represent the relationship among bus stops. Then, network analysis indicators were calculated to analyze the statistical properties of the network and quantify the accessibility, connectivity, and influence of nodes in the network. We found that the bus network of Shenzhen follows a small-world property, with an average path length of 2.01 and clustering coefficient of 0.47. This means that people need one transfer on average to reach any TAZ of the city by taking buses. The clustering coefficient represents the extent of the local aggregation in the network, so it indicates the connectivity of the TAZ with its local adjacent TAZs. The two indicators could be used to design an urban bus network, and a well-designed bus network should try to achieve a small average path length and high clustering coefficient. The weight of edges represents the spatial interaction between the TAZs, and the heavy-tailed distribution of weight indicates that only a few edges have an extremely large weight. Based on the weight of edges, we identified six spatially interacting communities from the bus service network, and discussed the similarity and difference between detected communities and administrative districts, which provides an understanding of the spatial interaction structure formed by urban bus lines. In addition, we classified the TAZs into six classes based on the value of closeness, betweenness and PageRank score, and found that the TAZs in southern area have high accessibility, connectivity, and influence. Finally, we investigated the correlation of centrality between the bus service network and urban road network and found that closeness showed the highest correlation and that PageRank was not related. These empirical results provide an insight into the laws and significant accessible areas of a bus network, which promotes the understanding of the characteristics of configuration in urban bus service systems.
However, limitations still exist, which can be improved upon in future works. The dataset acquired from the website lacks the detailed operating information of bus lines such as the timetables and number of buses for each line, which is of great importance to assess the efficiency of a bus service. Moreover, passenger trajectories can reveal the usage patterns of citizens who take buses, which has great referential meaning in optimizing the configuration of a bus network system. Therefore, we will work on both issues by combining other datasets (e.g., smart card dataset) to help urban managers establish a bus-friendly city and improve the residents’ green travel behavior.
Author Contributions
The research was mainly conceived and designed by Xiping Yang and Shiwei Lu. Xiping Yang and Weifeng Zhao performed the experiments. Xiping Yang and Zhiyuan Zhao wrote the manuscript. Shiwei Lu and Zhiyuan Zhao reviewed the manuscript and provided comments.
Funding
This study was jointly supported by the National Natural Science Foundation of China (No. 41801373, 41901390), the Fundamental Research Funds for the Central Universities (No. GK201803049), the China Postdoctoral Science Foundation (Nos. 2017M623112, 2019T120876), the Foundation of Geomatics Technology and Application Key Laboratory of Qinghai Province (No. QHDX-2018-08), the Open Fund of Key Laboratory of Urban Land Resources Monitoring and Simulation, the Ministry of Land and Resources (KF-2018-03-006), the Open fund of Beijing Key Laboratory of Urban Spatial Information Engineering (No. 2019206), the Natural Science Basic Research Plan in Shaanxi Province of China (Program No. 2018JM4041), and Shannxi Science and Technology Program (No. 2019ZDLSF07-04).
Conflicts of Interest
The authors declare no conflict of interest.
References
- Pittschieler, K. Performance improvement of urban bus system: Issues and solution. Int. J. Eng. Sci. Technol. 2010, 2, 21–23. [Google Scholar]
- Wang, M.; Hu, B.-Q.; Wu, X.; Niu, Y.-Q. The topological and statistical analysis of public transport network based on fuzzy clustering. In Fuzzy Information and Engineering; Cao, B., Li, T.-F., Zhang, C.-Y., Eds.; Springer: Berlin/Heidelberg, Germany, 2009; Volume 2, pp. 1183–1191. [Google Scholar]
- Wu, X.; Dong, H.; Chi, K.T.; Ho, I.W.H.; Lau, F.C.M. Analysis of metro network performance from a complex network perspective. Phys. A Stat. Mech. Appl. 2017, 492, 553–563. [Google Scholar] [CrossRef]
- Lin, J. Network analysis of China’s aviation system, statistical and spatial structure. J. Transp. Geogr. 2012, 22, 109–117. [Google Scholar] [CrossRef]
- Zhang, J.; Zhao, M.; Liu, H.; Xu, X. Networked characteristics of the urban rail transit networks. Phys. A Stat. Mech. Appl. 2013, 392, 1538–1546. [Google Scholar] [CrossRef]
- Zhang, J.; Cao, X.B.; Du, W.B.; Cai, K.Q. Evolution of Chinese airport network. Phys. A Stat. Mech. Appl. 2011, 389, 3922–3931. [Google Scholar] [CrossRef]
- Wang, C.; Wang, J. Spatial pattern of the global shipping network and its hub-and-spoke system. Res. Transp. Econ. 2012, 32, 54–63. [Google Scholar] [CrossRef]
- Wang, J.; Mo, H.; Wang, F.; Jin, F. Exploring the network structure and nodal centrality of China’s air transport network: A complex network approach. J. Transp. Geogr. 2011, 19, 712–721. [Google Scholar] [CrossRef]
- Lin, J.; Ban, Y. Complex network topology of transportation systems. Transp. Rev. 2013, 33, 658–685. [Google Scholar] [CrossRef]
- Roth, C.; Kang, S.M.; Batty, M.; Barthélemy, M. Structure of urban movements: Polycentric activity and entangled hierarchical flows. PLoS ONE 2011, 6, e15923. [Google Scholar] [CrossRef]
- Liu, X.; Gong, L.; Gong, Y.; Liu, Y. Revealing travel patterns and city structure with taxi trip data. J. Transp. Geogr. 2015, 43, 78–90. [Google Scholar] [CrossRef] [Green Version]
- Zhong, C.; Arisona, S.M.; Huang, X.; Batty, M.; Schmitt, G. Detecting the dynamics of urban structure through spatial network analysis. Int. J. Geogr. Inf. Sci. 2014, 28, 2178–2199. [Google Scholar] [CrossRef]
- Patuelli, R.; Reggiani, A.; Gorman, S.P.; Nijkamp, P.; Bade, F.J. Network analysis of commuting flows: A comparative static approach to German data. Netw. Spat. Econ. 2007, 7, 315–331. [Google Scholar] [CrossRef]
- Zhu, G.; Corcoran, J.; Shyy, P.; Pileggi, S.F.; Hunter, J. Analysing journey-to-work data using complex networks. J. Transp. Geogr. 2018, 66, 65–79. [Google Scholar] [CrossRef]
- Yang, X.; Fang, Z.; Yin, L.; Li, J.; Zhou, Y.; Lu, S. Understanding the spatial structure of urban commuting using mobile phone location data: A case study of Shenzhen, China. Sustainability 2018, 10, 1435. [Google Scholar] [CrossRef]
- Gonzalez, M.C.; Hidalgo, C.A.; Barabasi, A. Understanding individual human mobility patterns. Nature 2008, 453, 779–782. [Google Scholar] [CrossRef] [PubMed]
- Li, M.X.; Jiang, Z.Q.; Xie, W.J.; Miccichè, S.; Tumminello, M.; Zhou, W.X.; Mantegna, R.N. A comparative analysis of the statistical properties of large mobile phone calling networks. Sci. Rep. 2014, 4, 5132. [Google Scholar] [CrossRef] [PubMed] [Green Version]
- Demsar, U.; Spatenkova, O.; Virrantaus, K. Identifying critical locations in a spatial network with graph theory. Trans. GIS 2008, 12, 61–82. [Google Scholar] [CrossRef]
- Rui, Y.; Ban, Y. Exploring the relationship between street centrality and land use in Stockholm. Int. J. Geogr. Inf. Sci. 2014, 28, 1425–1438. [Google Scholar] [CrossRef]
- Dai, L.; Derudder, B.; Liu, X.; Witlox, F. Transport network backbone extraction: A comparison of techniques. J. Transp. Geogr. 2018, 69, 271–281. [Google Scholar] [CrossRef]
- Jiang, B.; Claramunt, C. Topological analysis of urban street networks. Environ. Plan. B Abstr. 2003, 31, 151–162. [Google Scholar] [CrossRef]
- Sun, D.; Zhao, Y.; Lu, Q.C. Vulnerability analysis of urban rail transit networks: A case study of Shanghai, China. Sustainability 2015, 7, 6919–6936. [Google Scholar] [CrossRef]
- Zhang, J.; Wang, S.; Wang, X. Comparison analysis on vulnerability of metro networks based on complex network. Phys. A Stat. Mech. Appl. 2018, 496, 72–78. [Google Scholar] [CrossRef]
- Soh, H.; Lim, S.; Zhang, T.; Fu, X.; Lee, G.K.K.; Hung, T.G.G.; Di, P.; Prakasam, S.; Wong, L. Weighted complex network analysis of travel routes on the Singapore public transportation system. Phys. A Stat. Mech. Appl. 2010, 389, 5852–5863. [Google Scholar] [CrossRef]
- Chen, Y.Z.; Li, N.; He, D.R. A study on some urban bus transport networks. Phys. A Stat. Mech. Appl. 2007, 376, 747–754. [Google Scholar] [CrossRef]
- Rodrigue, J.P.; Comtois, C.; Slack, B. The geography of transport systems. J. Urban. Technol. 2013, 18, 127. [Google Scholar]
- Feng, S.; Hu, B.; Nie, C.; Shen, X. Empirical study on a directed and weighted bus transport network in china. Phys. A Stat. Mech. Appl. 2016, 441, 85–92. [Google Scholar] [CrossRef]
- Sienkiewicz, J.; Hołyst, J.A. Statistical analysis of 22 public transport networks in Poland. Phys. Rev. 2005, 72, 046127. [Google Scholar] [CrossRef] [Green Version]
- Háznagy, A.; Fi, I.; London, A.; Nemeth, T. Complex network analysis of public transportation networks: A comprehensive study. In Proceedings of the 2015 International Conference on MODELS and Technologies for Intelligent Transportation Systems, Budapest, Hungary, 3–5 June 2015; pp. 371–378. [Google Scholar]
- Tanuja, S.; Ho, I.W.H.; Chi, K.T. Spatial analysis of bus transport networks using network theory. Phys. A Stat. Mech. Appl. 2018, 502, 295–314. [Google Scholar]
- Barabasi, A.; Albert, R. Emergence of scaling in random networks. Science 1999, 286, 509–512. [Google Scholar] [CrossRef]
- Xu, X.; Hu, J.; Liu, F.; Liu, L. Scaling and correlations in 3 bus-transport networks of China. Phys. A Stat. Mech. Appl. 2007, 374, 441–448. [Google Scholar] [CrossRef]
- Chatterjee, A.; Ramadurai, G. Scaling laws in Chennai bus network. In Proceedings of the International Conference on Complex Systems and Applications ICCSA 2014, Le Havre, France, 23–26 June 2014. [Google Scholar]
- Watts, D.J.; Strogatz, S.H. Collective dynamics of ‘small-world’ networks. Nature 1998, 393, 440–442. [Google Scholar] [CrossRef] [PubMed]
- Latora, V.; Marchiori, M. Efficient behavior of small-world networks. Phys. Rev. Lett. 2001, 87, 198701. [Google Scholar] [CrossRef] [PubMed]
- Barthelemy, M. Spatial networks. Phys. Rep. 2010, 499, 1–101. [Google Scholar] [CrossRef]
- Yang, X.-H.; Chen, G.; Chen, S.-Y.; Wang, W.-L.; Wang, L. Study on some bus transport networks in China with considering spatial characteristics. Transp. Res. Part A Policy Pract. 2014, 69, 1–10. [Google Scholar] [CrossRef]
- Fang, Z.; Yang, X.; Xu, Y.; Shaw, S.; Yin, L. Spatiotemporal model for assessing the stability of urban human convergence and divergence patterns. Int. J. Geogr. Inf. Sci. 2017, 31, 2119–2141. [Google Scholar] [CrossRef]
- Amap Platform. Available online: https://www.amap.com/ (accessed on 29 October 2019).
- Sen, P.; Dasgupta, S.; Chatterjee, A.; Sreeram, P.A.; Mukherjee, G.; Manna, S.S. Small-world properties of the Indian railway network. Phys. Rev. E 2003, 67, 036106. [Google Scholar] [CrossRef] [Green Version]
- You, J.; Nedović-Budić, Z.; Kim, T.J. A GIS-based traffic analysis zone design: Technique. Transp. Plan. Technol. 1998, 21, 45–68. [Google Scholar] [CrossRef]
- Dong, H.; Wu, M.; Ding, X.; Chu, L.; Jia, L.; Qin, Y.; Zhou, X. Traffic zone division based on big data from mobile phone base stations. Transp. Res. Part. C Emerg. Technol. 2015, 58, 278–291. [Google Scholar] [CrossRef]
- Amaral, L.A.; Scala, A.; Barthelemy, M.; Stanley, H.E. Classes of small-world networks. Proc. Natl. Acad. Sci. USA 2000, 97, 11149–11152. [Google Scholar] [CrossRef] [Green Version]
- Sabidussi, G. The centrality index of a graph. Psychometrika 1996, 31, 581–603. [Google Scholar] [CrossRef]
- Freeman, L.C. A set of measures of centrality based upon betweenness. Sociometry 1977, 40, 35–41. [Google Scholar] [CrossRef]
- Brin, S.; Page, L. The anatomy of a large-scale hypertextual web search engine. Comput. Netw. ISDN Syst. 1998, 30, 107–117. [Google Scholar] [CrossRef]
- Liu, L.; Li, R.; Shao, F.; Sun, R. Complexity analysis of Qingdao’s public transport network. In Proceedings of the International Symposium on Intelligent Information Systems and Applications (IISA 2009), Nanchang, China, 21–22 November 2009; pp. 300–303. [Google Scholar]
- Ferber, C.V.; Holovatch, T.; Holovatch, Y.; Palchykov, V. Network harness: Metropolis public transport. Phys. A Stat. Mech. Appl. 2007, 380, 585–591. [Google Scholar] [CrossRef] [Green Version]
- Huang, Y.; Lu, S.; Yang, X.; Zhao, Z. Exploring railway network dynamics in China from 2008 to 2017. ISPRS Int. J. Geo Inf. 2018, 7, 320. [Google Scholar] [CrossRef]
- Clauset, A.; Newman, M.E.J.; Moore, C. Finding community structure in very large networks. Phys. Rev. E 2004, 70, 066111. [Google Scholar] [CrossRef] [PubMed] [Green Version]
- Jenks, G.F. The data model concept in statistical mapping. Int. Yearb. Cartogr. 1967, 7, 186–190. [Google Scholar]
Figure 1.
Study area and bus stops.

Figure 2.
Constructing the complex network based on bus lines.

Figure 3.
Spatial degree distribution.

Figure 4.
Statistical degree distribution.

Figure 5.
Spatial distribution of the clustering coefficient.

Figure 6.
Correlation of degree and clustering coefficient.

Figure 7.
Weight of edges.

Figure 8.
Statistical distribution of the weight of edges.

Figure 9.
The result of community detection; one color represents one community.

Figure 10.
Statistical distribution of the six levels of groups. L1 represents the percentage of traffic analysis zones (TAZs) with level L1 in all TAZs.
Figure 10.
Statistical distribution of the six levels of groups. L1 represents the percentage of traffic analysis zones (TAZs) with level L1 in all TAZs.

Figure 11.
Spatial distribution of closeness centrality, betweenness centrality, and PageRank score of the TAZs.
Figure 11.
Spatial distribution of closeness centrality, betweenness centrality, and PageRank score of the TAZs.

Figure 12.
Correlation between degree and centrality.

Figure 13.
Correlation of centrality between the bus network and road network.

© 2019 by the authors. Licensee MDPI, Basel, Switzerland. This article is an open access article distributed under the terms and conditions of the Creative Commons Attribution (CC BY) license (http://creativecommons.org/licenses/by/4.0/).
Share and Cite
MDPI and ACS Style
Yang, X.; Lu, S.; Zhao, W.; Zhao, Z. Exploring the Characteristics of an Intra-Urban Bus Service Network: A Case Study of Shenzhen, China. ISPRS Int. J. Geo-Inf. 2019, 8, 486. https://doi.org/10.3390/ijgi8110486
AMA Style
Yang X, Lu S, Zhao W, Zhao Z. Exploring the Characteristics of an Intra-Urban Bus Service Network: A Case Study of Shenzhen, China. ISPRS International Journal of Geo-Information. 2019; 8(11):486. https://doi.org/10.3390/ijgi8110486
Chicago/Turabian StyleYang, Xiping, Shiwei Lu, Weifeng Zhao, and Zhiyuan Zhao. 2019. "Exploring the Characteristics of an Intra-Urban Bus Service Network: A Case Study of Shenzhen, China" ISPRS International Journal of Geo-Information 8, no. 11: 486. https://doi.org/10.3390/ijgi8110486
Note that from the first issue of 2016, this journal uses article numbers instead of page numbers. See further details here.