Article

Unraveling the Chloroplast Genomes of Two Prosopis Species to Identify Its Genomic Information, Comparative Analyses and Phylogenetic Relationship

1
Natural and Medical Sciences Research Center, University of Nizwa, Nizwa 616, Oman
2
Genomics Group, Faculty of Biosciences and Aquaculture, Nord University, 8049 Bodø, Norway
*
Authors to whom correspondence should be addressed.
Authors contributed equally.
Int. J. Mol. Sci. 2020, 21(9), 3280; https://doi.org/10.3390/ijms21093280
Submission received: 1 March 2020 / Revised: 14 April 2020 / Accepted: 23 April 2020 / Published: 6 May 2020
(This article belongs to the Section Molecular Genetics and Genomics)

Abstract

:
Genus Prosopis (family Fabaceae) are shrubby trees, native to arid and semi-arid regions of Asia, Africa, and America and known for nitrogen fixation. Here, we have sequenced the complete chloroplast (cp) genomes of two Prosopis species (P. juliflora and P. cineraria) and compared them with previously sequenced P. glandulosa, Adenanthera microsperma, and Parkia javanica belonging to the same family. The complete genome sequences of Prosopis species and related species ranged from 159,389 bp (A. microsperma) to 163,677 bp (P. cineraria). The overall GC contents of the genomes were almost the similar (35.9–36.6%). The P. juliflora and P. cineraria genomes encoded 132 and 131 genes, respectively, whereas both the species comprised of 85 protein-coding genes higher than other compared species. About 140, 134, and 129 repeats were identified in P. juliflora, P. cineraria and P. glandulosa cp genomes, respectively. Similarly, the maximum number of simple sequence repeats were determined in P. juliflora (88), P. cineraria (84), and P. glandulosa (78). Moreover, complete cp genome comparison determined a high degree of sequence similarity among P. juliflora, P. cineraria, and P. glandulosa, however some divergence in the intergenic spacers of A. microsperma and Parkia javanica were observed. The phylogenetic analysis showed that P. juliflora is closer to P. cineraria than P. glandulosa.

1. Introduction

The Prosopis L. genus belongs to the Leguminosae (Fabaceae) family, sub-family Mimosoideae. Prosopis comprises about 44 species, classified into five sections: Prosopis, Monilicarpa, Strombocarpa, Algarobia, and Anonychium [1]. Prosopis genus can be found around the world in arid and semi-arid regions, including Central and North Africa, South and North America, and the Caribbean region. It has both economic and ecological reputation in arid regions [1,2] and is related with chaquenian areas in Brazil [3]. The genus is mostly pollinated by insects [1,4,5], which shows a short distance of pollen dispersion [4,5]. Prosopis taxa grow in most of the world’s warm arid and semi-arid areas, both as introduced and native species [6]. They have been introduced universally and have become naturalized or invasive in various part of the world [7].
Prosopis cineraria is one of the most common trees of the Indian desert and locally known as Khejri. This is an important agroforestry tree and a renewable source of timber, fodder and fuel used by local populations [8]. It is an important part of Asian desert ecosystems due to biomass production and it provides desert soil, provides greenery and help to fix atmospheric nitrogen [9,10]. On the other hand, P. juliflora is a xerophytic evergreen tree which can grow in different climatic conditions and on variety of soils [11]. P. juliflora can grow up to 14 m having an open canopy and a large crown. The taxonomy of P. juliflora remains unclear due to the morphological similarities with P. pallida which cause confusion in their identification [6]. Similarly, genus Prosopis phylogenetic relationships have been controversial for a long time and various studies have suggested taxonomic revision [12,13].
The chloroplast is a vital organelle that plays a central role in various important biochemical processes especially in plant photosynthesis [14]. Due to an abundance within plants, slow mutation rate, maternal inheritance, and relatively small genome size chloroplast DNA (cpDNA) has been extensively used in genetic studies [15]. The gene content and structure of cp genomes among angiosperms are well conserved but there are exceptions such as parasitic plants with a reduced gene set and loss of IR. Chloroplast genome comprise two inverted repeat (IR) sequences which separates a small single copy (SSC) and large single copy (LSC) region and complete cp genome range in size from 107 to 218 kb [16]. Cp genome has been extensively used to infer the evolutionary history of most angiosperms due to its maternally inherited nature. These features makes cp genome very useful in phylogenetic and phylogeographic studies, especially at higher taxonomic levels [17]. Similarly, recent research have verified that phylogenetic analysis based on whole genome data set and all shared protein-coding genes can deliver better phylogeographic and phylogenetic resolution [18,19]. Maternally-inherited markers are often better predictors of interspecific gene flow [20], resulting in shared genetic structure, rather than the detection of incomplete lineage sorting [21,22]. Chloroplast DNA analyses have enabled the advancement of strategies for the conservation of various angiosperm species [23].
The development of next generation sequencing (NGS) technologies have allowed for the sequencing of entire chloroplast genomes. Many chloroplast genomes of sub family Caesalpinioideae have already been determined by NGS [24,25]. Similarly, the quickly evolving loci recognized by numerous researchers are very significant and have more resolving power than traditional molecular markers to resolve ambiguous phylogenetic relationships [26,27]. Therefore, numerous researchers have concentrated to determine genic regions among specific genera or families to get valuable information about molecular markers for future studies [26,27,28].
Cp genome variation has opened new significant understandings into the domestication origins of various crops such as citrus and apple [29,30,31]. In the current study, the complete chloroplast genomes of P. juliflora and P. cineraria were sequenced and elucidated their structural organization and performed comparative analysis with the genomes of related species viz. P. glandulosa, A. microsperma and P. javanica cp genomes. Furthermore, we identified the simple sequence repeats (SSRs), dispersed repeat sequences, sequence divergence and phylogenetic relationship among these studied cp genomes.

2. Results

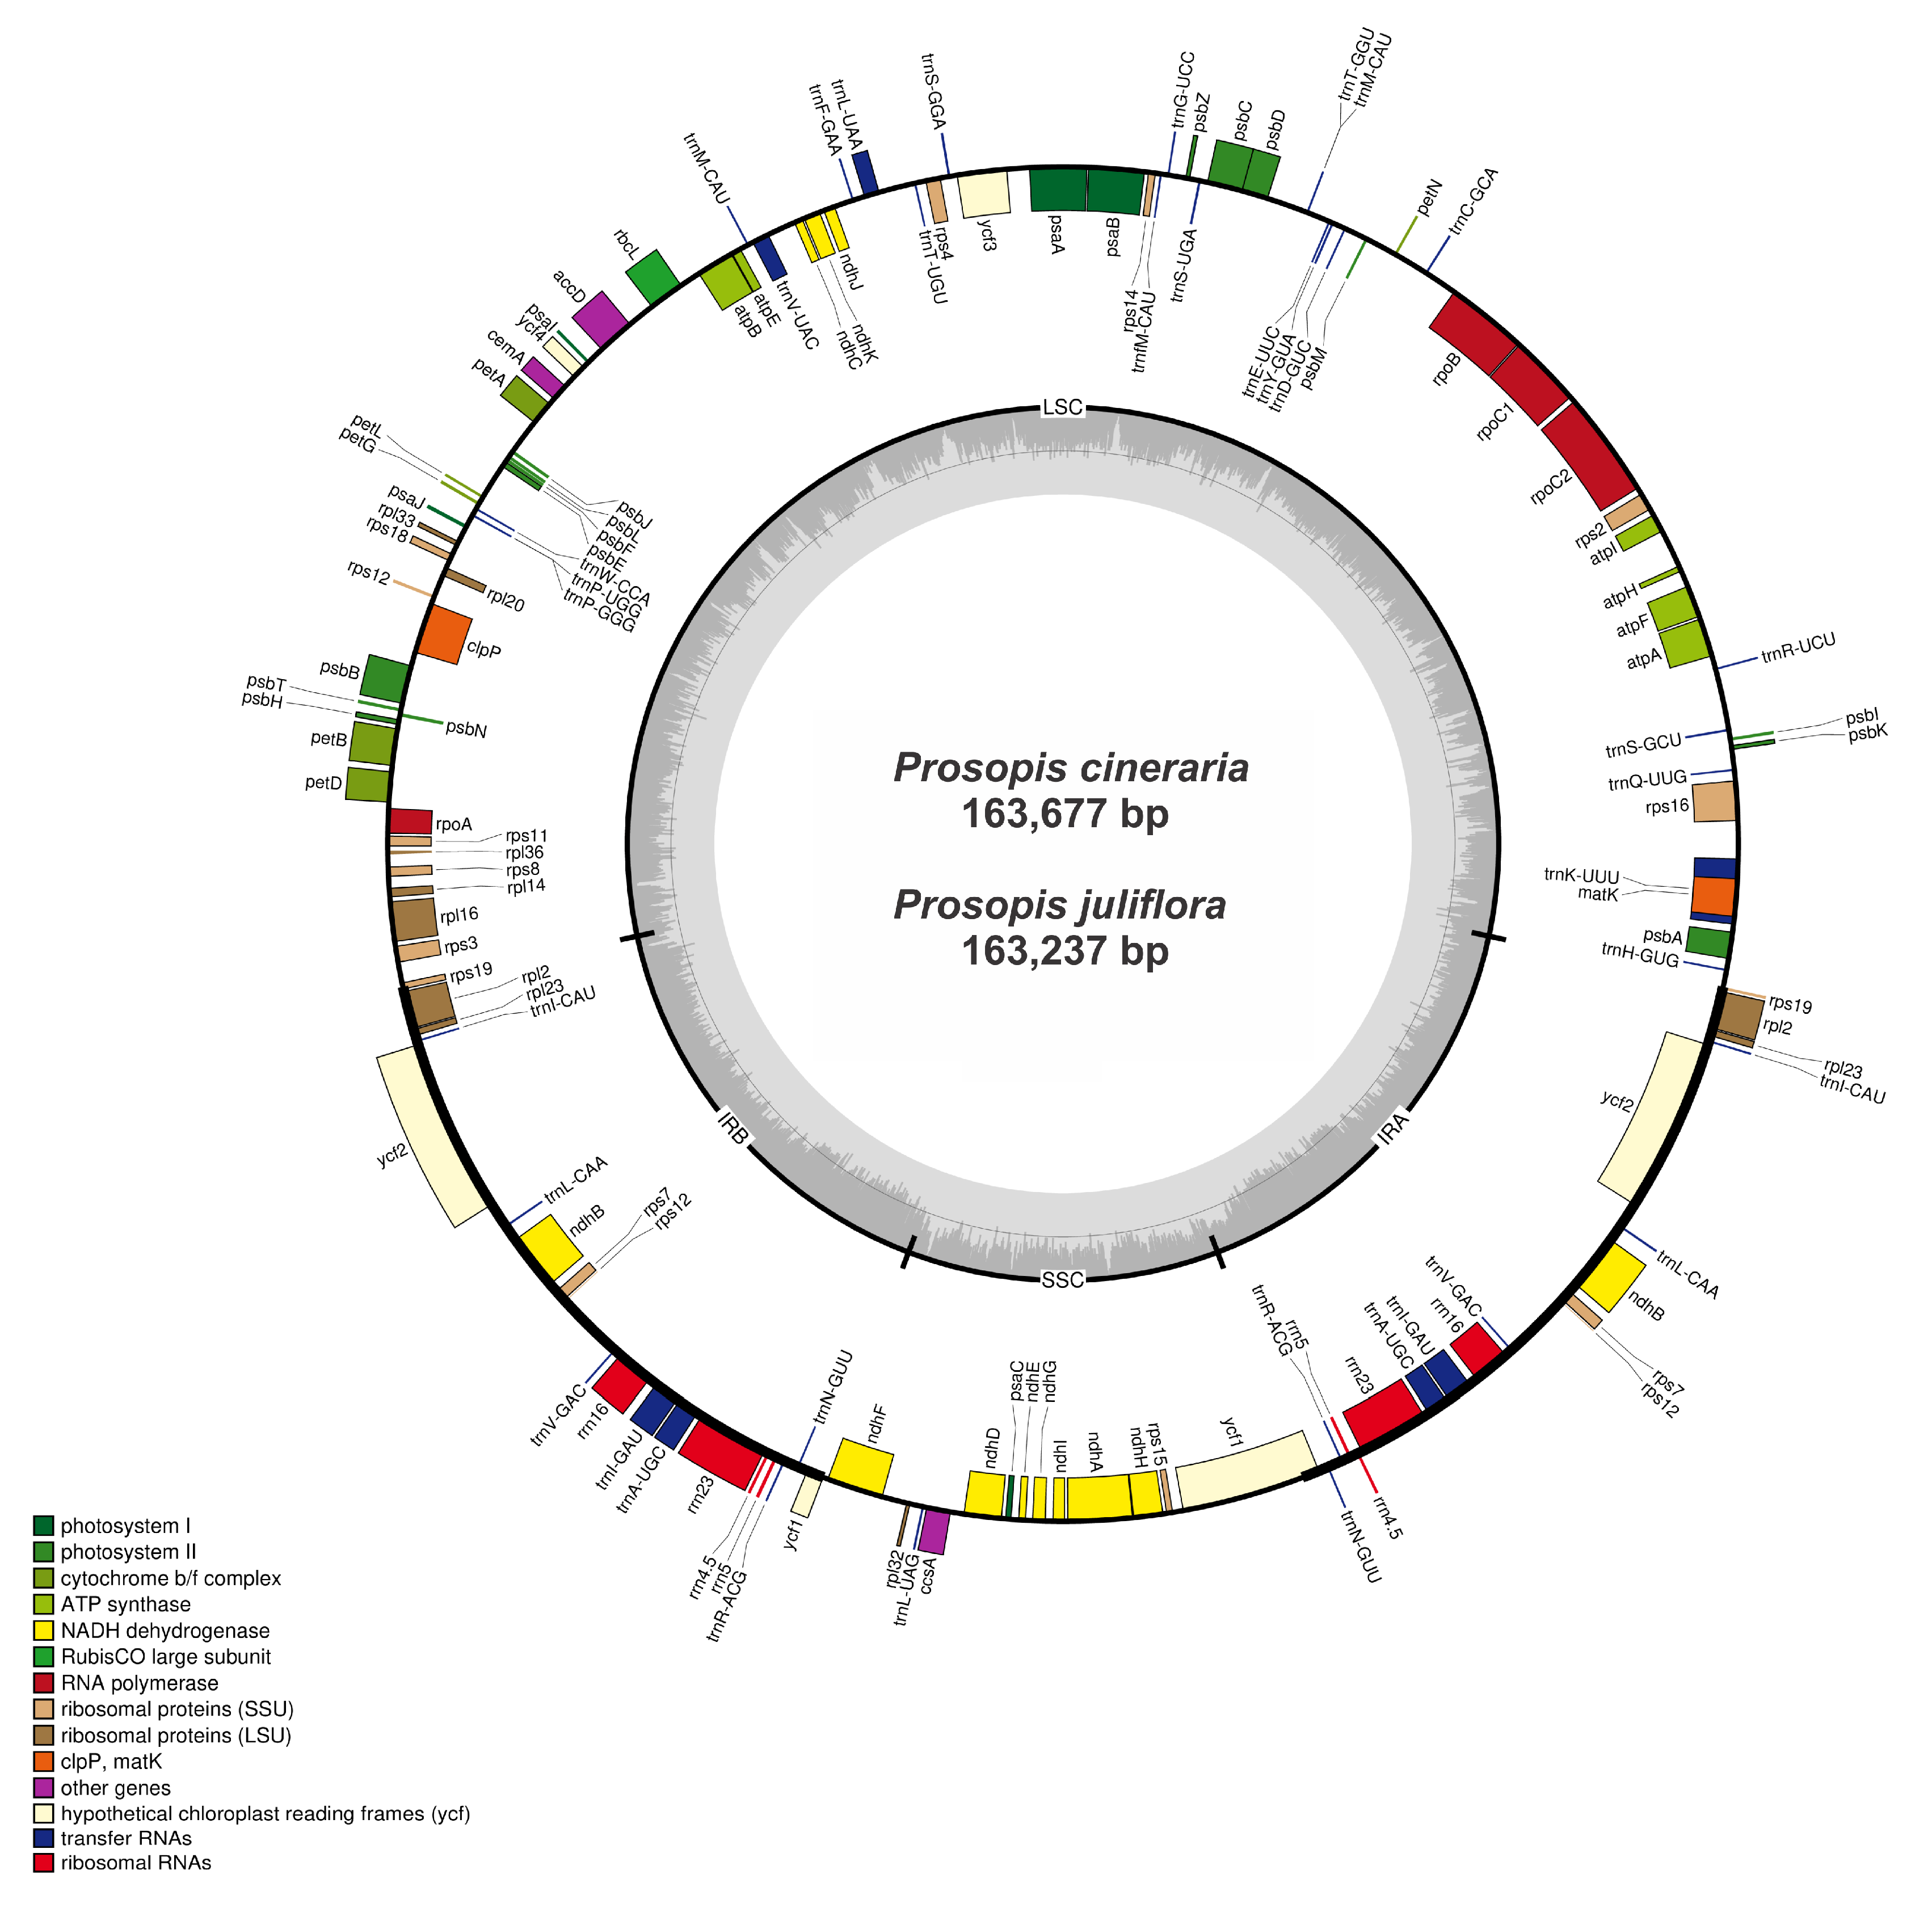
2.1. General Features and Organization of Chloroplast Genomes

The complete chloroplast genomes of the two sequenced Prosopis species, Prosopis juliflora (Pj) (MN104889) and Prosopis cineraria (Pc) (MN104890) are circular molecules like typical angiosperm cp genomes having quadripartite structures. The sizes of the P. juliflora and P. cineraria cp genomes are 163,237 and 163,677 bp, respectively (Figure 1 and Table 1). Both P. juliflora and P. cineraria cp genomes were analyzed and compared with three associated cp genomes, with sizes ranging from 159,389 bp (A. microsperma) to 163,677 bp (P. cineraria) (Table 1). Similar to earlier reported angiosperm cp genomes [32,33,34,35], the P. juliflora and P. cineraria cp genomes are typical circular in nature comprising of four parts: (a) LSC region of 92,495 bp and 92,937 bp, covering 56.6% and 56.7% in the genomes respectively; (b) SSC region of 18,880 bp and 18,878 bp, covering 11.5% and 11.53% in the genome; (c) two IR regions separating the SSC and LSC regions, which were 25,931 bp and 25,931 bp in size, covering the same amount 15.8% in both the genomes respectively. The P. juliflora and P. cineraria cp genomes encodes 132 and 131 genes respectively, including 85 protein-coding genes, 38 tRNA (P. cineraria) and 39 tRNA genes (P. juliflora), and 8 rRNA genes each (Figure 1). Among the annotated genes, 16 genes (petD, petB, atpF, rpl2, rps16, rpl16, rpoC1, rps12, ndhA, ndhB, trnI-GAU, trnA-UGC, trnK-UUU, trnL-UAA, trnV-UAC, and trnG-GCC) have one intron each, and two genes (ycf3, clpP) comprised two introns each (Table 2). The rps12 gene was trans-spliced; the 5′ end exon was detected in the LSC region and the 3′ exon was observed in the IR region, as in most other angiosperms. The protein-coding genes included 12 genes encoding small ribosomal proteins (rps2, 3, 4, 7, 8, 11, 12, 14, 15, 16, 18, and 19), eight genes encoding large ribosomal proteins (rpl2, 14, 16, 20, 23, 32, 33, and 36), fifteen genes related to photosystem II, five genes encoding photosystem I components, and six genes encoding ATP synthase and electron transport chain components (atpA, B, E, F, H, and I; Table 3).
The total GC content was 35.9% in cp genomes of the P. juliflora, P. cineraria, P. glandulosa and P. javanica, whereas the A. microsperma comprised 36.6%. The IR region shows the highest amount of GC contents (42.7%) compared to LSC (33%) and SSC (30.4%) regions. In these cp genomes the most frequently used codons were ATT (n = 1114, n = 1118) followed by AAA (n = 1181, n = 1117) in P. juliflora and P. cineraria respectively, which encodes isoleucine and lysine respectively. The least frequently used codon were ATT and ATC (n = 1) encode methionine in both P. juliflora and P. cineraria cp genomes. The AT contents of the 1st, 2nd, and 3rd codon positions of Protein Coding Sequences (CDSs) in both P. juliflora and P. cineraria were 64%; 64.5%, 63.9%; 63.6%, and 64.3%; 64.3% respectively (Table 4). These high AT contents detected here are similar to previously reported cp genomes of other terrestrial plants [28,36,37].
Protein-coding regions accounted for 48.4% and 48.1% of the P. juliflora and P. cineraria cp genomes respectively whereas the tRNA and rRNA regions accounted for 1.79%, 1.74% and 5.53%, 5.54% respectively. The remaining regions were intergenic spacers, introns, and non-coding sequences. The GC content counted 35.9% for both cp genomes, which is very similar to the previously reported cp genome of angiosperms [38,39].

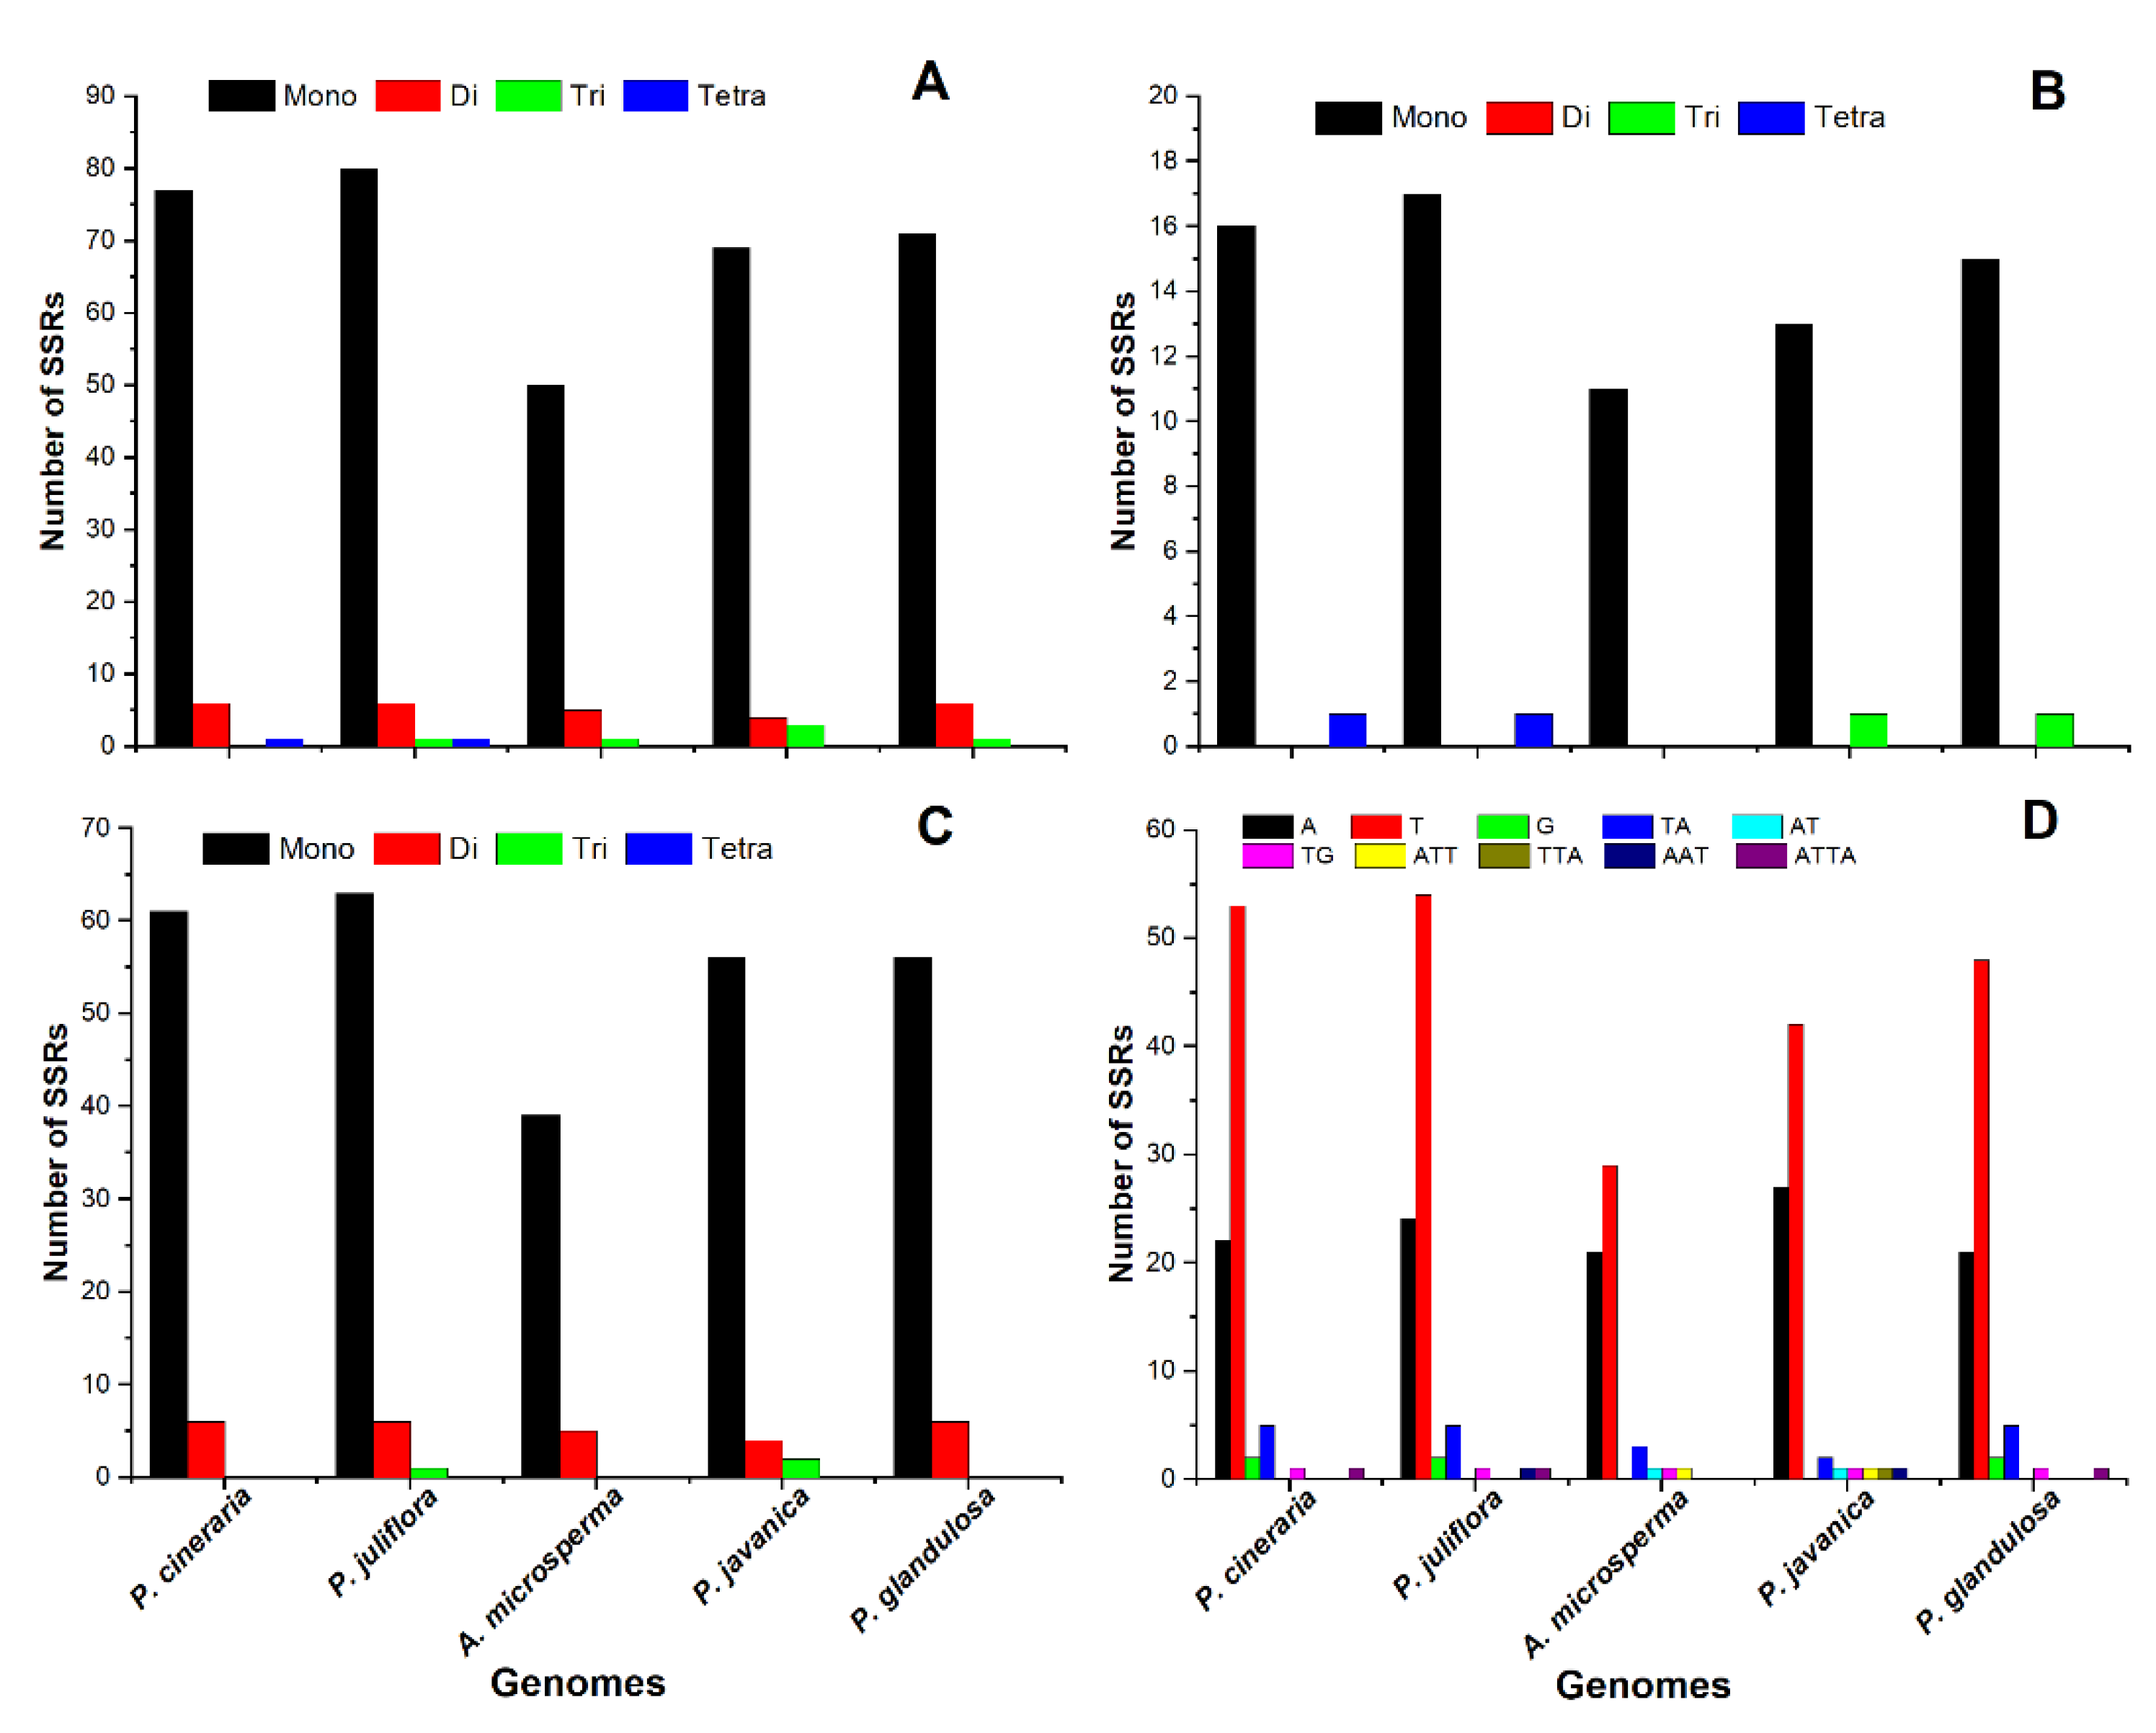
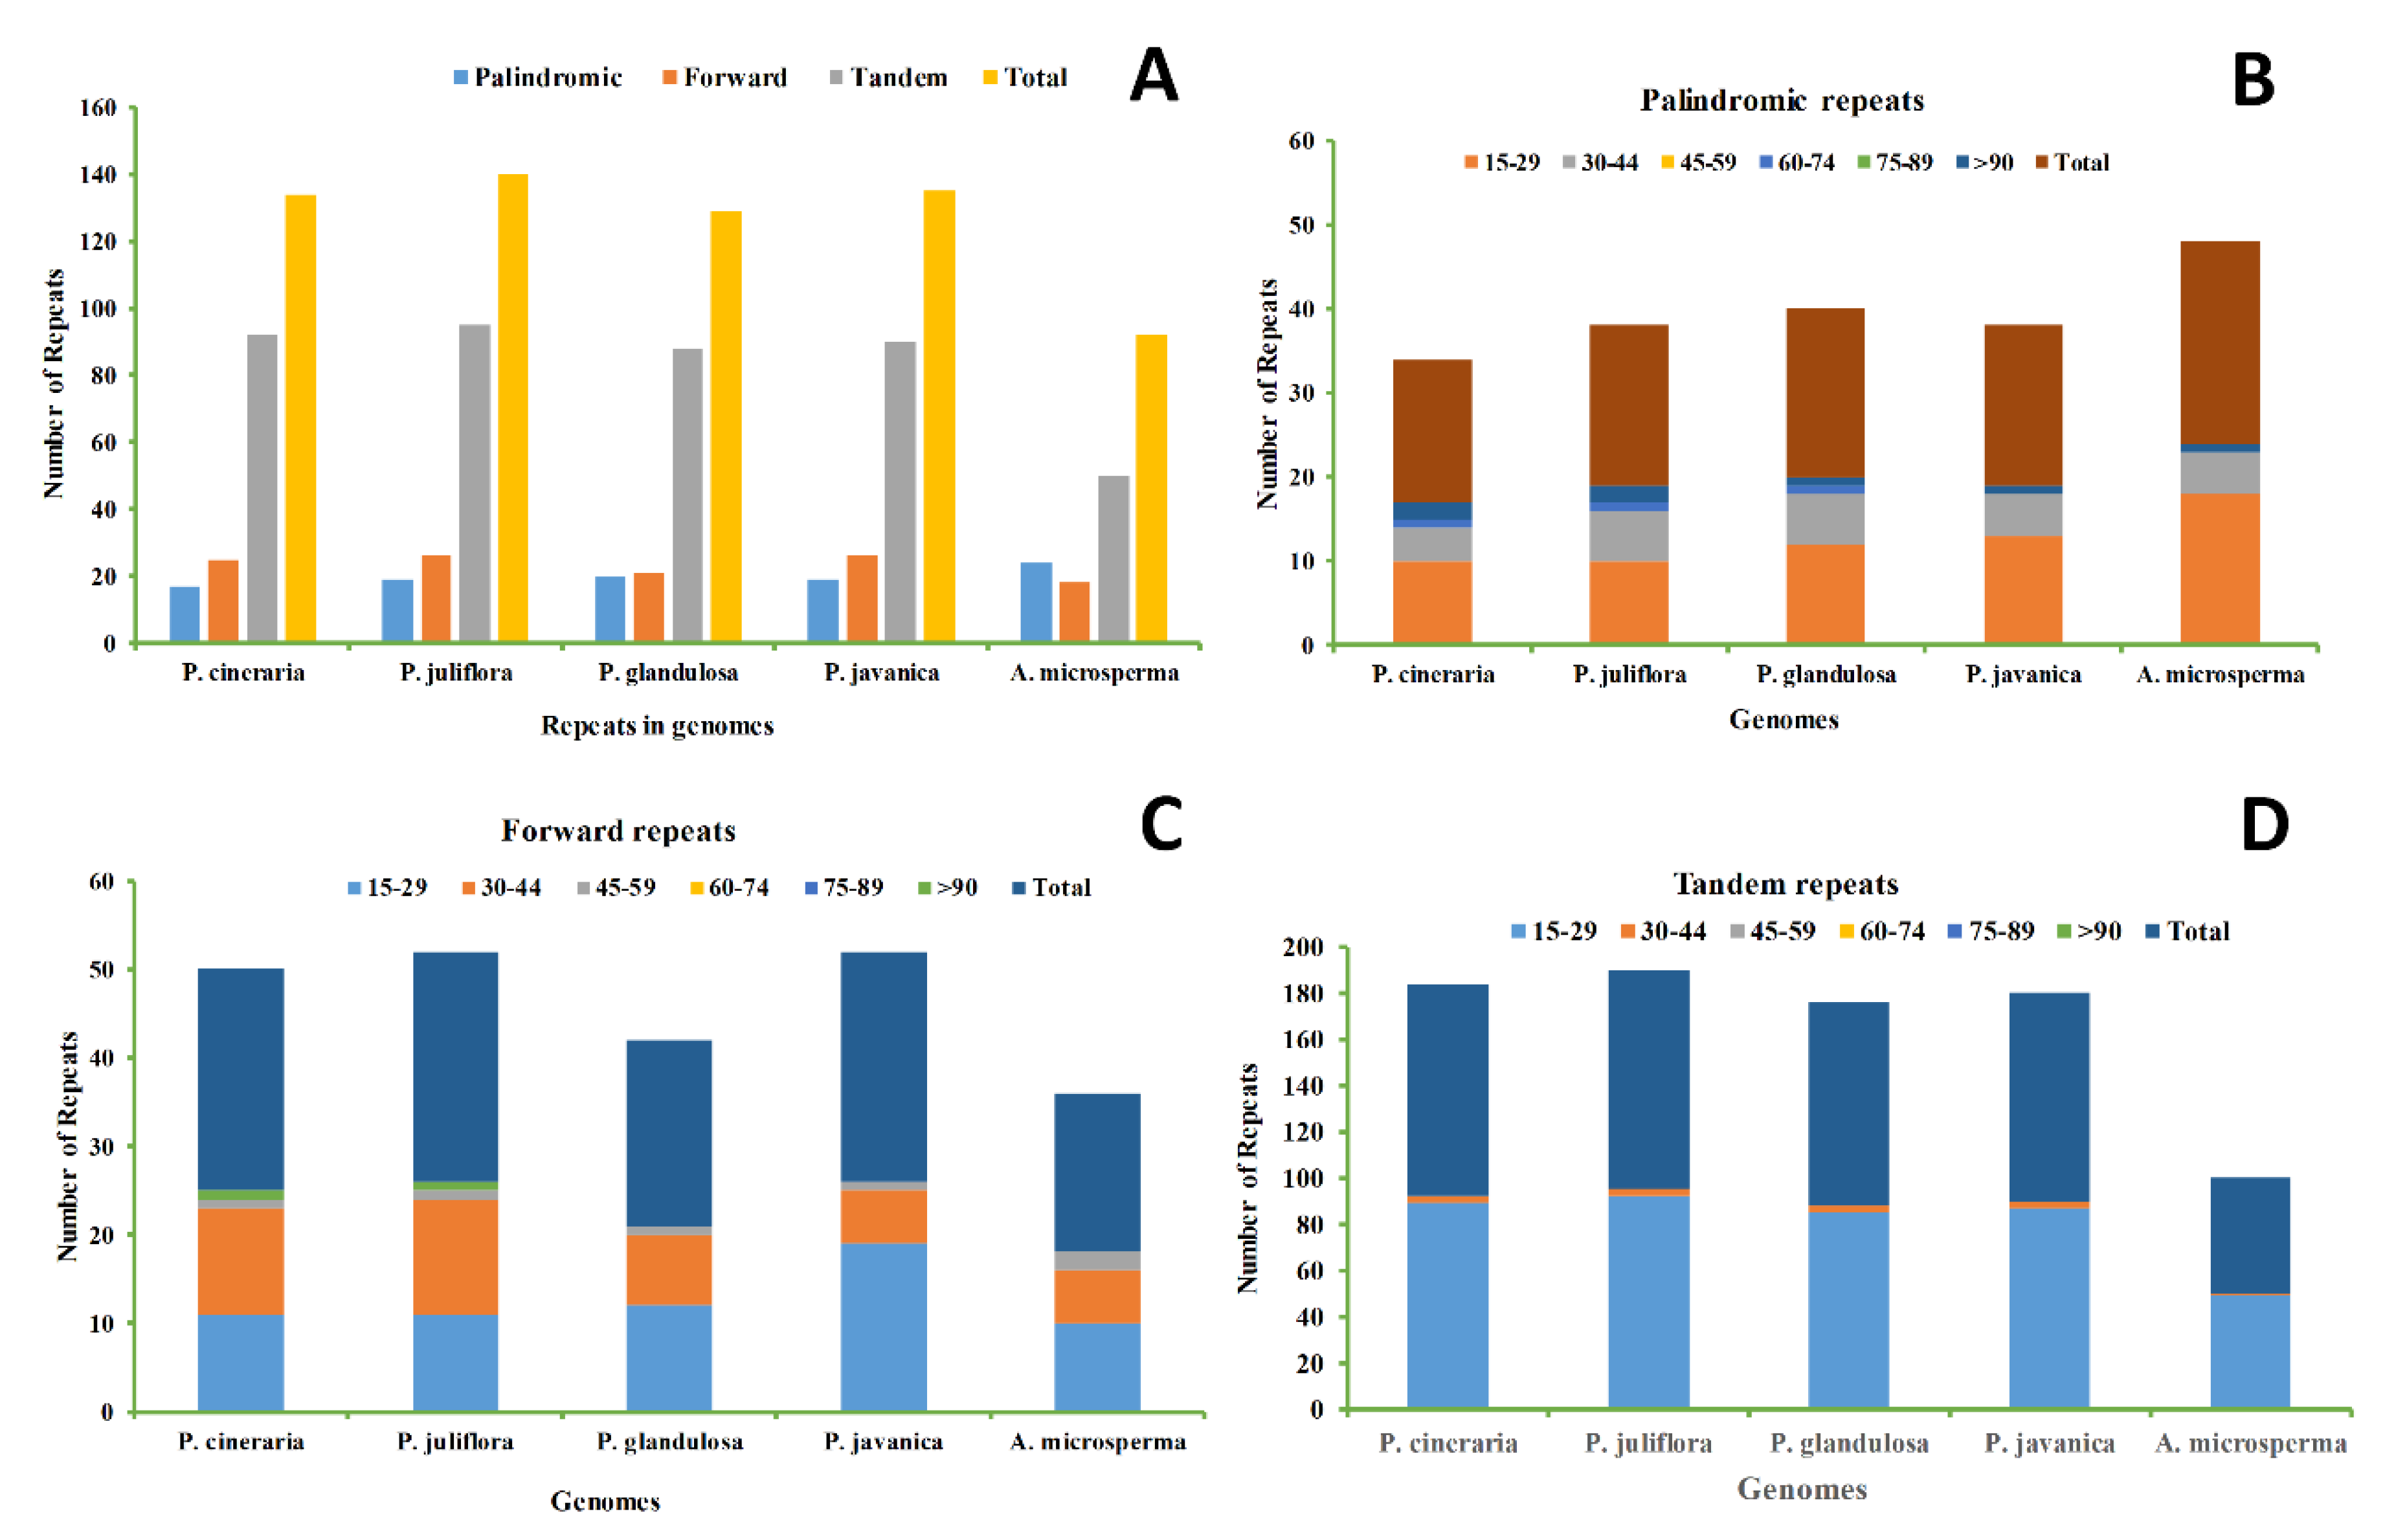
2.2. SSR Analysis and Repeats, an Insight into the Genome

We also determined SSRs in these cp genomes, which are commonly works as genetic markers in population genetics and evolutionary studies. SSRs or microsatellite markers, comprise of a sequence of 1–6 bp repeat units. In current study, SSRs were analyzed in three Prosopis species cp genomes as well as in two other cp genomes from the subfamily Caesalpinioideae. The total number of SSRs per species ranging from 56 to 88 and these repeats include 50–80 mononucleotide repeats, 4–6 dinucleotide repeats, 1–3 trinucleotide repeats, and one tetranucleotide repeats was only observed in P. juliflora cp genome. The maximum number of SSRs were detected in P. juliflora (88 SSRs), while the minimum number of SSRs was detected in A. microsperma (56 SSRs) (Figure 2). Mononucleotide repeats were found to be the most common types of SSRs in these cp genomes P. juliflora, P. cineraria, A. microsperma, P. javanica, P. glandulosa, comprising 90%, 91.6%, 89.2%, 90.7%, and 91% of total SSRs respectively (Figure 2). In P. juliflora the highest number of SSRs were single-base repeats (80), followed by double-base (6), and tri-base repeats (1) (Figure 2). Similarly, in P. cineraria the highest number were single base repeat (77), followed by double base repeat (6). However, among these cp genomes, only one tetra-base repeat was found only in P. juliflora cp genome.
In P. juliflora and P. cineraria most of the SSRs were detected in intergenic spacer (IGS) regions (79.5% and 79.7%) respectively, followed by coding sequences (CDSs) (20.4% and 10.2%) (Figure 2B,C). Mononucleotide A/T repeat units contained the highest proportion up to 90% in P. juliflora, 91.6% in P. cineraria, 91% in P. glandulosa, 90.7% in P. javanica, and 89.2% in A. microsperma (Figure 2D). Mononucleotide G repeats detected only in P. juliflora, P. cineraria and P. glandulosa. Among dinucleotides repeat, TA was found more frequently than AT. The tetranucleotide repeats were ATTA, which appeared only in P. juliflroa and P. cineraria, respectively (Figure 2D).
A total of 140, 134, 129, 135, and 92 repeats were detected in the P. juliflora, P. cineraria, P. glandulosa, P. javanica, and A. microsperma cp genomes, respectively. The P. juliflora genome comprises 26 forward, 19 palindromic, and 95 tandem repeats, while P. cineraria cp genome comprises 25 forward, 17 palindromic, and 92 tandem repeats, and about 21 forward, 20 palindromic and 88 tandem repeats were detected in P. glandulosa cp genome (Figure 3). Similarly, about 135 and 92 total repeats were also identified in related cp genome of both P. javanica and A. microsperma, respectively (Figure 3). With 24 palindromic repeats, A. microsperma comprises the maximum number of palindromic repeats, while P. juliflora and P. javanica comprises the highest number of forward repeats (26), and the highest tandem repeat was detected in P. juliflora (95). We also observed that P. cineraria comprises the minimum number of palindromic repeats (17) while A. microsperma comprises minimum number of forward repeats (18) and tandem repeats (50) (Figure 3).

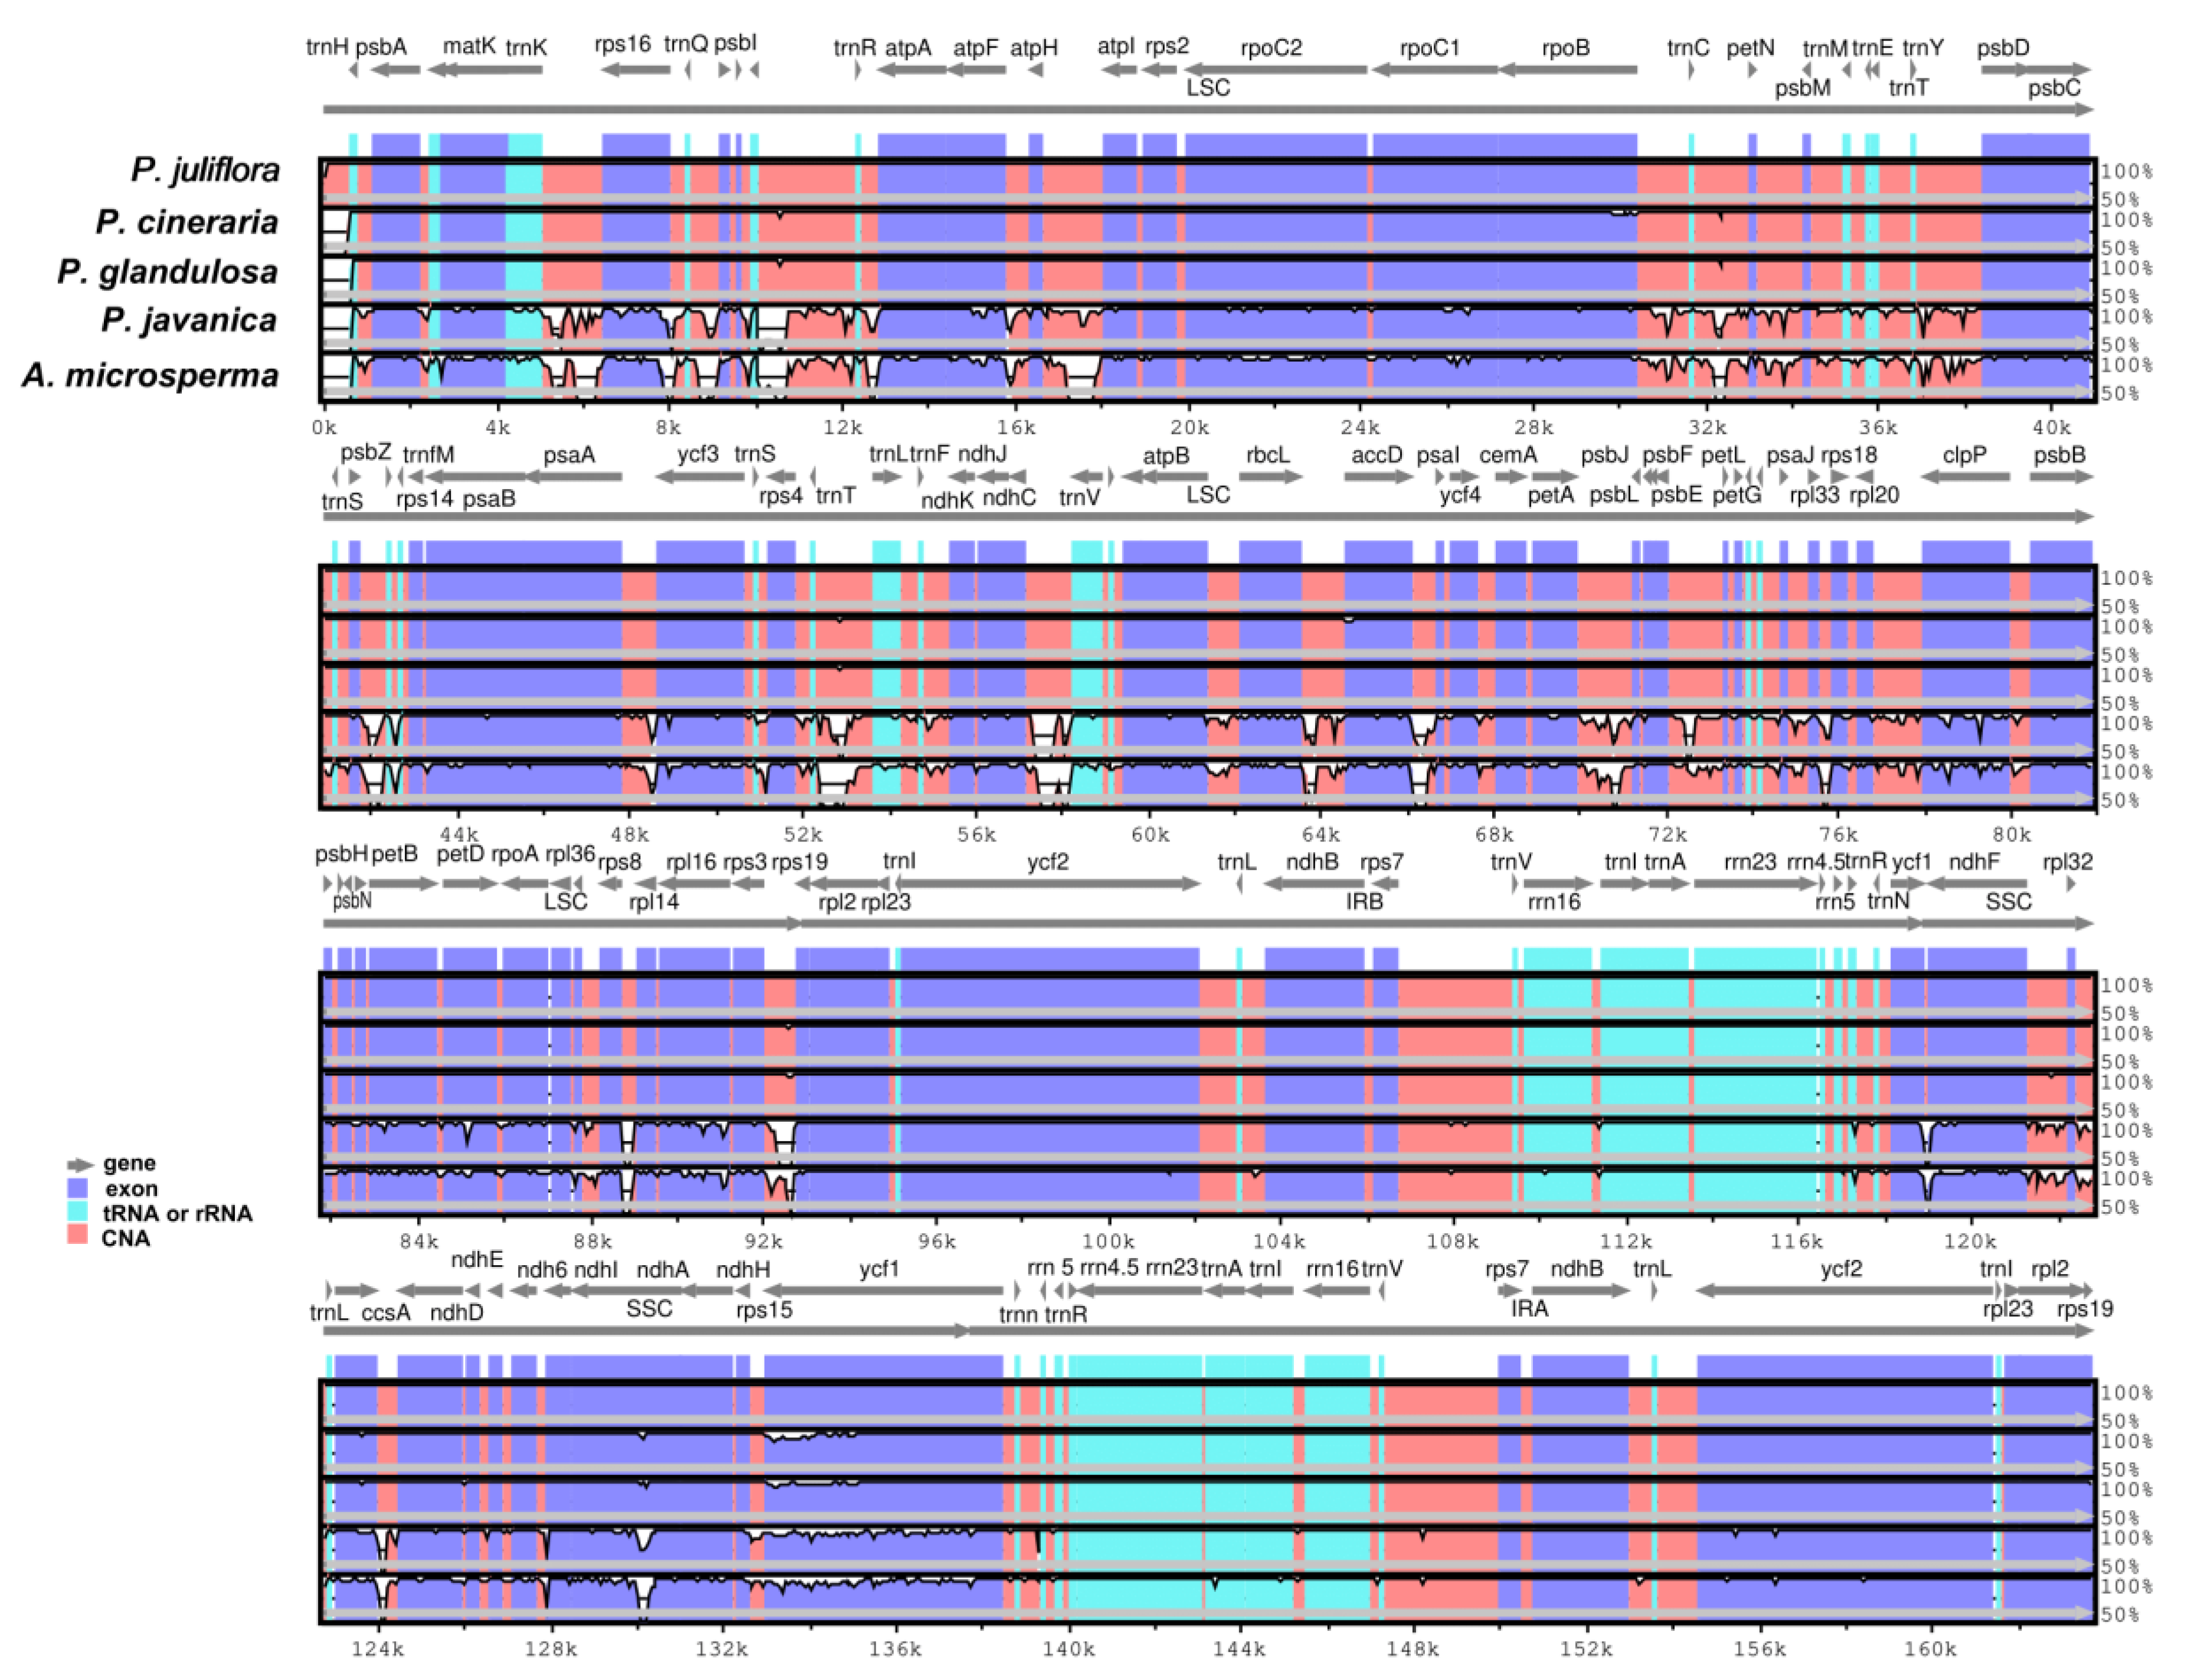
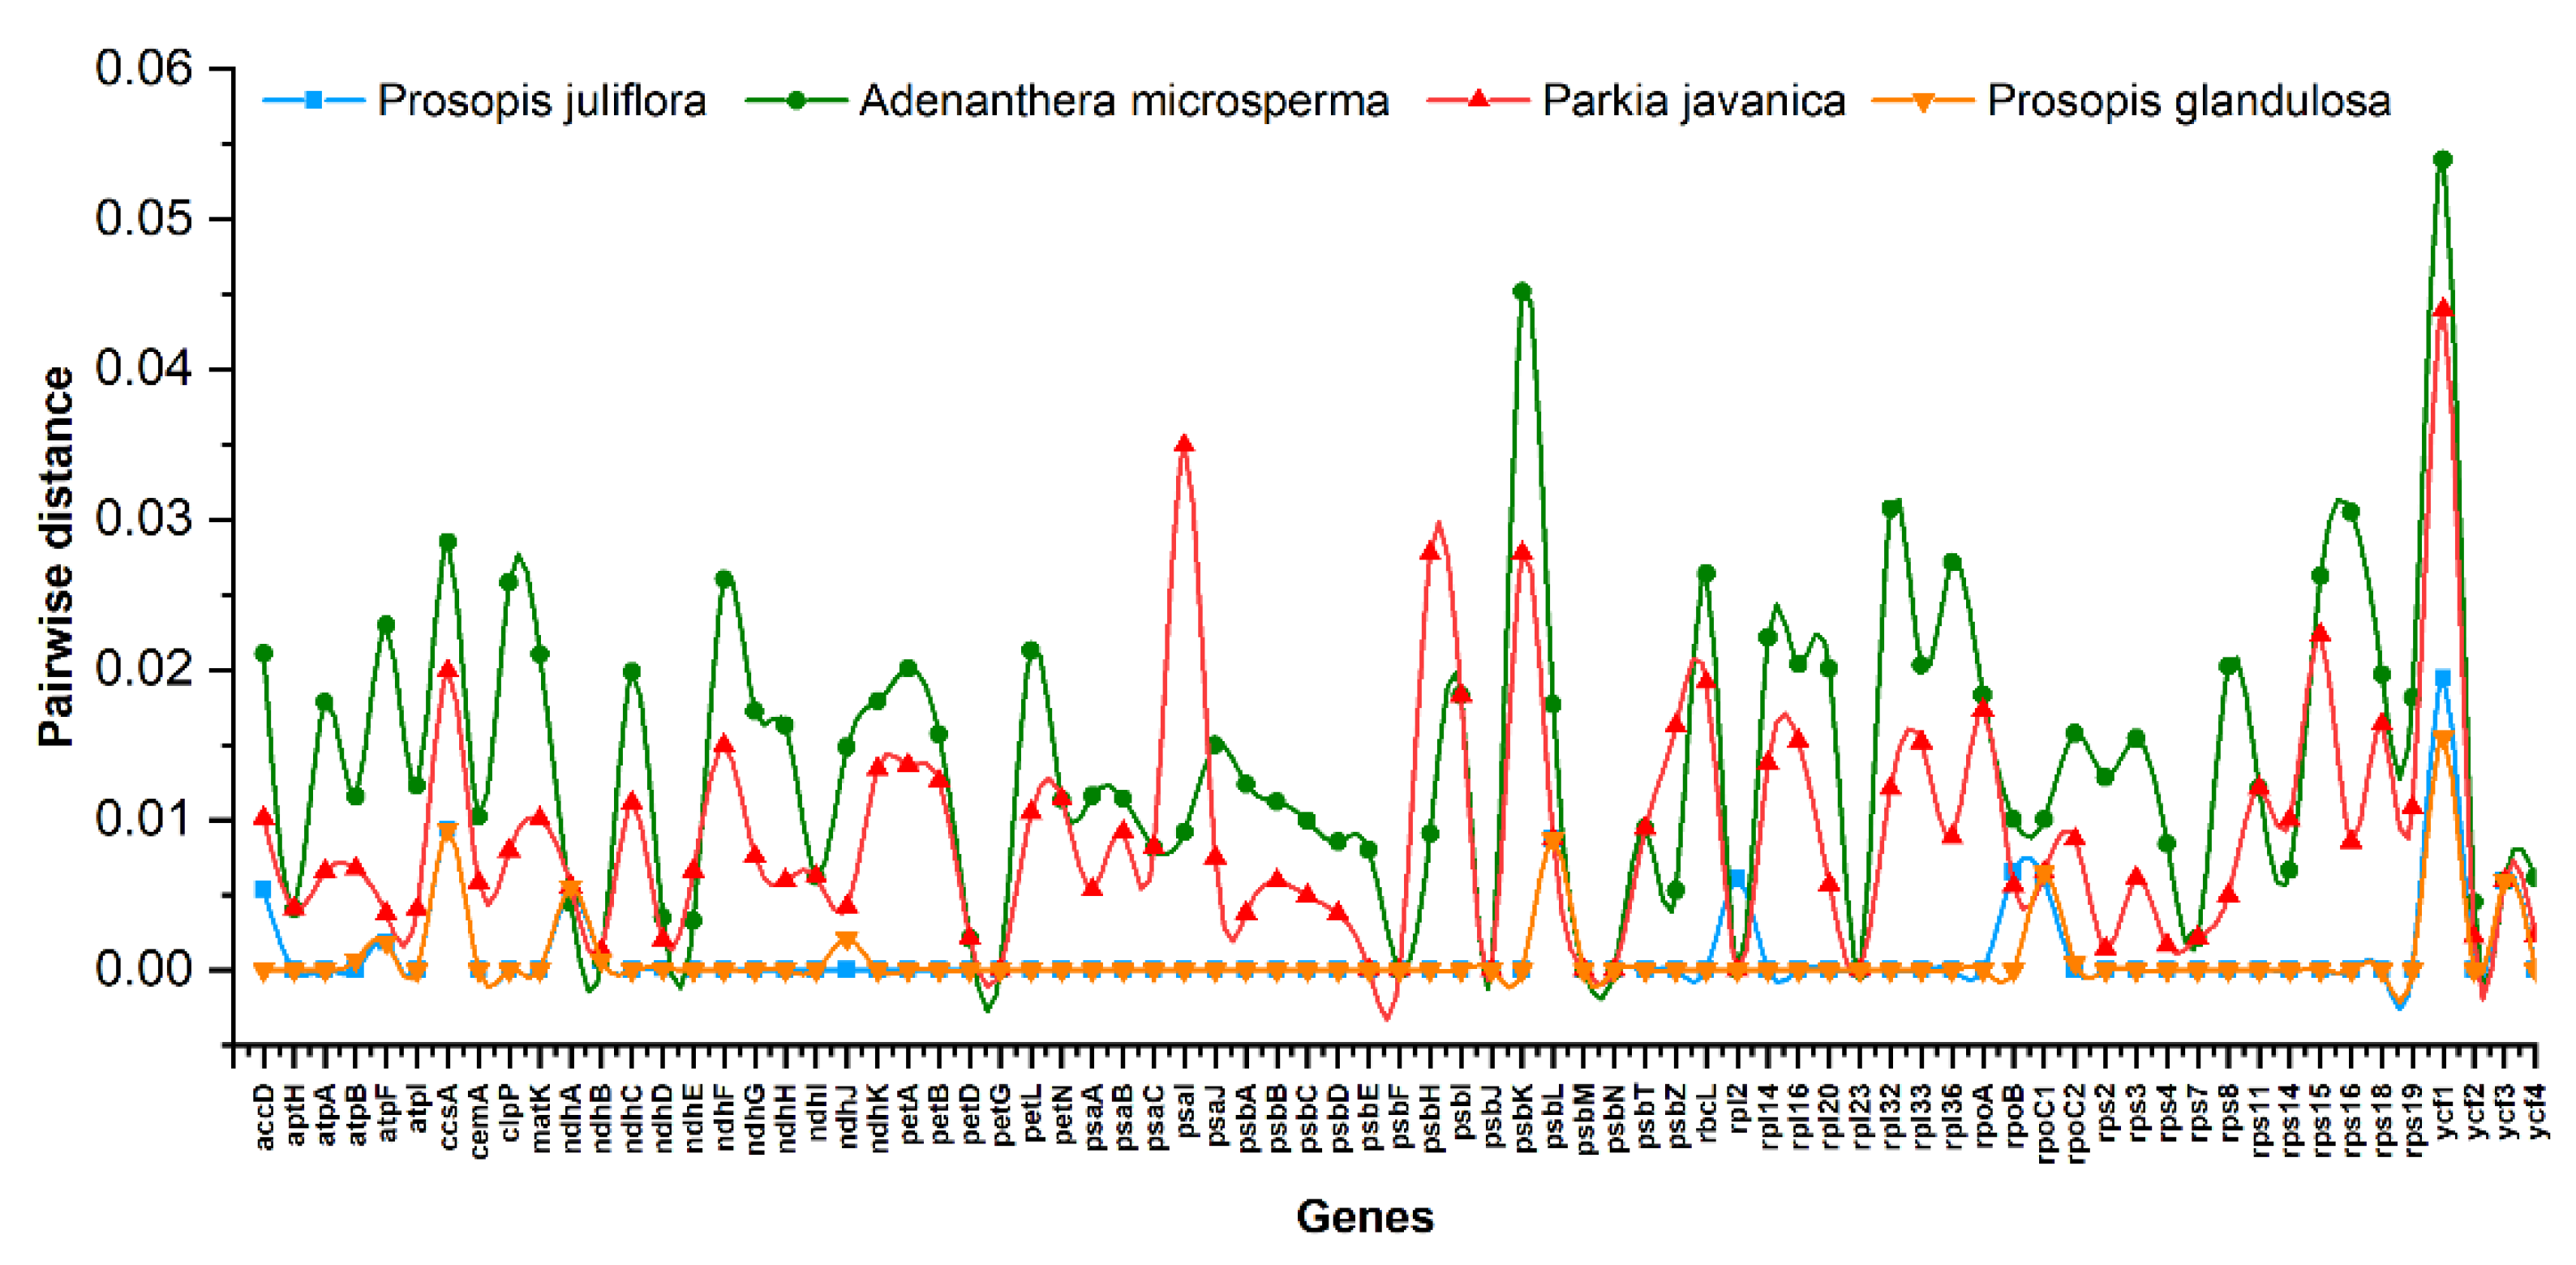
2.3. Comparative Analysis and Sequence Divergence Analyses

The Prosopis species cp genomes comparisons revealed various regions of sequence variation by using mVISTA and the P. juliflora genome was selected as reference genome. Some genes, such as rpoB, accD, ycf1, ccsA, atpF, showed sequence divergence with P. cineraria and P. glandulosa. However, with P. javanica and A. microsperma it shows sequence divergence in many coding and non-coding regions such as matK- rps16, psbI-trnR, atpH-atpI, psbZ-trnG, rps4-trnI, petA-psbL, rps3-rps19, ndhG-ndhA, rpoC2, rpoB, clpP, ndhF, ycf1, and matK exhibited sequence divergences among these genomes. ycf1, ndhH and ndhD were detected the most divergent genes in the SSC region. In the LSC region, the rpoC1, rpoC2, and rpl16 genes showed some sequence divergence only in P. javanica and A. microsperma. The IR region is very similar, however very little divergence was observed in ycf2 gene among the compared genomes (Figure 4).
Similarly, we determined the average pairwise sequence divergence among these cp genomes (Supplementary Table S1). The P. juliflora cp genome revealed an average sequence divergence of 0.001, whereas the P. juliflora possessed the highest sequence divergence with A. microsperma (0.025) while the lowest was observed with P. glandulosa (0.0009). Furthermore, the thirteen most divergent genes among these genomes were ycf1, psbK, psaI, rpl32, accD, ccsA, clpP, ndhF, ndhG, psbH, rbcL, rps15, and rps16. The ycf1 gene showed the highest average sequence divergence (0.1329), followed by psbK (0.072), ccsA (0.067), rbcL (0.045), and accD (0.036; Figure 5). Similarly, among Prosopis species, P. cineraria showed greatest divergence in ycf1 with both P. juliflora (0.019) and P. glandulosa (0.015), respectively (Figure 5).

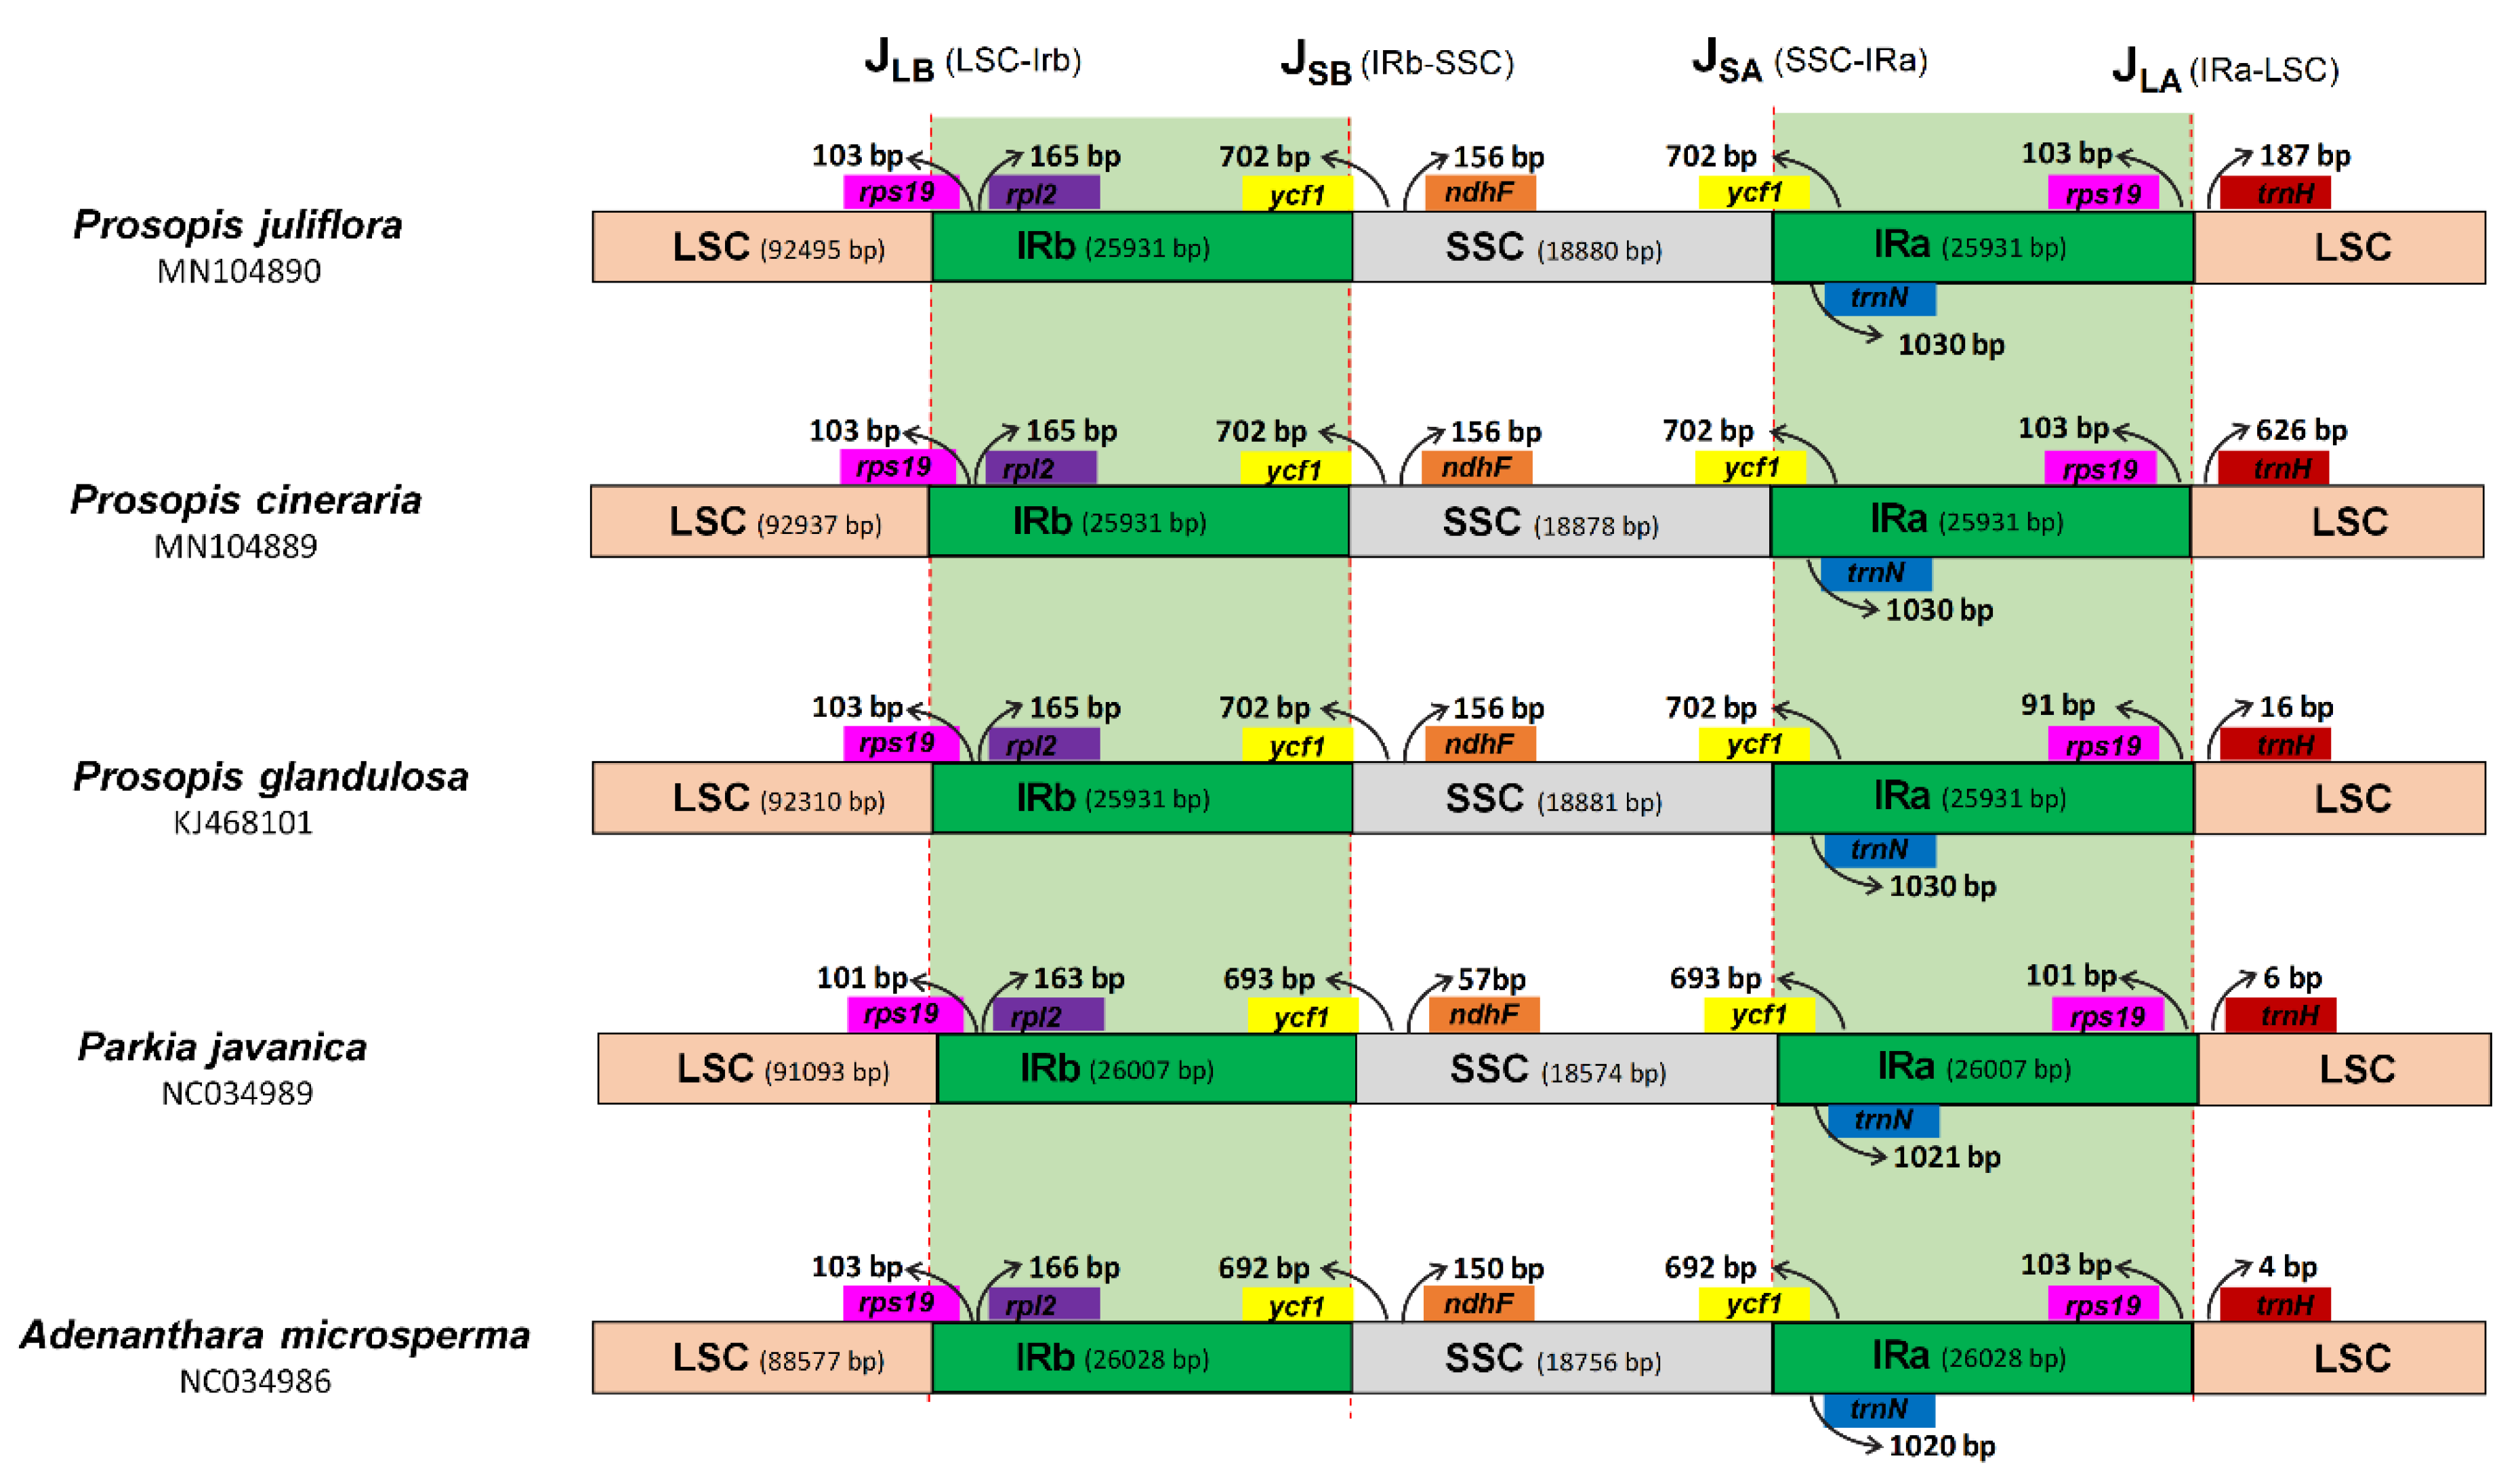
2.4. Boundaries between Inverted Repeat and Single Copy Regions

In angiosperms, variation in the length of cp genomes are usually due to the IR and single-copy (SC) regions expansion and contraction [40]. In the current study, a comprehensive assessment of the four junctions (JLA, JLB, JSA, and JSB) between the two single copy regions (LSC and SSC) and the two IR regions (IRa and IRb) of the P. juliflora, P. cineraria, P. glandulosa, P. javanica, and A. microsperma cp genomes was performed. Regardless of the similar lengths of the IR regions of P. cineraria, P. juliflora and P. glandulosa, some expansion and contraction were detected, with the IR regions ranging from 25,931 bp in Prosopis species to 26,028 bp in A. microsperma. All the four junctions (JLA, JLB, JSA, and JSB) were conserved in three Prosopis cp genomes. However, some variations were observed with P. javanica and A. microsperma cp genomes (Figure 6). The partially duplicated genes were observed only at the beginnings and ends of the IR regions, including 103 bp of rps19 in P. juliflora and P. cineraria and 101 bp of rps19 in P. glandulosa from JLB (Figure 6). Furthermore, the ycf1 gene was partially duplicated, with 702 bp of this sequence being duplicated in P. cineraria, P. juliflora, P. glandulosa, 693 bp in P. javanica, and 692 bp in A. microsperma. Furthermore, JLA was found between rps19 and trnH, and the distance between rps19 and JLA was 103 bp in P. juliflora and P. cineraria while in P. glandulosa this distance was 91 bp. However, in P. javanica and A. micosperma the above distance was 101 bp and 103 bp respectively. Additionally, variation was observed in the distance between JLA and trnH among these species cp genomes (Figure 6). In P. juliflora, P. cineraria, and P. glandulosa the distance between JLA and trnH was 187 bp, 626 bp and 16 bp respectively. Similarly, this distance was 6 bp and 4 bp in P. javanica and A. microsperma cp genomes. The distance between JSB border and ndhF gene was found to be the same in all Prosopis species cp genomes, while in P. javanica and A. microsperma, this distance was found 57 bp and 150 bp respectively (Figure 6).

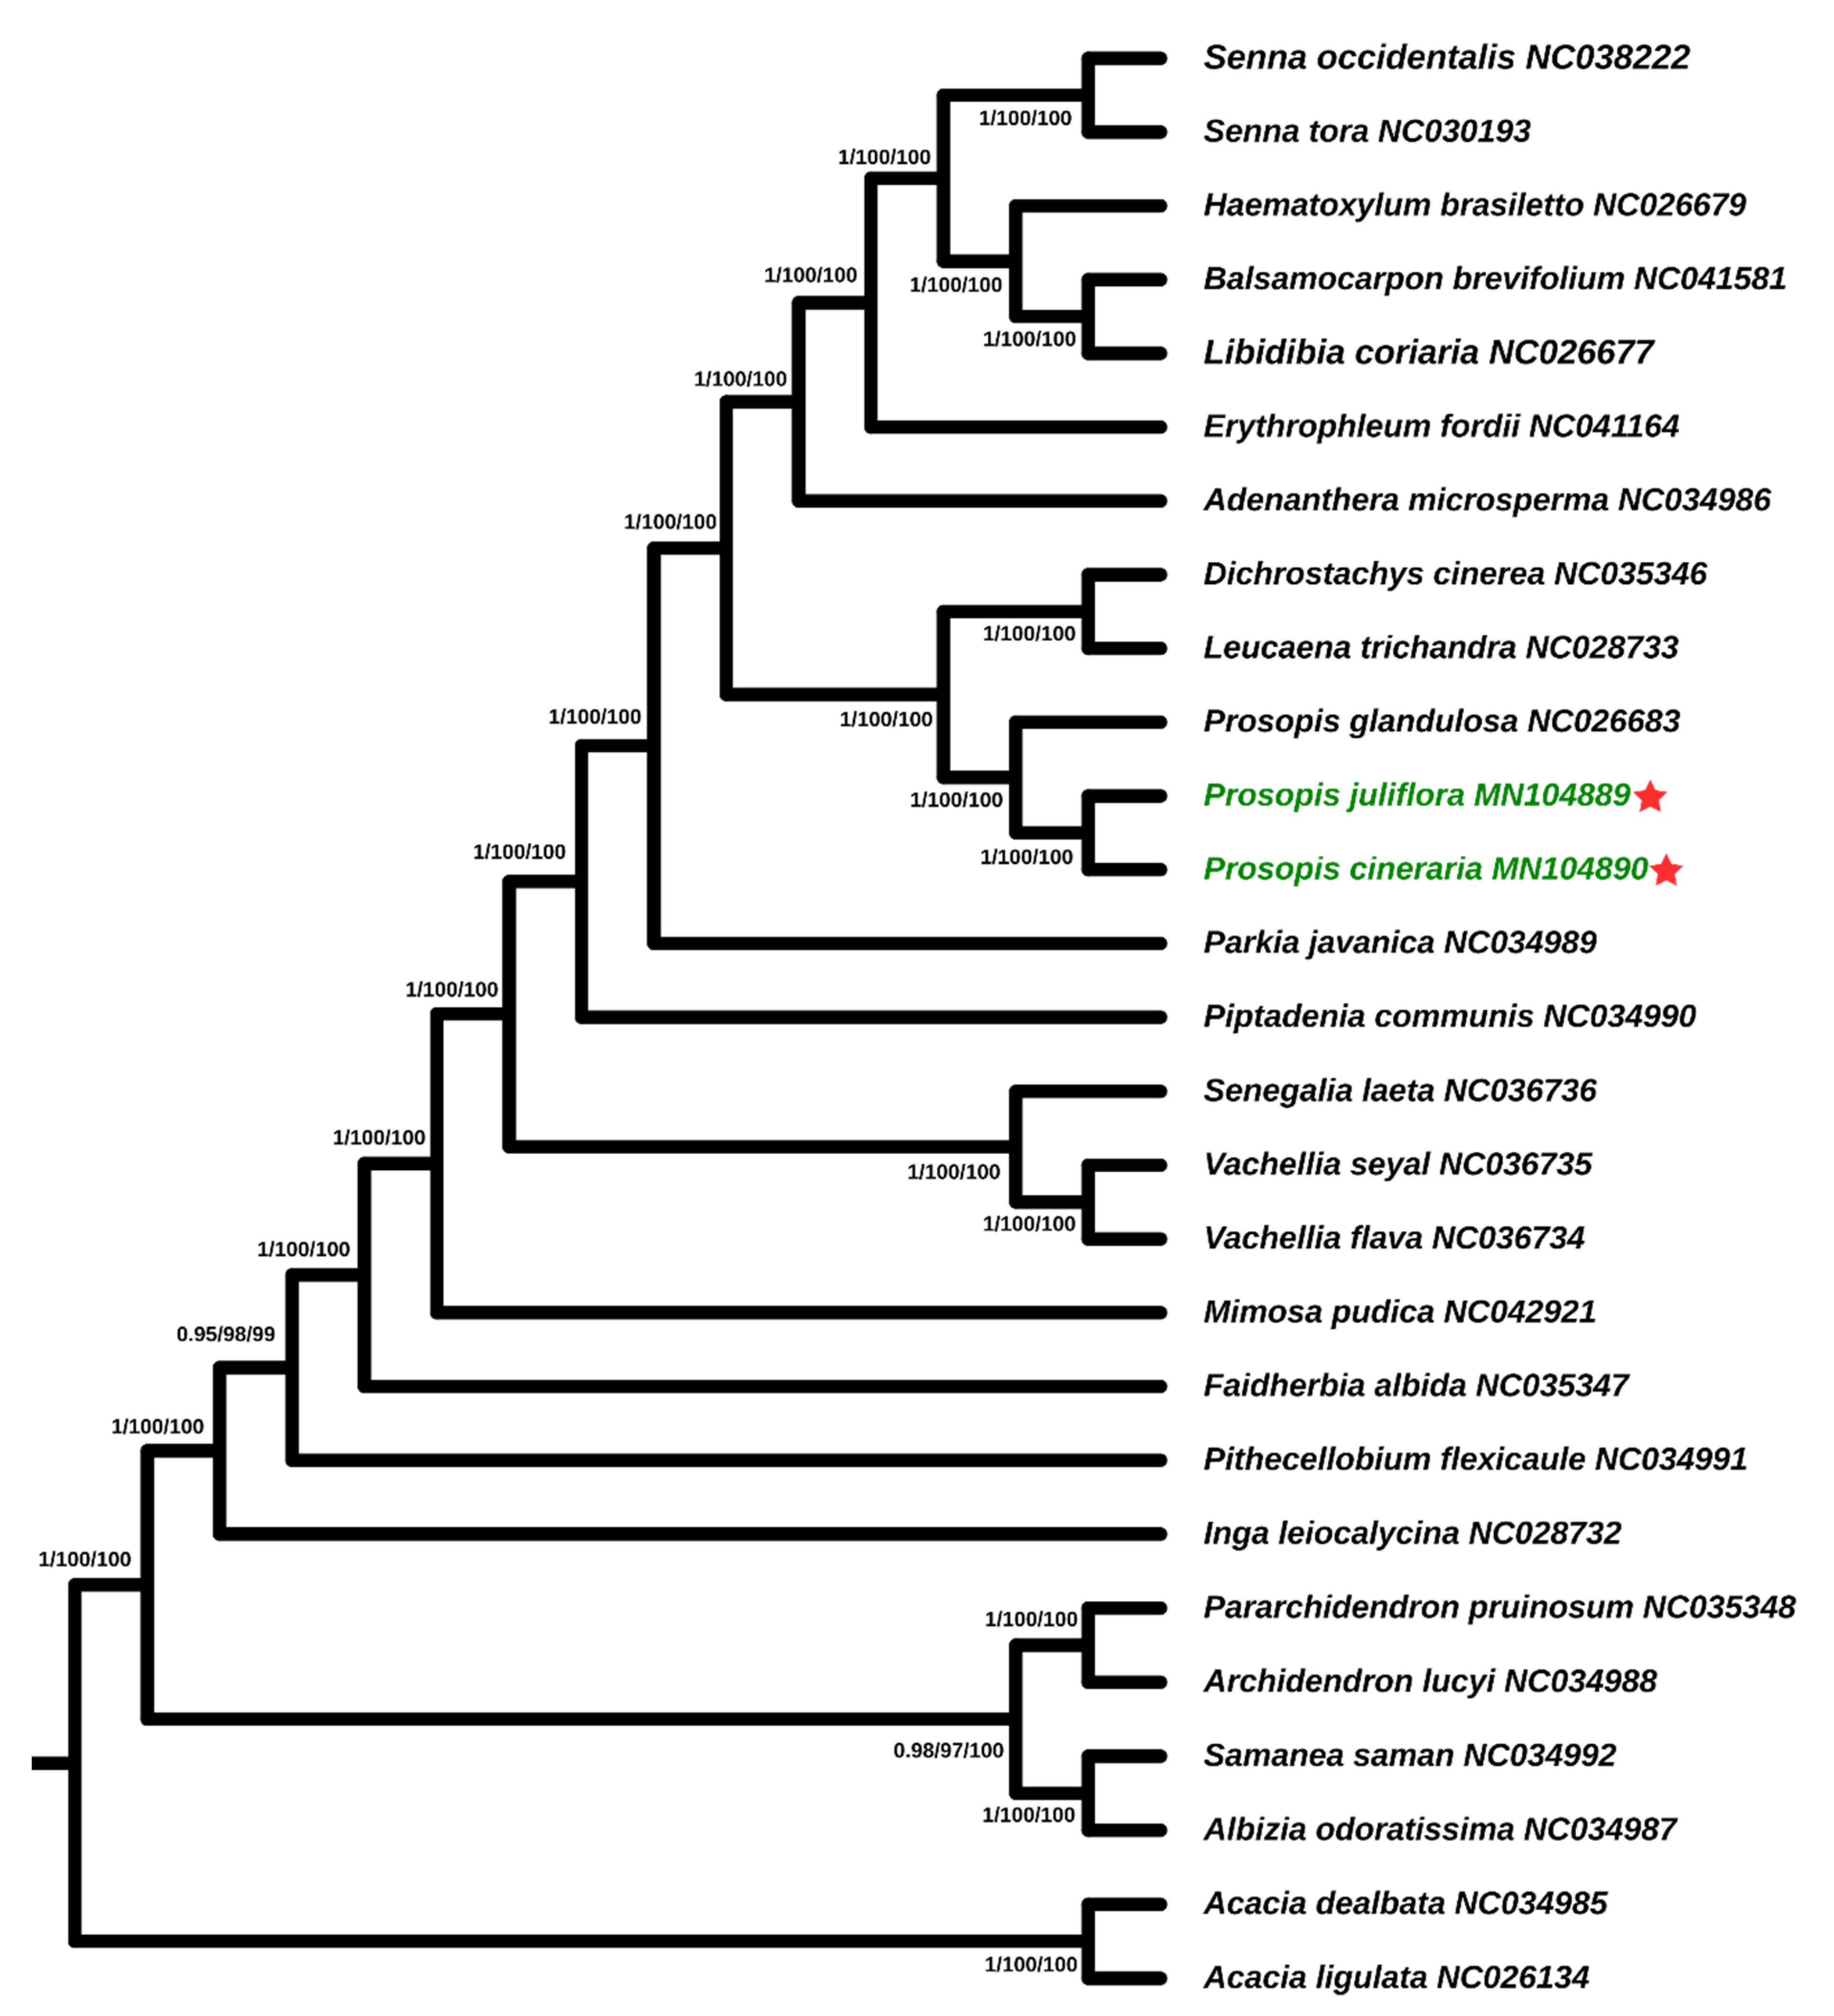
2.5. Phylogenetic Relationships

The phylogenetic relationship of P. cineraria, P. juliflora, and P. glandulosa were determined within the subfamily Caesalpinioideae (Leguminosae) using 24 complete chloroplast genomes (Figure 7). Phylogenetic analysis using maximum likelihood (ML), maximum parsimony (MP), and Bayesian inference (BI) methods were performed. Our phylogenetic analysis for the species of subfamily Caesalpinioideae shows that P. juliflora and P. cineraria share monophyletic clade within the phylogenetic tree are supported by high bootstrap values in these two species, and further share a sub-clade with P. glandulosa. In addition, this study also revealed that, within the subfamily Caesalpinioideae, the genus Prosopis species are monophyletic and closely related to Leucaena trichandra and Dichrostachys cinerea (Figure 7).

3. Discussion

We sequenced the cp genomes of P. juliflora and P. cineraria using Ion Torrent S5 sequencing methods and compared them with those available for other species within subfamily Caesalpinioideae. The cp genomes was ranged from 115 to 165 kb in length have a circular structure, which comprised two copies of inverted repeat (IR) regions, a small single copy (SSC) region and a large single copy (LSC) region [41]. The cp genomes studied here were highly conserved, with genome sizes ranging from 159,389 bp in A. microsperma to 163,677 bp in P. cineraria, which encoded 128–131 genes (131 in P. cineraria, 132 in P. juliflora, 128 in P. glandulosa, 128 in A. microsperma and 130 in P. javanica) (Figure 1). The size range of these sequenced cp genomes are found similar with the sizes of the earlier reported cp genomes of P. glandulosa (163,040 bp) and related species [42,43,44]. Similarly, the IRs of these species are almost 26 kb in length and found similar and within the size range of typical angiosperm cp genomes (20 ± 28 kb) [45]. The difference in genome size could mainly be attributed to variation in the LSC regions rather than the expansion and contraction of IR region (Table 1) as reported previously [46]. Like other reported cp genome from Caesalpinioideae about 19 genes are duplicated in the IR regions (Figure 1 and Table 1), including four rRNA genes, seven tRNA genes, and eight protein coding genes [42,44]. Furthermore, eighteen genes (twelve protein coding genes and six tRNA genes) having introns were detected in these genomes and among these introns containing genes rps12, clpP and ycf3 genes have two introns each (Table 2). Among these genes, rps12 was unevenly divided and its 5′ exon is detected in the LSC region and one copy of the 3′ exon and intron are detected in each of the IR regions as reported previously in other angiosperms. Contrast to P. glandulosa cp genome trnG-GCC was absent in both P. cineraria and P. juliflora cp genomes while in other two cp genome of A. microsperma and P. javanica, trnG-GCC gene was present without intron. Like other plant species from family Caesalpinioideae, the maturase K (matK) gene is annotated within the trnK intron [31]. The GC content of the P. juliflora and P. ceneraria LSC, SSC, and IR region were 33.1%, 30.4%, and 42.7%, respectively. Due to the existence of eight ribosomal RNA (rRNA) in IR regions higher GC contents were observed in these regions like other angiosperm cp genomes [42,47].
Repetitive sequences play significant roles in rearrangement and stabilization and cp genome sequences [48] and can affect copy number difference among similar and different species. Length variation and variable copy numbers have encouraged the extensive use of cp SSRs in biogeographic studies and plant population genetics, particularly at lower taxonomic levels [49,50]. These characteristics in cp genomes can be used for molecular marker designing and play vital role in plant identification [51] and phylogenetic analyses [52]. A total of 140, 134, and 129 repeats were found in the P. juliflora, P. cineraria, and P. glandulosa cp genomes, respectively. Cp genome repeat sequences contribute significantly to genomic structural variations, rearrangements or expansions [41,53]. Similarly, about 135 and 92 total repeats were detected in the P. javanica and A. microsperma cp genomes, respectively (Figure 2). P. juliflora comprises the lowest number of forward repeats (19) while the lowest palindromic repeats were found in P. cineraria cp genome (Figure 3). In our study, tandem repeats were determined to be the most plentiful in the P. juliflora (95) cp genome, showing similar traits to the previously reported cp genome [42,44]. It is obvious from earlier reports that high number and complex repeats also play key roles in cp genomes rearrangement and evolutions [53,54,55].
Simple sequence repeats (SSRs) characterize potentially valuable markers because of relative lack of recombination, their haploid nature, and maternal inheritance for phylogenetic studies [56]. SSRs have been extensively used in the estimation of levels of genetic variation, analyzing gene flow, describing the history of populations in plants and animals [57,58]. The efficacy of the SSR markers in genetic screening has been reported in other Prosopis species such as P. chilensis (Mol.) Stuntz, P. alba Griseb., P. flexuosa D.C., P. juliflora Swartz DC., P. pallida Humbolt & Bonpland ex Willd., P. rubriflora Hassl., and P. ruscifolia Griseb [38,39,59,60,61]. We analyzed the type and distribution of SSRs in the P. juliflora and P. cineraria with related species cp genomes and detected the highest number of SSRs in P. juliflora (88) followed by 84 SSRs, including 13 compound SSRs in each (Figure 3). The detection of AT-rich SSRs in P. cineraria and P. juliflora cp genomes were similar other plant species [56]. According to Ebert and Peakall [56], intra-species variation in cp genomes are due to mononucleotide cpSSRs present in a non-coding single copy (SC) region. The observed results accord with previous findings that cp genomes SSRs are usually comprised of polyadenine (polyA) or polythymine (polyT) repeats and occasionally contain tandem guanine (G) or cytosine (C) repeats [62], thereby contributing to AT richness of cp genomes [39,40].
Like previously reported angiosperm cp genome the IR regions showed lower sequence divergence compared to SSC and LSC regions. Moreover, pairwise alignment of the P. juliflora cp genome with those of four other genomes displayed a high degree of synteny. Similarly, relatively lower sequence identity was observed among these cp genomes, especially in the matK-rps16, psbI-trnR, atpH-atpI, psbZ-trnG, rps4-trnI, petA-psbL, rps3-rps19, ndhG-ndhA, rpoC2, rpoB, clpP, ndhF, ycf1 and matK regions (Figure 4). In addition, the SSC and LSC regions showed more divergence than the two inverted repeat regions in all Prosopis cp genomes, and the non-coding regions were less similar than the coding regions as reported previously [28,63]. The current results also revealed similar variations among numerous coding regions in these cp genomes, as suggested by Kumar et al. [64]. Moreover, numerous researchers have analyzed coding and non-coding regions especially having high variability as possible molecular markers family Fabaceae, such as rpl16-rps3, trnS(GGA)-trnG(UCC), atpB-rbcL and trnT-trnL [65,66]. Similarly, it has been reported that coding regions in cp genome reveal less variability than non-coding regions and therefore, these non-coding regions became a key region to infer the phylogenetic position in various species [28,67].
Similarly, the average pairwise sequence divergence among the cp genomes of the Prosopis and related species were calculated (Supplementary Table S1). The cp genome of P. juliflora showed an average sequence divergence of 0.001, whereas the P. juliflora possessed the highest sequence divergence with A. microsperma (0.025) while the lowest was observed with P. glandulosa (0.0009). Furthermore, the ycf1 gene revealed the highest average sequence divergence (0.1329), followed by psbK (0.072), ccsA (0.067), rbcL (0.045), and accD (0.036; Figure 5). Similarly, among Prosopis species the P. cineraria showed greatest divergence in ycf1 with both P. juliflora (0.019) and P. glandulosa (0.015) respectively.
In spite of the collinear gene order found in most land plant, some notable changes such as gene loss [68], sequence inversion [69], and contraction and expansion at the borders between IRs, SSC, and LSC regions [70]. Similarly, length variation among cp genomes were observed due to the contraction and expansion of the IR regions [71,72]. However, IR regions have been lost in some cp genomes, such as Erodium, Carnegiea [73], and some Fabaceae members [74]. The Prosopis cp genomes were highly conservative in size, structure, SC and IR boundary locations among species were slightly diverse due to contraction or expansion of the cp genome, as reported in most land plants [75,76,77]. In the current study a comprehensive assessment of the four junctions (JLA, JLB, JSA, and JSB) between the two single copy regions (LSC and SSC) and the two IR regions (IRa and IRb) of the P. cineraria, P. juliflora, P. glandulosa, P. javanica, and A. microsperma cp genomes was performed. Regardless of the parallel lengths of the IR regions of P. cineraria, P. juliflora, and P. glandulosa, some extension and contraction were detected, with the IR regions ranging from 25,931 bp in Prosopis species to 26,028 bp in A. microsperma. All the four junctions (JLA, JLB, JSA, and JSB) were conserved in three Prosopis cp genomes. However, some variations were observed with P. javanica and A. microsperma cp genomes (Figure 6). The partially duplicated genes found at the beginnings and ends of the IR regions, including 103 bp of rps19 in P. juliflora and P. cineraria and 101 bp of rps19 in P. glandulosa from JLB. The boundaries between IRs, SSC, and LSC were similar in all the cp genomes studied. The IRb/LSC boundary of the studied cp genomes from subfamily Caesalpinioideae is detected in the rps19 gene, and a small portion of the rps19 gene is also found in the IRb region, as reported in previously angiosperm cp genome such as in O. vulgare [78], S. miltiorrhiza, and some species from Ilex genus [79]. On the other hand, some cp genomes such as in Lupinus luteus [80] and Millettia pinnata [81] the rps19 gene does not extend into the IR region. Similar results were mostly reported in numerous monocots cp genome such as, in the Oryza AA genome [82], the rps19 gene present inside the IR region [83].
Cp genomes have been valuable in molecular, evolutionary, and phylogenetic studies. Numerous analyses on the basis of complete genome sequence comparison [28,84] have resolved various phylogenetic problems at deep node levels and improved our understanding of mysterious evolutionary associations among angiosperms. The phylogenetic relationships of P. cineraria, P. juliflora, and P. glandulosa were determined within the subfamily Caesalpinioideae (Leguminosae) using complete chloroplast genomes from 24 plant cp genomes (Figure 7). Despite of numerous analyses of relationship within the subfamily Caesalpinioideae its evolutionary history remains poorly understood [85,86,87,88,89]. As reported recently by Lewis et al. [90] subfamily Caesalpinioideae is paraphyletic; it comprises the monophyletic tribes Detarieae and Cercideae, and the paraphyletic tribes Caesalpinieae and Cassieae. Phylogenetic analysis using maximum likelihood (ML), maximum parsimony (MP), and Bayesian inference (BI) methods were performed. Our phylogenetic analysis for the species of subfamily Caesalpinioideae shows that P. juliflora is closer to P. cineraria than P. glandulosa with high bootstrap support. In addition, this study also revealed that, within the subfamily Caesalpinioideae, the genus Prosopis species are monophyletic and closely related to Leucaena trichandra and Dichrostachys cinerea (Figure 7).

4. Methodology

4.1. Sample Collection

The fresh young leaves of P. juliflora and P. cineraria were collected from plants growing in Nizwa Oman (22°59′48.8″ N; 57°39′48.7″ E). The Director General of Nature Conservation, Ministry of Environment & Climate Affairs, Sultanate of Oman had issued a collection permit (4/2106) for this purpose. The plants were identified by Taxonomist at Royal Botanical Garden, Oman. The area receives limited rainfall throughout the year, having an average temperature from 25 °C to 46 °C in summer season. The leaf samples were collected in plastic zip bags and kept for DNA extraction in liquid nitrogen at −80 °C.

4.2. DNA Extraction and Genome Sequencing

Chloroplast DNA was extracted from the powdered leaves of P. juliflora and P. cineraria by following a modified protocol [91]. Manufacturer’s instructions (Life Technologies USA, Eugene, OR, USA) were followed to prepare genomic libraries. Ion Shear™ Plus Reagents kit was used to share the cpDNA into 400 bp fragments enzymatically and Ion Xpress™ Plus gDNA Fragment Library kit was used to prepare libraries. Qubit 3.0 fluorometer and bioanalyzer (Agilent 2100 Bioanalyzer system, Life Technologies USA) were used to quantify and qualify libraries. Ion OneTouch™ 2 instrument was used to amplify template after library preparation and the amplified templates were enriched (Ion OneTouch™ ES enrichment system) by using Ion 530 & 520 OT2 Reagents. Ion S5 sequencing protocol was used to load the samples on Ion S5 530 Chip for sequencing.

4.3. Chloroplast Reference-Based Genome Assembly

A total of 1,126,428 and 1,238,421 raw reads were produced for P. cineraria and P. juliflora, respectively. The generated both cp genomes reads were mapped to P. glandulosa (KJ468101) which is used as reference genome using Bowtie2 (v.2.2.3) [92] in Geneious Pro (v.10.2.3) software [93]. The P. juliflora and P. cineraria assemblies mean coverage were 213X and 175X respectively. The previously published genome of P. glandulosa was used to identify the IR junctions using MITObim (v.1.8) software [94].

4.4. Prosopis Species Genome Annotation

For both P. cineraria and P. juliflora cp genomes annotation Dual Organellar Genome Annotator (DOGMA) [95] was used using BLASTN and BLASTX to determine the locations of tRNA, ribosomal RNAs and protein coding genes, and tRNAscan-SE version 1.21 [96] software was used to detect tRNA genes. Moreover, for manual alteration, tRNAscan-SE [96] and Geneious Pro (v.10.2.3) [93] were used to compare the genomes with the already reported P. glandulosa genome and intron boundaries, start and stop codons were also adjusted manually. Similarly, the Prosopis species cp genomes structural features were illustrated using OGDRAW [97]. Furthermore, for genome divergence among these species, cp genomes mVISTA [98] in Shuffle-LAGAN mode was used and P. juliflora was selected as reference genome.

4.5. Repeat Identification

For identification of forward and reverse repeats REPuter software [99] was used. About 15 bp sequence with 90% identities was considered a minimum criterion. Moreover, MISA software [100] was used to determine SSRs with following search parameters: ≥10 repeat units for single base pair repeats; ≥8 repeat units for two base pair repeats; ≥4 repeat units for three and four base pair repeats; and ≥3 repeat units for five and six base pair repeats,. To find the tandem repeats, Tandem Repeats Finder version 4.07 [101] with default settings was used.

4.6. Chloroplast Genome Divergence and Phylogenetic Relationship

The whole genome and shared genes sequence divergence among Prosopis species and related species were calculated. Comparative analysis strategy was used after multiple sequence alignment and comparing gene order to identify the ambiguous and missing gene annotation. To align the complete cp genomes, MAFFT version 7.222 [102], with default parameters, was used and Kimura’s two-parameter (K2P) model [103] was used to determine pairwise sequence divergence. To infer the phylogenetic positions of P. cineraria and P. juliflora within the sub family Caesalpinioideae (Leguminosae), 23 cp genome sequences were obtained from the NCBI database. Alignments of the complete cp genomes were constructed on the bases of conserved gene orders and the structures of the cp genomes [41], and three different methods were applied to infer phylogenetic tree: Bayesian inference (BI), implemented in Mr Bayes 3.1.2 [104], maximum parsimony (MP) using PAUP 4.0 [105], and maximum likelihood (ML) using MEGA 6 [106], employing previously described settings [36,40]. The best substitution model GTR + G was tested by jModelTest version v2.1.02 [107] according to the Akaike information criterion (AIC) for Bayesian posterior probabilities (PP) in BI analyses. The Markov Chain Monte Carlo (MCMC) method was run using four incrementally heated chains across 1,000,000 generations, starting from random trees and sampling 1 out of every 100 generations. The values of first 30% of trees were discarded as burn-in. Maximum parsimony run was based on a heuristic search with 1000 random addition of sequence replicates with the tree-bisection-reconnection (TBR) branch-swapping tree search criterion to estimate the posterior probabilities. Similarly, the parameters for ML analysis were optimized using a BIONJ tree [108] as the starting tree with 1000 bootstrap replicates by employing the Kimura 2-parameter model with invariant sites and gamma-distributed rate heterogeneity

5. Conclusions

In the present study, the P. juliflora and P. cineraria complete genomes sequences were determined. The genomics characteristics genome size, GC contents, genome organization and gene orders were found to be highly conserved as compared to related cp genomes. Repetitive sequences such as tandem repeats and SSRs were analyzed within these cp genomes. The maximum number of simple sequence repeats was detected in P. juliflora, followed by P. cineraria and P. glandulosa. Overall, a high degree of sequence similarity between P. cineraria and P. glandulosa was observed. However, various divergent genes, such as rpoB, accD, ycf1, ccsA, and atpF, were found in these cp genomes. The present study provides a valuable set of complete chloroplast genome analysis of P. juliflora and related species, which could be helpful for species identification and may facilitate biological, genetic diversity, and phylogenetic studies.

Supplementary Materials

Supplementary materials can be found at https://www.mdpi.com/1422-0067/21/9/3280/s1.

Author Contributions

A.K. and A.L.K. performed and designed the experiments, S.A. wrote the original draft and performed bioinformatics analysis, S.A. and A.L.K. edited and drafted the manuscript, A.A.-H. arranging resources. All authors have read and agreed to the published version of the manuscript.

Funding

The corresponding authors are thankful to The Research Council, Oman for their financial support through Research Grant Program (BFP/RGP/EBR/18/005). The funders had no role in study design, data collection and analysis, decision to publish, or preparation of the manuscript.

Acknowledgments

The corresponding authors wish to thank Oman’s Animal and Plant Genetic Resources Center, Oman for their support in Ion S5 Sequencer.

Conflicts of Interest

The authors declare no conflict of interest.

Abbreviations

BIBayesian inference
IRInverted repeat
LSCLarge single copy
MLmaximum likelihood
MPMaximum parsimony
NGSNext generation sequencing
rRNARibosomal RNA
SSCShort single copy
SSRsSimple sequence repeats
tRNATransfer RNA

References

  1. Burkart, A. A monograph of the genus Prosopis (Leguminosae subfam. Mimosoideae). J. Arnold Arbor. 1976, 57, 450–525. [Google Scholar]
  2. Shackleton, R.T.; Le Maitre, D.C.; Pasiecznik, N.M.; Richardson, D.M. Prosopis: A global assessment of the biogeography, benefits, impacts and management of one of the world’s worst woody invasive plant taxa. AoB Plants 2014, 6, plu027. [Google Scholar] [CrossRef] [PubMed]
  3. Prado, D.E.; Gibbs, P.E. Patterns of Species Distributions in the Dry Seasonal Forests of South America. Ann. Mo. Bot. Gard. 1993, 80, 902. [Google Scholar] [CrossRef]
  4. Bessega, C.; Pometti, C.L.; Ewens, M.; Saidman, B.O.; Vilardi, J.C. Strategies for conservation for disturbed Prosopis alba (Leguminosae, Mimosoidae) forests based on mating system and pollen dispersal parameters. Tree Genet. Genomes 2011, 8, 277–288. [Google Scholar] [CrossRef]
  5. Bessega, C.; Ferreyra, L.; Julio, N.; Montoya, S.; Saidman, B.; Vilardi, J.C. Mating system parameters in species of genus Prosopis (Leguminosae). Hered. 2000, 132, 19–27. [Google Scholar] [CrossRef]
  6. Pasiecznik, N.M.; Felker, P.; Harris, P.J.; Harsh, L.; Cruz, G.; Tewari, J.; Cadoret, K.; Maldonado, L.J. The’Prosopis Juliflora’-’Prosopis Pallida’Complex: A Monograph; HDRA: Coventry, UK, 2001; Volume 172. [Google Scholar]
  7. Rejmánek, M.; Richardson, D.M. Trees and shrubs as invasive alien species - 2013 update of the global database. Divers. Distrib. 2013, 19, 1093–1094. [Google Scholar] [CrossRef]
  8. Bhandari, M. Flora of the Indian Desert; MPS Repros: Jodhpur, India, 1990. [Google Scholar]
  9. Felker, P.; Bandurski, R.S. Uses and potential uses of leguminous trees for minimal energy input agriculture. Econ. Bot. 1979, 33, 172–184. [Google Scholar] [CrossRef]
  10. Felker, P. Mesquite: An all-purpose leguminous arid land tree. New Agric. Crop. 2019, 38, 89–132. [Google Scholar]
  11. Sawal, R.K.; Ratan, R.; Yadav, S.B.S. Mesquite (Prosopis juliflora) Pods as a Feed Resource for Livestock - A Review -. Asian-Australasian J. Anim. Sci. 2004, 17, 719–725. [Google Scholar] [CrossRef]
  12. Ramírez, L.; De La Vega, A.; Razkin, N.; Luna, V.; Harris, P.J. Analysis of the relationships between species of the genus Prosopis revealed by the use of molecular markers. Agron. 1999, 19, 31–43. [Google Scholar] [CrossRef] [Green Version]
  13. Landeras, G.; Alfonso, M.; Pasiecznik, N.M.; Harris, P.J.C.; Ramírez, L. Identification of Prosopis juliflora and Prosopis pallida Accessions Using Molecular Markers. Biodivers. Conserv. 2005, 15, 1829–1844. [Google Scholar] [CrossRef]
  14. Neuhaus, H.; Emes, M. Nonphotosynthetic metabolism in plastids. Annu. Rev. Plant Biol. 2000, 51, 111–140. [Google Scholar] [CrossRef] [PubMed]
  15. Clegg, M.T.; Gaut, B.S.; Learn, G.H.; Morton, B.R. Rates and patterns of chloroplast DNA evolution. Proc. Natl. Acad. Sci. USA 1994, 91, 6795–6801. [Google Scholar] [CrossRef] [PubMed] [Green Version]
  16. Palmer, J.D. Plastid Chromosomes: Structure and Evolution. The Molecular Biology of Plastids 1991, 7, 5–53. [Google Scholar] [CrossRef]
  17. Shaw, J.; Lickey, E.B.; Beck, J.T.; Farmer, S.B.; Liu, W.; Miller, J.; Siripun, K.C.; Winder, C.T.; Schilling, E.E.; Small, R.L. The tortoise and the hare II: Relative utility of 21 noncoding chloroplast DNA sequences for phylogenetic analysis. Am. J. Bot. 2005, 92, 142–166. [Google Scholar] [CrossRef] [PubMed] [Green Version]
  18. Bock, D.; Kane, N.C.; Ebert, D.P.; Rieseberg, L.H. Genome skimming reveals the origin of the Jerusalem Artichoke tuber crop species: Neither from Jerusalem nor an artichoke. New Phytol. 2013, 201, 1021–1030. [Google Scholar] [CrossRef]
  19. Shaw, J.; Shafer, H.L.; Leonard, O.R.; Kovach, M.J.; Schorr, M.; Morris, A.B. Chloroplast DNA sequence utility for the lowest phylogenetic and phylogeographic inferences in angiosperms: The tortoise and the hare IV. Am. J. Bot. 2014, 101, 1987–2004. [Google Scholar] [CrossRef] [Green Version]
  20. Du, F.; Petit, R.; Liu, J.Q. More introgression with less gene flow: Chloroplast vs. mitochondrial DNA in thePicea asperatacomplex in China, and comparison with other Conifers. Mol. Ecol. 2009, 18, 1396–1407. [Google Scholar] [CrossRef]
  21. Kane, N.C.; King, M.G.; Barker, M.S.; Raduski, A.; Karrenberg, S.; Yatabe, Y.; Knapp, S.J.; Rieseberg, L.H. Comparative genomic and population genetic analyses indicate highly porous genomes and high levels of gene flow between divergent Helianthus species. Evol. Int. J. Org. Evol. 2009, 63, 2061–2075. [Google Scholar] [CrossRef] [Green Version]
  22. A McGuire, J.; Linkem, C.W.; Koo, M.S.; Hutchison, D.W.; Lappin, A.K.; Orange, D.I.; Lemos-Espinal, J.; Riddle, B.R.; Jaeger, J.R. Mitochondrial Introgression and incomplete lineage sorting through SPACE and time: Phylogenetics of crotaphytid lizards. Evol. 2007, 61, 2879–2897. [Google Scholar] [CrossRef]
  23. Newton, A.; Allnutt, T.; Gillies, A.; Lowe, A.; Ennos, R. Molecular phylogeography, intraspecific variation and the conservation of tree species. Trends Ecol. Evol. 1999, 14, 140–145. [Google Scholar] [CrossRef]
  24. Jia, Y.; Yang, J.; He, Y.-L.; He, Y.; Niu, C.; Gong, L.-L.; Li, Z.-H. Characterization of the whole chloroplast genome sequence of Acer davidii Franch (Aceraceae). Conserv. Genet. Resour. 2016, 8, 141–143. [Google Scholar] [CrossRef]
  25. Li, Z.-H.; Xie, Y.-S.; Zhou, T.; Jia, Y.; He, Y.-L.; Yang, J. The complete chloroplast genome sequence of Acer morrisonense (Aceraceae). Mitochondrial DNA Part A 2015, 28, 1–2. [Google Scholar] [CrossRef] [PubMed]
  26. Yang, J.-B.; Yang, S.-X.; Li, H.-T.; Yang, J.; Li, D.-Z. Comparative Chloroplast Genomes of Camellia Species. PLoS ONE 2013, 8, e73053. [Google Scholar] [CrossRef] [PubMed] [Green Version]
  27. Cai, J.; Ma, P.-F.; Li, H.-T.; Li, D.-Z. Complete Plastid Genome Sequencing of Four Tilia Species (Malvaceae): A Comparative Analysis and Phylogenetic Implications. PLoS ONE 2015, 10, e0142705. [Google Scholar] [CrossRef] [PubMed] [Green Version]
  28. Asaf, S.; Khan, A.L.; Khan, M.A.; Waqas, M.; Kang, S.-M.; Yun, B.-W.; Lee, I.-J. Chloroplast genomes of Arabidopsis halleri ssp. gemmifera and Arabidopsis lyrata ssp. petraea: Structures and comparative analysis. Sci. Rep. 2017, 7, 7556. [Google Scholar] [CrossRef] [Green Version]
  29. Nikiforova, M.N.; Wald, A.I.; Roy, S.; Durso, M.B.; Nikiforov, Y.E. Targeted next-generation sequencing panel (ThyroSeq) for detection of mutations in thyroid cancer. J. Clin. Endocrinol. Metab. 2013, 98, E1852–E1860. [Google Scholar] [CrossRef] [Green Version]
  30. Caballero, J.C.; Alonso, R.; Ibáñez, V.; Terol, J.; Talon, M.; Dopazo, J. A Phylogenetic Analysis of 34 Chloroplast Genomes Elucidates the Relationships between Wild and Domestic Species within the Genus Citrus. Mol. Boil. Evol. 2015, 32, 2015–2035. [Google Scholar] [CrossRef] [Green Version]
  31. Daniell, H.; Lin, C.; Yu, M.; Chang, W.-J. Chloroplast genomes: Diversity, evolution, and applications in genetic engineering. Genome Boil. 2016, 17, 134. [Google Scholar] [CrossRef] [Green Version]
  32. Huang, D.; Hefer, C.A.; Kolosova, N.; Douglas, C.J.; Cronk, Q. Whole plastome sequencing reveals deep plastid divergence and cytonuclear discordance between closely related balsam poplars, Populus balsamifera and P. trichocarpa (Salicaceae). New Phytol. 2014, 204, 693–703. [Google Scholar] [CrossRef]
  33. Kersten, B.; Rampant, P.F.; Mader, M.; Le Paslier, M.-C.; Bounon, R.; Bérard, A.; Vettori, C.; Schroeder, H.; Leple, J.-C.; Fladung, M. Genome Sequences of Populus tremula Chloroplast and Mitochondrion: Implications for Holistic Poplar Breeding. PLoS ONE 2016, 11, e0147209. [Google Scholar] [CrossRef] [PubMed] [Green Version]
  34. Lu, R.-S.; Li, P.; Qiu, Y.-X. The Complete Chloroplast Genomes of Three Cardiocrinum (Liliaceae) Species: Comparative Genomic and Phylogenetic Analyses. Front. Plant Sci. 2017, 7, 232. [Google Scholar] [CrossRef] [PubMed]
  35. Yang, Y.; Zhou, T.; Duan, D.; Yang, J.; Feng, L.; Zhao, G.-F. Comparative Analysis of the Complete Chloroplast Genomes of Five Quercus Species. Front. Plant Sci. 2016, 7, 803. [Google Scholar] [CrossRef] [PubMed] [Green Version]
  36. Asaf, S.; Khan, A.L.; Khan, A.R.; Waqas, M.; Kang, S.-M.; Khan, M.A.; Lee, S.-M.; Lee, I.-J. Complete Chloroplast Genome of Nicotiana otophora and its Comparison with Related Species. Front. Plant Sci. 2016, 7, 93. [Google Scholar] [CrossRef] [Green Version]
  37. Liao, D.; Jia, C.; Sun, P.; Qi, J.; Li, X. Quality evaluation of Panax quinquefolium from different cultivation regions based on their ginsenoside content and radioprotective effects on irradiated mice. Sci. Rep. 2019, 9, 1079. [Google Scholar] [CrossRef] [Green Version]
  38. Bessega, C.F.; Pometti, C.L.; Miller, J.T.; Watts, R.; Saidman, B.O.; Vilardi, J.C. New microsatellite loci for Prosopis alba and P. chilensis (Fabaceae)1. Appl. Plant Sci. 2013, 1, 1200324. [Google Scholar] [CrossRef] [PubMed]
  39. Kuang, D.-Y.; Wu, H.; Wang, Y.-L.; Gao, L.-M.; Zhang, S.-Z.; Lu, L. Complete chloroplast genome sequence of Magnolia kwangsiensis (Magnoliaceae): Implication for DNA barcoding and population genetics. Genome 2011, 54, 663–673. [Google Scholar] [CrossRef] [Green Version]
  40. Asaf, S.; Waqas, M.; Khan, A.L.; Khan, M.A.; Kang, S.-M.; Imran, Q.M.; Shahzad, R.; Bilal, S.; Yun, B.-W.; Lee, I.-J. The Complete Chloroplast Genome of Wild Rice (Oryza minuta) and Its Comparison to Related Species. Front. Plant Sci. 2017, 8, 345. [Google Scholar] [CrossRef] [Green Version]
  41. Wicke, S.; Schneeweiss, G.M.; Depamphilis, C.W.; Müller, K.F.; Quandt, D. The evolution of the plastid chromosome in land plants: Gene content, gene order, gene function. Plant Mol. Boil. 2011, 76, 273–297. [Google Scholar] [CrossRef] [Green Version]
  42. Liu, W.; Kong, H.; Zhou, J.; Fritsch, P.W.; Hao, G.; Gong, W. Complete Chloroplast Genome of Cercis chuniana (Fabaceae) with Structural and Genetic Comparison to Six Species in Caesalpinioideae. Int. J. Mol. Sci. 2018, 19, 1286. [Google Scholar] [CrossRef] [Green Version]
  43. Chen, Y.; Hu, N.; Wu, H. Analyzing and Characterizing the Chloroplast Genome of Salix wilsonii. BioMed Res. Int. 2019, 2019, 5190425. [Google Scholar] [CrossRef] [Green Version]
  44. Schwarz, E.N.; Ruhlman, T.A.; Sabir, J.S.M.; Hajrah, N.H.; Alharbi, N.S.; Bailey, C.D.; Jansen, R.K.; Hajarah, N.H.; Al-Malki, A.L. Plastid genome sequences of legumes reveal parallel inversions and multiple losses ofrps16in papilionoids. J. Syst. Evol. 2015, 53, 458–468. [Google Scholar] [CrossRef]
  45. Chumley, T.W.; Palmer, J.D.; Mower, J.P.; Fourcade, H.M.; Calie, P.J.; Boore, J.L.; Jansen, R.K. The Complete Chloroplast Genome Sequence of Pelargonium × hortorum: Organization and Evolution of the Largest and Most Highly Rearranged Chloroplast Genome of Land Plants. Mol. Boil. Evol. 2006, 23, 2175–2190. [Google Scholar] [CrossRef] [PubMed]
  46. Su, Q.; Liu, L.; Zhao, M.; Zhang, C.; Zhang, D.; Li, Y.; Li, S. The complete chloroplast genomes of seventeen Aegilops tauschii: Genome comparative analysis and phylogenetic inference. PeerJ 2020, 8, e8678. [Google Scholar] [CrossRef] [PubMed] [Green Version]
  47. Nie, X.; Deng, P.; Feng, K.; Liu, P.; Du, X.; You, F.M.; Weining, S. Comparative analysis of codon usage patterns in chloroplast genomes of the Asteraceae family. Plant Mol. Boil. Rep. 2013, 32, 828–840. [Google Scholar] [CrossRef]
  48. Vieira, L.D.N.; Faoro, H.; Rogalski, M.; Fraga, H.P.D.F.; Cardoso, R.L.A.; De Souza, E.M.; Pedrosa, F.D.O.; Nodari, R.O.; Guerra, M.P. The Complete Chloroplast Genome Sequence of Podocarpus lambertii: Genome Structure, Evolutionary Aspects, Gene Content and SSR Detection. PLoS ONE 2014, 9, 9. [Google Scholar] [CrossRef]
  49. Piovani, P.; Leonardi, S.; Piotti, A.; Menozzi, P. Conservation genetics of small relic populations of silver fir (Abies alba Mill.) in the northern Apennines. Plant Biosyst. Int. J. Deal. Asp. Plant Boil. 2010, 144, 683–691. [Google Scholar] [CrossRef]
  50. Wang, T.; Wang, Z.; Chen, G.; Wang, C.; Su, Y. Invasive Chloroplast Population Genetics of Mikania micrantha in China: No Local Adaptation and Negative Correlation between Diversity and Geographic Distance. Front. Plant Sci. 2016, 7, 2626. [Google Scholar] [CrossRef] [Green Version]
  51. Cho, K.-S.; Cheon, K.-S.; Hong, S.-Y.; Cho, J.-H.; Im, J.-S.; Mekapogu, M.; Yu, Y.-S.; Park, T.-H. Complete chloroplast genome sequences of Solanum commersonii and its application to chloroplast genotype in somatic hybrids with Solanum tuberosum. Plant Cell Rep. 2016, 35, 2113–2123. [Google Scholar] [CrossRef]
  52. Williams, A.F.; Miller, J.; Small, I.D.; Nevill, P.G.; Boykin, L.M. Integration of complete chloroplast genome sequences with small amplicon datasets improves phylogenetic resolution in Acacia. Mol. Phylogenetics Evol. 2016, 96, 1–8. [Google Scholar] [CrossRef] [Green Version]
  53. Milligan, B.G.; Hampton, J.N.; Palmer, J.D. Dispersed repeats and structural reorganization in subclover chloroplast DNA. Mol. Boil. Evol. 1989, 6, 355–368. [Google Scholar] [CrossRef] [Green Version]
  54. Cavalier-Smith, T. Chloroplast evolution: Secondary symbiogenesis and multiple losses. Curr. Boil. 2002, 12, R62–R64. [Google Scholar] [CrossRef] [Green Version]
  55. Bausher, M.G.; Singh, N.D.; Lee, S.-B.; Jansen, R.K.; Daniell, H. The complete chloroplast genome sequence of Citrus sinensis (L.) Osbeck var ’Ridge Pineapple’: Organization and phylogenetic relationships to other angiosperms. BMC Plant Boil. 2006, 6, 21. [Google Scholar] [CrossRef] [Green Version]
  56. Ebert, D.; Peakall, R. Chloroplast simple sequence repeats (cpSSRs): Technical resources and recommendations for expanding cpSSR discovery and applications to a wide array of plant species. Mol. Ecol. Resour. 2009, 9, 673–690. [Google Scholar] [CrossRef]
  57. Addisalem, A.B.; Esselink, G.D.; Bongers, F.; Smulders, M.J. Genomic sequencing and microsatellite marker development for Boswellia papyrifera, an economically important but threatened tree native to dry tropical forests. AoB PLANTS 2015, 7, 7. [Google Scholar] [CrossRef] [Green Version]
  58. Kalia, R.K.; Rai, M.K.; Kalia, S.; Singh, R.; Dhawan, A.K. Microsatellite markers: An overview of the recent progress in plants. Euphytica 2010, 177, 309–334. [Google Scholar] [CrossRef]
  59. Sherry, M.; Smith, S.; Patel, A.; Harris, P.; Hand, P.; Trenchard, L.; Henderson, J. RAPD and microsatellite transferability studies in selected species of Prosopis (section Algarobia) with emphasis on Prosopis juliflora and P. pallida. J. Genet. 2011, 90, 251–264. [Google Scholar] [CrossRef]
  60. Mottura, M.C.; Finkeldey, R.; Verga, A.R.; Gailing, O. Development and characterization of microsatellite markers for Prosopis chilensis and Prosopis flexuosa and cross-species amplification. Mol. Ecol. Notes 2005, 5, 487–489. [Google Scholar] [CrossRef]
  61. Pomponio, M.F.; Acuña, C.; Petreath, V.; Lauenstein, D.L.; Poltri, S.M.; Torales, S. Characterization of functional SSR markers in Prosopis alba and their transferability across Prosopis species. For. Syst. 2015, 24, 13. [Google Scholar] [CrossRef] [Green Version]
  62. Yi, X.; Gao, L.; Wang, B.; Su, Y.-J.; Wang, T. The complete chloroplast genome sequence of Cephalotaxus oliveri (Cephalotaxaceae): Evolutionary comparison of cephalotaxus chloroplast DNAs and insights into the loss of inverted repeat copies in gymnosperms. Genome Boil. Evol. 2013, 5, 688–698. [Google Scholar] [CrossRef] [Green Version]
  63. Qian, J.; Song, J.; Gao, H.; Zhu, Y.; Xu, J.; Pang, X.; Yao, H.; Sun, C.; Li, X.; Li, C.; et al. The Complete Chloroplast Genome Sequence of the Medicinal Plant Salvia miltiorrhiza. PLoS ONE 2013, 8, e57607. [Google Scholar] [CrossRef] [PubMed]
  64. Kumar, S.; Hahn, F.M.; Mcmahan, C.; Cornish, K.; Whalen, M.C. Comparative analysis of the complete sequence of the plastid genome of Parthenium argentatum and identification of DNA barcodes to differentiate Parthenium species and lines. BMC Plant Boil. 2009, 9, 131. [Google Scholar] [CrossRef] [PubMed] [Green Version]
  65. Xu, D.H.; Abe, J.; Sakai, M.; Kanazawa, A.; Shimamoto, Y. Sequence variation of non-coding regions of chloroplast DNA of soybean and related wild species and its implications for the evolution of different chloroplast haplotypes. Theor. Appl. Genet. 2000, 101, 724–732. [Google Scholar] [CrossRef]
  66. Kanazawa, A.; Tozuka, A.; Shimamoto, Y. Sequence variation of chloroplast DNA that involves EcoRI and ClaI restriction site polymorphisms in soybean. Genes Genet. Syst. 1998, 73, 111–119. [Google Scholar] [CrossRef] [PubMed] [Green Version]
  67. Small, R.L.; Ryburn, J.A.; Cronn, R.; Seelanan, T.; Wendel, J.F.; Wendel, T.S.F. The tortoise and the hare: Choosing between noncoding plastome and nuclearAdhsequences for phylogeny reconstruction in a recently diverged plant group. Am. J. Bot. 1998, 85, 1301–1315. [Google Scholar] [CrossRef] [PubMed] [Green Version]
  68. Fu, P.-C.; Zhang, Y.-Z.; Geng, H.-M.; Chen, S.-L. The complete chloroplast genome sequence ofGentiana lawrenceivar. farreri(Gentianaceae) and comparative analysis with its congeneric species. PeerJ 2016, 4, e2540. [Google Scholar] [CrossRef] [Green Version]
  69. Cho, K.-S.; Yun, B.-K.; Yoon, Y.-H.; Hong, S.-Y.; Mekapogu, M.; Kim, K.-H.; Yang, T.-J. Complete Chloroplast Genome Sequence of Tartary Buckwheat (Fagopyrum tataricum) and Comparative Analysis with Common Buckwheat (F. esculentum). PLoS ONE 2015, 10, e0125332. [Google Scholar] [CrossRef]
  70. Choi, K.S.; Chung, M.G.; Park, S. The Complete Chloroplast Genome Sequences of Three Veroniceae Species (Plantaginaceae): Comparative Analysis and Highly Divergent Regions. Front. Plant Sci. 2016, 7, 183. [Google Scholar] [CrossRef] [Green Version]
  71. Cho, K.-S.; Park, T.-H. Complete chloroplast genome sequence of Solanum nigrum and development of markers for the discrimination of S. nigrum. Hortic. Environ. Biotechnol. 2016, 57, 69–78. [Google Scholar] [CrossRef]
  72. Hu, Y.; Woeste, K.E.; Zhao, P. Completion of the Chloroplast Genomes of Five Chinese Juglans and Their Contribution to Chloroplast Phylogeny. Front. Plant Sci. 2017, 7, 803. [Google Scholar] [CrossRef] [Green Version]
  73. Blazier, J.C.; Jansen, R.K.; Mower, J.P.; Govindu, M.; Zhang, J.; Weng, M.-L.; Ruhlman, T. Variable presence of the inverted repeat and plastome stability inErodium. Ann. Bot. 2016, 117, 1209–1220. [Google Scholar] [CrossRef] [PubMed] [Green Version]
  74. Wang, Y.-H.; Wicke, S.; Wang, H.; Jin, J.-J.; Chen, S.-Y.; Zhang, S.-D.; Li, D.-Z.; Yi, T.-S. Plastid Genome Evolution in the Early-Diverging Legume Subfamily Cercidoideae (Fabaceae). Front. Plant Sci. 2018, 9, 138. [Google Scholar] [CrossRef] [PubMed] [Green Version]
  75. Hansen, D.R.; Dastidar, S.G.; Cai, Z.; Penaflor, C.; Kuehl, J.; Boore, J.L.; Jansen, R.K. Phylogenetic and evolutionary implications of complete chloroplast genome sequences of four early-diverging angiosperms: Buxus (Buxaceae), Chloranthus (Chloranthaceae), Dioscorea (Dioscoreaceae), and Illicium (Schisandraceae). Mol. Phylogenetics Evol. 2007, 45, 547–563. [Google Scholar] [CrossRef] [PubMed]
  76. Huang, H.; Shi, C.; Liu, Y.; Mao, S.-Y.; Gao, L.-Z. Thirteen Camelliachloroplast genome sequences determined by high-throughput sequencing: Genome structure and phylogenetic relationships. Bmc Evol. Biol. 2014, 14, 151. [Google Scholar] [CrossRef] [PubMed] [Green Version]
  77. Zeng, S.; Zhou, T.; Han, K.; Yang, Y.; Zhao, J.; Liu, Z.-L. The Complete Chloroplast Genome Sequences of Six Rehmannia Species. Genes 2017, 8, 103. [Google Scholar] [CrossRef] [PubMed] [Green Version]
  78. Lukas, B.; Novak, J. The complete chloroplast genome of Origanum vulgare L. (Lamiaceae). Gene 2013, 528, 163–169. [Google Scholar] [CrossRef] [PubMed]
  79. Yao, X.; Tan, Y.-H.; Liu, Y.-Y.; Song, Y.; Yang, J.-B.; Corlett, R.T. Chloroplast genome structure in Ilex (Aquifoliaceae). Sci. Rep. 2016, 6, 28559. [Google Scholar] [CrossRef] [Green Version]
  80. Martin, G.E.; Rousseau-Gueutin, M.; Cordonnier, S.; Lima, O.; Michon-Coudouel, S.; Naquin, D.; De Carvalho, J.F.; Aïnouche, M.; Salmon, A.; Aïnouche, A. The first complete chloroplast genome of the Genistoid legume Lupinus luteus: Evidence for a novel major lineage-specific rearrangement and new insights regarding plastome evolution in the legume family. Ann. Bot. 2014, 113, 1197–1210. [Google Scholar] [CrossRef] [Green Version]
  81. Kazakoff, S.H.; Imelfort, M.; Edwards, D.; Koehorst, J.J.; Biswas, B.; Batley, J.; Scott, P.T.; Gresshoff, P.M. Capturing the Biofuel Wellhead and Powerhouse: The Chloroplast and Mitochondrial Genomes of the Leguminous Feedstock Tree Pongamia pinnata. PLoS ONE 2012, 7, e51687. [Google Scholar] [CrossRef]
  82. Wang, R.-J.; Cheng, C.-L.; Chang, C.-C.; Wu, C.-L.; Su, T.-M.; Chaw, S.-M. Dynamics and evolution of the inverted repeat-large single copy junctions in the chloroplast genomes of monocots. BMC Evol. Boil. 2008, 8, 36. [Google Scholar] [CrossRef] [Green Version]
  83. Wambugu, P.W.; Brozynska, M.; Furtado, A.; Waters, D.; Henry, R. Relationships of wild and domesticated rices (Oryza AA genome species) based upon whole chloroplast genome sequences. Sci. Rep. 2015, 5, 13957. [Google Scholar] [CrossRef] [PubMed] [Green Version]
  84. Hohmann, N.; Schmickl, R.; Chiang, T.-Y.; Lučanová, M.; Kolář, F.; Marhold, K.; Koch, M.A. Taming the wild: Resolving the gene pools of non-model Arabidopsis lineages. Bmc Evol. Biol. 2014, 14, 224. [Google Scholar] [CrossRef] [PubMed]
  85. Doyle, J.J. Phylogeny of the legume family: An approach to understanding the origins of nodulation. Annu. Rev. Ecol. Syst. 1994, 25, 325–349. [Google Scholar] [CrossRef]
  86. Chappill, J. Cladistic analysis of the Leguminosae: The development of an explicit phylogenetic hypothesis. In Advances in Legume Systematics; Royal Botanic Gardens: London, UK, 1995; pp. 1–9. [Google Scholar]
  87. Doyle, J.J.; Doyle, J.L.; Ballenger, J.A.; Dickson, E.E.; Kajita, T.; Ohashi, H. A Phylogeny of the Chloroplast Gene RBC L in the Leguminosae: Taxonomic correlations and Insights Into the Evolution of Nodulation. Am. J. Bot. 1997, 84, 541–554. [Google Scholar] [CrossRef] [PubMed]
  88. Wojciechowski, M.F.; Lavin, M.; Sanderson, M.J.; Belmonte, J.; Vilà, M. A phylogeny of legumes (Leguminosae) based on analysis of the plastid mat K gene resolves many well-supported subclades within the family. Am. J. Bot. 2004, 91, 1846–1862. [Google Scholar] [CrossRef] [PubMed]
  89. Bruneau, A.; Mercure, M.; Lewis, G.P.; Herendeen, P. Phylogenetic patterns and diversification in the caesalpinioid legumesThis paper is one of a selection of papers published in the Special Issue on Systematics Research. Bot. 2008, 86, 697–718. [Google Scholar] [CrossRef]
  90. Lewis, G.; Schrire, B.; Mackinder, B.; Lock, M. Legumes of the World; Royal Botanic Gardens, Kew: London, UK, 2005. [Google Scholar]
  91. Shi, C.; Hu, N.; Huang, H.; Gao, J.; Zhao, Y.-J.; Gao, L.-Z. An Improved Chloroplast DNA Extraction Procedure for Whole Plastid Genome Sequencing. PLoS ONE 2012, 7, e31468. [Google Scholar] [CrossRef]
  92. Langmead, B.; Salzberg, S. Fast gapped-read alignment with Bowtie 2. Nat. Methods 2012, 9, 357–359. [Google Scholar] [CrossRef] [Green Version]
  93. Kearse, M.; Moir, R.; Wilson, A.; Stones-Havas, S.; Cheung, M.; Sturrock, S.; Buxton, S.; Cooper, A.; Markowitz, S.; Duran, C.; et al. Geneious Basic: An integrated and extendable desktop software platform for the organization and analysis of sequence data. Bioinformatics 2012, 28, 1647–1649. [Google Scholar] [CrossRef]
  94. Hahn, C.; Bachmann, L.; Chevreux, B. Reconstructing mitochondrial genomes directly from genomic next-generation sequencing reads--A baiting and iterative mapping approach. Nucleic Acids Res. 2013, 41, e129. [Google Scholar] [CrossRef] [Green Version]
  95. Wyman, S.; Jansen, R.K.; Boore, J.L. Automatic annotation of organellar genomes with DOGMA. Bioinformatics 2004, 20, 3252–3255. [Google Scholar] [CrossRef] [PubMed] [Green Version]
  96. Schattner, P.; Brooks, A.; Lowe, T. tRNAscan-SE: A program for improved detection of transfer RNA genes in genomic sequence. Nucleic Acids Res 2005, 33, W686–W689. [Google Scholar] [CrossRef] [PubMed]
  97. Lohse, M.; Drechsel, O.; Bock, R. OrganellarGenomeDRAW (OGDRAW): A tool for the easy generation of high-quality custom graphical maps of plastid and mitochondrial genomes. Curr. Genet. 2007, 52, 267–274. [Google Scholar] [CrossRef] [PubMed]
  98. Frazer, K.A.; Pachter, L.; Poliakov, A.; Rubin, E.M.; Dubchak, I. VISTA: Computational tools for comparative genomics. Nucleic Acids Res. 2004, 32, W273–W279. [Google Scholar] [CrossRef] [PubMed]
  99. Kurtz, S. REPuter: The manifold applications of repeat analysis on a genomic scale. Nucleic Acids Res. 2001, 29, 4633–4642. [Google Scholar] [CrossRef] [PubMed] [Green Version]
  100. Beier, S.; Thiel, T.; Münch, T.; Scholz, U.; Mascher, M. MISA-web: A web server for microsatellite prediction. Bioinformatics 2017, 33, 2583–2585. [Google Scholar] [CrossRef] [Green Version]
  101. Benson, G. Tandem repeats finder: A program to analyze DNA sequences. Nucleic Acids Res. 1999, 27, 573–580. [Google Scholar] [CrossRef] [Green Version]
  102. Katoh, K.; Toh, H. Parallelization of the MAFFT multiple sequence alignment program. Bioinformatics 2010, 26, 1899–1900. [Google Scholar] [CrossRef]
  103. Kimura, M. A simple method for estimating evolutionary rates of base substitutions through comparative studies of nucleotide sequences. J. Mol. Evol. 1980, 16, 111–120. [Google Scholar] [CrossRef]
  104. Ronquist, F.; Huelsenbeck, J.P. MrBayes 3: Bayesian phylogenetic inference under mixed models. Bioinformatics 2003, 19, 1572–1574. [Google Scholar] [CrossRef] [Green Version]
  105. Swofford, D.L. Paup*: Phylogenetic analysis using parsimony (and other methods) 4.0. B5. 2001. Available online: http://citeseerx.ist.psu.edu/viewdoc/summary?doi=10.1.1.458.6867 (accessed on 22 January 2020).
  106. Kumar, S.; Nei, M.; Dudley, J.; Tamura, K. MEGA: A biologist-centric software for evolutionary analysis of DNA and protein sequences. Briefings Bioinform. 2008, 9, 299–306. [Google Scholar] [CrossRef] [PubMed] [Green Version]
  107. Posada, D. jModelTest: Phylogenetic Model Averaging. Mol. Boil. Evol. 2008, 25, 1253–1256. [Google Scholar] [CrossRef] [PubMed]
  108. Gascuel, O. BIONJ: An improved version of the NJ algorithm based on a simple model of sequence data. Mol. Boil. Evol. 1997, 14, 685–695. [Google Scholar] [CrossRef] [PubMed] [Green Version]
Figure 1. Genome map of the P. juliflora and P. cineraria cp genomes. The extent of the inverted repeat regions (IRs) is represented by thick lines, which divide the cp genome into large (LSC) and small (SSC) single copy regions. Genes drawn inside the circle are transcribed clockwise, while those outside of the circle are transcribed counter clockwise. Genes belonging to different functional groups are color coded. The dark grey in the inner circle corresponds to the GC content, while the light grey corresponds to the AT content.
Ijms 21 03280 g001
Figure 2. Analysis of simple sequence repeats (SSRs) in the P. juliflora and P. cineraria and related cp genomes. Total numbers of SSRs in whole genome (A), Number of SSRs in coding region (B), Number of SSRs in intergenic region (C) and Frequency of identified SSR motifs in different repeat class types (D).
Ijms 21 03280 g002
Figure 3. Analysis of repeated sequences in P. juliflora and P. cineraria and related cp genomes. Total numbers of the three repeat types (A), frequencies of palindromic repeats by length (B), frequencies of forward repeats by length (C) and frequencies of tandem repeats by length (D).
Ijms 21 03280 g003
Figure 4. Visual alignment of plastid genomes from P. juliflora with P. cineraria, P. glandulosa, P. javanica and A. micosperma cp genomes. VISTA-based identity plot showing sequence identities among five species, using P. juliflora as a reference. Genome regions are color-coded as protein coding, rRNA coding, tRNA coding, or conserved noncoding sequences (CNS). The x-axis represents the coordinate in the chloroplast genome. Annotated genes are displayed along the top. The sequences similarity of the aligned regions is shown as horizontal bars indicating the average percent identity between 50% and 100%.
Ijms 21 03280 g004
Figure 5. Pairwise distance of 75 genes from P. cineraria (as reference genome) with P. juliflora, P. glandulosa, P. javanica and A. microsperma cp genomes.
Ijms 21 03280 g005
Figure 6. Distances between adjacent genes and junctions of the small single-copy (SSC), large single-copy (LSC), and two inverted repeat (IR) regions among five cp genomes within the subfamily Caesalpinioideae. Boxes above and below the primary line indicate the adjacent border genes. The figure is not to scale with regards to sequence length and only shows relative changes at or near the IR/SC borders.
Ijms 21 03280 g006
Figure 7. Phylogenetic tree of P. juliflora and P. cineraria within the subfamily Caesalpinioideae (Leguminosae). The entire genome data set was analysed using three different methods: Bayesian inference (BI), maximum parsimony (MP) and maximum likelihood (ML). Numbers above and below the branches represent bootstrap values in the MP and ML trees and posterior probabilities in the BI trees. The green color and red stars represent the positions of P. juliflora and P. cineraria.
Ijms 21 03280 g007
Table 1. Summary of genome features of complete chloroplast of P. cineraria, P. juliflora, P. glandulosa, A. microsperma, P. javanica.
P. CinerariaP. JulifloraP. GlandulosaA. MicrospermaP. Javanica
Size (bp)163,677163,237163,040159,389161,681
Overall GC contents35.935.935.936.535.9
LSC size (bp)92,93792,49592,31088,57791,093
SSC size (bp)18,87818,88019,13218,75618,574
IR size (bp)25,93125,93125,93126,02826,007
Protein coding regions (bp)78,88378,42178,03978,03078,075
tRNA size (bp)28682927281027932794
rRNA size (bp)90529052905290529052
Number of genes131132128128130
Number of protein coding genes8585838383
Number of rRNAs88888
Number of tRNA s3839373737
Genes with introns2121232223
P. cineraria = Prosopis cineraria, P. juliflora = Prosopis juliflora, P. glandulosa = Prosopis glandulosa, A. microsperma = Adenanthera microsperma, P. javanica = Parkia javanica.
Table 2. The genes with introns in the three Prosopis species chloroplast genomes and the length of exons and introns.
GeneLocationExon I (bp)Intron 1 (bp)Exon II (bp)Intron II (bp)Exon III (bp)
P. jP. cP. gP. jP. cP. gP. jP. cP. gP. jP. cP. gP. jP. cP. g
atpFLSC145145145744726727389407407
petBLSC666815815815642642642
petDLSC888720720720475475475
rpl2 aIR391393393665662662434435435
rpl16LSC999117311731173399399399
rps16LSC404040884883883245245245
rpoC1LSC432432432842802802157816171617
rps12 *LSC-IR114114114 2322322325405405402626
clpPLSC696969789790789291291291642642642228228228
ndhASSC552553552144914521457540539540
ndhB aIR777777777685684685756756756
ycf3LSC126126126729729728228228228738738738153153153
trnA-UGC aIR383838802794802353535
trnI –GAUaIR424242948948948353535
trnL-UAALSC373737536536536505050
trnK-UUULSC292929249224912491373737
trnG-GCCLSC 23 702 49
trnV-UACLSC373737619619619393939
P. j = Prosopis juliflora, P. c = Prosopis cineraria, P. g = Prosopis glandulosa. a Duplicated gene. * The rps12 coding sequence is split between 5′-rps12 and 3′-rps12, which are located in the large single-copy region and inverted repeat region, respectively.
Table 3. Genes in the sequenced Prosopis species chloroplast genomes.
CategoryGroup of GenesName of Genes
Self-replicationLarge subunit of ribosomal proteinsrpl2, 14, 16, 20, 23, 32, 33, 36
Small subunit of ribosomal proteinsrps2, 3, 4, 7, 8, 11, 12, 14, 15, 16, 18, 19
DNA dependent RNA polymeraserpoA, B, C1, C2
rRNA genesrrn4.5, rrn5, rrn16, rrn23
tRNA genestrnA-UGC, trnC-GCA, trnD-GUC, trnE-UUC trnF-GAA, trnfM-CAU, trnG-UCC, trnH-GUG, trnI-CAU, trnI-GAU, trnK-UUU, trnL-CAA, trnL-UAA, trnL-UAG, trnM-CAU, trnN-GUU, trnP-GGG, trnP-UGG, trnQ-UUG, trnR-ACG, trnR-UCU, trnS-GCU, trnS-GGA, trnS-UGA, trnT-GGU, trnT-UGU, trnV-GAC, trnV-UAC, trnW-CCA, trnY-GUA
PhotosynthesisPhotosystem IpsaA, B, C, I,
Photosystem IIpsbA, B, C, D, E, F, H, I, J, K, L, M, N, T, Z
Cytochrome b6/f complexpetA, B, D, G, L, N
ATP synthaseatpA, B, E, F, H, I
RubiscorbcL
MaturasematK
ProteaseclpP
Envelop membrane proteincemA
Subunit Acetyl- CoA-CarboxylateaccD
c-type cytochrome synthesis geneccsA
UnknownConserved Open reading framesycf1, 2, 3, 4
Table 4. Base composition of the P. cineraria, P. juliflora and P. glandulosa chloroplast genome.
T/UCAGLength (bp)
P. jP. cP. gP. jP. cP. gP. jP. cP. gP. jP. cP. gP. jP. cP. g
Genome32.532.532.518.318.318.331.631.631.717.617.617.6163,237163,677163,040
LSC34.234.234.217.017.017.032.632.632.616.116.216.192,49592,93792,310
SSC34.934.934.615.916.015.734.734.635.214.514.514.418,88018,87819,132
IR28.828.828.520.620.622.128.528.528.822.122.120.625,93125,93125,931
tRNA25.124.924.823.423.523.822.122.021.929.429.629.5292728682810
rRNA18.918.918.823.723.723.625.725.725.731.731.731.9905290529052
Protein coding genes31.731.731.717.417.417.430.930.830.820.020.120.178,42178,88378,039
1st position32.633.032.417.918.1418.231.431.531.717.917.517.554,41254,55954,347
2nd position32.432.3332.718.518.417.731.531.332.117.417.817.554,41254,55954,347
3rd position32.332.4432.420.918.118.832.031.93117.417.317.754,41254,55954,347
P. c = Prosopis cinerea, P. j = Prosopis juliflora, P. g = Prosopis glandulosa.

