Article

Transcriptome Profiling of m6A mRNA Modification in Bovine Mammary Epithelial Cells Treated with Escherichia coli

1
Department of Clinical Veterinary Medicine, Faculty of Veterinary Medicine, Huazhong Agricultural University, Wuhan 430070, China
2
State Key Laboratory of Agricultural Microbiology, Huazhong Agricultural University, Wuhan 430070, China
3
Department of Preventive Veterinary Medicine, Faculty of Veterinary Medicine, Huazhong Agricultural University, Wuhan 430070, China
4
Department of Animal Nutrition and Feed Science College of Animal Science and Technology, Huazhong Agricultural University, Wuhan 430070, China
*
Author to whom correspondence should be addressed.
Int. J. Mol. Sci. 2021, 22(12), 6254; https://doi.org/10.3390/ijms22126254
Submission received: 19 May 2021 / Revised: 7 June 2021 / Accepted: 8 June 2021 / Published: 10 June 2021
(This article belongs to the Section Molecular Immunology)

Abstract

:
Mastitis is a common disease in dairy cows that is mostly caused by E. coli, and it brings massive losses to the dairy industry. N6-Methyladenosine (m6A), a methylation at the N6 position of RNA adenine, is a type of modification strongly associated with many diseases. However, the role of m6A in mastitis has not been investigated. In this study, we used MeRIP-seq to sequence the RNA of bovine mammary epithelial cells treated with inactivated E. coli for 24 h. In this in vitro infection model, there were 16,691 m6A peaks within 7066 mRNA transcripts in the Con group and 10,029 peaks within 4891 transcripts in the E. coli group. Compared with the Con group, 474 mRNAs were hypermethylated and 2101 mRNAs were hypomethylated in the E. coli group. Biological function analyses revealed differential m6A-modified genes mainly enriched in the MAPK, NF-κB, and TGF-β signaling pathways. In order to explore the relationship between m6A and mRNA expression, combined MeRIP-seq and mRNA-seq analyses revealed 212 genes with concomitant changes in the mRNA expression and m6A modification. This study is the first to present a map of RNA m6A modification in mastitis treated with E. coli, providing a basis for future research.

1. Introduction

Mastitis is one of the most severe diseases in dairy farming, and its diagnosis and treatment present many challenges. Common measures to prevent mastitis include antibiotic treatments, the discarding of milk, and the elimination of sick cows, all of which cause serious losses [1]. Over the past decades, studies of mastitis have mainly focused on the reaction between the pathogen and the host [2]. The innate immune system of the mammary gland has been shown to minimize mastitis caused by pathogenic microorganisms, thereby cooperating with the acquired immune system. Mammary epithelial cells (MECs), as the first barrier of nonspecific immunity of mastitis, play a crucial role in mastitis following infection by pathogenic microorganisms. These cells secrete a variety of inflammatory factors and chemokines [3] that regulate cell apoptosis, the Toll-like receptor (TLR) pathway, the mitogen-activated protein kinase (MAPK) pathway, and other signaling pathways [4]. Mastitis-associated Escherichia coli (E. coli) [5] could result in an acute course of mastitis with severe clinical symptoms [6,7]. Lipopolysaccharides (LPS), a component of E. coli, can activate TLR signal transduction and cause a series of reaction cascades [8,9,10,11]. It has also been reported that E. coli can induce apoptosis in mastitis [12]. These factors eventually lead to inflammation and tissue damage. Although many studies have been conducted on mastitis, knowledge of its diagnosis and treatment remains insufficient. Therefore, new research on pathogen-specific mastitis may provide new directions for diagnosis and treatment.
N6-Methyladenosine (m6A) is the most common RNA modification in eukaryotes, and it involves methylation at the N6 position of RNA adenine [13,14]. In the 1970s, m6A modification was detected in eukaryotic mRNA and lncRNA [15], and subsequent studies found that about 1–2% of mRNAs contain m6A modification [16]. Studies have demonstrated that m6A modification is vital to splicing and editing of mRNA, degradation of polyadenylation, and other RNA processing events [17]. Furthermore, m6A modification may promote mRNA nuclear export and translation initiation, and it maintains the structural stability of mRNA with poly A binding proteins. m6A modification is mainly involved in three enzymes: “writers”, methylation transferases responsible for the methylation modification of RNA, such as the METTLE family and WTAP; “erasers”, demethylation enzymes, including FTO and ALKBH5, which clear the methylation modification of RNA; “readers”, methylation-reading proteins, such as YTH family protein and elF3 [18,19,20,21,22]. m6A modification is involved in many pathophysiological processes in mammals [23]. Chen et al. found that m6A modification of circular RNA inhibited innate immunity [24]. Yu et al. reported that m6A reader protein YTHDF was closely correlated with inflammation induced by LPS via the expression of inflammatory genes such as nuclear factor kappa B (NF-κB) and MAPK [25]. Zhu and Lu reported that the “eraser” ALKBH5 could regulate the cell apoptosis induced by LPS [26]. However, the nature of the relationship between mastitis and m6A modification is still unclear.
In this study, we determined potential m6A modification in the inflammation of bovine mammary epithelial cells treated with inactivated E. coli using high-throughput sequencing (MeRIP-seq). Differential m6A-modified transcripts were analyzed in E. coli-induced MAC-T. Furthermore, we performed biological function analysis of the differential m6A modification and clustered signaling pathways of differentially methylated mRNAs. We also investigated the relationship between m6A modification and mRNA transcription. These findings lay a foundation for further exploration of m6A RNA modification in mastitis treated with E. coli.

2. Results

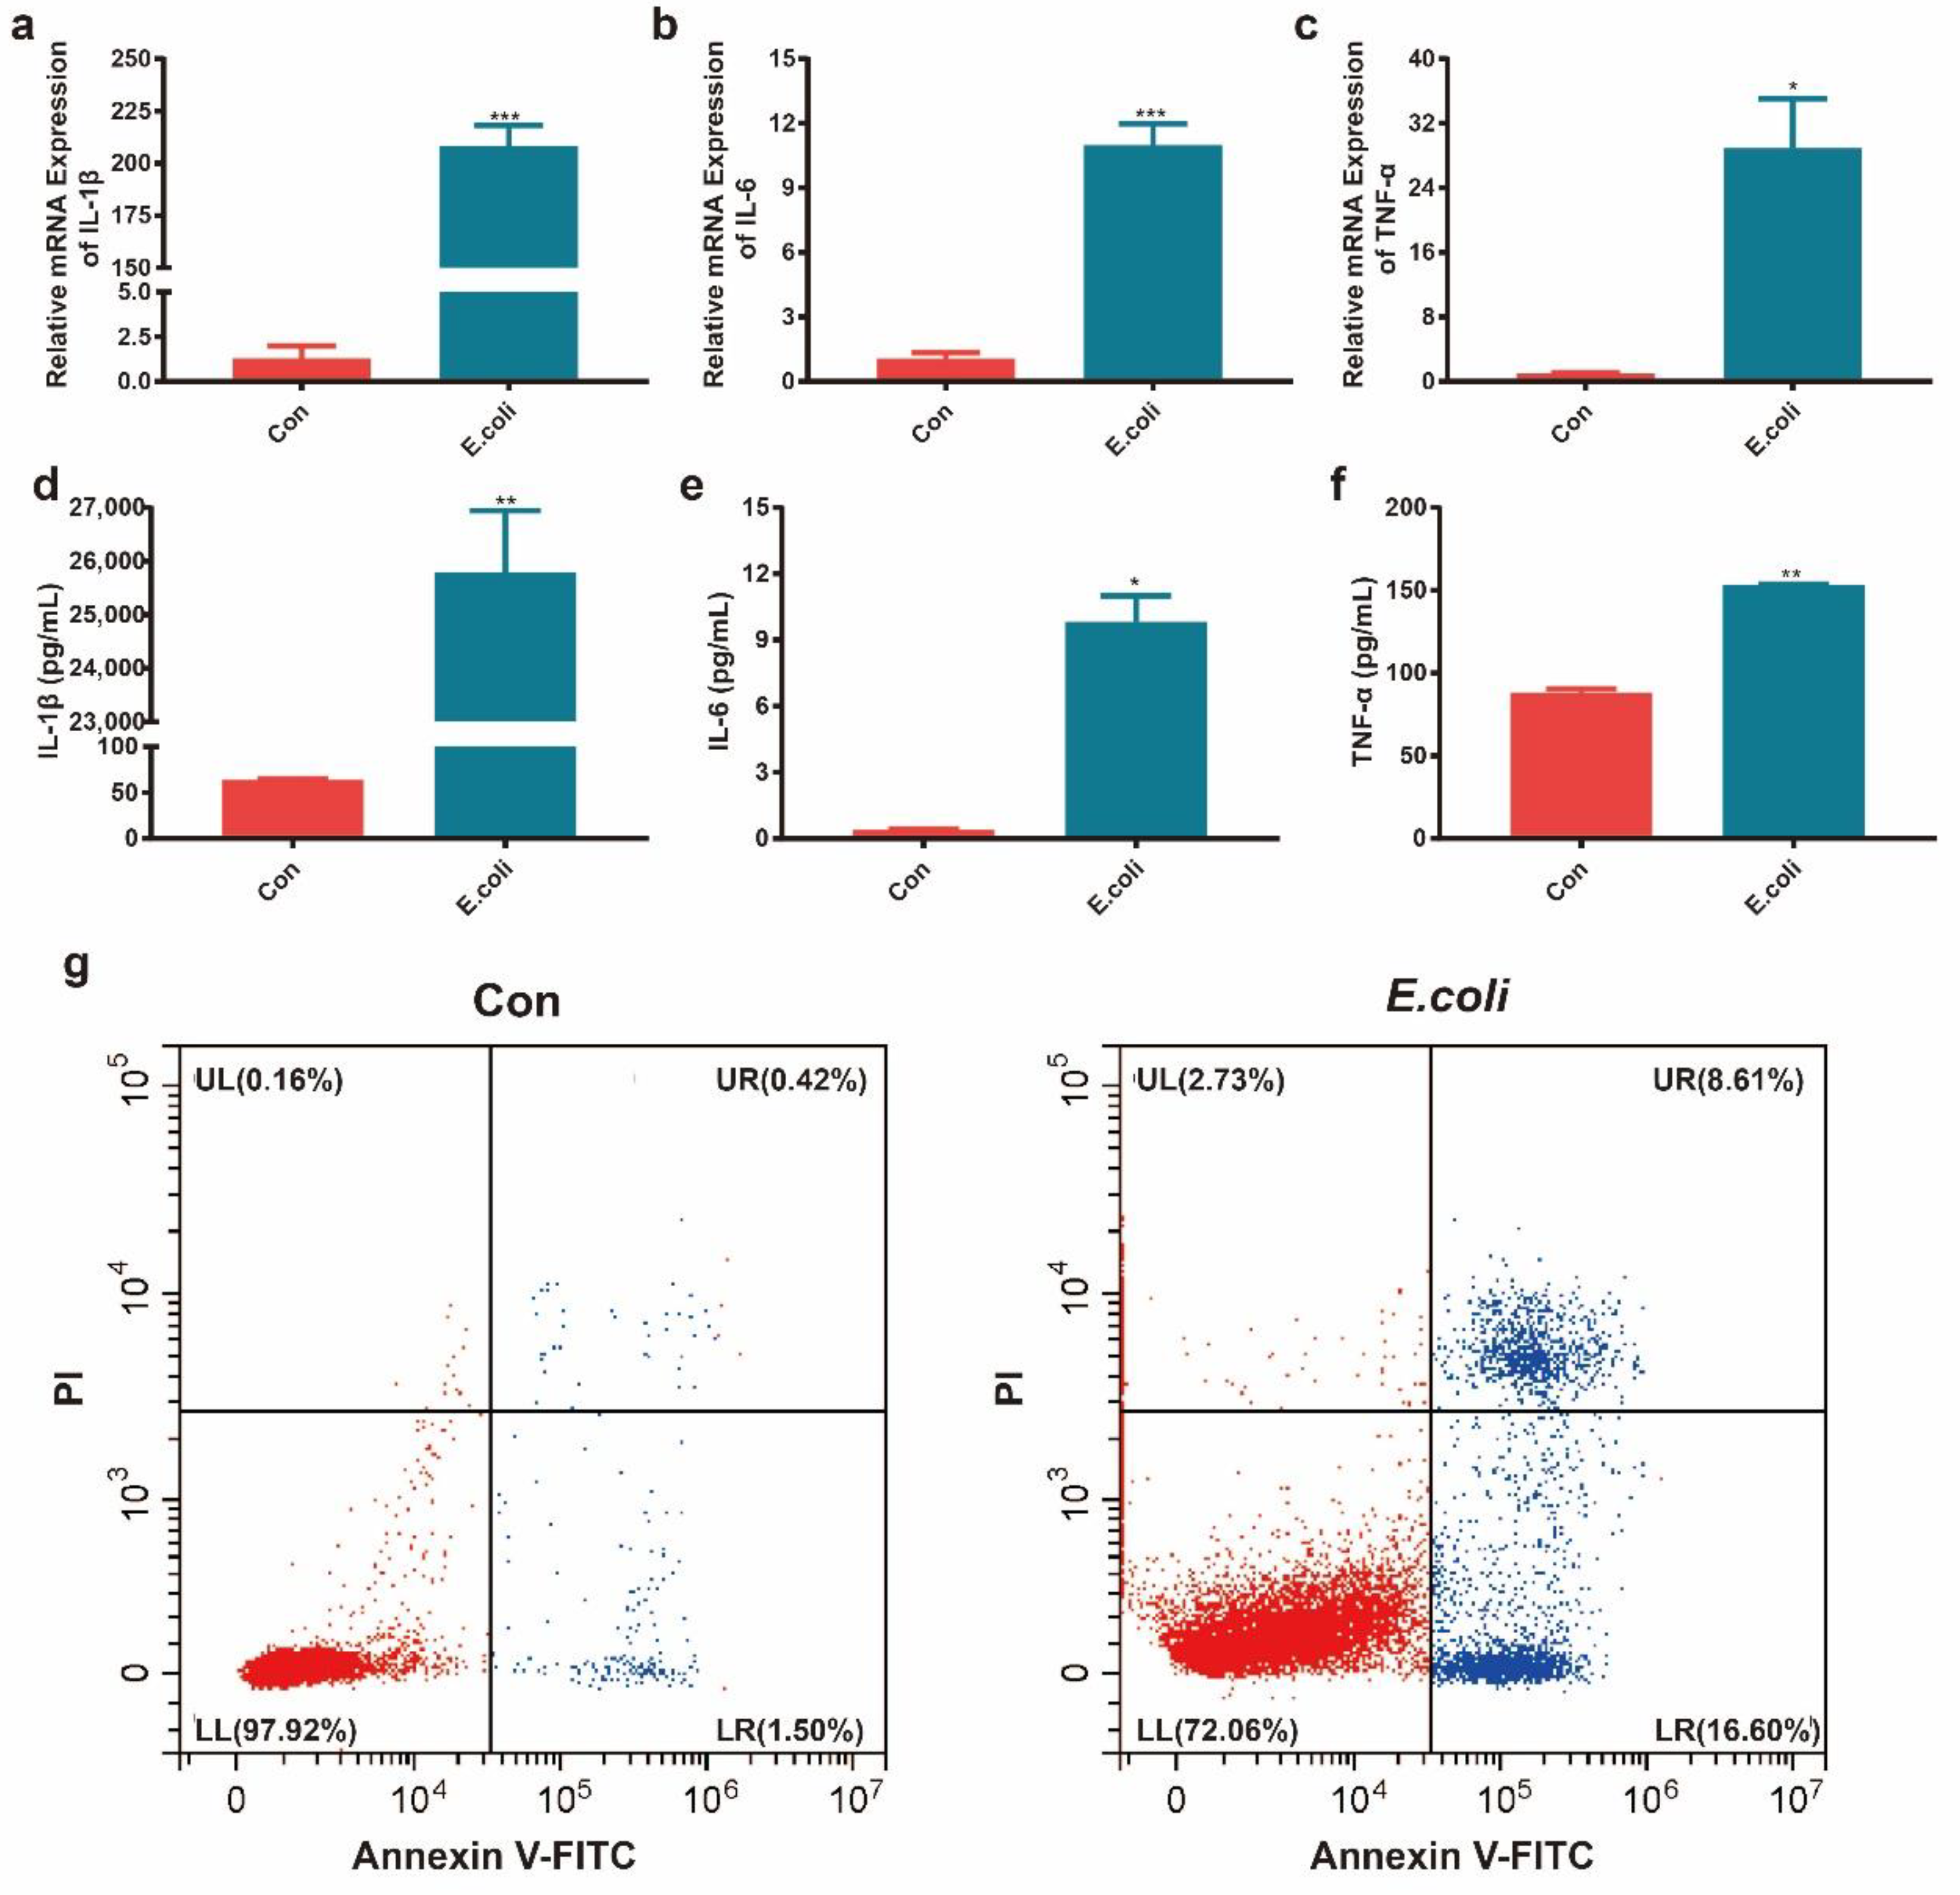
2.1. Establishment of Mastitis Model In Vitro

In this study, MAC-T cells were treated with heat-inactivated E. coli with an MOI of 10:1 for 24 h. We detected the mRNA and protein expression of IL-1β, IL-6, and TNF-α by RT-qPCR (Figure 1a–c) and ELISA (Figure 1d–f). The results show that the expression levels of proinflammatory factors IL-1β, IL-6, and TNF-α were significantly increased in the MAC-T cells treated with inactivated E. coli (p < 0.05). Meanwhile, we used flow cytometry to detect the apoptosis of MAC-T cells induced by inactivated E. coli. The results show that the percentage of apoptotic cells in the control group was 1.92% and that in the E. coli group was 25.21% (Figure 1g), suggesting that inactivated E. coli could cause MAC-T cell apoptosis.

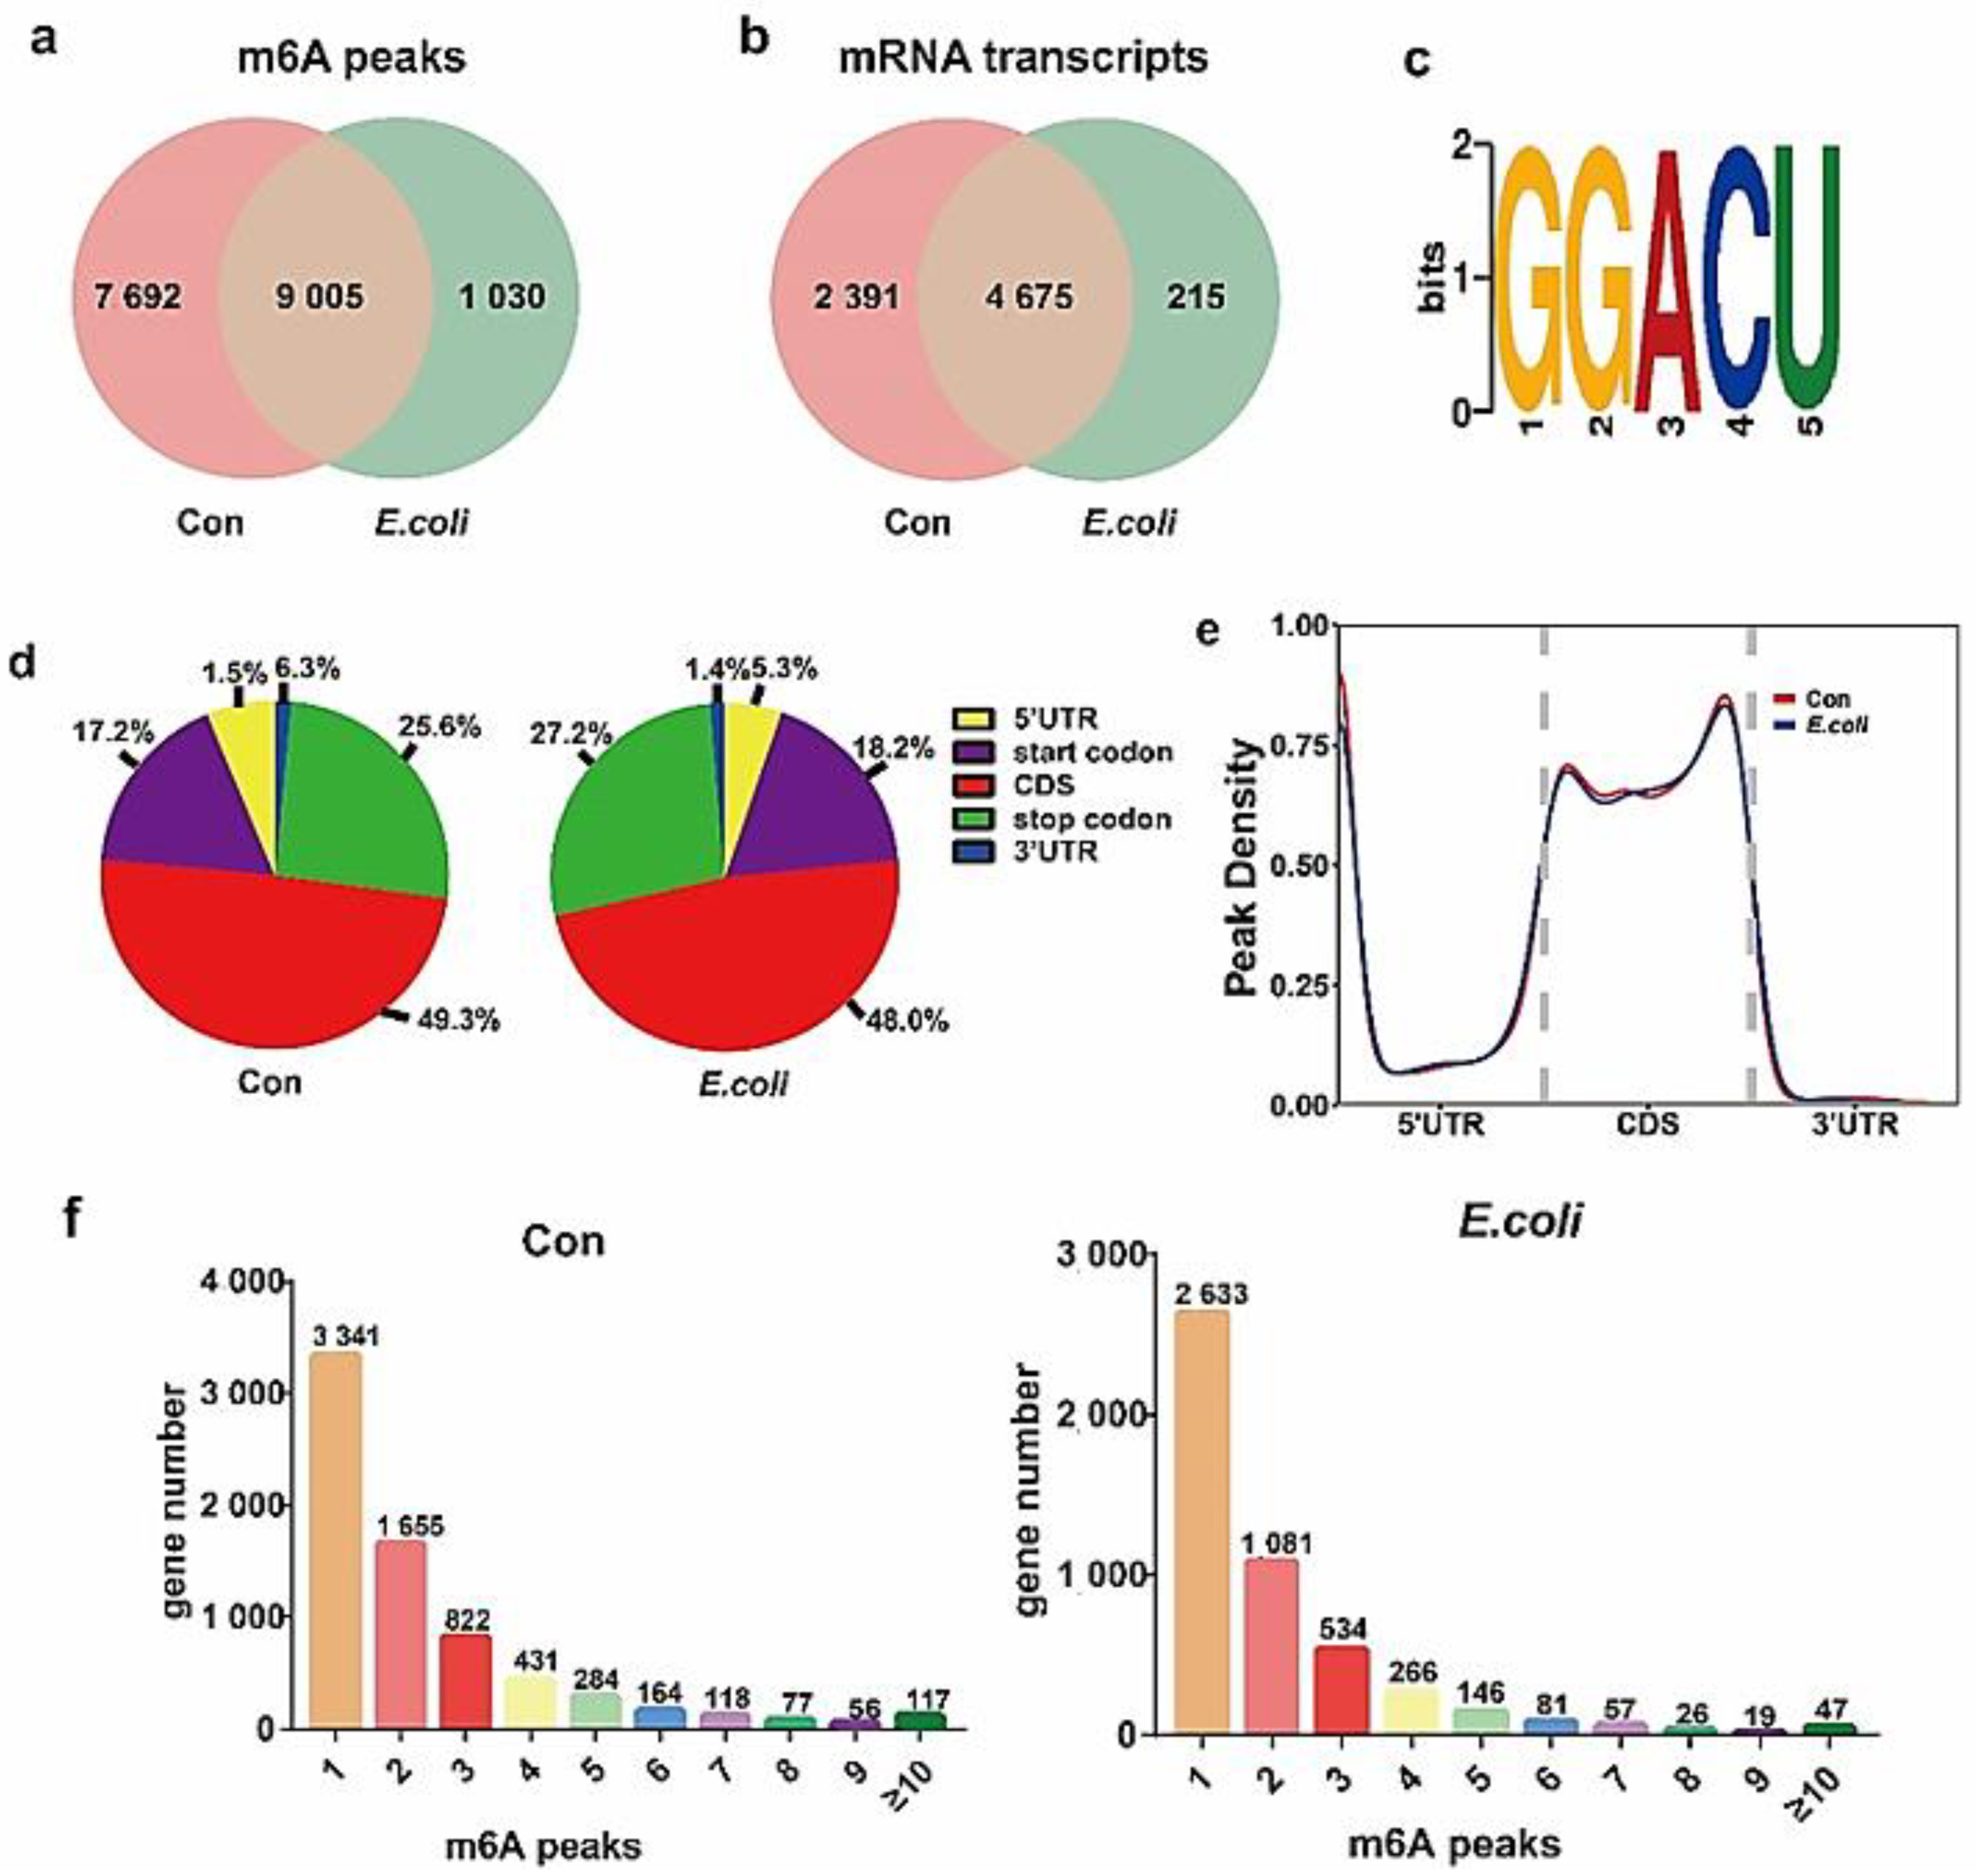
2.2. Profile of the m6A Modification in MAC-T Cells Treated with E. coli

In order to obtain a map of m6A modification in MAC-T cells treated with E. coli, we performed a transcriptome profiling of m6A modification analysis using meRIP-seq. Comparing the clean reads to the reference genome, there were 16,691 m6A peaks within 7066 mRNA transcripts in the Con group and 10,029 peaks within 4891 mRNA transcripts in the E. coli group (Figure S1a,b, Supplementary Materials). A total of 9005 m6A modification peaks and 4675 mRNA transcripts existed in the two groups, whereby 7692 peaks and 2391 mRNA transcripts existed in the Con group and 1030 peaks and 215 mRNA transcripts existed in the E. coli group (Figure 2a,b). The most enriched motif sequence [27,28] m6A peak in the Con and E. coli groups was GGACU (Figure 2c).
An analysis of the specific positions of peaks on modified genes revealed that methylation in the CDS region was significantly greater than in other regions in the Con and E. coli groups (Figure 2d), consistent with the results reported in previous studies [29]. Furthermore, the distribution density of methylation peaks in the Con and E. coli groups was highly similar (Figure 2e). Studies have confirmed that there is sometimes more than one methylation peak of mRNA, but one peak is usually the most common. In this study, a count of the methylation peaks of mRNAs revealed that the number of mRNAs with one methylation peak was the largest, although genes with multiple methylation peaks were not uncommon (Figure 2f).

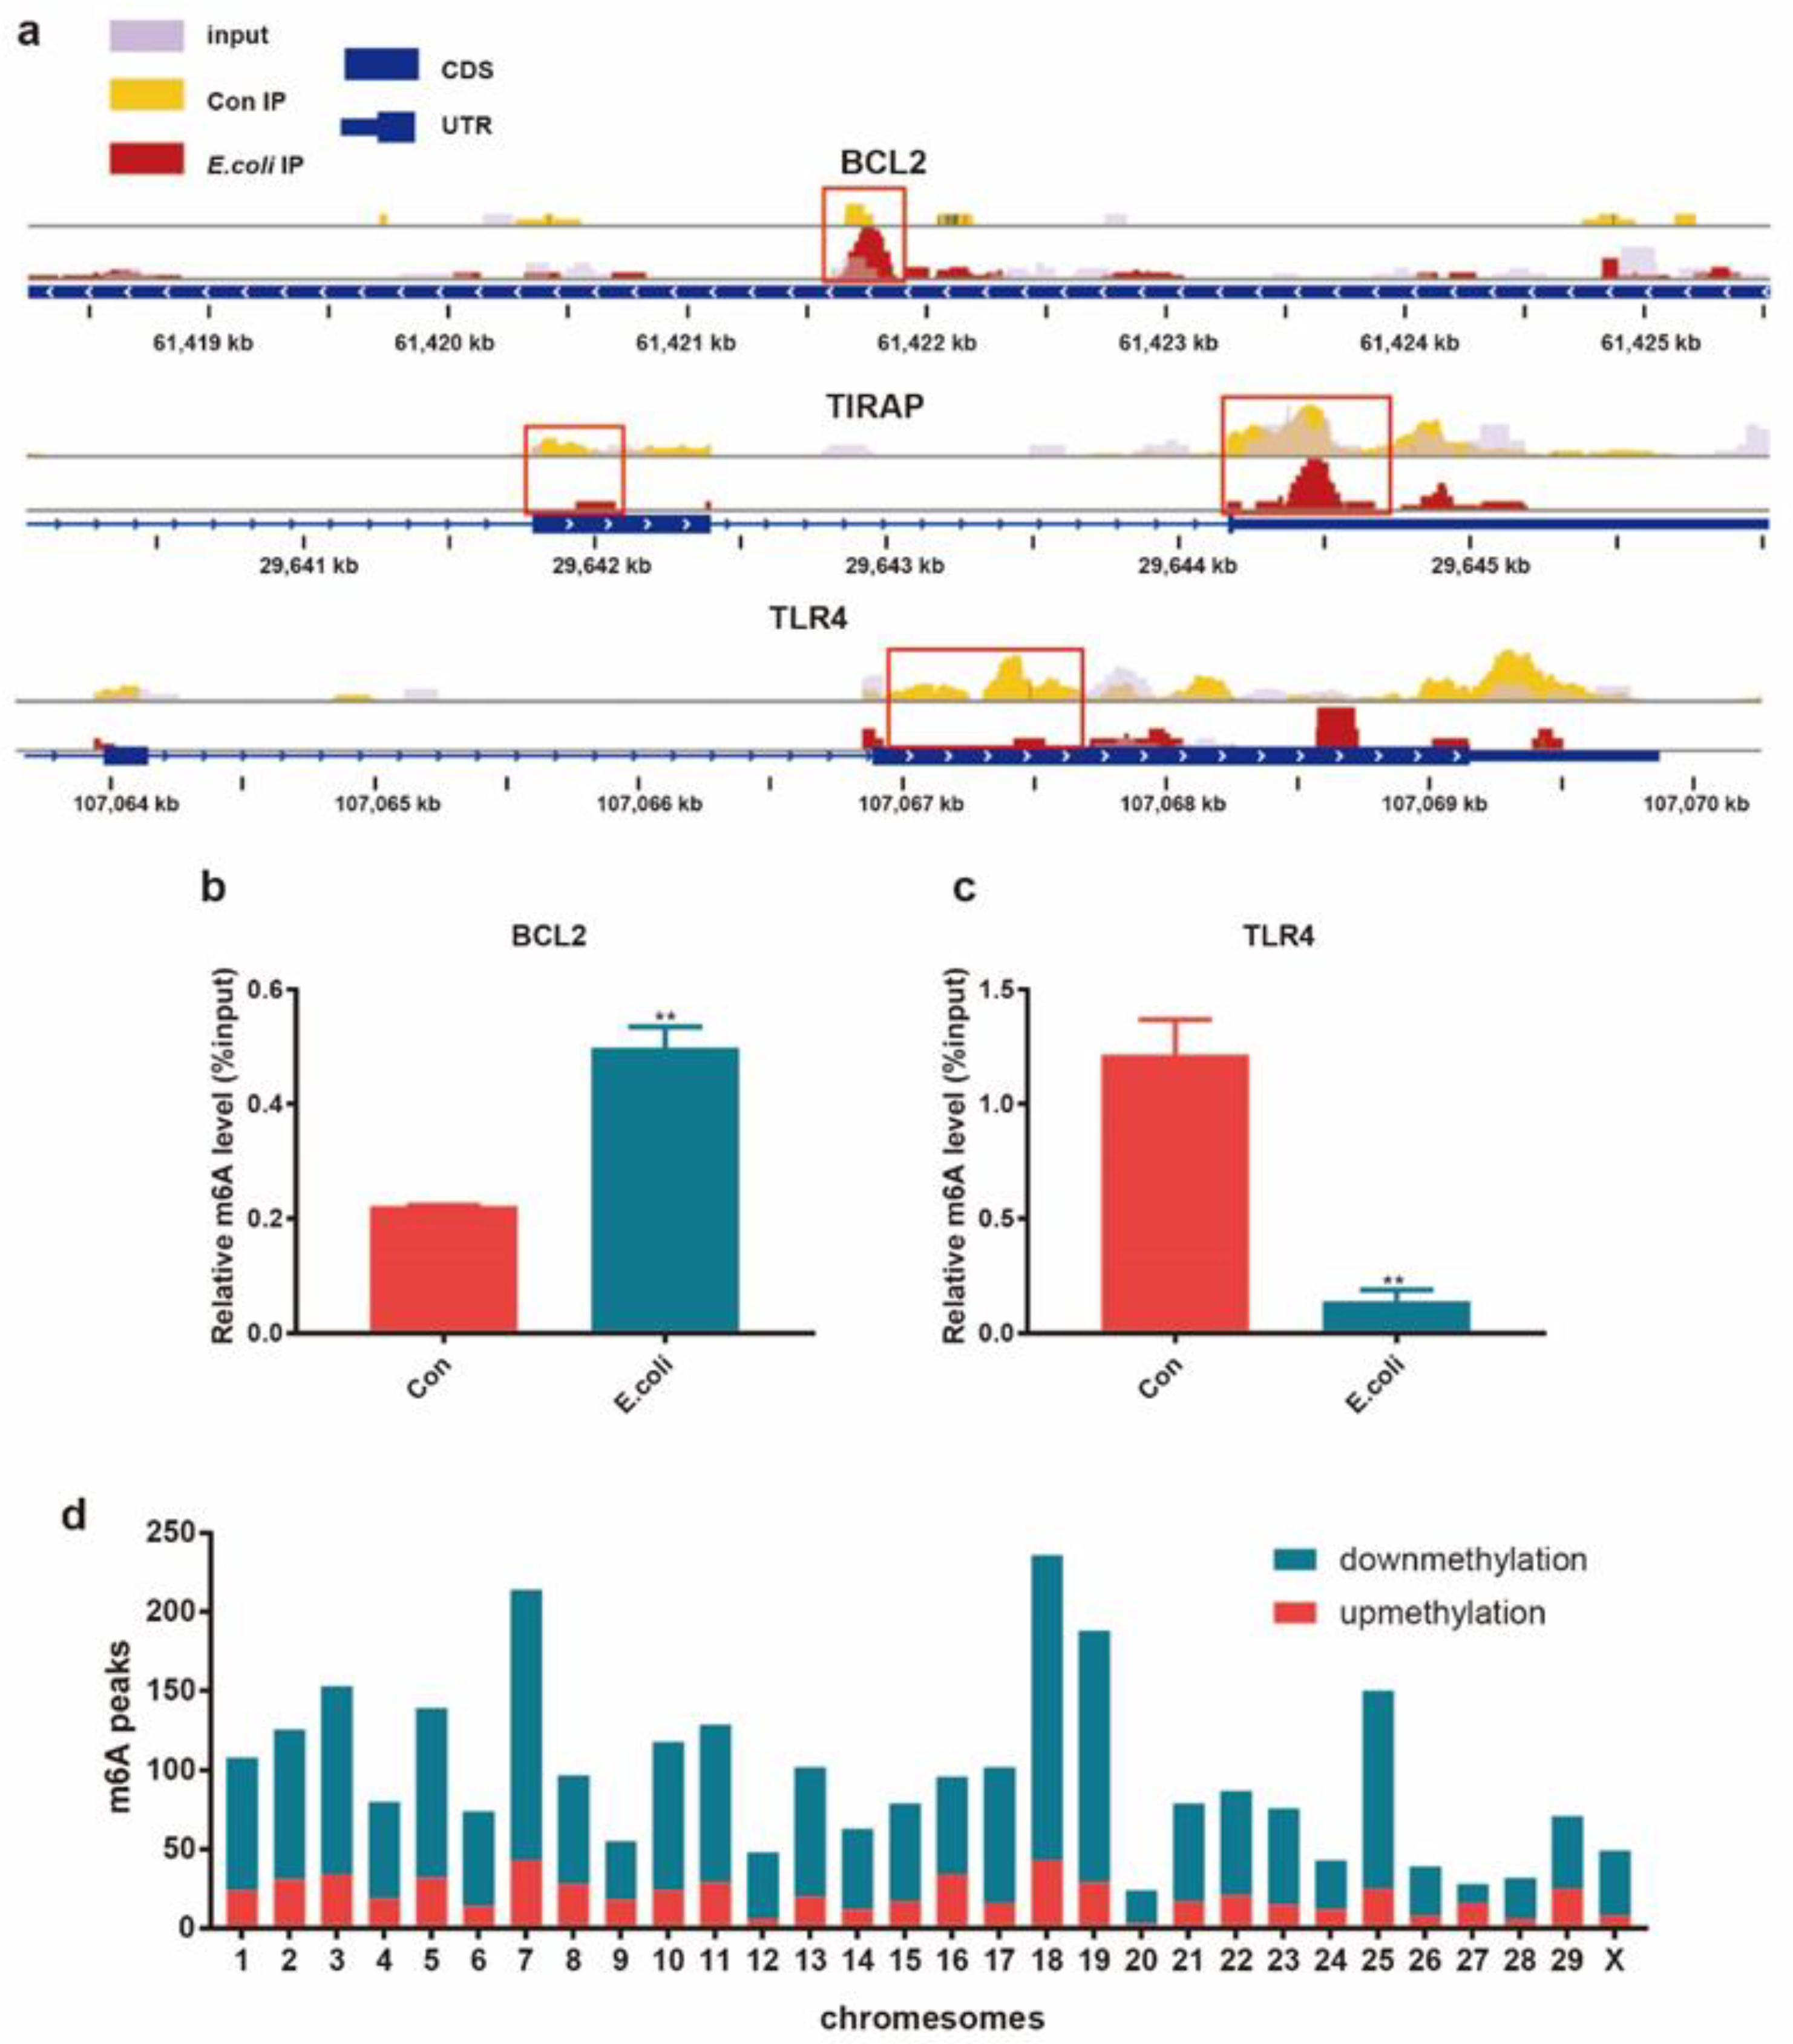
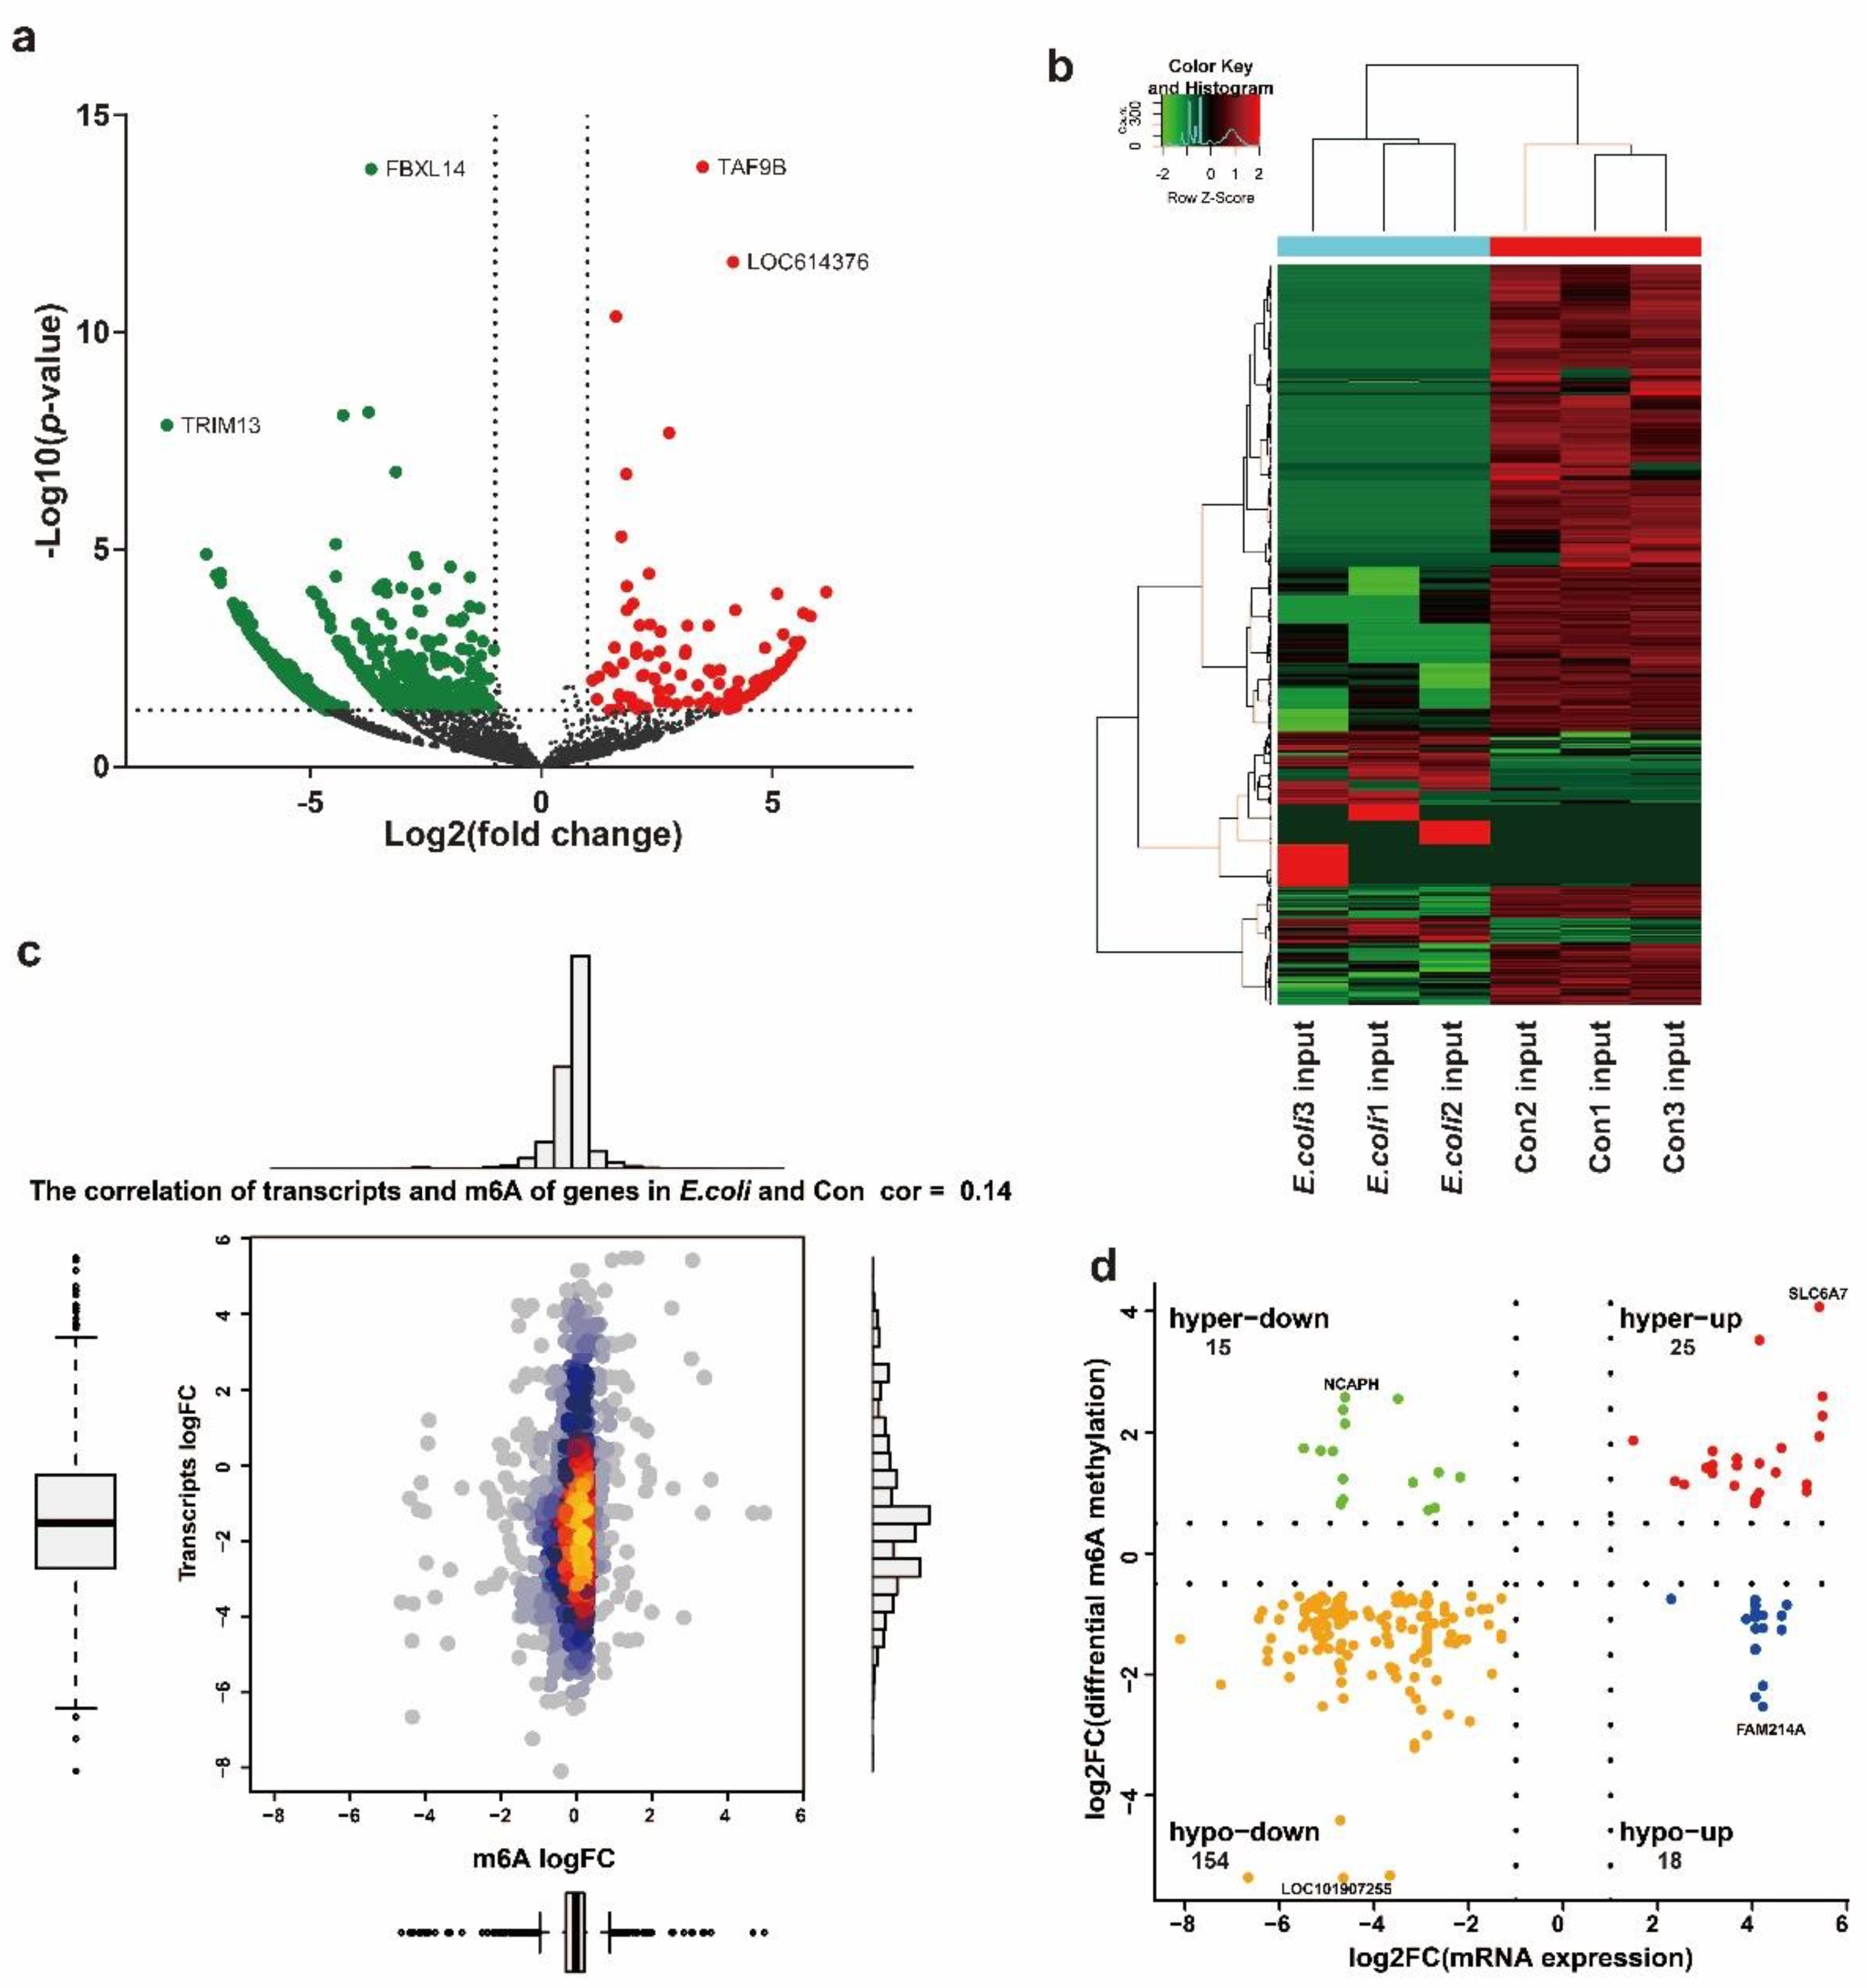
2.3. Differential m6A Modification between the E. coli Group and Control Group

In order to further study the role of m6A modification in dairy bovine mastitis, we analyzed the differences between the m6A peaks of RNA in the E. coli and Con groups. Compared with the Con group, there were 2904 significantly differential m6A peaks within 2101 mRNAs in the E. coli group (Table S2, Supplementary Materials), of which 644 hypermethylated peaks were within 474 mRNAs such as BCL2 (Figure 3a) and 2260 hypomethylated peaks were within 1627 mRNAs, such as TIRAP and TLR4 (Figure 3a) (p < 0.00001, fold change >2.0). Table 1 shows the top 10 hypermethylated or hypomethylated genes in E. coli groups compared with the Con group. This study also demonstrated that BCL2 was m6A hypermethylated (Figure 3b), while TLR4 was m6A hypomethylated (Figure 3c) in E. coli-induced MAC-T cells. Additionally, compared with the Con group, several differential methylation sites in the E. coli group were located on chromosomes 7, 18, 19, and 25 (Figure 3d).

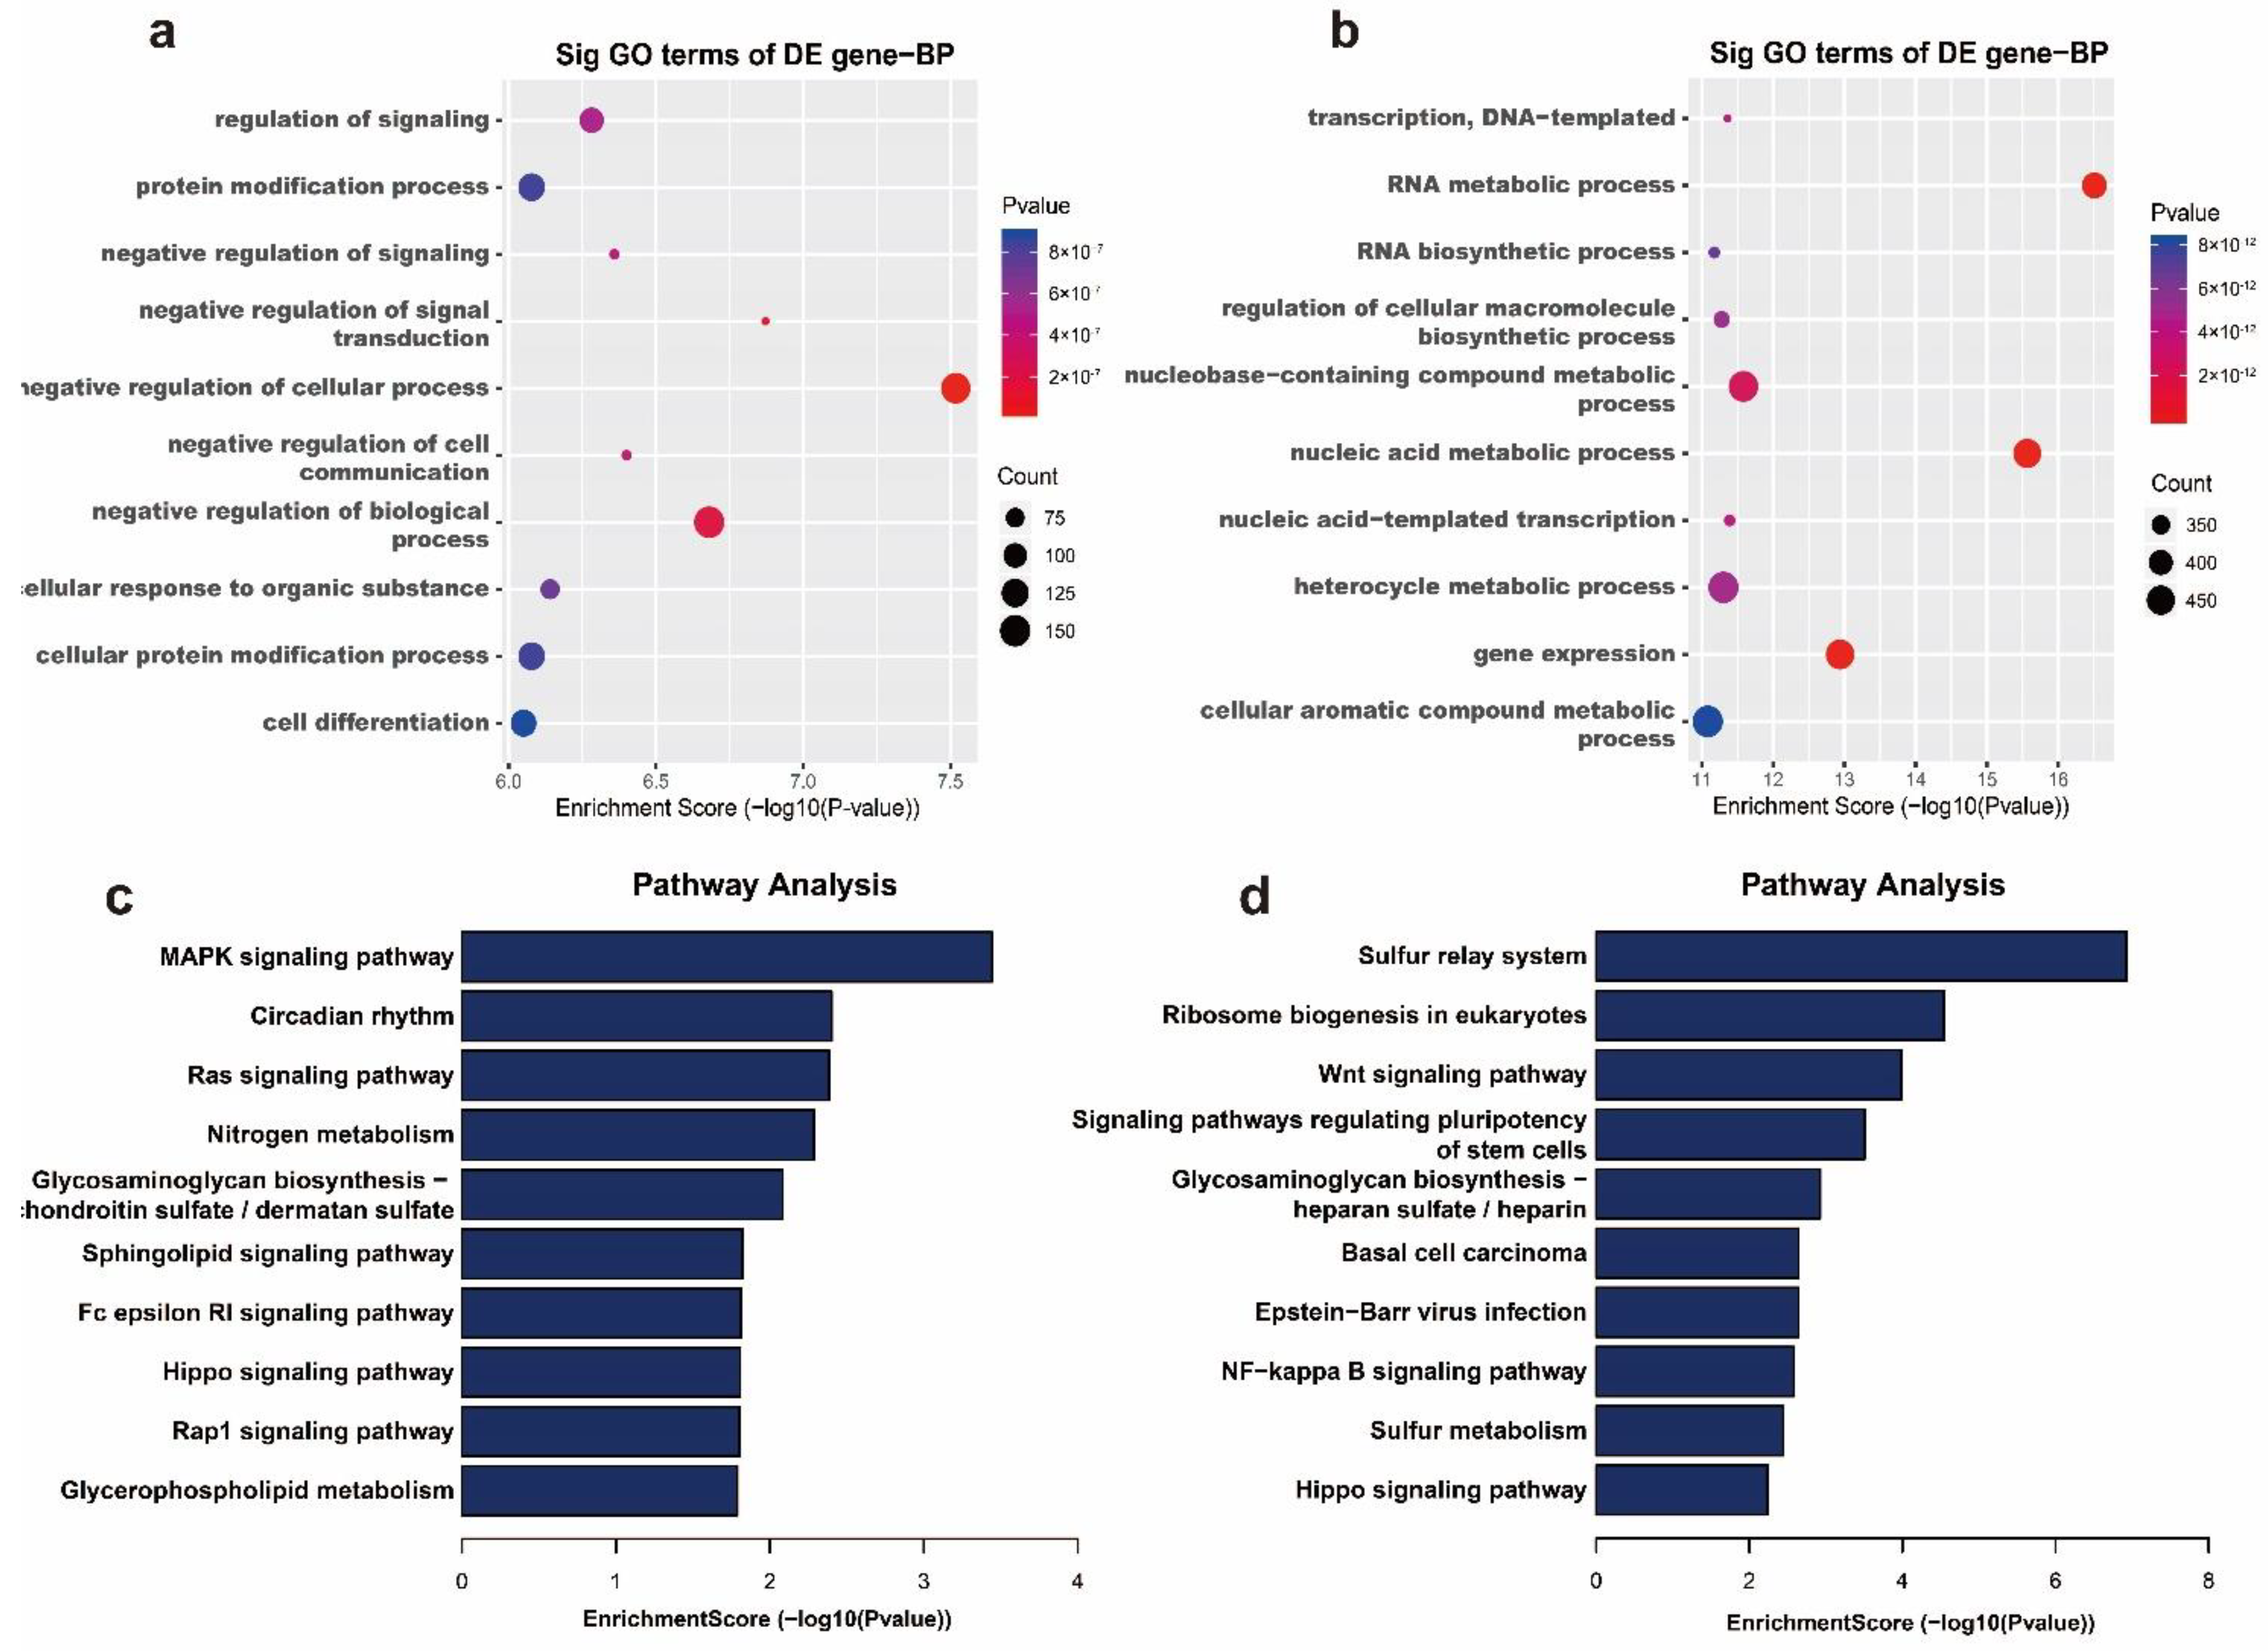
2.4. Differential m6A Modifications Participate in Important Biological Pathways

In order to demonstrate the important function of m6A modification in MAC-T cells induced with E. coli, GO and KEGG enrichment analyses were performed on the above molecules with differential m6A methylation. Regarding the biological process function (BP) of GO enrichment analysis, we observed that genes with m6A hypermethylation in the E. coli group were mainly enriched in processes related to the regulation of signal transduction, protein modification, cell differentiation, etc. (Figure 4a), whereas genes with m6A hypomethylation were mainly enriched in RNA biosynthetic and cellular macromolecule biosynthetic processes (Figure 4b).
Furthermore, KEGG analysis annotated m6A hypermethylated genes in the E. coli group as participating in the MAPK signaling pathway, circadian rhythm, Ras signaling pathway, nitrogen metabolism, sphingolipid signaling pathway, etc. (Figure 4c), whereas m6A hypomethylated genes were significantly associated with the sulfur relay system, ribosome biogenesis in eukaryotes, the Wnt signaling pathway, the NF-κB signaling pathway, the Hippo signaling pathway, etc. (Figure 4d).

2.5. Conjoint Analysis of mRNA-Seq and MeRIP-Seq

To further explore the relationship between m6A modification and mRNA expression, we used RNA sequencing data from the input samples to analyze the mRNA expression of the control and E. coli groups. Volcano plots showed significantly different mRNA expression distribution in the E. coli group (p < 0.05, fold change >2.00) (Figure 5a). Hierarchical clustering showed the similarity of relative expression levels between the Con and E. coli groups (Figure 5b). On the basis of this analysis, we identified 190 upregulated and 595 downregulated genes in the E. coli group. Table 2 shows the top 20 most significantly different genes in the Con and E. coli groups.
A combined analysis showed differential mRNA expression levels (p <0.05, fold change >1.5) and m6A methylation peaks (p < 0.00001, fold change >1.5). The correlation coefficient between m6A modification and mRNA expression in the E. coli group compared with the Con group was 0.14 (Figure 5c), indicating a weak connection between m6A and the overall mRNA expression level. In addition, these genes were divided into four parts, including 25 hypermethylated and upregulated genes (hyper-up), 154 hypomethylated and downregulated genes (hypo-down), 15 hypermethylated but downregulated genes (hyper-down), and 18 hypomethylated but upregulated genes (hypo-up) (Figure 5d). Table 3 shows the 20 genes with significantly differential m6A modification (p < 0.00001, fold change >1.5) and mRNA expression (p < 0.05, fold change >1.5) in the Con and E. coli groups.

3. Discussion

Bovine MECs are the first barrier against invading microorganisms in the mammary gland. The pathogen recognition receptors (PPRs) on the cell surface activate pathogen-associated molecular patterns (PAMPs) after recognizing related pathogens. This major interaction initiates a series of downstream regulatory expression, leading to the expression and release of antimicrobial molecules, chemokines, and cytokines by host cells, even causing apoptosis [30]. Despite the volume of studies that exist on mastitis, there are still uncertainties about the pathogenesis of mastitis caused by E. coli. Therefore, the prevention, diagnosis, and treatment of mastitis remain challenging. The abnormality of m6A-modified enzymes can cause a series of diseases [31]; however, the mechanism of m6A modification in bovine mastitis remains unclear. This study is the first to analyze the relationship between the m6A modification profile and E. coli-induced mastitis.
Using MeRIP-seq to assess m6A modification in a mastitis model, we obtained an overview of m6A modification in mastitis treated with inactivated E. coli infection. The total m6A modification peak numbers revealed significant differences in m6A modification between the control and E. coli groups. Therefore, we assume that m6A modification may be related to E. coli-induced mastitis.
It is known that m6A modification of mRNA often affects changes in and the development of diseases. In this study, we identified a total of 2904 distinct m6A methylation peaks in 2101 mRNAs; 474 mRNAs had 622 hypermethylated peaks and 1627 mRNAs had 2260 hypomethylated peaks. Our analysis of the differential methylation patterns revealed some key mRNAs that may be closely related to mastitis (Figure 3a). BCL2 was found to be hypomethylated. As one of the key factors in the study of apoptosis, BCL2 can inhibit cell apoptosis and protect tissue [32,33]. Therefore, we suspect that m6A modification of BCL2 is involved in the process of apoptosis in mastitis. TLR4 is an important membrane protein receptor that can recognize lipopolysaccharides on the surface of Gram-positive bacteria such as E. coli [10,34,35], and TIRAP, a Toll/IL-1 receptor (TIR) domain of cohesion in cells, upon identifying PAMPs, can activate a series of downstream immune responses [36,37]. We speculate that the m6A hypomethylation in these two key molecules (TLR4 and TIRAP) by MeRIP-seq and IGV visualization reduces the rapid inflammatory reaction of MAC-T treated with E. coli. The findings regarding m6A modification of these genes suggest that differential m6A modification somewhat enriches the pathogenic mechanism of E. coli infection of bovine mammary glands. Although previous studies have confirmed the important role of some genes in the pathophysiology of mastitis, few studies have been conducted on m6A modification. Whether the changes resulting from the m6A modification of genes play an important role in mastitis caused by E. coli requires further verification.
E. coli can not only activate the natural immunity of dairy cow mammary gland tissues through the nucleotide binding oligomerization domain (NOD)-like receptor signaling pathway, the TLR signaling pathway, and the NF-κB signaling pathway, but it can also cause cell apoptosis [3,4,8]. Studies have confirmed that the Ras–MAPK signaling pathway affects proliferation, differentiation, and apoptosis by affecting gene transcription and regulation [38,39]. The NF-κB signaling pathway is a key regulatory pathway for immune response, apoptosis, and differentiation [40]. In our study, pathway enrichment analysis showed that the m6A differential methylation peaks were mainly enriched in the MAPK signaling pathway, NF-κB signaling pathway, Ras signaling pathway, and Hippo signaling pathway. This evidence also indicates that m6A modification is probably associated with mastitis.
Nevertheless, in the combined analysis of mRNA-seq and MeRIP-seq, we found a weak correlation [41] of m6A modification and mRNA expression between the E. coli group and the control group. Meanwhile, there were 212 genes in the E. coli group that exhibited differential methylation with significant differential expression of mRNA compared with the Con group (Figure 5a,b). The change in expression of these genes may be closely related to m6A modification [42]. These 212 genes (Table 3) included BAD, a protein in the BCL-2 family which plays a key role in mitochondrial-dependent apoptosis and participates in the development of many diseases by regulating cell death [43,44,45]. TMEM214 was also included, which acts as an anchor for the recruitment of procaspase 4 to the endoplasmic reticulum and its subsequent activation, and which is essential for endoplasmic reticulum stress-induced apoptosis [46]. MAP3K2, MAP2K1, and MAPK12 were also identified. Belonging to the MAPK cascade family of molecules, these proteins participate in important biological processes such as cell proliferation, differentiation, and immune response [34,35]. Whether the difference in m6A modification of these molecules affected the changes in their mRNA levels and, in turn, affected the release of inflammatory factors and the occurrence of cell apoptosis requires further experimental confirmation. In addition to affecting mRNA expression, m6A modification has many other functions, such as affecting the splicing of mRNA precursors, regulating the nuclear export of RNA, regulating mRNA translation, and affecting the stability of mRNAs [47,48]. The genes that did not exhibit expression changes may have one or more of these functions, which should be confirmed by further experiments.
The model established using inactivated bacteria retained the main infectious components of E. coli, while avoiding bacterial growth and apoptosis. Inactivated bacterial infection model experiments have been widely recognized and applied in many mastitis studies [49,50,51]. Although MAC-T cells cannot fully represent the microenvironment during the natural infection process of mastitis, MECs are the first barrier in mastitis, not macrophages or neutrophils [30,51,52]. Therefore, MECs are suitable in vitro models for mastitis. We suspect that m6A modification affects the transcription and translation of mRNA in MAC-T cells treated with E. coli and, in turn, affects physiological and pathological processes such as inflammatory release and cell apoptosis (Figure 6). However, the mechanism of m6A-regulated mastitis in dairy cows is not clearly understood. Through the use of advanced technologies, we provide the first m6A transcriptome profile of mastitis and an initial map revealing the function of m6A modification in mastitis, thereby contributing critical insights for further research on the role of m6A in mastitis.

4. Materials and Methods

4.1. Bacteria Strains and Cell Line

E. coli (ATCC 25922) was donated by associated Professor Wang Xiangru of Huazhong Agricultural University, respectively. E. coli was resuscitated in LB (Luria–Bertani) solid medium. Single colonies were grown at 37 °C overnight. A single bacteria colony was used to inoculate culture bottle containing 10 mL LB broth and incubated in a shaker for 220 r/min. After counting the bacteria, the bacteria were heat-inactivated at 63 °C for 30 min.
MAC-T cells (an immortalized bovine mammary epithelial cell line) were donated by Professor Mark Hanigan of Virginia Tech University. The culture medium formulations of MAC-T cell differed from those reported in the literature [10]. MAC-T cells were cultured in DME/F12 medium (Hyclone, Tauranga, New Zealand) supplemented with 10% fetal bovine serum (Gibco, New York, NY, USA), and incubated at 37 °C in a 5% CO2 humidified incubator. The cells were digested and passaged using 0.25% trypsin and 0.02% EDTA.

4.2. Sample Collection and RNA Extraction

Trypsinized MAC-T cells were counted and seeded in a cell culture dish (Corning, New York, NY, USA) with 106 cells per well. After 12 h, the DME/F12 maintenance medium containing 2% FBS was replaced. Three groups of cells were set up in triplicate. To the control group (Con) was added only the LB broth. The E. coli group was induced with 107 inactivated E. coli at a multiplicity of infection (MOI) of 10:1 and incubated for 24 h. The medium was discarded, and the cells were gently washed thrice using cold PBS (Hyclone, Tauranga, New Zealand), before adding 1 mL of TRIzol reagent (Invitrogen, Carlsbad, CA, USA) to each well for RNA cell lysate collection.
Total RNA was extracted according to the commercial reagent manufacturer’s instructions (Invitrogen) and RNA isolation procedures. The NanoDrop 2000 instrument (Thermo Fischer Scientific, Waltham, MA, USA) was used to measure the RNA concentrations, and the RNA purity index was denoted by an OD260/OD280 value between 1.80 and 2.10. The integrity of the sample RNA and potential gDNA contamination were assessed using agarose gel electrophoresis.

4.3. Real-Time Quantitative PCR

HiScript reverse transcriptase (Vazyme, Nanjing, China) was used to reverse-transcribe the RNA samples. The corresponding mixture of cDNA was configured according to AceQ SYBR® qPCR Master Mix (Vazyme), and the expression levels of IL-1β, IL-6, and TNF-α were detected using a ViiA7 Real-Time PCR System (Applied Biosystems Inc., Foster, CA, USA) instrument. The 2−ΔΔCt method was used for data analysis. Related primer sequences were as follows: β-actin F, AGATCAAGATCATCGCGCCC and R, TAACGCAGCTAACAGTCCGC; IL-1β F, TTCCATATTCCTCTTGGGGTAGA and R, AAATGAACCGAGAAGTGGTGTT; IL-6 F, CAGCAGGTCAGTGTTTGTGG and R, CTGGGTTCAATCAGGCGAT; TNF-α F, TCTTCTCAAGCCTCAAGTAACAAGC and R, CCATGAGGGCATTGGCATAC.

4.4. Enzyme-Linked Immunosorbent Assay (ELISA)

Cell-free supernatants were collected from the groups of bacteria treatments and assayed for proinflammatory cytokines (IL-1β, IL-6, TNF-α) using an ELISA kit (Cusabio, Wuhan, China). Based on the manufacturer’s instructions, the OD of each sample was assessed with a microplate reader at 450 nm wavelength. A standard curve was constructed to calculate the concentration of the samples.

4.5. Flow Cytometry

MAC-T cells were digested with trypsin without EDTA for 3 min. After stopping the digestion with DMEM/F12 containing 10% FBS, the cells were collected by centrifugation. After washing three times with PBS, the cells were re-suspended with 100 μL of Binding Buffer. Then, 5 μL each of FITC and PI dyes (Vazyme) were added and left for 10 min at room temperature in the dark. After adding 400 μL of Binding Buffer, the cells were detected using cytoflex-LX (Beckman Coulter, Indianapolis, IN, USA).

4.6. Methylated RNA Immunoprecipitation (MeRIP)

Firstly, the collected RNA was fragmented. Secondly, protein A magnetic beads (Thermo Fisher Scientific, Waltham, MA, USA) were incubated with anti-m6A antibody (abcam, Cambridge, UK) at room temperature for 1 h. Thirdly, the recovered RNA fragments were co-incubated with the mixture of magnetic beads and antibodies at 4 °C for 3 h. Fourthly, the above mixture was eluted with elution buffer, and the collected RNA was reverse-transcribed by HiScript reverse transcriptase. Lastly, the corresponding mixture of cDNA was configured according to AceQ SYBR® qPCR Master Mix (Vazyme), and the expression levels of BCL2 and TLR4 were detected using a ViiA7 Real-Time PCR System instrument. The percentage input method was used for data analysis, where % input = 2−(Average CTRIP − AverageCTinput − log2(input dilution factor)). Related primer sequences were as follows: TLR4 F, CCGGCTGGTTTTGGGAGAAT and R, ATGGTCAGGTTGCACAGTCC; BCL2 F, CAGTTGCTCTGCTGTTTGAGG and R, CATTACTCTAGTGCTCCCCGC.

4.7. MeRIP-seq and mRNA-seq

The extracted RNA samples were sent to Cloud-Seq Biotech (Shanghai, China) for MeRIP-seq and mRNA-seq analyses (GSE 161050). Firstly, the fragmented RNA and m6A antibodies (Millipore, Burlington, MA, USA) were incubated in IP buffer at 4 °C for 2 h. Secondly, the mixture was immunoprecipitated with protein A magnetic beads (Thermo Fisher Scientific, Waltham, MA, USA) at 4 °C for 2 h. Thirdly, the RNA on the magnetic beads was eluted with a free m6A adenosine analogue and further extracted with TRIzol reagent. Lastly, the m6A IP samples and the input samples without immunoprecipitation were used for the NEBNext® Ultra II Directional RNA Library Prep Kit (New England Biolabs, Inc., Ipswich, MA, USA), and double-ended sequencing was performed on an Illumina Hiseq (Illumina, Inc., San Diego, CA, USA).

4.8. Bioinformatics Analysis

Image analysis, base recognition, and quality control were performed after sequencing to produce raw data of original reads. Next, Q30 quality control and Cutadapt software (V1.9.3) (http://code.google.com/p/cutadapt/, accessed on 25 March 2020) were used to remove the connector and low-quality reads, thereby obtaining high-quality clean reads (Table S1, Supplementary Materials). The reads were compared on the basis of the genome/transcriptome (bosTau9) using Hisat2 software (v2.0.4) [53], and the MACS software (v1.4.2) [54] was used to identify methylated mRNA peaks in each sample. IGV software (v2.4.10) [55] was used to visualize the matching of MeRIP and input on the genome. The Gene Ontology (GO) (http://www.geneontology.org, accessed on 27 April 2020) and Kyoto Encyclopedia of Genes and Genomes (KEGG) (http://www.genome.jp/keg, accessed on 27 April 2020) databases were used to analyze differentially methylated genes.

4.9. Statistical Analysis

Data analysis was performed using GraphPad Prism v7.0 software, and values are reported as the mean ± standard deviation (SD) of at least three replicates in each group. A p-value of <0.05 was considered statistically significant (*, **, and *** represent p < 0.05, p < 0.01, and p < 0.001, respectively).

5. Conclusions

Our findings clearly profile the m6A methylation of E. coli-induced MAC-T cells and identify many differentially methylated genes, which may contribute to the diagnosis and treatment of mastitis. These results are the first to elucidate a potentially meaningful relationship between m6A modification and dairy cow mastitis, laying the foundation for future studies of m6A modification in mastitis.

Supplementary Materials

The following are available online at https://www.mdpi.com/article/10.3390/ijms22126254/s1, Figure S1: Overview of the m6A methylation map in the Con and E. coli groups, Table S1:The detailed information of the raw data, Table S2: Differentially methylated RNA sites for: E. coli vs. Con.

Author Contributions

Conceptualization, T.L. and C.H.; methodology, T.L. and Y.Z.; software, T.L. and C.L.; validation, T.L., C.L., Y.Z., H.X. and C.W.; formal analysis, T.L. and Y.Y.; investigation, T.L. and X.T.; resources, T.L., C.H. and T.S.; data curation, T.L. and C.H.; writing—original draft preparation, T.L.; writing—review and editing, C.H.; visualization, T.L.; supervision, C.H.; project administration, C.H., A.G. and Y.C.; funding acquisition, C.H., A.G. All authors have read and agreed to the published version of the manuscript.

Funding

This research was funded by the National Key Research and Development Plan (No. 2016YFD0500906) and the special fund for the China Agriculture Research System (Beef/Yak cattle) (No. CARS-37), National Natural Science Foundation of China (No. 31101874, 31972758), Key R & D program of Hubei province of China (No. 2020BBA055) and the Research Fund for National Distinguished Scholars in Agriculture Research and Technical Innovative Team.

Institutional Review Board Statement

Not applicable.

Informed Consent Statement

Not applicable.

Data Availability Statement

Acknowledgments

We thank the technical support and the platform of Huazhong Agricultural University and the State Key Laboratory of Agricultural Microbiology (Wuhan, China). We thank our coworkers’ advice and help.

Conflicts of Interest

The authors declare no conflict of interest.

References

  1. Monistero, V.; Graber, H.U.; Pollera, C.; Cremonesi, P.; Castiglioni, B.; Bottini, E.; Ceballos-Marquez, A.; Lasso-Rojas, L.; Kroemker, V.; Wente, N.; et al. Staphylococcus aureus Isolates from Bovine Mastitis in Eight Countries: Genotypes, Detection of Genes Encoding Different Toxins and Other Virulence Genes. Toxins 2018, 10, 247. [Google Scholar] [CrossRef] [Green Version]
  2. Rivas, A.L.; Tadevosyan, R.; Quimby, F.W.; Coksaygan, T.; Lein, D.H. Identification of subpopulations of bovine mammary-gland phagocytes and evaluation of sensitivity and specificity of morphologic and functional indicators of bovine mastitis. Can. J. Vet. Res. 2002, 66, 165. [Google Scholar] [PubMed]
  3. Günther, J.; Petzl, W.; Zerbe, H.; Schuberth, H.-J.; Koczan, D.; Goetze, L.; Seyfert, H.-M. Lipopolysaccharide priming enhances expression of effectors of immune defence while decreasing expression of pro-inflammatory cytokines in mammary epithelia cells from cows. BMC Genom. 2012, 13. [Google Scholar] [CrossRef] [PubMed] [Green Version]
  4. Islam, A.; Takagi, M.; Fukuyama, K.; Komatsu, R.; Albarracin, L.; Nochi, T.; Suda, Y.; Ikeda-Ohtsubo, W.; Rutten, V.; Van Eden, W.; et al. Transcriptome Analysis of The Inflammatory Responses of Bovine Mammary Epithelial Cells: Exploring Immunomodulatory Target Genes for Bovine Mastitis. Pathogens 2020, 9, 200. [Google Scholar] [CrossRef]
  5. Rainard, P.; Repérant-Ferter, M.; Gitton, C.; Germon, P. Shielding Effect of Escherichia coli O-Antigen Polysaccharide on J5-Induced Cross-Reactive Antibodies. mSphere 2021, 6. [Google Scholar] [CrossRef] [PubMed]
  6. Vangroenweghe, F.; Lamote, I.; Burvenich, C. Physiology of the periparturient period and its relation to severity of clinical mastitis. Domest. Anim. Endocrinol. 2005, 29. [Google Scholar] [CrossRef]
  7. Burvenich, C.; Mehrzad, J.; Diez-Fraile, A.; Duchateau, L. Severity of E. coli mastitis is mainly determined by cow factors. Vet. Res. 2003, 34. [Google Scholar] [CrossRef] [Green Version]
  8. Ashraf, A.; Imran, M. Causes, types, etiological agents, prevalence, diagnosis, treatment, prevention, effects on human health and future aspects of bovine mastitis. Anim. Health Res. Rev. 2020. [Google Scholar] [CrossRef]
  9. Jensen, K.; Günther, J.; Talbot, R.; Petzl, W.; Zerbe, H.; Schuberth, H.-J.; Seyfert, H.-M.; Glass, E.J. Escherichia coli- and Staphylococcus aureus-induced mastitis differentially modulate transcriptional responses in neighbouring uninfected bovine mammary gland quarters. BMC Genom. 2013, 14. [Google Scholar] [CrossRef] [Green Version]
  10. Ibeagha-Awemu, E.; Ibeagha, A.E.; Messier, S.; Zhao, X. Proteomics, genomics, and pathway analyses of Escherichia coli and Staphylococcus aureus infected milk whey reveal molecular pathways and networks involved in mastitis. J. Proteome Res. 2010, 9. [Google Scholar] [CrossRef]
  11. Günther, J.; Petzl, W.; Bauer, I.; Ponsuksili, S.; Zerbe, H.; Schuberth, H.-J.; Brunner, R.M.; Seyfert, H.-M. Differentiating Staphylococcus aureus from Escherichia coli mastitis: S. aureus triggers unbalanced immune-dampening and host cell invasion immediately after udder infection. Sci. Rep. 2017, 7. [Google Scholar] [CrossRef] [PubMed]
  12. Long, E.; Capuco, A.V.; Wood, D.L.; Sonstegard, T.; Tomita, G.; Paape, M.J.; Zhao, X. Escherichia coli induces apoptosis and proliferation of mammary cells. Cell Death Differ. 2001, 8. [Google Scholar] [CrossRef] [Green Version]
  13. Deng, X.; Chen, K.; Luo, G.-Z.; Weng, X.; Ji, Q.; Zhou, T.; He, C. Widespread occurrence of N6-methyladenosine in bacterial mRNA. Nucleic Acids Res. 2015, 43. [Google Scholar] [CrossRef] [PubMed] [Green Version]
  14. Meyer, K.; Jaffrey, S.R. The dynamic epitranscriptome: N6-methyladenosine and gene expression control. Nat. Rev. Mol. Cell Biol. 2014, 15. [Google Scholar] [CrossRef] [PubMed] [Green Version]
  15. Desrosiers, R.; Friderici, K.; Rottman, F. Identification of methylated nucleosides in messenger RNA from Novikoff hepatoma cells. Proc. Natl. Acad. Sci. USA 1974, 71. [Google Scholar] [CrossRef] [PubMed] [Green Version]
  16. Perry, R.P.; Kelley, D.E.; Friderici, K.; Rottman, F. The methylated constituents of L cell messenger RNA: Evidence for an unusual cluster at the 5′ terminus. Cell 1975, 4. [Google Scholar] [CrossRef]
  17. Roundtree, I.A.; Evans, M.E.; Pan, T.; He, C. Dynamic RNA Modifications in Gene Expression Regulation. Cell 2017, 169. [Google Scholar] [CrossRef] [Green Version]
  18. Wang, Y.; Li, Y.; Toth, J.I.; Petroski, M.D.; Zhang, Z.; Zhao, J.C. N6-methyladenosine modification destabilizes developmental regulators in embryonic stem cells. Nat. Cell Biol. 2014, 16. [Google Scholar] [CrossRef]
  19. Liu, J.; Yue, Y.; Han, D.; Wang, X.; Fu, Y.; Zhang, L.; Jia, G.; Yu, M.; Lu, Z.; Deng, X.; et al. A METTL3-METTL14 complex mediates mammalian nuclear RNA N6-adenosine methylation. Nat. Chem. Biol. 2014, 10. [Google Scholar] [CrossRef] [Green Version]
  20. Wu, B.; Li, L.; Huang, Y.; Ma, J.; Min, J. Readers, writers and erasers of N(6)-methylated adenosine modification. Curr. Opin. Struct. Biol. 2017, 47. [Google Scholar] [CrossRef]
  21. Shi, H.; Zhang, X.; Weng, Y.-L.; Lu, Z.; Liu, Y.; Lu, Z.; Li, J.; Hao, P.; Zhang, Y.; Zhang, F.; et al. m(6)A facilitates hippocampus-dependent learning and memory through YTHDF1. Nature 2018, 563. [Google Scholar] [CrossRef]
  22. Visvanathan, A.; Somasundaram, K. mRNA Traffic Control Reviewed: N6-Methyladenosine (m(6) A) Takes the Driver’s Seat. Bioessays 2018, 40. [Google Scholar] [CrossRef]
  23. Laffleur, B.; Basu, U. Biology of RNA Surveillance in Development and Disease. Trends Cell Biol. 2019, 29. [Google Scholar] [CrossRef]
  24. Chen, Y.G.; Chen, R.; Ahmad, S.; Verma, R.; Kasturi, S.P.; Amaya, L.; Broughton, J.P.; Kim, J.; Cadena, C.; Pulendran, B.; et al. N6-Methyladenosine Modification Controls Circular RNA Immunity. Mol. Cell 2019, 76. [Google Scholar] [CrossRef] [PubMed]
  25. Yu, R.; Li, Q.; Feng, Z.; Cai, L.; Xu, Q. m6A Reader YTHDF2 Regulates LPS-Induced Inflammatory Response. Int. J. Mol. Sci. 2019, 20, 1323. [Google Scholar] [CrossRef] [Green Version]
  26. Zhu, S.; Lu, Y. Dexmedetomidine Suppressed the Biological Behavior of HK-2 Cells Treated with LPS by Down-Regulating ALKBH5. Inflammation 2020, 43. [Google Scholar] [CrossRef]
  27. Wei, C.M.; Gershowitz, A.; Moss, B. 5′-Terminal and internal methylated nucleotide sequences in HeLa cell mRNA. Biochemistry 1976, 15. [Google Scholar] [CrossRef] [PubMed]
  28. Schibler, U.; Kelley, D.E.; Perry, R.P. Comparison of methylated sequences in messenger RNA and heterogeneous nuclear RNA from mouse L cells. J. Mol. Biol. 1977, 115. [Google Scholar] [CrossRef]
  29. Zhang, H.; Shi, X.; Huang, T.; Zhao, X.; Chen, W.; Gu, N.; Zhang, R. Dynamic landscape and evolution of m6A methylation in human. Nucleic Acids Res. 2020, 48. [Google Scholar] [CrossRef] [PubMed]
  30. Petzl, W.; Zerbe, H.; Günther, J.; Seyfert, H.-M.; Hussen, J.; Schuberth, H.-J. Pathogen-specific responses in the bovine udder. Models and immunoprophylactic concepts. Res. Vet. Sci. 2018, 116. [Google Scholar] [CrossRef]
  31. Zhang, S.-Y.; Zhang, S.-W.; Fan, X.-N.; Meng, J.; Chen, Y.; Gao, S.-J.; Huang, Y. Global analysis of N6-methyladenosine functions and its disease association using deep learning and network-based methods. PLoS Comput. Biol. 2019, 15. [Google Scholar] [CrossRef] [Green Version]
  32. Siddiqui, W.A.; Ahad, A.; Ahsan, H. The mystery of BCL2 family: Bcl-2 proteins and apoptosis: An update. Arch. Toxicol. 2015, 89. [Google Scholar] [CrossRef] [PubMed]
  33. Kale, J.; Osterlund, E.J.; Andrews, D. BCL-2 family proteins: Changing partners in the dance towards death. Cell Death Differ. 2018, 25. [Google Scholar] [CrossRef] [Green Version]
  34. Liang, Y.-J.; Yang, W.-X. Kinesins in MAPK cascade: How kinesin motors are involved in the MAPK pathway? Gene 2019, 684. [Google Scholar] [CrossRef] [PubMed]
  35. Egaestel, M. MAPK-Activated Protein Kinases (MKs): Novel Insights and Challenges. Front. Cell Dev. Biol. 2015, 3. [Google Scholar] [CrossRef] [Green Version]
  36. Kawai, T.; Akira, S. TLR signaling. Semin. Immunol. 2007, 19. [Google Scholar] [CrossRef]
  37. Ryu, J.-K.; Kim, S.J.; Rah, S.-H.; Kang, J.I.; Jung, H.E.; Lee, D.; Lee, H.K.; Lee, J.-O.; Park, B.S.; Yoon, T.-Y.; et al. Reconstruction of LPS Transfer Cascade Reveals Structural Determinants within LBP, CD14, and TLR4-MD2 for Efficient LPS Recognition and Transfer. Immunity 2017, 46. [Google Scholar] [CrossRef] [PubMed] [Green Version]
  38. Sui, X.; Kong, N.; Ye, L.; Han, W.; Zhou, J.; Zhang, Q.; He, C.; Pan, H. p38 and JNK MAPK pathways control the balance of apoptosis and autophagy in response to chemotherapeutic agents. Cancer Lett. 2014, 344. [Google Scholar] [CrossRef]
  39. Yue, J.; López, J.M. Understanding MAPK Signaling Pathways in Apoptosis. Int. J. Mol. Sci. 2020, 21, 2346. [Google Scholar] [CrossRef] [PubMed] [Green Version]
  40. Oeckinghaus, A.; Hayden, M.; Ghosh, S. Crosstalk in NF-κB signaling pathways. Nat. Immunol. 2011, 12. [Google Scholar] [CrossRef]
  41. Faul, F.; Erdfelder, E.; Lang, A.-G.; Buchner, A. G*Power 3: A flexible statistical power analysis program for the social, behavioral, and biomedical sciences. Behav. Res. Methods 2007, 39. [Google Scholar] [CrossRef]
  42. Berulava, T.; Buchholz, E.; Elerdashvili, V.; Pena, T.; Islam, R.; Lbik, D.; Mohamed, B.A.; Renner, A.; Von Lewinski, D.; Sacherer, M.; et al. Changes in m6A RNA methylation contribute to heart failure progression by modulating translation. Eur. J. Heart Fail. 2020, 22. [Google Scholar] [CrossRef] [PubMed] [Green Version]
  43. Danial, N.N.; Walensky, L.D.; Zhang, C.-Y.; Choi, C.S.; Fisher, J.K.; Molina, A.J.A.; Datta, S.R.; Pitter, K.L.; Bird, G.H.; Wikstrom, J.D.; et al. Dual role of proapoptotic BAD in insulin secretion and beta cell survival. Nat. Med. 2008, 14. [Google Scholar] [CrossRef] [PubMed] [Green Version]
  44. Sastry, K.S.R.; Al-Muftah, M.A.; Li, P.; Al-Kowari, M.K.; Wang, E.; Chouchane, A.I.; Kizhakayil, D.; Kulik, G.; Marincola, F.M.; Haoudi, A.; et al. Targeting proapoptotic protein BAD inhibits survival and self-renewal of cancer stem cells. Cell Death Differ. 2014, 21. [Google Scholar] [CrossRef] [Green Version]
  45. Yan, J.; Zhang, H.; Xiang, J.; Zhao, Y.; Yuan, X.; Sun, B.; Lin, A. The BH3-only protein BAD mediates TNFα cytotoxicity despite concurrent activation of IKK and NF-κB in septic shock. Cell Res. 2018, 28. [Google Scholar] [CrossRef]
  46. Li, C.; Wei, J.; Li, Y.; He, X.; Zhou, Q.; Yan, J.; Zhang, J.; Liu, Y.; Shu, H.-B. Transmembrane Protein 214 (TMEM214) mediates endoplasmic reticulum stress-induced caspase 4 enzyme activation and apoptosis. J. Biol. Chem. 2013, 288. [Google Scholar] [CrossRef] [Green Version]
  47. Niu, Y.; Zhao, X.; Wu, Y.-S.; Li, M.-M.; Wang, X.-J.; Yang, Y.-G. N6-methyl-adenosine (m6A) in RNA: An old modification with a novel epigenetic function. Genom. Proteom. Bioinform. 2013, 11. [Google Scholar] [CrossRef] [PubMed] [Green Version]
  48. Lin, X.; Chai, G.; Wu, Y.; Li, J.; Chen, F.; Liu, J.; Luo, G.; Tauler, J.; Du, J.; Lin, S.; et al. RNA m(6)A methylation regulates the epithelial mesenchymal transition of cancer cells and translation of Snail. Nat. Commun. 2019, 10. [Google Scholar] [CrossRef]
  49. Gilbert, F.B.; Cunha, P.; Jensen, K.; Glass, E.J.; Foucras, G.; Robert-Granié, C.; Rupp, R.; Rainard, P. Differential response of bovine mammary epithelial cells to Staphylococcus aureus or Escherichia coli agonists of the innate immune system. Vet. Res. 2013, 44. [Google Scholar] [CrossRef] [Green Version]
  50. Jin, W.; Ibeagha-Awemu, E.M.; Liang, G.; Beaudoin, F.; Zhao, X.; Guan, L.L. Transcriptome microRNA profiling of bovine mammary epithelial cells challenged with Escherichia coli or Staphylococcus aureus bacteria reveals pathogen directed microRNA expression profiles. BMC Genom. 2014, 15. [Google Scholar] [CrossRef] [Green Version]
  51. Günther, J.; Koczan, D.; Yang, W.; Nürnberg, G.; Repsilber, D.; Schuberth, H.-J.; Park, Z.; Maqbool, N.; Molenaar, A.; Seyfert, H.-M. Assessment of the immune capacity of mammary epithelial cells: Comparison with mammary tissue after challenge with Escherichia coli. Vet. Res. 2009, 40. [Google Scholar] [CrossRef] [PubMed] [Green Version]
  52. Günther, J.; Koy, M.; Berthold, A.; Schuberth, H.-J.; Seyfert, H.-M. Comparison of the pathogen species-specific immune response in udder derived cell types and their models. Vet. Res. 2016, 47. [Google Scholar] [CrossRef] [Green Version]
  53. Kim, D.; Langmead, B.; Salzberg, S.L. HISAT: A fast spliced aligner with low memory requirements. Nat. Methods 2015, 12. [Google Scholar] [CrossRef] [PubMed] [Green Version]
  54. Zhang, Y.; Liu, T.; Meyer, C.A.; Eeckhoute, J.; Johnson, D.S.; Bernstein, B.E.; Nusbaum, C.; Myers, R.M.; Brown, M.; Li, W.; et al. Model-based analysis of ChIP-Seq (MACS). Genome Biol. 2008, 9. [Google Scholar] [CrossRef] [PubMed] [Green Version]
  55. Thorvaldsdóttir, H.; Robinson, J.T.; Mesirov, J.P. Integrative Genomics Viewer (IGV): High-performance genomics data visualization and exploration. Brief Bioinform 2013, 14. [Google Scholar] [CrossRef] [Green Version]
Figure 1. Inflammatory factor expression and apoptotic cell rate in the mastitis model in vitro. (ac) Relative mRNA levels of IL-1β, IL-6, and TNF-α measured using real-time PCR in the Con and E. coli groups. (df) Concentrations of IL-1β, IL-6, and TNF-α measured using ELISA in the Con and E. coli groups. (g) The apoptotic cell rate in the Con and E. coli groups according to flow cytometry. Data are expressed as the mean ± standard deviation (SD) and analyzed using one-way analysis of variance; *, **, and *** represent p < 0.05, p < 0.01, and p < 0.001, respectively.
Ijms 22 06254 g001
Figure 2. Overview of m6A methylation map in Con and E. coli groups. (a) Venn diagram showing the specific and common peaks between two groups. (b) Venn diagram displaying the specific and common mRNA transcripts between the Con and E. coli groups. (c) RRACH sequence motif enrichment of the m6A peaks in the Con and E. coli groups. (d) Pie charts demonstrating m6A peak distribution in the gene structures of mRNAs. (e) Metagene plots displaying the regions of m6A peaks identified across the transcripts in the Con and E. coli groups. (f) The number of m6A peaks per gene in the Con and E. coli groups.
Ijms 22 06254 g002
Figure 3. Distribution of significantly differential peaks between the Con and E. coli groups. (a) Data visualization analysis of differential m6A peaks in selected mRNAs (BCL2, TIRAP, and TLR4) in the E. coli group compared with the Con group. MeRIP-qPCR verified the differential m6A modification in BCL2 (b) and TLR4 (c). (d) Distribution of differential m6A sites on bovine chromosomes.
Ijms 22 06254 g003
Figure 4. Biological function analysis of differential m6A modification according to GO biological processes (BPs) and KEGG pathways. The top 10 biological processes of hypermethylated mRNAs (a) and hypomethylated mRNAs (b) in the E. coli group. The top 10 enriched pathways of hypermethylated mRNAs (c) and hypomethylated mRNAs (d) in the E. coli group.
Ijms 22 06254 g004
Figure 5. Conjoint analysis of m6A methylation and mRNA expression. (a) Volcano plots showing the differentially expressed mRNAs between the E. coli and Con groups with statistical significance (fold change ≥2.0 and p < 0.05). (b) Heat map demonstrating the differentially expressed mRNAs in three E. coli input samples and three control input samples. (c) Correlation of expression and m6A modification of transcripts in the E. coli group compared with the Con group. (d) Four-quadrant graph displaying the distribution of differential transcripts with m6A methylation and expression in the E. coli group.
Ijms 22 06254 g005
Figure 6. Sketch showing the potential pathways for MAC-T cells treated with the E. coli.
Ijms 22 06254 g006
Table 1. The top 20 differently expresses m6A peaks between E. coli and controls based on p-value.
Gene NamePeak
Region
Peak
Start
Peak EndChromosomeLog10
(p-Value)
Log2
(Fold Change)
Regulation
TOR1AIP1startC61,095,20161,095,890NC_037343.1−9.641.09hyper
SYTL2CDS9,831,6419,831,860NC_037356.1−9.421.21hyper
HERC6startC36,366,46136,366,789NC_037333.1−8.981.44hyper
BHLHE41startC83,818,00183,818,465NC_037332.1−8.92.57hyper
GPR155CDS22,358,28622,358,700NC_037329.1−8.842.45hyper
IGFBP5stopC104,660,241104,660,804NC_037329.1−8.821.44hyper
TSPAN183′UTR75,001,04175,002,400NC_037342.1−8.681.74hyper
CENPU3′UTR15,119,10115,119,520NC_037354.1−8.641.73hyper
AKAP13CDS16,514,46316,514,712NC_037348.1−8.61.08hyper
RFX23′UTR18,396,04318,397,660NC_037334.1−8.581.03hyper
CLCA2CDS57,619,16057,619,431NC_037330.1−10.757.39hypo
NUDT193′UTR43,175,36143,175,740NC_037345.1−10.524.43hypo
FZD2CDS44,329,98144,330,600NC_037346.1−10.504.07hypo
LOC1019072555′UTR41,829,80141,830,640NC_037353.1−10.327.74hypo
LOC101903326CDS1,089,7211,090,900NC_037341.1−10.325.05hypo
HGFACCDS115,444,475115,444,760NC_037333.1−10.272.78hypo
GPR156CDS65,018,45265,018,905NC_037328.1−10.113.88hypo
AOAHCDS60,547,45160,547,800NC_037331.1−10.113.33hypo
AAR23′UTR65,379,40165,379,780NC_037340.1−10.093.98hypo
STRBP3′UTR94,269,36194,269,860NC_037338.1−10.094.54hypo
Table 2. Top 20 differential mRNA expression in E. coli vs. con.
Gene NameLog2 (Fold Change)Log10 (p-Value)Regulation
IER36.164040553−4.02169998up
PTGS25.826757014−3.467281725up
ERO1A5.669337971−3.536666229up
PRDX55.586646738−2.881586777up
HNRNPC5.556401381−2.802666029up
CA45.481535598−2.86568667up
SLC6A75.414589103−2.589570251up
TMCC35.325086008−2.488894255up
DDIT45.280240307−2.400378604up
SLC2A15.237809067−3.050012716up
TRIM13−8.101651804−7.866625717down
CD70−7.242189071−4.903814594down
DDX39A−7.027795258−4.414552565down
YEATS2−6.971898132−4.337112177down
RASGRP1−6.946317893−4.286252914down
PRPF38A−6.946269946−4.239872373down
CELSR3−6.935875444−4.464239943down
AQP11−6.664329625−3.773669927down
GAPDHS−6.638835912−3.724064388down
LOC112442013−6.591469341−3.591651156down
Table 3. All 20 transcripts of differential m6A modification and mRNA expression in E. coli vs. Con.
Gene NameChangeChromosomem6A Modification ChangemRNA Expression Change
Peak StartPeak EndPeak
Length
Peak
Region
logFCLog10 (p-Value)logFCp-ValueStrand
MAP3K2hyper-upNC_037329.15,150,4375,150,8203835′UTR2.49−6.974.0710.021139+
ECI1hyper-upNC_037352.11,765,1001,765,420320CDS2.33−5.304.070.023957+
ALKhyper-upNC_037338.170,660,38170,661,7601379CDS1.98−6.283.110.002504
CA4hyper-upNC_037346.112,807,57912,807,920341CDS13.42−7.905.480.001362+
SEMA6Bhyper-upNC_037334.119,583,61619,585,1601544CDS3.81−6.164.490.022398+
HK1hyper-downNC_037355.125,767,27825,767,520242CDS1.84−5.07−4.660.047763+
GAB2hyper-downNC_037356.117,787,96717,788,0701033′UTR1.85−5.68−2.710.042939+
MAP2K1hyper-downNC_037337.113,276,35313,276,7123595′UTR3.52−5.06−2.180.023033+
CTSBhyper-downNC_037335.17,566,0767,566,2281525′UTR1.73−5.81−5.220.015551+
EIF2AK4hyper-downNC_037337.135,645,63735,645,71780CDS1.69−5.17−3.560.00288+
USP1hypo-downNC_037330.183,118,46183,118,9204593′UTR1.60−6.82−1.670.023734
DDX58hypo-downNC_037335.111,604,22111,604,7004793′UTR3.30−8.74−5.000.021294+
FBN1hypo-downNC_037337.161,917,88161,918,380499CDS4.14−7.63−2.170.001185+
BADhypo-downNC_037356.142,573,69742,574,1975003′UTR1.56−5.22−4.350.045042
MAPK12hypo-downNC_037332.1119,619,701119,620,4407393′UTR6.15−6.27−4.730.043358
TMEM214hypo-upNC_037338.172,593,80172,594,1002993′UTR1.60−7.894.140.042666
STAT2hypo-upNC_037332.157,007,91057,008,239329CDS2.11−7.112.280.046055+
ACOX3hypo-upNC_037333.1114,662,000114,662,840840CDS2.14−5.174.060.045482
RASSF6hypo-upNC_037333.188,624,20188,624,5403393′UTR2.79−7.764.610.017354
ZNF385Ahypo-upNC_037332.125,706,60425,707,9591355CDS2.87−6.824.060.034321+
Publisher’s Note: MDPI stays neutral with regard to jurisdictional claims in published maps and institutional affiliations.

