
ZNF521 Enhances MLL-AF9-Dependent Hematopoietic Stem Cell Transformation in Acute Myeloid Leukemias by Altering the Gene Expression Landscape †

 , , , and
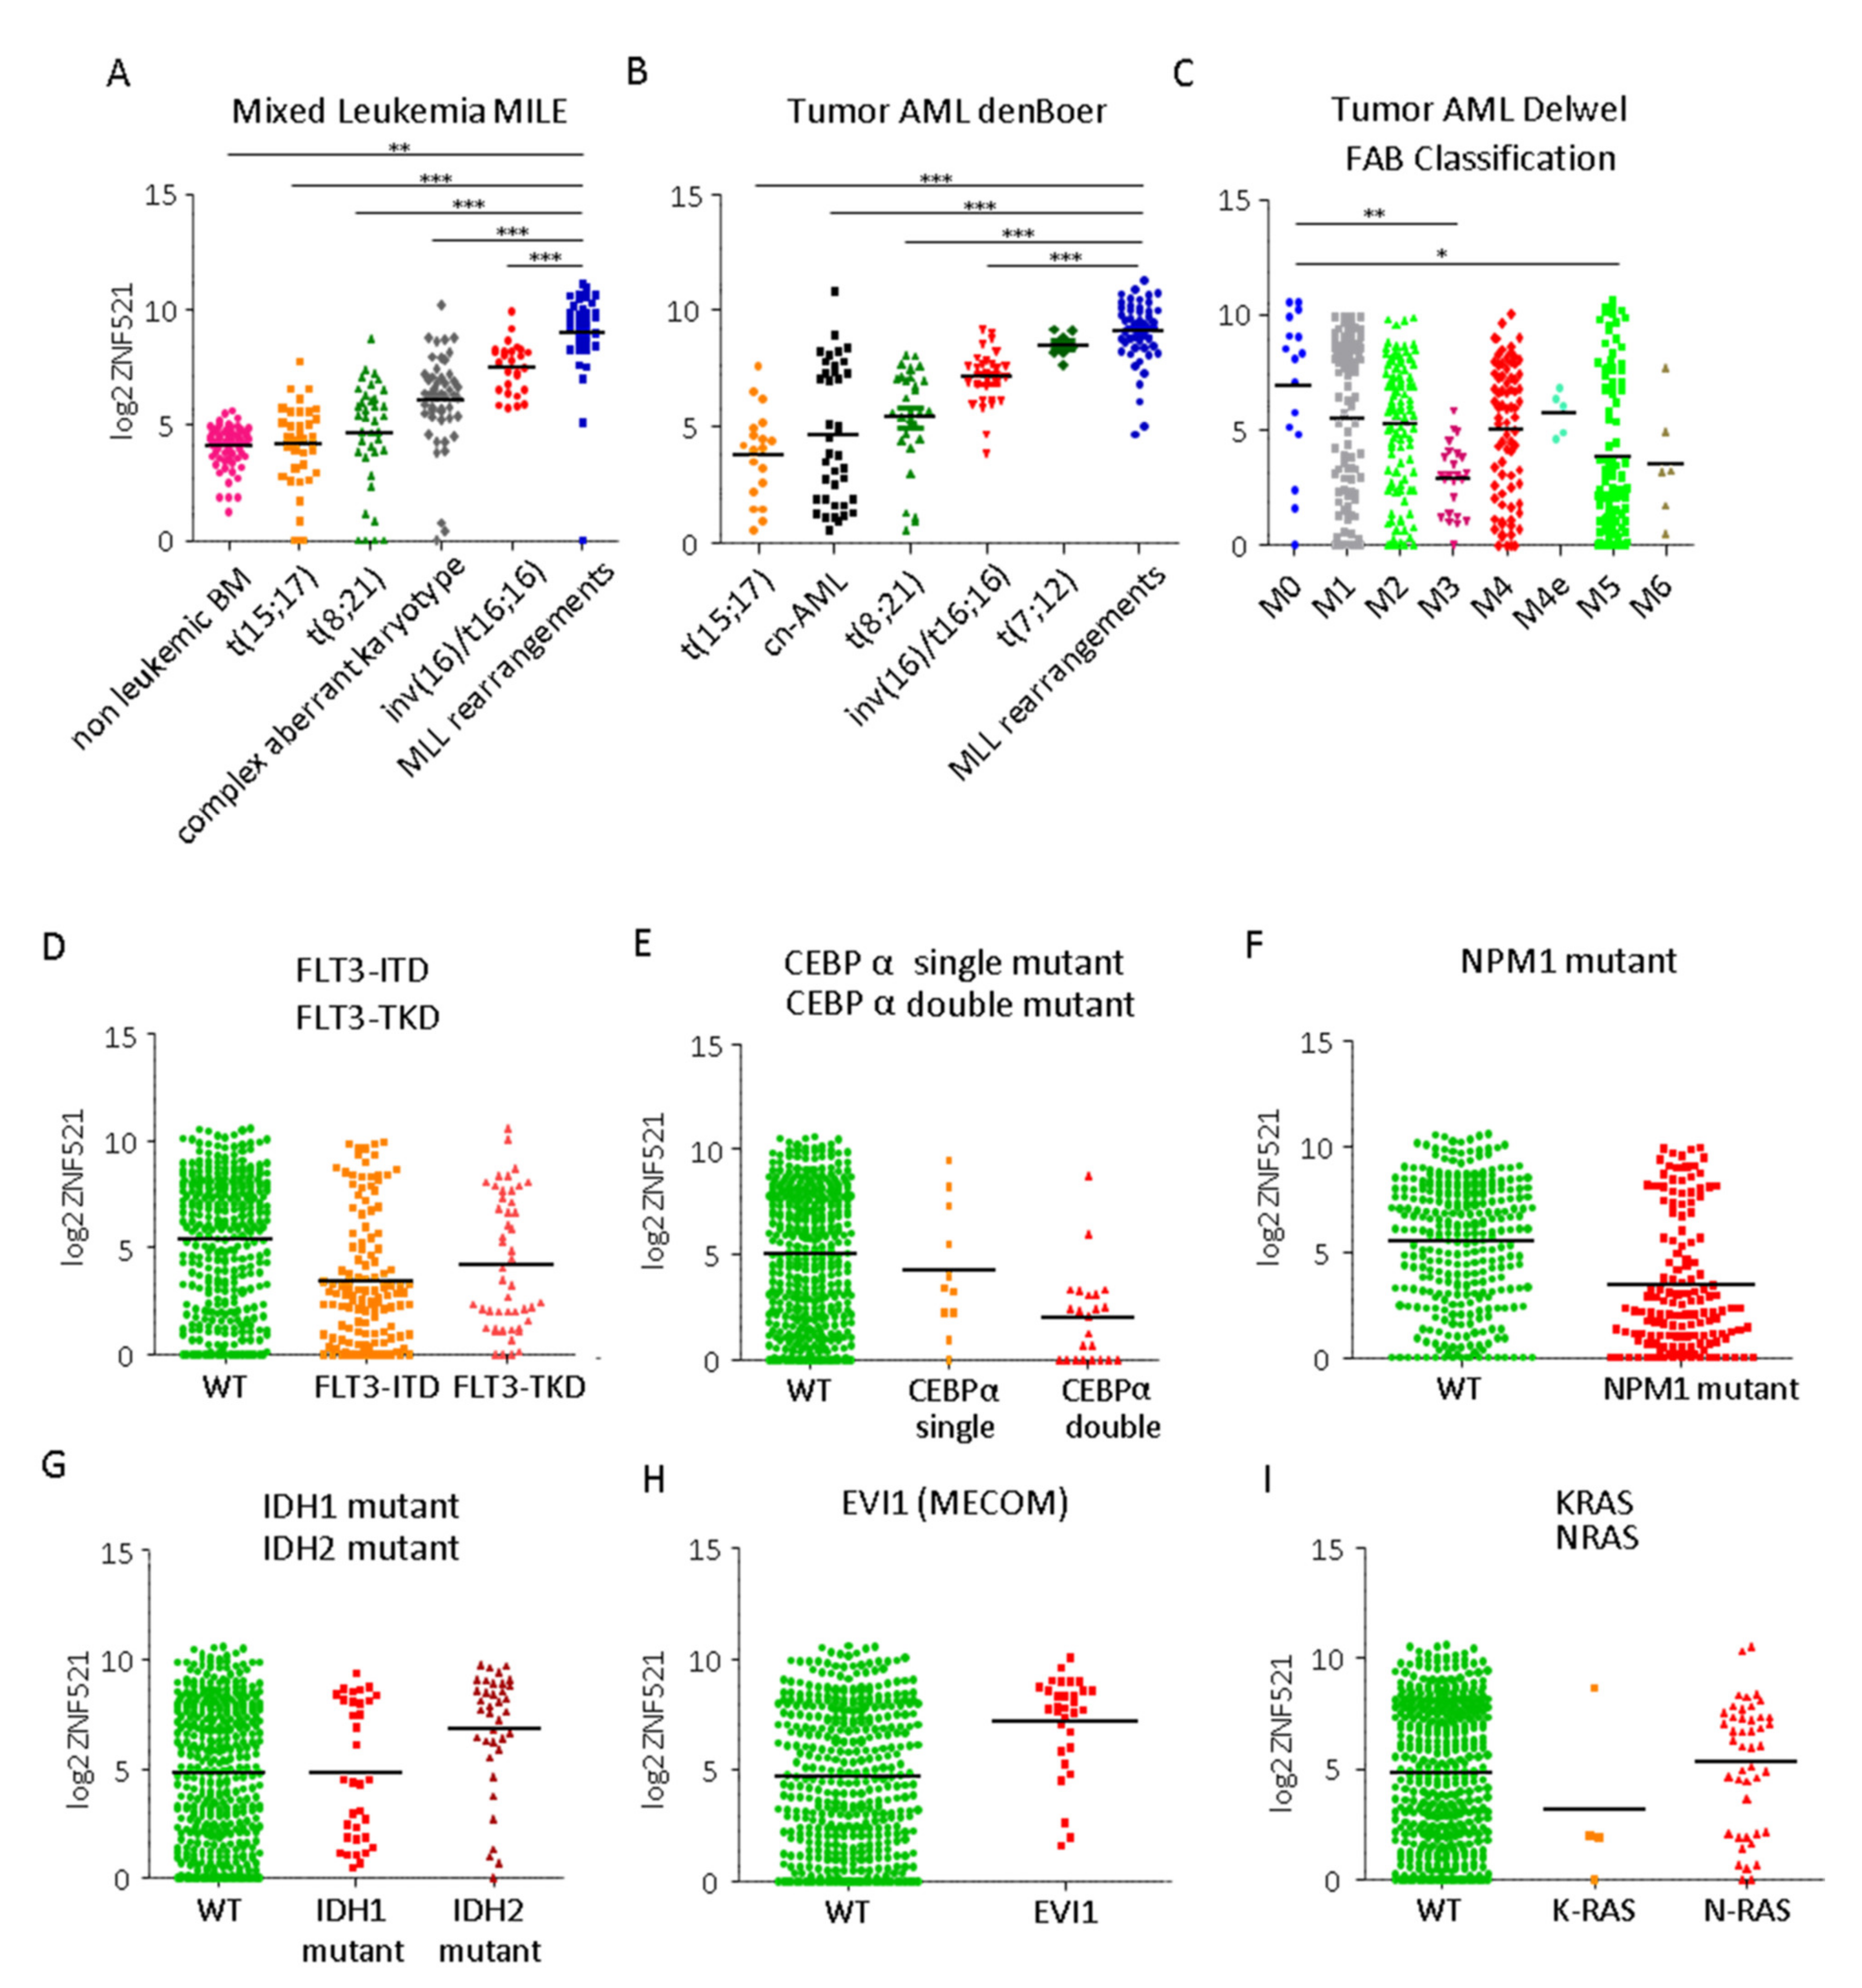
Abstract
:1. Introduction
2. Results
2.1. Differential Expression of the Transcription Co-Factor ZNF521 in AMLs: Correlation with Specific Cytogenetic Profiles
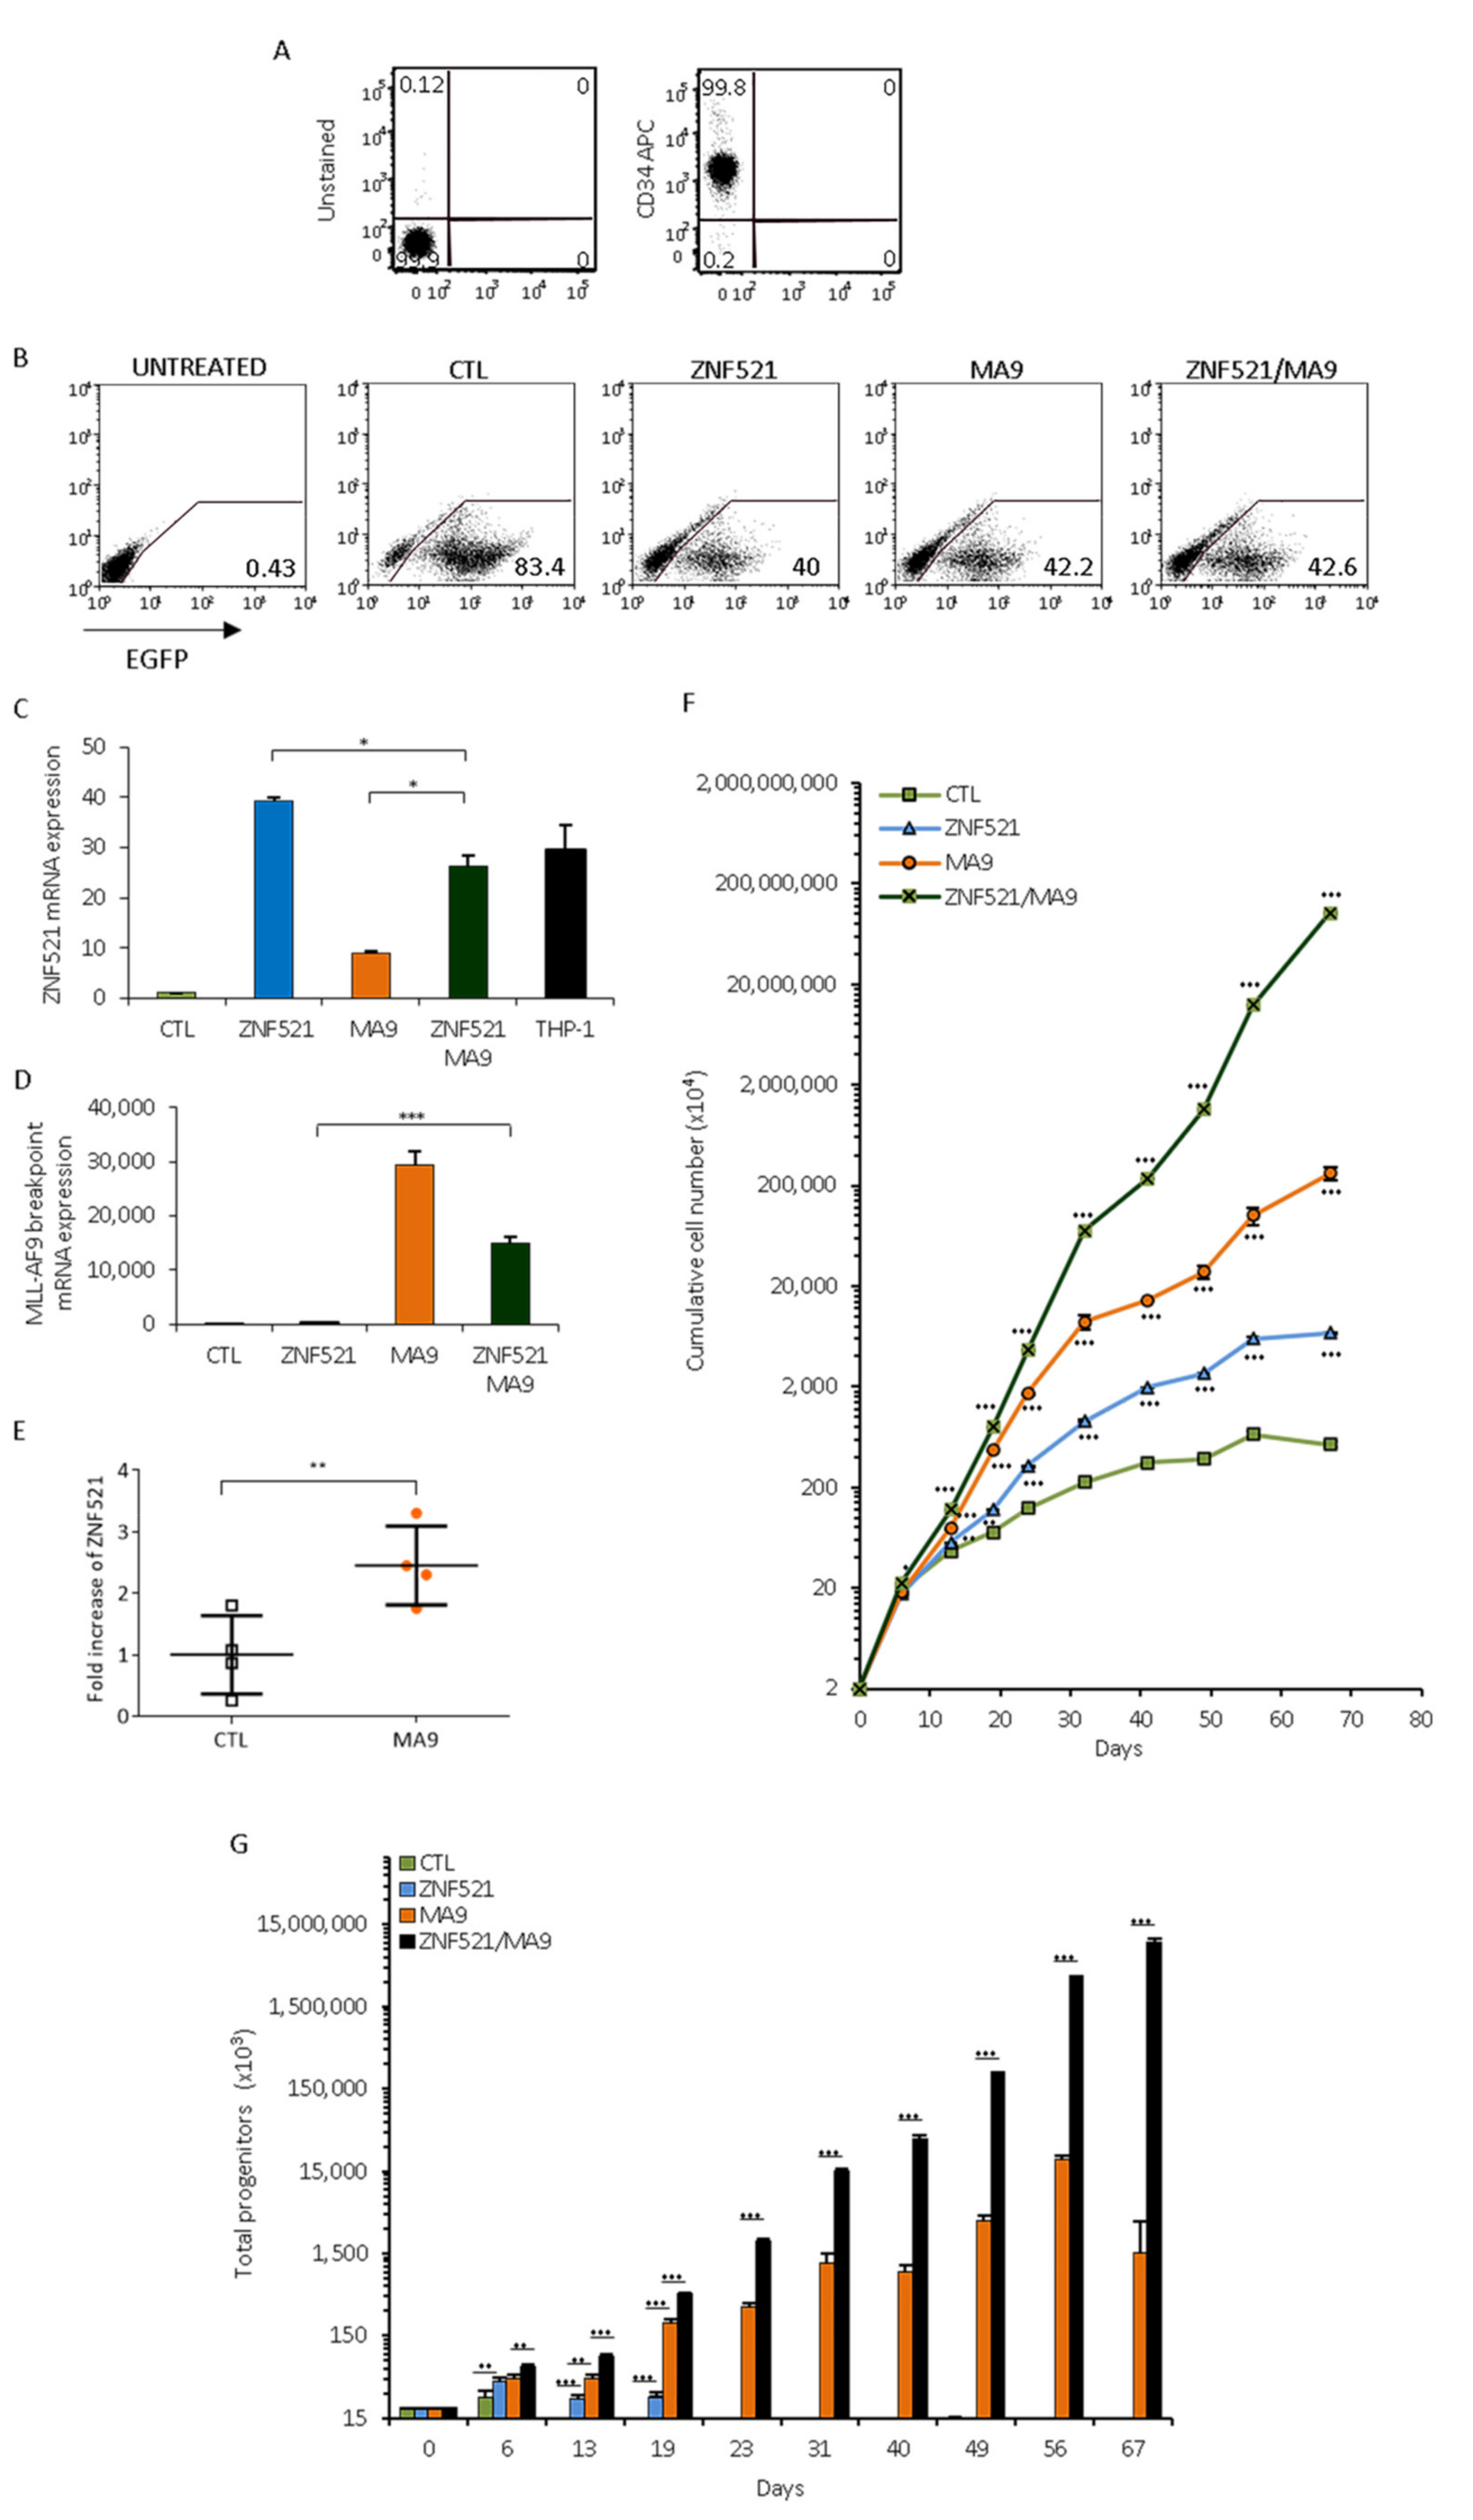
2.2. Over-Expression of Both MLL-AF9 and ZNF521 Genes Increases the Expansion of Umbilical CB-Derived Early Hematopoietic Progenitors In Vitro
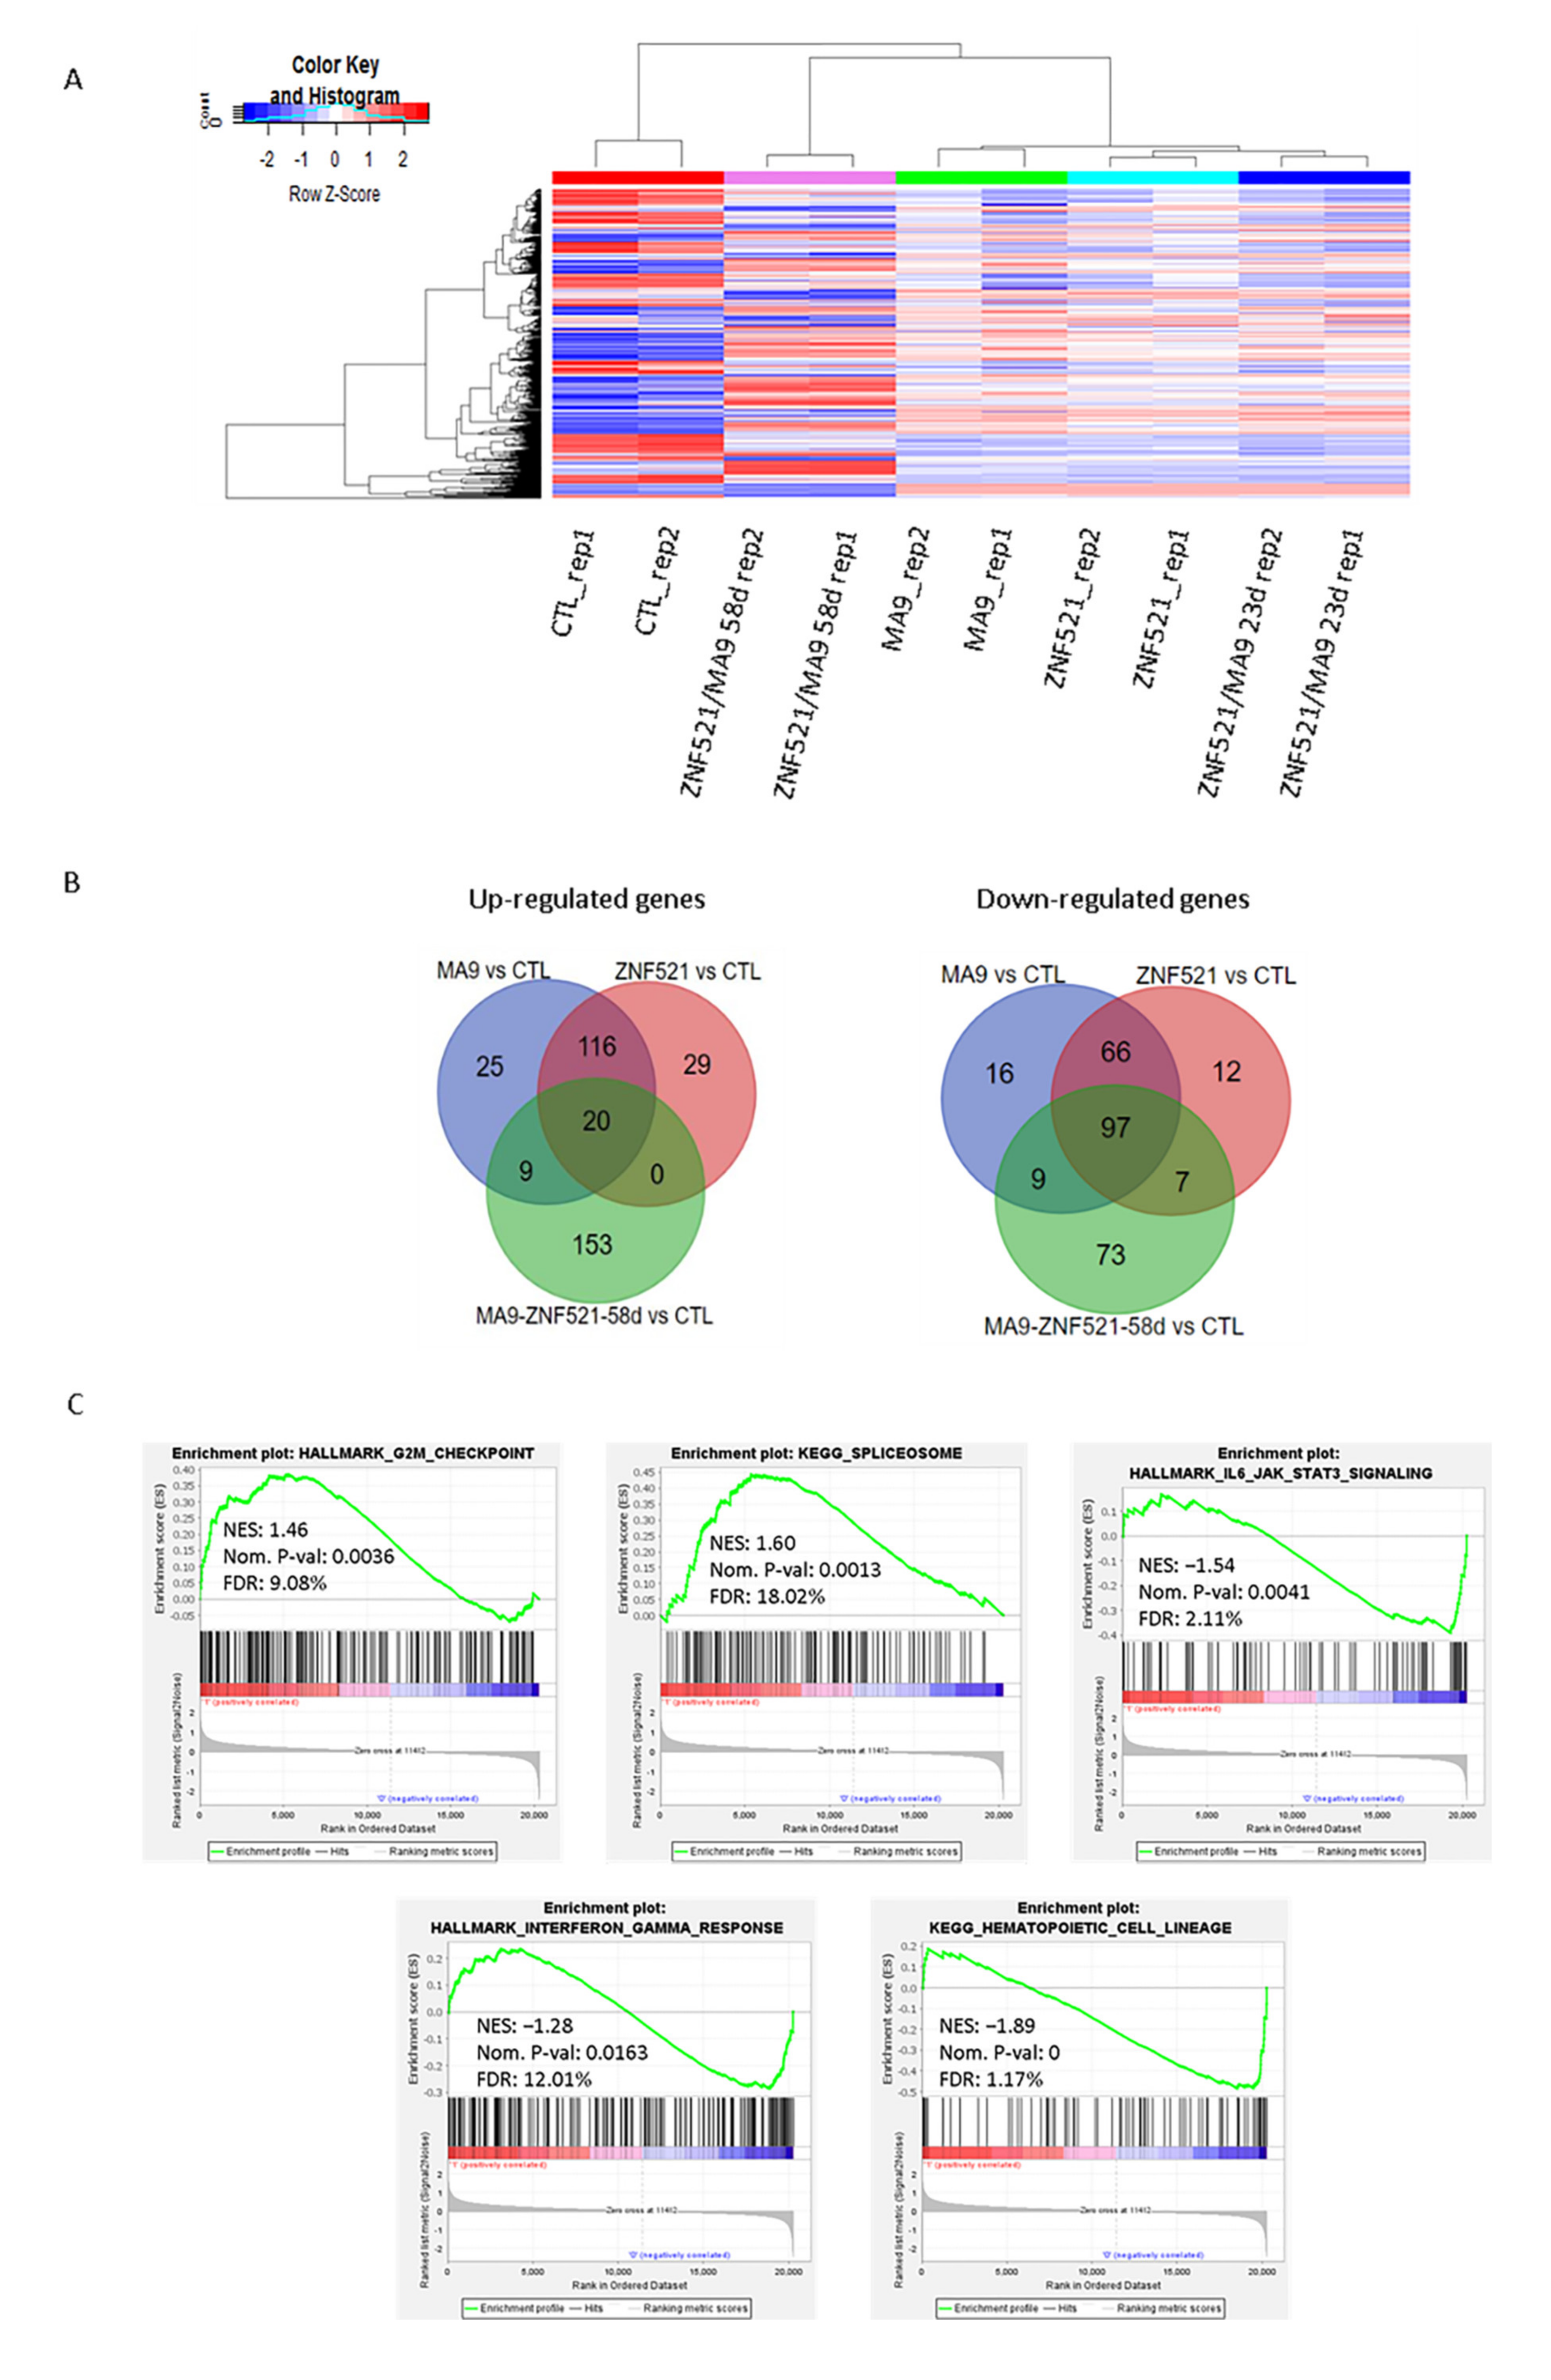
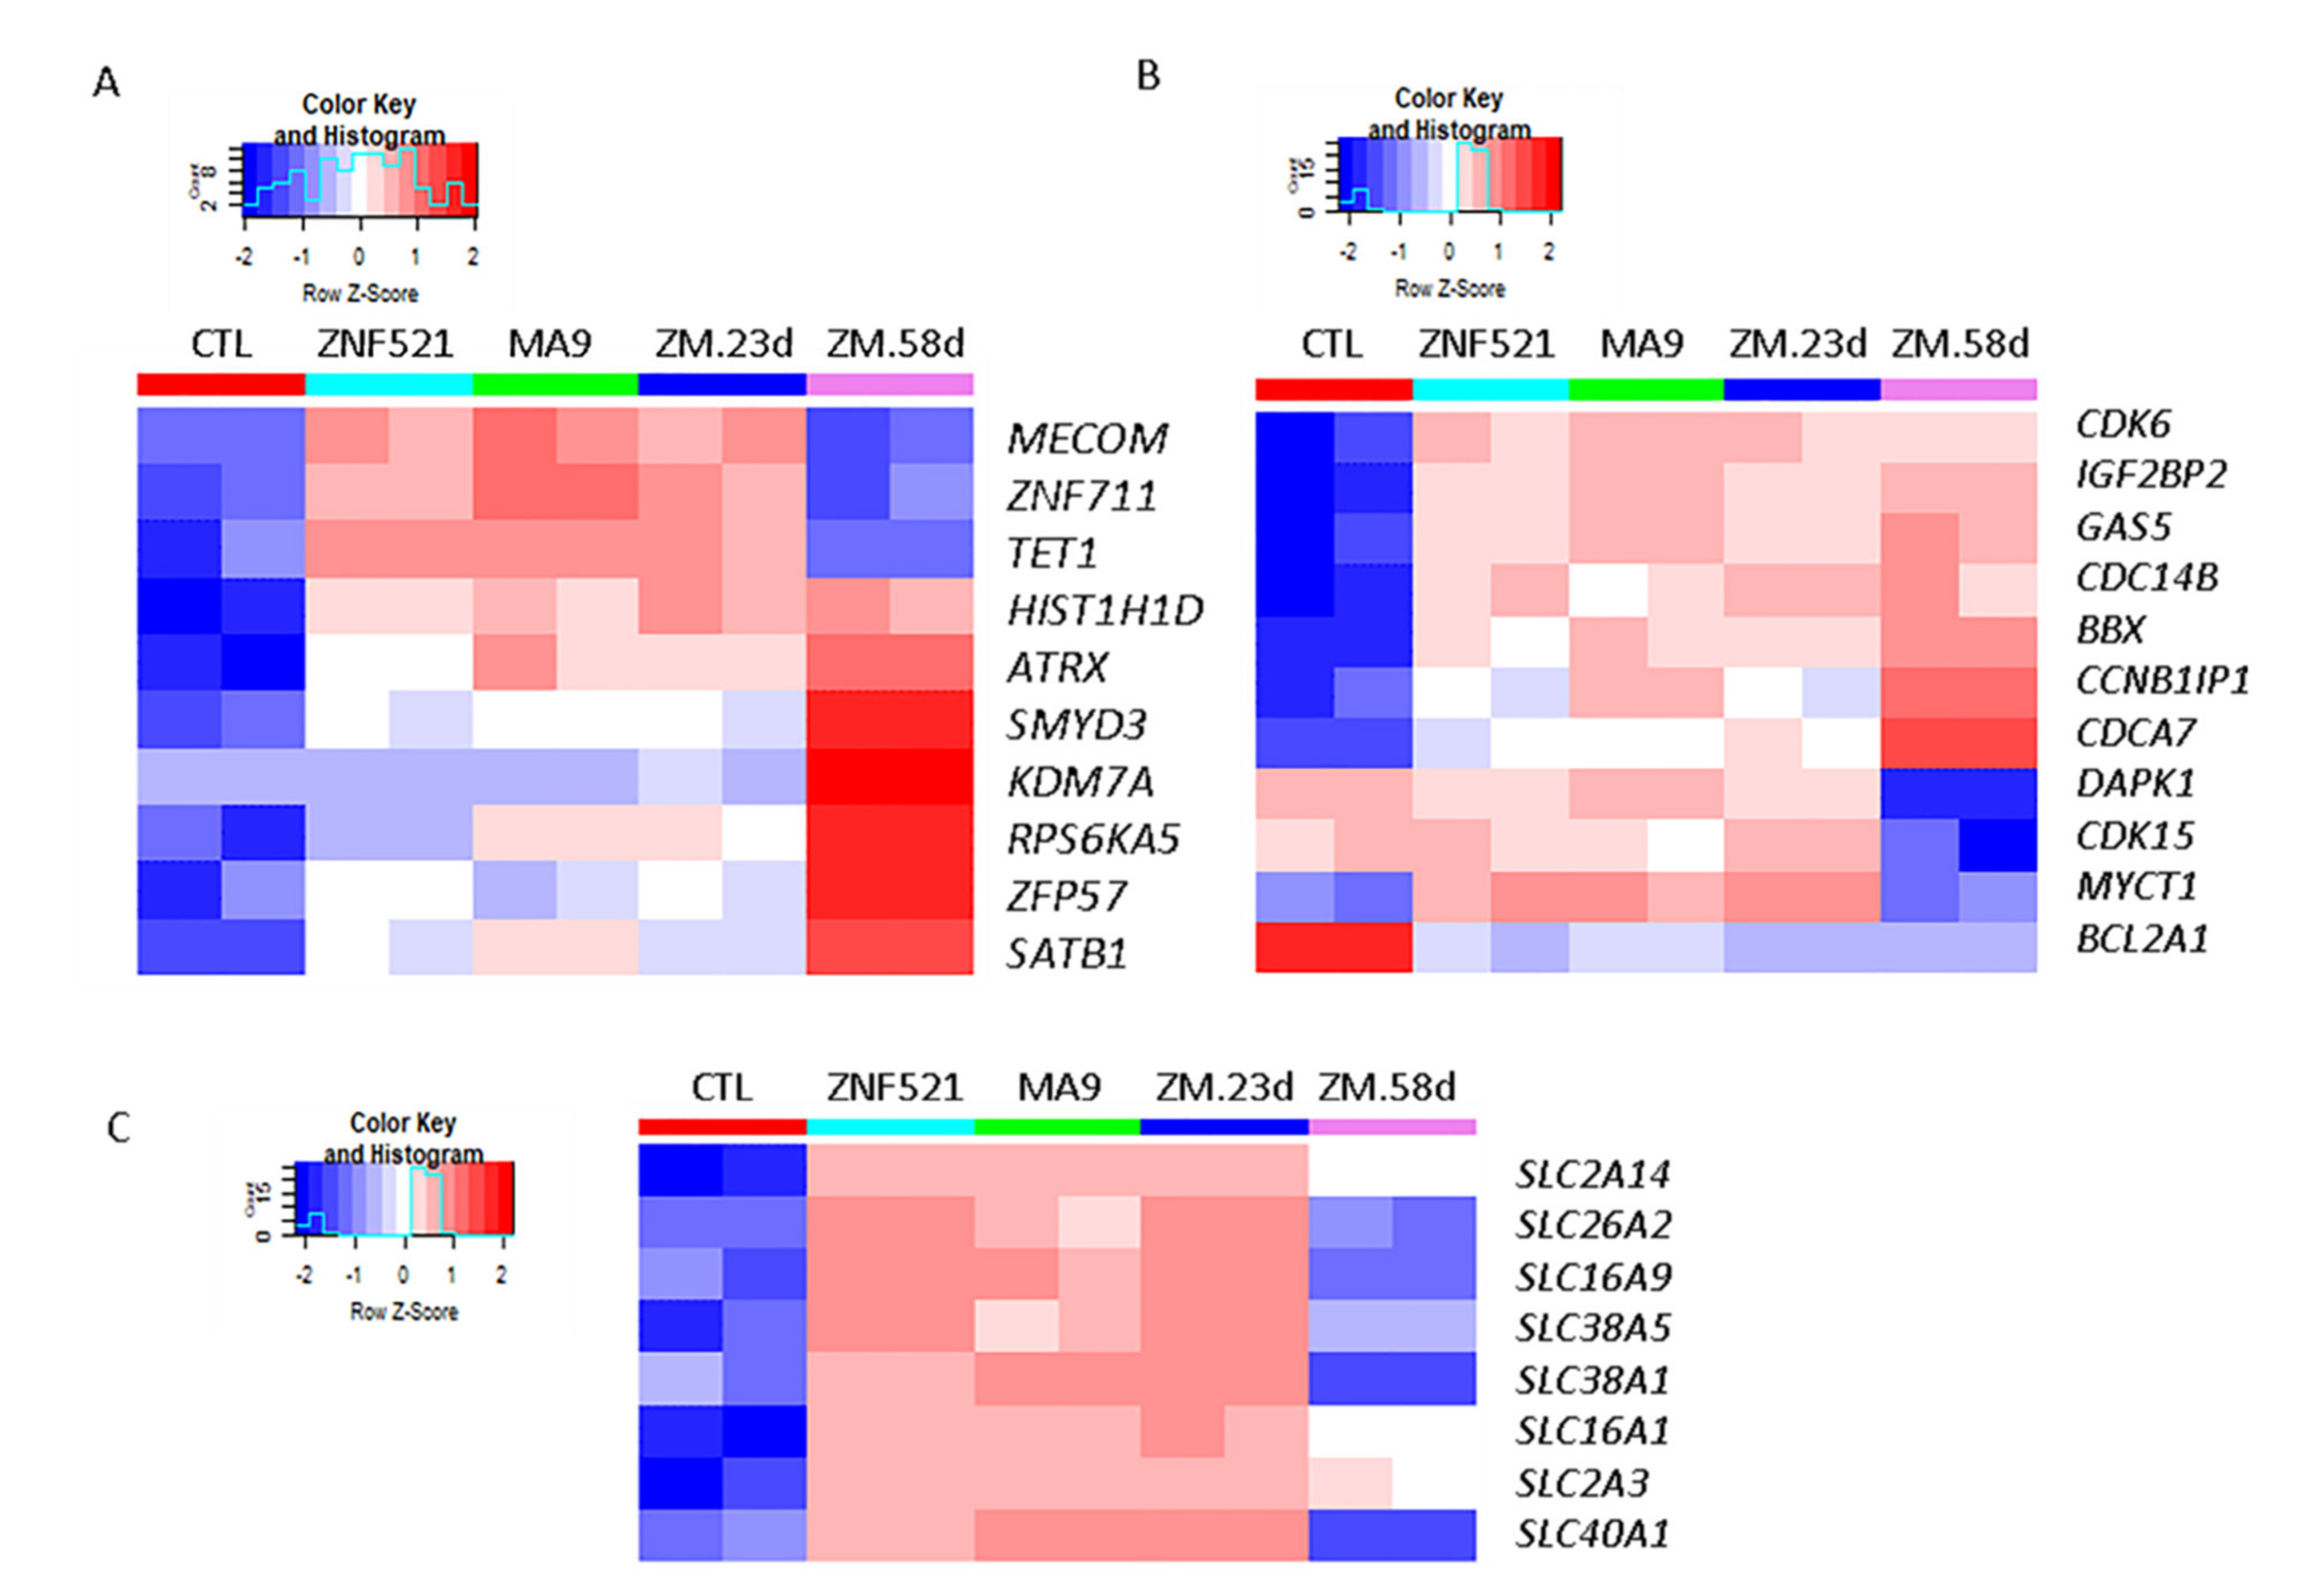
2.3. Transcriptome Profiling of ZNF521, MA9 and Double ZNF521/MA9 Transductions
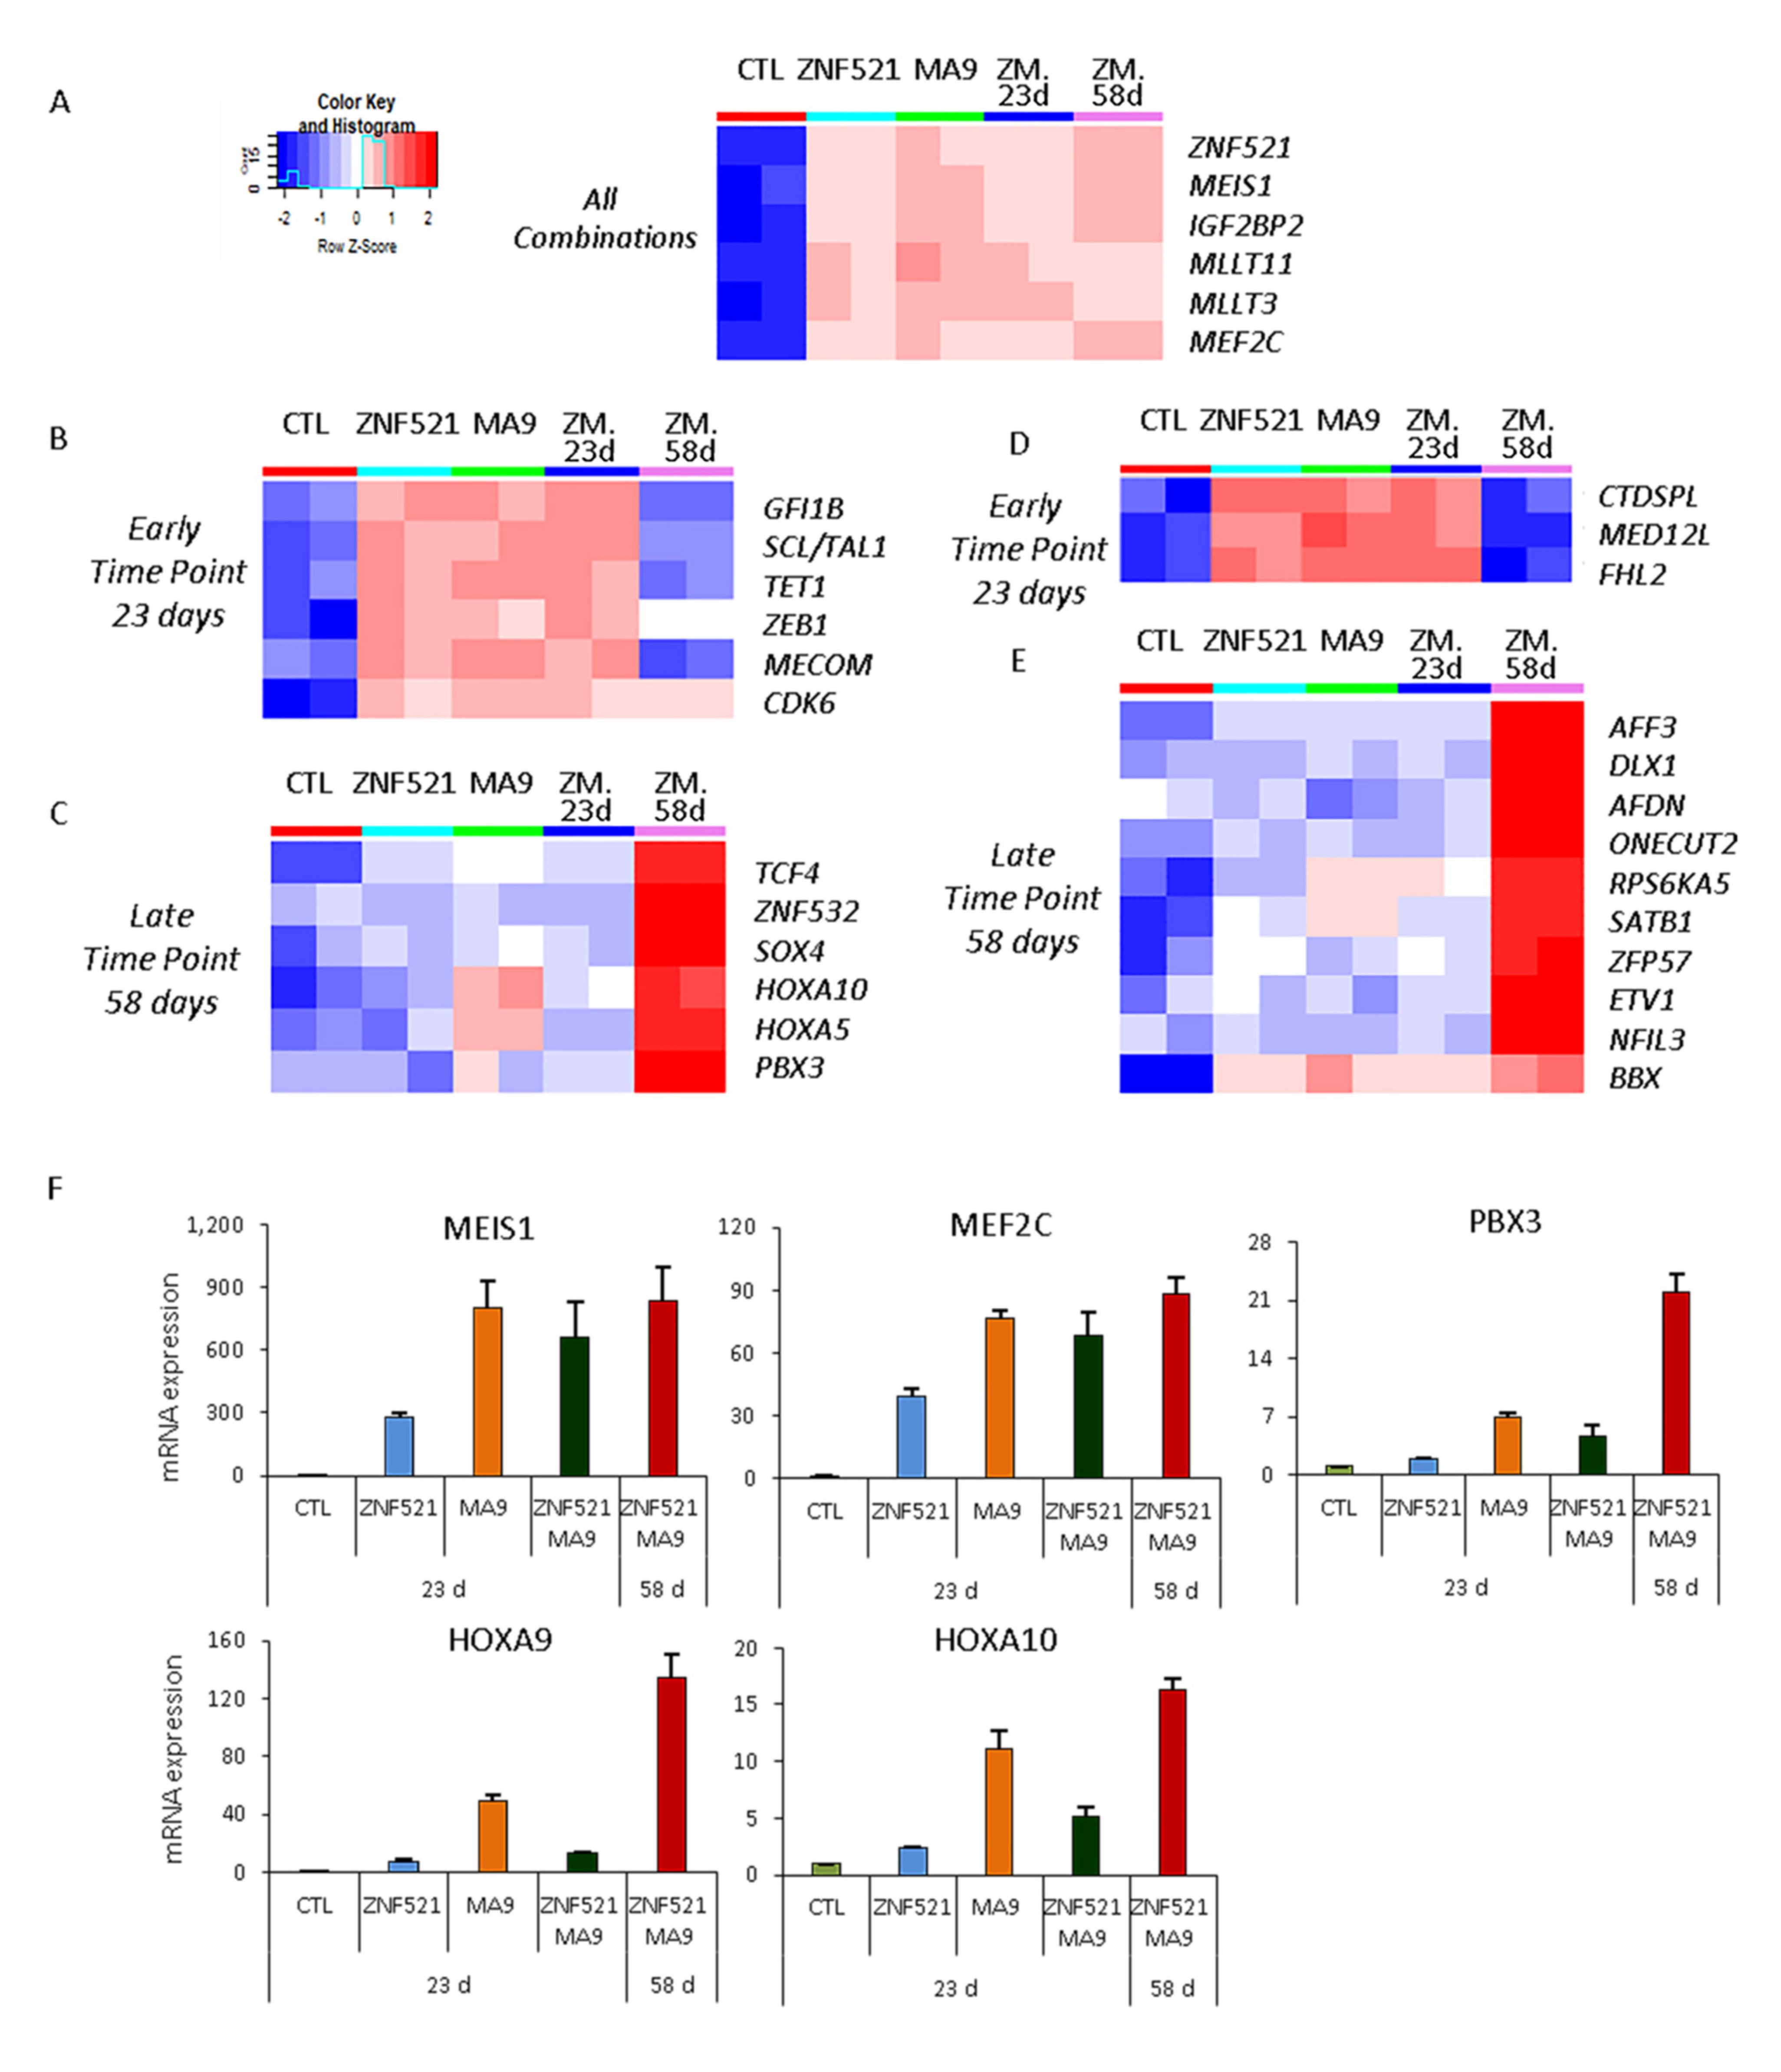
2.4. Transcript Analysis for MLL-AF9 Targets
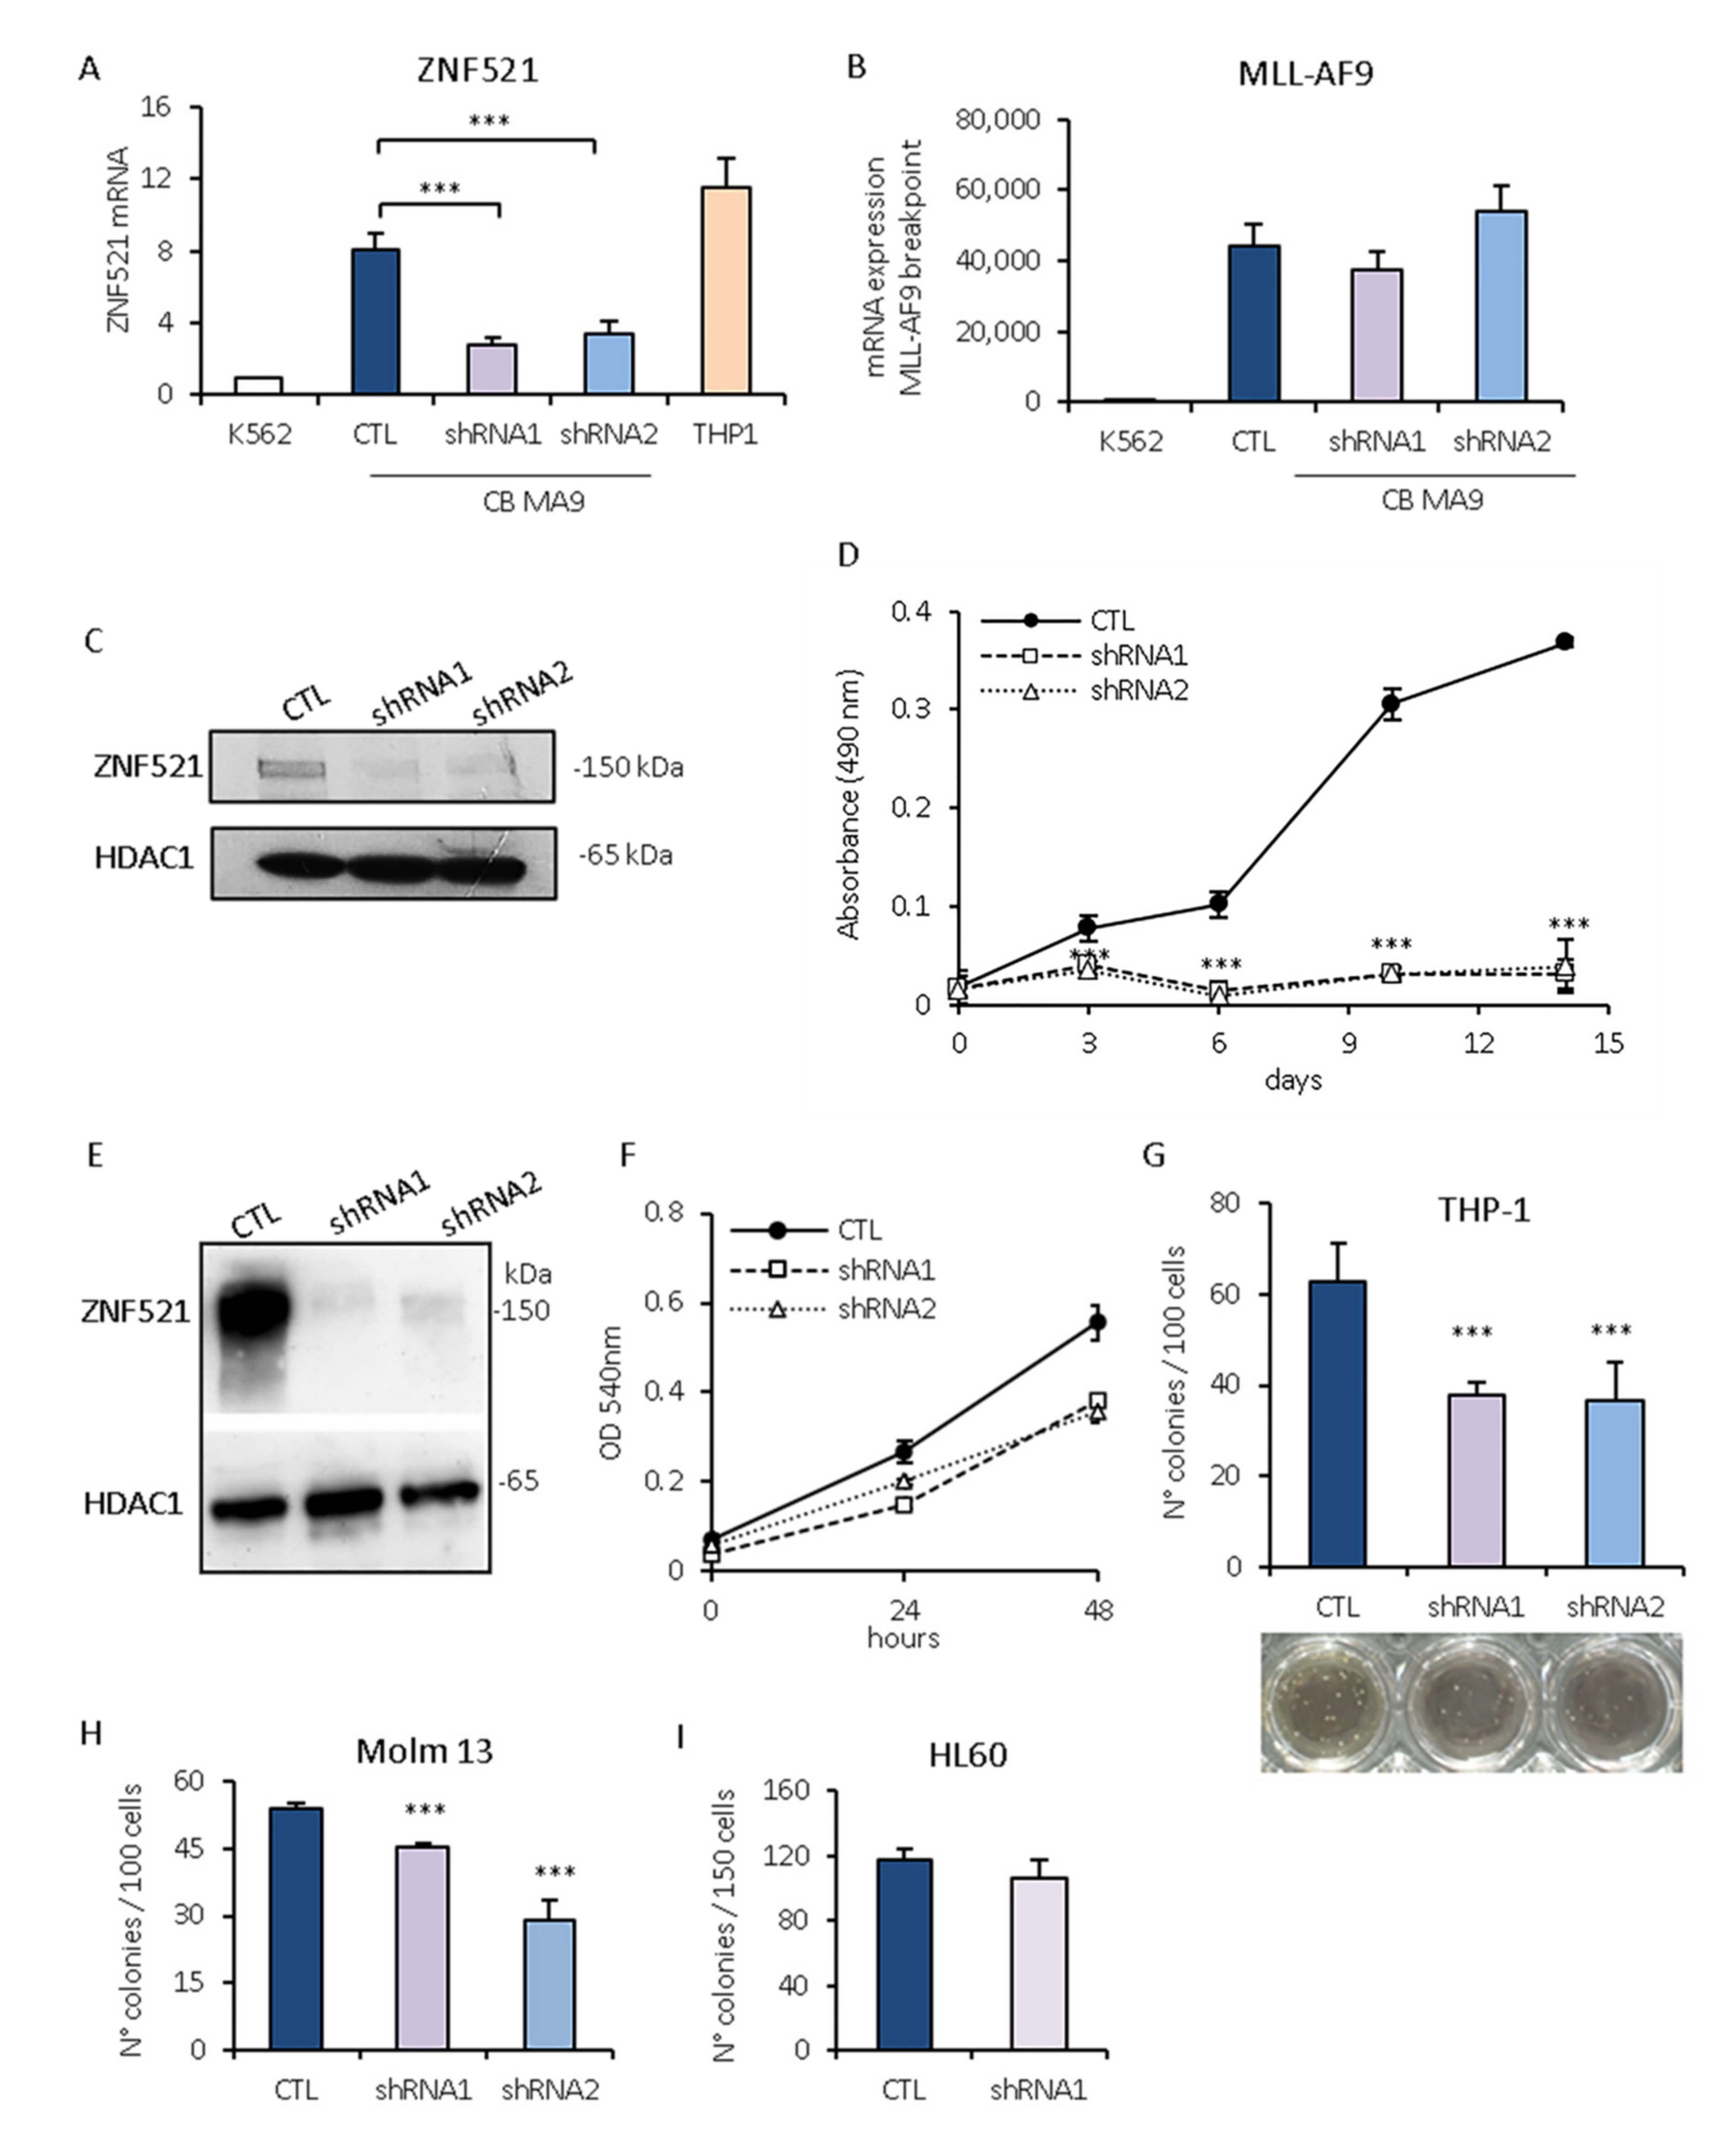
2.5. Effect of ZNF521 Silencing on Growth of Human Leukemia Cells Expressing the MLL-AF9 Fusion Protein
3. Discussion
4. Materials and Methods
4.1. Gene Expression Analysis from Public Repositories
4.2. Cell Culture
4.3. Cell Transduction
4.4. RNA Isolation, Reverse Transcription, and Quantitative RT-PCR
4.5. Continuous Culture Assays
4.6. MTT Assay
4.7. MTS Assay
4.8. Colony Formation Assay
4.9. Protein Lysates and Immunoblotting
4.10. Global Transcriptome Profiling
4.11. Survival Analysis
4.12. Statistical Analysis
5. Conclusions
Supplementary Materials
Author Contributions
Funding
Institutional Review Board Statement
Informed Consent Statement
Data Availability Statement
Acknowledgments
Conflicts of Interest
References
- Meyer, C.; Burmeister, T.; Gröger, D.; Tsaur, G.; Fechina, L.; Renneville, A.; Sutton, R.; Venn, N.C.; Emerenciano, M.; Pombo-de-Oliveira, M.S.; et al. The MLL recombinome of acute leukemias in 2017. Leukemia 2018, 32, 273–284. [Google Scholar] [CrossRef]
- Wouters, B.J.; Delwel, R. Epigenetic and approaches to targeted epigenetic therapy in acute myeloid leukemia. Blood 2016, 127, 42–52. [Google Scholar] [CrossRef] [Green Version]
- Corral, J.; Lavenir, I.; Impey, H.; Warren, A.J.; Forster, A.; Larson, T.A.; Bell, S.; McKenzie, A.N.; King, G.; Rabbitts, T.H. An MLL-AF9 fusion gene made by homologous recombination causes acute leukemia in chimeric mice: A method to create fusion oncogenes. Cell 1996, 85, 853–861. [Google Scholar] [CrossRef] [Green Version]
- Smith, L.L.; Yeung, J.; Zeisig, B.B.; Popov, N.; Huijbers, I.; Barnes, J.; Wilson, A.J.; Taskesen, E.; Delwel, R.; Gil, J.; et al. Functional crosstalk between Bmi1 and MLL/Hoxa9 axis in establishment of normal hematopoietic and leukemic stem cells. Cell Stem. Cell 2011, 8, 649–662. [Google Scholar] [CrossRef] [Green Version]
- Dick, J.E. Stem cell concepts renew cancer research. Blood 2008, 112, 4793–4807. [Google Scholar] [CrossRef] [Green Version]
- Schoch, C.; Schnittger, S.; Klaus, M.; Hiddemann, W.; Haferlach, T. AML with 11q23/ MLL abnormalities as defined by the WHO classification: Incidence, partner chromosomes, FAB subtype, age distribution, and prognostic impact in an unselected series of 1897 cytogenetically analyzed AML cases. Blood 2003, 102, 2395–2402. [Google Scholar] [CrossRef] [Green Version]
- Stavropoulou, V.; Kaspar, S.; Brault, L.; Sanders, M.A.; Juge, S.; Morettini, S.; Tzankov, A.; Iacovino, M.; Lau, I.J.; Milne, T.; et al. MLL-AF9 Expression in Hematopoietic Stem Cells Drives a Highly Invasive AML Expressing EMT-Related Genes Linked to Poor Outcome. Cancer Cell 2016, 30, 43–58. [Google Scholar] [CrossRef] [Green Version]
- Barabé, F.; Kennedy, J.A.; Hope, K.J.; Dick, J.E. Modeling the initiation and progression of human acute leukemia in mice. Science 2007, 316, 600–604. [Google Scholar] [CrossRef]
- Mulloy, C.J.; Wunderlich, M.; Zheng, Y.; Wei, J. Transforming human blood stem and progenitor cells: A new way forward in leukemia modelling. Cell Cycle 2008, 7, 3314–3319. [Google Scholar] [CrossRef] [Green Version]
- Bond, H.M.; Mesuraca, M.; Morrone, G. Targeting leukemia stem cells: In vitro veritas? Oncotarget 2014, 5, 575–576. [Google Scholar] [CrossRef]
- Zhu, N.; Chen, M.; Eng, R.; DeJong, J.; Sinha, A.U.; Rahnamay, N.F.; Koche, R.; Al-Shahrour, F.; Minehart, J.C.; Chen, C.W.; et al. MLL-AF9- and HOXA9-mediated acute myeloid leukemia stem cell self-renewal requires JMJD1C. J. Clin. Invest. 2016, 126, 997–1011. [Google Scholar] [CrossRef]
- Mesuraca, M.; Amodio, N.; Chiarella, E.; Scicchitano, S.; Aloisio, A.; Codispoti, B.; Lucchino, V.; Montalcini, Y.; Bond, H.M.; Morrone, G. Turning Stem Cells Bad: Generation of Clinically Relevant Models of Human Acute Myeloid Leukemia through Gene Delivery- or Genome Editing-Based Approaches. Molecules 2018, 23, 2060. [Google Scholar] [CrossRef] [Green Version]
- Mohan, M.; Lin, C.; Guest, E.; Shilatifard, A. Licensed to elongate: A molecular mechanism for MLL-based leukaemogenesis. Nat. Rev. Cancer 2010, 10, 721–728. [Google Scholar] [CrossRef]
- Prange, K.H.M.; Mandoli, A.; Kuznetsova, T.; Wang, S.Y.; Sotoca, A.M.; Marneth, A.E.; van der Reijden, B.A.; Stunnenberg, H.G.; Martens, J.H.A. MLL-AF9 and MLL-AF4 oncofusion proteins bind a distinct enhancer repertoire and target the RUNX1 program in 11q23 acute myeloid leukemia. Oncogene 2017, 36, 3346–3356. [Google Scholar] [CrossRef] [Green Version]
- Wei, J.; Wunderlich, M.; Fox, C.; Alvarez, S.; Cigudosa, J.C.; Wilhelm, J.S.; Zheng, Y.; Cancelas, J.A.; Gu, Y.; Jansen, M.; et al. Microenvironment determines lineage fate in a human model of MLL-AF9 leukemia. Cancer Cell 2008, 13, 483–495. [Google Scholar] [CrossRef] [Green Version]
- Chen, W.; Kumar, A.R.; Hudson, W.A.; Li, Q.; Wu, B.; Staggs, R.A.; Lund, E.A.; Sam, T.N.; Kersey, J.H. Malignant transformation initiated by MLL-AF9: Gene dosage and critical target cells. Cancer Cell 2008, 13, 432–440. [Google Scholar] [CrossRef] [Green Version]
- Ross, M.E.; Mahfouz, R.; Onciu, M.; Liu, H.C.; Zhou, X.; Song, G.; Shurtleff, S.A.; Pounds, S.; Cheng, C.; Ma, J.; et al. Gene expression profiling of pediatric acute myelogenous leukemia. Blood 2004, 104, 3679–3687. [Google Scholar] [CrossRef] [Green Version]
- Valk, P.J.; Verhaak, R.G.; Beijen, M.A.; Erpelinck, C.A.; Barjesteh van Waalwijk van Doorn-Khosrovani, S.; Boer, J.M.; Beverloo, H.B.; Moorhouse, M.J.; van der Spek, P.J.; Löwenberg, B.; et al. Prognostically useful gene-expression profiles in acute myeloid leukemia. N. Engl. J. Med. 2004, 35016, 1617–1628. [Google Scholar] [CrossRef] [Green Version]
- Schwaller, J. Learning from mouse models of MLL fusion gene-driven acute leukemia. Biochim. Biophys. Acta Gene Regul. Mech. 2020, 1863. [Google Scholar] [CrossRef]
- Chen, X.; Burkhardt, D.B.; Hartman, A.A.; Hu, X.; Eastman, A.E.; Sun, C.; Wang, X.; Zhong, M.; Krishnaswamy, S.; Guo, S. MLL-AF9 initiates transformation from fast-proliferating myeloid progenitors. Nat. Commun. 2019, 10, 5767. [Google Scholar] [CrossRef] [Green Version]
- Wang, Y.; Krivtsov, A.V.; Sinha, A.U.; North, T.E.; Goessling, W.; Feng, Z.; Zon, L.I.; Armstrong, S.A. The Wnt/beta-catenin pathway is required for the development of leukemia stem cells in AML. Science 2010, 327, 1650–1653. [Google Scholar] [CrossRef] [Green Version]
- Kohlmann, A.; Schoch, C.; Dugas, M.; Schnittger, S.; Hiddemann, W.; Kern, W.; Haferlach, T. New insights into MLL gene rearranged acute leukemias using gene expression profiling: Shared pathways, lineage commitment, and partner genes. Leukemia 2005, 19, 953–964. [Google Scholar] [CrossRef]
- Horton, S.J.; Jaques, J.; Woolthuis, C.; van Dijk, J.; Mesuraca, M.; Huls, G.; Morrone, G.; Vellenga, E.; Schuringa, J.J. MLL-AF9-mediated immortalization of human hematopoietic cells along different lineages changes during ontogeny. Leukemia 2013, 27, 1116–1126. [Google Scholar] [CrossRef] [Green Version]
- Fleischmann, K.K.; Pagel, P.; Schmid, I.; Roscher, A.A. RNAi-mediated silencing of MLL-AF9 reveals leukemia-associated downstream targets and processes. Mol. Cancer 2014, 13, 27. [Google Scholar] [CrossRef] [Green Version]
- Carretta, M.; Brouwers-Vos, A.Z.; Bosman, M.; Horton, S.J.; Martens, J.; Vellenga, E.; Schuringa, J.J. BRD3/4 inhibition and FLT3-ligand deprivation target pathways that are essential for the survival of human MLL-AF9+ leukemic cells. PLoS ONE 2017, 12, e0189102. [Google Scholar] [CrossRef] [Green Version]
- Germano, G.; Morello, G.; Aveic, S.; Pinazza, M.; Minuzzo, S.; Frasson, C.; Persano, L.; Bonvini, P.; Viola, G.; Bresolin, S.; et al. ZNF521 sustains the differentiation block in MLL-rearranged acute myeloid leukemia. Oncotarget 2017, 8, 26129–26141. [Google Scholar] [CrossRef] [Green Version]
- Garrison, B.S.; Rybak, A.P.; Beerman, I.; Heesters, B.; Mercier, F.E.; Scadden, D.T.; Bryder, D.; Baron, R.; Rossi, D.J. ZFP521 regulates murine hematopoietic stem cell function and facilitates MLL-AF9 leukemogenesis in mouse and human cells. Blood 2017, 130, 619–624. [Google Scholar] [CrossRef] [Green Version]
- Bond, H.M.; Mesuraca, M.; Amodio, N.; Mega, T.; Agosti, V.; Fanello, D.; Pelaggi, D.; Bullinger, L.; Grieco, M.; Moore, M.A.; et al. Early hematopoietic zinc finger protein-zinc finger protein 521: A candidate regulator of diverse immature cells. Int. J. Biochem Cell Biol. 2008, 40, 848–854. [Google Scholar] [CrossRef]
- Gerrits, A.; Li, Y.; Tesson, B.M.; Bystrykh, L.V.; Weersing, E.; Ausema, A.; Dontje, B.; Wang, X.; Breitling, R.; Jansen, R.C.; et al. Expression quantitative trait loci are highly sensitive to cellular differentiation state. PLoS Genet. 2009, 5, e1000692. [Google Scholar] [CrossRef] [Green Version]
- Matsubara, E.; Sakai, I.; Yamanouchi, J.; Fujiwara, H.; Yakushijin, Y.; Hato, T.; Shigemoto, K.; Yasukawa, M. The role of zinc finger protein 521/early hematopoietic zinc finger protein in erythroid cell differentiation. J. Biol. Chem. 2009, 284, 3480–3487. [Google Scholar] [CrossRef] [Green Version]
- Theilgaard-Monch, K.; Jacobsen, L.C.; Borup, R.; Rasmussen, T.; Bjerregaard, M.D.; Nielsen, F.C.; Cowland, J.B.; Borregaard, N. The transcriptional program of terminal granulocytic differentiation. Blood 2005, 105, 1785–1796. [Google Scholar] [CrossRef]
- Mega, T.; Lupia, M.; Amodio, N.; Horton, S.J.; Mesuraca, M.; Pelaggi, D.; Agosti, V.; Grieco, M.; Chiarella, E.; Spina, R.; et al. Zinc finger protein 521 antagonizes early B-cell factor 1 and modulates the B-lymphoid differentiation of primary hematopoietic progenitors. Cell Cycle 2011, 10, 2129–2139. [Google Scholar] [CrossRef] [Green Version]
- Hiratsuka, T.; Takei, Y.; Ohmori, R.; Imai, Y.; Ozeki, M.; Tamaki, K.; Haga, H.; Nakamura, T.; Tsuruyama, T. ZFP521 contributes to pre-B-cell lymphomagenesis through modulation of the pre-B-cell receptor signaling pathway. Oncogene 2016, 35, 3227–3238. [Google Scholar] [CrossRef]
- Chiarella, E.; Codispoti, B.; Aloisio, A.; Cosentino, E.G.; Scicchitano, S.; Montalcini, Y.; Lico, D.; Morrone, G.; Mesuraca, M.; Bond, H.M. Zoledronic acid inhibits the growth of leukemic MLL-AF9 transformed hematopoietic cells. Heliyon 2020, 6, e04020. [Google Scholar] [CrossRef]
- Kohlmann, A.; Kipps, T.J.; Rassenti, L.Z.; Downing, J.R.; Shurtleff, S.A.; Mills, K.I.; Gilkes, A.F.; Hofmann, W.K.; Basso, G.; Dell’orto, M.C.; et al. An international standardization programme towards the application of gene expression profiling in routine leukaemia diagnostics: The Microarray Innovations in LEukemia study prophase. Br. J. Haematol. 2008, 142, 802–807. [Google Scholar] [CrossRef]
- Balgobind, B.V.; Van den Heuvel-Eibrink, M.M.; De Menezes, R.X.; Reinhardt, D.; Hollink, I.H.; Arentsen-Peters, S.T.; van Wering, E.R.; Kaspers, G.J.; Cloos, J.; de Bont, E.S.; et al. Evaluation of gene expression signatures predictive of cytogenetic and molecular subtypes of pediatric acute myeloid leukemia. Haematologica 2011, 96, 221–230. [Google Scholar] [CrossRef] [Green Version]
- Verhaak, R.G.; Wouters, B.J.; Erpelinck, C.A.; Abbas, S.; Beverloo, H.B.; Lugthart, S.; Löwenberg, B.; Delwel, R.; Valk, P.J. Prediction of molecular subtypes in acute myeloid leukemia based on gene expression profiling. Haematologica 2009, 94, 131–134. [Google Scholar] [CrossRef] [Green Version]
- Bindels, E.M.; Havermans, M.; Lugthart, S.; Erpelinck, C.; Wocjtowicz, E.; Krivtsov, A.V.; Rombouts, E.; Armstrong, S.A.; Taskesen, E.; Haanstra, J.R.; et al. EVI1 is critical for the pathogenesis of a subset of MLL-AF9-rearranged AMLs. Blood 2012, 119, 5838–5849. [Google Scholar] [CrossRef]
- Arai, S.; Yoshimi, A.; Shimabe, M.; Ichikawa, M.; Nakagawa, M.; Imai, Y.; Goyama, S.; Kurokawa, M. Evi-1 is a transcriptional target of mixed-lineage leukemia oncoproteins in hematopoietic stem cells. Blood 2011, 117, 6304–6314. [Google Scholar] [CrossRef] [Green Version]
- Jo, A.; Tsukimoto, I.; Ishii, E.; Asou, N.; Mitani, S.; Shimada, A.; Igarashi, T.; Hayashi, Y.; Ichikawa, H. Age-associated difference in gene expression of paediatric acute myelomonocytic lineage leukaemia (FAB M4 and M5 subtypes) and its correlation with prognosis. Br. J. Haematol. 2009, 144, 917–929. [Google Scholar] [CrossRef]
- VIB/UGent. Calculate and Draw Custom Venn Diagrams. Bioinformatics & Evolutionary Genomics. Available online: http://bioinformatics.psb.ugent.be/webtools/Venn/ (accessed on 20 September 2021).
- The Database for Annotation, Visualization and Integrated Discovery (DAVID) v6.8. Available online: https://david.ncifcrf.gov/ (accessed on 20 September 2021).
- Huynh, H.; Zheng, J.; Umikawa, M.; Zhang, C.; Silvany, R.; Iizuka, S.; Holzenberger, M.; Zhang, W.; Zhang, C.C. IGF binding protein 2 supports the survival and cycling of hematopoietic stem cells. Blood 2011, 118, 3236–3243. [Google Scholar] [CrossRef] [Green Version]
- Li, T.; Forbes, M.E.; Fuller, G.N.; Li, J.; Yang, X.; Zhang, W. IGFBP2: Integrative hub of developmental and oncogenic signaling network. Oncogene 2020, 39, 2243–2257. [Google Scholar] [CrossRef]
- Vagapova, E.R.; Spirin, P.V.; Lebedev, T.D.; Prassolov, V.S. The Role of TAL1 in Hematopoiesis and Leukemogenesis. Acta Naturae 2018, 101, 15–23. [Google Scholar] [CrossRef]
- Jiang, X.; Hu, C.; Ferchen, K.; Nie, J.; Cui, X.; Chen, C.H.; Cheng, L.; Zuo, Z.; Seibel, W.; He, C.; et al. Targeted inhibition of STAT/TET1 axis as a therapeutic strategy for acute myeloid leukemia. Nat. Commun. 2017, 8, 2099. [Google Scholar] [CrossRef]
- Kang, E.; Seo, J.; Yoon, H.; Cho, S. The Post-Translational Regulation of Epithelial-Mesenchymal Transition-Inducing Transcription Factors in Cancer Metastasis. Int. J. Mol. Sci. 2021, 22, 3591. [Google Scholar] [CrossRef]
- Chiarella, E.; Lombardo, N.; Lobello, N.; Aloisio, A.; Aragona, T.; Pelaia, C.; Scicchitano, S.; Bond, H.M.; Mesuraca, M. Nasal Polyposis: Insights in Epithelial-Mesenchymal Transition and Differentiation of Polyp Mesenchymal Stem Cells. Int. J. Mol. Sci. 2020, 21, 6878. [Google Scholar] [CrossRef]
- Schneider, G.; Krämer, O.H.; Saur, D. A ZEB1-HDAC pathway enters the epithelial to mesenchymal transition world in pancreatic cancer. Gut 2012, 61, 329–330. [Google Scholar] [CrossRef] [Green Version]
- Aghdassi, A.; Sendler, M.; Guenther, A.; Mayerle, J.; Behn, C.O.; Heidecke, C.D.; Friess, H.; Büchler, M.; Evert, M.; Lerch, M.M.; et al. Recruitment of histone deacetylases HDAC1 and HDAC2 by the transcriptional repressor ZEB1 downregulates E-cadherin expression in pancreatic cancer. Gut 2012, 61, 439–448. [Google Scholar] [CrossRef]
- Bernaudo, F.; Monteleone, F.; Mesuraca, M.; Krishnan, S.; Chiarella, E.; Scicchitano, S.; Cuda, G.; Morrone, G.; Bond, H.M.; Gaspari, M. Validation of a novel shotgun proteomic workflow for the discovery of protein-protein interactions: Focus on ZNF521. J. Proteome Res. 2015, 14, 1888–1899. [Google Scholar] [CrossRef]
- Almotiri, A.; Alzahrani, H.; Menendez-Gonzalez, J.B.; Abdelfattah, A.; Alotaibi, B.; Saleh, L.; Greene, A.; Georgiou, M.; Gibbs, A.; Alsayari, A.; et al. Zeb1 modulates hematopoietic stem cell fates required for suppressing acute myeloid leukemia. J. Clin. Investig. 2021, 131, e129115. [Google Scholar] [CrossRef]
- Li, L.; Feng, Y.; Hu, S.; Du, Y.; Xu, X.; Zhang, M.; Peng, X.; Chen, F. ZEB1 serves as an oncogene in acute myeloid leukaemia via regulating the PTEN/PI3K/AKT signalling pathway by combining with P53. J. Cell Mol. Med. 2021, 25, 5295–5304. [Google Scholar] [CrossRef]
- Tang, Z.; Li, C.; Kang, B.; Gao, G.; Li, C.; Zhang, Z. GEPIA: A web server for cancer and normal gene expression profiling and interactive analyses. Nucleic Acids Res. 2017, 45, W98–W102. [Google Scholar] [CrossRef] [Green Version]
- Sniegowski, T.; Korac, K.; Bhutia, Y.D.; Ganapathy, V. SLC6A14 and SLC38A5 Drive the Glutaminolysis and Serine-Glycine-One-Carbon Pathways in Cancer. Pharmaceuticals 2021, 14, 216. [Google Scholar] [CrossRef]
- Wagner, W.; Laufs, S.; Blake, J.; Schwager, C.; Wu, X.; Zeller, J.W.; Ho, A.D.; Fruehauf, S. Retroviral integration sites correlate with expressed genes in hematopoietic stem cells. Stem Cells 2005, 23, 1050–1058. [Google Scholar] [CrossRef]
- Mesuraca, M.; Galasso, O.; Guido, L.; Chiarella, E.; Scicchitano, S.; Vatrinet, R.; Morrone, G.; Bond, H.M.; Gasparini, G. Expression profiling and functional implications of a set of zinc finger proteins, ZNF423, ZNF470, ZNF521, and ZNF780B, in primary osteoarthritic articular chondrocytes. Mediators Inflamm. 2014, 2014, 318793. [Google Scholar] [CrossRef]
- Mesuraca, M.; Chiarella, E.; Scicchitano, S.; Codispoti, B.; Giordano, M.; Nappo, G.; Bond, H.M.; Morrone, G. ZNF423 and ZNF521: EBF1 Antagonists of Potential Relevance in B-Lymphoid Malignancies. Biomed. Res. Int. 2015, 2015, 165238. [Google Scholar] [CrossRef] [Green Version]
- Hemmoranta, H.; Hautaniemi, S.; Niemi, J.; Nicorici, D.; Laine, J.; Yli-Harja, O.; Partanen, J.; Jaatinen, T. Transcriptional profiling reflects shared and unique characters for CD34+ and CD133+ cells. Stem. Cells Dev. 2006, 15, 839–851. [Google Scholar] [CrossRef]
- Scicchitano, S.; Giordano, M.; Lucchino, V.; Montalcini, Y.; Chiarella, E.; Aloisio, A.; Codispoti, B.; Zoppoli, P.; Melocchi, V.; Bianchi, F.; et al. The stem cell-associated transcription co-factor, ZNF521, interacts with GLI1 and GLI2 and enhances the activity of the Sonic hedgehog pathway. Cell Death Dis. 2019, 10, 715. [Google Scholar] [CrossRef] [Green Version]
- Pigazzi, M.; Masetti, R.; Bresolin, S.; Beghin, A.; Di Meglio, A.; Gelain, S.; Trentin, L.; Baron, E.; Giordan, M.; Zangrando, A.; et al. MLL partner genes drive distinct gene expression profiles and genomic alterations in pediatric acute myeloid leukemia: An AIEOP study. Leukemia 2011, 25, 560–563. [Google Scholar] [CrossRef] [Green Version]
- Bullinger, L.; Döhner, K.; Bair, E.; Fröhling, S.; Schlenk, R.F.; Tibshirani, R.; Döhner, H.; Pollack, J.R. Use of gene-expression profiling to identify prognostic subclasses in adult acute myeloid leukemia. N. Engl. J. Med. 2004, 350, 1605–1616. [Google Scholar] [CrossRef] [Green Version]
- Yu, M.; Al-Dallal, S.; Al-Haj, L.; Panjwani, S.; McCartney, A.S.; Edwards, S.M.; Manjunath, P.; Walker, C.; Awgulewitsch, A.; Hentges, K.E. Transcriptional regulation of the proto-oncogene Zfp521 by SPI1 (PU.1) and HOXC13. Genesis 2016, 54, 519–533. [Google Scholar] [CrossRef] [PubMed] [Green Version]
- Chiarella, E.; Aloisio, A.; Scicchitano, S.; Bond, H.M.; Mesuraca, M. Regulatory Role of microRNAs Targeting the Transcription Co-Factor ZNF521 in Normal Tissues and Cancers Int. J. Mol. Sci. 2021, 22, 8461. [Google Scholar] [CrossRef] [PubMed]
- Zhang, Y.; Xu, S.; Chen, Z.; Xie, M.; Ma, Y.; Wu, G.; Huang, X.; Luo, C.; Huang, Z.; Sun, Y.; et al. Zfp521 SUMOylation facilities erythroid hematopoietic reconstitution under stress. Biosci. Biotechnol. Biochem. 2020, 84, 943–953. [Google Scholar] [CrossRef]
- Dang, T.N.; Dang, T.N.; Taylor, J.L.; Kilroy, G.; Yu, Y.; Burk, D.H.; Floyd, Z.E. SIAH2 is Expressed in Adipocyte Precursor Cells and Interacts with EBF1 and ZFP521 to Promote Adipogenesis. Obesity 2021, 29, 98–107. [Google Scholar] [CrossRef] [PubMed]
- Kang, S.; Akerblad, P.; Kiviranta, R.; Gupta, R.K.; Kajimura, S.; Griffin, M.J.; Min, J.; Baron, R.; Rosen, E.D. Regulation of early adipose commitment by Zfp521. PLoS Biol. 2012, 10, e1001433. [Google Scholar] [CrossRef]
- Addison, W.N.; Fu, M.M.; Yang, H.X.; Lin, Z.; Nagano, K.; Gori, F.; Baron, R. Direct transcriptional repression of Zfp423 by Zfp521 mediates a bone morphogenic protein-dependent osteoblast versus adipocyte lineage commitment switch. Mol. Cell Biol. 2014, 34, 3076–3085. [Google Scholar] [CrossRef] [Green Version]
- Chiarella, E.; Aloisio, A.; Codispoti, B.; Nappo, G.; Scicchitano, S.; Lucchino, V.; Montalcini, Y.; Camarotti, A.; Galasso, O.; Greco, M.; et al. ZNF521 has an inhibitory effect on the adipogenic differentiation of human adipose derived mesenchymal stem cells. Stem Cell Rev. Rep. 2018, 14, 901–914. [Google Scholar] [CrossRef]
- Chiarella, E.; Aloisio, A.; Scicchitano, S.; Lucchino, V.; Montalcini, Y.; Galasso, O.; Greco, M.; Gasparini, G.; Mesuraca, M.; Bond, H.M.; et al. ZNF521 Represses Osteoblastic Differentiation in Human Adipose-Derived Stem Cells. Int. J. Mol. Sci. 2018, 19, E4095. [Google Scholar] [CrossRef] [PubMed] [Green Version]
- Kamiya, D.; Banno, S.; Sasai, N.; Ohgushi, M.; Inomata, H.; Watanabe, K.; Kawada, M.; Yakura, R.; Kiyonari, H.; Nakao, K.; et al. Intrinsic transition of embryonic stem-cell differentiation into neural progenitors. Nature 2011, 470, 503–509. [Google Scholar] [CrossRef]
- Shahbazi, E.; Moradi, S.; Nemati, S.; Satarian, L.; Basiri, M.; Gourabi, H.; Zare Mehrjardi, N.; Günther, P.; Lampert, A.; Händler, K.; et al. Conversion of Human Fibroblasts to Stably Self-Renewing Neural Stem Cells with a Single Zinc-Finger Transcription Factor. Stem Cell Rep. 2016, 6, 539–551. [Google Scholar] [CrossRef] [Green Version]
- Matthews, G.M.; Mehdipour, P.; Cluse, L.A.; Falkenberg, K.J.; Wang, E.; Roth, M.; Santoro, F.; Vidacs, E.; Stanley, K.; House, C.M.; et al. Functional-genetic dissection of HDAC dependencies in mouse lymphoid and myeloid malignancies. Blood 2015, 126, 2392–2403. [Google Scholar] [CrossRef] [Green Version]
- Kunchala, P.; Kuravi, S.; Jensen, R.; McGuirk, J.; Balusu, R. When the good go bad: Mutant NPM1 in acute myeloid leukemia. Blood Rev. 2018, 32, 167–183. [Google Scholar] [CrossRef]
- Chiarella, E.; Carrà, G.; Scicchitano, S.; Codispoti, B.; Mega, T.; Lupia, M.; Pelaggi, D.; Marafioti, M.G.; Aloisio, A.; Giordano, M.; et al. UMG Lenti: Novel lentiviral vectors for efficient transgene- and reporter gene expression in human early hematopoietic progenitors. PLoS ONE 2014, 9, e114795. [Google Scholar] [CrossRef]
- Chiarella, E.; Lombardo, N.; Lobello, N.; Piazzetta, G.L.; Morrone, H.L.; Mesuraca, M.; Bond, H.M. Deficit in Adipose Differentiation in Mesenchymal Stem Cells Derived from Chronic Rhinosinusitis Nasal Polyps Compared to Nasal Mucosal Tissue. Int. J. Mol. Sci. 2020, 21, 9214. [Google Scholar] [CrossRef]
- Codispoti, B.; Rinaldo, N.; Chiarella, E.; Lupia, M.; Spoleti, C.B.; Marafioti, M.G.; Aloisio, A.; Scicchitano, S.; Giordano, M.; Nappo, G.; et al. Recombinant TAT-BMI-1 fusion protein induces ex vivo expansion of human umbilical cord blood-derived hematopoietic stem cells. Oncotarget 2017, 8, 43782–43798. [Google Scholar] [CrossRef] [Green Version]
- Di Vito, A.; Chiarella, E.; Baudi, F.; Scardamaglia, P.; Antonelli, A.; Giudice, D.; Barni, T.; Fortunato, L.; Giudice, A. Dose-Dependent Effects of Zoledronic Acid on Human Periodontal Ligament Stem Cells: An In Vitro Pilot Study. Cell Transplant. 2020, 29, 963689720948497. [Google Scholar] [CrossRef] [PubMed]
- Storti, P.; Agnelli, L.; Palma, B.D.; Todoerti, K.; Marchica, V.; Accardi, F.; Sammarelli, G.; Deluca, F.; Toscani, D.; Costa, F.; et al. The transcriptomic profile of CD138(+) cells from patients with early progression from smoldering to active multiple myeloma remains substantially unchanged. Haematologica 2019, 104, e465–e469. [Google Scholar] [CrossRef] [PubMed] [Green Version]
- Carvalho, B.S.; Irizarry, R.A. A framework for oligonucleotide microarray preprocessing. Bioinformatics 2010, 26, 2363–2367. [Google Scholar] [CrossRef] [PubMed]
- Sacco, A.; Federico, C.; Todoerti, K.; Ziccheddu, B.; Palermo, V.; Giacomini, A.; Ravelli, C.; Maccarinelli, F.; Bianchi, G.; Belotti, A.; et al. Specific targeting of the KRAS mutational landscape in myeloma as a tool to unveil the elicited anti-tumor activity. Blood Advance online publication. 2020. [Google Scholar] [CrossRef]
- Breitling, R.; Armengaud, P.; Amtmann, A.; Herzyk, P. Rank products: A simple, yet powerful, new method to detect differentially regulated genes in replicated microarray experiments. FEBS Lett. 2004, 573, 83–92. [Google Scholar] [CrossRef] [PubMed]
- Subramanian, A.; Tamayo, P.; Mootha, V.K.; Mukherjee, S.; Ebert, B.L.; Gillette, M.A.; Paulovich, A.; Pomeroy, S.L.; Golub, T.R.; Lander, E.S.; et al. Gene set enrichment analysis: A knowledge-based approach for interpreting genome-wide expression profiles. Proc. Natl. Acad. Sci. USA 2005, 102, 15545–15550. [Google Scholar] [CrossRef] [Green Version]
- Mootha, V.K.; Lindgren, C.M.; Eriksson, K.F.; Subramanian, A.; Sihag, S.; Lehar, J.; Puigserver, P.; Carlsson, E.; Ridderstråle, M.; Laurila, E.; et al. PGC-1alpha-responsive genes involved in oxidative phosphorylation are coordinately downregulated in human diabetes. Nat. Genet. 2003, 34, 267–273. [Google Scholar] [CrossRef] [PubMed]


Publisher’s Note: MDPI stays neutral with regard to jurisdictional claims in published maps and institutional affiliations. |
© 2021 by the authors. Licensee MDPI, Basel, Switzerland. This article is an open access article distributed under the terms and conditions of the Creative Commons Attribution (CC BY) license (https://creativecommons.org/licenses/by/4.0/).
Share and Cite
Chiarella, E.; Aloisio, A.; Scicchitano, S.; Todoerti, K.; Cosentino, E.G.; Lico, D.; Neri, A.; Amodio, N.; Bond, H.M.; Mesuraca, M. ZNF521 Enhances MLL-AF9-Dependent Hematopoietic Stem Cell Transformation in Acute Myeloid Leukemias by Altering the Gene Expression Landscape. Int. J. Mol. Sci. 2021, 22, 10814. https://doi.org/10.3390/ijms221910814
Chiarella E, Aloisio A, Scicchitano S, Todoerti K, Cosentino EG, Lico D, Neri A, Amodio N, Bond HM, Mesuraca M. ZNF521 Enhances MLL-AF9-Dependent Hematopoietic Stem Cell Transformation in Acute Myeloid Leukemias by Altering the Gene Expression Landscape. International Journal of Molecular Sciences. 2021; 22(19):10814. https://doi.org/10.3390/ijms221910814
Chicago/Turabian StyleChiarella, Emanuela, Annamaria Aloisio, Stefania Scicchitano, Katia Todoerti, Emanuela G. Cosentino, Daniela Lico, Antonino Neri, Nicola Amodio, Heather Mandy Bond, and Maria Mesuraca. 2021. "ZNF521 Enhances MLL-AF9-Dependent Hematopoietic Stem Cell Transformation in Acute Myeloid Leukemias by Altering the Gene Expression Landscape" International Journal of Molecular Sciences 22, no. 19: 10814. https://doi.org/10.3390/ijms221910814