Resource Allocation Combining Heuristic Matching and Particle Swarm Optimization Approaches: The Case of Downlink Non-Orthogonal Multiple Access


Abstract
:1. Introduction
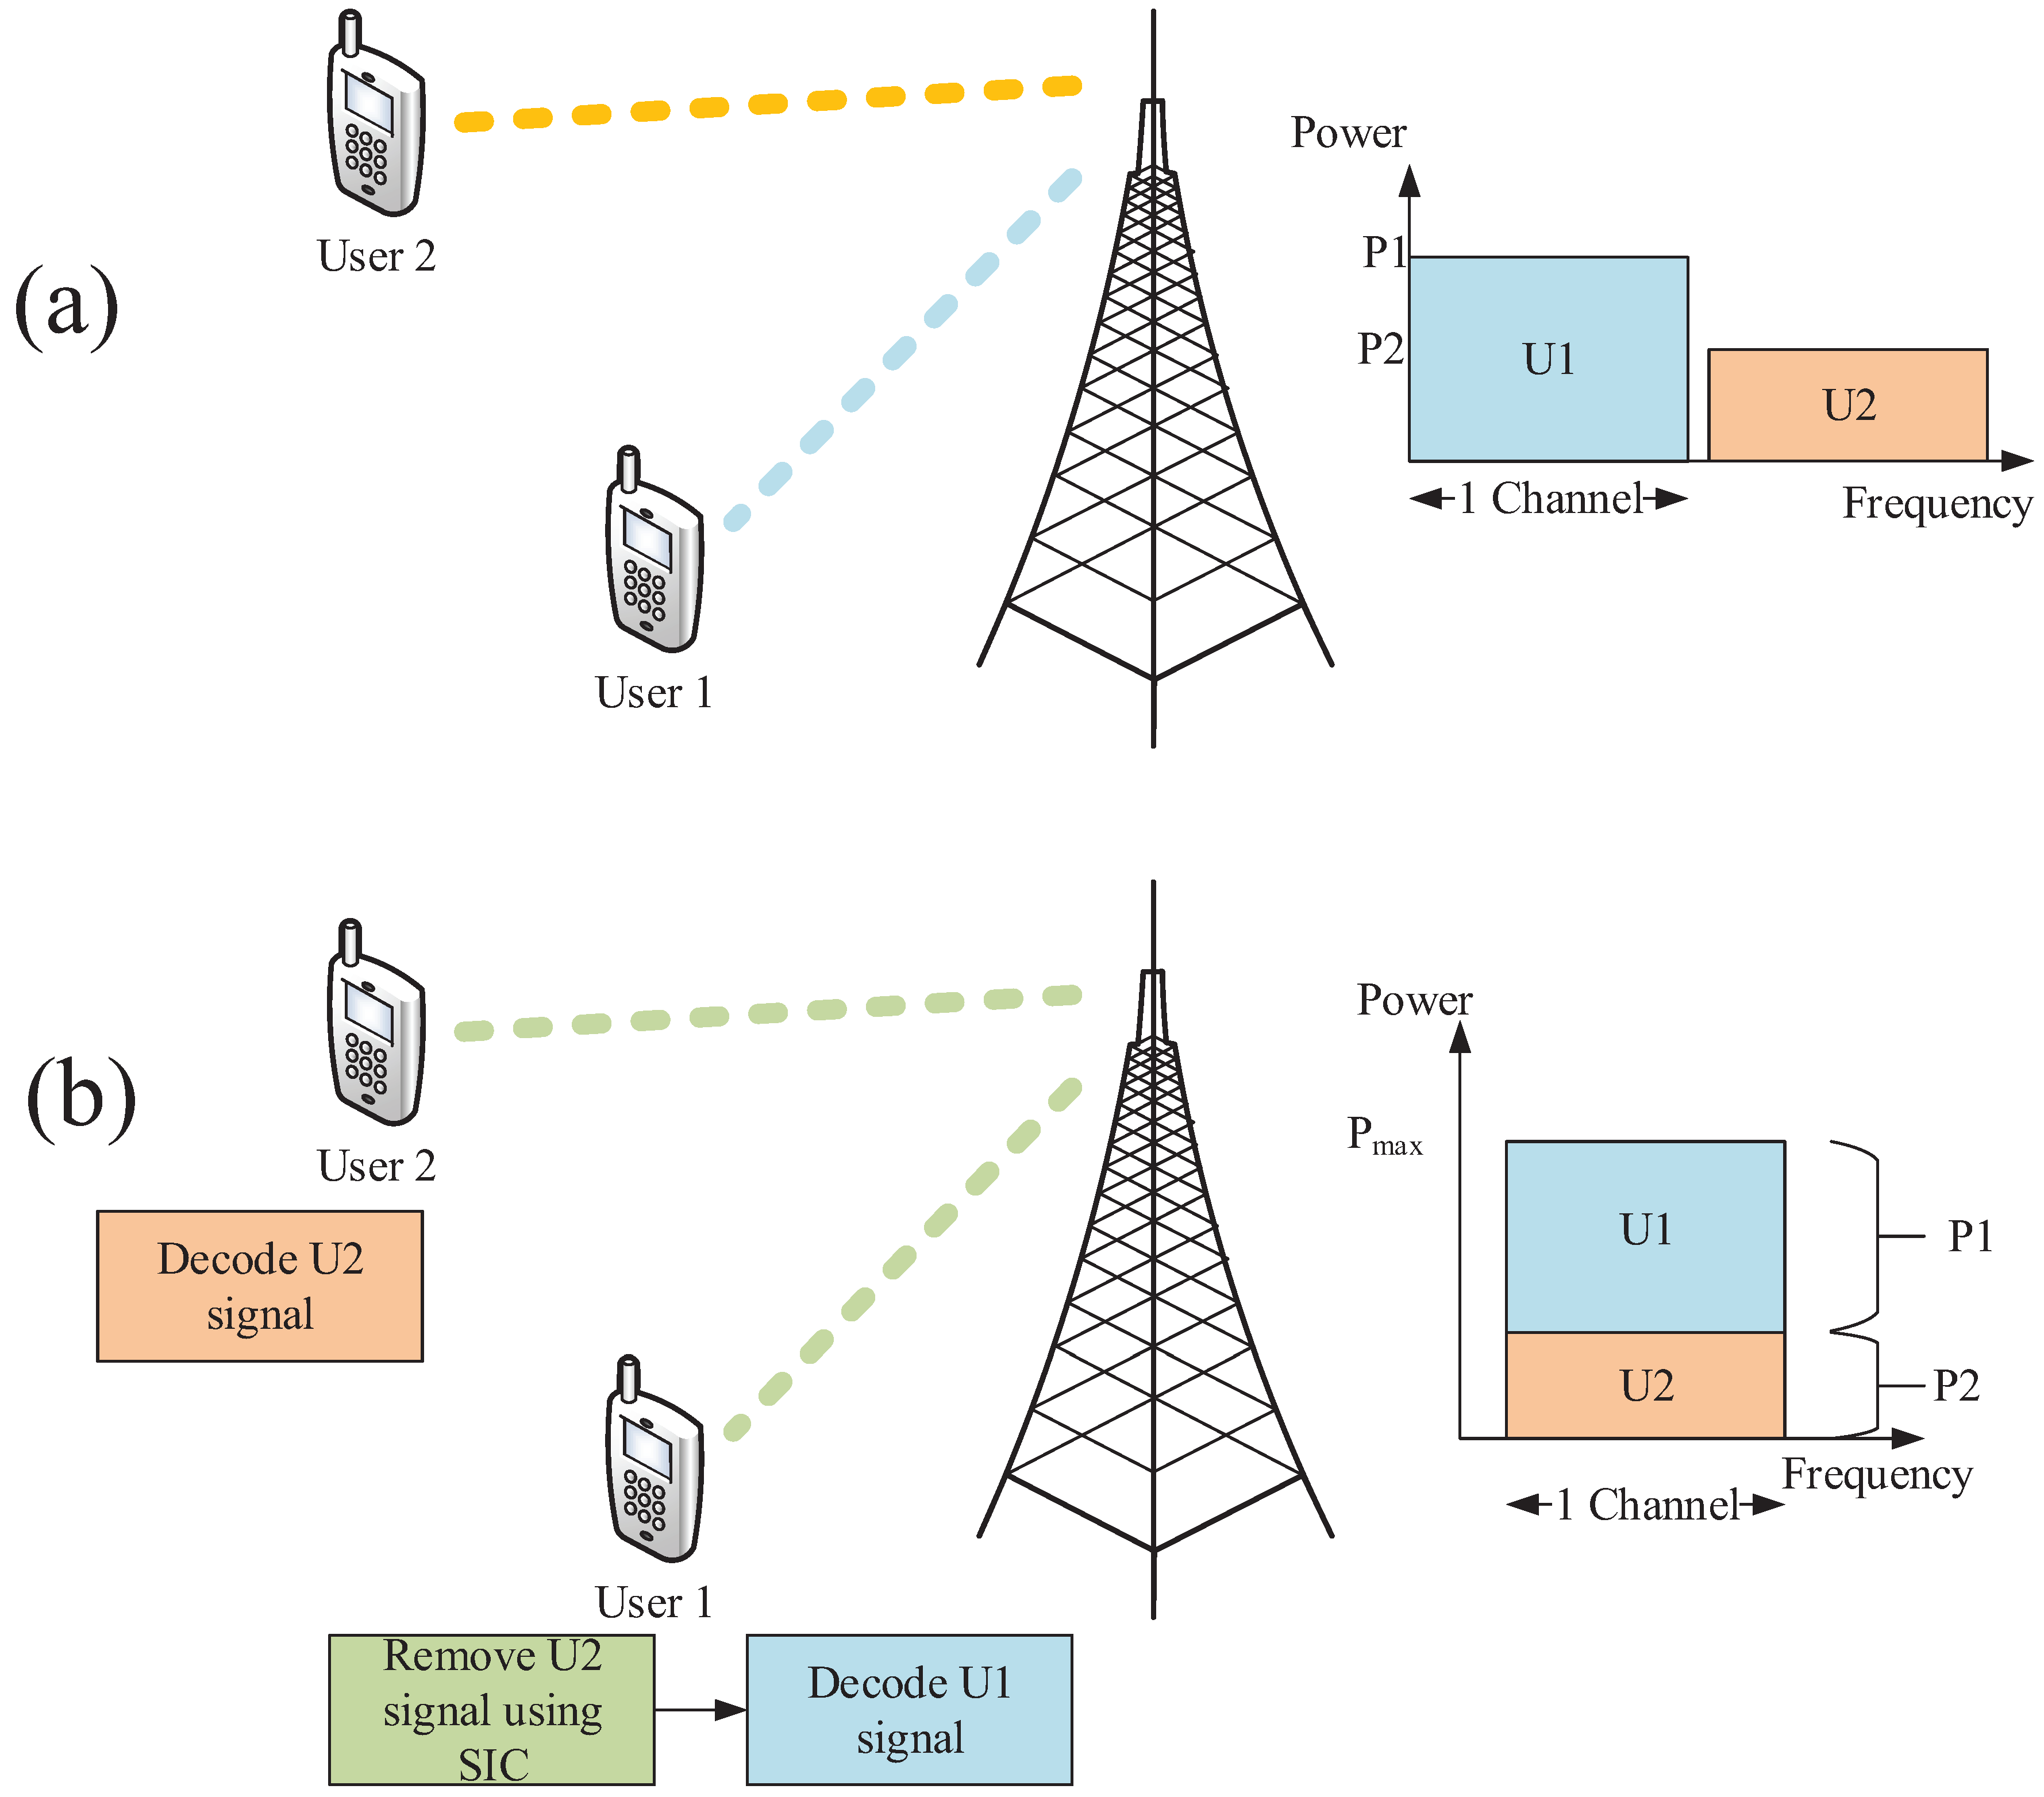
1.1. Preliminaries
- Detect the strongest user signal from the received signal.
- Decode the user signal.
- Regenerate the strongest user signal using its chip sequence.
- Use the generated signal to cancel the user signal from the received signal.
- Repeat the process until all the users have decoded their respective signals.
1.2. Related Work
1.3. Novelty of This Work and Structure of the Paper
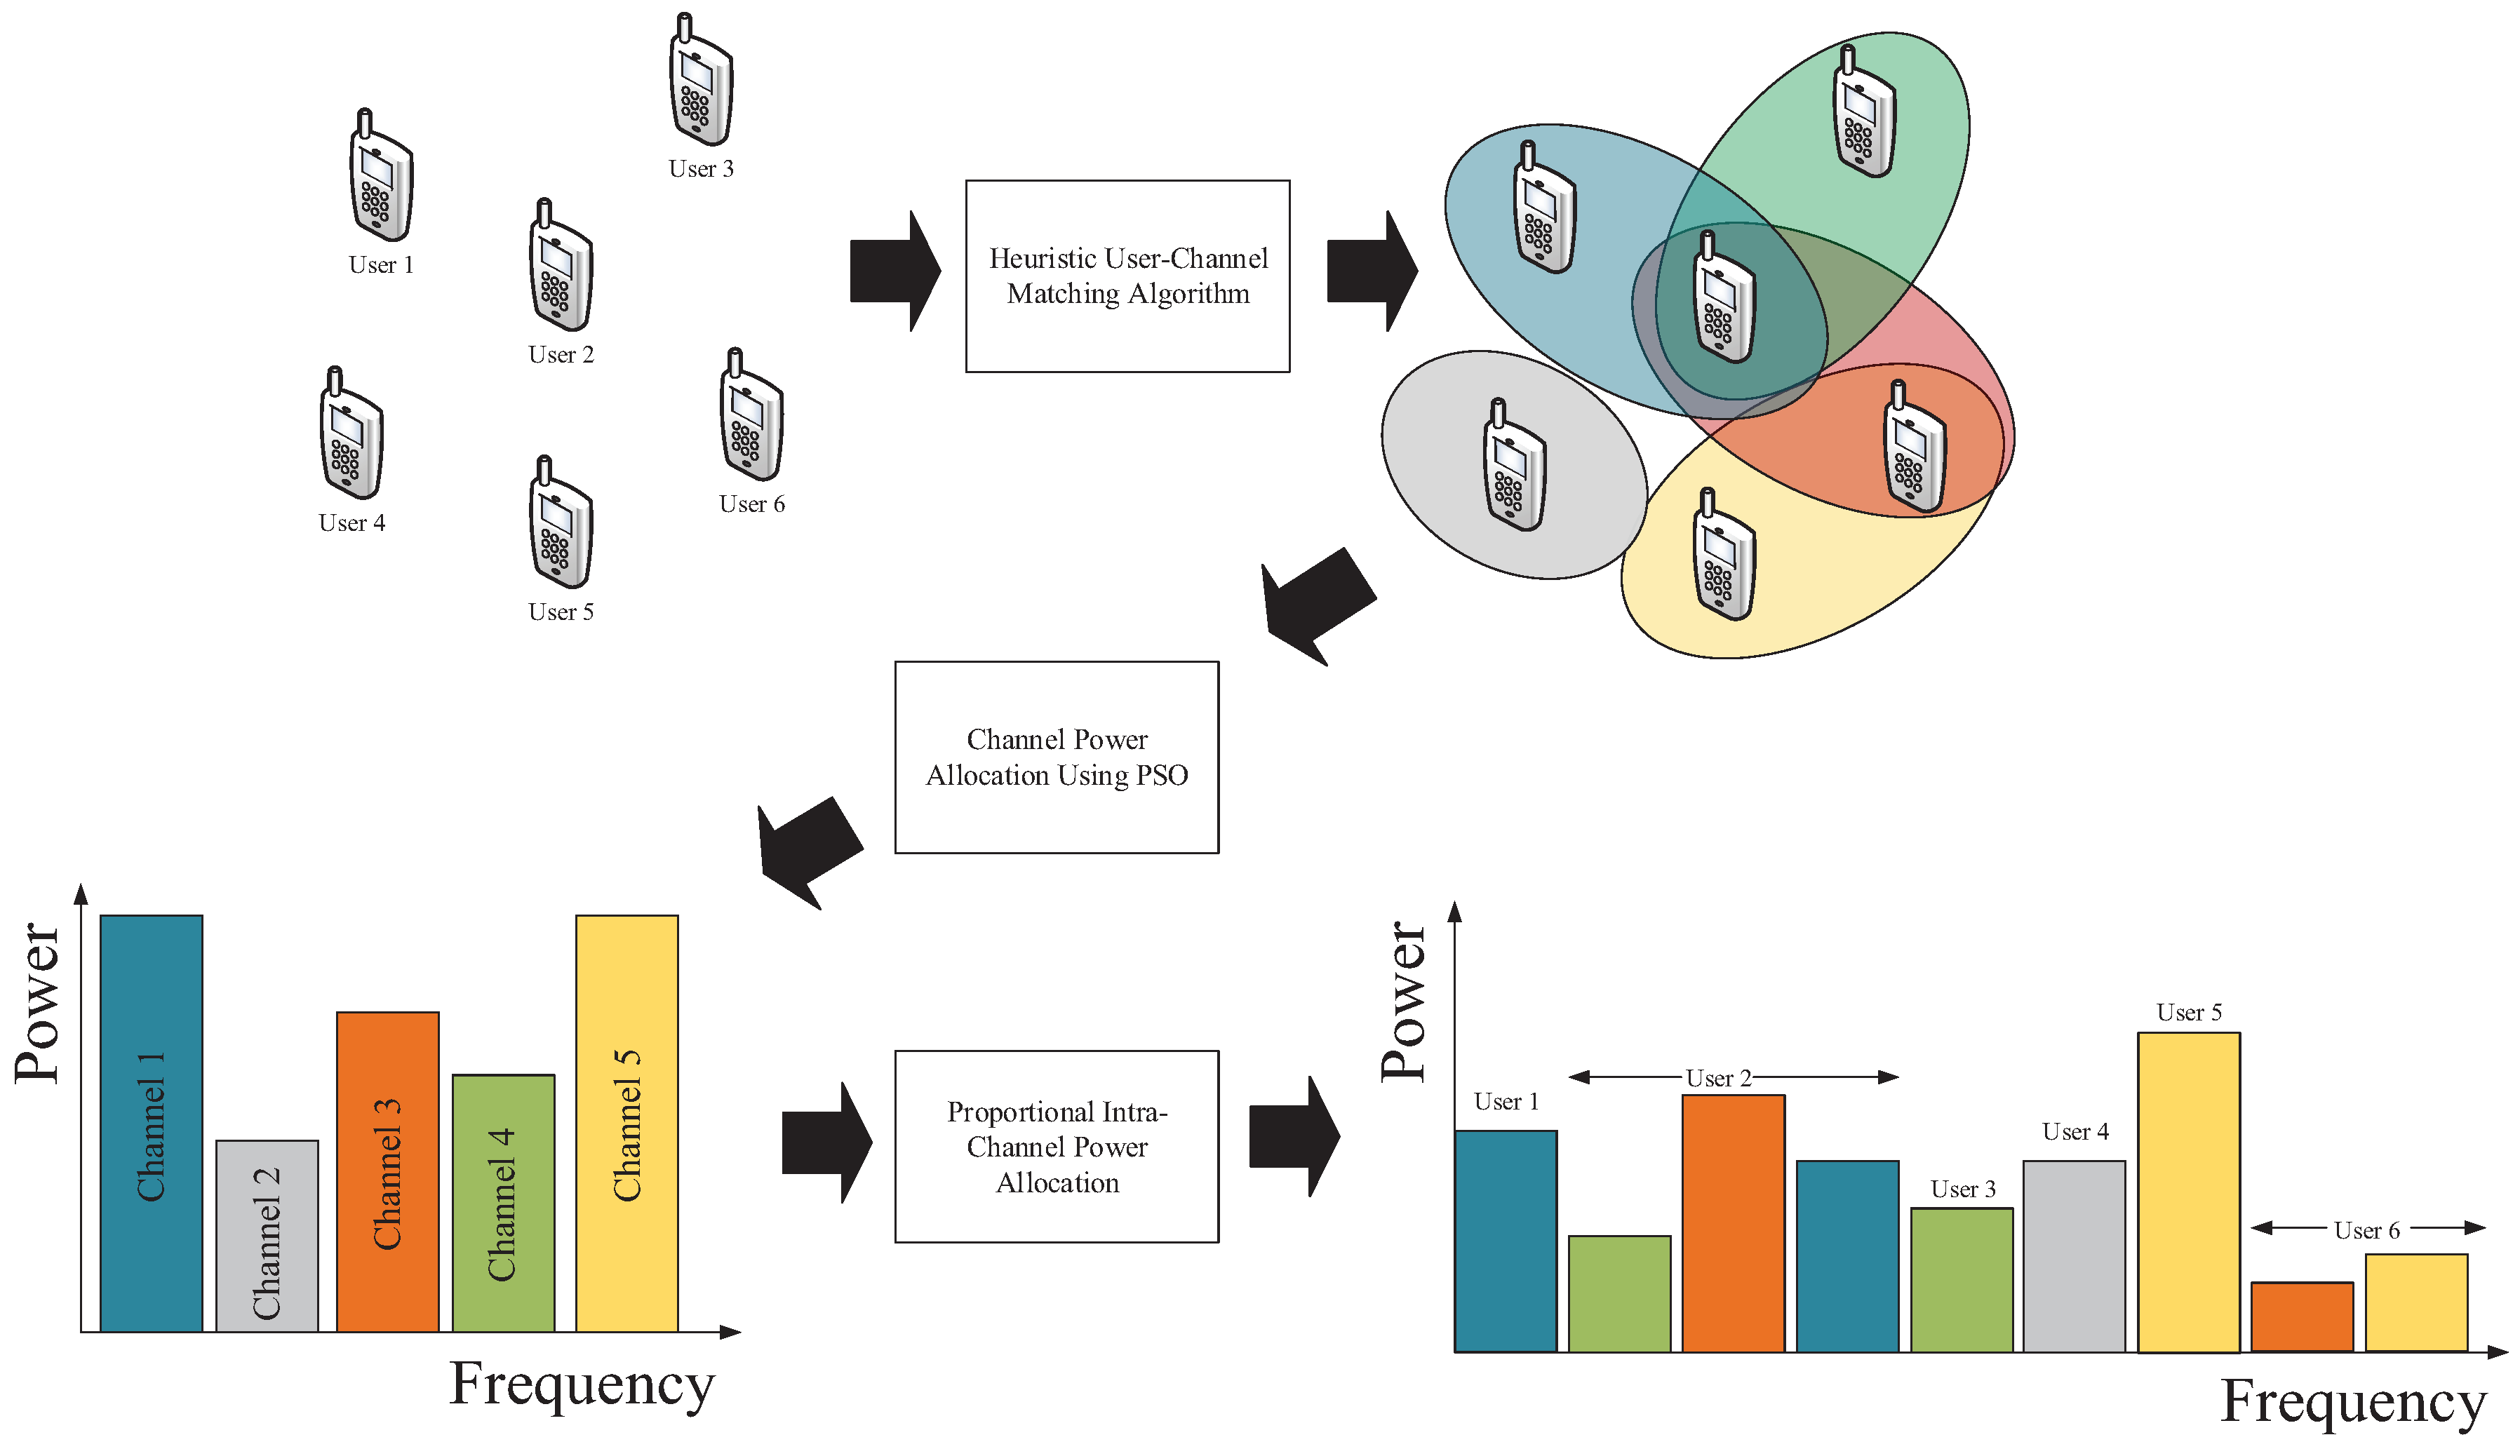
- A heuristic user-channel matching algorithm.
- Optimal power allocation to each channel using the PSO algorithm.
- Intra-channel power allocation to each user based on the channel gain of each user.
2. System Description and Problem Formulation
2.1. Description of the NOMA Scheme with SIC
2.2. Problem Formulation
3. Proposed Channel Matching and Power Allocation Methods
3.1. Heuristic User-Channel Matching
| Algorithm 1 Heuristic channel–user matching. |
| Input:S: number of channels, K: number of users, H: channel gain matrix Output:: user-channel assignment binary matrix Initialization:
|
3.2. Power Allocation
| Algorithm 2 Channel power allocation using particle swarm optimisation (PSO). |
| Input:S: number of channels, M: population size, : user gain of each channel Output:: power assigned to each channel Initialization:
|
3.3. Numerical Example
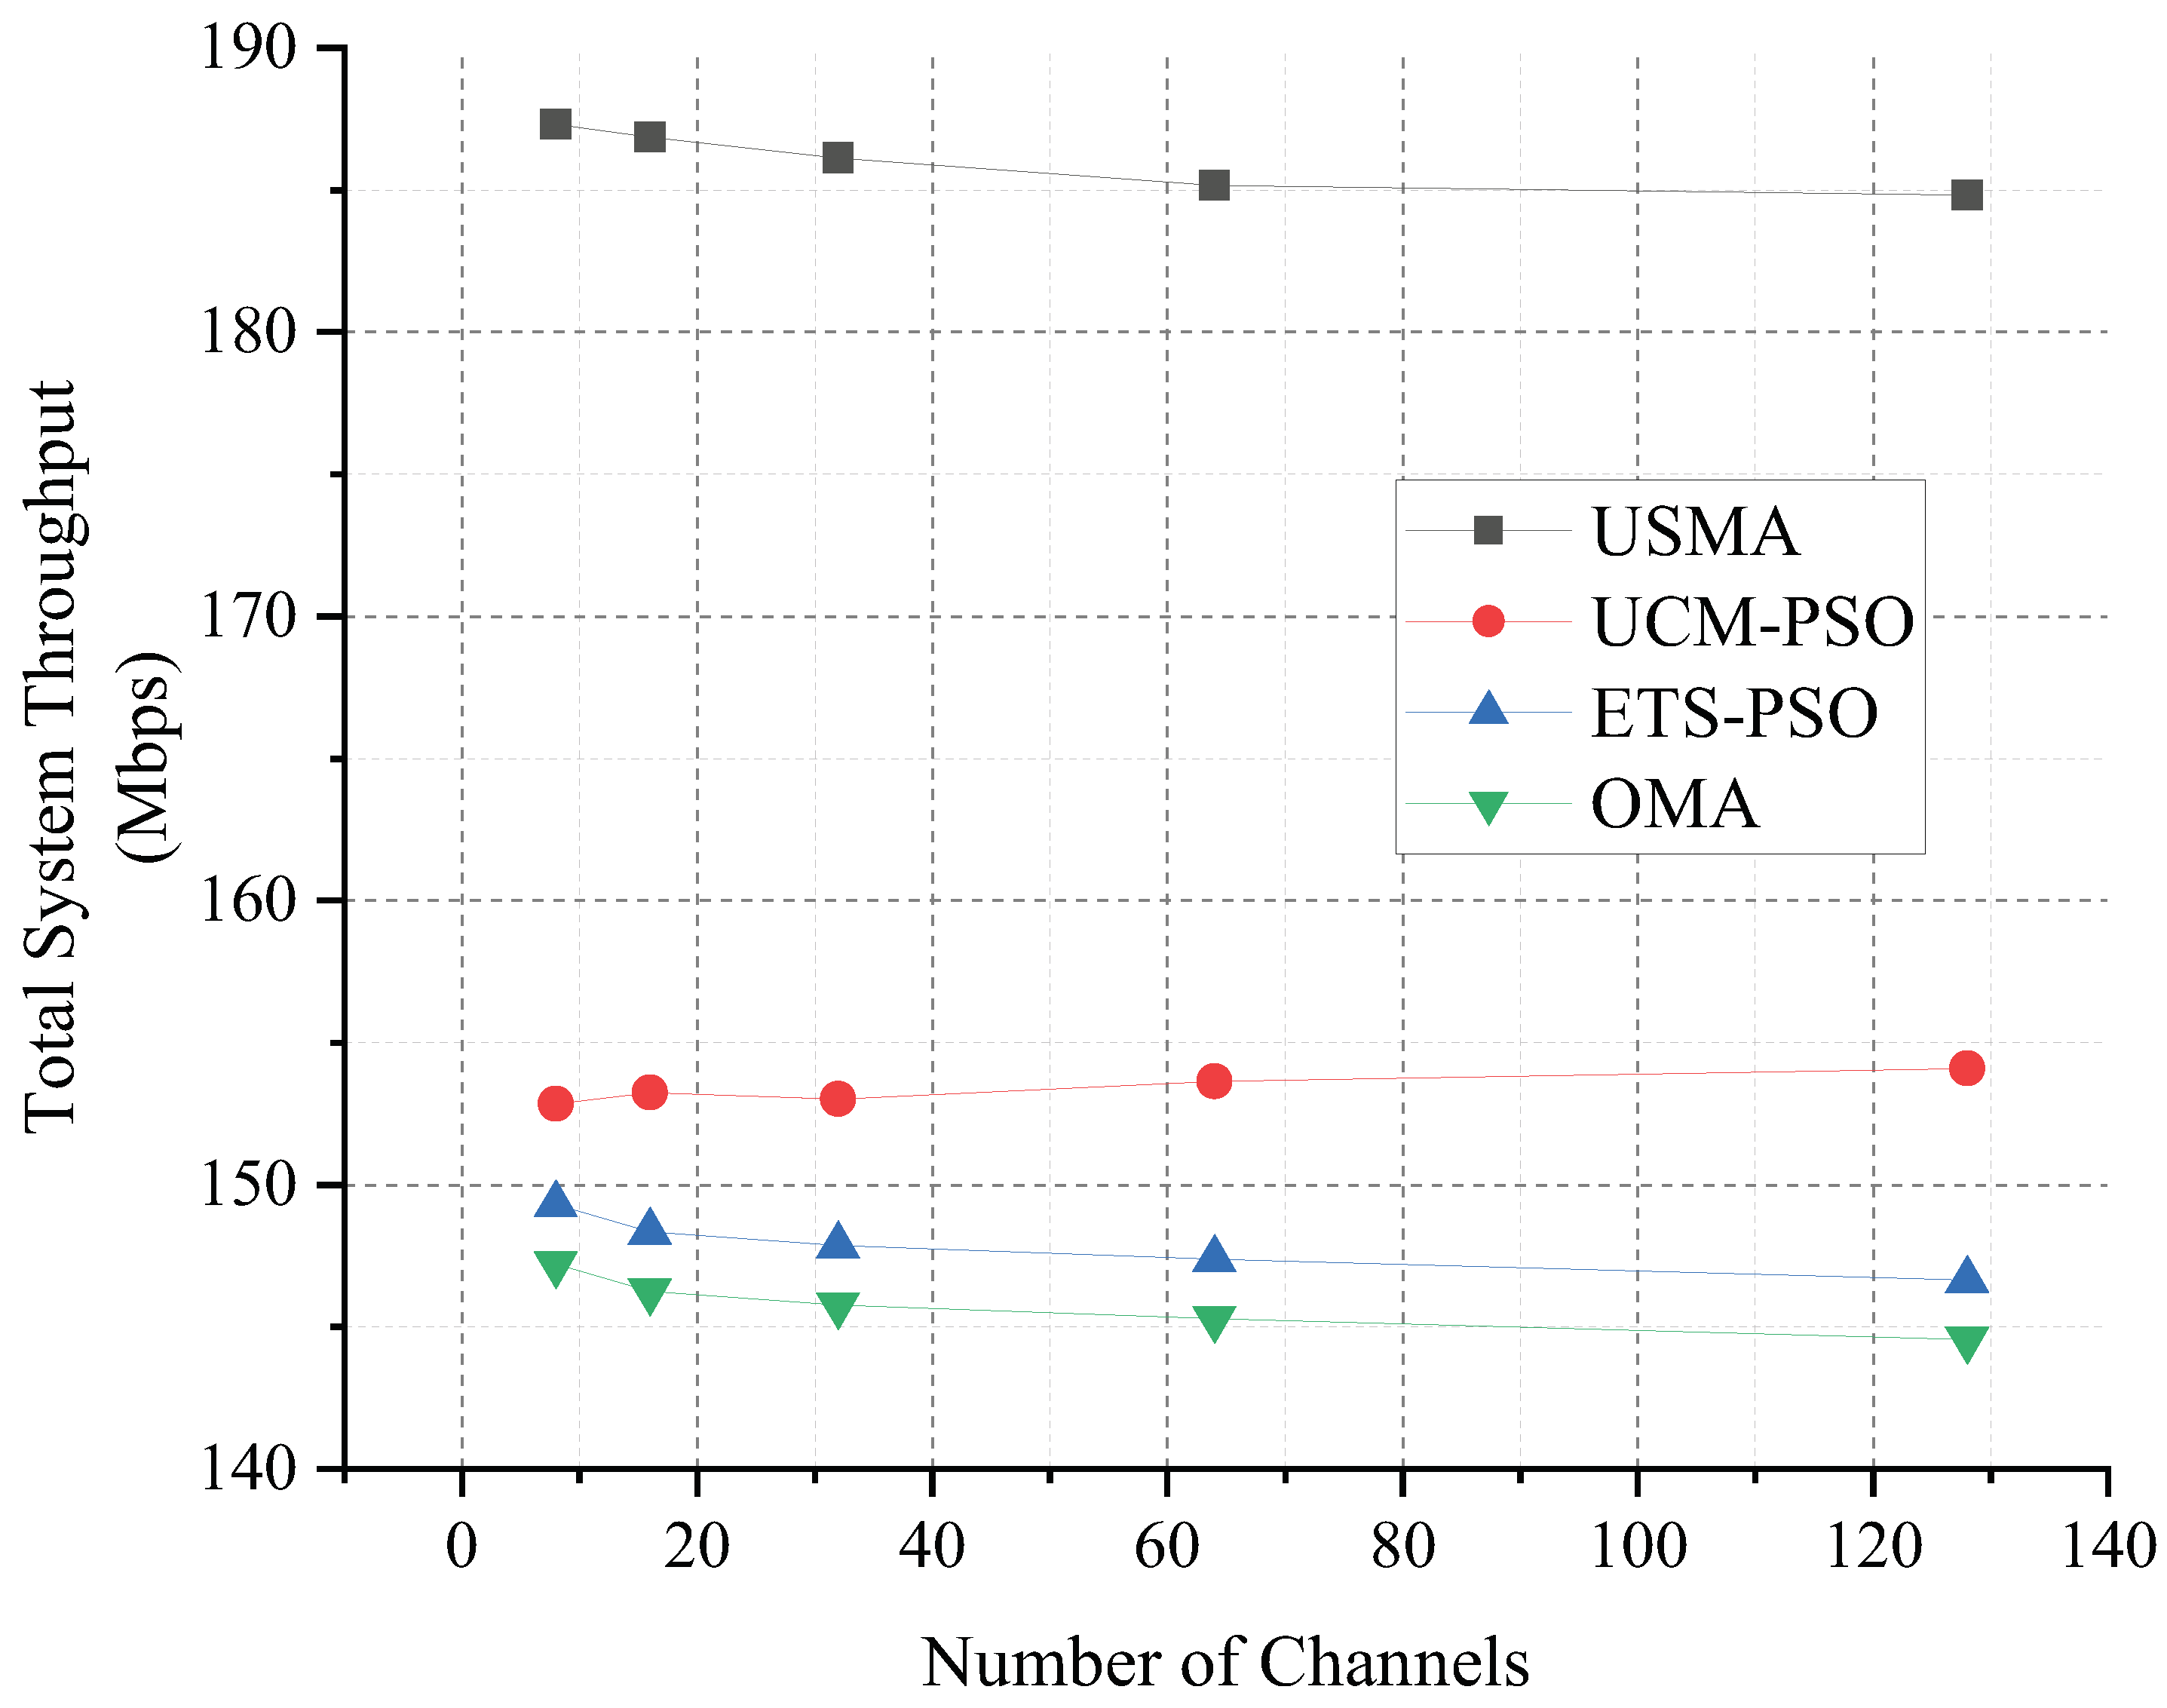
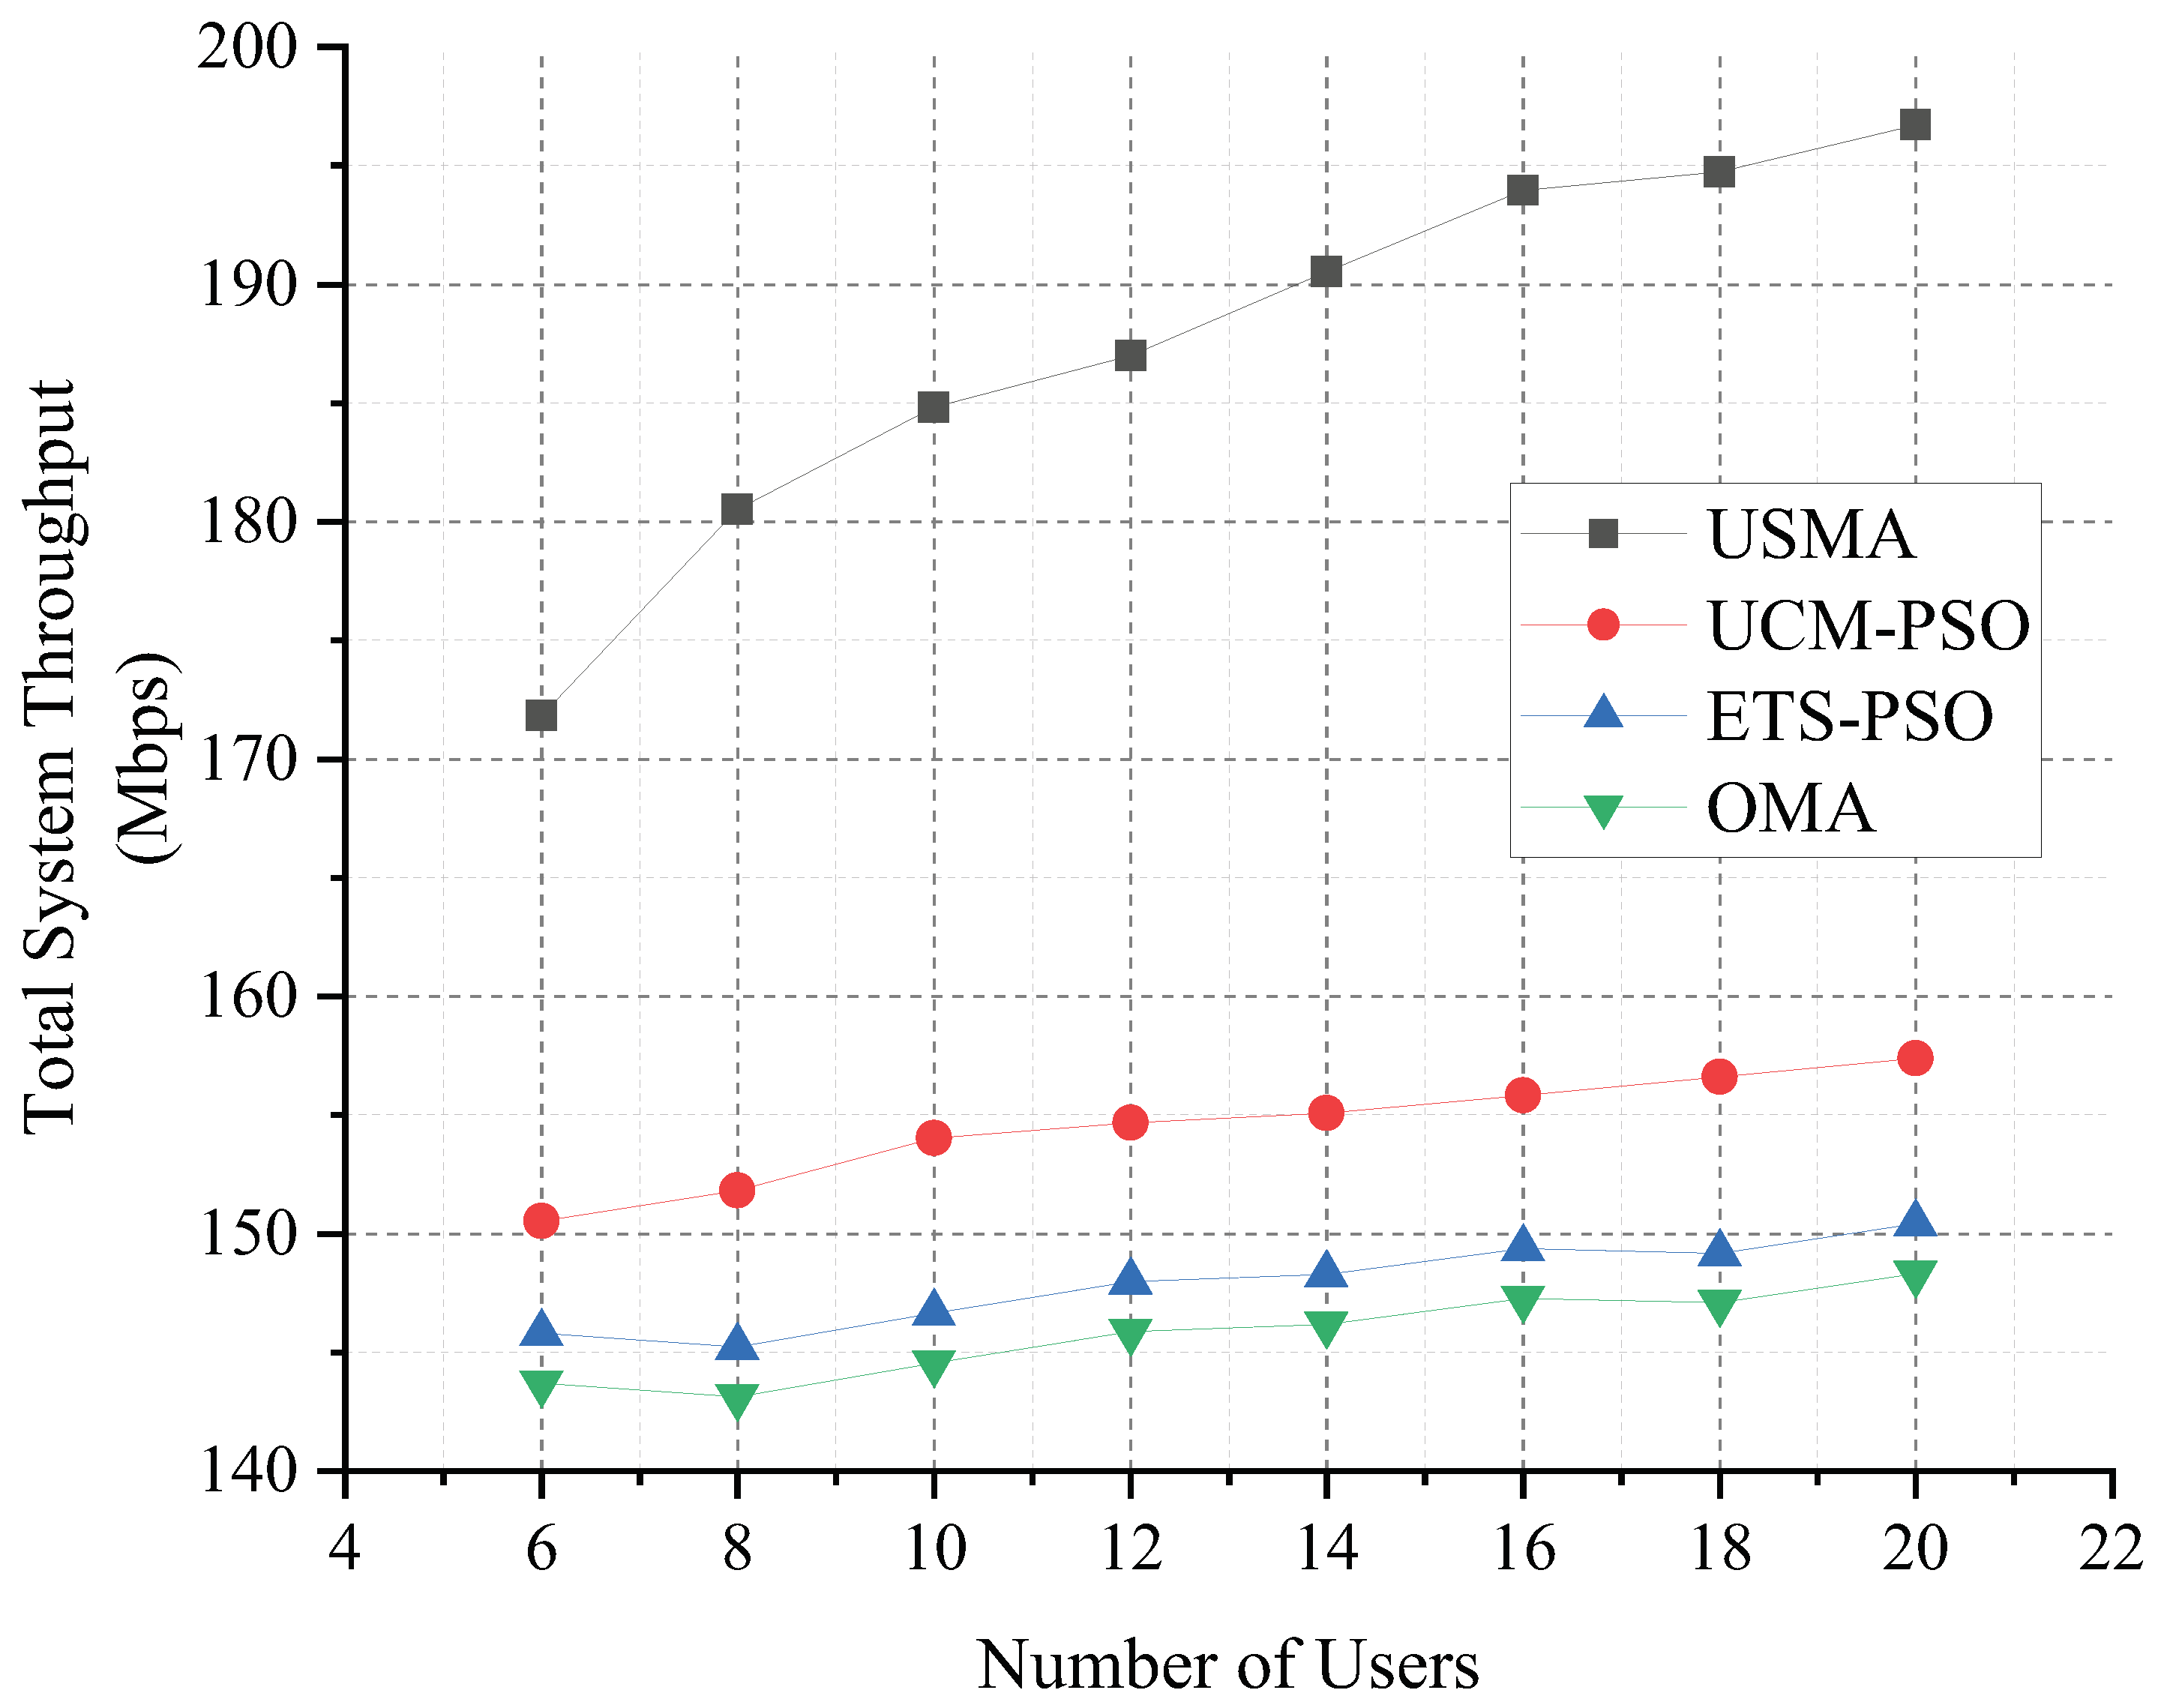
4. Performance Evaluation
4.1. System Model Parameters
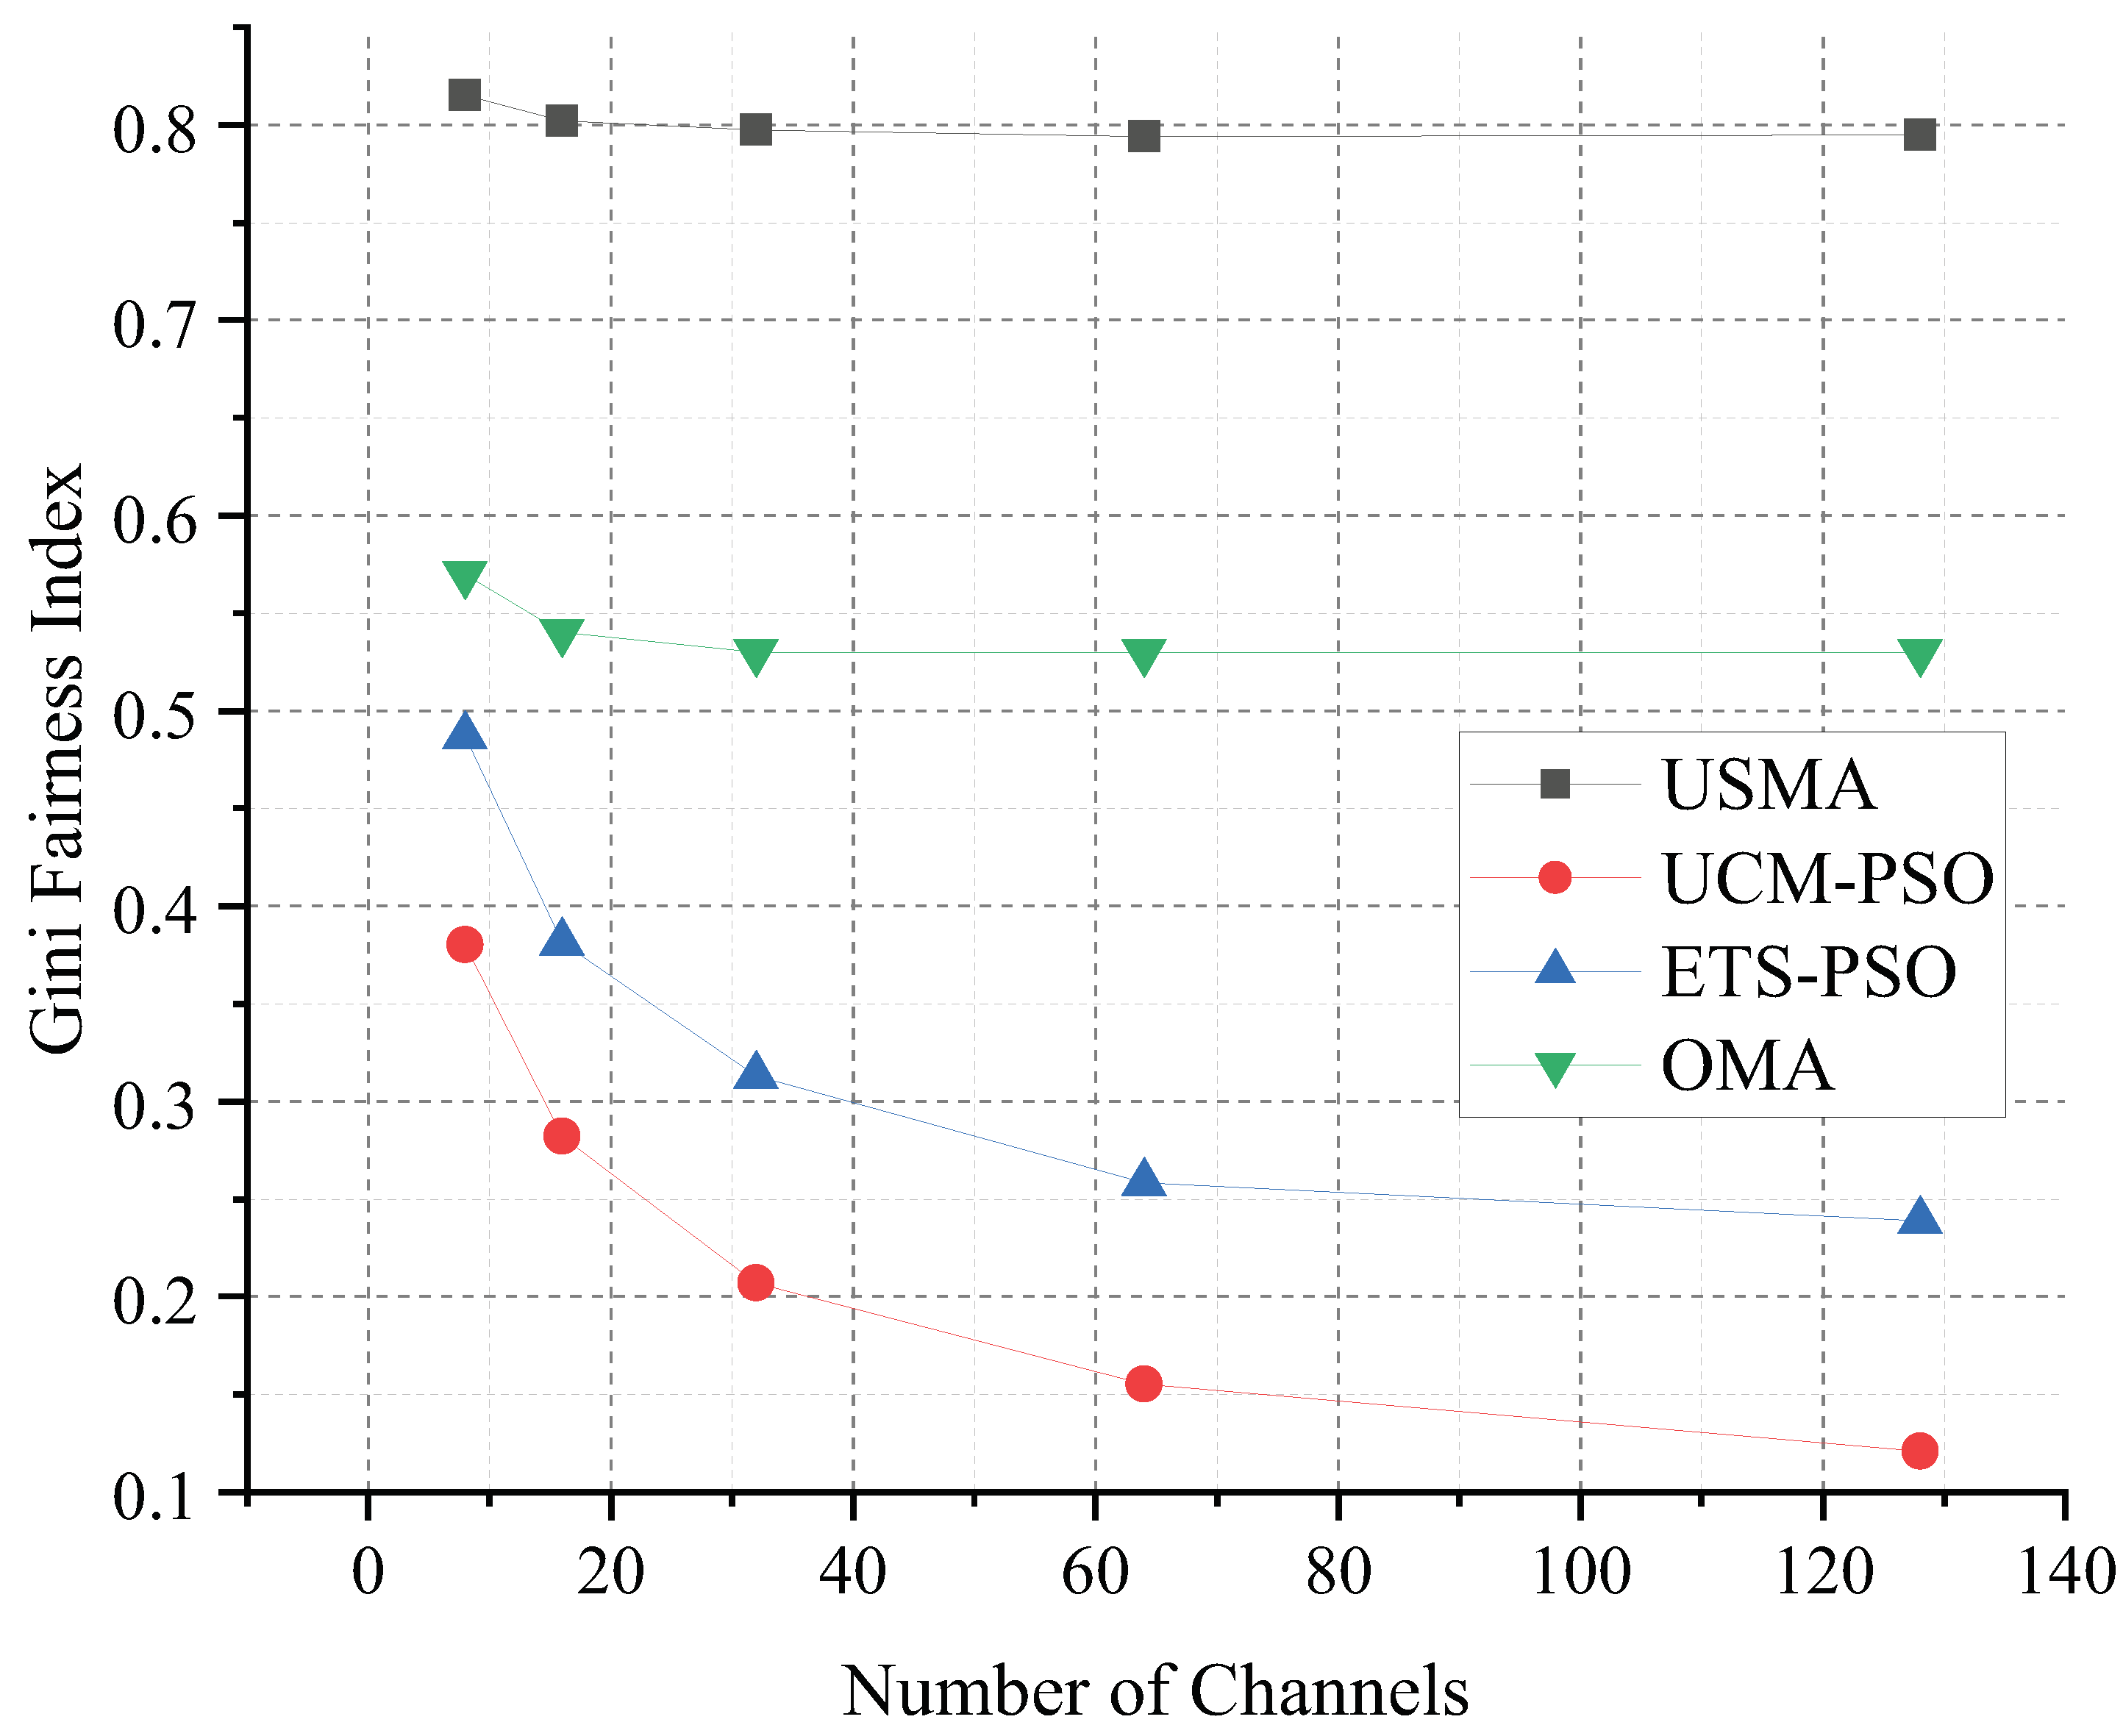
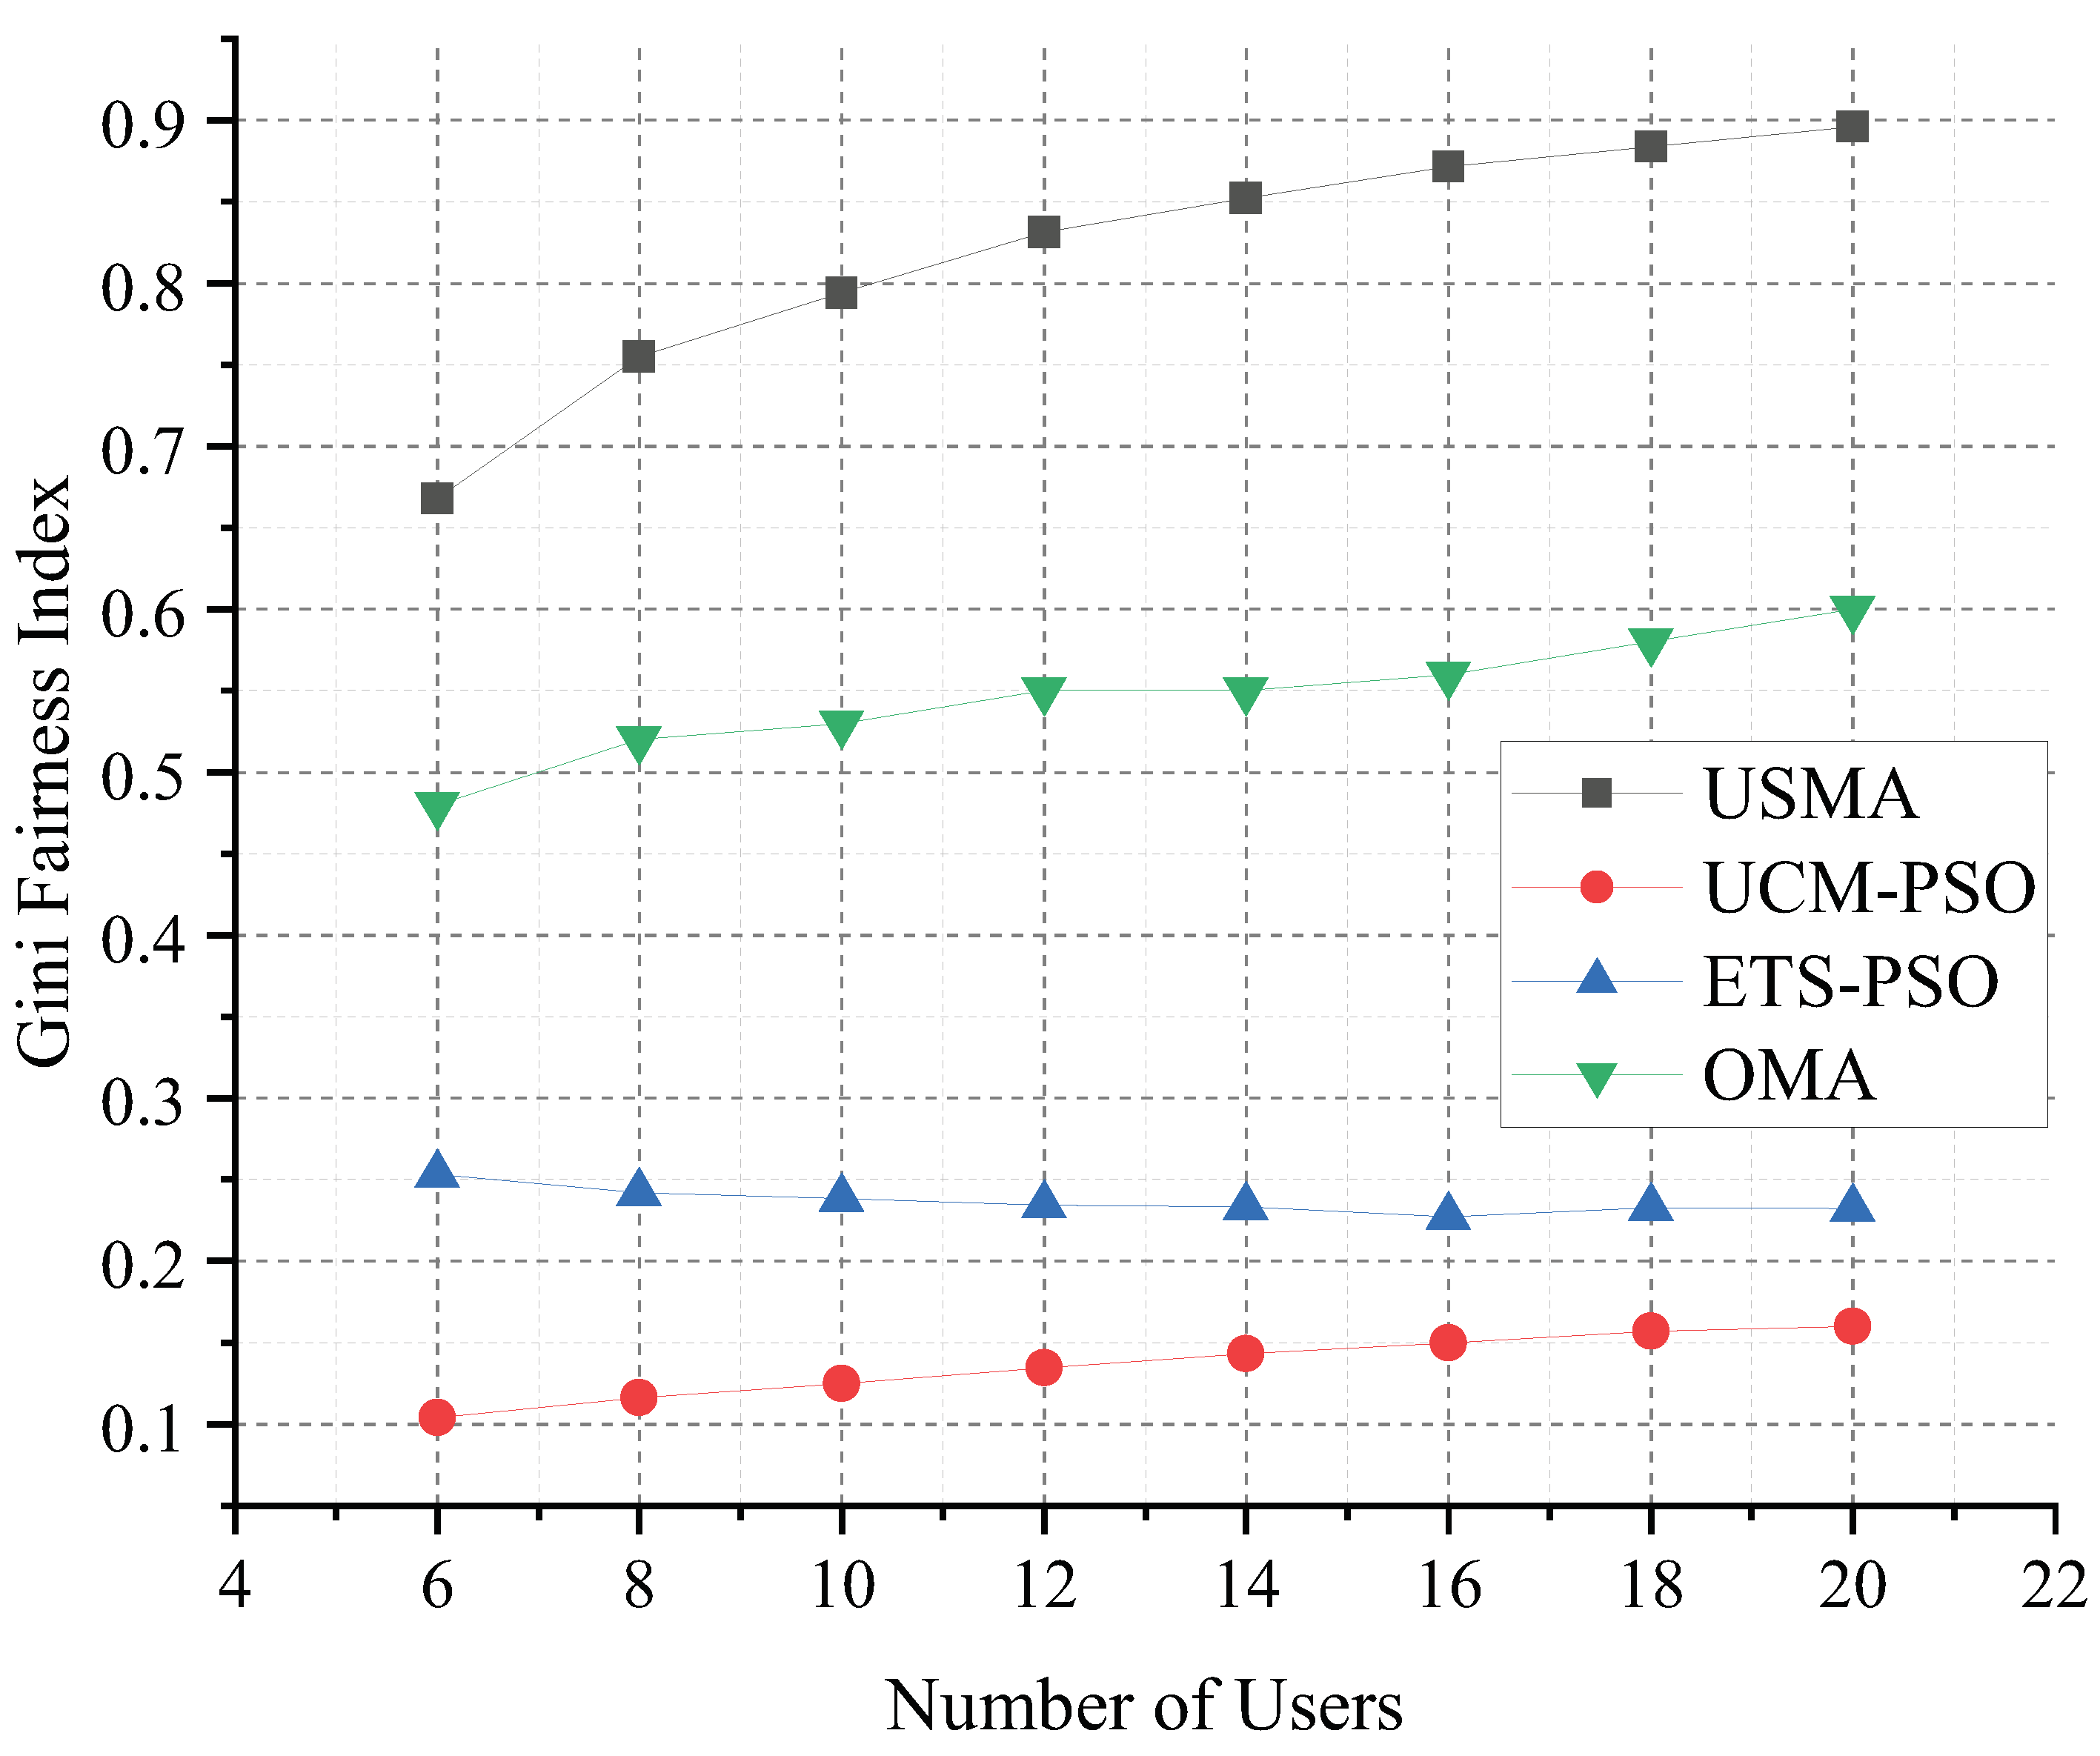
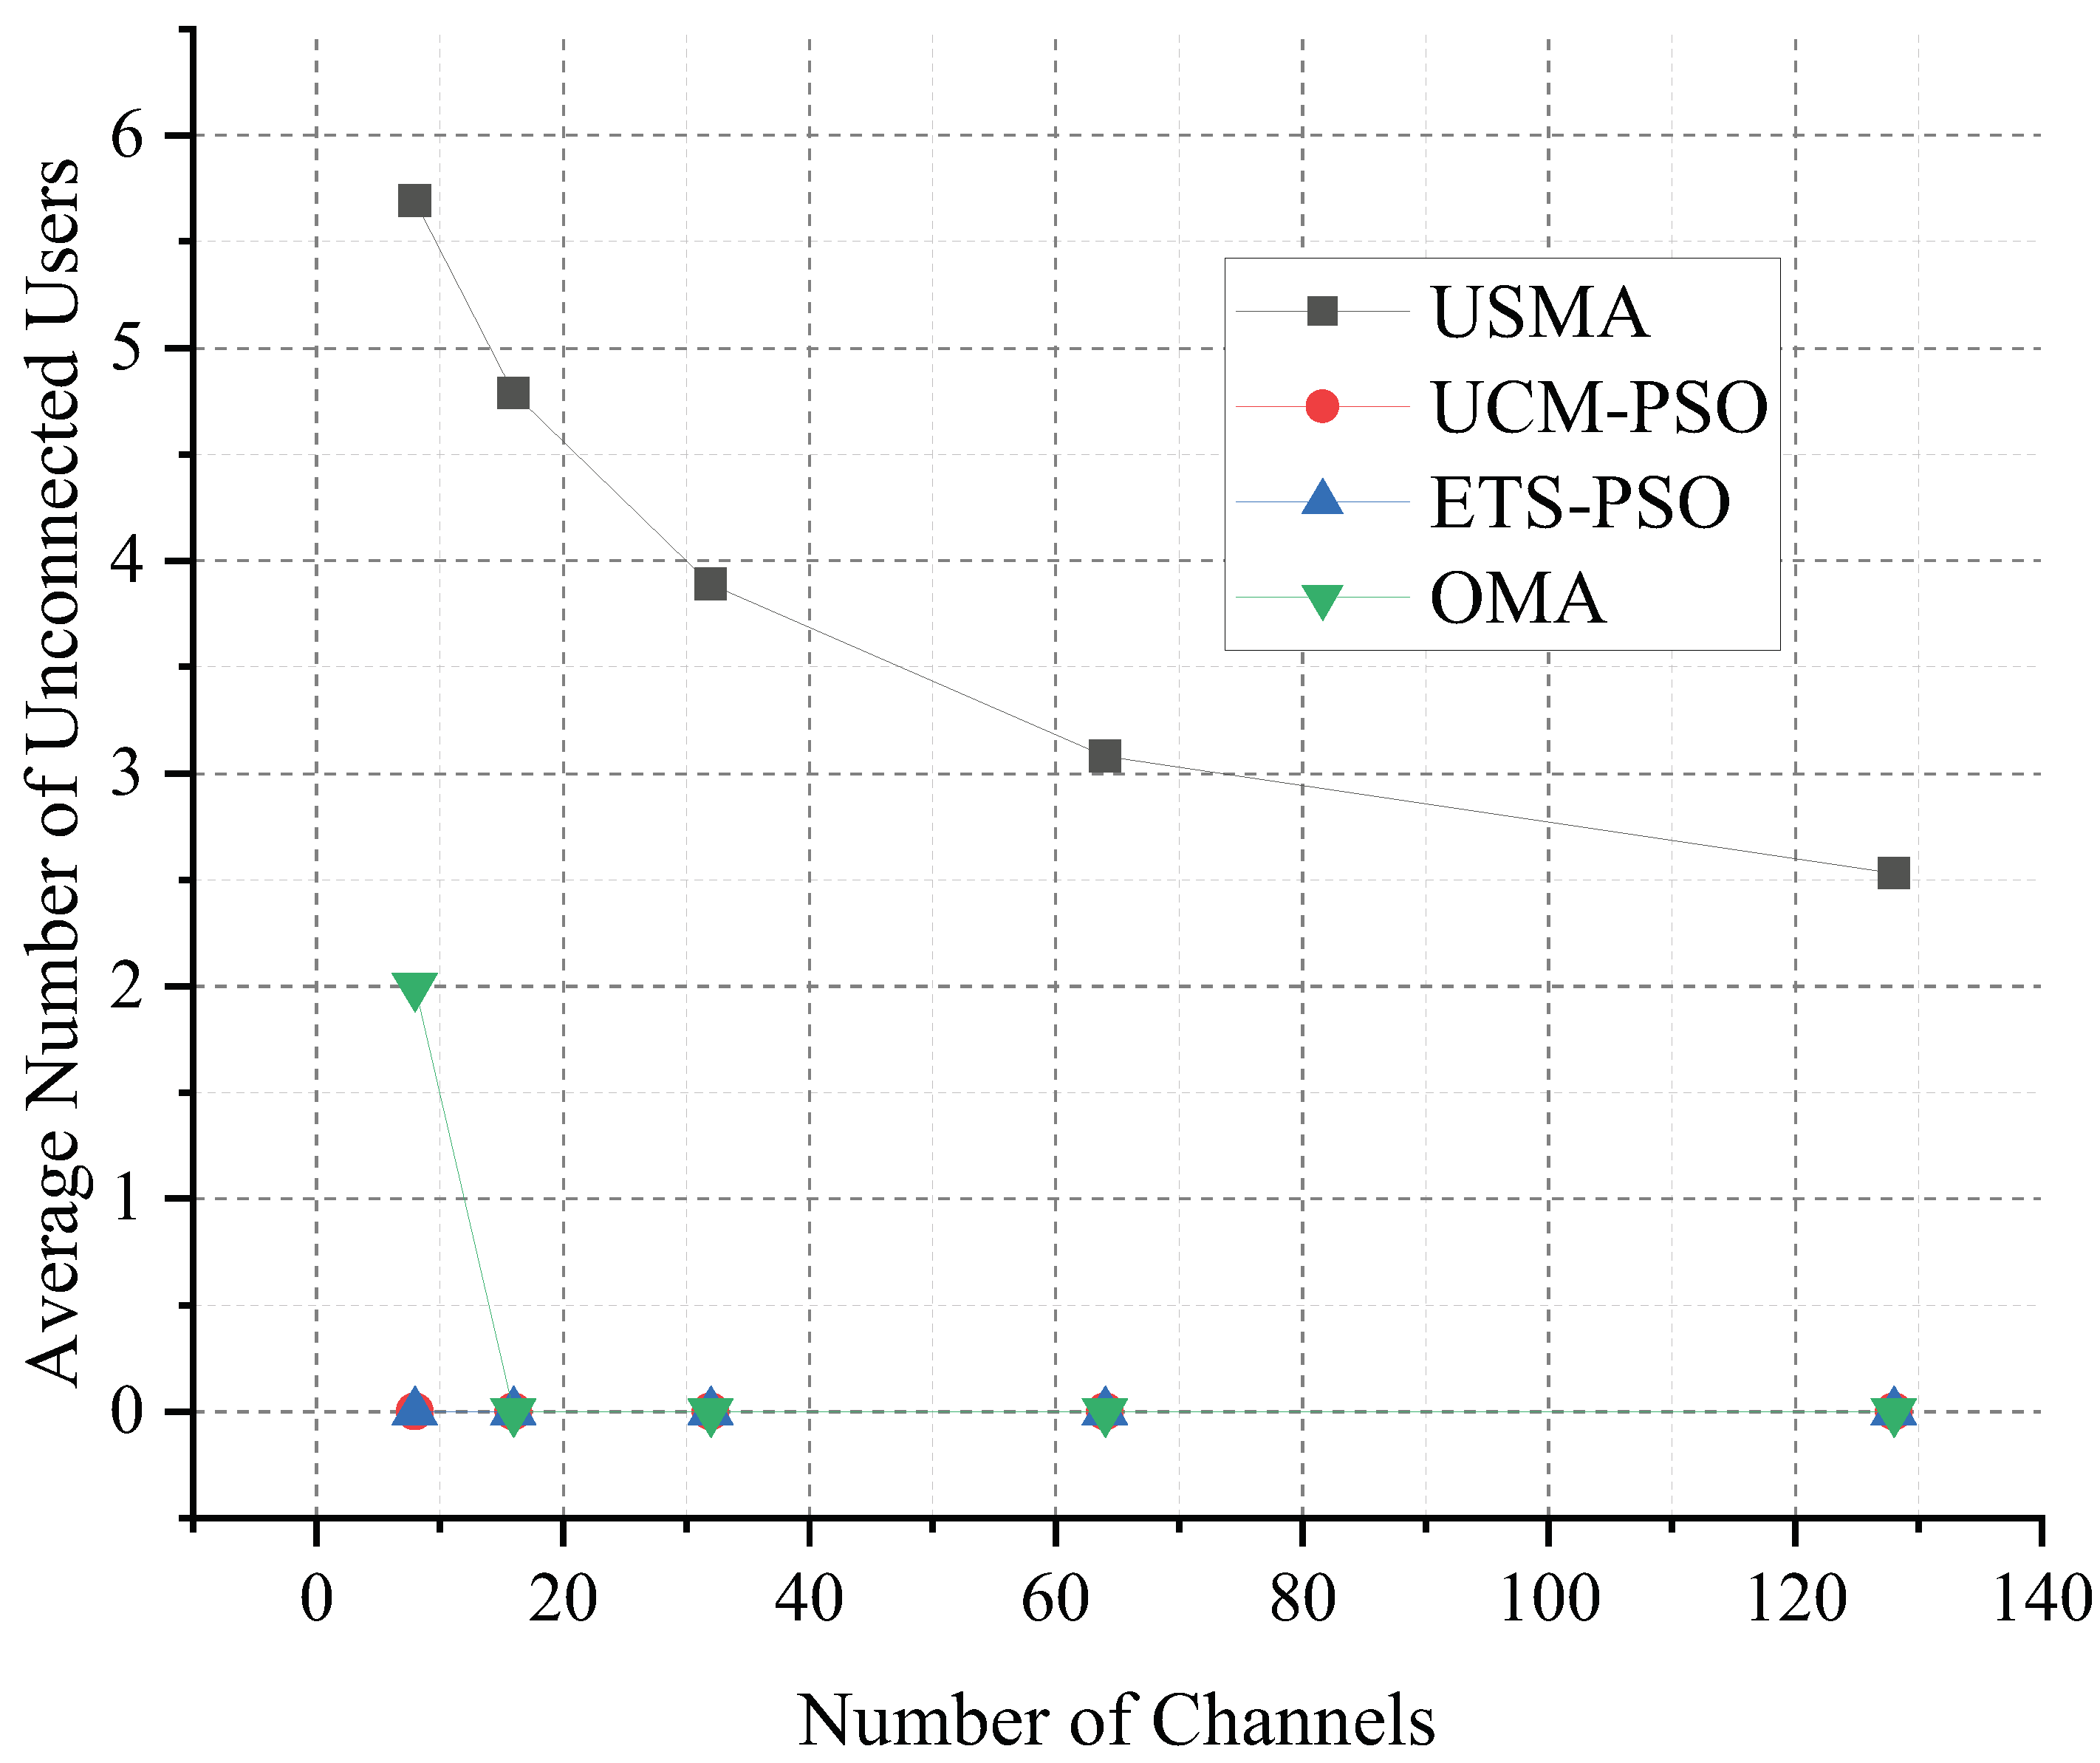
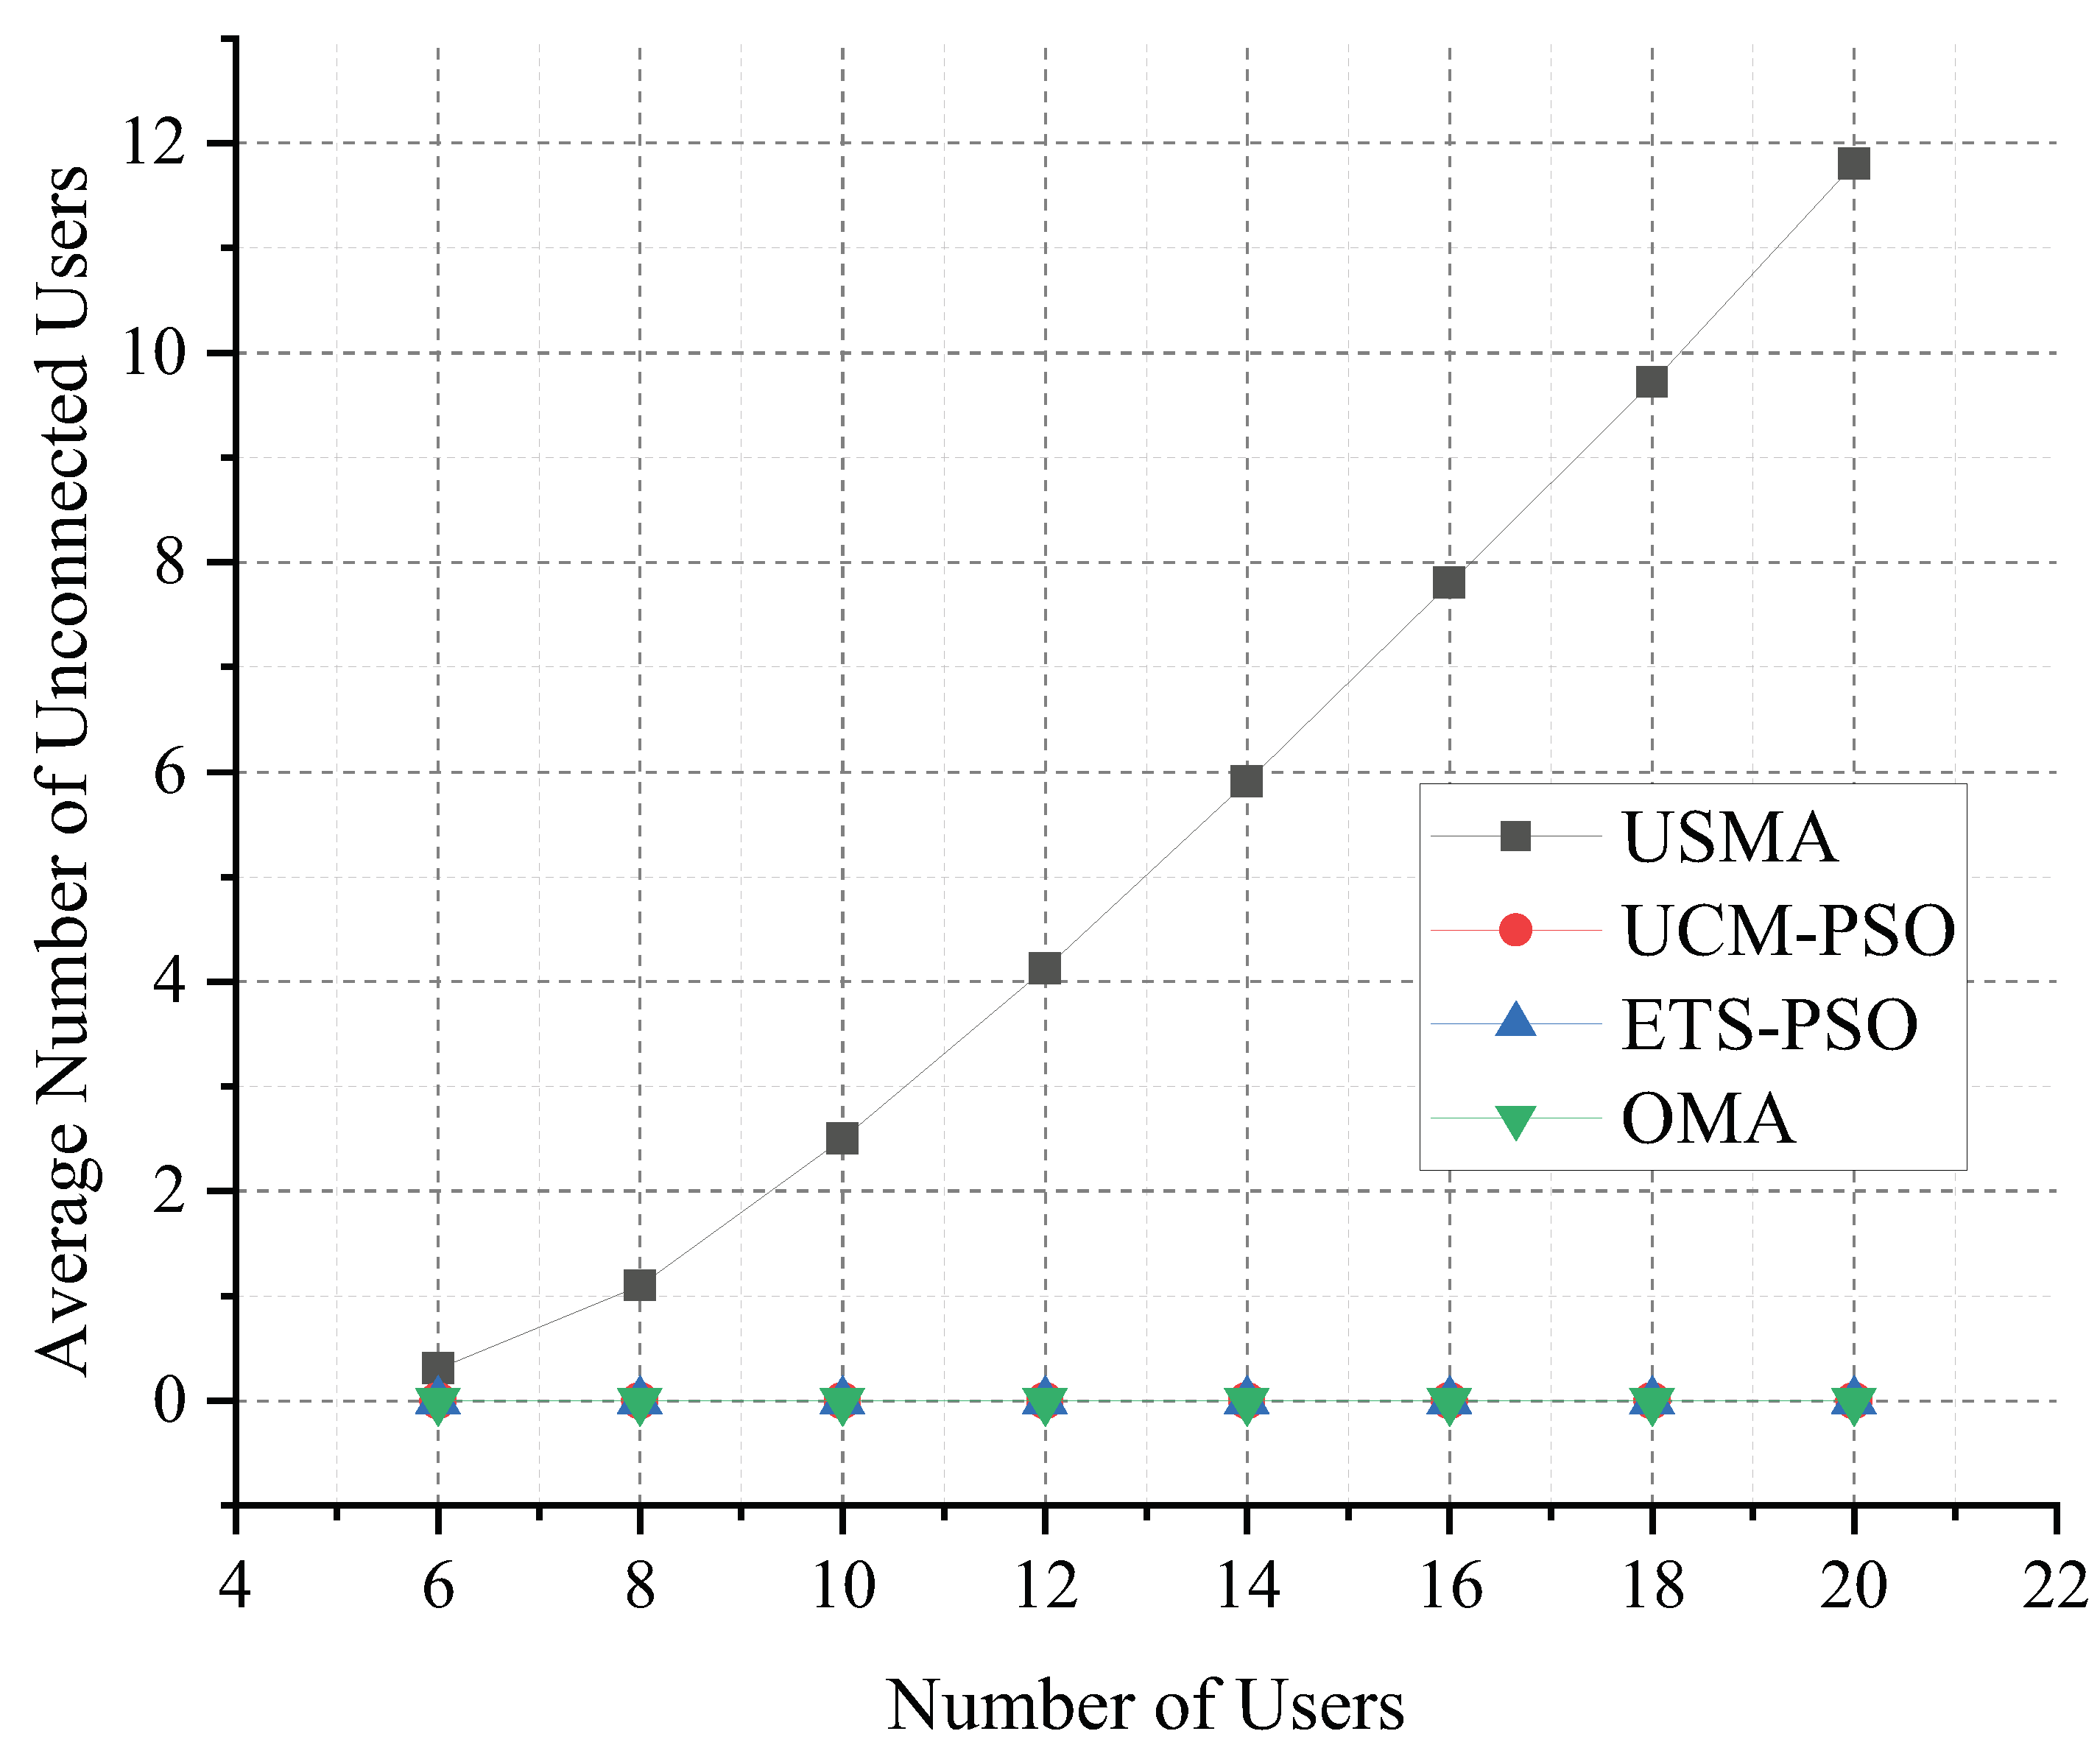
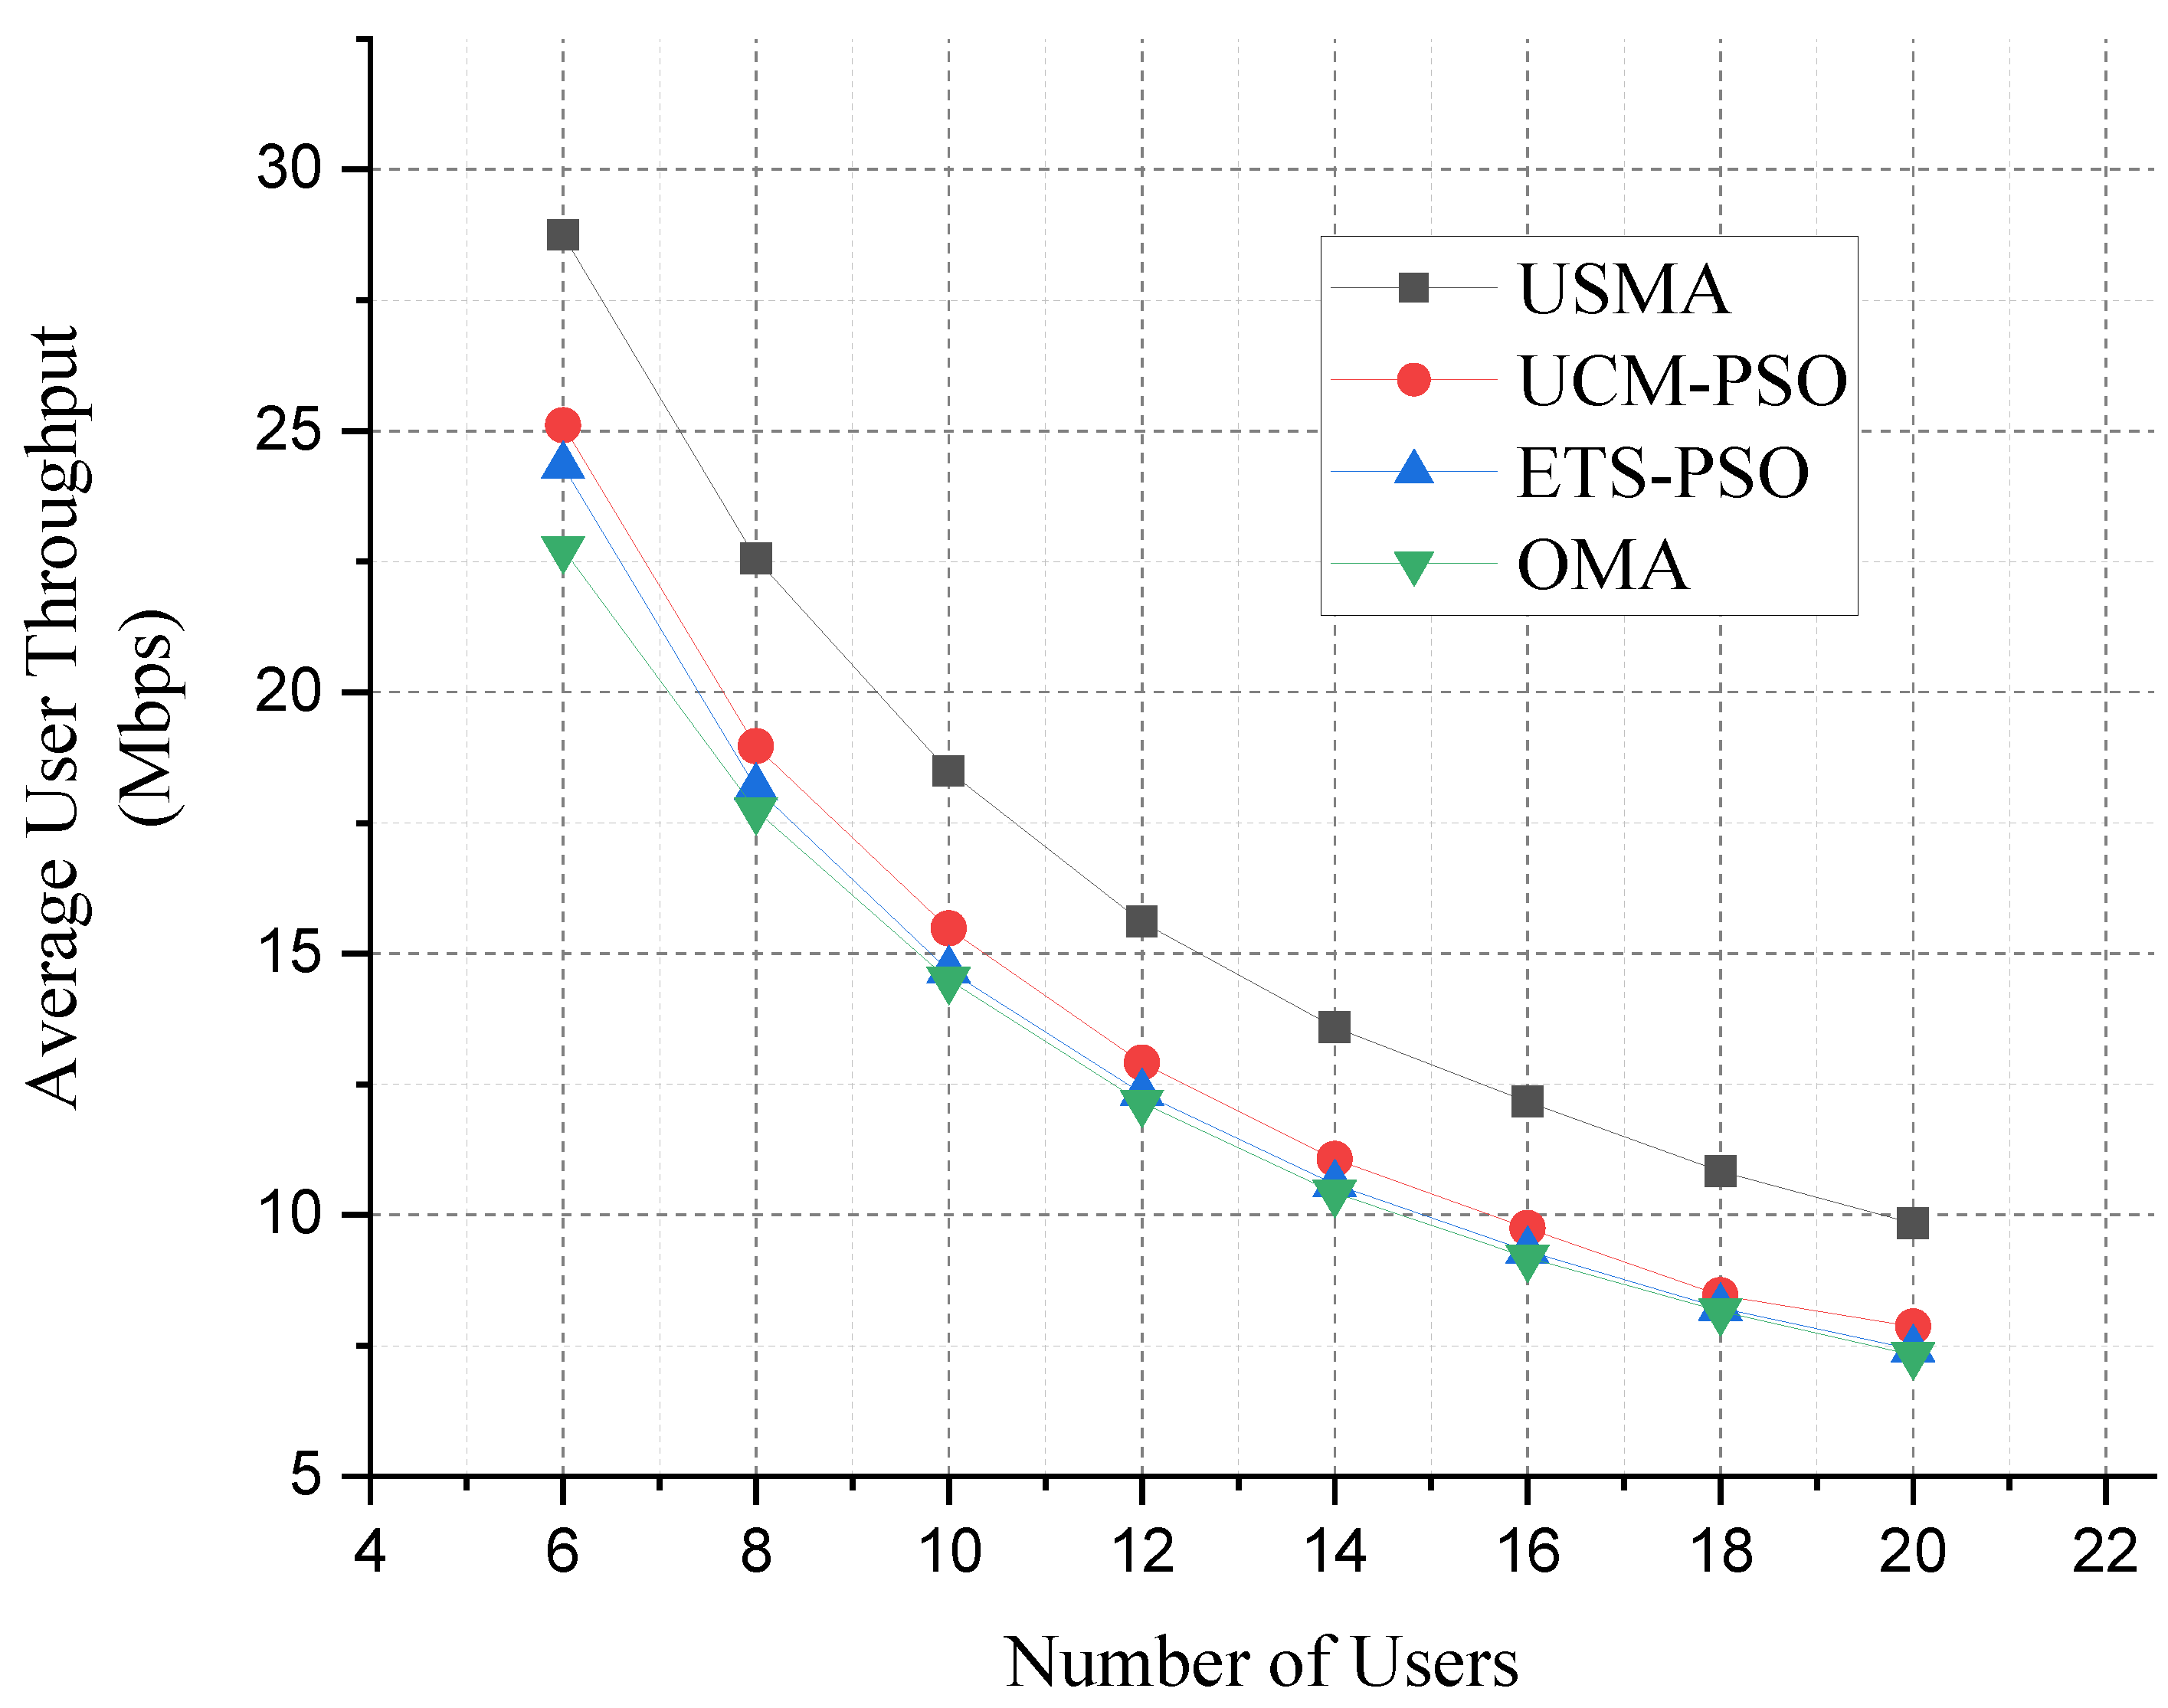
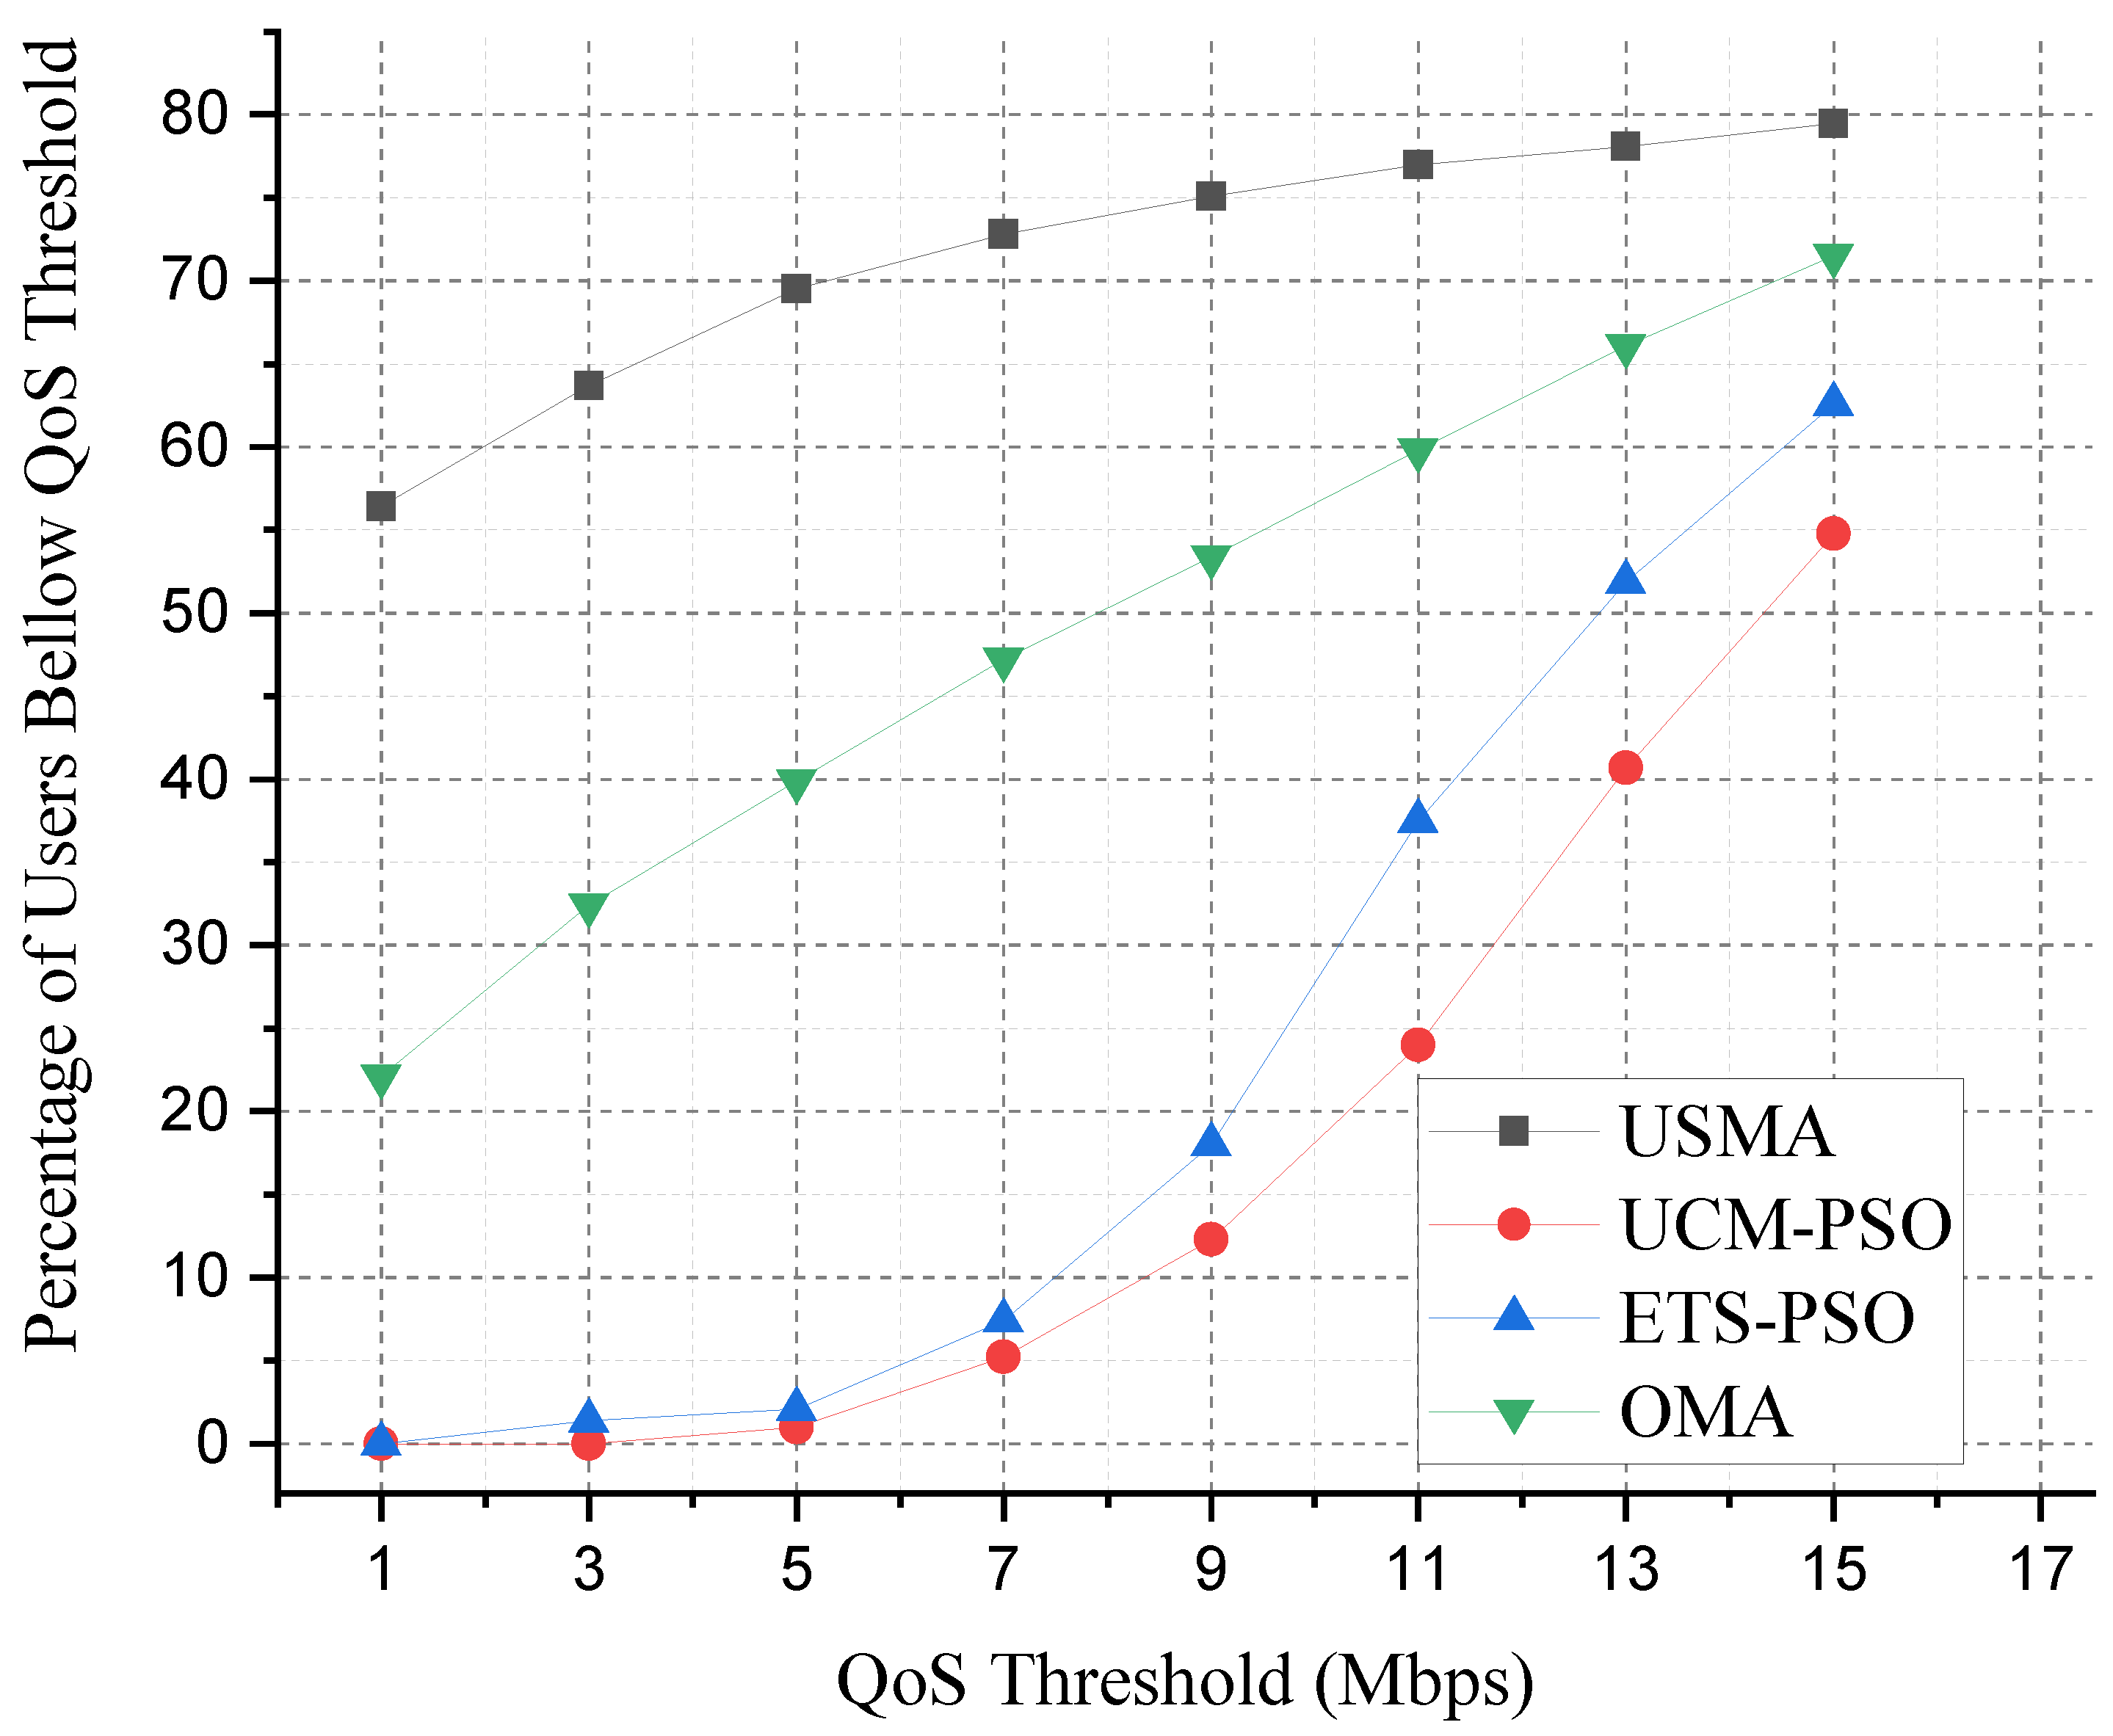
4.2. Numerical Results
5. Conclusions
Author Contributions
Funding
Conflicts of Interest
References
- Akyildiz, I.F.; Nie, S.; Lin, S.C.; Chandrasekaran, M. 5G roadmap: 10 Key enabling technologies. Comput. Netw. 2016, 106, 17–48. [Google Scholar] [CrossRef]
- Sarigiannidis, P.; Lagkas, T.; Bibi, S.; Ampatzoglou, A.; Bellavista, P. Hybrid 5G optical-wireless SDN-based networks, challenges and open issues. IET Netw. 2017, 6, 141–148. [Google Scholar] [CrossRef]
- Pliatsios, D.; Sarigiannidis, P.; Goudos, S.; Karagiannidis, G.K. Realizing 5G vision through Cloud RAN: technologies, challenges, and trends. EURASIP J. Wirel. Commun. Netw. 2018, 2018, 136. [Google Scholar] [CrossRef] [Green Version]
- Condoluci, M.; Mahmoodi, T. Softwarization and virtualization in 5G mobile networks: Benefits, trends and challenges. Comput. Netw. 2018, 146, 65–84. [Google Scholar] [CrossRef] [Green Version]
- Cerwall, P.; Jonsson, P.; Möller, R.; Bävertoft, S.; Carson, S.; Godor, I. Ericsson Mobility Report; Ericsson: Stockholm, Sweden, 2015. [Google Scholar]
- Palattella, M.R.; Dohler, M.; Grieco, A.; Rizzo, G.; Torsner, J.; Engel, T.; Ladid, L. Internet of things in the 5G era: Enablers, architecture, and business models. IEEE J. Sel. Areas Commun. 2016, 34, 510–527. [Google Scholar] [CrossRef]
- Condoluci, M.; Lema, M.A.; Mahmoodi, T.; Dohler, M. 5g IoT industry verticals and network requirements. In Powering the Internet of Things With 5G Networks; IGI Global: Hershey, PA, USA, 2018; pp. 148–175. [Google Scholar]
- Srikanth, S.; Pandian, P.M.; Fernando, X. Orthogonal frequency division multiple access in WiMAX and LTE: A comparison. IEEE Commun. Mag. 2012, 50, 153–161. [Google Scholar] [CrossRef]
- Wei, Z.; Yang, L.; Ng, D.W.K.; Yuan, J. On the Performance Gain of NOMA over OMA in Uplink Single-cell Systems. In Proceedings of the 2018 IEEE Global Communications Conference (GLOBECOM), Abu Dhabi, UAE, 9–13 December 2018; pp. 1–7. [Google Scholar]
- Marcano, A.S.; Christiansen, H.L. Performance of non-orthogonal multiple access (NOMA) in mmWave wireless communications for 5G networks. In Proceedings of the 2017 International Conference on Computing, Networking and Communications (ICNC), Santa Clara, CA, USA, 26–29 January 2017; pp. 969–974. [Google Scholar]
- Islam, S.R.; Avazov, N.; Dobre, O.A.; Kwak, K.S. Power-domain non-orthogonal multiple access (NOMA) in 5G systems: Potentials and challenges. IEEE Commun. Surv. Tutor. 2017, 19, 721–742. [Google Scholar] [CrossRef]
- Ali, M.S.; Hossain, E.; Kim, D.I. Coordinated multipoint transmission in downlink multi-cell NOMA systems: Models and spectral efficiency performance. IEEE Wirel. Commun. 2018, 25, 24–31. [Google Scholar] [CrossRef]
- Dai, X.; Chen, S.; Sun, S.; Kang, S.; Wang, Y.; Shen, Z.; Xu, J. Successive interference cancelation amenable multiple access (SAMA) for future wireless communications. In Proceedings of the 2014 IEEE International Conference on Communication Systems, Macau, China, 19–21 November 2014; pp. 222–226. [Google Scholar]
- Meng, L.; Su, X.; Zhang, X.; Choi, C.; Choi, D. Signal reception for successive interference cancellation in NOMA downlink. In Proceedings of the 2018 Conference on Research in Adaptive and Convergent Systems, Honolulu, HI, USA, 9–12 October 2018; pp. 75–79. [Google Scholar]
- Ding, Z.; Yang, Z.; Fan, P.; Poor, H.V. On the performance of non-orthogonal multiple access in 5G systems with randomly deployed users. IEEE Signal Process. Lett. 2014, 21, 1501–1505. [Google Scholar] [CrossRef]
- Di, B.; Bayat, S.; Song, L.; Li, Y. Radio resource allocation for downlink non-orthogonal multiple access (NOMA) networks using matching theory. In Proceedings of the 2015 IEEE Global Communications Conference (GLOBECOM), San Diego, CA, USA, 6–10 December 2015; pp. 1–6. [Google Scholar]
- Ali, M.S.; Tabassum, H.; Hossain, E. Dynamic user clustering and power allocation for uplink and downlink non-orthogonal multiple access (NOMA) systems. IEEE Access 2016, 4, 6325–6343. [Google Scholar] [CrossRef]
- Hojeij, M.R.; Nour, C.A.; Farah, J.; Douillard, C. Waterfilling-based proportional fairness scheduler for downlink non-orthogonal multiple access. IEEE Wirel. Commun. Lett. 2017, 6, 230–233. [Google Scholar] [CrossRef]
- Ali, S.; Hossain, E.; Kim, D.I. Non-orthogonal multiple access (NOMA) for downlink multiuser MIMO systems: User clustering, beamforming, and power allocation. IEEE Access 2017, 5, 565–577. [Google Scholar] [CrossRef]
- Cui, J.; Liu, Y.; Ding, Z.; Fan, P.; Nallanathan, A. Optimal user scheduling and power allocation for millimeter wave NOMA systems. IEEE Trans. Wirel. Commun. 2018, 17, 1502–1517. [Google Scholar] [CrossRef]
- Ni, D.; Hao, L.; Tran, Q.T.; Qian, X. Power allocation for downlink NOMA heterogeneous networks. IEEE Access 2018, 6, 26742–26752. [Google Scholar] [CrossRef]
- Amin, S.H.; Mehana, A.H.; Soliman, S.S.; Fahmy, Y.A. Power allocation for maximum MIMO-NOMA system user-rate. In Proceedings of the 2018 IEEE Globecom Workshops (GC Wkshps), Abu Dhabi, UAE, 9–13 December 2018; pp. 1–6. [Google Scholar]
- Ali, M.S.; Hossain, E.; Al-Dweik, A.; Kim, D.I. Downlink power allocation for CoMP-NOMA in multi-cell networks. IEEE Trans. Commun. 2018, 66, 3982–3998. [Google Scholar] [CrossRef]
- Zeng, M.; Yadav, A.; Dobre, O.A.; Poor, H.V. Energy-efficient power allocation for MIMO-NOMA with multiple users in a cluster. IEEE Access 2018, 6, 5170–5181. [Google Scholar] [CrossRef]
- Zhu, L.; Zhang, J.; Xiao, Z.; Cao, X.; Wu, D.O.; Xia, X.G. Joint power control and beamforming for uplink non-orthogonal multiple access in 5G millimeter-wave communications. IEEE Trans. Wirel. Commun. 2018, 17, 6177–6189. [Google Scholar] [CrossRef]
- Zhai, D.; Zhang, R.; Cai, L.; Li, B.; Jiang, Y. Energy-efficient user scheduling and power allocation for NOMA-based wireless networks with massive IoT devices. IEEE Internet Things J. 2018, 5, 1857–1868. [Google Scholar] [CrossRef]
- Brighente, A.; Tomasin, S. Power allocation for non-orthogonal millimeter wave systems with mixed traffic. IEEE Trans. Wirel. Commun. 2018, 18, 432–443. [Google Scholar] [CrossRef]
- Chen, X.; Liu, G.; Ma, Z.; Zhang, X.; Xu, W.; Fan, P. Optimal Power Allocations for Non-Orthogonal Multiple Access Over 5G Full/Half-Duplex Relaying Mobile Wireless Networks. IEEE Trans. Wirel. Commun. 2018, 18, 77–92. [Google Scholar] [CrossRef]
- Zhang, H.; Fang, F.; Cheng, J.; Long, K.; Wang, W.; Leung, V.C. Energy-efficient resource allocation in NOMA heterogeneous networks. IEEE Wirel. Commun. 2018, 25, 48–53. [Google Scholar] [CrossRef]
- Xing, H.; Liu, Y.; Nallanathan, A.; Ding, Z.; Poor, H.V. Optimal throughput fairness tradeoffs for downlink non-orthogonal multiple access over fading channels. IEEE Trans. Wirel. Commun. 2018, 17, 3556–3571. [Google Scholar] [CrossRef]
- Jeong, Y.; Lee, C.; Kim, Y.H. Power Minimizing Beamforming and Power Allocation for MISO-NOMA Systems. IEEE Trans. Veh. Technol. 2019, 68, 6187–6191. [Google Scholar] [CrossRef]
- Chen, L.; Ma, L.; Xu, Y. Proportional Fairness-Based User Pairing and Power Allocation Algorithm for Non-Orthogonal Multiple Access System. IEEE Access 2019, 7, 19602–19615. [Google Scholar] [CrossRef]
- Uddin, M.F. Energy efficiency maximization by joint transmission scheduling and resource allocation in downlink NOMA cellular networks. Comput. Netw. 2019, 159, 37–50. [Google Scholar] [CrossRef]
- Alavi, F.; Cumanan, K.; Ding, Z.; Burr, A.G. Beamforming techniques for nonorthogonal multiple access in 5G cellular networks. IEEE Trans. Veh. Technol. 2018, 67, 9474–9487. [Google Scholar] [CrossRef]
- Pliatsios, D.; Sarigiannidis, P. Power Allocation in Downlink Non-orthogonal Multiple Access IoT-enabled Systems: A Particle Swarm Optimization Approach. In Proceedings of the 2019 15th International Conference on Distributed Computing in Sensor Systems (DCOSS), Santorini Island, Greece, 29–31 May 2019; pp. 416–422. [Google Scholar]
- Wang, D.; Tan, D.; Liu, L. Particle swarm optimization algorithm: an overview. Soft Comput. 2018, 22, 387–408. [Google Scholar] [CrossRef]
- Axnäs, J.; Wang, Y.P.E.; Kamuf, M.; Andgart, N. Successive interference cancellation techniques for LTE downlink. In Proceedings of the 2011 IEEE 22nd International Symposium on Personal, Indoor and Mobile Radio Communications, Toronto, ON, Canada, 11–14 September 2011; pp. 1793–1797. [Google Scholar] [CrossRef]
- Zhang, X.; Haenggi, M. Successive interference cancellation in downlink heterogeneous cellular networks. In Proceedings of the 2013 IEEE Globecom Workshops (GC Wkshps), Atlanta, GA, USA, 9–13 December 2013; pp. 730–735. [Google Scholar] [CrossRef]
- Poli, R.; Kennedy, J.; Blackwell, T. Particle swarm optimization. Swarm Intell. 2007, 1, 33–57. [Google Scholar] [CrossRef]
- Yeniay, Ö. Penalty function methods for constrained optimization with genetic algorithms. Math. Comput. Appl. 2005, 10, 45–56. [Google Scholar] [CrossRef]
- 3GPP, TR25.814. Physical Layer Aspect for Evolved Universal Terrestrial Radio Access (UTRA); Technical Report; 3rd Generation Partnership Project (3GPP): Sophia Antipolis, France.
- Trelea, I.C. The particle swarm optimization algorithm: convergence analysis and parameter selection. Inf. Process. Lett. 2003, 85, 317–325. [Google Scholar] [CrossRef]
- Dianati, M.; Shen, X.; Naik, S. A new fairness index for radio resource allocation in wireless networks. In Proceedings of the IEEE Wireless Communications and Networking Conference, New Orleans, LA, USA, 13–17 March 2005; Volume 2, pp. 712–717. [Google Scholar]
- Mahmood, N.H.; Pedersen, K.I.; Mogensen, P. Interference aware inter-cell rank coordination for 5G systems. IEEE Access 2017, 5, 2339–2350. [Google Scholar] [CrossRef]
- Ayoob, A.A.; Abdulazeez, H.A.; Gang, S.; Tan, L. Hybrid Inter Cell Interference Coordination in 5G Networks. Int. J. Pure Appl. Math. 2018, 119, 13105–13116. [Google Scholar]
- Tan, A.S.; Zeydan, E. Performance maximization of network assisted mobile data offloading with opportunistic Device-to-Device communications. Comput. Netw. 2018, 141, 31–43. [Google Scholar] [CrossRef]
- Saliba, D.; Imad, R.; Houcke, S.; El Hassan, B. WiFi Dimensioning to offload LTE in 5G Networks. In Proceedings of the 2019 IEEE 9th Annual Computing and Communication Workshop and Conference (CCWC), Las Vegas, NV, USA, 7–9 January 2019; pp. 521–526. [Google Scholar]


| Reference | Aim | Proposed Method |
|---|---|---|
| [15] | Investigation of outage probability in NOMA system with randomly deployed users | Mathematical analysis of the outage probability |
| [16] | Channel assignment and power allocation optimization | Channel assignment exploiting matching theory and power allocation using water-filling method |
| [17] | Power allocation optimization | Clustering of deployed users using mixed integer non-linear programming |
| [18] | Channel assignment and power allocation optimization | Water-filling method in order to maximize the total system throughput |
| [19] | Interference mitigation in MIMO NOMA systems | Application of beamforming techniques on user clusters |
| [20] | User scheduling and power allocation optimization | Matching theory and successive convex approximation techniques |
| [21] | Power allocation optimization in heterogeneous NOMA systems | Iterative distributed power allocation scheme |
| [22] | Power allocation optimization and interference mitigation in heterogeneous NOMA systems | Interference alignment scheme based on user clustering |
| [23] | Power allocation optimization in heterogeneous NOMA systems | Exploitation of CoMP schemes in order to apply a low-complexity distributed power optimization method |
| [24] | Energy efficiency optimization for multi-cluster MIMO NOMA system under QoS constraints | Water-filling-based method in order to maximize the system throughput under a given total power |
| [25] | Throughput maximization through power control and beamforming | Decomposition of the joint problem into sub-problems and development of a sub-optimal solution |
| [26] | User scheduling and power allocation optimization | Exploitation of Lyapunov stochastic optimization scheme |
| [27] | Maximization of spectral efficiency in a NOMA system with mixed-traffic requirements | Developed a group-based power allocation scheme |
| [28] | Throughput maximization in relay-based NOMA systems | Conversion of the quasi-concave problem into a convex one, and proposal of a dynamic power allocation scheme |
| [29] | User scheduling and power allocation optimization | Leverage of convex optimization techniques |
| [30] | Maximization of the minimal achievable user throughput | Development of a two-step joint beamforming and power allocation solution |
| [31] | Minimization of transmission power under throughput constraints in MIMO NOMA systems | Combination of power allocation, user clustering and beamforming techniques |
| [32] | Optimization of proportional fairness of the users | Joint user pairing and power allocation method |
| [33] | Energy efficiency optimization through optimal resource allocation | Formulation as linear programming problem and utilization of CPLEX optimization tool |
| Term | Description |
|---|---|
| B | Total system bandwidth |
| Channel gain coefficient | |
| K | Number of users |
| Noise spectral density of AWGN | |
| Number of multiplexed users in the same channel | |
| Total power budget of the Base Station | |
| Power allocated to user k in channel s | |
| Achievable throughput of user k in channel s | |
| S | Number of channels |
| Additive White Gaussian Noise | |
| Transmitted signal in channel s | |
| Transmitted signal of user k in channel s | |
| Received signal of user k in channel s |
| User | Channel Preference Order |
|---|---|
| A | 3, 1, 2, 6, 5, 4 |
| B | 3, 4, 5, 2, 1, 6 |
| C | 5, 2, 6, 3, 4, 1 |
| D | 5, 6, 4, 1, 2, 3 |
| Channels | 1 | 2 | 3 | 4 | 5 | 6 | Channel Throughput | |
|---|---|---|---|---|---|---|---|---|
| Initialization | 1st Particle | 1.399 | 4.636 | 3.282 | 0.489 | 1.463 | 5.427 | 79.269 |
| 2nd Particle | 2.438 | 5.058 | 4.756 | 0.390 | 1.663 | 5.024 | 80.480 | |
| 3rd Particle | 3.971 | 4.386 | 5.258 | 3.001 | 2.370 | 5.861 | 84.798 | |
| 4th Particle | 5.036 | 2.699 | 4.879 | 0.132 | 2.608 | 4.496 | 79.584 | |
| Intermediate | 1st Particle | 6.690 | 6.217 | 7.386 | 5.243 | 3.706 | 8.447 | 88.520 |
| 2nd Particle | 6.082 | 6.181 | 7.651 | 4.680 | 3.644 | 8.637 | 88.269 | |
| 3rd Particle | 5.676 | 6.231 | 7.435 | 4.269 | 3.373 | 8.318 | 87.842 | |
| 4th Particle | 5.331 | 7.295 | 7.647 | 4.379 | 3.403 | 8.477 | 88.096 | |
| Final | 1st Particle | 6.869 | 6.694 | 8.020 | 5.399 | 3.961 | 9.058 | 89.023 |
| 2nd Particle | 6.869 | 6.694 | 8.020 | 5.399 | 3.961 | 9.058 | 89.023 | |
| 3rd Particle | 6.869 | 6.694 | 8.020 | 5.399 | 3.961 | 9.058 | 89.023 | |
| 4th Particle | 6.869 | 6.694 | 8.020 | 5.399 | 3.961 | 9.058 | 89.023 |
| Parameter | Value |
|---|---|
| Carrier Frequency | 2 GHz |
| Cell Radius | 500 m |
| Maximum Transmission Power | 46 dBm |
| Number of channels | 8, 16, 32, 64, 128 |
| System Bandwidth | 10 MHz |
| QoS Threshold | 1–15 Mbps |
| Distance Dependent Path Loss | 128.1 + 37.6log10(d), d in km |
| Noise Power Spectral Density | −174 dBm/Hz |
| Number of deployed users | 6–20 |
| Maximum number of multiplexed users | 2 |
| PSO Population Size | 100 |
| PSO Inertia Weight | 0.9–0.4 |
| PSO Accelaration Factors | 0.25 |
| PSO Maximum Iterations | 1000 |
| PSO Best Value Gain Tolerance | |
| Intra-channel Power Allocation Factor | 0.7 |
© 2019 by the authors. Licensee MDPI, Basel, Switzerland. This article is an open access article distributed under the terms and conditions of the Creative Commons Attribution (CC BY) license (http://creativecommons.org/licenses/by/4.0/).
Share and Cite
Pliatsios, D.; Sarigiannidis, P. Resource Allocation Combining Heuristic Matching and Particle Swarm Optimization Approaches: The Case of Downlink Non-Orthogonal Multiple Access. Information 2019, 10, 336. https://doi.org/10.3390/info10110336
Pliatsios D, Sarigiannidis P. Resource Allocation Combining Heuristic Matching and Particle Swarm Optimization Approaches: The Case of Downlink Non-Orthogonal Multiple Access. Information. 2019; 10(11):336. https://doi.org/10.3390/info10110336
Chicago/Turabian StylePliatsios, Dimitrios, and Panagiotis Sarigiannidis. 2019. "Resource Allocation Combining Heuristic Matching and Particle Swarm Optimization Approaches: The Case of Downlink Non-Orthogonal Multiple Access" Information 10, no. 11: 336. https://doi.org/10.3390/info10110336