Network Traffic Anomaly Detection via Deep Learning
by
 , ,
, ,
Konstantina Fotiadou
1,* ,
,
Terpsichori-Helen Velivassaki
1,
Artemis Voulkidis
1,
Dimitrios Skias
2,
Sofia Tsekeridou
3 and
Theodore Zahariadis
1 1
Synelixis Solutions S.A., 34100 Chalkida, Greece
2
Intrasoft International S.A., L-1253 Luxembourg, Luxembourg
3
Intrasoft International S.A., 19002 Athens, Greece
*
Author to whom correspondence should be addressed.
Information 2021, 12(5), 215; https://doi.org/10.3390/info12050215
Submission received: 18 April 2021
/
Revised: 14 May 2021
/
Accepted: 15 May 2021
/
Published: 19 May 2021
(This article belongs to the Section Information and Communications Technology)
Abstract
:Network intrusion detection is a key pillar towards the sustainability and normal operation of information systems. Complex threat patterns and malicious actors are able to cause severe damages to cyber-systems. In this work, we propose novel Deep Learning formulations for detecting threats and alerts on network logs that were acquired by pfSense, an open-source software that acts as firewall on FreeBSD operating system. pfSense integrates several powerful security services such as firewall, URL filtering, and virtual private networking among others. The main goal of this study is to analyse the logs that were acquired by a local installation of pfSense software, in order to provide a powerful and efficient solution that controls traffic flow based on patterns that are automatically learnt via the proposed, challenging DL architectures. For this purpose, we exploit the Convolutional Neural Networks (CNNs), and the Long Short Term Memory Networks (LSTMs) in order to construct robust multi-class classifiers, able to assign each new network log instance that reaches our system into its corresponding category. The performance of our scheme is evaluated by conducting several quantitative experiments, and by comparing to state-of-the-art formulations.
1. Introduction
Over recent years, the spread of connectivity and the extended internet usage due to the pandemic, has both increased the vulnerabilities to cyber-threats, and simultaneously grown the sophistication of cyber-attacks. As a result, the cyber-security defensive shield of the information systems is further stressed. Nowadays, modern enterprises generate enormous amount of data, which brings several opportunities concerning their exploitation, but also depicts severe challenges regarding their protection. On this direction, network logs are considered as an immensely rich source of information that can be exploited for many purposes, such as the estimation regarding the current operation state of the network, and the investigation and prevention of potentially malicious activities. The above actions indicate the necessity of further improving the cyber-security defences, by providing more effective cyber-security procedures. Cyber-security protection is the ability to identify any malicious behaviour or potential vulnerabilities that impose a threat which can be exploited by adversaries. For this purpose, relevant countermeasures and mitigation actions have to be applied to the affected assets in order to overcome potential risks.
Network log management corresponds to the collection, manipulation, analysis and reporting of large volume and velocity data, such as event-logs, audit records, audit trails, etc. Additionally, log management evaluates the firewall capabilities in enhancing network security, facilitates the early detection of possible vulnerabilities, and minimizes the resolution time of any suspicious action that corrupts the normal operation of information systems. On this direction, network traffic analysis enables the immediate and deep understanding of several significant network metrics, including the network type, origin, size, destination of variant packets, and the uploading/downloading speed, among others. Consequently, network traffic analysis provides significant assistance towards the identification of malicious packets and actors within the traffic flow. However, with the increased penetration rates that are reported on modern information systems, sophisticated cybersecurity protection technologies like Machine Learning (ML) and Artificial Intelligence (AI) can be incorporated into the loop.
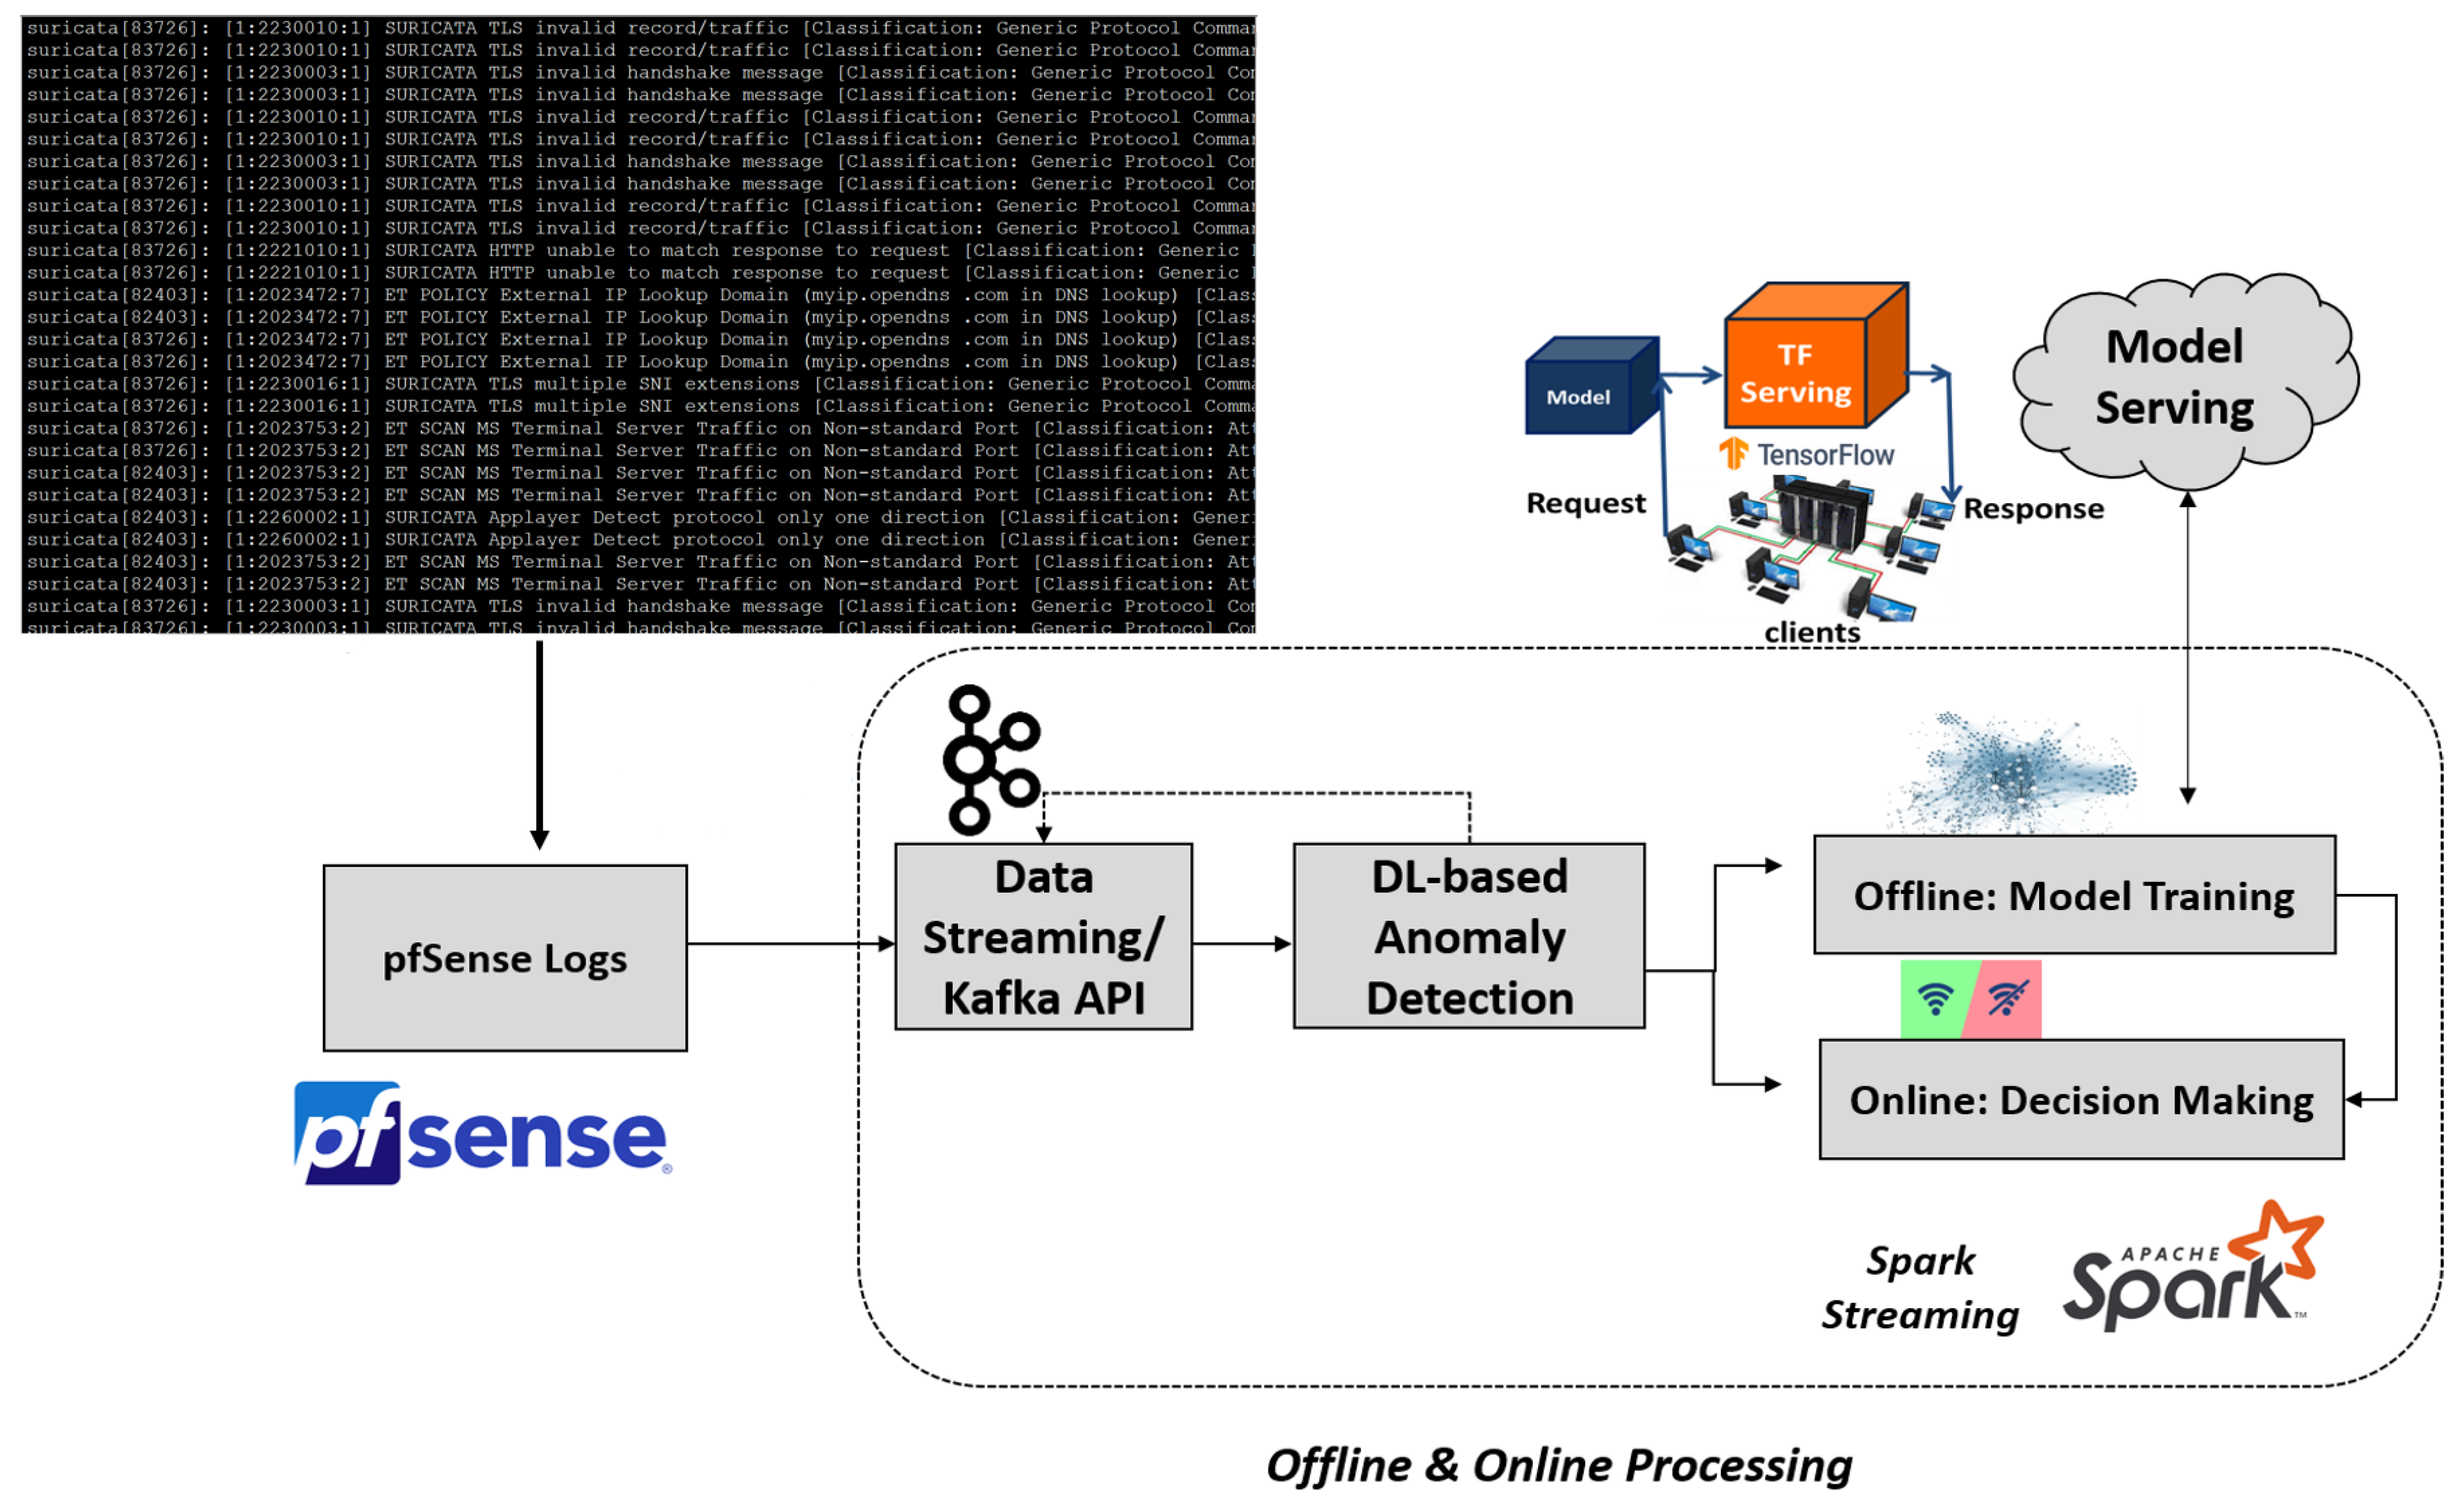
In this paper, we design and develop an innovative network-traffic monitoring and anomaly detection scheme that is able to upload, monitor and analyse network logs utilizing the pfSense software [1,2], as illustrated on Figure 1. pfSense is a customized FreeBSD (Berkeley Software) distribution that is oriented to be used as a firewall and router. The software includes multiple features, including among others: firewall, routing, QoS differentiation, NAT, Redundancy, Load Balancing, VPN, Report and Monitoring, Real Time information, and a Captive Portal. It is fully prepared for high- throughput scenarios (over 500 Mbps). pfSense uses a single XML file, called config.xml, which stores the configuration of all services available in the pfSense system. For each new instance that reaches our system, we use Apache Spark Streaming [3] as the tool for real-time processing of the log’s monitoring. Packets from the input data are stored into Apache Kafka topics and are ingested into Spark Streaming using the Kafka consumer API for Spark, synthesizing discretized streams. After we parse the input network log instances, we perform the subsequent analysis steps, including the design and evaluation of semi-supervised Deep Learning (DL) anomaly detection techniques, with main goal to classify the different Event types that reach our system.
Specifically, the key contributions of this paper are summarized as follows:
- The design and development of an innovative network monitoring and analysis scheme based on the pfSense software;
- The construction and pre-processing of a novel network intrusion dataset composed of Suricata logs collected from the pfSense software;
- The design and exploitation of challenging Deep Learning (DL) schemes for semi-supervised network intrusion/anomaly detection.
According to our knowledge, this work is out of the first that propose variant deep feature learning architectures towards the problem of anomaly detection on network logs that were acquired by the pfSense firewall, with main goal the Event type classification. The proposed scheme can be efficiently extended-with minor modifications regarding the data pre-processing in detecting multiple threat types from variant information systems. The rest of the paper is structured as follows: Section 2 describes the state-of-the-art concerning network intrusion detection systems, along with the most recent Machine Learning/Deep Learning approaches that were reported in the literature; Section 3 demonstrates the main formulation of this work, including the proposed architectures: the Convolutional Neural Networks and the Long Short Term Neural Networks towards the multi-class Suricata pfSense logs anomaly detection; Section 4 presents the complete experimental setup, including the data acquisition, the dataset creation, the achieved performance of the proposed schemes and their comparison; finally, Section 5 concludes this work and highlights our main future directions.
2. Related Work and Background
2.1. Network Intrusion Detection Systems
Nowadays the complexity of cyber-attacks and malicious events has grown tremendously. For this purpose, the design and exploitation of robust Intrusion detection systems (IDSs) [4,5,6] becomes a fundamental entity towards the protection and sustainability of the Information and Communication Tecnology (ICT) infrastructures. IDSs provide the means to early detect malicious cyber-activities and design efficient mitigation actions against them. Recently, numerous interesting intrusion detection approaches have been proposed in the related literature [7,8]. Generally, network intrusion detection methodologies are divided into two main categories (i) the signature-based [9,10], and (ii) the anomaly detection-based approaches [11,12]. Signature-based intrusion detection approaches focus on detecting pre-defined malicious threats, for instance network traffic for a series of malicious packet sequences, or bytes. The key benefits of the specific approaches lie into the fact that signatures can be efficiently extracted, under the constraint that precise prior knowledge regarding their patterns or structure exists. A characteristic example is described on [13,14], where the authors propose a signature-based IDS for the detection of DoS and routing attacks in IoT networks, involving centralised and distributed components. Specifically, the detection module operates on the main router, while other lightweight modules are deployed in the network in close proximity to the IoT devices for traffic monitoring and reporting purposes. Moreover, pattern matching on signature-based approaches is implemented efficiently on modern systems that minimize the amount of power required to perform the matching for a particular rule set [15]. For instance, if the monitored system communicates only via DNS, DNS, ICMP and SMTP, all other signatures have to be ignored. Despite the advantages of the signature-based techniques, they also confront several limitations, since they only detect attacks whose signatures are previously recorded. Consequently, these techniques perform well only when they work with pre-defined behavioral patterns, while they demonstrate poor performance when they either deal with novel attacks, or when the users use advance technologies such as payload encoders, and encrypted data channels [16].
On the other hand, anomaly detection techniques exploit numerous of statistical, data-mining and Machine Learning (ML)-based techniques to automatically detect any kind of attacks [17]. ML formulations have been widely utilized for network intrusion detection applications [18], and they can be discriminated into shallow ML and Deep Learning (DL) according to the involved network architecture. Generally, DL architectures present more robust representation ability compared to the shallow architectures. Additionally, ML-based anomaly detection approaches can be further discriminated into supervised [19,20,21], semi-supervised [22,23,24] or unsupervised [25,26,27,28,29]. Supervised classification approaches require proper training datasets that include all the anomalous examples along with their corresponding labels. The main drawback of these techniques is that they achieve proper detection performance only when they exploit large number of labeled training data. Nevertheless, real network traffic data usually lacks of truly labeled datasets. On the other hand, semi-supervised anomaly detection approaches provide accurate estimates of the probability distribution of the normal and malicious classes, extracted from a sufficiently large amount of collected log/network measurements [30]. These techniques are differentiated from the supervised approaches in the sense that partial or no information regarding the properties of the anomaly is presented. Finally, the unsupervised anomaly detection methodologies aim to discriminate automatically normal from abnormal network behavior without exploiting labelled data. In such scenarios, clustering-based techniques [31,32,33] proved to be convenient solution, however due to the enormous and extremely heterogeneous structure of network traffic measurements more sophisticated techniques, relying on DNNs, are considered [34]. Finally, generative models have proved to be an intelligent choice towards the unsupervised network anomaly detection problem [35].
2.2. Embedding
Recently, several interesting techniques have been reported in the literature that handle time-series observations with text data using deep learning architectures [36,37]. In this work, we propose two DL schemes for the problem of multi-class event classification/anomaly detection of pfSense Suricata logs that both consider a word embedding layer as their input layer. This approach ensures that multiple occurrences of a word are provided by the same identifier. Embedding has proved to be a highly efficient choice in DL for not only handling categorical data, but generally big-volume datasets [38]. Embedding acts as a trainable layer in which categorical data are encoded via dense vectors of real values with reduced dimension [39,40]. Specifically, embedding stores the input information of n-words (i.e., categorical data) into an matrix, where , i.e., each word is stored into a vector. The textual input to the network corresponds to an one-dimensional vector with each element consisting of an integer identifier of the corresponding word. Consequently, multiple occurrences of a word are provided by the same identifier. Additionally, using distance measures, words with similar meanings are clustered together, facilitating the analysis of similar words during the training and testing phases.
2.3. Long-Short Term Networks (LSTM)
Long Short-Term Memory (LSTM) [41] is a variation of Recurrent Neural Networks (RNNs) [42], that consider the long-term dependencies between data nodes. Each LSTM consists of a chain of repeating modules of neural networks to process an input data sequence, and utilizes memory blocks to replace the traditional neurons in the hidden layer. Each module consists of three control gates and four neural network layers, interacting with each other. The gates control the cell state (i.e., the top horizontal line of the module that operates straight down the entire chain), by deciding the extend to which old information should be erased (i.e., denoted as “forget gate”), the new information that should be memorized (i.e., input gate), and last the current contents that should be communicated (“output gate”). Each gate is composed of a sigmoid activated neural network and a pointwise multiplication operation. The sigmoid layers output the numbers in the interval , where “zero” denotes that no information passes, while 1 corresponds to all information being exposed. From an analytical point of view, we consider a memory cell, denoted as , an input gate , and a forget gate . At time instance t, corresponds to the input, and to the hidden state, while is the candidate state of the memory cell, which determines how much the input is received in the cell state. The calculations for each gate, input candidate, hidden state, and cell state are summarized as follows:
where denotes the state vector, is the input vector and is the output vector. Additionally, and tan stand for the and tanh activation functions, respectively, while , represent the weight matrices. Finally, , and correspond to the input, forget, and output gates, respectively, and stands for the diagonal matrix. LSTM neural networks and their variants are regarded as powerful tool in DL, and have been widely used in modelling time-series prediction and classification problems. In our previous work, we provided the complete analysis and background regarding the LSTM formulations [43], when applied on the problem of autonomous fault detection on Critical Energy Infrastructures. Additionally, over the last few years multiple LSTM approaches have been proposed in the literature that tackle the problems of anomaly detection and network intrusion detection [44,45].
2.4. Convolutional Neural Network
Convolutional Neural Networks (CNNs) [46] are biologically inspired feed-forward deep neural networks, traditionally used for two-dimensional signals, such as imaging and video data [47]. Over the last few decades, CNNs are considered as the state-of-the-art approach for multiple image classification [48] and detection problems [49]. Nevertheless, their success in tackling 2D problems, imposed the demand to also use them for 1D applications, such as timeseries prediction and classification problems. Recently, multiple literature techniques use 1D-CNNs for anomaly detection applications [50,51,52]. In this formulation, due to the tremendously complex structure of our data, conventional deep learning formulations are not able to fully represent and encode the input information. Contradictory, the CNNs scheme that is composed of one or more convolution and pooling layer(s) followed by one or more FCN layer(s), builds a powerful architecture, able to encode high-level features and extracts all valuable information that will facilitate the subsequent classification task.
Consequently, similar to the 2D CNNs, 1D CNN-layers process the raw signals and automatically extract features that can be further used for any classification task, implemented by the network’s fully-connected/dense layers. The key differences with the traditional multi perpecton models (MLPs) include: (i) 1D CNNs perform 1D convolutions among the input data with pre-defined kernels, (ii) the kernel size affects the connectivity of the previous 1D convolution layers with the current layer, and (iii) the same weights are used for all connections. A significant component of a CNN concerns the non-linear activation function which is associated with the outputs of the convolution operations. The most prominent non-linear functions that have been utilized in the related state-of-the-art are the sigmoid, the tanh, and the Rectified Linear Unit (ReLU), which preserves the non-negative components while the negative values are set to zero, according to: [53]. Moreover, the activations of each convolutional layer are introduced into a pooling layer that produces down-sampled versions of the input vector. There are numerous types of pooling operators, including max-pooling and average pooling to be the most convenient choices that reduce the models’ training computational complexity. Finally, the last layer of a traditional CNN architecture corresponds to a fully-connected layer, that assigns each output unit to a certain class.
3. Proposed Formulation
This paper provides a modification of our previous work [54] in designing a formulation that uploads, monitors and analyses network logs utilizing the pfSense software [1]. For each new network log that arrives our system, Apache Spark Streaming [3] is used for its monitoring in (semi) real-time conditions. To be more accurate, after we parse the input, raw pfSense network measurements, we perform the several intermediate data pre-processing and cleansing steps. Characteristic examples include several proper internal data checks, such as the problems of missing values and the existence of inappropriate characters. Additionally, since we deal with multivariate time-series data, we separate the numeric from the categorical variables to encode them properly. For the categorical variables, Natural Language Processing (NLP)-based data pre-processing [55] procedures have been applied, while all numeric variables were normalized with respect to the sum of the unit-norm (l1-norm). After the data pre-processing part, we proceed to the analysis procedure regarding the development of DL models for network intrusion detection/multi-class event classification techniques. To achieve this, we divide the analysis into two distinct phases:
- Offline: representing the model training process;
- Online: corresponding to the decision making and does not involve model re-training.
During the offline, training stage, we store the learnt models, to be able to distribute them for the decision making stage. To achieve this, we design two characteristic DL formulations, capable of detecting whether specific logs contain anomalies, such as alerts or threats. The following paragraphs are dedicated on the multiclass classification problem of the “Event” type of Suricata logs that were extracted from the pfSense software, using: (i) the Long Short Term Memory (LSTM) Neural Network approach, and (ii) the one Dimensional Convolutional Neural Network (CNN) method.
3.1. Long Short Term Memory (LSTM) Approach
The first technique that is exploited towards the problem of multi-class classification/anomaly detection relies on the intelligent scheme of the Long-Short Term Memory (LSTM) neural networks. As it was explicitely described on the background Section (i.e., Section 2), LSTM neural networks are widely used for both multivariate time-series analysis and Natural Language Processing (NLP)/text-classification problems. Consequently, their structure is highly convenient for our use-case since the network measurements that we exploit compose a combination of time-series data instances including significant text information. In the following paragraph, we provide a detailed analysis regarding the mathematical formulation of LSTM as it is applied on our scenario. In our formulation, we consider as the input data sequence, where N stands for the total number of examples. The first hidden layer, is an embedding layer, in order to encode the text information properly and provide more robust and faithful representations of our data. Thus, for each we consider: , where . Each i-th vector of the sequence can be encoded via the proposed LSTM architecture as:
where are the RNN (i.e., Recurrent Neural Network) coefficient weight matrices, and stands as the state vector. For each the output is formulated as:
where corresponds to the output vector of the i-th input unit, and denotes the set of parameters that are imposed. After each LSTM layer, a dropout layer is operated, that preserves the most characteristic parts of the learnt features. The final layer, which is fully connected, is responsible for the classification task, and it is selected to be activated using the softmax function [56] as:
Finally, a state-of-the-art back-propagation algorithm [57] is exploited to learn the model’s trainable parameters. For the reader’s reference, in back propagation, the model’s parameters are updated via the alternating minimization of the cost function with respect to each parameter:
In this formulation, we denote D as the training dataset. To extract the final prediction, we calculate the maximum value of:
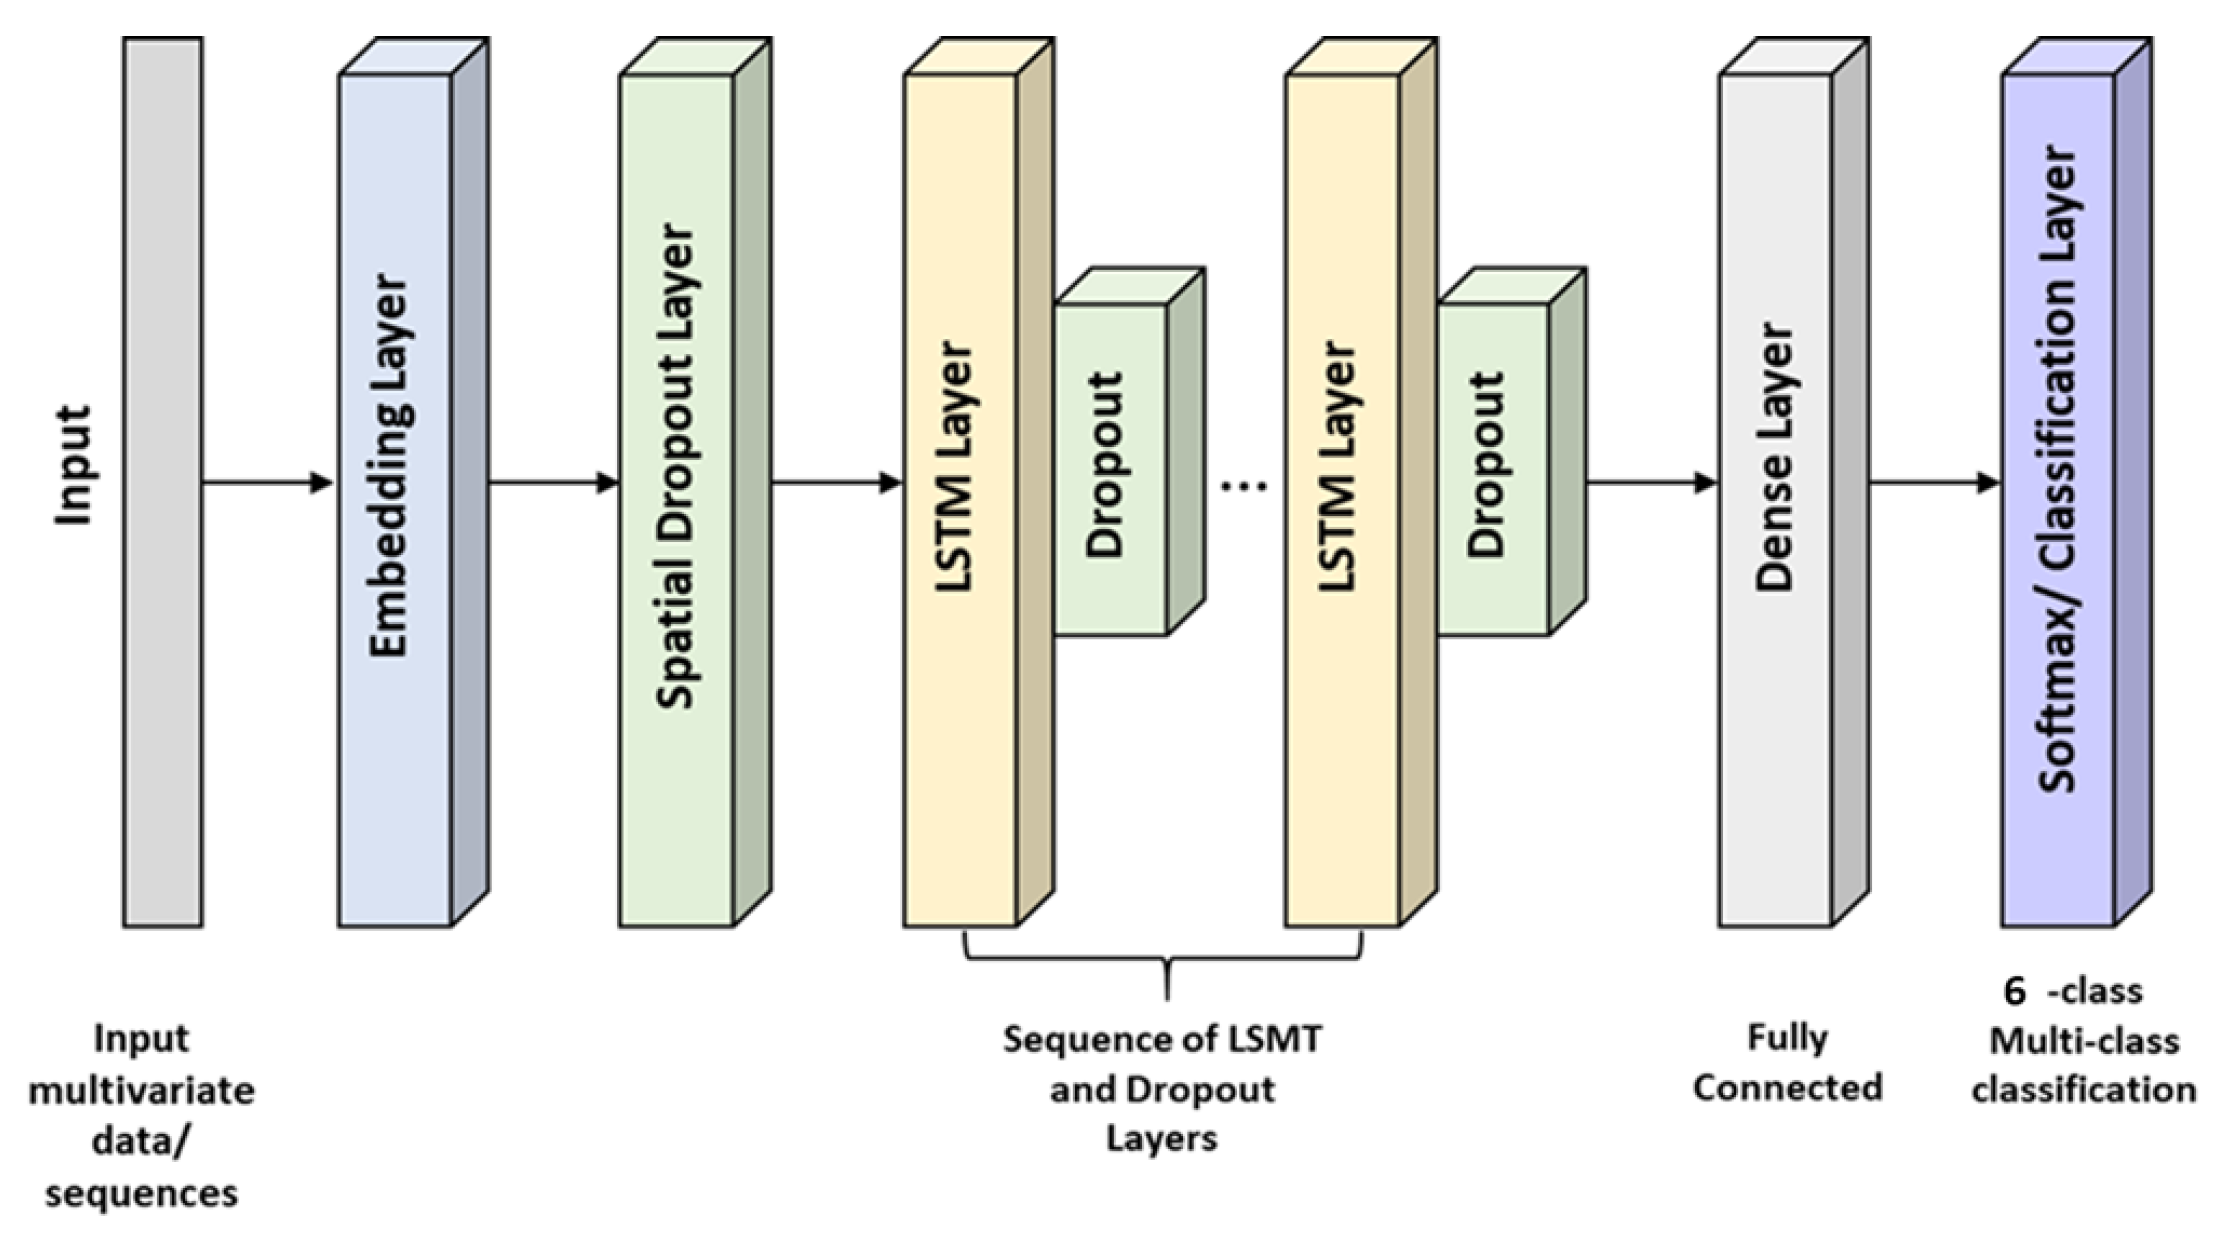
In Figure 2, we depict the main diagram of the proposed LSTM-based formulation for the multi-class event type classification of the Suricata pfSense logs. Specifically, we illustrate the high-level architecture of the proposed scheme where multiple LSTM layers can be imposed. However, to reduce the computational complexity of our model, we may use only one LSTM layer and achieve significant performance.
3.2. One Dimensional Convolutional Neural Network (CNN) Approach
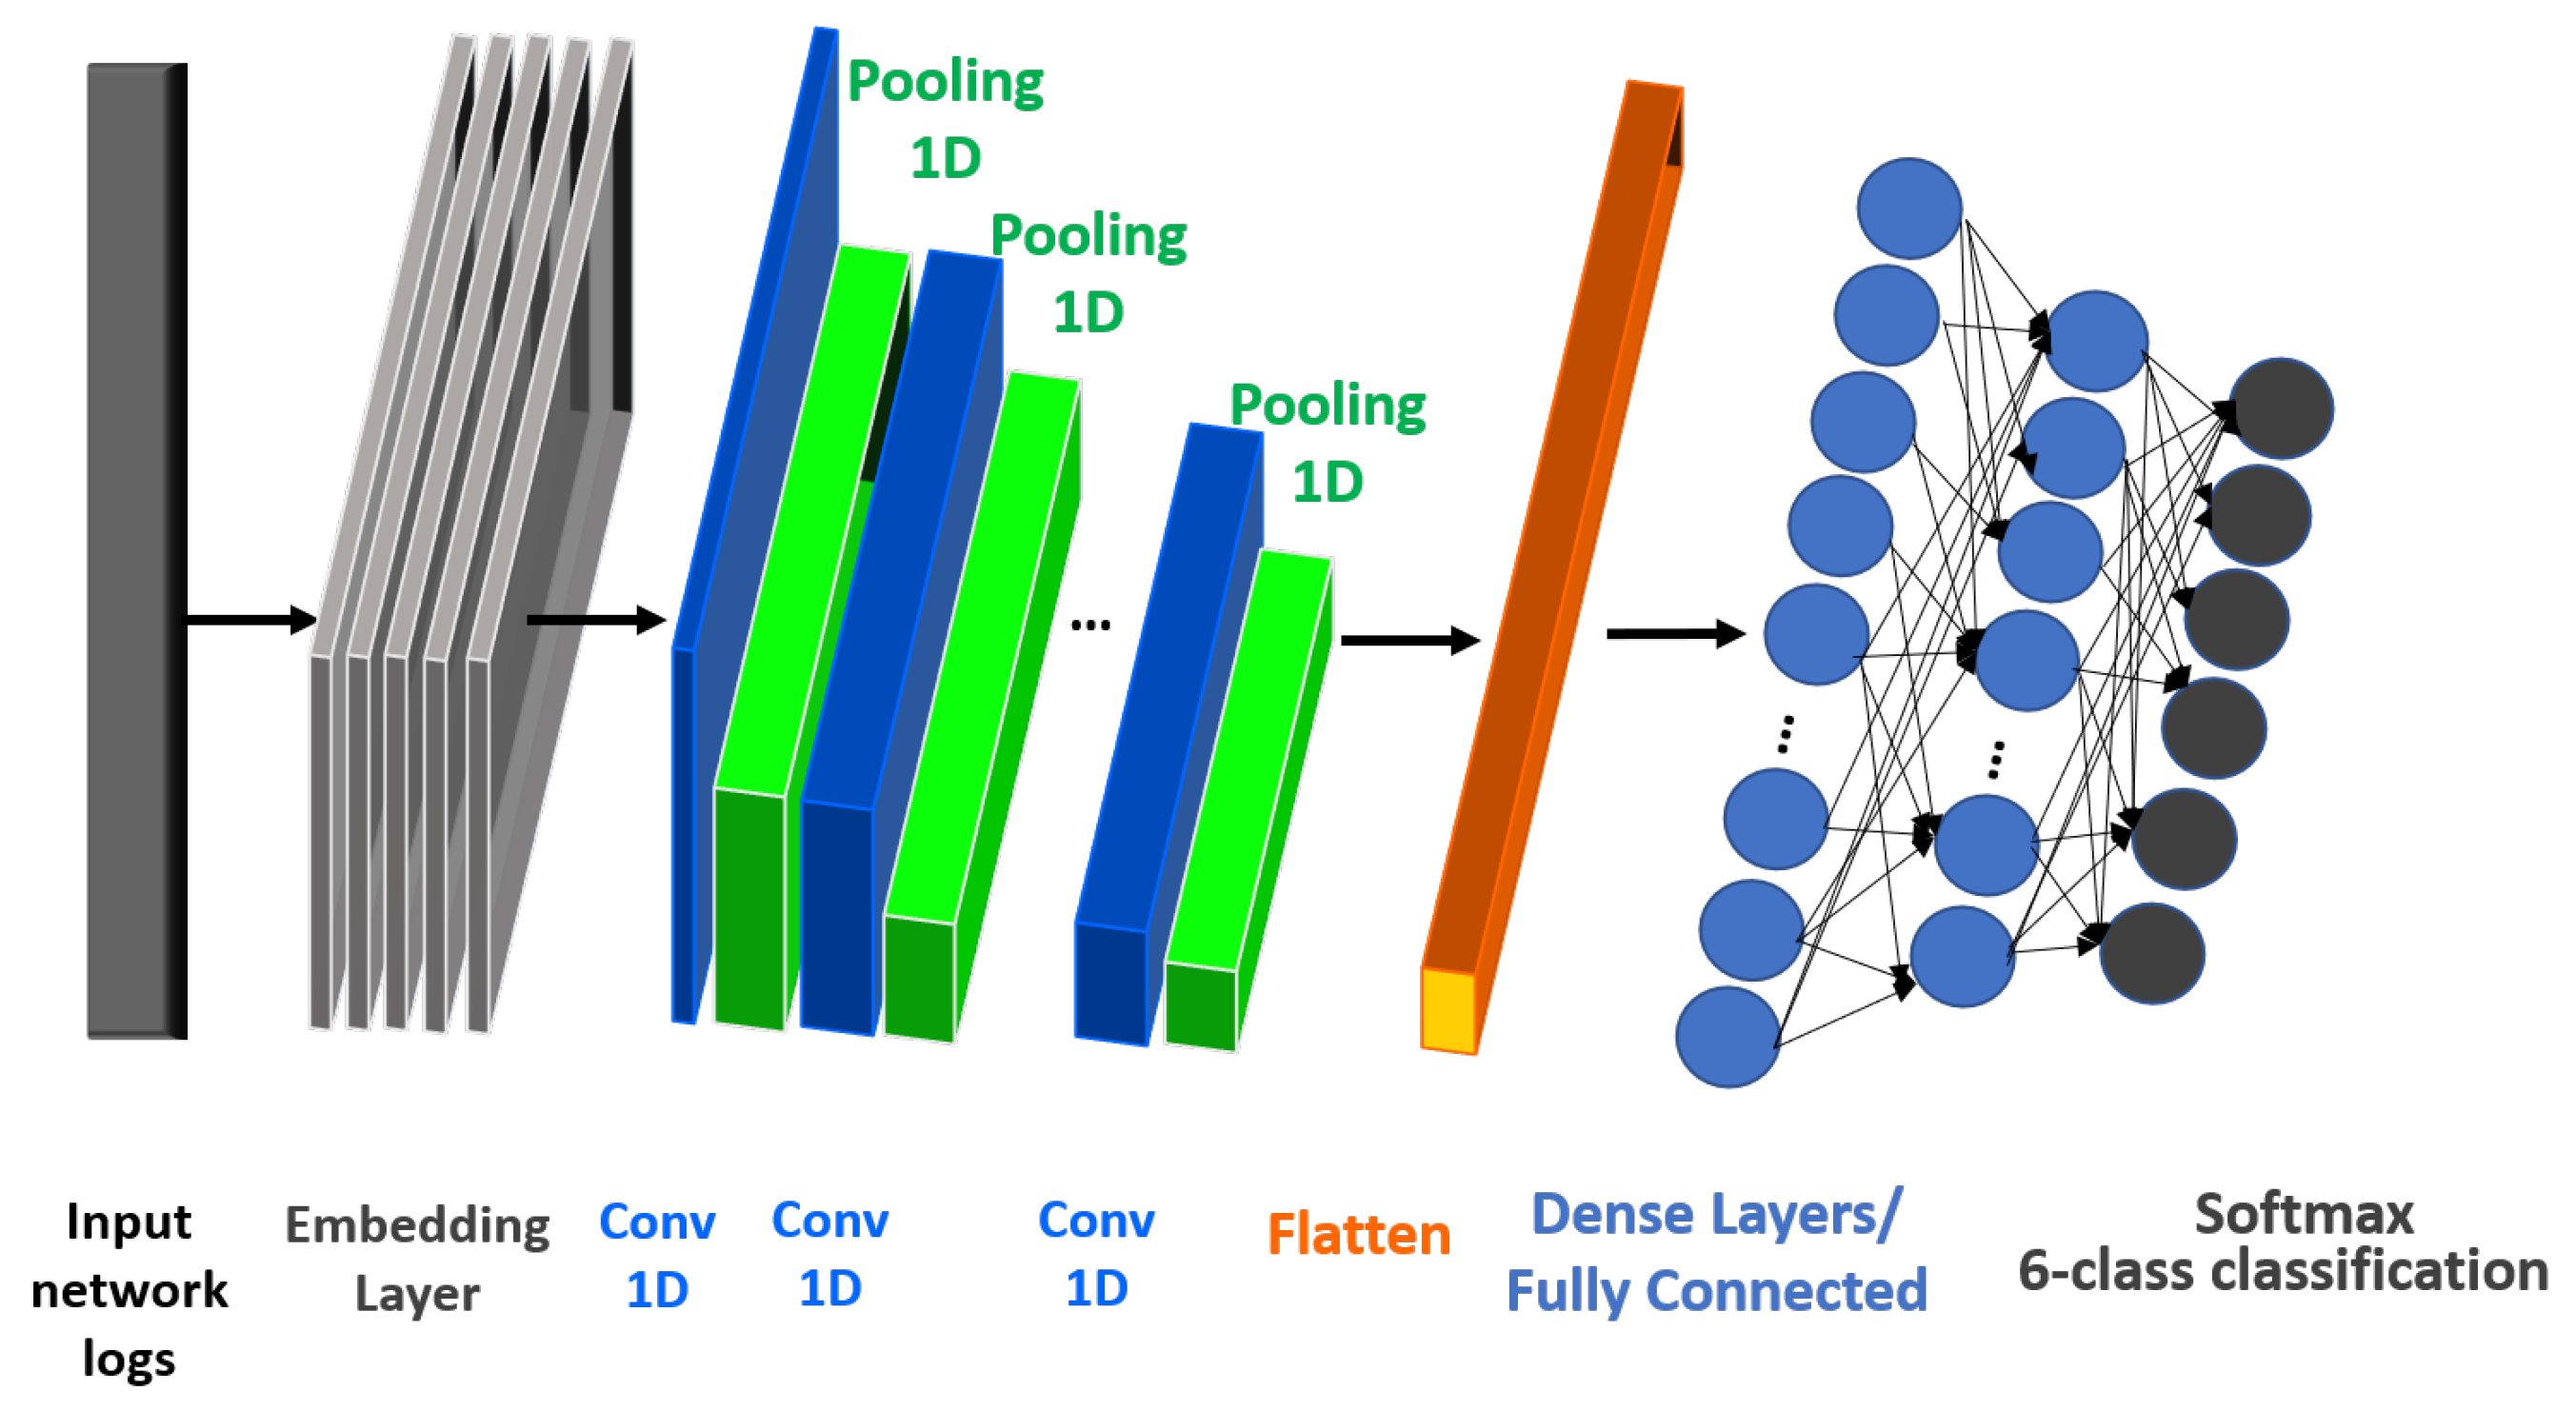
Since convolution operators extract automatically features of patterns from complex data structures, in the second approach of this study, we propose an 1D-CNN architecture, as illustrated on Figure 3. Specifically, in this scheme we aim to exploit the key insights of CNNs, summarized as: while in traditional, dense neural network schemes the activation of each hidden vector is computed by considering the whole input vector with certain weights, in CNNs only the most representative examples of the input vectors are utilized to compute the activation term of each hidden unit. Our proposed 1D-CNN scheme considers the input time-series sequence , and first passes it through an embedding layer composed of 50 hidden units. Each input observation , , is passed through a convolution operation of the following form:
where denotes the bias parameter, corresponds to a non-linear activation function, corresponds to the filter operator, and finally the output of the l hidden layer for a square-region is formulated as .
In our formulation, we use 32 convolution filters, with 3 kernel sizes and 8 input features. The convolution filters allow us to extract different features on the first convolution layer of our network. Each filter contains its own weight with the pre-defined kernel size, composing the length of the input matrix. Moreover, each convolutional layer (i.e., 1DConv) is followed by a max-pooling operator (i.e., MaxPool) that down-samples the spatial size of the output, by selecting the maximum value of the region to which the filter operator is applied. In our scheme, we used 1D max-pooling with a pooling size of 2 and 1 stride size. Additionally, after each max-pooling operator a dropout layer is imposed in order to provide higher generalization of results for unseen data, by dropping out a percentage of outputs from the previous layer. All convolutional layers are activated using the ReLU function. After the last pair of 1DConv-MaxPool layers, a flatten layer is imposed, followed by a stack of fully-connected/dense layers. Generally, the majority of learning parameters are included on the fully-connected layers. The last layer is a softmax activated layer, which is responsible for the assigning the probabilities to the corresponding classes, and thus is responsible for the classification task.
4. Experimental Setup
In this section, we provide the dataset description, including the data acquisition process, the experimental scenario that was exploited, the evaluation metrics, and finally the quantitative performance of the proposed architecture.
4.1. pfSense Software
In this work we exploit data that were extracted through pfSense software [1,58], which acts as a firewall service, also enabling the Suricata [59] intrusion detection service using Snort detection rules. pfSense is a customized FreeBSD (Berkeley Software) distribution, oriented to be used as a firewall and router. It has started as a fork of the m0n0wall project, which was mainly directed towards embedded hardware installations [2]. Contradictory, pfSense is more focused on full PC installations. pfSense platform, includes many base features, and can be extended with the package system, including “one touch” installations. pfSense stands as a viable replacement for commercial firewalling/routing packages, including multiple features that can be found on commercial products such as SonicWall and WatchGuard among others. Out of the most significant features of pfSense are the firewall, routing, QoS differentiation, NAT, Redundancy, Load Balancing, VPN, Report and Monitoring, Real Time information, and a Captive Portal. It is fully prepared for high throughput scenarios (over 500 Mbps), as long as high-end server class hardware is used. Logs, in pfSense software, contain recent events and messages from daemons. These messages can be stored locally on a limited basis or forwarded to a central logging server for long-term storage, better reporting, and alerting among others. pfSense logs are contained in a binary circular log format called clog. These files have a fixed size that does not grow. Consequently, logs only hold a certain amount of entries. As the new log entries are added to the system, the old entries are removed. Additionally, logs can be copied to another server with syslog where they may be permanently retained or rotated with less frequency. On normal installations, where logs are kept on disk, they are retained across reboots.
4.2. Dataset Description
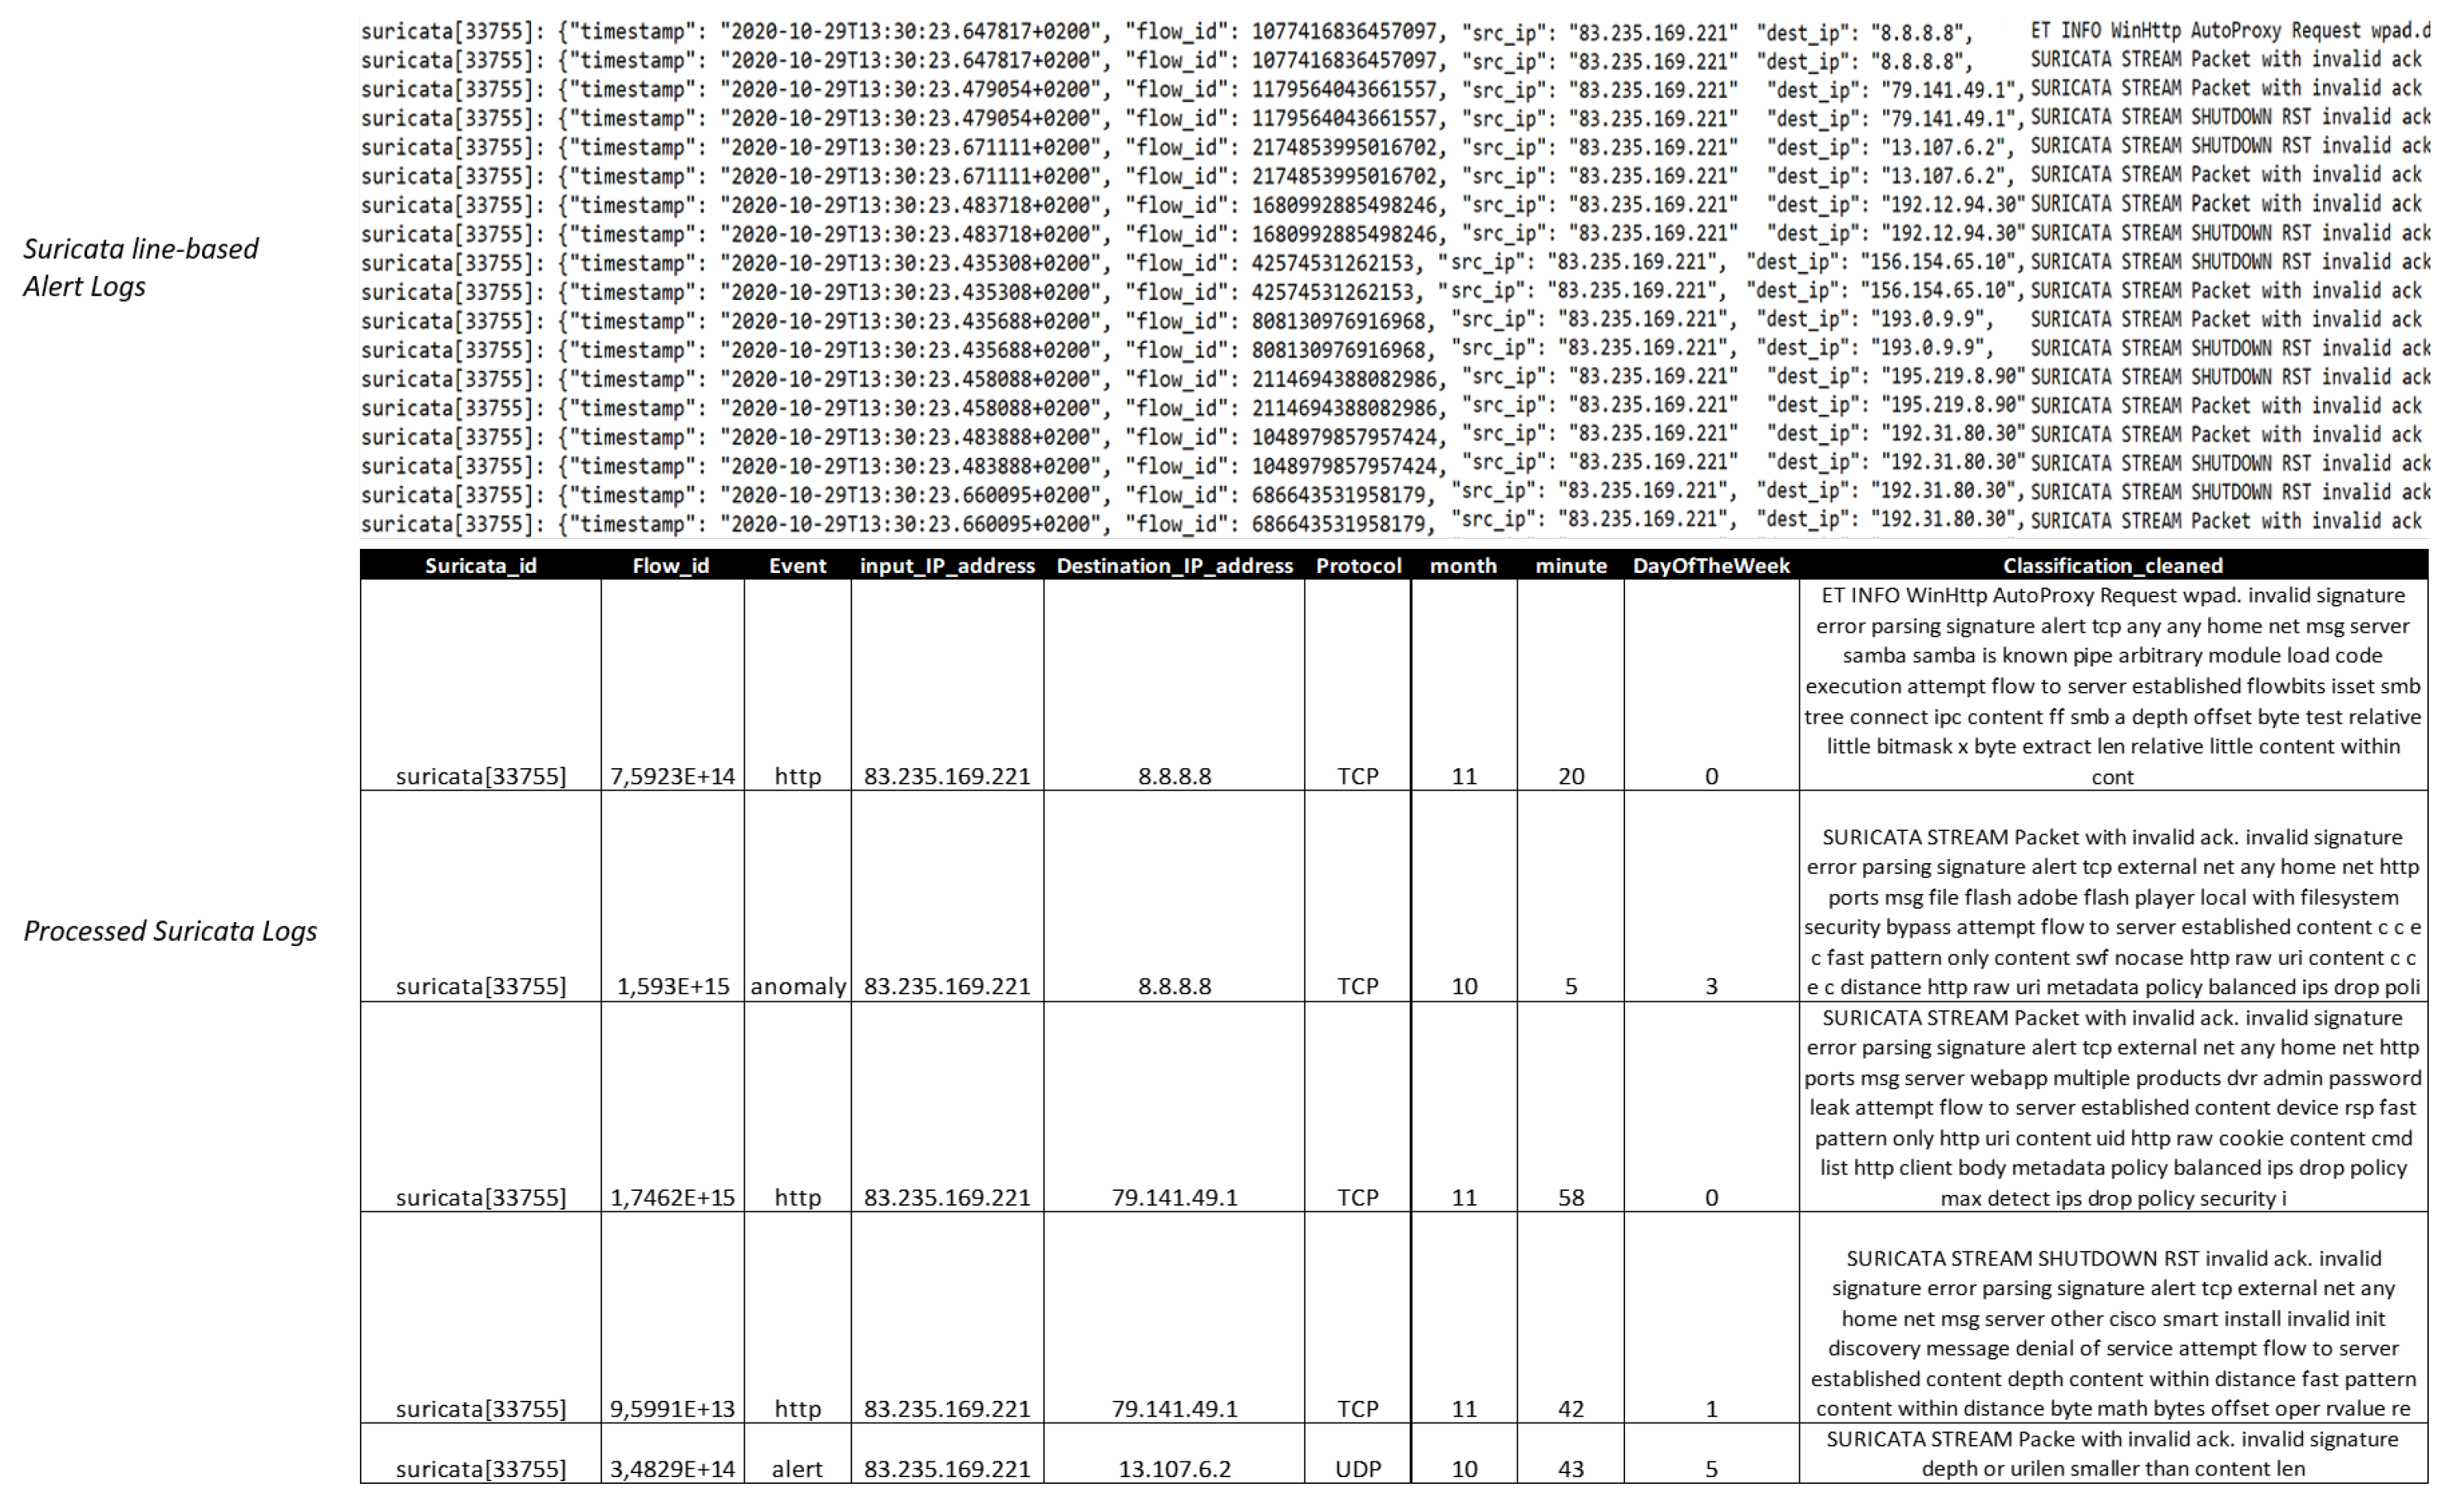
Suricata is a high-performance and multi-tasking network intrusion detection (IDS), prevention (IPS) and security monitoring engine, designed to protect networks, as well as collect, and store information about any incoming signals [59]. Additionally, it is open source and owned by a community-run non-profit foundation, the Open Information Security Foundation (OISF). The work of the Suricata attack detector is based on the analysis of signatures and heuristics, and its convenience is due to the presence of open access to the source code. This approach allows the users to customize the system performance for individual tasks. The main settings include rules referring to traffic analysis, filters that limit the output of an alert, and notifications regarding active ports and networks among others. Consequently, Suricata, stands as an intelligent and highly flexible IDS/IPS solution, that can be easily extended or modified depending upon the type of the attack, making it as effective as possible. Information and communication systems capture and store information about suspicious activity. The users are able to edit the settings of the attack detector, to specify internal, external networks, address ranges of the different servers, and the utilised ports, among others. Additionally, on Suricata’s default settings, the traffic to external interfaces is also analysed. Suricata supports multiple output formats, including: the line-based alerts, EVE JSON, http-logs, packet logs, and verbose alerts. In our study, we exploit the line-based alert logs file, and a characteristic example of the extracted logs is illustrated in Figure 4.
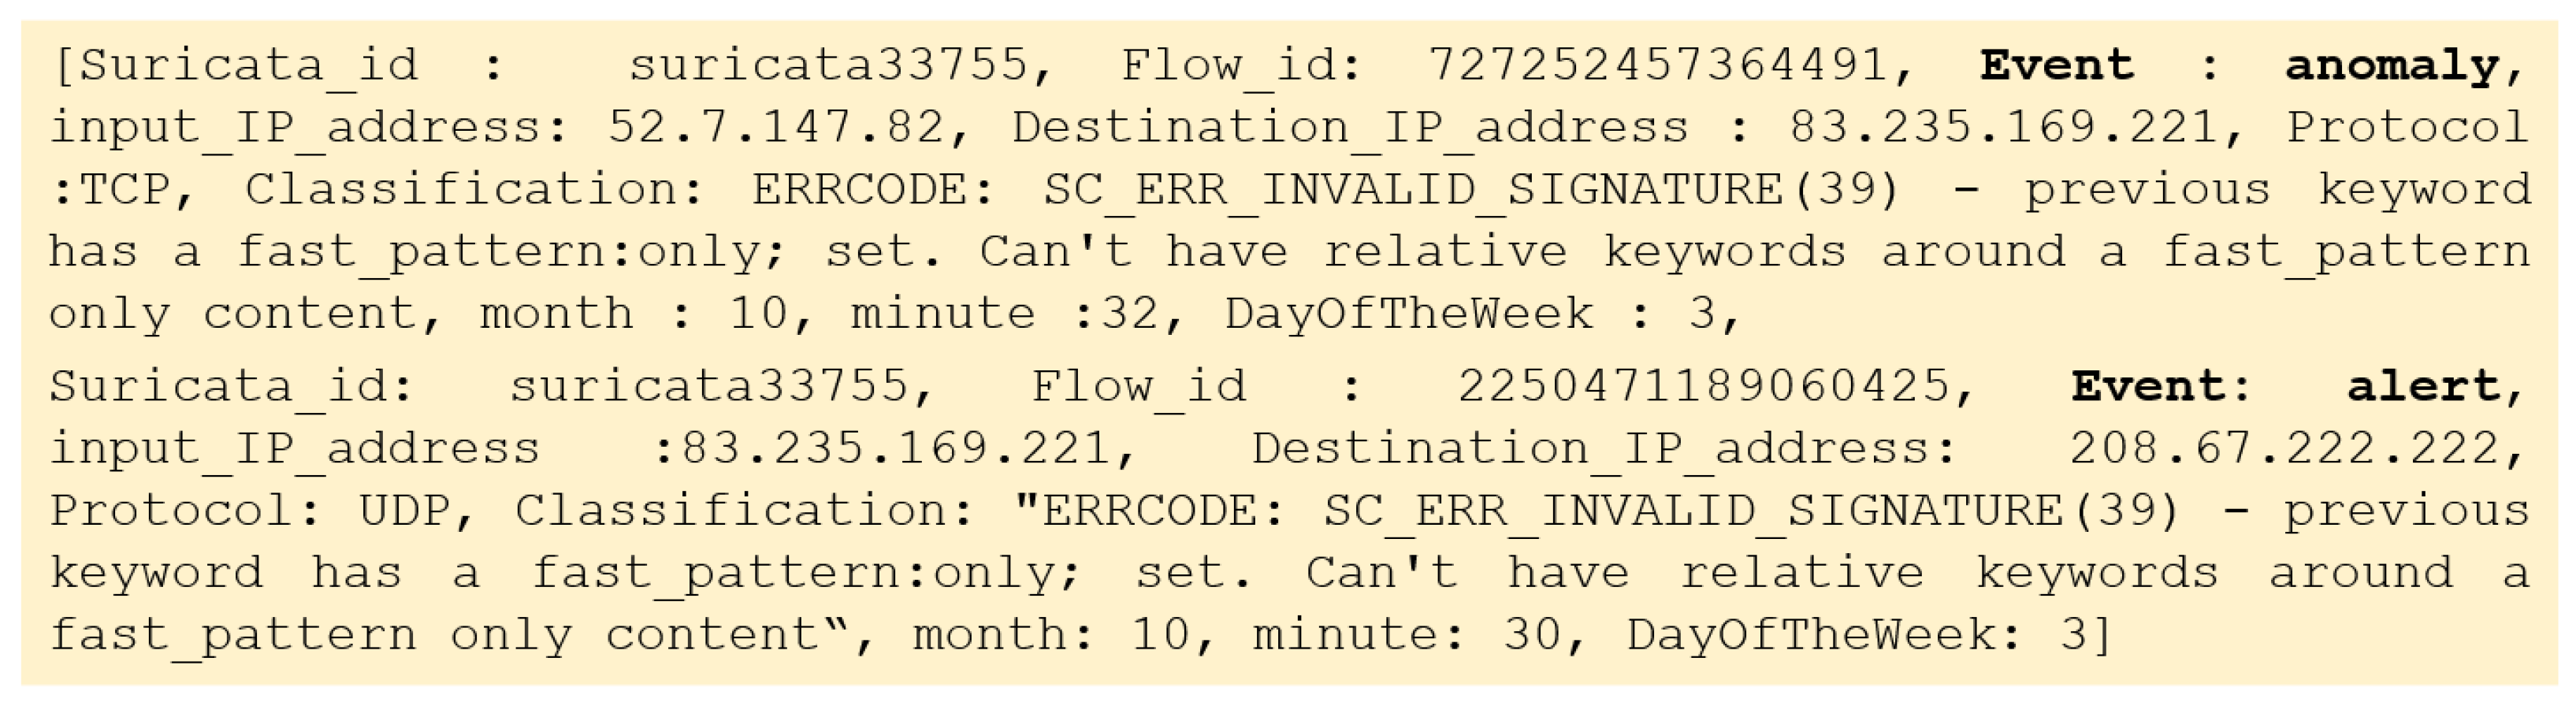
The attributes that are extracted from the Suricata line-based alert logs, are: ,. We consider as our training set, the attributes: , along with their corresponding labels which are included into the <Event> attribute. <Event> attribute indicates the type of the instance. Regarding the attribute, we observe that there exist 52 distinct classification occurrences. Regarding the attribute, 6 distinct types are reported. However, we observed that several data records appear with either corrupted or missing attribute. For this purpose, the main goal of this study is to classify the events with respect to the attribute, in order to also cover the cases that data instances might appear with missing information on this field. Consequently, during the testing phase, examples with similar attributes are presented, and task is to determine the precise value of the <Event> category. The main goal is to identify the “alert” and “anomaly” cases, and to provide the precise <Event> type, since we are not confronting a binary classification problem. Figure 5 presents two characteristic examples of “alert” and “anomaly” network logs.
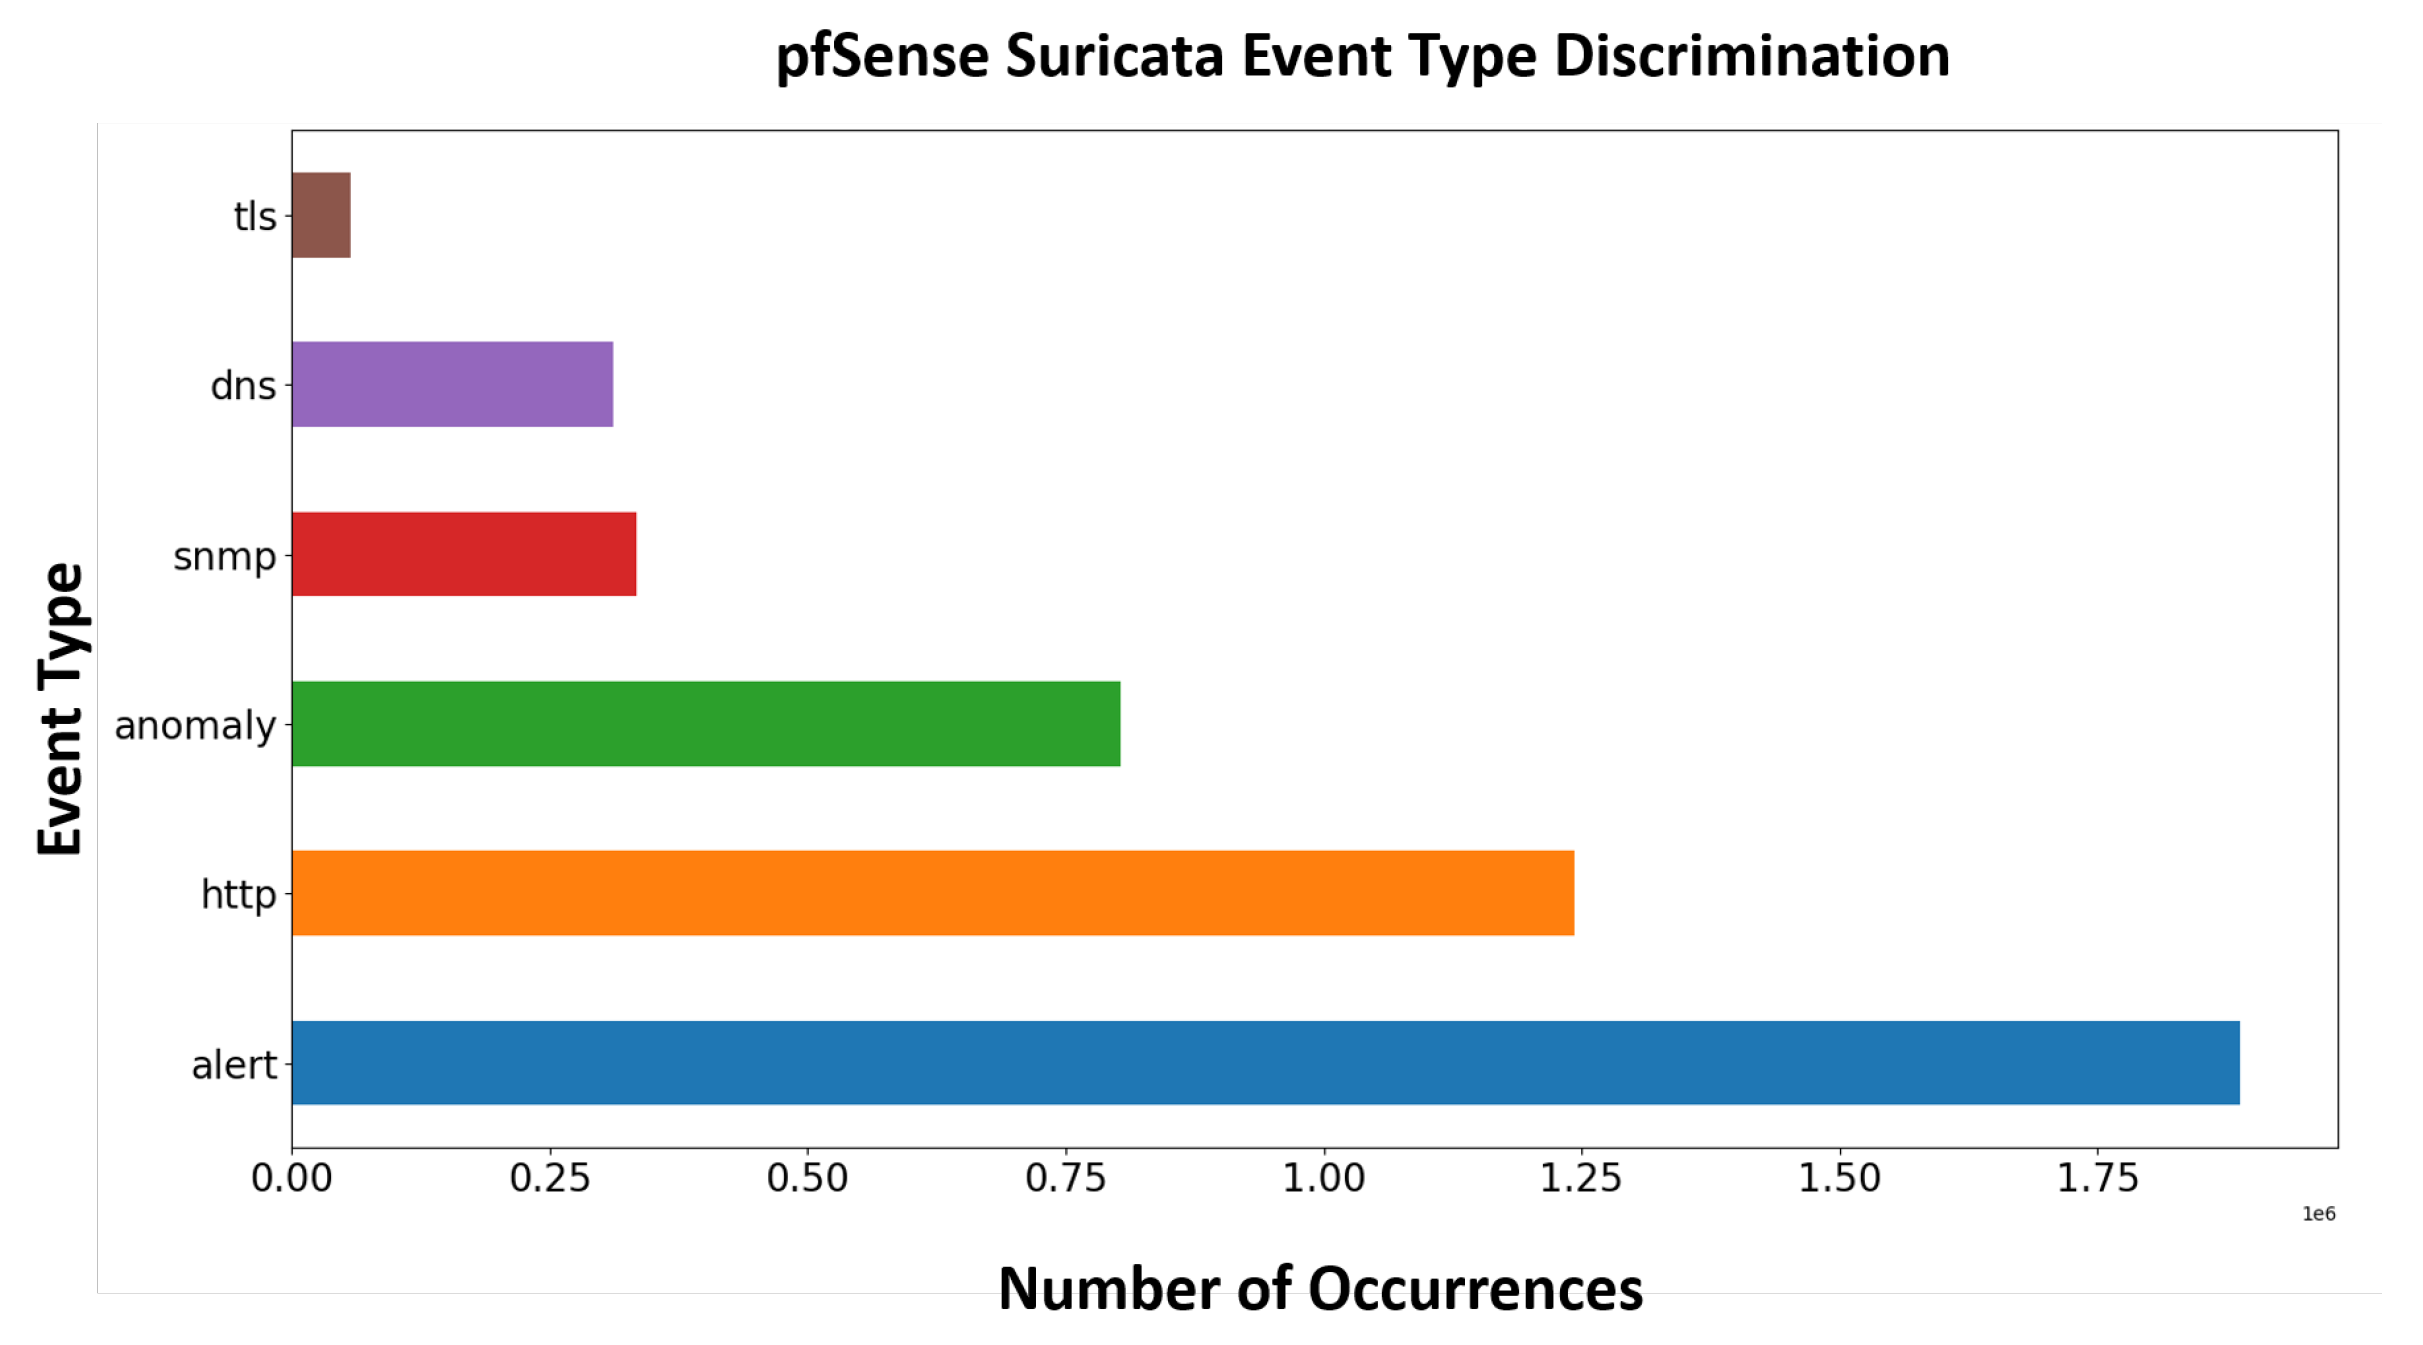
Additionally, in Figure 6 we demonstrate the distribution of the categories. We observe, that the majority of cases on our total approximately 700,000 network instances are marked as “alert”, and much less number of instances as “anomaly”. However, since the number of occurrences among the variant classed is not balanced, we should consider to incorporate this remark also in our models.
4.3. Evaluation Metrics
The most significant indicator that quantitatively evaluates the performance of the proposed architectures is the (Accuracy, AC) metric, defined as follows:
where True Positives (TP) indicate the number of anomaly measurements that are identified as anomaly, False Positives (FP) denote the number of normal records that are identified as anomaly, True Negatives (TN) correspond to the number of normal records that are identified as normal, and False Negatives (FN) denote the number of anomaly measurements that are characterized as normal [60].
Additionally, we have selected the Area Under the Receiver Operating Characteristic (ROC) Curve (ROC-AUC) score as an evaluation metric to determine the degree of separability among the different categories, since it measures the classification performance of each model/per each class. ROC curve illustrates the ratio between the True Positive Rate (TPR), i.e., , and the False Positive Rate (FPT), i.e., . Using the specific metric, we evaluate how the model works while distinguishing between the variant anomaly or normal statuses. ROC-AUC scores that are close to 1.0 indicate highly robust models, that can perfectly determine the variant different classes. Moreover, we exploit the Precision, Recall, and F1-score metrics defined as:
High score on Precision metric indicates a lower False Positive Rate, i.e., achieving less fault-free data that were incorrectly marked as faulty. On the other hand, high score on the Recall metric demonstrates low ratio of False Negatives, and thus prevents from false event detection. Finally, F1-score provides the harmonic mean of Precision and Recall, by capturing these two measures on a single metric. Finally, regarding the loss function, since we confront a multi-class classification problem, the categorical cross-entropy function [61] is exploited and defined as:
where stands for the ground truth, and for the predicted values, while K denotes the total number of classes.
Experimental Results
In the following paragraphs we demonstrate the evaluation results obtained using the proposed formulations: (i) the LSTM neural network architecture, and (ii) the 1D-CNN scheme, for the 6-<Event> category multi-class classification problem of the pfSense Suricata network logs. Regarding the dataset split, for both architectures we follow a 80–20% split ratio, considering the of our dataset for the training, and the rest for the testing phases, respectively. In order to successfully validate the proposed deep learning architectures, we extract a small sample of our initial training set as the validation set in order to provide an unbiased evaluation of the model fit on the training dataset while tuning the models hyper-parameters. The validation split ratio that was used during the model’s training process was also set into . Moreover, since we are dealing with real-world’s data that are highly imbalanced, we are significantly cautious with avoiding over-fitting scenarios. For this purpose, we set class weights for our imbalanced classes [62]. Using this strategy the proposed models will avoid cases of over-fitting, and will able to generalize better for all trained scenarios, even if they contain a limited number of training examples.
Regarding the LSTM neural network architecture, we include one embedding layer composed of 50 hidden units, followed by a Dropout layer, one LSTM layer with 50 hidden nodes, followed by another Dropout Layer and two Dense layers with 10, and 6 hidden units, respectively. The final layer is a fully connected Dense layer, activated with the softmax function and is responsible for the classification task. Specifically, the output layer (i.e., classification layer) assigns the corresponding probabilities to the output classes (i.e., the classification levels) that we investigate. The maximum value of these probabilities indicates the corresponding class. The number of the hyper-parameters were evaluated via a thorough validation approach, in which we have selected the best possible parameters for our architecture. The number of batch-size was set to 512, while the number of internal epochs was set to 50. We observe, that within the interval of 50 epochs, we achieve highly robust results, including convergence in terms of the reduction of the loss fuction, and in terms of achieving high ratio in Accuracy. Finally, the dropout ratio was set into 0.3 for all layers.
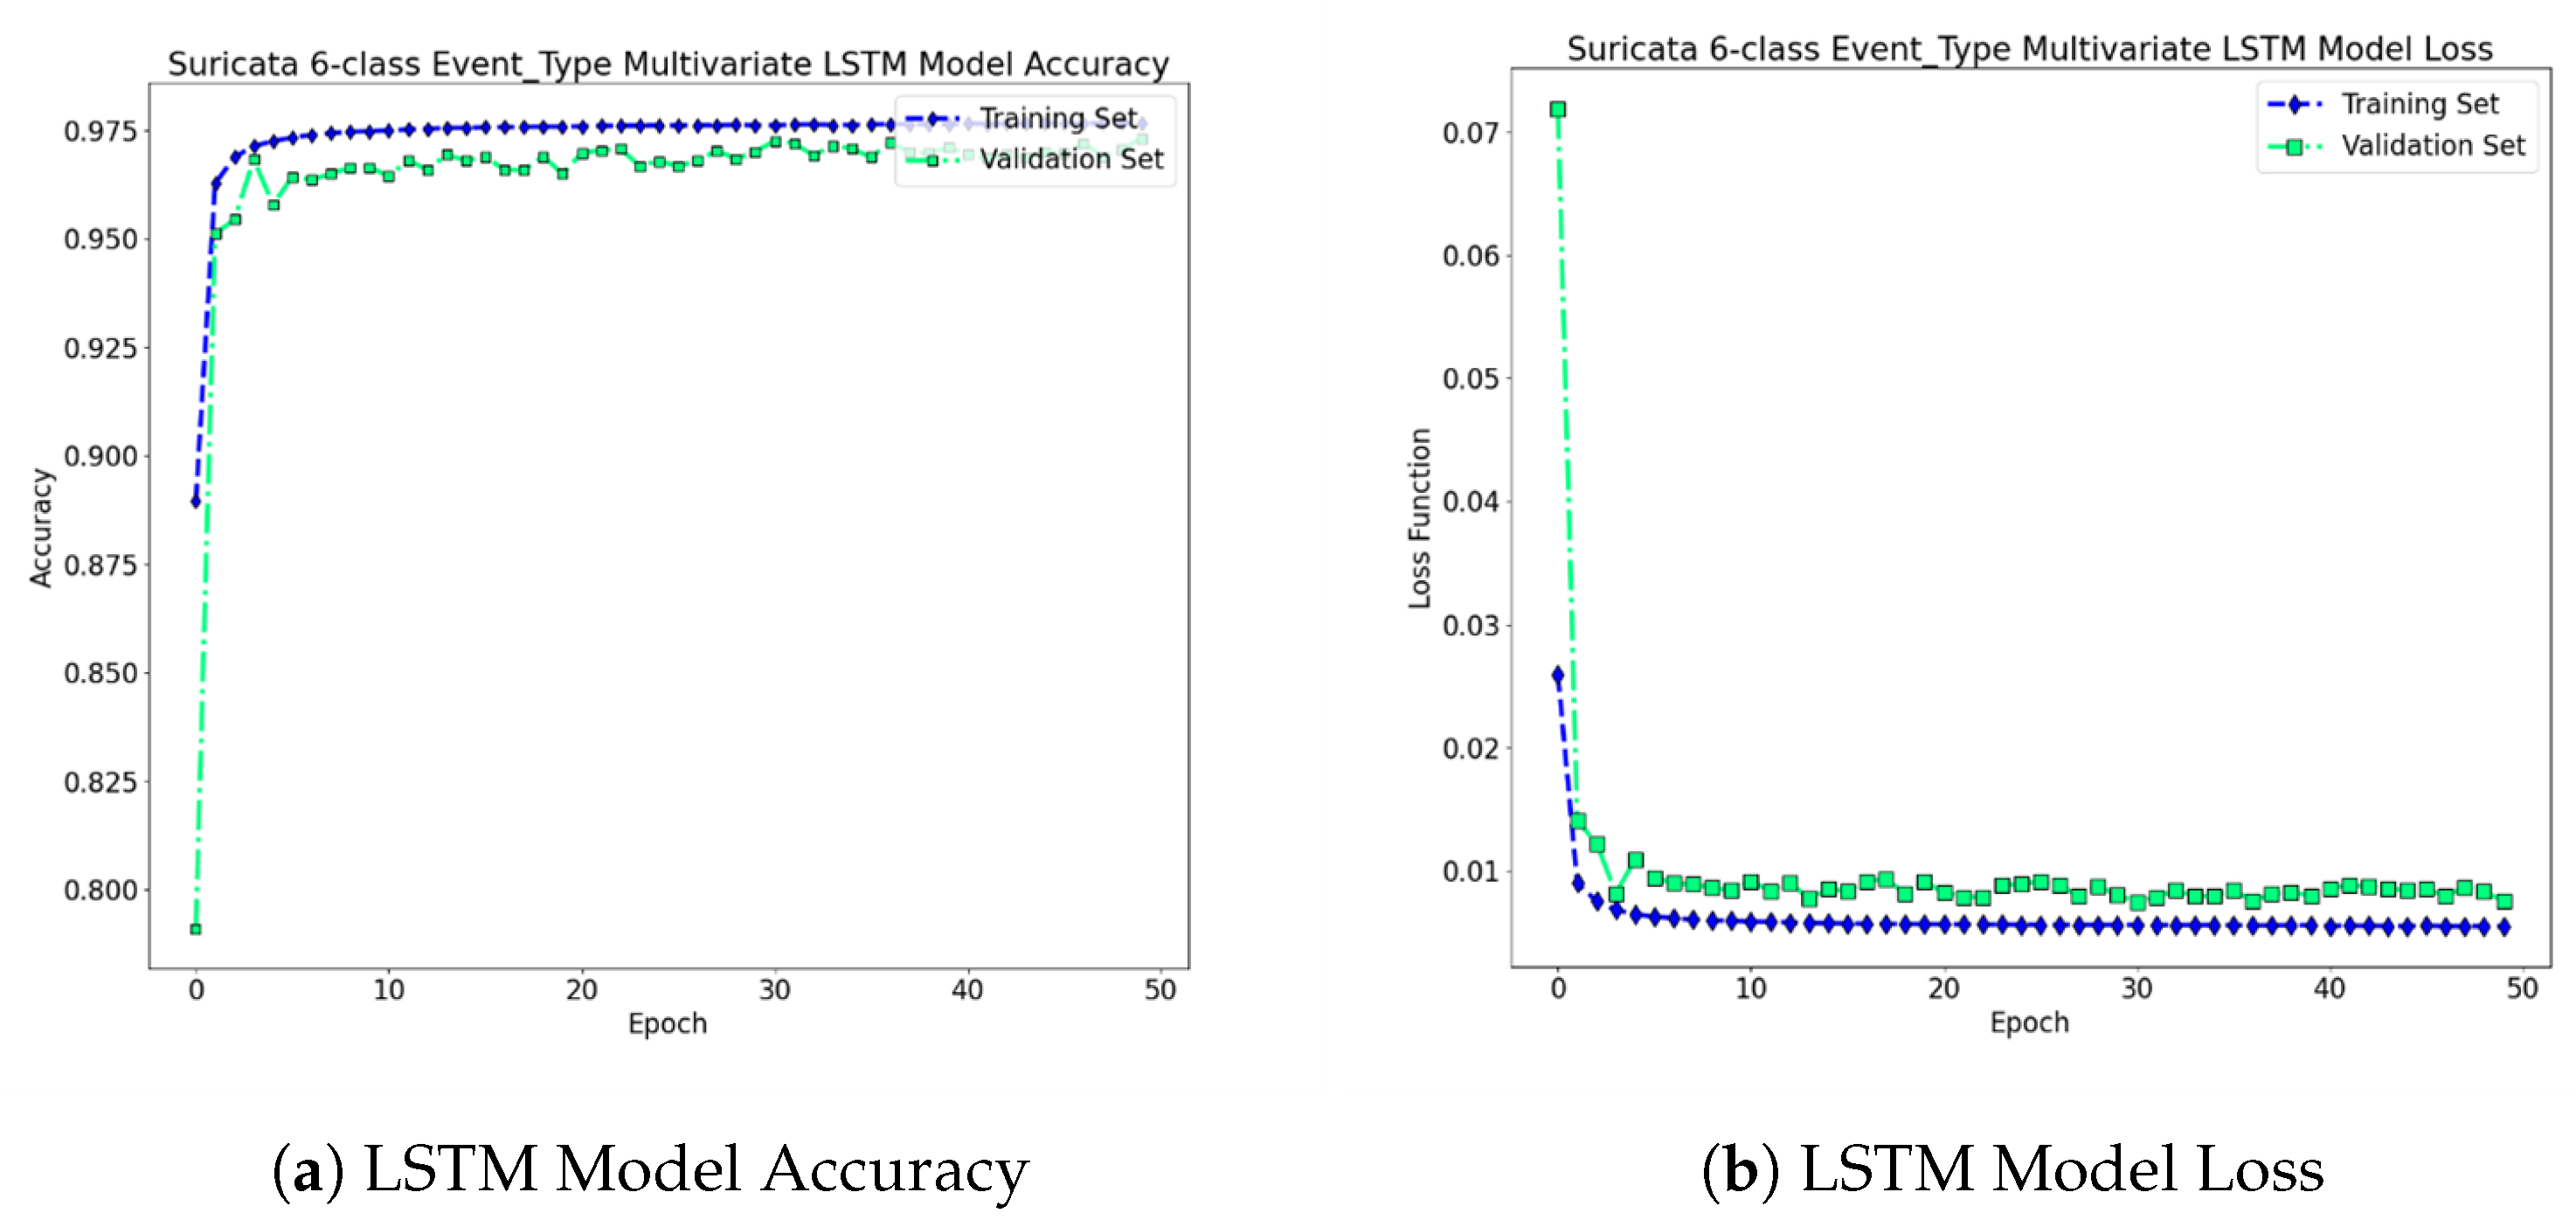
In Figure 7, we illustrate the LSTM neural network architecture’s accuracy and loss function with respect the number of epochs. The total accuracy for the training and validation phases that was achieved via the proposed method is: and , respectively, while the total error of the loss function is set to: and for the training and validation phases, respectively. We observe that the extracted values for both accuracy and Mean Squared Error (MSE) loss function illustrate a significantly robust architecture that can be further generalized and tested successfully with new network Suricata Logs containing similar structure. Regarding the testing phase, the proposed scheme achieves accuracy and MSE loss on the of Suricata logs that remained for testing. Consequently, as we may notice the proposed scheme is able to generalize with high accuracy on new/“unseen” network observations.
Regarding the 1D-CNN scheme, we consider one embedding layer composed of 50 hidden units, followed by a sequence of 1D-convolutional layers, with filter size 5, batch size 256, and 32 number of filters. Specifically, the input data sequence passes through the first layer, which is an embedding one and is composed of 50 hidden units. After the embedding layer, we consider the convolution operators, followed by the max-pooling operators that reduce the tensors’ dimensions. The 1D-CNN constructs a tensor of shape , which is then passed to a max-pooling layer of filter size 2 and 1 stride. The pooling layer reduces the tensor shape into . After the max-pooling layer, a spatial dropout layer is introduced, with 0.5 dropout ratio, followed by a flatten layer, and two dense layers composed of 64 and 6 hidden nodes, respectively.
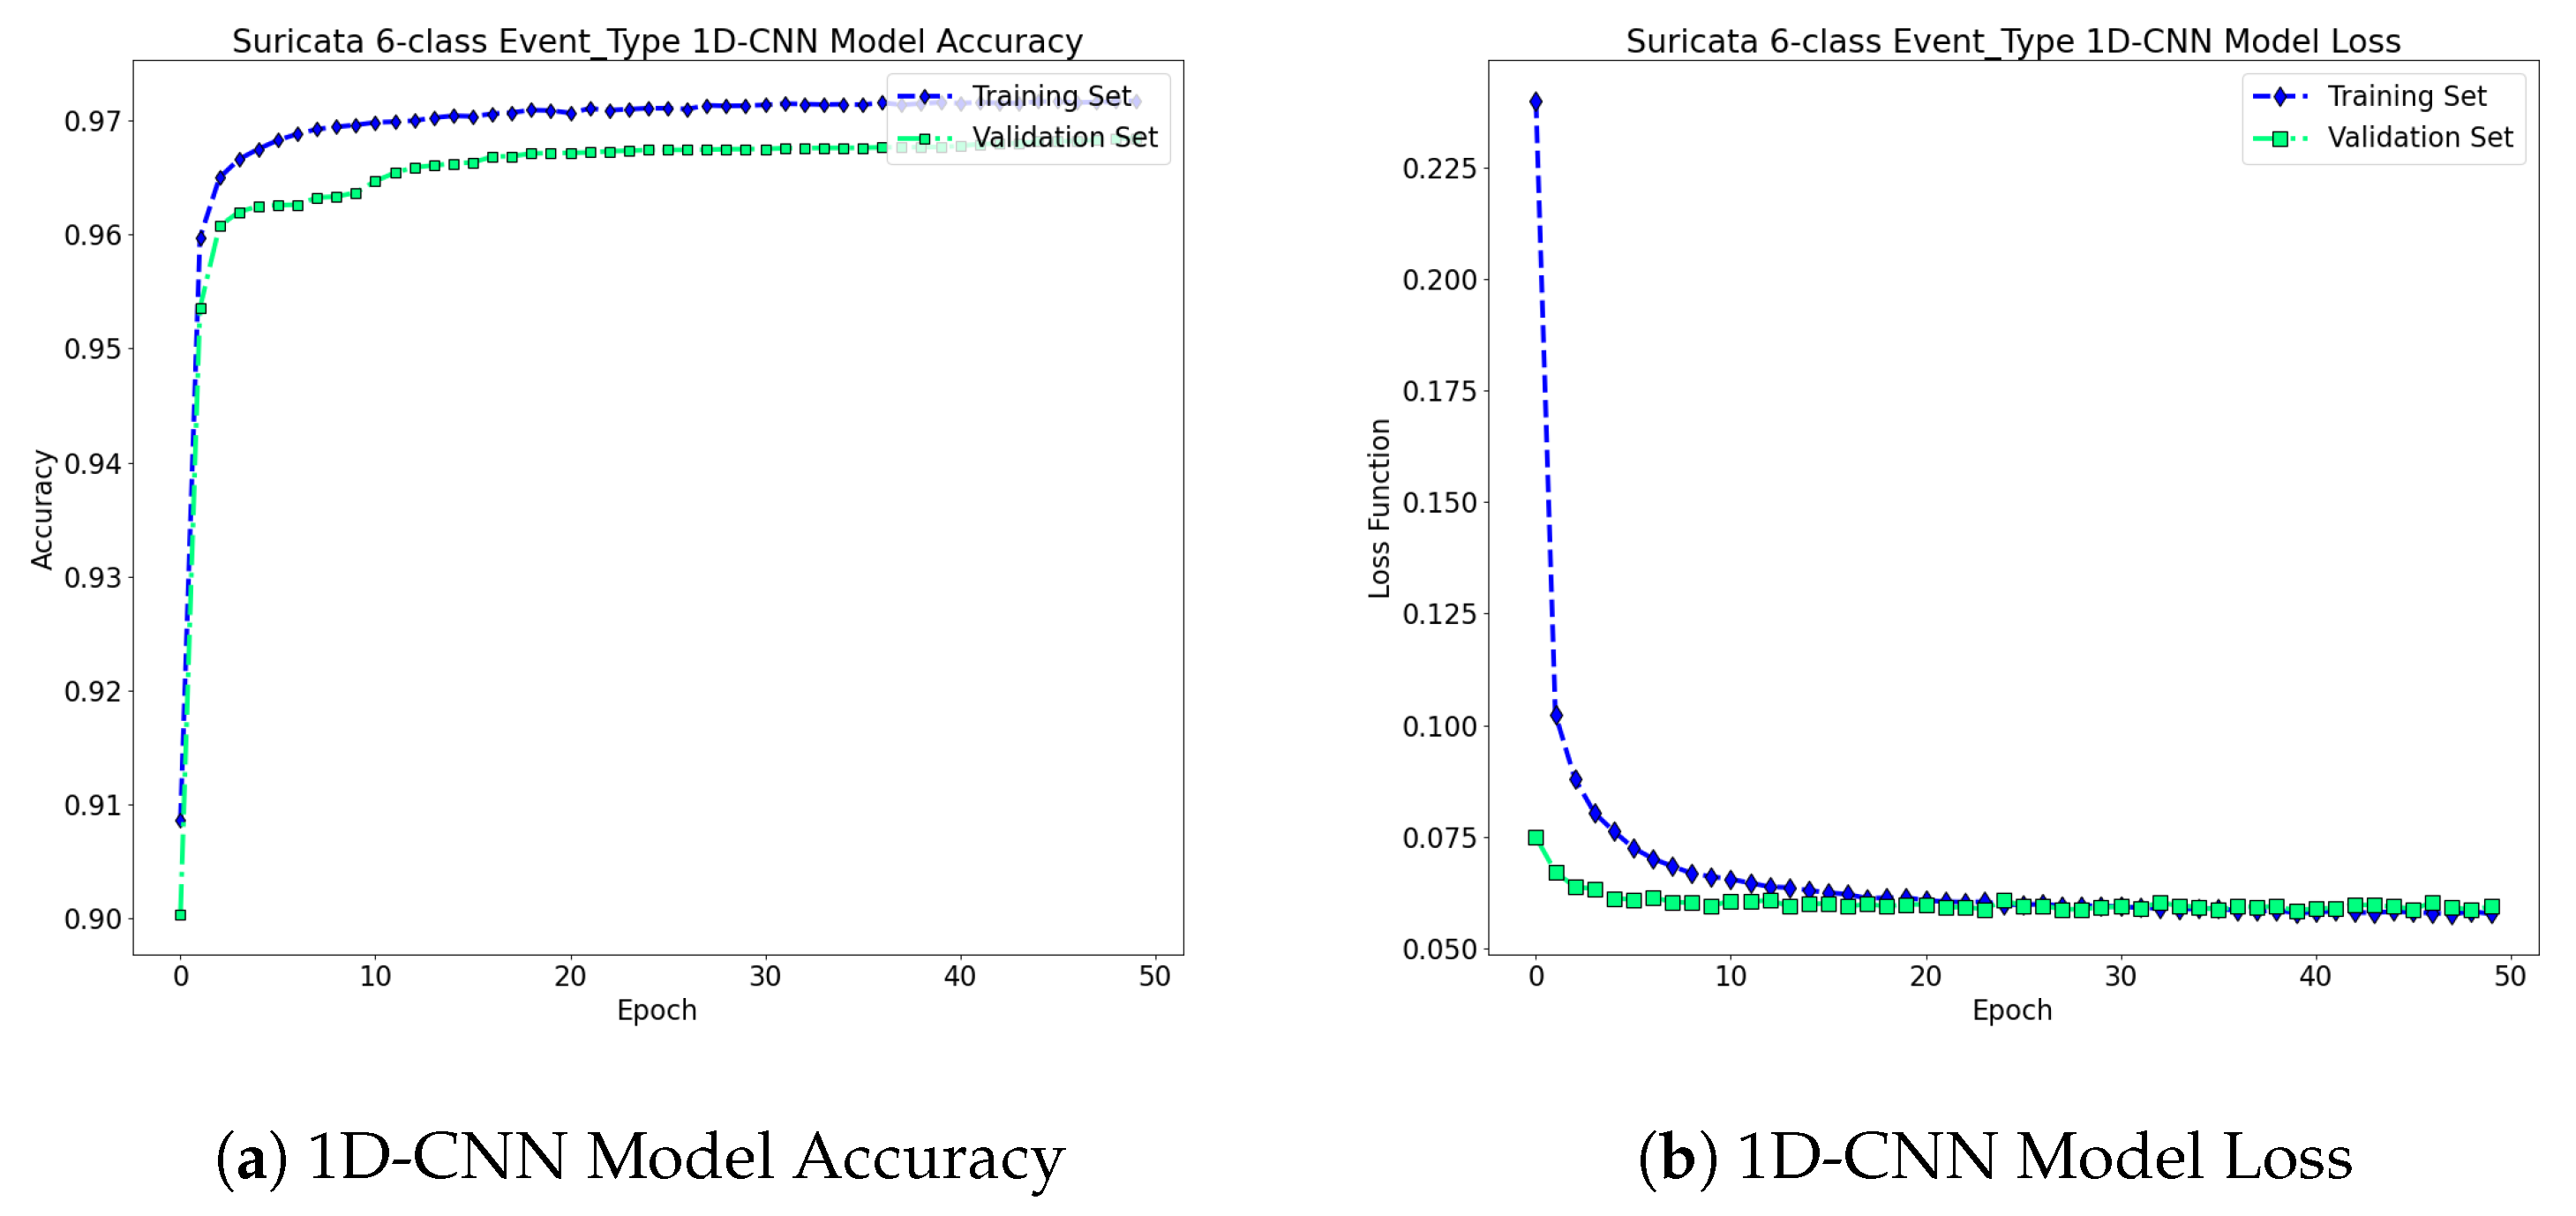
The dense layer that has 64 hidden units is activated using the ReLU fuction, while the last layer, which is composed of 6 hidden nodes, is activated with the softmax fuction and is responsible for the classification task. The optimizer that was exploited in the specific scenario is the Adam, using a learning rate of . Moreover, Figure 8, demonstrates the proposed 1D-CNN model’s accuracy and loss function with respect to the number of epochs. The achieved accuracy for the training phase is: , while for the validation phase is . The total loss function error is set to: and for the training and validation phases, respectively. Regarding the testing phase, the proposed scheme achieves accuracy and MSE loss on the of Suricata logs that were extracted out of the initial dataset for testing.
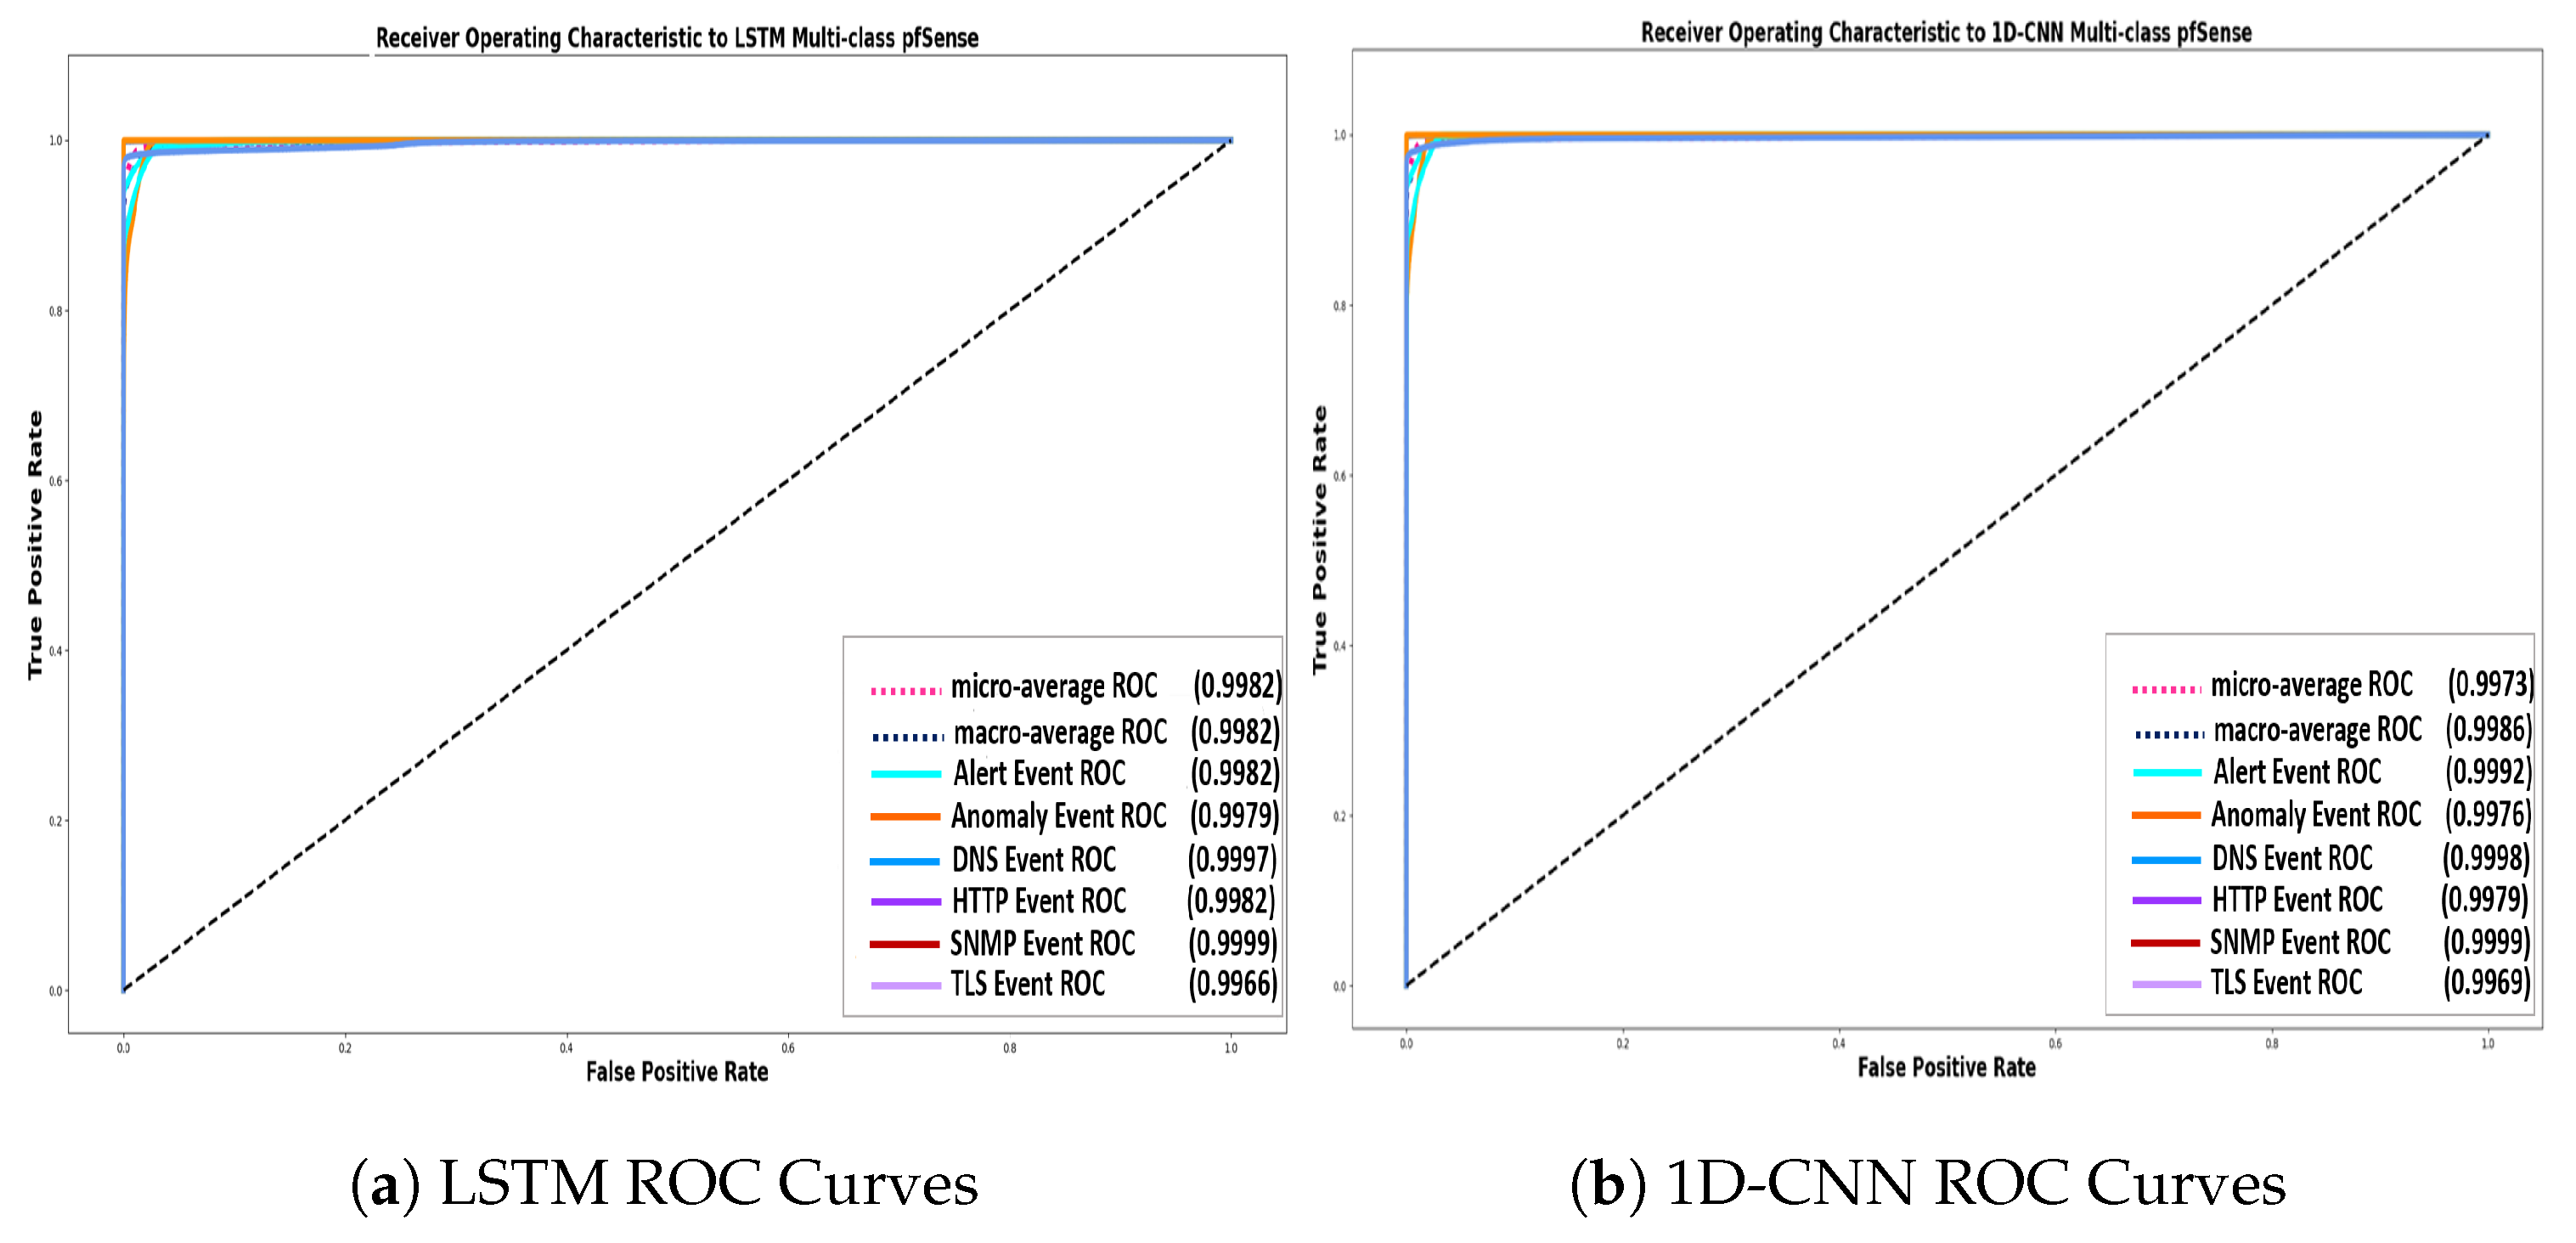
Figure 9 illustrates the AUC-ROC curves that were constructed via the proposed LSTM and 1D -CNN architectures, concerning the classification among the different Event-type category of pfSense Suricata Logs. In these figures, the distribution between the false positive and true positives rates for each separate class is illustrated. Regarding the LSTM scheme, the observed detection performance among the different categories is: DNS: , Alert: , Anomaly: , HTTP: , TLS: , SNMP: . Moreover, regarding the 1D-CNN formulation, the performance for classifying between the different categories is: DNS: , Alert: , Anomaly: , HTTP: , TLS: , SNMP: . Consequently, we observe that both the LSTM and the 1D-CNN techniques provide high quality estimations of each separate Event-type category.
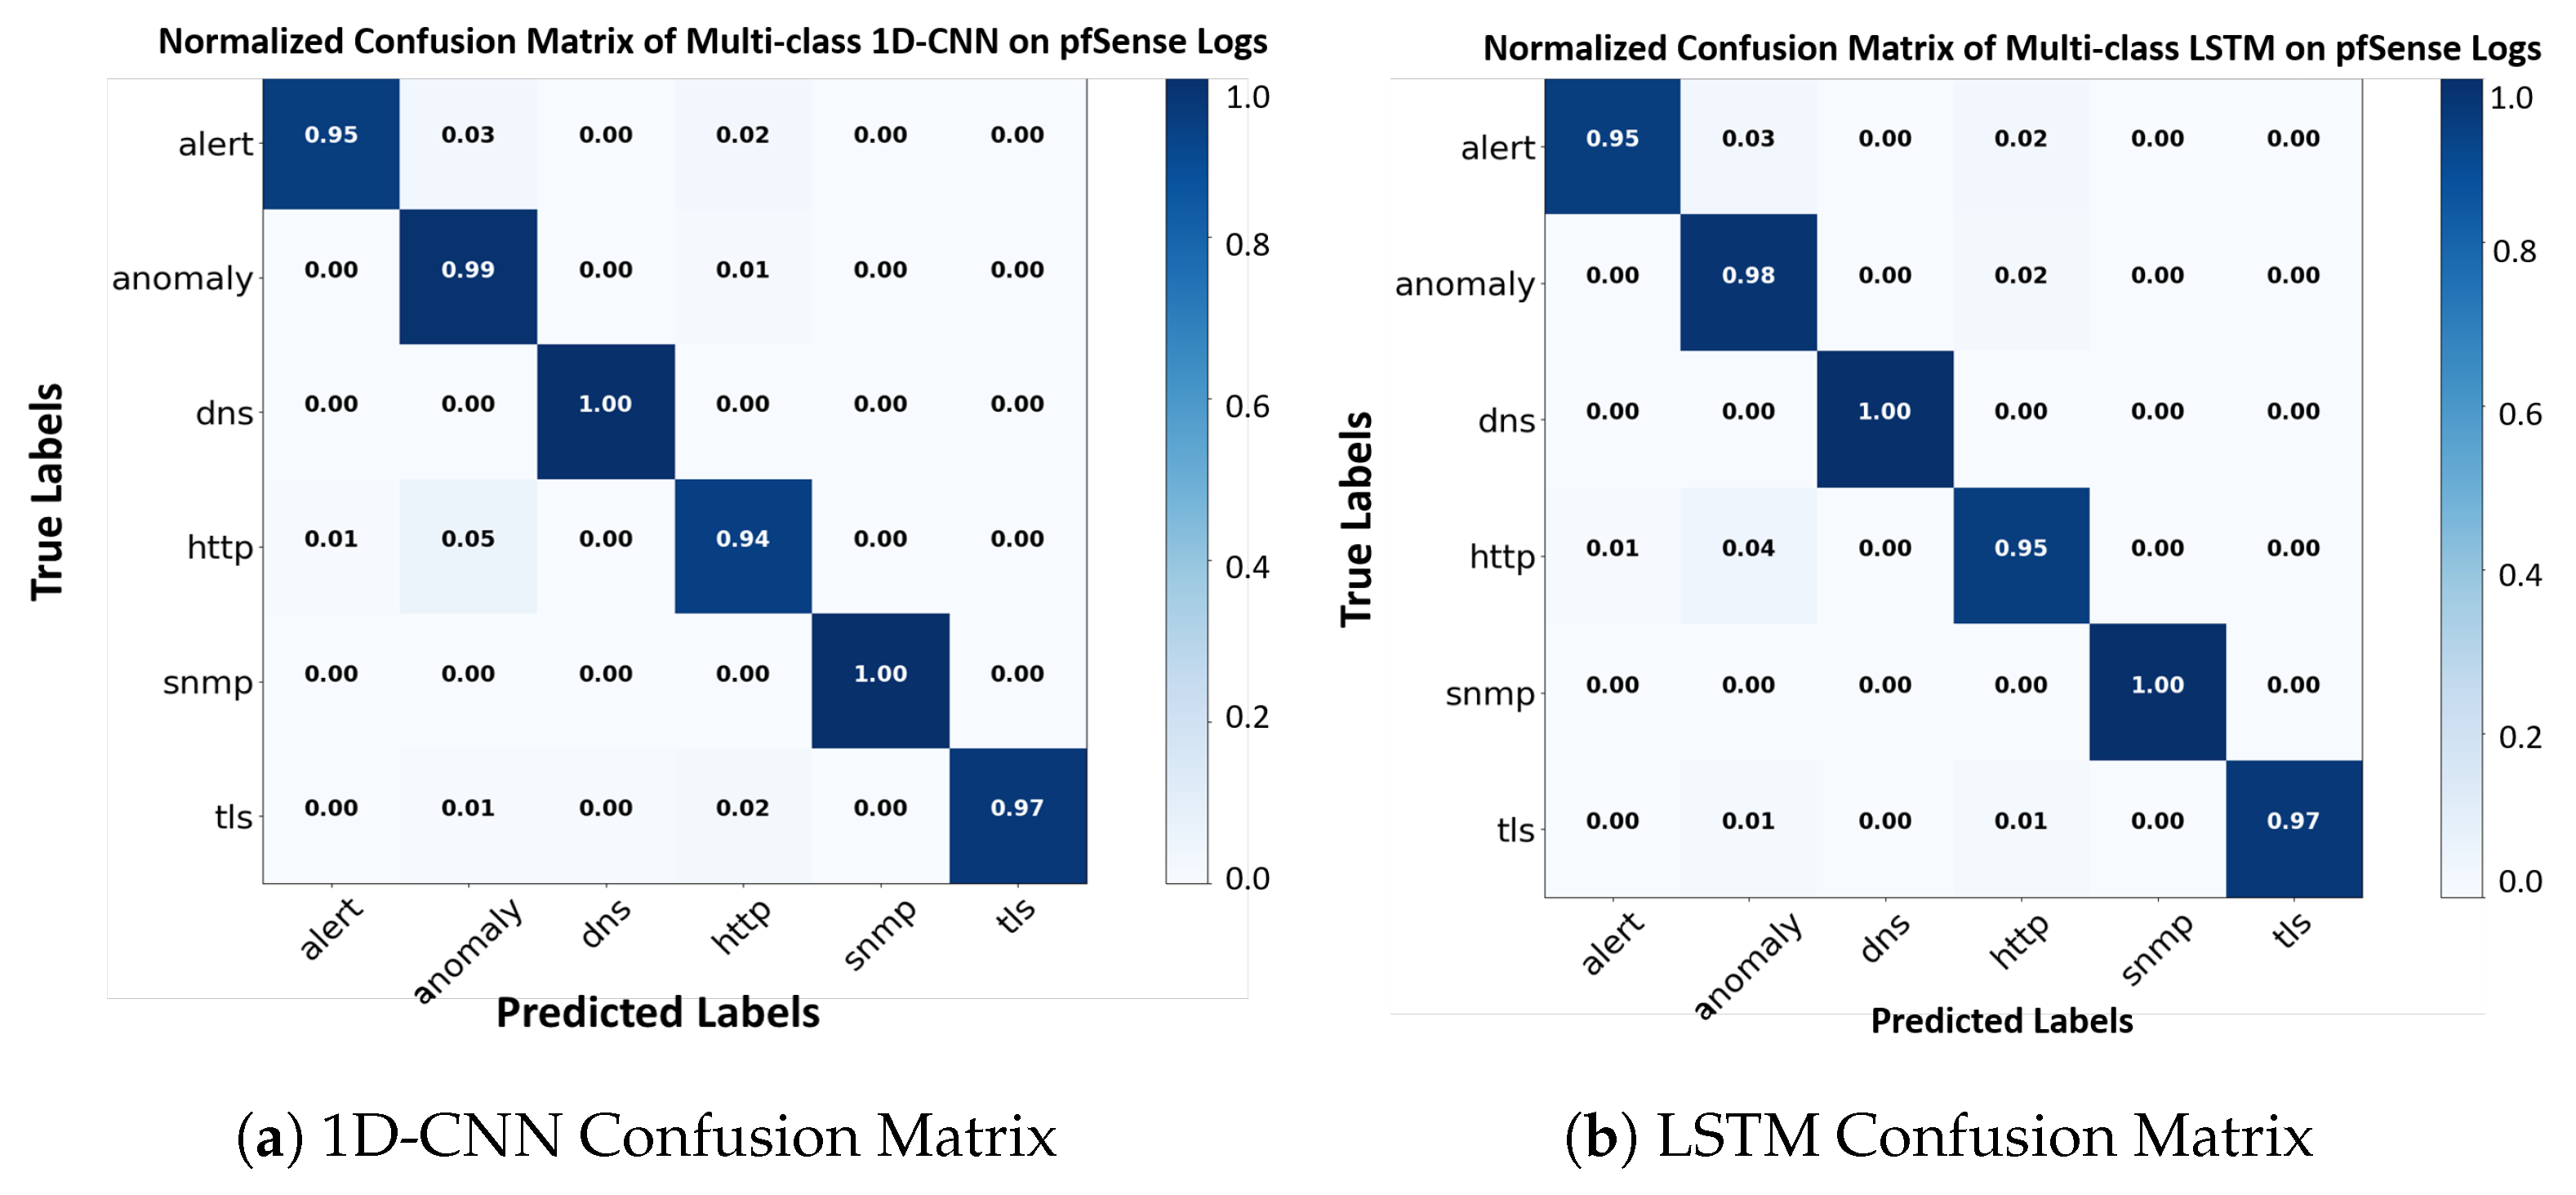
Additionally, Figure 10 demonstrates the normalized confusion matrices that were achieved via the proposed LSTM and 1D-CNN techniques, towards the 6-Event type category classification of Suricata logs. We observe that both architectures provide high detection rate among the variant categories, regarding the models’ predicted labels towards the ground truth labels. All the above examples demonstrate the high performance of our proposed deep learning formulations in representing real-world data, and learning robust features from them, that significantly facilitate the problem of network anomaly detection, from the perspective of multiclass classification of pfSense Suricata logs.
Furthermore, in order to validate the superiority of the proposed architectures, we compare our results with state-of-the-art classifiers, namely with the: (i) traditional, ML-based Random Forest classifier [63], and with the (ii) Multi Percepton Model (MLP)-fully connected neural networks. Concerning the Random Forest classifier, we selected 20 estimators, while the max depth parameter was set to 12 in order to achieve proper classification results. Regarding the MLP multi-class classifier, we selected a four intermediate-layer architecture, composed of 512,256,128 and 64 hidden nodes, respectively. The last layer, which is composed of 6 nodes, is activated with the softmax function and is responsible for the multi-class classification task of the variant Event type categories. In terms of classification accuracy on the validation set, we observe that the highest score for the pfSense, Suricata logs multi-class Event type classification, is achieved first by the LSTM scheme with an accuracy of 97.29%, followed by the , then by the MLP model with , and finally by the Random Forests with . Concluding, Table 1 depicts the Precision, Recall, and F1-score metrics that are achieved via the comparable schemes, representing the various <Event> classes of pfSense logs. We observe that our proposed multi-class classification schemes achieve highly accurate results for all classes, and in all cases over in terms of all metrics, validating our claim that the specific schemes are very prominent in predicting accurately the Event type of pfSense Suricata network measurements.
5. Conclusions
This paper examines the performance of two efficient and robust deep neural network architectures, namely: the LSTM and the 1D-CNN, for the challenging problem of pfSense Suricata anomaly detection/multi-class classification problem. Both developed formulations were trained on multivariate time-series data including significant text information in order to classify between the variant “Event” states of the pfSense Suricata log instances. The proposed techniques present high-quality results regarding the classification accuracy, the reduction of the loss function reconstruction error, and the evaluation metrics, compared to state-of-the-art classifiers. The superiority of the proposed architectures lies in the fact that they present high detection accuracy in real-world’s data, and gives us the insight that these schemes with slight data pre-preprocessing steps and modifications are able to tackle any kind of network anomaly/intrusion detection application.
Author Contributions
Conceptualization: K.F., T.-H.V., A.V., S.T.; Methodology: K.F., T.-H.V., A.V., D.S., T.Z.; Software: K.F., A.V., D.S.; Validation: D.S., K.F., T.-H.V., A.V.; Writing—Original draft preparation: K.F., T.-H.V., A.V.; Writing—review and editing: D.S., T.Z.; Supervision: T.Z., S.T.; Project administration: T.Z., A.V., S.T; Funding acquisition: T.Z., A.V., S.T. All authors have read and agreed to the published version of the manuscript.
Funding
This work was partially funded by the H2020 PHOENIX project, contract no. 832989, within the H2020 Framework Program of the European Commission.
Institutional Review Board Statement
Not applicable.
Informed Consent Statement
Not applicable.
Conflicts of Interest
The authors declare no conflict of interest.
References
- pfSense-World’s Most Trusted Open Source Firewall. Available online: https://www.pfsense.org (accessed on 18 May 2021).
- pfSense-Documentation. Available online: https://docs.netgate.com/pfsense/en/latest/ (accessed on 18 May 2021).
- Apache Spark. Available online: https://spark.apache.org/docs/latest/streaming-programming-guide.html (accessed on 18 May 2021).
- Kim, D.S.; Nguyen, H.N.; Park, J.S. Genetic algorithm to improve SVM based network intrusion detection system. In Proceedings of the 19th International Conference on Advanced Information Networking and Applications (AINA’05) Volume 1 (AINA Papers), Taipei, Taiwan, 28–30 March 2005; Volume 2, pp. 155–158. [Google Scholar]
- Farnaaz, N.; Jabbar, M. Random forest modeling for network intrusion detection system. Procedia Comput. Sci. 2016, 89, 213–217. [Google Scholar] [CrossRef] [Green Version]
- Sekar, R.; Guang, Y.; Verma, S.; Shanbhag, T. A high-performance network intrusion detection system. In Proceedings of the 6th ACM Conference on Computer and Communications Security, Singapore, 2–4 November 1999; pp. 8–17. [Google Scholar]
- Sultana, N.; Chilamkurti, N.; Peng, W.; Alhadad, R. Survey on SDN based network intrusion detection system using machine learning approaches. Peer-Peer Netw. Appl. 2019, 12, 493–501. [Google Scholar] [CrossRef]
- Samrin, R.; Vasumathi, D. Review on anomaly based network intrusion detection system. In Proceedings of the 2017 International Conference on Electrical, Electronics, Communication, Computer, and Optimization Techniques (ICEECCOT), Mysuru, India, 15–16 December 2017; pp. 141–147. [Google Scholar] [CrossRef]
- Kruegel, C.; Toth, T. Using decision trees to improve signature-based intrusion detection. In International Workshop on Recent Advances in Intrusion Detection; Springer: Berlin/Heidelberg, Germany, 2003; pp. 173–191. [Google Scholar]
- Kumar, V.; Sangwan, O.P. Signature based intrusion detection system using SNORT. Int. J. Comput. Appl. Inf. Technol. 2012, 1, 35–41. [Google Scholar]
- Kwon, D.; Kim, H.; Kim, J.; Suh, S.C.; Kim, I.; Kim, K.J. A survey of deep learning-based network anomaly detection. Clust. Comput. 2019, 22, 949–961. [Google Scholar] [CrossRef]
- Omar, S.; Ngadi, A.; Jebur, H.H. Machine learning techniques for anomaly detection: An overview. Int. J. Comput. Appl. 2013, 79, 33–41. [Google Scholar] [CrossRef]
- Ioulianou, P.; Vasilakis, V.; Moscholios, I.; Logothetis, M. A signature-based intrusion detection system for the Internet of Things. In Proceedings of the Information and Communication Technology Forum (ICTF) 2018, Graz, Austria, 11–13 July 2018. [Google Scholar]
- Ioulianou, P.P.; Vassilakis, V.G. Denial-of-service attacks and countermeasures in the RPL-based Internet of Things. In Computer Security; Springer: Berlin/Heidelberg, Germany, 2019; pp. 374–390. [Google Scholar]
- Dharmapurikar, S.; Lockwood, J.W. Fast and scalable pattern matching for network intrusion detection systems. IEEE J. Sel. Areas Commun. 2006, 24, 1781–1792. [Google Scholar] [CrossRef]
- Mishra, P.; Varadharajan, V.; Tupakula, U.; Pilli, E.S. A detailed investigation and analysis of using machine learning techniques for intrusion detection. IEEE Commun. Surv. Tutor. 2018, 21, 686–728. [Google Scholar] [CrossRef]
- Buczak, A.L.; Guven, E. A survey of data mining and machine learning methods for cyber security intrusion detection. IEEE Commun. Surv. Tutor. 2015, 18, 1153–1176. [Google Scholar] [CrossRef]
- Gupta, R.; Tanwar, S.; Tyagi, S.; Kumar, N. Machine learning models for secure data analytics: A taxonomy and threat model. Comput. Commun. 2020, 153, 406–440. [Google Scholar] [CrossRef]
- Görnitz, N.; Kloft, M.; Rieck, K.; Brefeld, U. Toward supervised anomaly detection. J. Artif. Intell. Res. 2013, 46, 235–262. [Google Scholar] [CrossRef]
- Yamanaka, Y.; Iwata, T.; Takahashi, H.; Yamada, M.; Kanai, S. Autoencoding Binary Classifiers for Supervised Anomaly Detection. In Pacific Rim International Conference on Artificial Intelligence; Springer: Berlin/Heidelberg, Germany, 2019; pp. 647–659. [Google Scholar]
- Ma, J.; Sun, L.; Wang, H.; Zhang, Y.; Aickelin, U. Supervised anomaly detection in uncertain pseudoperiodic data streams. ACM Trans. Internet Technol. 2016, 16, 1–20. [Google Scholar] [CrossRef] [Green Version]
- Akcay, S.; Atapour-Abarghouei, A.; Breckon, T.P. Ganomaly: Semi-supervised anomaly detection via adversarial training. In Asian Conference on Computer Vision; Springer: Berlin/Heidelberg, Germany, 2018; pp. 622–637. [Google Scholar]
- Ruff, L.; Vandermeulen, R.A.; Görnitz, N.; Binder, A.; Müller, E.; Müller, K.R.; Kloft, M. Deep Semi-Supervised Anomaly Detection. arXiv 2019, arXiv:1906.02694. [Google Scholar]
- Song, H.; Jiang, Z.; Men, A.; Yang, B. A hybrid semi-supervised anomaly detection model for high-dimensional data. Comput. Intell. Neurosci. 2017, 2017, 8501683. [Google Scholar] [CrossRef] [PubMed] [Green Version]
- Ahmad, S.; Lavin, A.; Purdy, S.; Agha, Z. Unsupervised real-time anomaly detection for streaming data. Neurocomputing 2017, 262, 134–147. [Google Scholar] [CrossRef]
- Filimonov, V.; Periorellis, P.; Starostin, D.; De Baynast, A.; Akchurin, E.; Klimov, A.; Minka, T.; Spengler, A. Unsupervised Anomaly Detection for Arbitrary Time Series. U.S. Patent 9,652,354, 16 May 2017. [Google Scholar]
- Schlegl, T.; Seeböck, P.; Waldstein, S.M.; Langs, G.; Schmidt-Erfurth, U. f-AnoGAN: Fast unsupervised anomaly detection with generative adversarial networks. Med. Image Anal. 2019, 54, 30–44. [Google Scholar] [CrossRef] [PubMed]
- Zhang, C.; Song, D.; Chen, Y.; Feng, X.; Lumezanu, C.; Cheng, W.; Ni, J.; Zong, B.; Chen, H.; Chawla, N.V. A deep neural network for unsupervised anomaly detection and diagnosis in multivariate time series data. In Proceedings of the AAAI Conference on Artificial Intelligence, Honolulu, HI, USA, 27 January–1 February 2019; Volume 33, pp. 1409–1416. [Google Scholar]
- Gong, D.; Liu, L.; Le, V.; Saha, B.; Mansour, M.R.; Venkatesh, S.; Hengel, A.v.d. Memorizing normality to detect anomaly: Memory-augmented deep autoencoder for unsupervised anomaly detection. In Proceedings of the IEEE International Conference on Computer Vision, Seoul, Korea, 27 October–2 November 2019; pp. 1705–1714. [Google Scholar]
- Ran, J.; Ji, Y.; Tang, B. A Semi-Supervised learning approach to IEEE 802.11 network anomaly detection. In Proceedings of the 2019 IEEE 89th Vehicular Technology Conference (VTC2019-Spring), Kuala Lumpur, Malaysia, 28 April–1 May 2019; pp. 1–5. [Google Scholar]
- Muniyandi, A.P.; Rajeswari, R.; Rajaram, R. Network anomaly detection by cascading k-Means clustering and C4.5 decision tree algorithm. Procedia Eng. 2012, 30, 174–182. [Google Scholar] [CrossRef] [Green Version]
- Aytekin, C.; Ni, X.; Cricri, F.; Aksu, E. Clustering and unsupervised anomaly detection with l 2 normalized deep auto-encoder representations. In Proceedings of the 2018 International Joint Conference on Neural Networks (IJCNN), Rio de Janeiro, Brazil, 8–13 July 2018; pp. 1–6. [Google Scholar]
- Papalexakis, E.E.; Beutel, A.; Steenkiste, P. Network anomaly detection using co-clustering. In Encyclopedia of Social Network Analysis and Mining; IEEE: New York, NY, USA, 2014; pp. 1054–1068. [Google Scholar]
- Ergen, T.; Kozat, S.S. Unsupervised anomaly detection with LSTM neural networks. IEEE Trans. Neural Netw. Learn. Syst. 2019, 31, 3127–3141. [Google Scholar] [CrossRef] [Green Version]
- Truong-Huu, T.; Dheenadhayalan, N.; Pratim Kundu, P.; Ramnath, V.; Liao, J.; Teo, S.G.; Praveen Kadiyala, S. An Empirical Study on Unsupervised Network Anomaly Detection using Generative Adversarial Networks. In Proceedings of the 1st ACM Workshop on Security and Privacy on Artificial Intelligence, Taipei Taiwan, 5 October 2020; pp. 20–29. [Google Scholar]
- Bertero, C.; Roy, M.; Sauvanaud, C.; Trédan, G. Experience report: Log mining using natural language processing and application to anomaly detection. In Proceedings of the 2017 IEEE 28th International Symposium on Software Reliability Engineering (ISSRE), Toulouse, France, 23–26 October 2017; pp. 351–360. [Google Scholar]
- Yu, J.; Reiter, E.; Hunter, J.; Mellish, C. Choosing the content of textual summaries of large time-series data sets. Nat. Lang. Eng. 2007, 13, 25. [Google Scholar] [CrossRef] [Green Version]
- Weston, J.; Ratle, F.; Mobahi, H.; Collobert, R. Deep learning via semi-supervised embedding. In Neural Networks: Tricks of the Trade; Springer: Berlin/Heidelberg, Germany, 2012; pp. 639–655. [Google Scholar]
- Lopez-Martin, M.; Carro, B.; Arribas, J.I.; Sanchez-Esguevillas, A. Network intrusion detection with a novel hierarchy of distances between embeddings of hash IP addresses. Knowl.-Based Syst. 2021, 219, 106887. [Google Scholar] [CrossRef]
- Yeh, C.K.; Wu, W.C.; Ko, W.J.; Wang, Y.C.F. Learning deep latent space for multi-label classification. In Proceedings of the AAAI Conference on Artificial Intelligence, San Francisco, CA, USA, 4–9 February 2017; Volume 31. [Google Scholar]
- Malhotra, P.; Vig, L.; Shroff, G.; Agarwal, P. Long short term memory networks for anomaly detection in time series. In Proceedings of the Presses universitaires de Louvain, Bruges, Belgium, 22–24 April 2015; p. 89. [Google Scholar]
- Yin, C.; Zhu, Y.; Fei, J.; He, X. A deep learning approach for intrusion detection using recurrent neural networks. IEEE Access 2017, 5, 21954–21961. [Google Scholar] [CrossRef]
- Fotiadou, K.; Velivassaki, T.H.; Voulkidis, A.; Skias, D.; De Santis, C.; Zahariadis, T. Proactive Critical Energy Infrastructure Protection via Deep Feature Learning. Energies 2020, 13, 2622. [Google Scholar] [CrossRef]
- Muhuri, P.S.; Chatterjee, P.; Yuan, X.; Roy, K.; Esterline, A. Using a Long Short-Term Memory Recurrent Neural Network (LSTM-RNN) to Classify Network Attacks. Information 2020, 11, 243. [Google Scholar] [CrossRef]
- Khan, M.A.; Karim, M.; Kim, Y. A scalable and hybrid intrusion detection system based on the convolutional-LSTM network. Symmetry 2019, 11, 583. [Google Scholar] [CrossRef] [Green Version]
- O’Shea, K.; Nash, R. An introduction to convolutional neural networks. arXiv 2015, arXiv:1511.08458. [Google Scholar]
- Krizhevsky, A.; Sutskever, I.; Hinton, G.E. Imagenet classification with deep convolutional neural networks. In Proceedings of the Advances in Neural Information Processing Systems, Lake Tahoe, NV, USA, 3–6 December 2012; pp. 1097–1105. [Google Scholar]
- Wang, J.; Yang, Y.; Mao, J.; Huang, Z.; Huang, C.; Xu, W. Cnn-rnn: A unified framework for multi-label image classification. In Proceedings of the IEEE Conference on Computer Vision and Pattern Recognition, Las Vegas, NV, USA, 27–30 June 2016; pp. 2285–2294. [Google Scholar]
- Shin, H.C.; Roth, H.R.; Gao, M.; Lu, L.; Xu, Z.; Nogues, I.; Yao, J.; Mollura, D.; Summers, R.M. Deep convolutional neural networks for computer-aided detection: CNN architectures, dataset characteristics and transfer learning. IEEE Trans. Med. Imaging 2016, 35, 1285–1298. [Google Scholar] [CrossRef] [Green Version]
- Kwon, D.; Natarajan, K.; Suh, S.C.; Kim, H.; Kim, J. An empirical study on network anomaly detection using convolutional neural networks. In Proceedings of the 2018 IEEE 38th International Conference on Distributed Computing Systems (ICDCS), Vienna, Austria, 2–6 July 2018; pp. 1595–1598. [Google Scholar]
- Naseer, S.; Saleem, Y.; Khalid, S.; Bashir, M.K.; Han, J.; Iqbal, M.M.; Han, K. Enhanced network anomaly detection based on deep neural networks. IEEE Access 2018, 6, 48231–48246. [Google Scholar] [CrossRef]
- Ma, C.; Du, X.; Cao, L. Analysis of multi-types of flow features based on hybrid neural network for improving network anomaly detection. IEEE Access 2019, 7, 148363–148380. [Google Scholar] [CrossRef]
- Eckle, K.; Schmidt-Hieber, J. A comparison of deep networks with ReLU activation function and linear spline-type methods. Neural Netw. 2019, 110, 232–242. [Google Scholar] [CrossRef]
- Fotiadou, K.; Velivassaki, T.H.; Voulkidis, A.; Railis, K.; Trakadas, P.; Zahariadis, T. Incidents Information Sharing Platform for Distributed Attack Detection. IEEE Open J. Commun. Soc. 2020, 1, 593–605. [Google Scholar] [CrossRef]
- Gharehchopogh, F.S.; Khalifelu, Z.A. Analysis and evaluation of unstructured data: Text mining versus natural language processing. In Proceedings of the 5th International Conference on Application of Information and Communication Technologies (AICT), Baku, Azerbaijan, 12–14 October 2011; pp. 1–4. [Google Scholar] [CrossRef]
- Liang, X.; Wang, X.; Lei, Z.; Liao, S.; Li, S.Z. Soft-margin softmax for deep classification. In International Conference on Neural Information Processing; Springer: Berlin/Heidelberg, Germany, 2017; pp. 413–421. [Google Scholar]
- Vogl, T.P.; Mangis, J.; Rigler, A.; Zink, W.; Alkon, D. Accelerating the convergence of the back-propagation method. Biol. Cybern. 1988, 59, 257–263. [Google Scholar] [CrossRef]
- Patel, K.C.; Sharma, D.P. A Review paper on pfsense—An Open source firewall introducing with different capabilities & customization. IJARIIE 2017, 3, 2395–4396. [Google Scholar]
- Suricata-Network Threat Detection Engine. Available online: https://suricata-ids.org/ (accessed on 18 May 2021).
- Hossin, M.; Sulaiman, M.N. A Review on Evaluation Metrics for Data Classification Evaluations. Int. J. Data Min. Knowl. Manag. Process. 2015, 5, 1–11. [Google Scholar] [CrossRef]
- Zhang, Z.; Sabuncu, M. Generalized cross entropy loss for training deep neural networks with noisy labels. In Proceedings of the Advances in Neural Information Processing Systems, Montreal, QC, USA, 3–8 December 2018; pp. 8778–8788. [Google Scholar]
- Sun, Y.; Kamel, M.S.; Wang, Y. Boosting for Learning Multiple Classes with Imbalanced Class Distribution. In Proceedings of the Sixth International Conference on Data Mining (ICDM’06), Hong Kong, China, 18–22 December 2006; pp. 592–602. [Google Scholar] [CrossRef] [Green Version]
- Chaudhary, A.; Kolhe, S.; Kamal, R. An improved random forest classifier for multi-class classification. Inf. Process. Agric. 2016, 3, 215–222. [Google Scholar] [CrossRef] [Green Version]
Figure 1.
Proposed network anomaly detection scheme on pfSense logs.

Figure 2.
High-level architecture of the proposed multi-class LSTM scheme on the Suricata pfSense logs.
Figure 2.
High-level architecture of the proposed multi-class LSTM scheme on the Suricata pfSense logs.

Figure 3.
High-level architecture of the proposed multi-class 1D-CNN scheme on Suricata pfSense logs.
Figure 3.
High-level architecture of the proposed multi-class 1D-CNN scheme on Suricata pfSense logs.

Figure 4.
Suricata line-based alert logs file.

Figure 5.
Characteristic logs that correspond to “alert” and “anomaly” <Event> types.

Figure 6.
<Event> Attribute Distribution.

Figure 7.
Multiclass LSTM Classification Accuracy and Model Loss Functions: We observe that both the classification accuracy and the loss functions during training/testing phase depict proper convergence rates after a small number of epochs, i.e., approximately after the 10th epoch, validating the robustness of the proposed LSTM scheme.

Figure 8.
Multiclass 1D-CNN Classification Accuracy and Model Loss Functions: As we may notice, both the classification accuracy and the loss functions during the training/testing phases depict proper convergence rates after a few number of epochs without presenting high variation among their accuracy/loss function scores.

Figure 9.
AUC-ROC Curve of the proposed Multiclass LSTM and 1D-CNN Architectures: In this figure we illustrate the AUC-ROC Curves for the 6-Eventy type category of the pfSense network logs. Comparing the proposed two schemes, we observe their high and robust performance towards the pfSense categories multi-class classification/anomaly detection problem.

Figure 10.
Confusion Matrices of the proposed 1D-CNN and LSTM Techniques: We observe that both techniques illustrate high detection rates of the correctly predicted classes, with the respect to their ground truth labels.
Figure 10.
Confusion Matrices of the proposed 1D-CNN and LSTM Techniques: We observe that both techniques illustrate high detection rates of the correctly predicted classes, with the respect to their ground truth labels.


Table 1.
Quantitative performance evaluation of the developed LSTM technique in terms of Precision, Recall and F-1 score metrics.
Table 1.
Quantitative performance evaluation of the developed LSTM technique in terms of Precision, Recall and F-1 score metrics.
| Method | Random Forest | DNN | Proposed 1D-CNN | Proposed LSTM | ||||||||
|---|---|---|---|---|---|---|---|---|---|---|---|---|
| Metrics | Precision | Recall | F-1 Score | Precision | Recall | F-1 Score | Precision | Recall | F-1 Score | Precision | Recall | F-1 Score |
| Alert | 0.7996 | 0.8298 | 0.8844 | 0.8266 | 0.6687 | 0.7393 | 0.9862 | 0.9473 | 0.9663 | 0.9836 | 0.9492 | 0.9661 |
| Anomaly | 0.9908 | 0.8319 | 0.8154 | 0.7240 | 0.75087 | 0.7372 | 0.9168 | 0.9869 | 0.9506 | 0.9179 | 0.9751 | 0.9456 |
| DNS | 0.8400 | 0.9449 | 0.9673 | 0.9255 | 0.9113 | 0.9184 | 0.9980 | 0.9943 | 0.9961 | 0.9944 | 0.9979 | 0.9961 |
| HTTP | 0.9855 | 0.8772 | 0.8582 | 0.8026 | 0.6405 | 0.7124 | 0.9943 | 0.9980 | 0.9961 | 0.9454 | 0.9458 | 0.9456 |
| SNMP | 0.8971 | 0.9965 | 0.9910 | 0.9305 | 0.9830 | 0.9560 | 0.9994 | 0.9996 | 0.9995 | 0.9995 | 0.9996 | 0.9995 |
| TLS | 0.9316 | 0.9878 | 0.9646 | 0.7378 | 0.9710 | 0.8385 | 0.9995 | 0.9680 | 0.9835 | 0.9991 | 0.9682 | 0.9834 |
Publisher’s Note: MDPI stays neutral with regard to jurisdictional claims in published maps and institutional affiliations. |
© 2021 by the authors. Licensee MDPI, Basel, Switzerland. This article is an open access article distributed under the terms and conditions of the Creative Commons Attribution (CC BY) license (https://creativecommons.org/licenses/by/4.0/).
Share and Cite
MDPI and ACS Style
Fotiadou, K.; Velivassaki, T.-H.; Voulkidis, A.; Skias, D.; Tsekeridou, S.; Zahariadis, T. Network Traffic Anomaly Detection via Deep Learning. Information 2021, 12, 215. https://doi.org/10.3390/info12050215
AMA Style
Fotiadou K, Velivassaki T-H, Voulkidis A, Skias D, Tsekeridou S, Zahariadis T. Network Traffic Anomaly Detection via Deep Learning. Information. 2021; 12(5):215. https://doi.org/10.3390/info12050215
Chicago/Turabian StyleFotiadou, Konstantina, Terpsichori-Helen Velivassaki, Artemis Voulkidis, Dimitrios Skias, Sofia Tsekeridou, and Theodore Zahariadis. 2021. "Network Traffic Anomaly Detection via Deep Learning" Information 12, no. 5: 215. https://doi.org/10.3390/info12050215
Note that from the first issue of 2016, this journal uses article numbers instead of page numbers. See further details here.