
Sarcopenia, Obesity, and Sarcopenic Obesity: Relationship with Skeletal Muscle Phenotypes and Single Nucleotide Polymorphisms

 ,
,  , , ,
, , ,  , , and
Abstract
:1. Introduction
2. Methodology
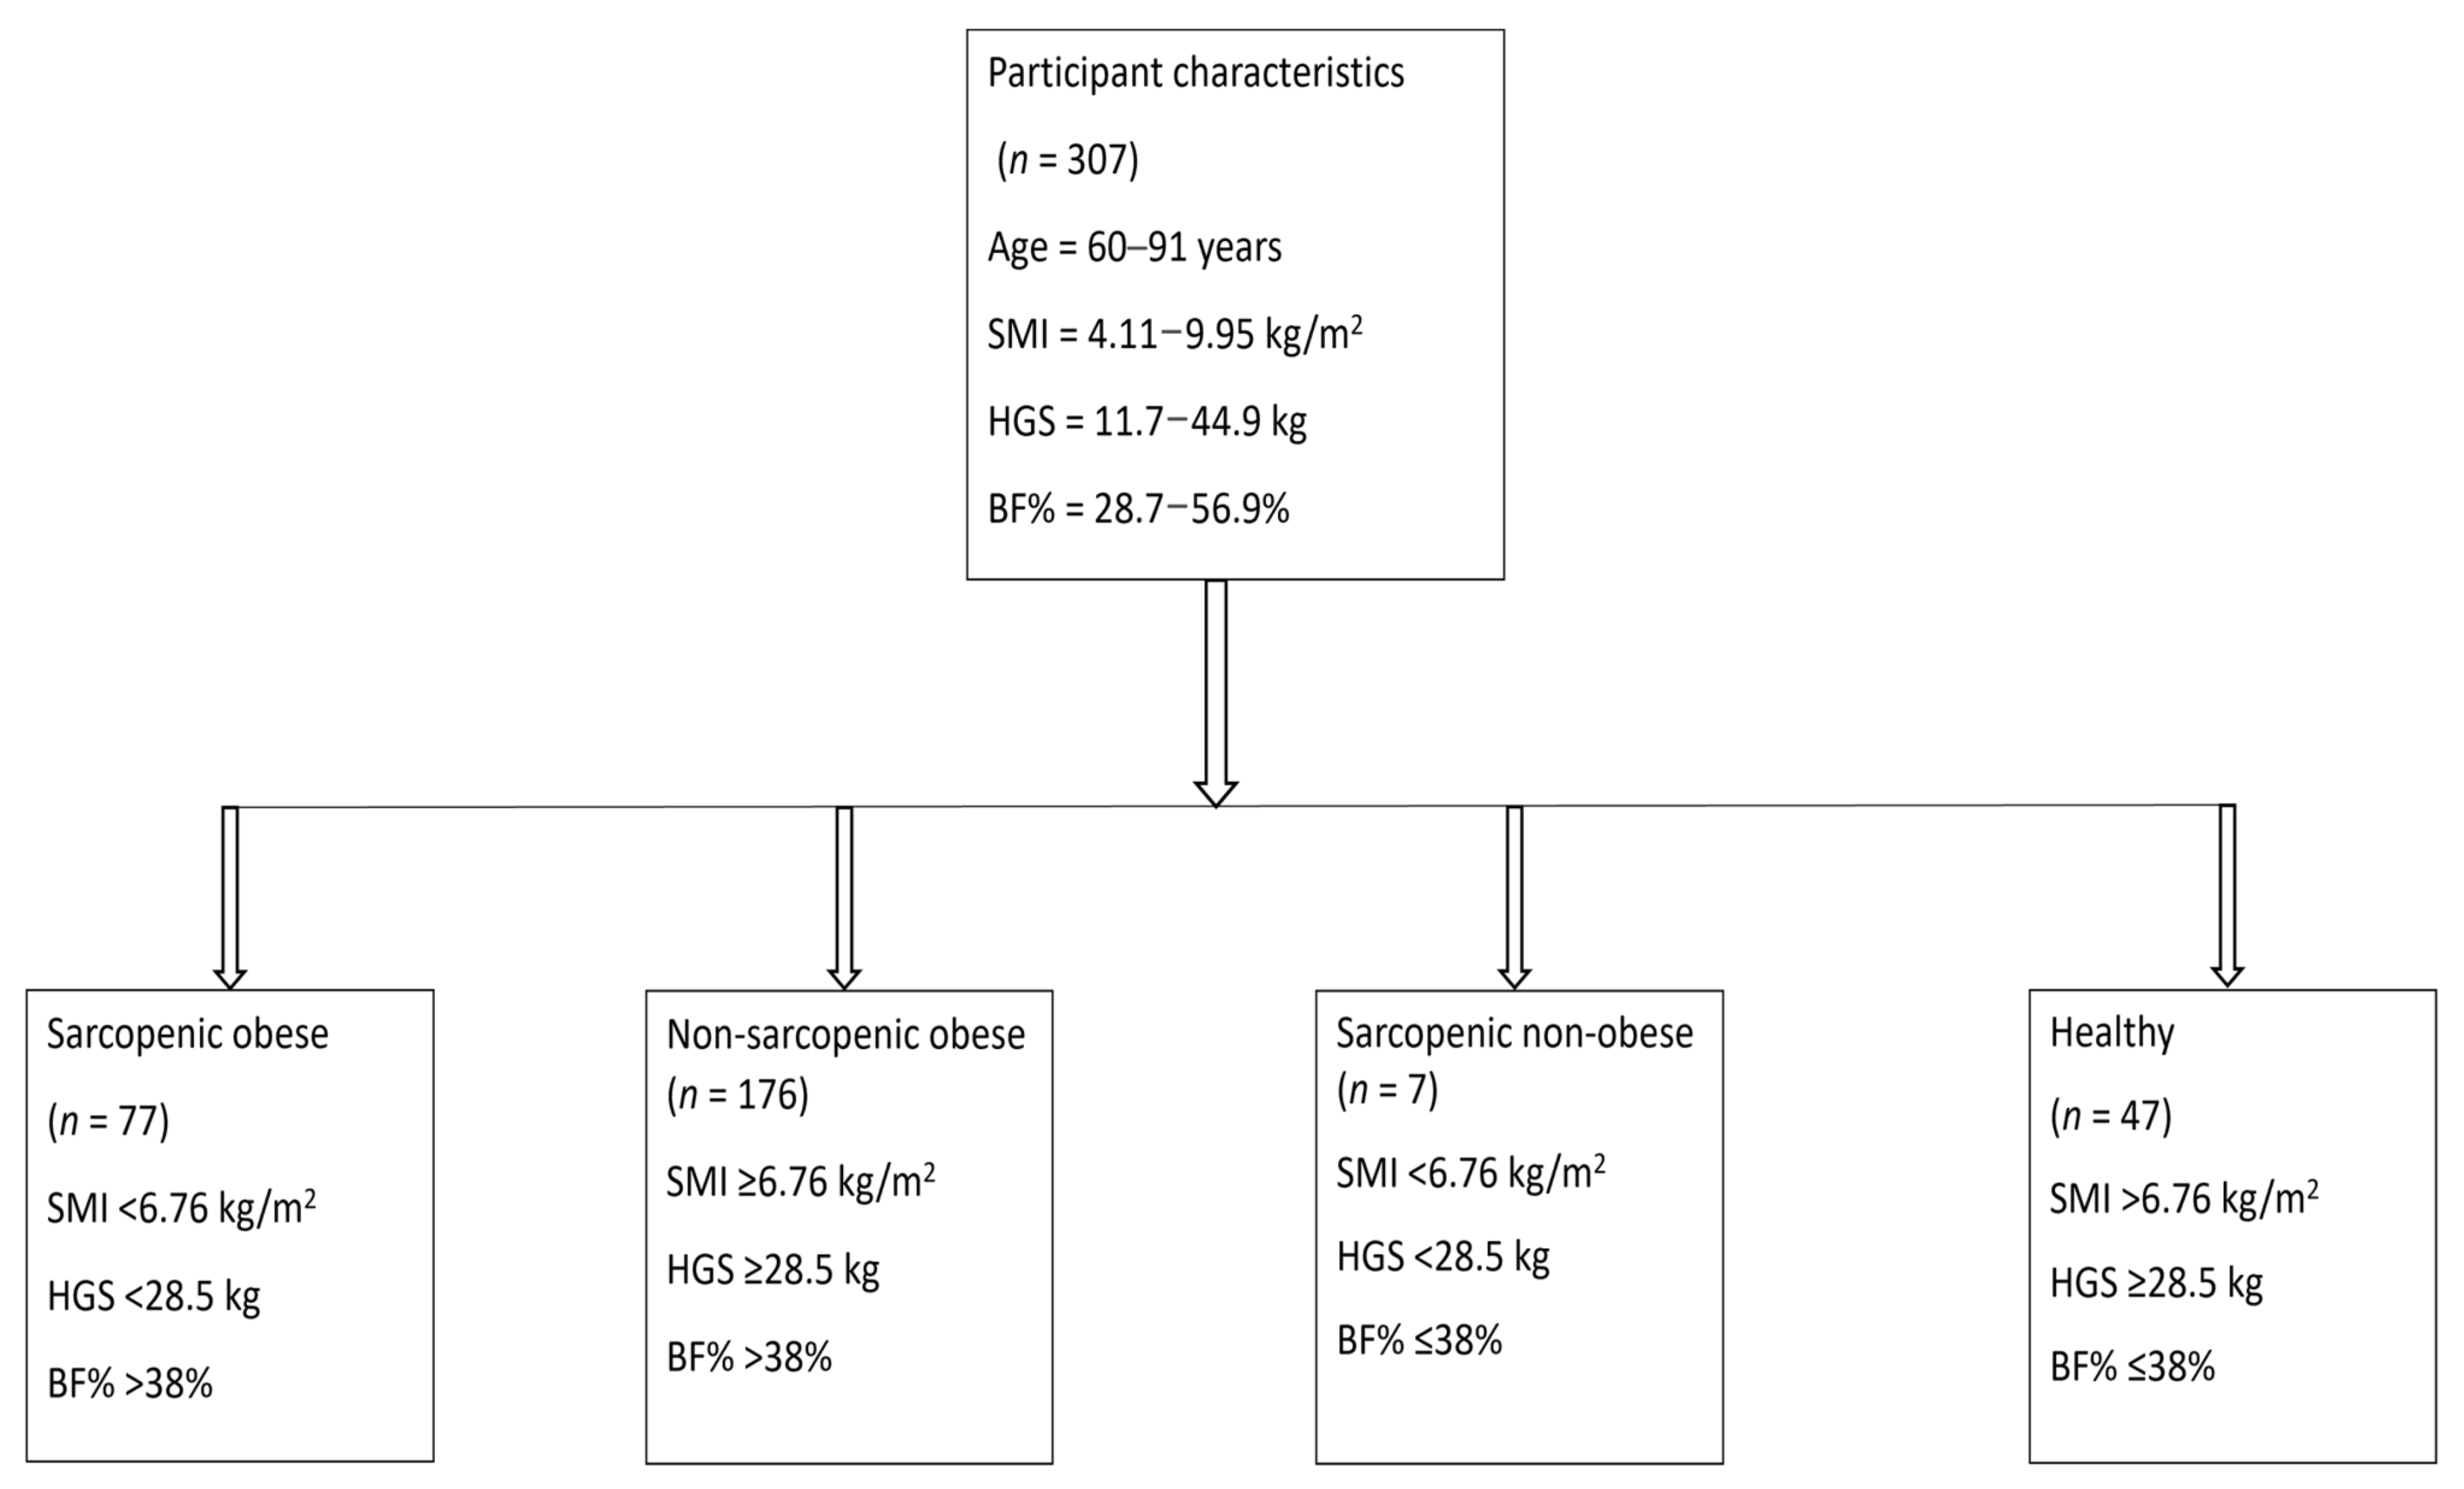
2.1. Participants
2.2. Procedures
2.3. Body Composition and Muscle Size
2.4. Muscle Strength and Quality Measurement
2.5. One-Leg Standing-Balance Test
2.6. Selection of Single-nucleotide Polymorphisms, Sample Collection, DNA Extraction and Genotyping
3. Statistics
4. Results
4.1. General Characteristics, Prevalence, and Differences in Muscle Size, Strength, and Quality among Groups
4.2. Associations of Gene Variants with Sarcopenia in Obese Elderly Women
5. Discussion
6. Conclusions
Supplementary Materials
Author Contributions
Funding
Institutional Review Board Statement
Informed Consent Statement
Data Availability Statement
Conflicts of Interest
References
- Michalakis, K.; Goulis, D.; Vazaiou, A.; Mintziori, G.; Polymeris, A.; Abrahamian-Michalakis, A. Obesity in the ageing man. Metabolism 2013, 62, 1341–1349. [Google Scholar] [CrossRef]
- Nilwik, R.; Snijders, T.; Leenders, M.; Groen, B.B.; van Kranenburg, J.; Verdijk, L.; van Loon, L.J. The decline in skeletal muscle mass with aging is mainly attributed to a reduction in type II muscle fiber size. Exp. Gerontol. 2013, 48, 492–498. [Google Scholar] [CrossRef] [PubMed]
- Baumgartner, R.N.; Wayne, S.J.; Waters, D.L.; Janssen, I.; Gallagher, D.; Morley, J.E. Sarcopenic Obesity Predicts Instrumental Activities of Daily Living Disability in the Elderly. Obes. Res. 2004, 12, 1995–2004. [Google Scholar] [CrossRef] [PubMed]
- Zamboni, M.; Mazzali, G.; Fantin, F.; Rossi, A.; Di Francesco, V. Sarcopenic obesity: A new category of obesity in the elderly. Nutr. Metab. Cardiovasc. Dis. 2008, 18, 388–395. [Google Scholar] [CrossRef]
- Chung, J.-Y.; Kang, H.-T.; Lee, D.C.; Lee, H.-R.; Lee, Y.-J. Body composition and its association with cardiometabolic risk factors in the elderly: A focus on sarcopenic obesity. Arch. Gerontol. Geriatr. 2013, 56, 270–278. [Google Scholar] [CrossRef] [PubMed]
- Choi, K.M. Sarcopenia and sarcopenic obesity. Korean J. Intern. Med. 2016, 31, 1054. [Google Scholar] [CrossRef] [Green Version]
- Wannamethee, S.G.; Atkins, J.L. Muscle loss and obesity: The health implications of sarcopenia and sarcopenic obesity. Proc. Nutr. Soc. 2015, 74, 405–412. [Google Scholar] [CrossRef]
- Kohara, K. Sarcopenic obesity in aging population: Current status and future directions for research. Endocrine 2014, 45, 15–25. [Google Scholar] [CrossRef]
- Atkins, J.L.; Whincup, P.; Morris, R.; Lennon, L.; Papacosta, O.; Wannamethee, S. Sarcopenic Obesity and Risk of Cardiovascular Disease and Mortality: A Population-Based Cohort Study of Older Men. J. Am. Geriatr. Soc. 2014, 62, 253–260. [Google Scholar] [CrossRef] [Green Version]
- Chang, C.-I.; Huang, K.-C.; Chan, D.-C.; Wu, C.-H.; Lin, C.-C.; Hsiung, C.A.; Hsu, C.-C.; Chen, C.-Y. The impacts of sarcopenia and obesity on physical performance in the elderly. Obes. Res. Clin. Pract. 2015, 9, 256–265. [Google Scholar] [CrossRef]
- Batsis, J.A.; Barre, L.K.; Mackenzie, T.A.; Pratt, S.I.; Lopez-Jimenez, F.; Bartels, S.J. Variation in the Prevalence of Sarcopenia and Sarcopenic Obesity in Older Adults Associated with Different Research Definitions: Dual-Energy X-ray Absorptiometry Data from the National Health and Nutrition Examination Survey 1999–2004. J. Am. Geriatr. Soc. 2013, 61, 974–980. [Google Scholar] [CrossRef]
- Prado, C.; Wells, J.; Smith, S.; Stephan, B.; Siervo, M. Sarcopenic obesity: A Critical appraisal of the current evidence. Clin. Nutr. 2012, 31, 583–601. [Google Scholar] [CrossRef] [PubMed]
- Cruz-Jentoft, A.J.; Bahat, G.; Bauer, J.; Boirie, Y.; Bruyère, O.; Cederholm, T.; Cooper, C.; Landi, F.; Rolland, Y.; Sayer, A.A.; et al. Sarcopenia: Revised European consensus on definition and diagnosis. Age Ageing 2019, 48, 16–31. [Google Scholar] [CrossRef] [PubMed] [Green Version]
- Öztürk, Z.A.; Türkbeyler, İ.H.; Abiyev, A.; Kul, S.; Edizer, B.; Yakaryılmaz, F.D.; Soylu, G. Health-related quality of life and fall risk associated with age-related body composition changes; sarcopenia, obesity and sarcopenic obesity. Intern. Med. J. 2018, 48, 973–981. [Google Scholar] [CrossRef]
- Yoshimura, Y.; Wakabayashi, H.; Nagano, F.; Bise, T.; Shimazu, S.; Kudo, M.; Shiraishi, A. Sarcopenic Obesity Is Associated With Activities of Daily Living and Home Discharge in Post-Acute Rehabilitation. J. Am. Med. Dir. Assoc. 2020, 21, 1475–1480. [Google Scholar] [CrossRef] [PubMed]
- Aibar-Almazán, A.; Martínez-Amat, A.; Díaz, D.C.; García, J.D.J.; Achalandabaso, A.; Sánchez-Montesinos, I.; de la Torre-Cruz, M.; Hita-Contreras, F. Sarcopenia and sarcopenic obesity in Spanish community-dwelling middle-aged and older women: Association with balance confidence, fear of falling and fall risk. Maturitas 2018, 107, 26–32. [Google Scholar] [CrossRef]
- Huo, Y.R.; Suriyaarachchi, P.; Gomez, F.; Curcio, C.-L.; Boersma, D.; Gunawardene, P.; Demontiero, O.; Duque, G. Phenotype of sarcopenic obesity in older individuals with a history of falling. Arch. Gerontol. Geriatr. 2016, 65, 255–259. [Google Scholar] [CrossRef]
- Rolland, Y.; Lauwers-Cances, V.; Cristini, C.; van Kan, G.A.; Janssen, I.; Morley, J.E.; Vellas, B. Difficulties with physical function associated with obesity, sarcopenia, and sarcopenic-obesity in community-dwelling elderly women: The EPIDOS (EPIDemiologie de l’OSteoporose) Study. Am. J. Clin. Nutr. 2009, 89, 1895–1900. [Google Scholar] [CrossRef]
- Bouchard, D.R.; Dionne, I.J.; Brochu, M. Sarcopenic/obesity and physical capacity in older men and women: Data from the Nutrition as a Determinant of Successful Aging (NuAge)—The Quebec Longitudinal Study. Obesity 2009, 17, 2082–2088. [Google Scholar] [CrossRef]
- Zoico, E.; Di Francesco, V.; Guralnik, J.M.; Mazzali, G.; Bortolani, A.; Guariento, S.; Sergi, G.; Bosello, O.; Zamboni, M. Physical disability and muscular strength in relation to obesity and different body composition indexes in a sample of healthy elderly women. Int. J. Obes. 2004, 28, 234–241. [Google Scholar] [CrossRef] [Green Version]
- Scott, D.; Sanders, K.; Aitken, D.; Hayes, A.; Ebeling, P.R.; Jones, G. Sarcopenic obesity and dynapenic obesity: 5-year associations with falls risk in middle-aged and older adults. Obesity 2014, 22, 1568–1574. [Google Scholar] [CrossRef] [PubMed]
- Kuk, J.L.; Saunders, T.; Davidson, L.; Ross, R. Age-related changes in total and regional fat distribution. Ageing Res. Rev. 2009, 8, 339–348. [Google Scholar] [CrossRef]
- Atmis, V.; Yalcin, A.; Silay, K.; Ulutas, S.; Bahşi, R.; Turgut, T.; Sürmeli, D.M.; Öztorun, H.S.; Yaman, S.; Çoşarderelioğlu, Ç.; et al. The relationship between all-cause mortality sarcopenia and sarcopenic obesity among hospitalized older people. Aging Clin. Exp. Res. 2019, 31, 1563–1572. [Google Scholar] [CrossRef]
- Kemmler, W.; Teschler, M.; Weißenfels, A.; Sieber, C.; Freiberger, E.; von Stengel, S. Prevalence of sarcopenia and sarcopenic obesity in older German men using recognized definitions: High accordance but low overlap! Osteoporos. Int. 2017, 28, 1881–1891. [Google Scholar] [CrossRef] [PubMed]
- Lee, J.; Hong, Y.-P.; Shin, H.J.; Lee, W. Associations of Sarcopenia and Sarcopenic Obesity with Metabolic Syndrome Considering Both Muscle Mass and Muscle Strength. J. Prev. Med. Public Health 2016, 49, 35–44. [Google Scholar] [CrossRef]
- Moreira, M.A.; Zunzunegui, M.V.; Vafaei, A.; Da Câmara, S.M.A.; Oliveira, T.S.; Maciel, C.C. Sarcopenic obesity and physical performance in middle aged women: A cross-sectional study in Northeast Brazil. BMC Public Health 2015, 16, 43. [Google Scholar] [CrossRef] [Green Version]
- Oliveira, R.J.; Bottaro, M.; Júnior, J.T.; Farinatti, P.T.V.; Bezerra, L.A.; Lima, R.M. Identification of sarcopenic obesity in postmenopausal women: A cutoff proposal. Braz. J. Med. Biol. Res. 2011, 44, 1171–1176. [Google Scholar] [CrossRef]
- Batsis, J.; Mackenzie, T.A.; Barre, L.K.; Lopez-Jimenez, F.; Bartels, S.J. Sarcopenia, sarcopenic obesity and mortality in older adults: Results from the National Health and Nutrition Examination Survey III. Eur. J. Clin. Nutr. 2014, 68, 1001–1007. [Google Scholar] [CrossRef] [PubMed] [Green Version]
- Hairi, N.N.; Cumming, R.; Naganathan, V.; Handelsman, D.J.; Le Couteur, D.; Creasey, H.; Waite, L.M.; Seibel, M.J.; Sambrook, P.N. Loss of Muscle Strength, Mass (Sarcopenia), and Quality (Specific Force) and Its Relationship with Functional Limitation and Physical Disability: The Concord Health and Ageing in Men Project. J. Am. Geriatr. Soc. 2010, 58, 2055–2062. [Google Scholar] [CrossRef]
- Lauretani, F.; Russo, C.R.; Bandinelli, S.; Bartali, B.; Cavazzini, C.; Di Iorio, A.; Corsi, A.M.; Rantanen, T.; Guralnik, J.M.; Ferrucci, L. Age-associated changes in skeletal muscles and their effect on mobility: An operational diagnosis of sarcopenia. J. Appl. Physiol. 2003, 95, 1851–1860. [Google Scholar] [CrossRef]
- Tomlinson, D.J.; Erskine, R.; Winwood, K.; Morse, C.; Onambélé, G.L. The impact of obesity on skeletal muscle architecture in untrained young vs. old women. J. Anat. 2014, 225, 675–684. [Google Scholar] [CrossRef] [PubMed]
- Tomlinson, D.J.; Erskine, R.; Morse, C.; Winwood, K.; Onambélé-Pearson, G. The impact of obesity on skeletal muscle strength and structure through adolescence to old age. Biogerontology 2016, 17, 467–483. [Google Scholar] [CrossRef] [PubMed] [Green Version]
- Rondanelli, M.; Klersy, C.; Terracol, G.; Talluri, J.; Maugeri, R.; Guido, D.; A Faliva, M.; Solerte, B.S.; Fioravanti, M.; Lukaski, H.; et al. Whey protein, amino acids, and vitamin D supplementation with physical activity increases fat-free mass and strength, functionality, and quality of life and decreases inflammation in sarcopenic elderly. Am. J. Clin. Nutr. 2016, 103, 830–840. [Google Scholar] [CrossRef] [PubMed]
- Fawcett, K.A.; Barroso, I. The genetics of obesity: FTO leads the way. Trends Genet. 2010, 26, 266–274. [Google Scholar] [CrossRef] [Green Version]
- Santos, D.; Silva, A.; Baptista, F.; Santos, R.; Vale, S.; Mota, J.; Sardinha, L.B. Sedentary behavior and physical activity are independently related to functional fitness in older adults. Exp. Gerontol. 2012, 47, 908–912. [Google Scholar] [CrossRef] [PubMed]
- Walsh, S.; Liu, D.; Metter, E.J.; Ferrucci, L.; Roth, S.M. ACTN3 genotype is associated with muscle phenotypes in women across the adult age span. J. Appl. Physiol. 2008, 105, 1486–1491. [Google Scholar] [CrossRef] [PubMed]
- Charbonneau, D.E.; Hanson, E.D.; Ludlow, A.T.; Delmonico, M.J.; Hurley, B.F.; Roth, S.M. ACE Genotype and the Muscle Hypertrophic and Strength Responses to Strength Training. Med. Sci. Sports Exerc. 2008, 40, 677–683. [Google Scholar] [CrossRef] [Green Version]
- Khanal, P.; He, L.; Stebbings, G.; Onambele-Pearson, G.L.; Degens, H.; Williams, A.; Thomis, M.; Morse, C.I. Prevalence and association of single nucleotide polymorphisms with sarcopenia in older women depends on definition. Sci. Rep. 2020, 10, 1–9. [Google Scholar] [CrossRef] [Green Version]
- Galbete, C.; Toledo, J.; Martínez-González, M.; Martínez, J.A.; Guillén-Grima, F.; Marti, A. Lifestyle factors modify obesity risk linked to PPARG2 and FTO variants in an elderly population: A cross-sectional analysis in the SUN Project. Genes Nutr. 2013, 8, 61–67. [Google Scholar] [CrossRef] [Green Version]
- Landi, F.; Cruz-Jentoft, A.J.; Liperoti, R.; Russo, A.; Giovannini, S.; Tosato, M.; Capoluongo, E.D.; Bernabei, R.; Onder, G. Sarcopenia and mortality risk in frail older persons aged 80 years and older: Results from ilSIRENTE study. Age Ageing 2013, 42, 203–209. [Google Scholar] [CrossRef] [Green Version]
- De Stefano, F.; Zambon, S.; Giacometti, L.; Sergi, G.; Corti, M.C.; Manzato, E.; Busetto, L. Obesity, muscular strength, muscle composition and physical performance in an elderly population. J. Nutr. Health Aging 2015, 19, 785–791. [Google Scholar] [CrossRef] [PubMed]
- Khanal, P.; He, L.; Degens, H.; Stebbings, G.K.; Onambele-Pearson, G.L.; Williams, A.G.; Thomis, M.; Morse, C.I. Dietary protein requirement threshold and micronutrients profile in healthy older women based on relative skeletal muscle mass. Nutrients 2021, 13, 3076. [Google Scholar] [CrossRef] [PubMed]
- Janssen, I.; Heymsfield, S.B.; Baumgartner, R.N.; Ross, R. Estimation of skeletal muscle mass by bioelectrical impedance analysis. J. Appl. Physiol. 2000, 89, 465–471. [Google Scholar] [CrossRef] [PubMed] [Green Version]
- Kanehisa, H.; Ito, M.; Kawakami, Y.; Fukunaga, T.; Miyatani, M. The accuracy of volume estimates using ultrasound muscle thickness measurements in different muscle groups. Eur. J. Appl. Physiol. 2004, 91, 264–272. [Google Scholar] [CrossRef] [PubMed]
- Ogasawara, R.; Thiebaud, R.S.; Loenneke, J.P.; Loftin, M.; Abe, T. Time course for arm and chest muscle thickness changes following bench press training. Interv. Med. Appl. Sci. 2012, 4, 217–220. [Google Scholar] [CrossRef]
- Reeves, N.D.; Maganaris, C.N.; Narici, M.V. Ultrasonographic assessment of human skeletal muscle size. Eur. J. Appl. Physiol. 2004, 91, 116–118. [Google Scholar] [CrossRef]
- Villafañe, J.H.; Valdes, K.; Buraschi, R.; Martinelli, M.; Bissolotti, L.; Negrini, S. Reliability of the Handgrip Strength Test in Elderly Subjects with Parkinson Disease. HAND 2016, 11, 54–58. [Google Scholar] [CrossRef] [Green Version]
- Gerbino, G.; Griffin, E.D.; Zurakowski, D. Comparison of standing balance between female collegiate dancers and soccer players. Gait Posture 2007, 26, 501–507. [Google Scholar] [CrossRef]
- Gajdosik, R.L. Relation of age and passive properties of an ankle dorsiflexion stretch to the timed one-leg stance test in older women. Percept. Mot. Skills 2006, 103, 177–182. [Google Scholar] [CrossRef]
- Bohannon, R.W.; Larkin, P.A.; Cook, A.C.; Gear, J.; Singer, J. Decrease in Timed Balance Test Scores with Aging. Phys. Ther. 1984, 64, 1067–1070. [Google Scholar] [CrossRef]
- Janssen, I.; Baumgartner, R.N.; Ross, R.; Rosenberg, I.H.; Roubenoff, R. Skeletal Muscle Cutpoints Associated with Elevated Physical Disability Risk in Older Men and Women. Am. J. Epidemiol. 2004, 159, 413–421. [Google Scholar] [CrossRef] [PubMed]
- Cruz-Jentoft, A.J.; Baeyens, J.P.; Bauer, J.M.; Boirie, Y.; Cederholm, T.; Landi, F.; Martin, F.C.; Michel, J.; Rolland, Y.; Schneider, S.M.; et al. Sarcopenia: European consensus on definition and diagnosisReport of the European Working Group on Sarcopenia in Older People. Age Ageing 2010, 39, 412–423. [Google Scholar] [CrossRef] [Green Version]
- Michikawa, T.; Nishiwaki, Y.; Takebayashi, T.; Toyama, Y. One-leg standing test for elderly populations. J. Orthop. Sci. 2009, 14, 675–685. [Google Scholar] [CrossRef] [PubMed]
- Monteiro, M.; Gabriel, R.; Aranha, J.; E Castro, M.N.; Sousa, M.; Moreira, H. Influence of obesity and sarcopenic obesity on plantar pressure of postmenopausal women. Clin. Biomech. 2010, 25, 461–467. [Google Scholar] [CrossRef]
- Stebbings, G.K.; Williams, A.G.; Morse, C.I.; Day, S.H. Polymorphisms in PTK2 are associated with skeletal muscle specific force: An independent replication study. Eur. J. Appl. Physiol. 2017, 117, 713–720. [Google Scholar] [CrossRef] [PubMed] [Green Version]
- Lim, H.-S.; Park, Y.-H.; Suh, K.; Yoo, M.H.; Park, H.K.; Kim, H.J.; Lee, J.-H.; Byun, D.-W. Association between Sarcopenia, Sarcopenic Obesity, and Chronic Disease in Korean Elderly. J. Bone Metab. 2018, 25, 187–193. [Google Scholar] [CrossRef]
- Oh, C.; Jho, S.; No, J.-K.; Kim, H.-S. Body composition changes were related to nutrient intakes in elderly men but elderly women had a higher prevalence of sarcopenic obesity in a population of Korean adults. Nutr. Res. 2015, 35, 1–6. [Google Scholar] [CrossRef]
- Liu, L.-K.; Chen, L.-Y.; Yeh, K.-P.; Lin, M.-H.; Hwang, A.-C.; Peng, L.-N. Sarcopenia, but not sarcopenic obesity, predicts mortality for older old men: A 3-year prospective cohort study. J. Clin. Gerontol. Geriatr. 2014, 5, 42–46. [Google Scholar] [CrossRef] [Green Version]
- Mitchell, W.K.; Williams, J.; Atherton, P.J.; Larvin, M.; Lund, J.N.; Narici, M. Sarcopenia, Dynapenia, and the Impact of Advancing Age on Human Skeletal Muscle Size and Strength; a Quantitative Review. Front. Physiol. 2012, 3, 260. [Google Scholar] [CrossRef] [Green Version]
- de Bool, C.; Gosker, H.R.; den Borst, B.; den Kamp, C.M.O.; Slot, I.G.M.; Schols, A.M.W.J. Muscle quality is more impaired in sarcopenic patients with chronic obstructive pulmonary disease. J. Am. Med. Dir. Assoc. 2016, 17, 415–420. [Google Scholar] [CrossRef]
- Abdelmoula, A.; Martin, V.; Bouchant, A.; Walrand, S.; Lavet, C.; Taillardat, M.; Maffiuletti, N.A.; Boisseau, N.; Duché, P.; Ratel, S. Knee extension strength in obese and nonobese male adolescents. Appl. Physiol. Nutr. Metab. 2012, 37, 269–275. [Google Scholar] [CrossRef] [PubMed]
- Barbat-Artigas, S.; Rolland, Y.; Vellas, B.; Aubertin-Leheudre, M. Muscle Quantity Is Not Synonymous with Muscle Quality. J. Am. Med. Dir. Assoc. 2013, 14, 852.e1–852.e7. [Google Scholar] [CrossRef] [PubMed]
- Lee, C.; Dierickx, E. Defining Sarcopenia Using Muscle Quality Index. J. Aging Res. Clin. Pract. 2018, 7, 45–59. [Google Scholar]
- Tallis, J.; Shelley, S.; Degens, H.; Hill, C. Age-Related Skeletal Muscle Dysfunction Is Aggravated by Obesity: An Investigation of Contractile Function, Implications and Treatment. Biomolecules 2021, 11, 372. [Google Scholar] [CrossRef] [PubMed]
- AhmadiAhangar, A.; Javadian, Y.; Babaei, M.; Heidari, B.; Hosseini, S.; Aminzadeh, M. The role of quadriceps muscle strength in the development of falls in the elderly people, a cross-sectional study. Chiropr. Man. Ther. 2018, 26, 1–6. [Google Scholar] [CrossRef] [Green Version]
- Den Ouden, M.E.; Schuurmans, M.J.; Brand, J.S.; Arts, I.E.; Mueller-Schotte, S.; van der Schouw, Y.T. Physical functioning is related to both an impaired physical ability and ADL disability: A ten year follow-up study in middle-aged and older persons. Maturitas 2013, 74, 89–94. [Google Scholar] [CrossRef] [PubMed]
- Roth, S.M.; Zmuda, J.M.; Cauley, J.A.; Shea, P.R.; Ferrell, R.E. Vitamin D receptor genotype is associated with fat-free mass and sarcopenia in elderly men. J. Gerontol. Ser. A Boil. Sci. Med. Sci. 2004, 59, B10–B15. [Google Scholar] [CrossRef] [Green Version]
- Tasar, T. Retrospective Investigation of Interleukin 1 and 6 Gene Polymorphism among Elderly Patients with Sarcopenia in the Turkish Population. Genet. Mol. Res. 2018, 17, gmr16039881. [Google Scholar] [CrossRef] [Green Version]
- Romero-Blanco, C.; González, M.J.A.; Gómez-Cabello, A.; Vila-Maldonado, S.; Casajús, J.A.; Ara, I.; Aznar, S. ACTN3 R577X polymorphism related to sarcopenia and physical fitness in active older women. Climacteric 2020, 24, 89–94. [Google Scholar] [CrossRef]
- Cho, J.; Lee, I.; Kang, H. ACTN3 Gene and Susceptibility to Sarcopenia and Osteoporotic Status in Older Korean Adults. BioMed Res. Int. 2017, 2017, 1–8. [Google Scholar] [CrossRef] [PubMed]
- Garatachea, N.; Lucia, A. Genes and the ageing muscle: A review on genetic association studies. Age 2013, 35, 207–233. [Google Scholar] [CrossRef] [PubMed] [Green Version]
- Chen, W.; Zhang, B.; Li, Y.; Liang, T. Association Between rs1815739 Polymorphism of ACTN3 Gene and Athletic Ability in Chinese Sprinters. J. Sci. Sport Exerc. 2020, 2, 113–119. [Google Scholar] [CrossRef] [Green Version]
- Kikuchi, N.; Nakazato, K.; Min, S.-K.; Ueda, D.; Igawa, S. The ACTN3 R577X Polymorphism Is Associated With Muscle Power in Male Japanese Athletes. J. Strength Cond. Res. 2014, 28, 1783–1789. [Google Scholar] [CrossRef] [PubMed]
- Lima, R.M.; Leite, T.K.M.; Pereira, R.W.; Rabelo, H.T.; Roth, S.M.; Oliveira, R.J. ACE and ACTN3 genotypes in older women: Muscular phenotypes. Int. J. Sports Med. 2011, 32, 66. [Google Scholar] [CrossRef]
- Delmonico, M.J.; Kostek, M.C.; Doldo, N.A.; Hand, B.D.; Walsh, S.; Conway, J.M.; Carignan, C.R.; Roth, S.; Hurley, B.F. Alpha-Actinin-3 (ACTN3) R577X Polymorphism Influences Knee Extensor Peak Power Response to Strength Training in Older Men and Women. J. Gerontol. Ser. A Boil. Sci. Med. Sci. 2007, 62, 206–212. [Google Scholar] [CrossRef] [Green Version]
- North, K.N.; Yang, N.; Wattanasirichaigoon, D.; Mills, M.; Easteal, S.; Beggs, A. A common nonsense mutation results in α-actinin-3 deficiency in the general population. Nat. Genet. 1999, 21, 353–354. [Google Scholar] [CrossRef]
- Houweling, P.J.; Papadimitriou, I.D.; Seto, J.T.; Pérez, L.M.; del Coso, J.; North, K.N.; Lucia, A.; Eynon, N. Is evolutionary loss our gain? The role of ACTN3 Arg577Ter (R577X) genotype in athletic performance, ageing, and disease. Hum. Mutat. 2018, 39, 1774–1787. [Google Scholar] [CrossRef]
- Fiuza-Luces, C.; Ruiz, J.R.; Rodríguez-Romo, G.; Santiago, C.; Gómez-Gallego, F.; Yvert, T.; Cano-Nieto, A.; Garatachea, N.; Morán, M.; Lucia, A. Are ‘endurance’alleles ‘survival’alleles? Insights from the ACTN3 R577X polymorphism. PLoS ONE 2011, 6, e17558. [Google Scholar] [CrossRef]
- MacArthur, D.G.; Seto, J.T.; Chan, S.; Quinlan, K.G.R.; Raftery, J.M.; Turner, N.; Nicholson, M.D.; Kee, A.J.; Hardeman, E.C.; Gunning, P.W. An Actn3 knockout mouse provides mechanistic insights into the association between α-actinin-3 deficiency and human athletic performance. Hum. Mol. Genet. 2008, 17, 1076–1086. [Google Scholar] [CrossRef] [Green Version]
- García-Giménez, J.; Sanchis-Gomar, F.; Lippi, G.; Mena, S.; Ivars, D.; Gomez-Cabrera, M.C.; Viña, J.; Pallardó, F. Epigenetic biomarkers: A new perspective in laboratory diagnostics. Clin. Chim. Acta 2012, 413, 1576–1582. [Google Scholar] [CrossRef]
- Moraes, A.C.F.; Fernández-Alvira, J.M.; Carvalho, H.B.; Meirhaeghe, A.; Dallongeville, J.; Kafatos, A.; Marcos, A.; Molnar, D.; Manios, Y.; Ruiz, J.R.; et al. Physical activity modifies the associations between genetic variants and blood pressure in European adolescents. J. Pediatr. 2014, 165, 1046–1049.e2. [Google Scholar] [CrossRef]
- Zarebska, A.; Ahmetov, I.; Sawczyn, S.; Weiner, A.S.; Kaczmarczyk, M.; Ficek, K.; Maciejewska-Karlowska, A.; Sawczuk, M.; Leonska-Duniec, A.; Klocek, T.; et al. Association of the MTHFR 1298A > C (rs1801131) polymorphism with speed and strength sports in Russian and Polish athletes. J. Sports Sci. 2013, 32, 375–382. [Google Scholar] [CrossRef] [PubMed]
- Castro, R.; Rivera, I.; Ravasco, P.; E Camilo, M.; Jakobs, C.; Blom, H.; De Almeida, I.T. 5,10-methylenetetrahydrofolate reductase (MTHFR) 677C→T and 1298A→C mutations are associated with DNA hypomethylation. J. Med. Genet. 2004, 41, 454–458. [Google Scholar] [CrossRef] [Green Version]
- Dankner, R.; Chetrit, A.; Dror, G.K.; Sela, B.-A. Physical activity is inversely associated with total homocysteine levels, independent of C677T MTHFR genotype and plasma B vitamins. Age 2007, 29, 219–227. [Google Scholar] [CrossRef] [PubMed] [Green Version]
- Kuo, H.-K.; Liao, K.-C.; Leveille, S.G.; Bean, J.F.; Yen, C.; Chen, J.; Yu, Y.; Tai, T. Relationship of homocysteine levels to quadriceps strength, gait speed, and late-life disability in older adults. J. Gerontol. Ser. A Biol. Sci. Med. Sci. 2007, 62, 434–439. [Google Scholar] [CrossRef] [Green Version]
- Steffl, M.; Bohannon, R.W.; Sontakova, L.; Tufano, J.; Shiells, K.; Holmerova, I. Relationship between sarcopenia and physical activity in older people: A systematic review and meta-analysis. Clin. Interv. Aging 2017, 12, 835–845. [Google Scholar] [CrossRef] [Green Version]
- Elia, M. Obesity in the elderly. Obes. Res. 2001, 9, 244S–248S. [Google Scholar] [CrossRef]
- Heffernan, S.M.; Stebbings, G.K.; Kilduff, L.P.; Erskine, R.M.; Day, S.H.; Morse, C.I.; McPhee, J.S.; Cook, C.J.; Vance, B.; Ribbans, W.J.; et al. Fat mass and obesity associated (FTO) gene influences skeletal muscle phenotypes in non-resistance trained males and elite rugby playing position. BMC Genet. 2017, 18, 4. [Google Scholar] [CrossRef] [Green Version]
- Yang, L.; Yao, X.; Shen, J.; Sun, G.; Sun, Q.; Tian, X.; Li, X.; Li, X.; Ye, L.; Zhang, Z.; et al. Comparison of revised EWGSOP criteria and four other diagnostic criteria of sarcopenia in Chinese community-dwelling elderly residents. Exp. Gerontol. 2020, 130, 110798. [Google Scholar] [CrossRef]
- Bahat, G.; Tufan, A.; Tufan, F.; Kilic, C.; Akpinar, T.S.; Kose, M.; Erten, N.; Karan, M.A.; Cruz-Jentoft, A.J. Cut-off points to identify sarcopenia according to European Working Group on Sarcopenia in Older People (EWGSOP) definition. Clin. Nutr. 2016, 35, 1557–1563. [Google Scholar] [CrossRef] [PubMed]
- Yalcin, A.; Aras, S.; Atmis, V.; Cengiz, O.K.; Varli, M.; Cinar, E.; Atli, T. Sarcopenia prevalence and factors associated with sarcopenia in older people living in a nursing home in A nkara T urkey. Geriatr. Gerontol. Int. 2016, 16, 903–910. [Google Scholar] [CrossRef]
- Degens, H. Human Ageing: Impact on Muscle Force and Power, in Muscle and Exercise Physiology; Elsevier: Amsterdam, The Netherlands, 2019; pp. 423–432. [Google Scholar]
- Witherspoon, D.J.; Wooding, S.; Rogers, A.R.; E Marchani, E.; Watkins, W.S.; A Batzer, M.; Jorde, L.B. Genetic Similarities Within and Between Human Populations. Genetics 2007, 176, 351–359. [Google Scholar] [CrossRef] [PubMed] [Green Version]
- De Lima, L.R.A.; Rech, C.R.; Petroski, E.L. Use of bioelectrical impedance for the estimation of skeletal muscle mass in elderly men. Arch. Latinoam. Nutr. 2008, 58, 386–391. [Google Scholar]
- Faria, S.L.; Faria, O.P.; Cardeal, M.D.A.; Ito, M.K. Validation Study of Multi-Frequency Bioelectrical Impedance with Dual-Energy X-ray Absorptiometry Among Obese Patients. Obes. Surg. 2014, 24, 1476–1480. [Google Scholar] [CrossRef] [PubMed]
- Janssen, I.; Heymsfield, S.B.; Ross, R. Low Relative Skeletal Muscle Mass (Sarcopenia) in Older Persons Is Associated with Functional Impairment and Physical Disability. J. Am. Geriatr. Soc. 2002, 50, 889–896. [Google Scholar] [CrossRef] [PubMed] [Green Version]
- Wang, H.; Hai, S.; Cao, L.; Zhou, J.; Liu, P.; Dong, B.-R. Estimation of prevalence of sarcopenia by using a new bioelectrical impedance analysis in Chinese community-dwelling elderly people. BMC Geriatr. 2016, 16, 216. [Google Scholar] [CrossRef] [Green Version]


| Variables | Overall Characteristics (n = 307) | Sarcopenic Obese (n = 77) | Non-Sarcopenic Obese (n = 176) | Sarcopenic Non-Obese (n = 7) | Non-Sarcopenic Non-Obese (n = 47) |
|---|---|---|---|---|---|
| Age (years) | 70.7 (70.1–71.4) | 72.5 (71.3–73.8) 4 | 70.8 (70.0–71.7) 4 | 68.7 (65.2–72.2) | 67.6 (66.3–69.0) 1,2 |
| Height (m) | 1.60 (1.59–1.60) | 1.58 (1.57–1.59) 2,4 | 1.60 (1.59–1.61) 1 | 1.63 (1.58–1.67) | 1.62 (1.61–1.64) 1 |
| Body mass (kg) | 66.3 (65.01–67.6) | 62.1 (60.1–64.0) 2 | 70.5 (68.7–72.2) 1,3,4 | 55.2 (48.6–61.7) 2 | 59.6 (57.5–61.6) 2 |
| BMI (kg/m2) | 25.9 (25.4–26.4) | 24.8 (24.1–25.6) 2,3,4 | 27.5 (26.9–28.1) 1,3,4 | 20.8 (19.1–22.5) 1,2 | 22.5 (22.0–23.1) 1,2 |
| SMI (kg/m2) | 6.56 (6.47–6.65) | 5.96 (5.85–6.08) 2,4 | 6.71 (6.59–6.83) 1 | 6.21 (5.83–6.60) 4 | 7.00 (6.80–7.20) 1,3 |
| HGS (kg) | 29.9 (29.3–30.5) | 25.3 (24.7–25.9) 2,4 | 31.0 (30.3–31.7) 1,3,4 | 25.8 (23.6–28.0) 2,4 | 34.0 (32.7–35.2) 1,2,3 |
| OLST (s) | 23 (22–24) | 20 (18–23) 2,4 | 23 (22–25) 1 | 22 (14–30) | 29 (28–30) 1 |
| BF% | 42.6 (42.1–43.2) | 44.4 (43.5–45.3) 3,4 | 44.1 (43.5–44.7) 3,4 | 36.1 (34.6–37.7) 1,2 | 35.0 (34.5–35.6) 1,2 |
| Variables | Sarcopenic Obese (n = 77) | Non-Sarcopenic Obese (n = 176) | Sarcopenic Non-Obese (n = 7) | Non-Sarcopenic Non-Obese (n = 47) | p-Value Obesity | p-Value Sarcopenia | p-Value Sarcopenia * Obesity |
|---|---|---|---|---|---|---|---|
| Biceps brachii thickness (cm) | 1.66 (1.59–1.74) | 1.81 (1.76–1.86) | 1.78 (1.51–2.05) | 1.68 (1.62–1.75) | 0.544 | 0.933 | 0.173 |
| VLACSA (cm2) | 14.7 (14.0–15.5) | 17.1 (16.6–17.6) | 13.9 (10.5–17.3) | 16.4 (15.4–17.4) | 0.074 | 0.003 | 0.861 |
| MVCEF (N·m) | 21.5 (20.3–22.8) | 25.4 (24.6–26.1) | 25.7 (19.2–32.2) | 27.8 (25.1–30.4) | 0.032 | 0.083 | 0.251 |
| MVCKE (N·m) | 48.2 (44.6–51.8) | 56.6 (53.9–59.2) | 66.1 (44.9–87.3) | 62.9 (55.9–70.0) | 0.047 | 0.498 | 0.252 |
| MVCKE/VLACSA (N·m/cm2) | 3.39 (3.10–3.68) | 3.37 (3.20–3.54) | 4.88 (3.34–6.42) | 3.89 (3.48–4.30) | 0.012 | 0.077 | 0.156 |
| SNPs | B | S.E (β) | Wald’s χ2 | p | OR | 95% CI | Risk Genotypes |
|---|---|---|---|---|---|---|---|
| ACTN3 rs1815739 | 0.612 | 0.294 | 4.341 | 0.037 | 1.84 | 1.04–3.28 | CC |
| MTHFR rs1801131 | 0.614 | 0.291 | 4.470 | 0.034 | 1.85 | 1.05–3.27 | GG + GT |
| MTHFR rs1537516 | 1.011 | 0.341 | 8.811 | 0.003 | 2.75 | 1.41–5.36 | AA + AG |
Publisher’s Note: MDPI stays neutral with regard to jurisdictional claims in published maps and institutional affiliations. |
© 2021 by the authors. Licensee MDPI, Basel, Switzerland. This article is an open access article distributed under the terms and conditions of the Creative Commons Attribution (CC BY) license (https://creativecommons.org/licenses/by/4.0/).
Share and Cite
Khanal, P.; Williams, A.G.; He, L.; Stebbings, G.K.; Onambele-Pearson, G.L.; Thomis, M.; Degens, H.; Morse, C.I. Sarcopenia, Obesity, and Sarcopenic Obesity: Relationship with Skeletal Muscle Phenotypes and Single Nucleotide Polymorphisms. J. Clin. Med. 2021, 10, 4933. https://doi.org/10.3390/jcm10214933
Khanal P, Williams AG, He L, Stebbings GK, Onambele-Pearson GL, Thomis M, Degens H, Morse CI. Sarcopenia, Obesity, and Sarcopenic Obesity: Relationship with Skeletal Muscle Phenotypes and Single Nucleotide Polymorphisms. Journal of Clinical Medicine. 2021; 10(21):4933. https://doi.org/10.3390/jcm10214933
Chicago/Turabian StyleKhanal, Praval, Alun G. Williams, Lingxiao He, Georgina K. Stebbings, Gladys L. Onambele-Pearson, Martine Thomis, Hans Degens, and Christopher I. Morse. 2021. "Sarcopenia, Obesity, and Sarcopenic Obesity: Relationship with Skeletal Muscle Phenotypes and Single Nucleotide Polymorphisms" Journal of Clinical Medicine 10, no. 21: 4933. https://doi.org/10.3390/jcm10214933