Systematic Multiomics Analysis of Alterations in C1QBP mRNA Expression and Relevance for Clinical Outcomes in Cancers

 ,
,  ,
,  ,
,  and
and 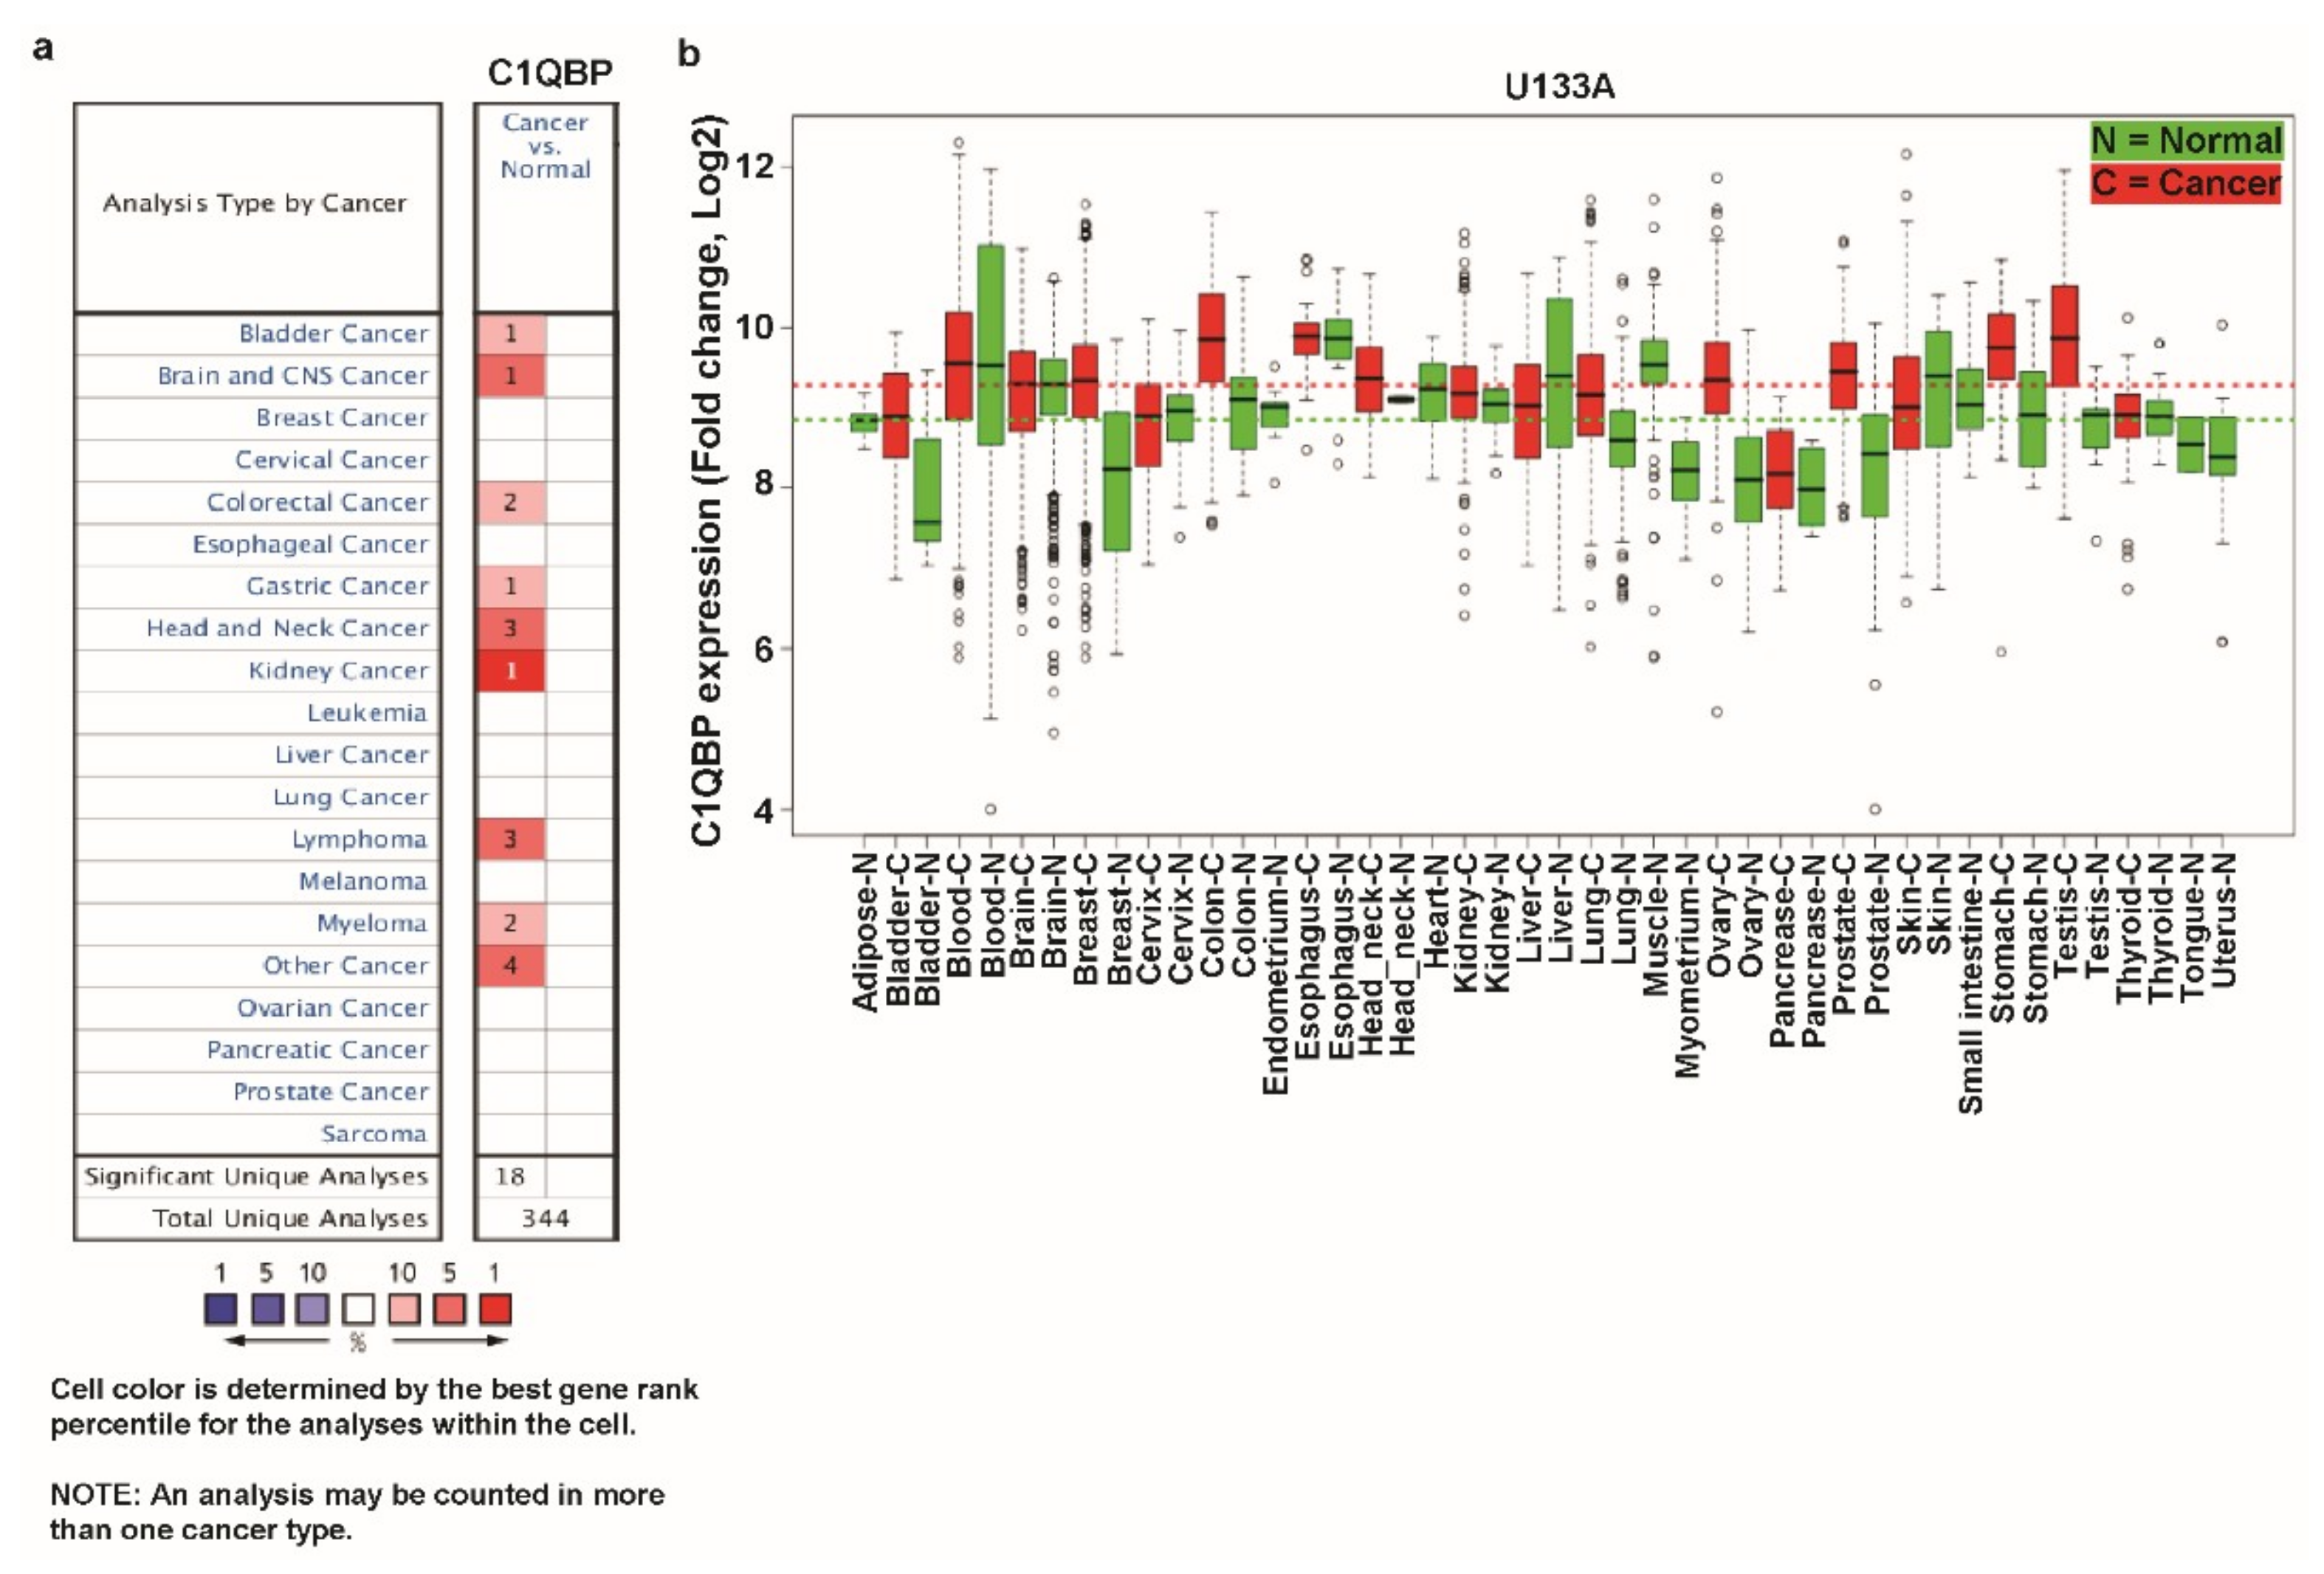
Abstract
:1. Introduction
2. Experimental Section
2.1. Oncomine Database Analysis
2.2. Analysis Using the Gene Expression Across Normal and Tumor Tissue (GENT) Database and UALCAN
2.3. cBioPortal Database Analysis
2.4. SurvExpress Biomarker Validation Tool
2.5. PrognoScan Database Analysis
2.6. R2: Kaplan Meier Scanner
2.7. Finding Coexpressed Genes of C1QBP and Its Pathway Analysis
3. Results
3.1. C1QBP Expression in Various Cancers
3.2. C1QBP Expression Pattern and Patient Survival in Breast Cancer.
3.3. C1QBP Expression Pattern and Patient Survival in Lung Cancer
3.4. C1QBP Expression Pattern and Patient Survival in Colon Cancer
3.5. C1QBP Expression Pattern and Patient Survival in Bladder Cancer
3.6. C1QBP Expression Pattern and Patient Survival in Lymphoma
3.7. C1QBP Expression Pattern and Patient Survival in Other Type of Cancers
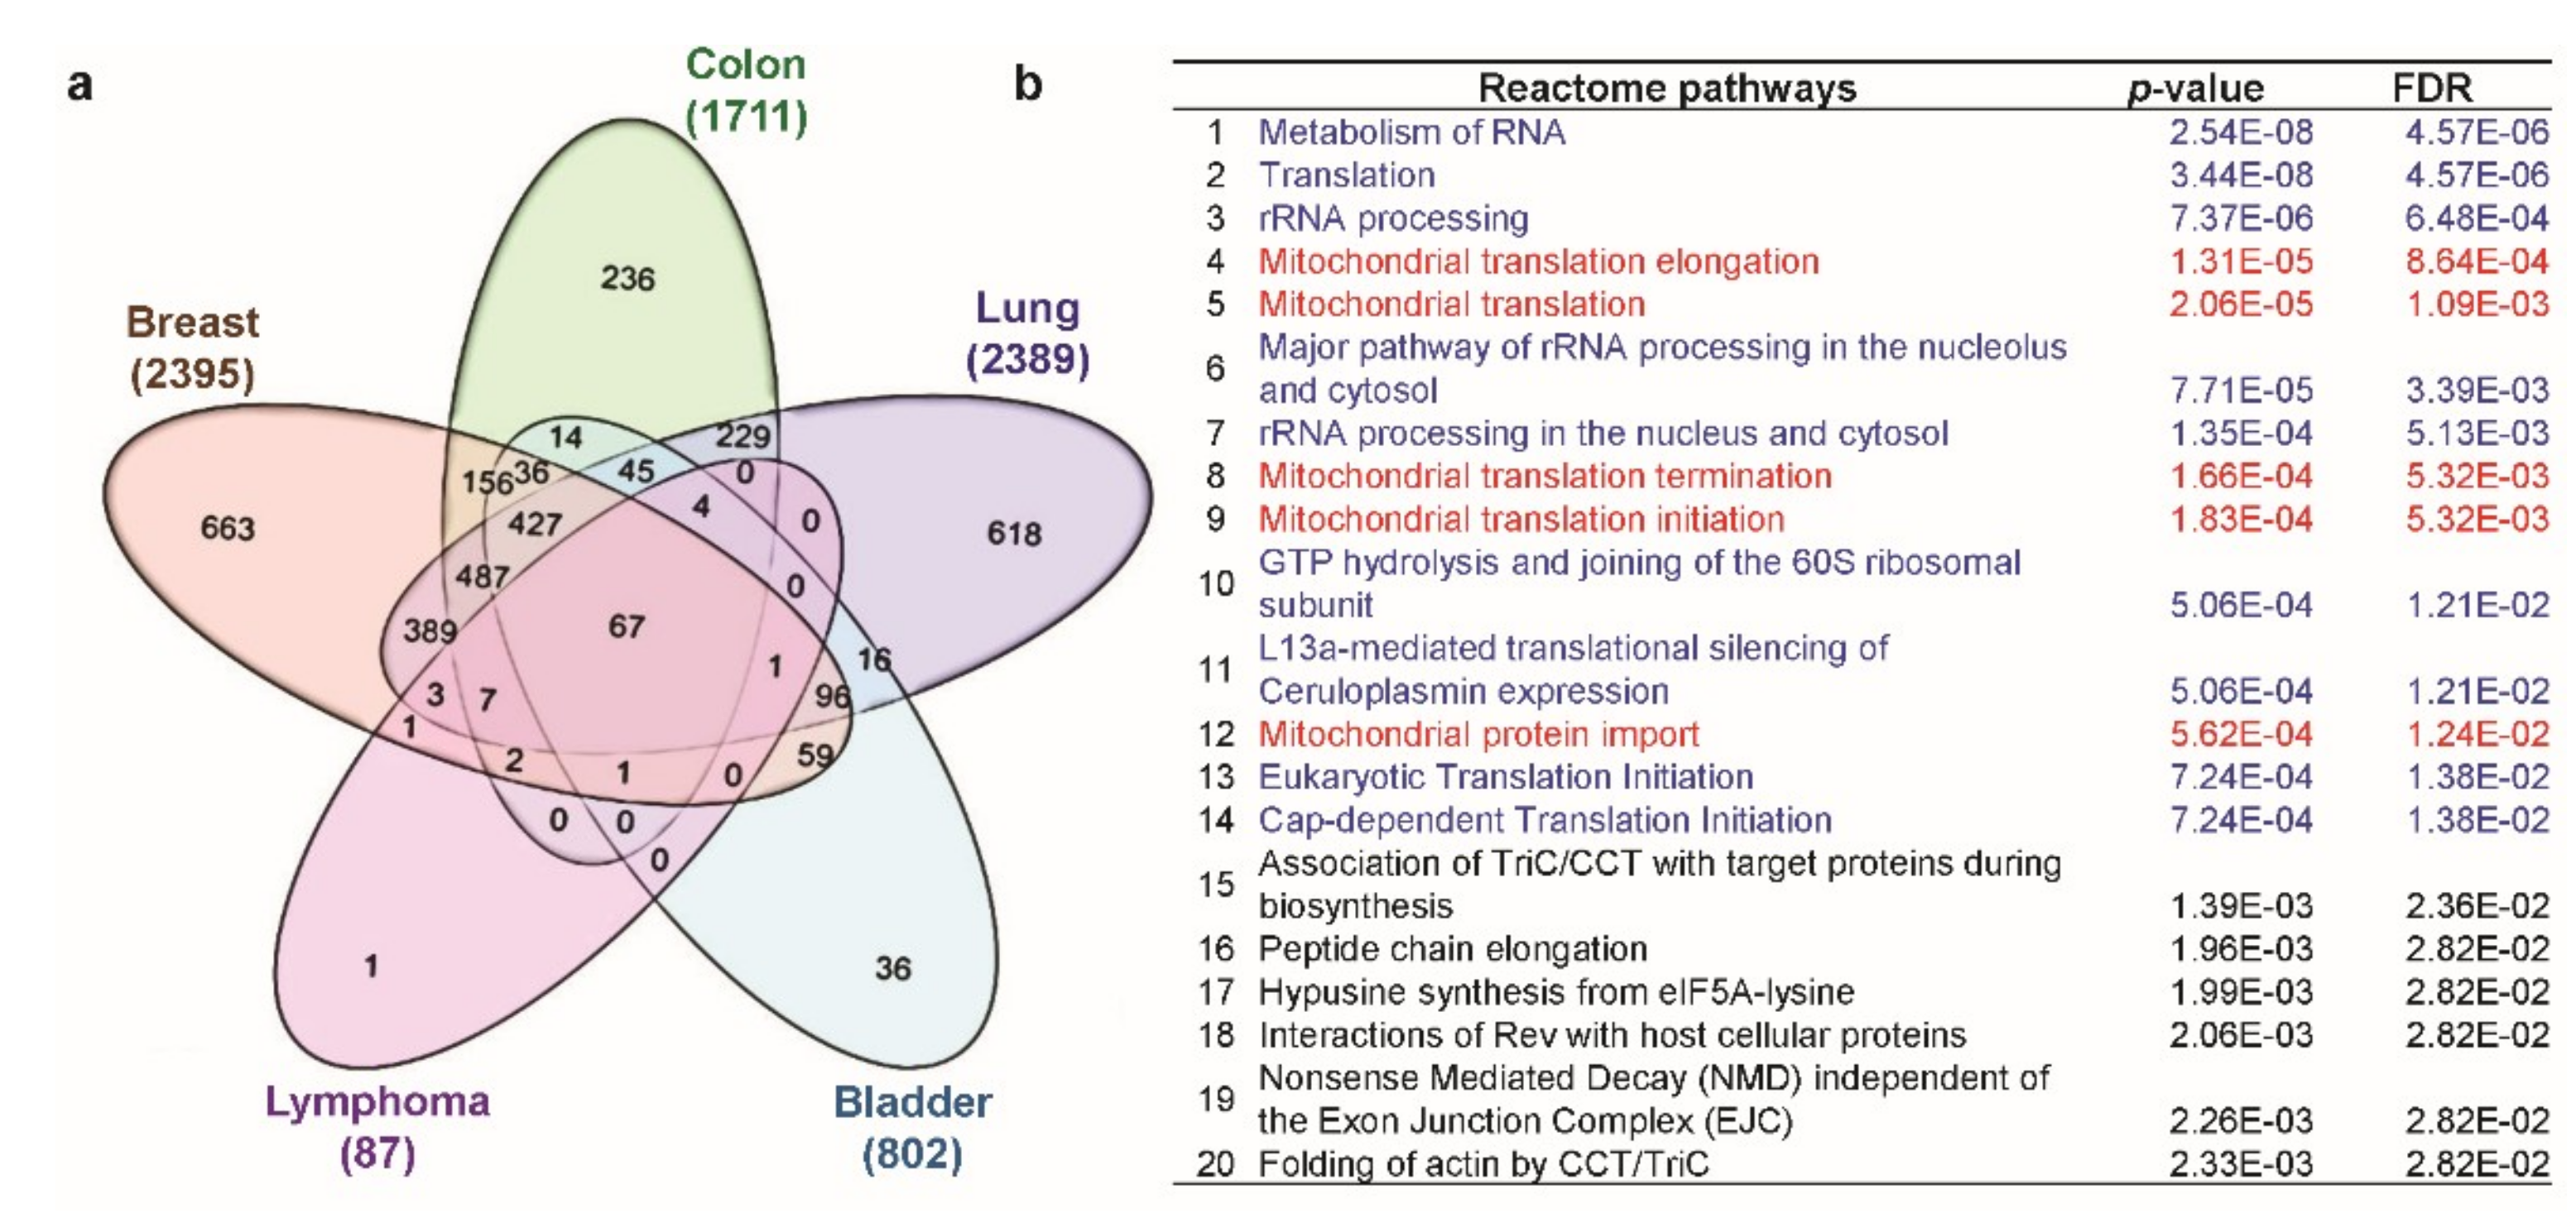
3.8. Differentially Expressed Genes with C1QBP Expression in Five Types of Cancers
4. Discussion
5. Conclusions
Supplementary Materials
Author Contributions
Funding
Acknowledgments
Conflicts of Interest
References
- Torre, L.A.; Bray, F.; Siegel, R.L.; Ferlay, J.; Lortet-Tieulent, J.; Jemal, A. Global cancer statistics, 2012. CA Cancer J. Clin. 2015, 65, 87–108. [Google Scholar] [CrossRef] [PubMed]
- Global Burden of Disease Cancer Collaboration; Fitzmaurice, C.; Allen, C.; Barber, R.M.; Barregard, L.; Bhutta, Z.A.; Brenner, H.; Dicker, D.J.; Chimed-Orchir, O.; Dandona, R.; et al. Global, Regional, and National Cancer Incidence, Mortality, Years of Life Lost, Years Lived With Disability, and Disability-Adjusted Life-years for 32 Cancer Groups, 1990 to 2015: A Systematic Analysis for the Global Burden of Disease Study. JAMA Oncol. 2017, 3, 524–548. [Google Scholar] [CrossRef]
- Ghebrehiwet, B.; Lim, B.L.; Peerschke, E.I.; Willis, A.C.; Reid, K.B. Isolation, cDNA cloning, and overexpression of a 33-kD cell surface glycoprotein that binds to the globular “heads” of C1q. J. Exp. Med. 1994, 179, 1809–1821. [Google Scholar] [CrossRef]
- Gupta, S.; Batchu, R.B.; Datta, K. Purification, partial characterization of rat kidney hyaluronic acid binding protein and its localization on the cell surface. Eur. J. Cell Biol. 1991, 56, 58–67. [Google Scholar] [PubMed]
- Soltys, B.J.; Kang, D.; Gupta, R.S. Localization of P32 protein (gC1q-R) in mitochondria and at specific extramitochondrial locations in normal tissues. Histochem. Cell Biol. 2000, 114, 245–255. [Google Scholar] [PubMed]
- Krainer, A.R.; Mayeda, A.; Kozak, D.; Binns, G. Functional expression of cloned human splicing factor SF2: Homology to RNA-binding proteins, U1 70K, and Drosophila splicing regulators. Cell 1991, 66, 383–394. [Google Scholar] [CrossRef]
- Majumdar, M.; Meenakshi, J.; Goswami, S.K.; Datta, K. Hyaluronan binding protein 1 (HABP1)/C1QBP/p32 is an endogenous substrate for MAP kinase and is translocated to the nucleus upon mitogenic stimulation. Biochem. Biophys. Res. Commun. 2002, 291, 829–837. [Google Scholar] [CrossRef] [PubMed]
- Feichtinger, R.G.; Olahova, M.; Kishita, Y.; Garone, C.; Kremer, L.S.; Yagi, M.; Uchiumi, T.; Jourdain, A.A.; Thompson, K.; D’Souza, A.R.; et al. Biallelic C1QBP Mutations Cause Severe Neonatal-, Childhood-, or Later-Onset Cardiomyopathy Associated with Combined Respiratory-Chain Deficiencies. Am. J. Hum. Genet. 2017, 101, 525–538. [Google Scholar] [CrossRef]
- Yoshikawa, H.; Komatsu, W.; Hayano, T.; Miura, Y.; Homma, K.; Izumikawa, K.; Ishikawa, H.; Miyazawa, N.; Tachikawa, H.; Yamauchi, Y.; et al. Splicing factor 2-associated protein p32 participates in ribosome biogenesis by regulating the binding of Nop52 and fibrillarin to preribosome particles. Mol. Cell. Proteom. 2011, 10, M110-006148. [Google Scholar] [CrossRef]
- Petersen-Mahrt, S.K.; Estmer, C.; Ohrmalm, C.; Matthews, D.A.; Russell, W.C.; Akusjarvi, G. The splicing factor-associated protein, p32, regulates RNA splicing by inhibiting ASF/SF2 RNA binding and phosphorylation. EMBO J. 1999, 18, 1014–1024. [Google Scholar] [CrossRef]
- Leigh, L.E.; Ghebrehiwet, B.; Perera, T.P.; Bird, I.N.; Strong, P.; Kishore, U.; Reid, K.B.; Eggleton, P. C1q-mediated chemotaxis by human neutrophils: Involvement of gClqR and G-protein signalling mechanisms. Biochem. J. 1998, 330 Pt 1, 247–254. [Google Scholar] [CrossRef]
- Joseph, K.; Ghebrehiwet, B.; Peerschke, E.I.; Reid, K.B.; Kaplan, A.P. Identification of the zinc-dependent endothelial cell binding protein for high molecular weight kininogen and factor XII: Identity with the receptor that binds to the globular “heads” of C1q (gC1q-R). Proc. Natl. Acad. Sci. USA 1996, 93, 8552–8557. [Google Scholar] [CrossRef]
- Herwald, H.; Dedio, J.; Kellner, R.; Loos, M.; Muller-Esterl, W. Isolation and characterization of the kininogen-binding protein p33 from endothelial cells. Identity with the gC1q receptor. J. Biol. Chem. 1996, 271, 13040–13047. [Google Scholar] [CrossRef] [PubMed]
- Pixley, R.A.; Espinola, R.G.; Ghebrehiwet, B.; Joseph, K.; Kao, A.; Bdeir, K.; Cines, D.B.; Colman, R.W. Interaction of high-molecular-weight kininogen with endothelial cell binding proteins suPAR, gC1qR and cytokeratin 1 determined by surface plasmon resonance (BiaCore). Thromb. Haemost. 2011, 105, 1053–1059. [Google Scholar] [CrossRef] [PubMed]
- Vegh, Z.; Kew, R.R.; Gruber, B.L.; Ghebrehiwet, B. Chemotaxis of human monocyte-derived dendritic cells to complement component C1q is mediated by the receptors gC1qR and cC1qR. Mol. Immunol. 2006, 43, 1402–1407. [Google Scholar] [CrossRef] [PubMed]
- Huang, L.; Chi, J.; Berry, F.B.; Footz, T.K.; Sharp, M.W.; Walter, M.A. Human p32 is a novel FOXC1-interacting protein that regulates FOXC1 transcriptional activity in ocular cells. Investig. Ophthalmol. Vis. Sci. 2008, 49, 5243–5249. [Google Scholar] [CrossRef] [PubMed]
- Chattopadhyay, C.; Hawke, D.; Kobayashi, R.; Maity, S.N. Human p32, interacts with B subunit of the CCAAT-binding factor, CBF/NF-Y, and inhibits CBF-mediated transcription activation in vitro. Nucl. Acids Res. 2004, 32, 3632–3641. [Google Scholar] [CrossRef] [Green Version]
- Matsumoto, K.; Kose, S.; Kuwahara, I.; Yoshimura, M.; Imamoto, N.; Yoshida, M. Y-box protein-associated acidic protein (YBAP1/C1QBP) affects the localization and cytoplasmic functions of YB-1. Sci. Rep. 2018, 8, 6198. [Google Scholar] [CrossRef]
- Nguyen, T.; Ghebrehiwet, B.; Peerschke, E.I. Staphylococcus aureus protein A recognizes platelet gC1qR/p33: A novel mechanism for staphylococcal interactions with platelets. Infect. Immun. 2000, 68, 2061–2068. [Google Scholar] [CrossRef] [PubMed]
- Kittlesen, D.J.; Chianese-Bullock, K.A.; Yao, Z.Q.; Braciale, T.J.; Hahn, Y.S. Interaction between complement receptor gC1qR and hepatitis C virus core protein inhibits T-lymphocyte proliferation. J. Clin. Investig. 2000, 106, 1239–1249. [Google Scholar] [CrossRef] [Green Version]
- Waggoner, S.N.; Hall, C.H.; Hahn, Y.S. HCV core protein interaction with gC1q receptor inhibits Th1 differentiation of CD4+ T cells via suppression of dendritic cell IL-12 production. J. Leukoc. Biol. 2007, 82, 1407–1419. [Google Scholar] [CrossRef] [PubMed]
- Yadav, G.; Prasad, R.L.; Jha, B.K.; Rai, V.; Bhakuni, V.; Datta, K. Evidence for inhibitory interaction of hyaluronan-binding protein 1 (HABP1/p32/gC1qR) with Streptococcus pneumoniae hyaluronidase. J. Biol. Chem. 2009, 284, 3897–3905. [Google Scholar] [CrossRef]
- Xu, L.; Xiao, N.; Liu, F.; Ren, H.; Gu, J. Inhibition of RIG-I and MDA5-dependent antiviral response by gC1qR at mitochondria. Proc. Natl. Acad. Sci. USA 2009, 106, 1530–1535. [Google Scholar] [CrossRef] [Green Version]
- Chen, Y.B.; Jiang, C.T.; Zhang, G.Q.; Wang, J.S.; Pang, D. Increased expression of hyaluronic acid binding protein 1 is correlated with poor prognosis in patients with breast cancer. J. Surg. Oncol. 2009, 100, 382–386. [Google Scholar] [CrossRef]
- Wang, J.; Song, Y.; Liu, T.; Shi, Q.; Zhong, Z.; Wei, W.; Huang, S.; Pang, D. Elevated expression of HABP1 is a novel prognostic indicator in triple-negative breast cancers. Tumour Biol. 2015, 36, 4793–4799. [Google Scholar] [CrossRef] [PubMed]
- Yu, G.; Wang, J. Significance of hyaluronan binding protein (HABP1/P32/gC1qR) expression in advanced serous ovarian cancer patients. Exp. Mol. Pathol. 2013, 94, 210–215. [Google Scholar] [CrossRef] [PubMed]
- Zhao, J.; Liu, T.; Yu, G.; Wang, J. Overexpression of HABP1 correlated with clinicopathological characteristics and unfavorable prognosis in endometrial cancer. Tumour Biol. 2015, 36, 1299–1306. [Google Scholar] [CrossRef] [PubMed]
- Zhang, M.; Li, N.; Liang, Y.; Liu, J.; Zhou, Y.; Liu, C. Hyaluronic acid binding protein 1 overexpression is an indicator for disease-free survival in cervical cancer. Int. J. Clin. Oncol. 2017, 22, 347–352. [Google Scholar] [CrossRef] [PubMed]
- Scully, O.J.; Yu, Y.; Salim, A.; Thike, A.A.; Yip, G.W.; Baeg, G.H.; Tan, P.H.; Matsumoto, K.; Bay, B.H. Complement component 1, q subcomponent binding protein is a marker for proliferation in breast cancer. Exp. Biol. Med. 2015, 240, 846–853. [Google Scholar] [CrossRef] [PubMed] [Green Version]
- Zhang, X.; Zhang, F.; Guo, L.; Wang, Y.; Zhang, P.; Wang, R.; Zhang, N.; Chen, R. Interactome analysis reveals that C1QBP (complement component 1, q subcomponent binding protein) is associated with cancer cell chemotaxis and metastasis. Mol. Cell. Proteom. 2013, 12, 3199–3209. [Google Scholar] [CrossRef]
- Yu, H.; Liu, Q.; Xin, T.; Xing, L.; Dong, G.; Jiang, Q.; Lv, Y.; Song, X.; Teng, C.; Huang, D.; et al. Elevated expression of hyaluronic acid binding protein 1 (HABP1)/P32/C1QBP is a novel indicator for lymph node and peritoneal metastasis of epithelial ovarian cancer patients. Tumour Biol. 2013, 34, 3981–3987. [Google Scholar] [CrossRef]
- Kim, K.B.; Yi, J.S.; Nguyen, N.; Lee, J.H.; Kwon, Y.C.; Ahn, B.Y.; Cho, H.; Kim, Y.K.; Yoo, H.J.; Lee, J.S.; et al. Cell-surface receptor for complement component C1q (gC1qR) is a key regulator for lamellipodia formation and cancer metastasis. J. Biol. Chem. 2011, 286, 23093–23101. [Google Scholar] [CrossRef]
- Wang, Y.; Fu, D.; Su, J.; Chen, Y.; Qi, C.; Sun, Y.; Niu, Y.; Zhang, N.; Yue, D. C1QBP suppresses cell adhesion and metastasis of renal carcinoma cells. Sci. Rep. 2017, 7, 999. [Google Scholar] [CrossRef] [PubMed]
- Rhodes, D.R.; Yu, J.; Shanker, K.; Deshpande, N.; Varambally, R.; Ghosh, D.; Barrette, T.; Pandey, A.; Chinnaiyan, A.M. ONCOMINE: A cancer microarray database and integrated data-mining platform. Neoplasia 2004, 6, 1–6. [Google Scholar] [CrossRef]
- Rhodes, D.R.; Kalyana-Sundaram, S.; Mahavisno, V.; Varambally, R.; Yu, J.; Briggs, B.B.; Barrette, T.R.; Anstet, M.J.; Kincead-Beal, C.; Kulkarni, P.; et al. Oncomine 3.0: Genes, pathways, and networks in a collection of 18,000 cancer gene expression profiles. Neoplasia 2007, 9, 166–180. [Google Scholar] [CrossRef] [PubMed]
- Shin, G.; Kang, T.W.; Yang, S.; Baek, S.J.; Jeong, Y.S.; Kim, S.Y. GENT: Gene expression database of normal and tumor tissues. Cancer Inform. 2011, 10, 149–157. [Google Scholar] [CrossRef]
- Chandrashekar, D.S.; Bashel, B.; Balasubramanya, S.A.H.; Creighton, C.J.; Ponce-Rodriguez, I.; Chakravarthi, B.; Varambally, S. UALCAN: A Portal for Facilitating Tumor Subgroup Gene Expression and Survival Analyses. Neoplasia 2017, 19, 649–658. [Google Scholar] [CrossRef]
- Tang, Z.F.; Li, C.W.; Kang, B.X.; Gao, G.; Li, C.; Zhang, Z.M. GEPIA: A web server for cancer and normal gene expression profiling and interactive analyses. Nucleic Acids Res. 2017, 45, W98–W102. [Google Scholar] [CrossRef]
- Diez-Villanueva, A.; Mallona, I.; Peinado, M.A. Wanderer, an interactive viewer to explore DNA methylation and gene expression data in human cancer. Epigenetics Chromatin 2015, 8, 22. [Google Scholar] [CrossRef] [PubMed] [Green Version]
- Gao, J.; Aksoy, B.A.; Dogrusoz, U.; Dresdner, G.; Gross, B.; Sumer, S.O.; Sun, Y.; Jacobsen, A.; Sinha, R.; Larsson, E.; et al. Integrative analysis of complex cancer genomics and clinical profiles using the cBioPortal. Sci. Signal. 2013, 6, pl1. [Google Scholar] [CrossRef]
- Cerami, E.; Gao, J.; Dogrusoz, U.; Gross, B.E.; Sumer, S.O.; Aksoy, B.A.; Jacobsen, A.; Byrne, C.J.; Heuer, M.L.; Larsson, E.; et al. The cBio cancer genomics portal: An open platform for exploring multidimensional cancer genomics data. Cancer Discov. 2012, 2, 401–404. [Google Scholar] [CrossRef]
- Aguirre-Gamboa, R.; Gomez-Rueda, H.; Martinez-Ledesma, E.; Martinez-Torteya, A.; Chacolla-Huaringa, R.; Rodriguez-Barrientos, A.; Tamez-Pena, J.G.; Trevino, V. SurvExpress: An online biomarker validation tool and database for cancer gene expression data using survival analysis. PLoS ONE 2013, 8, e74250. [Google Scholar] [CrossRef]
- Vastrik, I.; D’Eustachio, P.; Schmidt, E.; Gopinath, G.; Croft, D.; de Bono, B.; Gillespie, M.; Jassal, B.; Lewis, S.; Matthews, L.; et al. Reactome: A knowledge base of biologic pathways and processes. Genome Biol. 2007, 8, R39. [Google Scholar] [CrossRef]
- Boyle, E.I.; Weng, S.; Gollub, J.; Jin, H.; Botstein, D.; Cherry, J.M.; Sherlock, G. GO::TermFinder–open source software for accessing Gene Ontology information and finding significantly enriched Gene Ontology terms associated with a list of genes. Bioinformatics 2004, 20, 3710–3715. [Google Scholar] [CrossRef]
- McGee, A.M.; Douglas, D.L.; Liang, Y.; Hyder, S.M.; Baines, C.P. The mitochondrial protein C1qbp promotes cell proliferation, migration and resistance to cell death. Cell Cycle 2011, 10, 4119–4127. [Google Scholar] [CrossRef] [Green Version]
- Li, W.; Zhang, X.; Wang, W.; Sun, R.; Liu, B.; Ma, Y.; Zhang, W.; Ma, L.; Jin, Y.; Yang, S. Quantitative proteomics analysis of mitochondrial proteins in lung adenocarcinomas and normal lung tissue using iTRAQ and tandem mass spectrometry. Am. J. Transl. Res. 2017, 9, 3918–3934. [Google Scholar]
- Kim, K.; Kim, M.J.; Kim, K.H.; Ahn, S.A.; Kim, J.H.; Cho, J.Y.; Yeo, S.G. C1QBP is upregulated in colon cancer and binds to apolipoprotein A-I. Exp. Ther. Med. 2017, 13, 2493–2500. [Google Scholar] [CrossRef] [Green Version]
- Dembitzer, F.R.; Kinoshita, Y.; Burstein, D.; Phelps, R.G.; Beasley, M.B.; Garcia, R.; Harpaz, N.; Jaffer, S.; Thung, S.N.; Unger, P.D.; et al. gC1qR expression in normal and pathologic human tissues: Differential expression in tissues of epithelial and mesenchymal origin. J. Histochem. Cytochem. 2012, 60, 467–474. [Google Scholar] [CrossRef]
- Sanchez-Martin, D.; Cuesta, A.M.; Fogal, V.; Ruoslahti, E.; Alvarez-Vallina, L. The multicompartmental p32/gClqR as a new target for antibody-based tumor targeting strategies. J. Biol. Chem. 2011, 286, 5197–5203. [Google Scholar] [CrossRef]
- Li, X.; Jin, Q.; Chen, T.; Zhang, B.; Zheng, R.; Wang, Z.; Zheng, H. LyP-1 ultrasonic microbubbles targeting to cancer cell as tumor bio-acoustics markers or drug carriers: Targeting efficiency evaluation in, microfluidic channels. Conf. Proc. IEEE Eng. Med. Biol. Soc. 2009, 2009, 463–466. [Google Scholar] [CrossRef]
- Yenugonda, V.; Nomura, N.; Kouznetsova, V.; Tsigelny, I.; Fogal, V.; Nurmemmedov, E.; Kesari, S.; Babic, I. A novel small molecule inhibitor of p32 mitochondrial protein overexpressed in glioma. J. Transl. Med. 2017, 15, 210. [Google Scholar] [CrossRef]
- Yagi, M.; Uchiumi, T.; Takazaki, S.; Okuno, B.; Nomura, M.; Yoshida, S.; Kanki, T.; Kang, D. p32/gC1qR is indispensable for fetal development and mitochondrial translation: Importance of its RNA-binding ability. Nucl. Acids Res. 2012, 40, 9717–9737. [Google Scholar] [CrossRef] [PubMed]
- Fogal, V.; Richardson, A.D.; Karmali, P.P.; Scheffler, I.E.; Smith, J.W.; Ruoslahti, E. Mitochondrial p32 protein is a critical regulator of tumor metabolism via maintenance of oxidative phosphorylation. Mol. Cell. Biol. 2010, 30, 1303–1318. [Google Scholar] [CrossRef]


© 2019 by the authors. Licensee MDPI, Basel, Switzerland. This article is an open access article distributed under the terms and conditions of the Creative Commons Attribution (CC BY) license (http://creativecommons.org/licenses/by/4.0/).
Share and Cite
Saha, S.K.; Kim, K.E.; Islam, S.M.R.; Cho, S.-G.; Gil, M. Systematic Multiomics Analysis of Alterations in C1QBP mRNA Expression and Relevance for Clinical Outcomes in Cancers. J. Clin. Med. 2019, 8, 513. https://doi.org/10.3390/jcm8040513
Saha SK, Kim KE, Islam SMR, Cho S-G, Gil M. Systematic Multiomics Analysis of Alterations in C1QBP mRNA Expression and Relevance for Clinical Outcomes in Cancers. Journal of Clinical Medicine. 2019; 8(4):513. https://doi.org/10.3390/jcm8040513
Chicago/Turabian StyleSaha, Subbroto Kumar, Kyung Eun Kim, S.M. Riazul Islam, Ssang-Goo Cho, and Minchan Gil. 2019. "Systematic Multiomics Analysis of Alterations in C1QBP mRNA Expression and Relevance for Clinical Outcomes in Cancers" Journal of Clinical Medicine 8, no. 4: 513. https://doi.org/10.3390/jcm8040513