Article

Hydrodynamics and Morphodynamics Performance Assessment of Three Coastal Protection Structures

by
Bárbara F. V. Vieira
1,*,
José L. S. Pinho
1,
Joaquim A. O. Barros
1 and
José S. Antunes do Carmo
2
1
Department of Civil Engineering, University of Minho, Campus of Azurém, 4800-058 Guimarães, Portugal
2
Department of Civil Engineering, University of Coimbra, 3030-788 Coimbra, Portugal
*
Author to whom correspondence should be addressed.
J. Mar. Sci. Eng. 2020, 8(3), 175; https://doi.org/10.3390/jmse8030175
Submission received: 11 February 2020 / Accepted: 3 March 2020 / Published: 5 March 2020
(This article belongs to the Special Issue Reefs)

Abstract

:
Coastal areas accommodate a great part of large metropolises as they support a great amount of economic and leisure activities. The attraction of people to coastal zones is contributing to an intense and continuous urbanization of these areas, while the ecosystems are threatened by the increase of natural extreme weather events (e.g., intensity and duration of storms, floods), which interfere with local wave climate and changes in morphological beach characteristics. Protection of coastal zones predisposed to coastline recession, due to the action of high tides, high sediment transport deficit, and high wave energy, may involve various coastal structures to reduce or at least to mitigate coastal erosion problems. Many of the current coastal protections (notably groins, seawalls, and emerged breakwaters) were built with a single purpose, which was to protect at all costs without environmental or economic concerns, especially maintenance costs, or the negative consequences that such structures could cause up to considerable distances along the coast. The current concept of integrated coastal zone management presupposes studies involving other types of concerns and more actors in the decision-making process for the implementation of coastal works. In this context, multifunctional structures emerge and are increasingly frequent, such as the so-called multifunctional artificial reefs (MFARs), with the aim of improving leisure, fishing, diving, and other sporting activities, in addition to coastal protection. MFARs are in fact one of the latest concepts for coastal protection. Behind the search for more efficient and sustainable strategies to deal with coastal retreat, this study focused on a comparison between the performance of two traditional coastal protection solutions (submerged detached breakwater and emerged detached breakwater) and an MFAR on a particular coastal stretch. In order to analyse the hydro- (wave height and wave energy dissipation) and morphodynamics (sediment accumulation and erosion areas, and bed level) of the structures and beach interactions, two numerical models were used: SWAN (Simulation WAves Nearshore) for hydrodynamics and XBeach for hydrodynamics and morphodynamics. In addition, a comparison between SWAN and XBeach hydrodynamic results was also performed. From the simulations conducted by SWAN and XBeach, it can be concluded that amongst all structures, the emerged detached breakwater was the most efficient in reducing significant wave heights at a larger scale due to the fact that it constituted a higher obstacle to the incoming waves, and that, regarding both submerged structures (detached breakwater and the MFAR), the MFAR presented a more substantial shadow zone. Regarding morphodynamics, the obtained results presented favourable tendencies to sediment accretion near the shoreline, as well as at the inward areas for the three structures, especially for the emerged detached breakwater and for the MFAR in both wave directions. However, for the west wave direction, along the shoreline, substantial erosion was observed for both structures with more noticeable values for the emerged detached breakwater. For all the northwest wave direction scenarios, no noticeable erosion areas were visible along the shoreline. Overall, considering the balance of erosion and accretion rates, it can be concluded that for both wave predominance, the submerged detached breakwater and the MFAR presented better solutions regarding morphodynamics. The MFAR storm wave condition performed in XBeach indicated substantial erosion areas located around the structure, which added substantial changes in the bed level.

1. Introduction

In the past, coastal engineering was essentially based on empirical approaches and physical concepts of the hydrodynamic and morphodynamic processes involved [1]. In general, coastal interventions were based on structural projects without public consultation, and without a sound assessment of their environmental impact [1,2].
The need and urgency of such projects were a consequence of the large sedimentary deficits that occurred mainly as a result of activities in the river systems, notably, the increase in dam construction after World War II [3]. This has led to a large reduction of beaches in coastal areas and the destruction of many natural protections such as dunes [3]. With the ongoing climate change, the vulnerability coastal zones has increased and, according to most forecasts, will tend to worsen further from the middle of the current century [1].
By preventing the normal course of sediment along the coast, these projects have also caused erosion and land loss at considerable distances from the installation site [4]. Additionally, by allowing urban expansions in marginal areas, often over dune fields, they contributed to negative consequences locally [2,5].
Indeed, demand for coastal areas has been increasing, which is reflected in more population, more construction, more services, more pollution, more natural and marine resource needs, and greater pressure on ecosystems [6,7,8,9]. All this hinders the sustainability of coastal zones. This population growth is evident on some coasts of the Mediterranean, as noted by the European Environment Agency for the coastal zones of Spain, France, and Italy [10].
In fact, predictions provided by the Intergovernmental Panel on Climate Change (IPCC) point out that global climate change may contribute to sea level rise, and, in some regions, to the increase in the occurrence and magnitude of storms [11]. Addressing the outcomes of sea level rise will involve appropriate reactions for minimizing impacts [12,13]. Facing this threat and reversing the increasing degradation and vulnerability of coastal zones can only be achieved through the involvement of local communities and regular and properly planned interventions in accordance with the best-integrated coastal management rules.
Aiming to preserve coastal dunes and properly stabilize the coastal foundation in an environmentally friendly and aesthetically pleasing manner, a strategy based on the use of artificial nourishments, possibly supplemented with other (usually soft) protection measures to prevent sand loss, is strongly recommended [2].
The negative impacts of traditional hard structures have been a serious problem observable on shorelines around the world. Indeed, the potential advantages of these structures locally are often reduced in the face of the negative effects felt on many coasts around the world [14,15,16,17]. Among the main adverse effects of hard protections are aggravation of erosion downdrift, disturbance of sediment supply and beach reduction, and adverse visual impacts [18,19]. These effects urge the need to consider more adequate and successful solutions to control coastal erosion problems.
Protection of coastal zones predisposed to coastline recession due to the action of high tides, high sediment transport deficit, and high wave energy, may involve various coastal structures to reduce or at least to mitigate coastal erosion problems. Hard emerging protections such as breakwaters, groins, and seawalls provide direct protection, whereas hard submerged structures, such as artificial reefs, provide indirect protection by reducing the hydrodynamic loads and maintaining the dynamic shore balance. Indeed, regarding coastal protection, submerged structures are in general less efficacious than emerged structures. However, it is important to highlight that the implementation of coastal protection structures do not eliminate sea action hazards, and can only locally decrease them. For this reason, these approaches should not be imprudently considered for construction in dangerous areas.
Wave transmission can be controlled, considering the following factors: structure slope, crest height and width, wave height and period, tidal level, core, and armour material (permeability and roughness). The higher the wave transmission, the less intense the diffraction phenomenon and the accretion by the transmitted waves into the shadow zone. For this reason, for submerged detached structure design, the consideration of a transmission coefficient is of paramount importance [20].
A type of submerged structure that can prevent coastal erosion and increase beach stability, whether or not combined with sand nourishment, is a multifunctional artificial reef (MFAR).
Another developing new concept of coastal protection that has been recently demonstrated to protect coastal areas against erosion and flooding are the wave energy farms. This strategy consists of arrays of wave energy converters (WECs) with a dual function of carbon-free energy generation and coastal erosion protection. This approach has been tested on the Playa Granada (Spain) using numerical modelling (SWAN and XBeach-G) [21], and has demonstrated that wave farms can reduce significant wave heights and wave run-up on the coast down to 18% and 11%, respectively, which resulted in a beach erosion reduction of 45%.
According to [22], about 70% of submerged structures built for beach protection to date have resulted in net shoreline erosion. Recognizing that the existing knowledge on the shoreline response to MFAR is not sufficient, the study carried out by [22] also analysed the influence of several characteristic parameters.
In an attempt to address the knowledge gap of shoreline response to submerged structures, the study in [23] quantified the shape and dimensions of some features of natural reefs by visual inspection of aerial photographs. The study concluded that if all parameters (structure dimensions, distance from the shoreline to structure, wave climate, etc.) were the same, a larger salient would develop in the lee of a submerged structure than in the lee of an emerged structure.
However, a subsequent review conducted by [24] showed that the approach used by [23] incorporated several shortcomings. According to [22], the main mode of shoreline response to submerged structures can range from erosive to accretive, depending on the distance from the structure to the shoreline. This same conclusion was obtained by [25,26], using COULWAVE numerical model on Leirosa beach, as shown in Figure 1a (case of accretion—convergent vectors), using the currents (the structure-induced circulation pattern) as an indication of the shoreline response. Figure 1b illustrates Leirosa location in Portugal.
It was also identified that the incidence angle of the predominant wave and the crest level of the structure have implications for the magnitude of the shoreline response.
The analyses carried out also provided a useful empirical relationship to evaluate the shoreline response to submerged structures. Such relationship can suggest shoreline accretion if Sa/SZW > 1.5, where SZW is the width of the natural surf zone and Sa is the distance between the apex of the structure and the undisturbed coastline [22], as shown in Figure 2.
The hydrodynamic processes that govern the development of nearshore circulation patterns around relatively simple delta-form of MFARs are explained in [22], using appropriate modules from the MIKE 21 model suite, and are also shown in [25,26] using the Boussinesq-type COULWAVE model [27].
This case study had a clear objective of simultaneously contribute to the protection of a sand dune system, and an intent to improve the environmental characteristics of an area with excellent bathing characteristics, as well as for the practice of water sports.
Behind the search for more efficient and sustainable strategies to deal with coastal retreat, this study focused on an innovative approach through a comparison between the performance of two traditional coastal protection solutions (submerged detached breakwater and emerged detached breakwater) and an MFAR on a particular coastal stretch. This innovative approach included a comparative study on the behaviours and efficiencies of the three protection structures tested using two different numerical models. In order to analyse the hydro- (wave height and wave energy dissipation) and morphodynamics (accretion and erosion areas) of the structures and beach interactions, two numerical models were used: SWAN (Simulation WAves Nearshore) [28] for hydrodynamics and XBeach [29] for hydrodynamics and morphodynamics. These programs were included in a hydroinformatic environment that facilitated model implementation [30]. In addition, a comparison between SWAN and XBeach hydrodynamic results was also performed, using SWAN for each one of the three assessed structures and XBeach for the same three solutions.
The following sections describe: the characterization of the study area (Section 2), materials and methods (Section 3), results (Section 4), discussion (Section 5), and conclusions (Section 6) of this research work.

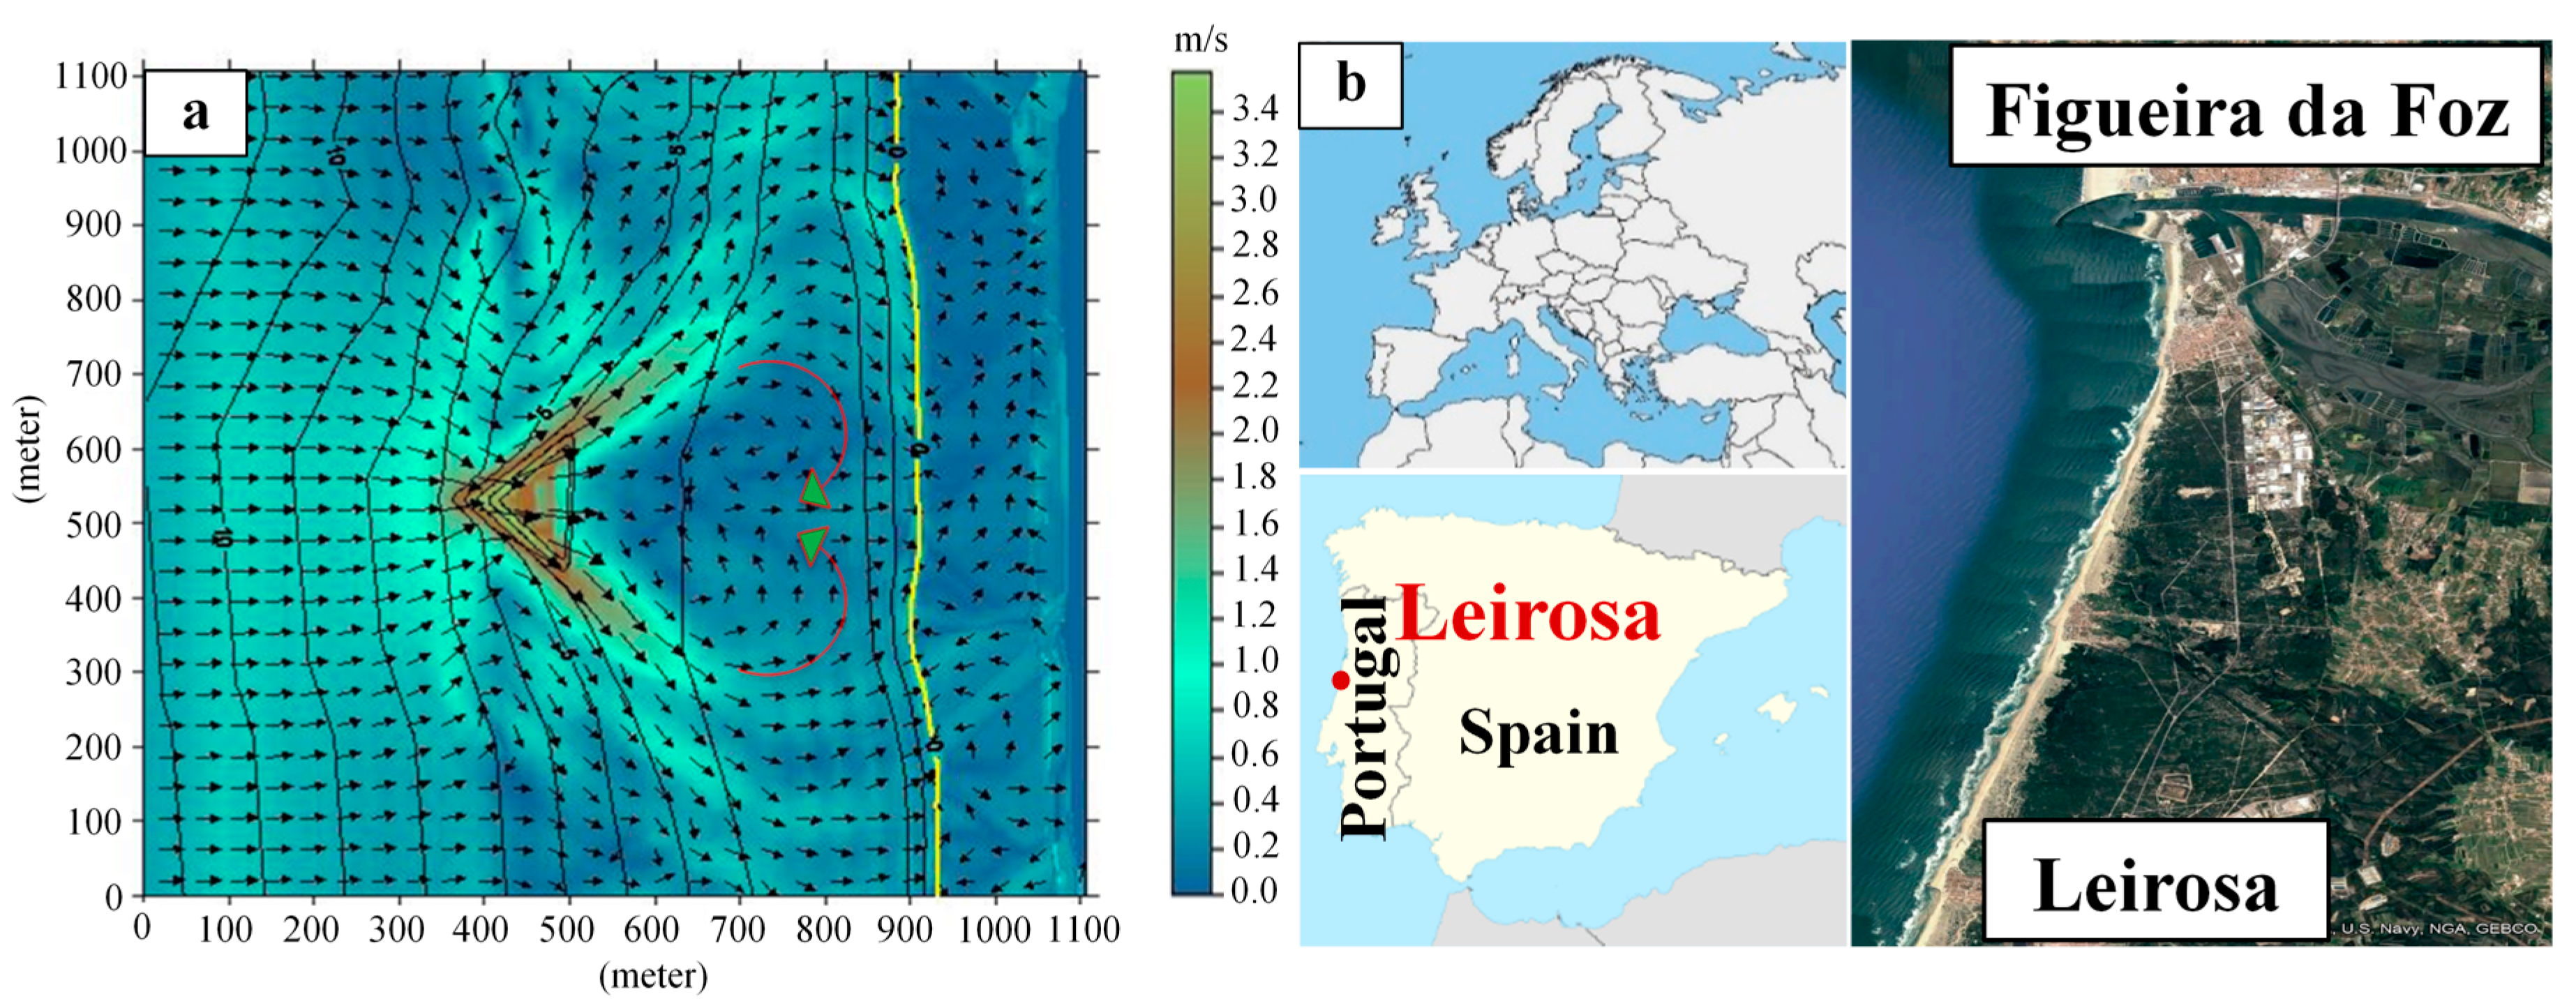
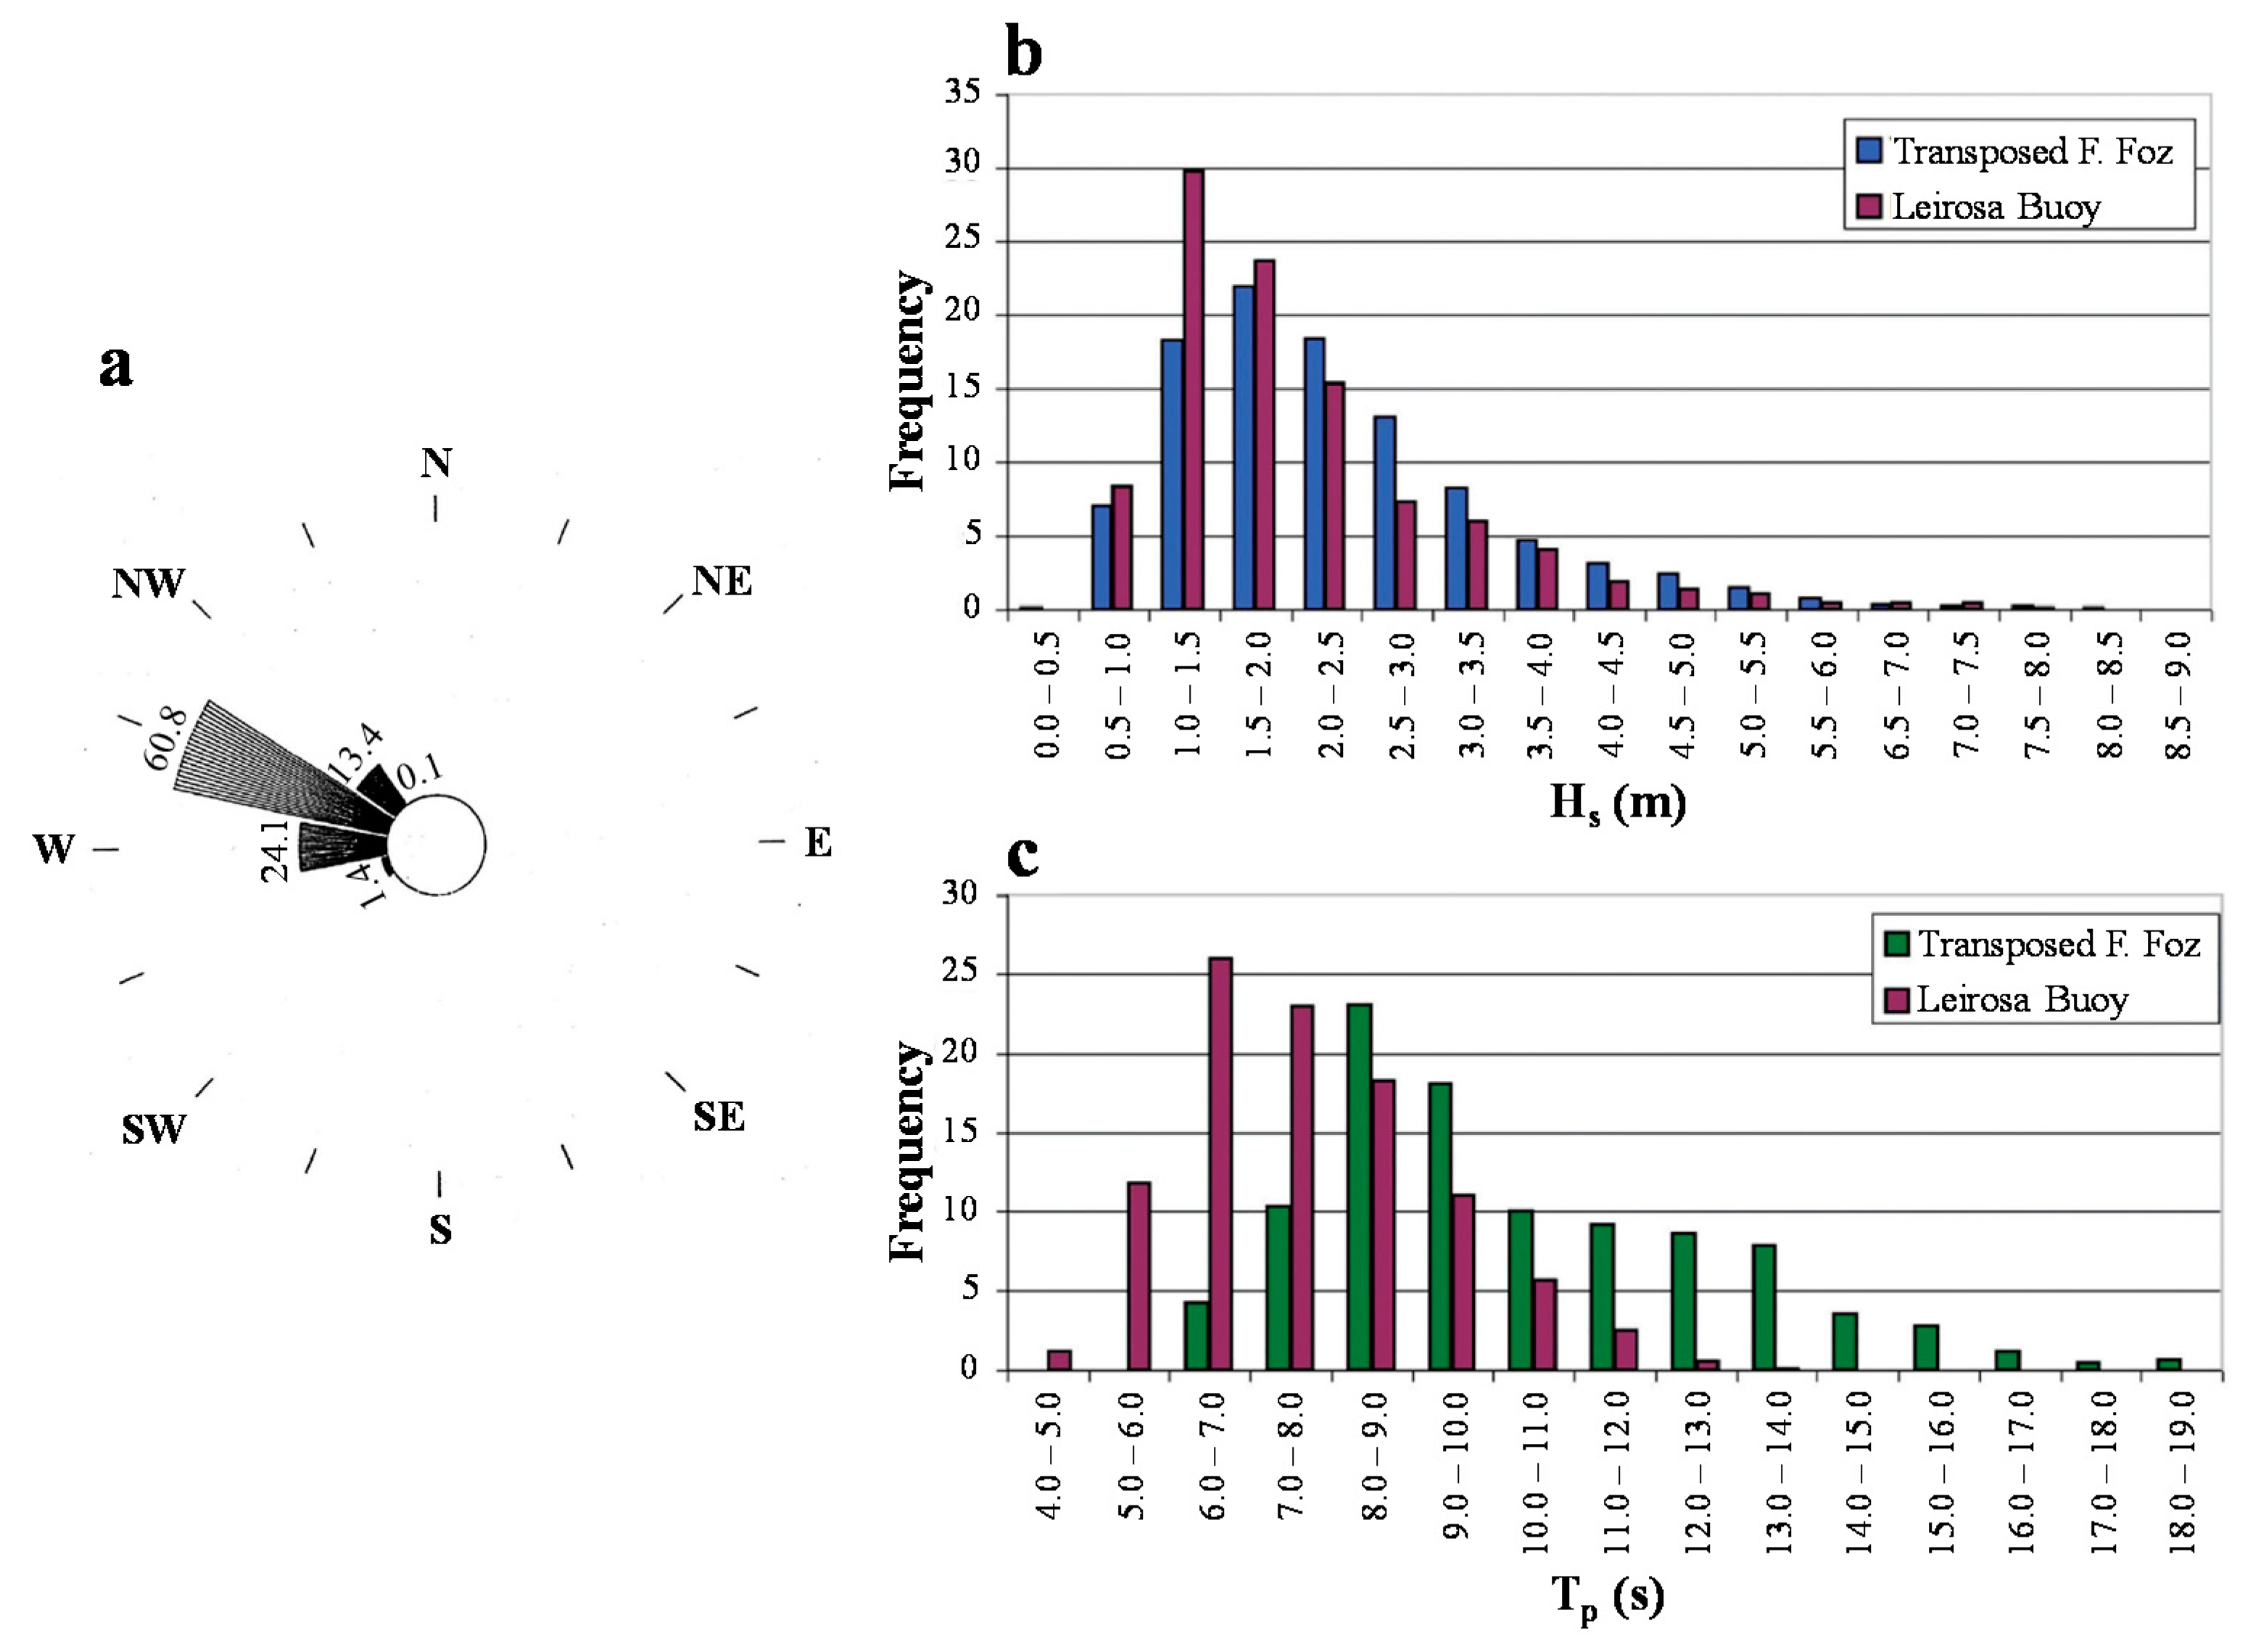
2. Characterization of the Study Area

The application of SWAN and XBeach models to study the influence of three different structures on a specific coastal stretch regarding hydrodynamic and morphodynamic analyses was driven using Leirosa’s beach bathymetry. Leirosa (40.0561° N, 8.8874° W) is located in the Coimbra district, south of Figueira da Foz, on the west coast of Portugal (as previously presented in Figure 1b). The selected area is justified by the fact that, according to [4], Leirosa’s beach is affected by notable erosion due to sediment retention at the north as a consequence of the Figueira da Foz port, and also due to the decreasing sediment deposition caused by Mondego river interventions. The authors of [4] stated that, during the 1970s, the construction of the jetties in the Mondego estuary triggered major erosion problems that were later mitigated by the construction of groins along the coast, southwards Figueira da Foz, and by sand nourishment dredged from the Figueira da Foz port, in order to protect urban population and the Leirosa beach.
Several technologies on Leirosa beach have been locally used over the past two decades (namely, the reconstruction/rehabilitation of the dune system with local sand and adequate vegetation), and the installation of geotubes for dune strengthening and protection [1,2,4]. After the occurrence of several storms, it was concluded that the methodology followed was not sufficiently resistant to protect an existing industrial plant in the vicinity and a village (Leirosa) [2,25,26]. Thus, a complementary reinforcement methodology was developed, which consisted of inducing the waves to break in an area sufficiently far from the dune system, and consequently preventing the waves from breaking on the emerged beach or even at the base of the dune system [1,2,25,26].
The Leirosa coastal area is geologically defined by dune systems of about 1800 m in length, extensive emerged and submerged beaches with slopes of about 1%, and essentially consisting of medium-fine white grain sands [31,32]. Thus, Leirosa beach counts with soft protection from dunes stabilized with Ammophila arenaria vegetation, which is characterized by being the most appropriate and most used species in revegetation due to its complex roots [4]. Regarding wave climate conditions, a study conducted by [26] indicates that (a) significant wave heights at the Leirosa beach vary from 0 m to 8.5 m, (b) average wave periods vary from 4 s to 12 s, and (c) wave angles vary from 275° to 325°. Most occurrences for (a) significant wave heights occurred in the (1.0–1.5) m and (1.5–2.0) m classes, (b) average wave periods were found between 5 to 10 s, and (c) wave angles were found between 295° to 310°, as presented in Figure 3.
To support decision-making, taking into account the characteristics and efficiencies of a possible structure to be installed, several numerical studies were carried out considering the three options analysed and discussed in this work. The local bathymetry was based on data mentioned in [25].

3. Materials and Methods

3.1. SWAN and XBeach Numerical Models

SWAN [28] can be used as a stand-alone application, but it is also included in the Delft3D 4 Suite [33]. SWAN is a spectral wave model that follows the wave action balance equation and that can be used to compute wave propagation from deep waters to the transition zone of coastal areas. Although the SWAN model does not calculate wave-induced currents, the model considers a great variety of physical phenomena, such as diffraction, refraction, shoaling, current interaction, wave breaking due to excess slope, wind waves, and wave transmission through obstacles. However, Delft3D-SWAN has the capability of simulating wave-induced currents. The implementation of the SWAN numerical model requires bathymetry of the study area and wave conditions at the boundaries. Amongst other results, SWAN provides results for significant wave heights (Hs), peak and mean time periods (T), peak and mean directions, and level of water anywhere in the computational domain [34]. From an efficiency point of view, SWAN should not be used on ocean scales nor in shallow waters, as it should be limited to deep and transitional waters.
XBeach [29] numerical model is used for the computation of 2D horizontal nearshore hydrodynamics due to wave propagation by simultaneously solving several equations: the roller energy equations, the nonlinear shallow water equations (NSWE) of mass and momentum, the short wave action balance, and the sediment transport and bed change equations. The model includes surf-beat (long period waves), average flow, and wave-induced currents in combination with non-cohesive sediment transports, overwash (wave uprush over a natural or artificial coastal barrier), scour around hard structures, and beach and dune morphological changes during storm events. The required XBeach boundary conditions are bathymetry, wave conditions, and tidal levels [35]. Users are allowed to choose which mode options to implement: (a) Stationary wave mode, where the wave heights of the incident waves are quite small and infragravity waves are neglected. This mode computes physical processes such as wave propagation, refraction, shoaling, wave breaking, and the roller model [36]; (b) Surf-beat mode (instationary), when the main process is the swash zone rather than the wave setup (characterized by the increasing of mean water level due to breaking waves) and currents. This mode includes the following processes: longshore currents, rip currents, infragravity waves, and swash and backwash. The diffraction phenomenon is neglected on this mode [36]; and (c) Non-hydrostatic mode (wave-resolving), where a combination of the NSWE with a pressure correction term is considered, which allows for modelling of propagation and decay of the individual waves. Moreover, processes such as the short wave run-up and overtopping are incorporated, which is an important phenomenon on steep slopes. The wave-resolving mode is adequate when diffraction is a relevant process. Despite the advantages mentioned, simulations on the wave-resolving mode are computationally more demanding than the surf-beat mode, as it requires a more substantial spatial resolution and smaller time steps [36]. At each time step, the XBeach model considers feedback between the bathymetry and the hydrodynamics.

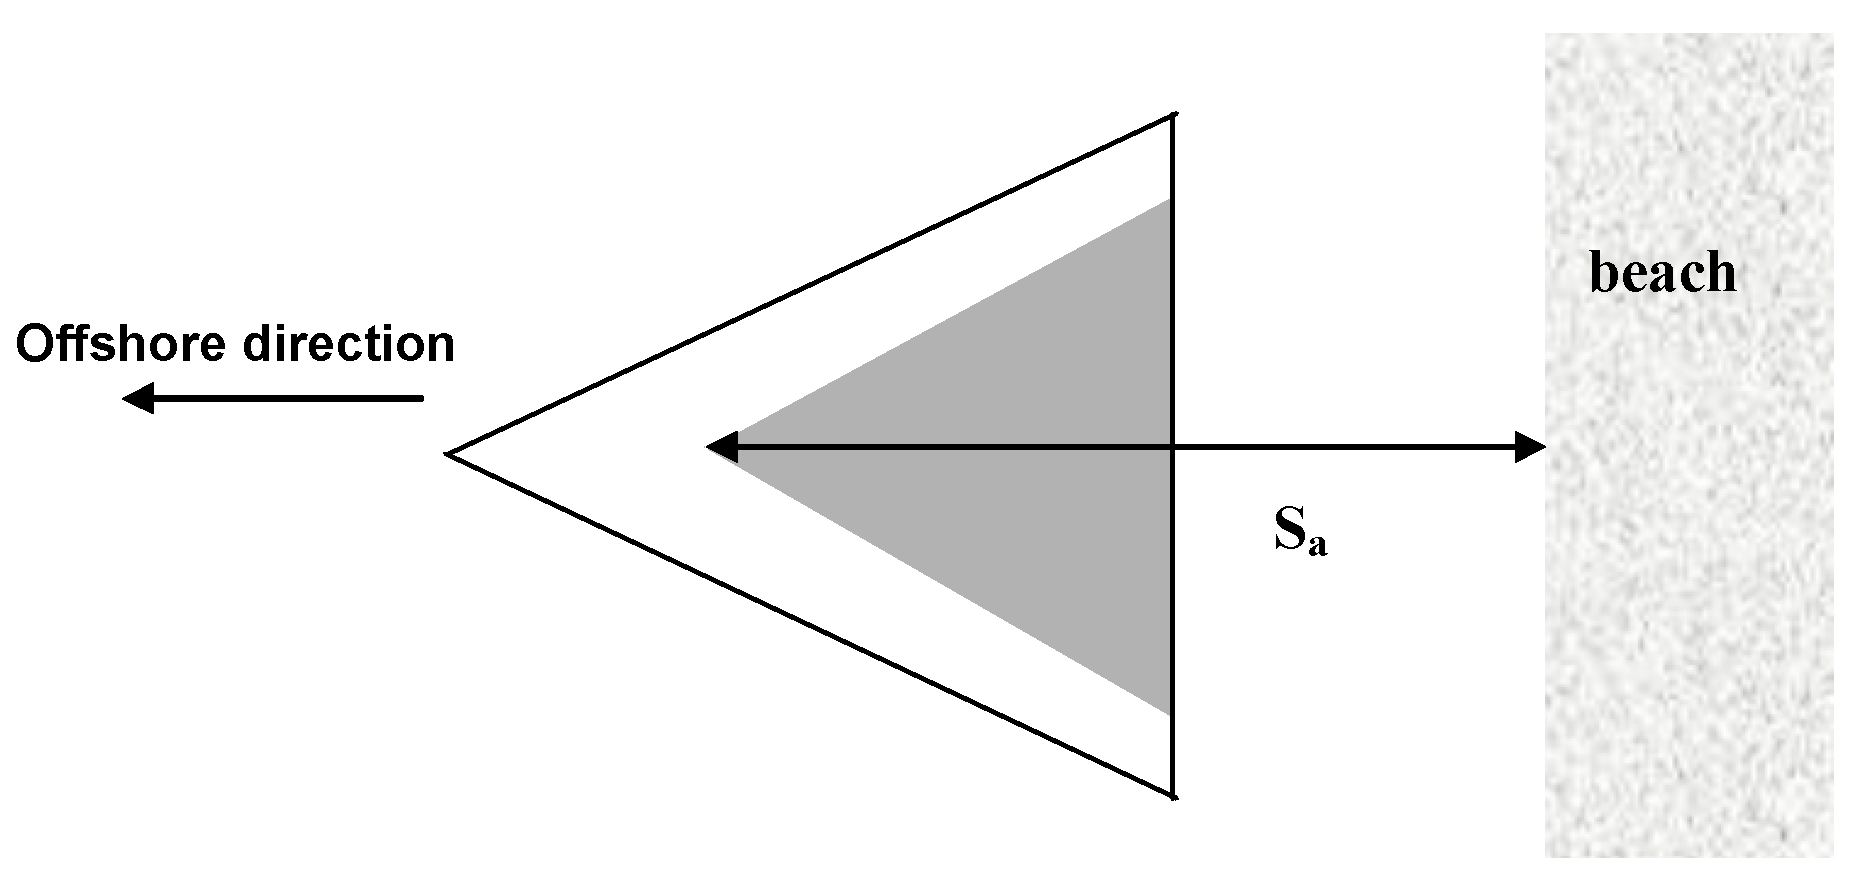
3.2. Simulated Scenarios

For this study, three different geometries for coastal protection structures were analysed. For a deeper understanding on the performance of an MFAR, the impact of this structure on a coastal zone was compared with a submerged detached breakwater (Figure 4a) and an emerged detached breakwater (Figure 4b). The case study developed by [25,26] was taken as reference for the MFAR modelling that resembles a triangular prism (Figure 4c), where the structure performance was conducted, considering “surfability” and coastal protection. On the basis of published and duly referenced data, the scenarios often considered in projects of this type were identified as frequent and typical storm conditions. The studies in [25,26] analysed the performance of two MFAR differing in their opening angles (45° and 66°) for two different incident wave conditions (frequent wave: Hs = 1.5 m, T = 9 s; and storm wave: Hs = 4 m, T = 15 s) and concluded that both geometries contribute to sedimentation by convergent velocity vectors observation near the shoreline.
For the current study, the analysis focused on coastal protection purposes, and it considered the structure geometry of 45° opening angle due to its wider shadow zone benefits for coastal protection. As geometrical considerations, all structures shared the same length (250 m). The detached breakwater design considered a crest width of 10 m and side-slopes of 1:2, which were representative of regular structures of this type as presented in [37]. The MFAR followed the design proposed by [25,26], which considered a crest width of 75 m and side slopes of 1:10. The submerged detached breakwater and the MFAR had their crests submerged at -1.5 m, and the emerged detached breakwater had its crest emerged at 1.0 m relative to mean sea level (MSL). All three structures were located at the same distance from the shoreline (440 m).
In order to study the influence of the structure on significant wave height attenuation and sediment accumulation, a realistic bathymetry was used for the model simulations, which was based on [25,26]. Regarding model conditions, the computational domain was 1670 m × 1870 m (crosshore×longshore) with a node spacing of dx= dy =5.0 m for both hydro-and morphodynamic analyses. Simulations considering other grid cell sizes were tested, as in the followed reference study. The selected grid cell size of 5 m was adequate considering the simulated area, the structure dimensions, and the confirmation that the obtained results were independent of the grid cell size. The total simulation time was 2 hours for the hydrodynamic analysis (using SWAN and XBeach) and 75 days for morphodynamics (XBeach) with a morphological acceleration factor (morfac) of 100. According to a study by [38], it was concluded that the necessary simulation time for morphodynamics (in days), in order to study the morphological development process of a substantial salient due to a detached breakwater placed 500 m away from the shoreline, was 75 days with a morfac equal to 100 (approximately 20 years).
The researchers in [38] developed a study where the XBeach model was used to analyse salient and tombolo formations for different detached breakwater conditions. In order to ensure the adequate models’ conditions and proceed with the morphodynamic analysis for this study, we developed a replication of the research work of [38] (presented in Figure A1 in the Appendix A section). The model considered for replication was a detached breakwater 300 m long and 20 m wide, placed 500 m away from the shoreline, on an essentially constant bathymetry slope of 1:50. The structure was emerged with a crest height of 1 m (above MSL). As [38] research work successfully formed a substantial salient at the inward side of the structure for a 20 year forecast; the same model parameters considered in the authors study (model simulation time, Chèzy parameter (surface roughness), directional energy distribution (dtheta), and morfac value), were implemented for this case.
For hydrodynamics (using SWAN and XBeach), the frequent wave scenario was analysed for all structures in order to give insights on the response to a mean wave climate with waves incoming from the west (270°) and northwest (315°) directions, whereas the tide level considered was 0 m relatively to the MSL (tidal influence not considered in the simulations). For morphodynamic analysis (using XBeach), the frequent wave scenario was also analysed for incoming waves from the west (270°) and northwest (315°) directions. An extra analysis was also developed with SWAN and XBeach models for a storm wave condition with the west direction (only for MFAR due to its innovative shape). Regarding seabed composition, the sediment dimensions considered were 200 µm for D50 and 300 µm for D90. D50 and D90 are common metrics used to describe particle size distributions. In this case, D50 meant that 50% of the sample had a size of 200 µm or smaller, and D90 meant that 90% had a size of 300 µm or smaller. Boundary conditions for SWAN model (hydrodynamics) were defined for north, west, and south boundaries; for frequent wave condition in all scenarios; and storm wave condition for one scenario. Boundary conditions for XBeach model (hydrodynamics and morphodynamics) were defined as absorbing–generating (weakly-reflective) boundary in 2D (abs_2d) for front and back boundaries, and wall boundary condition (simple no flux boundary condition) for left and right boundaries were defined. In XBeach model, the left and right designations correspond to north and south, whereas front and back correspond to west and east.
For hydrodynamics (SWAN and XBeach), the wave type considered was a JONSWAP spectrum, whereas the stationary mode was selected for morphodynamics (XBeach). The consideration of stationary mode was justified by the need to reduce model calculation time for morphodynamics. A morphological acceleration factor to hasten the morphological period in relation to the hydrodynamics (morfac) was also considered. The numerical model results obtained by the SWAN model were the significant wave heights and their mean directions, whereas XBeach model computed root mean square wave heights (Hrms), and estimated the accretion and erosion near shoreline. In addition, bed level results were presented for the MFAR under the storm wave condition. In order to compare SWAN hydrodynamic results with XBeach model results, a Hrms to Hs conversion of the XBeach numerical results was required, according to Equation (1) [39]:
H s = 2 × H r m s
In addition, the wave energy dissipation also required separate calculations using the following equation (Equation (2)) [37,40]:
E = 1 8 ( ρ g H 2 )
where E is the wave energy per unit area (J/m2), ρ is the water density (kg/m3), g is the gravitational acceleration constant (m/s2), and H is the wave height (m). The wave energy was computed for all scenarios, considering ρ seawater = 1025 kg/m3 and g = 9.81 m/s2.
Summarised information regarding structures dimensions and extensive information concerning the input conditions for both SWAN and XBeach models are detailed in Table 1.

4. Results

The following sections present the key results of hydrodynamics and morphodynamics using SWAN and XBeach numerical models, as these results present an adequate clarification of the methodology developed without compromising the extension of this research work.

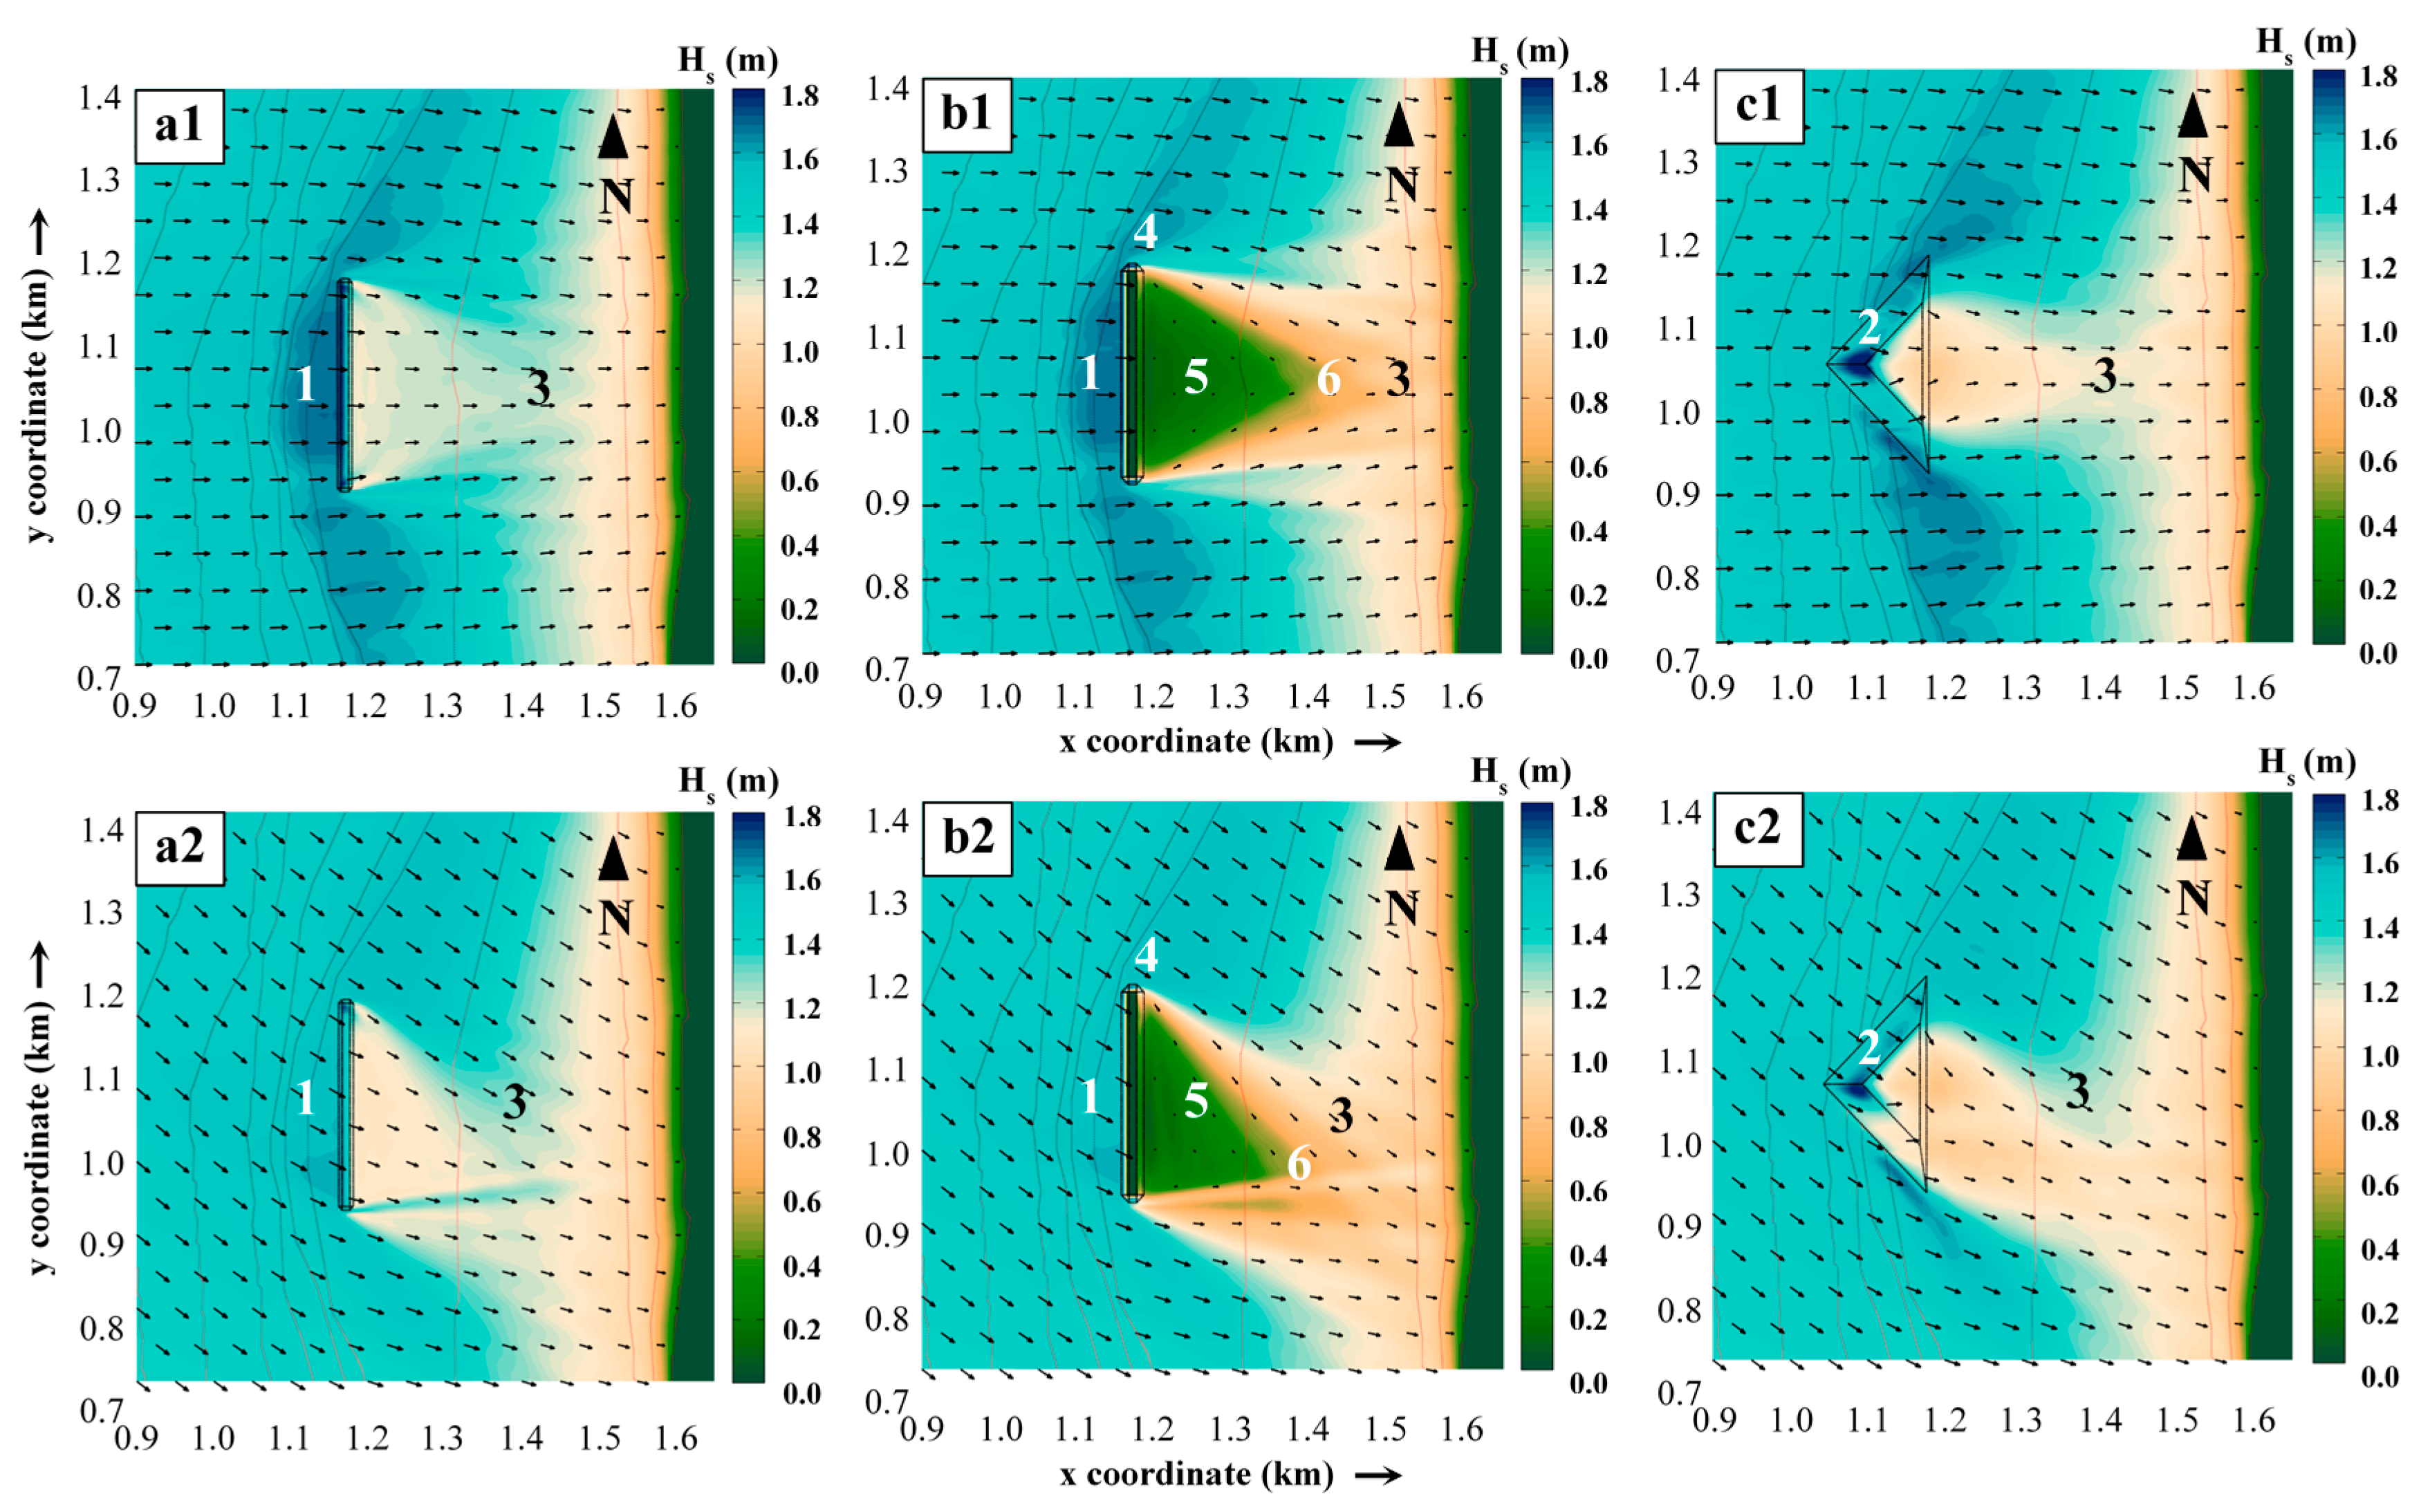
4.1. SWAN Hydrodynamics

Numerical simulations for the analysis of significant wave heights dissipation and their mean directions for a frequent wave condition was performed for each structure for the west wave direction: submerged detached breakwater (Figure 5a1), emerged detached breakwater (Figure 5b1), and MFAR (Figure 5c1); and for the northwest wave direction: submerged detached breakwater (Figure 5a2), emerged detached breakwater (Figure 5b2), and MFAR (Figure 5c2). For a more legible analysis, the SWAN results are centred in a limited window around the structures. The contour lines are also depicted in all results shown.

4.2. XBeach Hydrodynamics

The XBeach model for the analysis of significant wave height dissipation for a frequent wave condition was also used for each structure in the west wave direction: submerged detached breakwater (Figure 6a1), emerged detached breakwater (Figure 6b1), and MFAR (Figure 6c1); and for the northwest wave direction: submerged detached breakwater (Figure 6a2), emerged detached breakwater (Figure 6b2), and MFAR (Figure 6c2). XBeach post-processing does not allow for representation of wave mean direction with vectors. The presented XBeach results are cropped around the structures for a more legible analysis. The contour lines are also depicted in all results shown.

4.3. SWAN vs. XBeach Hydrodynamics
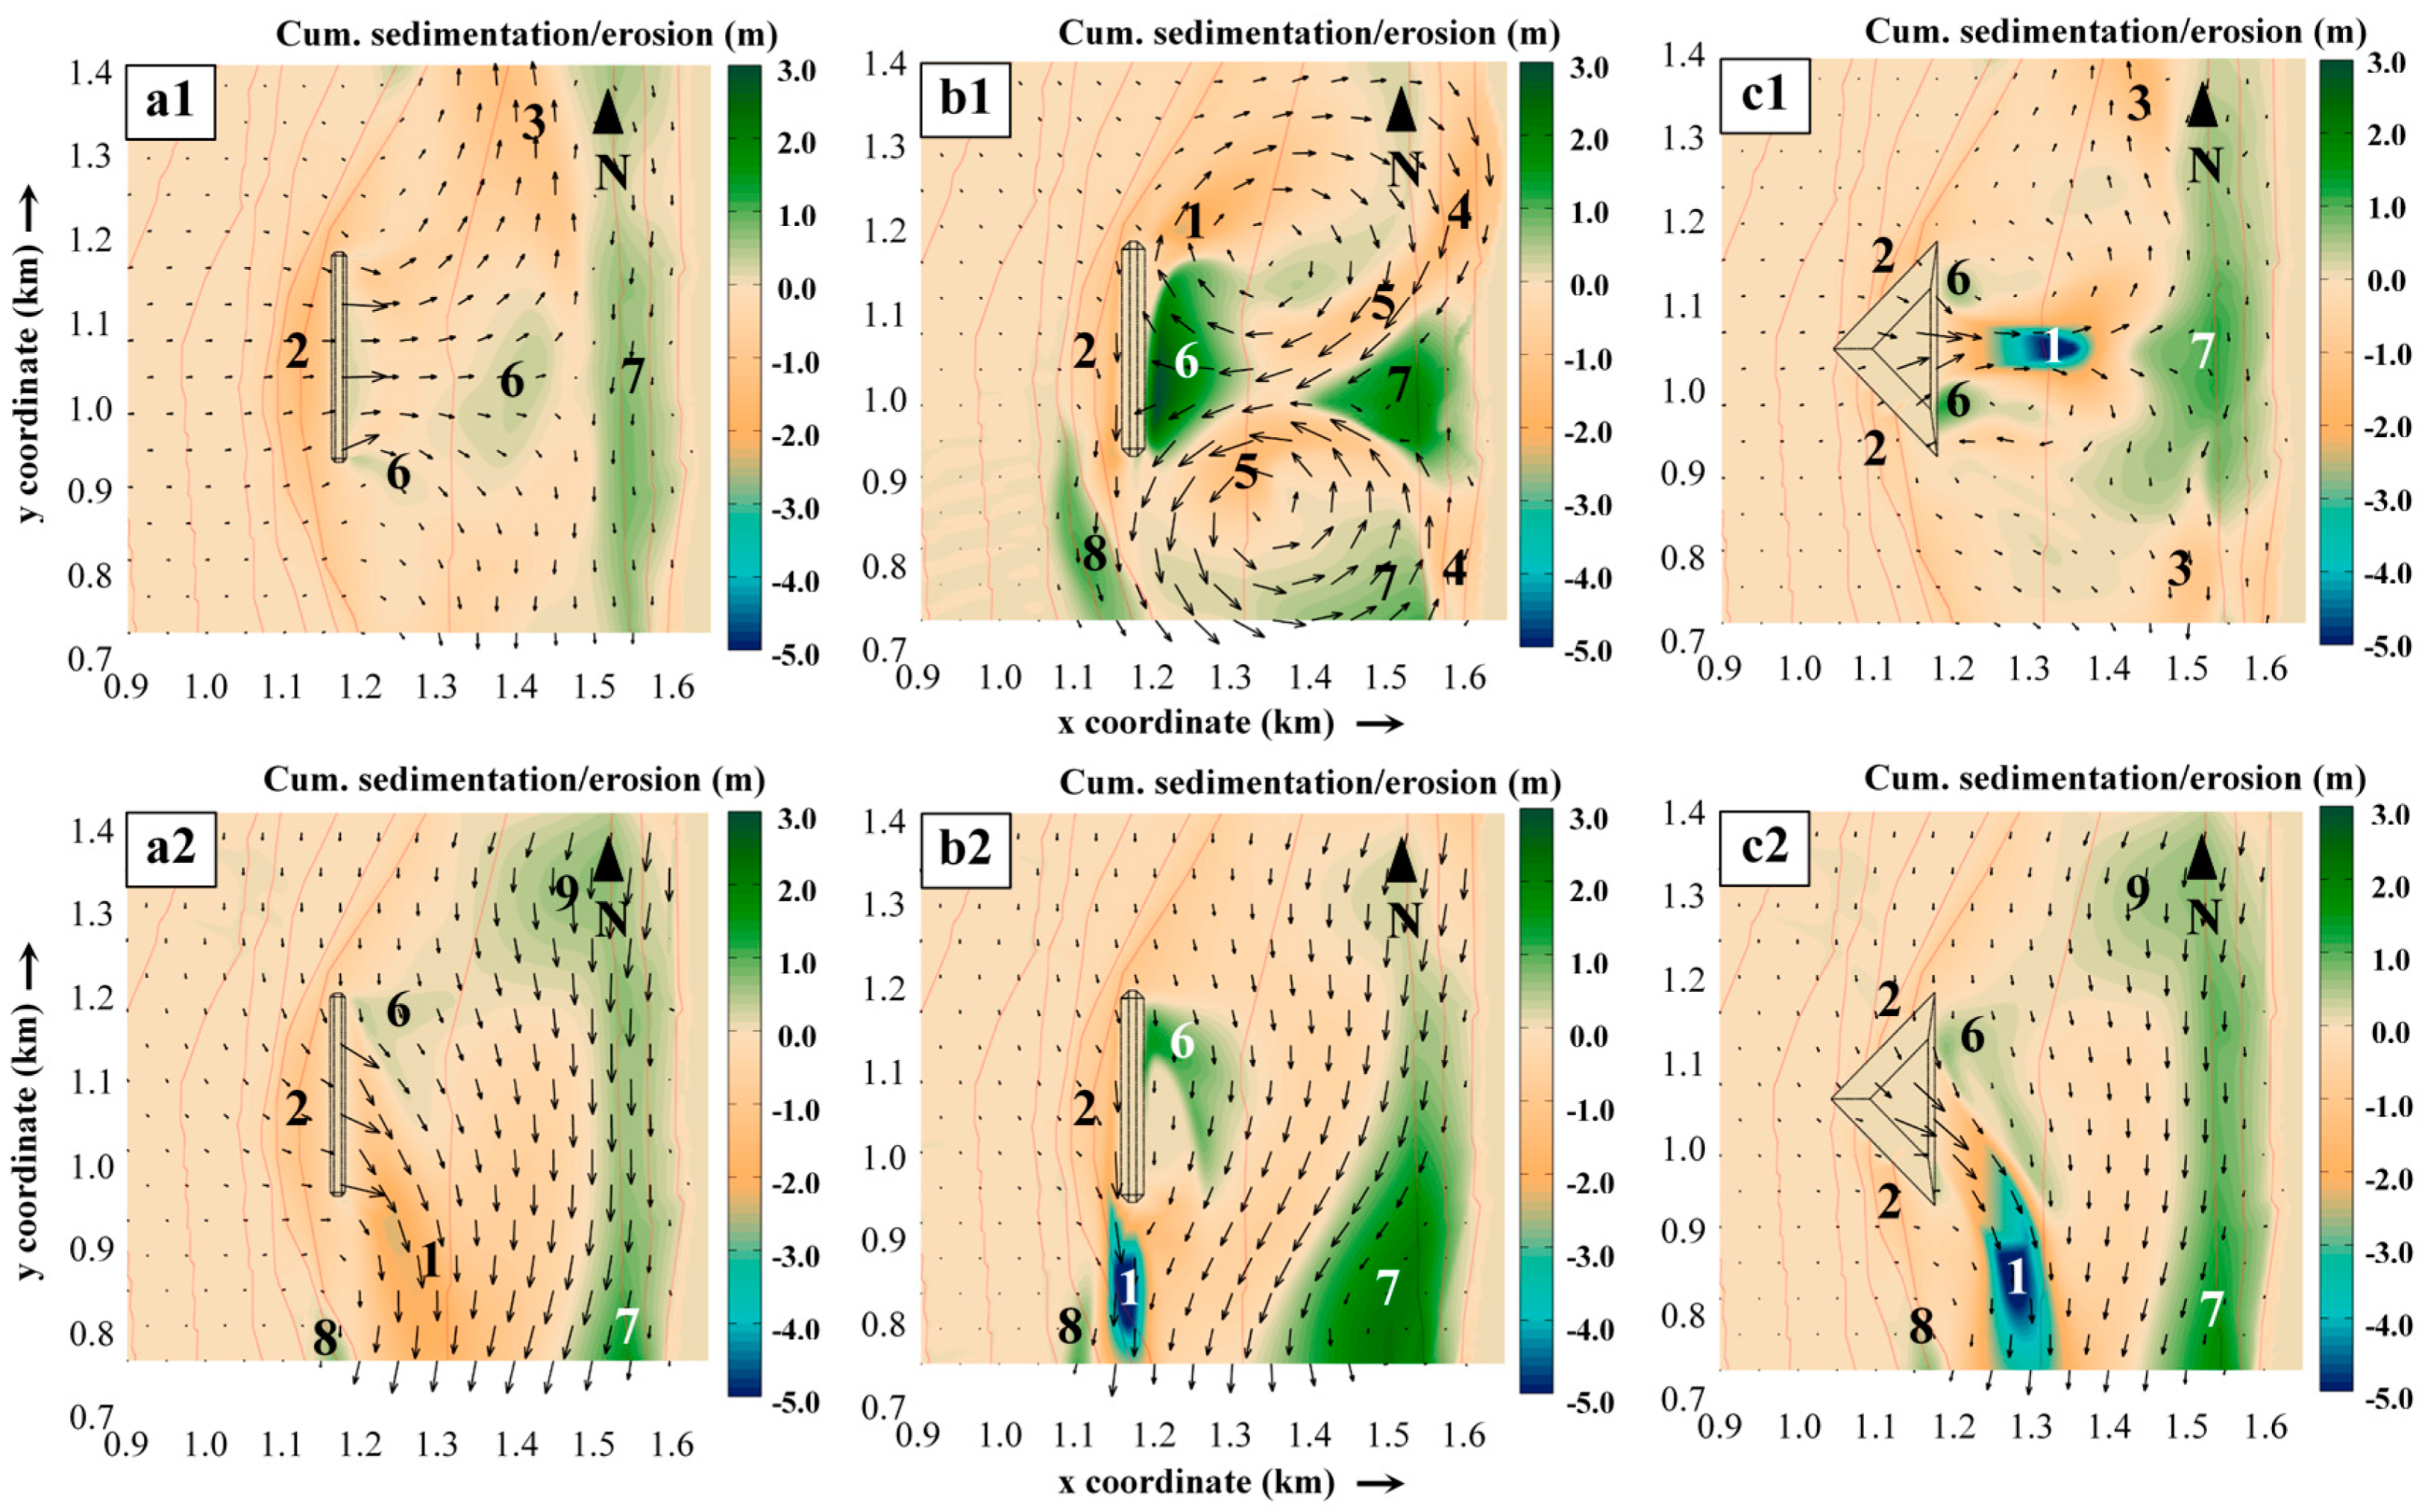
SWAN and XBeach are two powerful tools able to simulate hydrodynamic environments: SWAN for deep to transitional waters and XBeach for transitional and shallow waters. Because all actual coastal hydrodynamic models present limitations and simplified assumptions, it was decided that both numerical models would be used to increase the confidence in the obtained results. In order to understand their performance in this particular case, the plots depicted in Figure 7 show the similarities and differences between the significant wave height results for SWAN and XBeach for a cross-section in each structure. As the results of significant wave heights for the west and northwest wave direction were not substantially different in magnitude, only the west wave direction was analysed. The values shown in the plots were selected for four positions: before, immediately before, immediately after, and after the structures. The plotted vertical line represents a relevant seabed slope change.

4.4. Morphodynamics

One of the suggestions proposed by [25,26] was to study morphodynamics around the structure to enable a deeper understanding on sedimentation and erosion areas near the coast under the influence of an MFAR. In order to develop that study, the XBeach morphodynamic model was applied to each one of the structures.
Numerical simulations for the analysis of cumulative sedimentation and erosion were conducted for each shape: submerged detached breakwater (Figure 8a1,a2 for the west and northwest wave directions, respectively), emerged detached breakwater (Figure 8b1,b2 for the west and northwest wave directions, respectively), and MFAR (Figure 8c1,c2 for the west and northwest wave directions, respectively). In Figure 8, more intense wave velocities indicate erosion areas, whereas less intense wave velocities indicate sediment accumulation. The study was performed for 75 days with a morfac of 100, which insights results for 20 years. The simulations were taken for a frequent wave condition and the results presented were cropped for a more legible analysis.

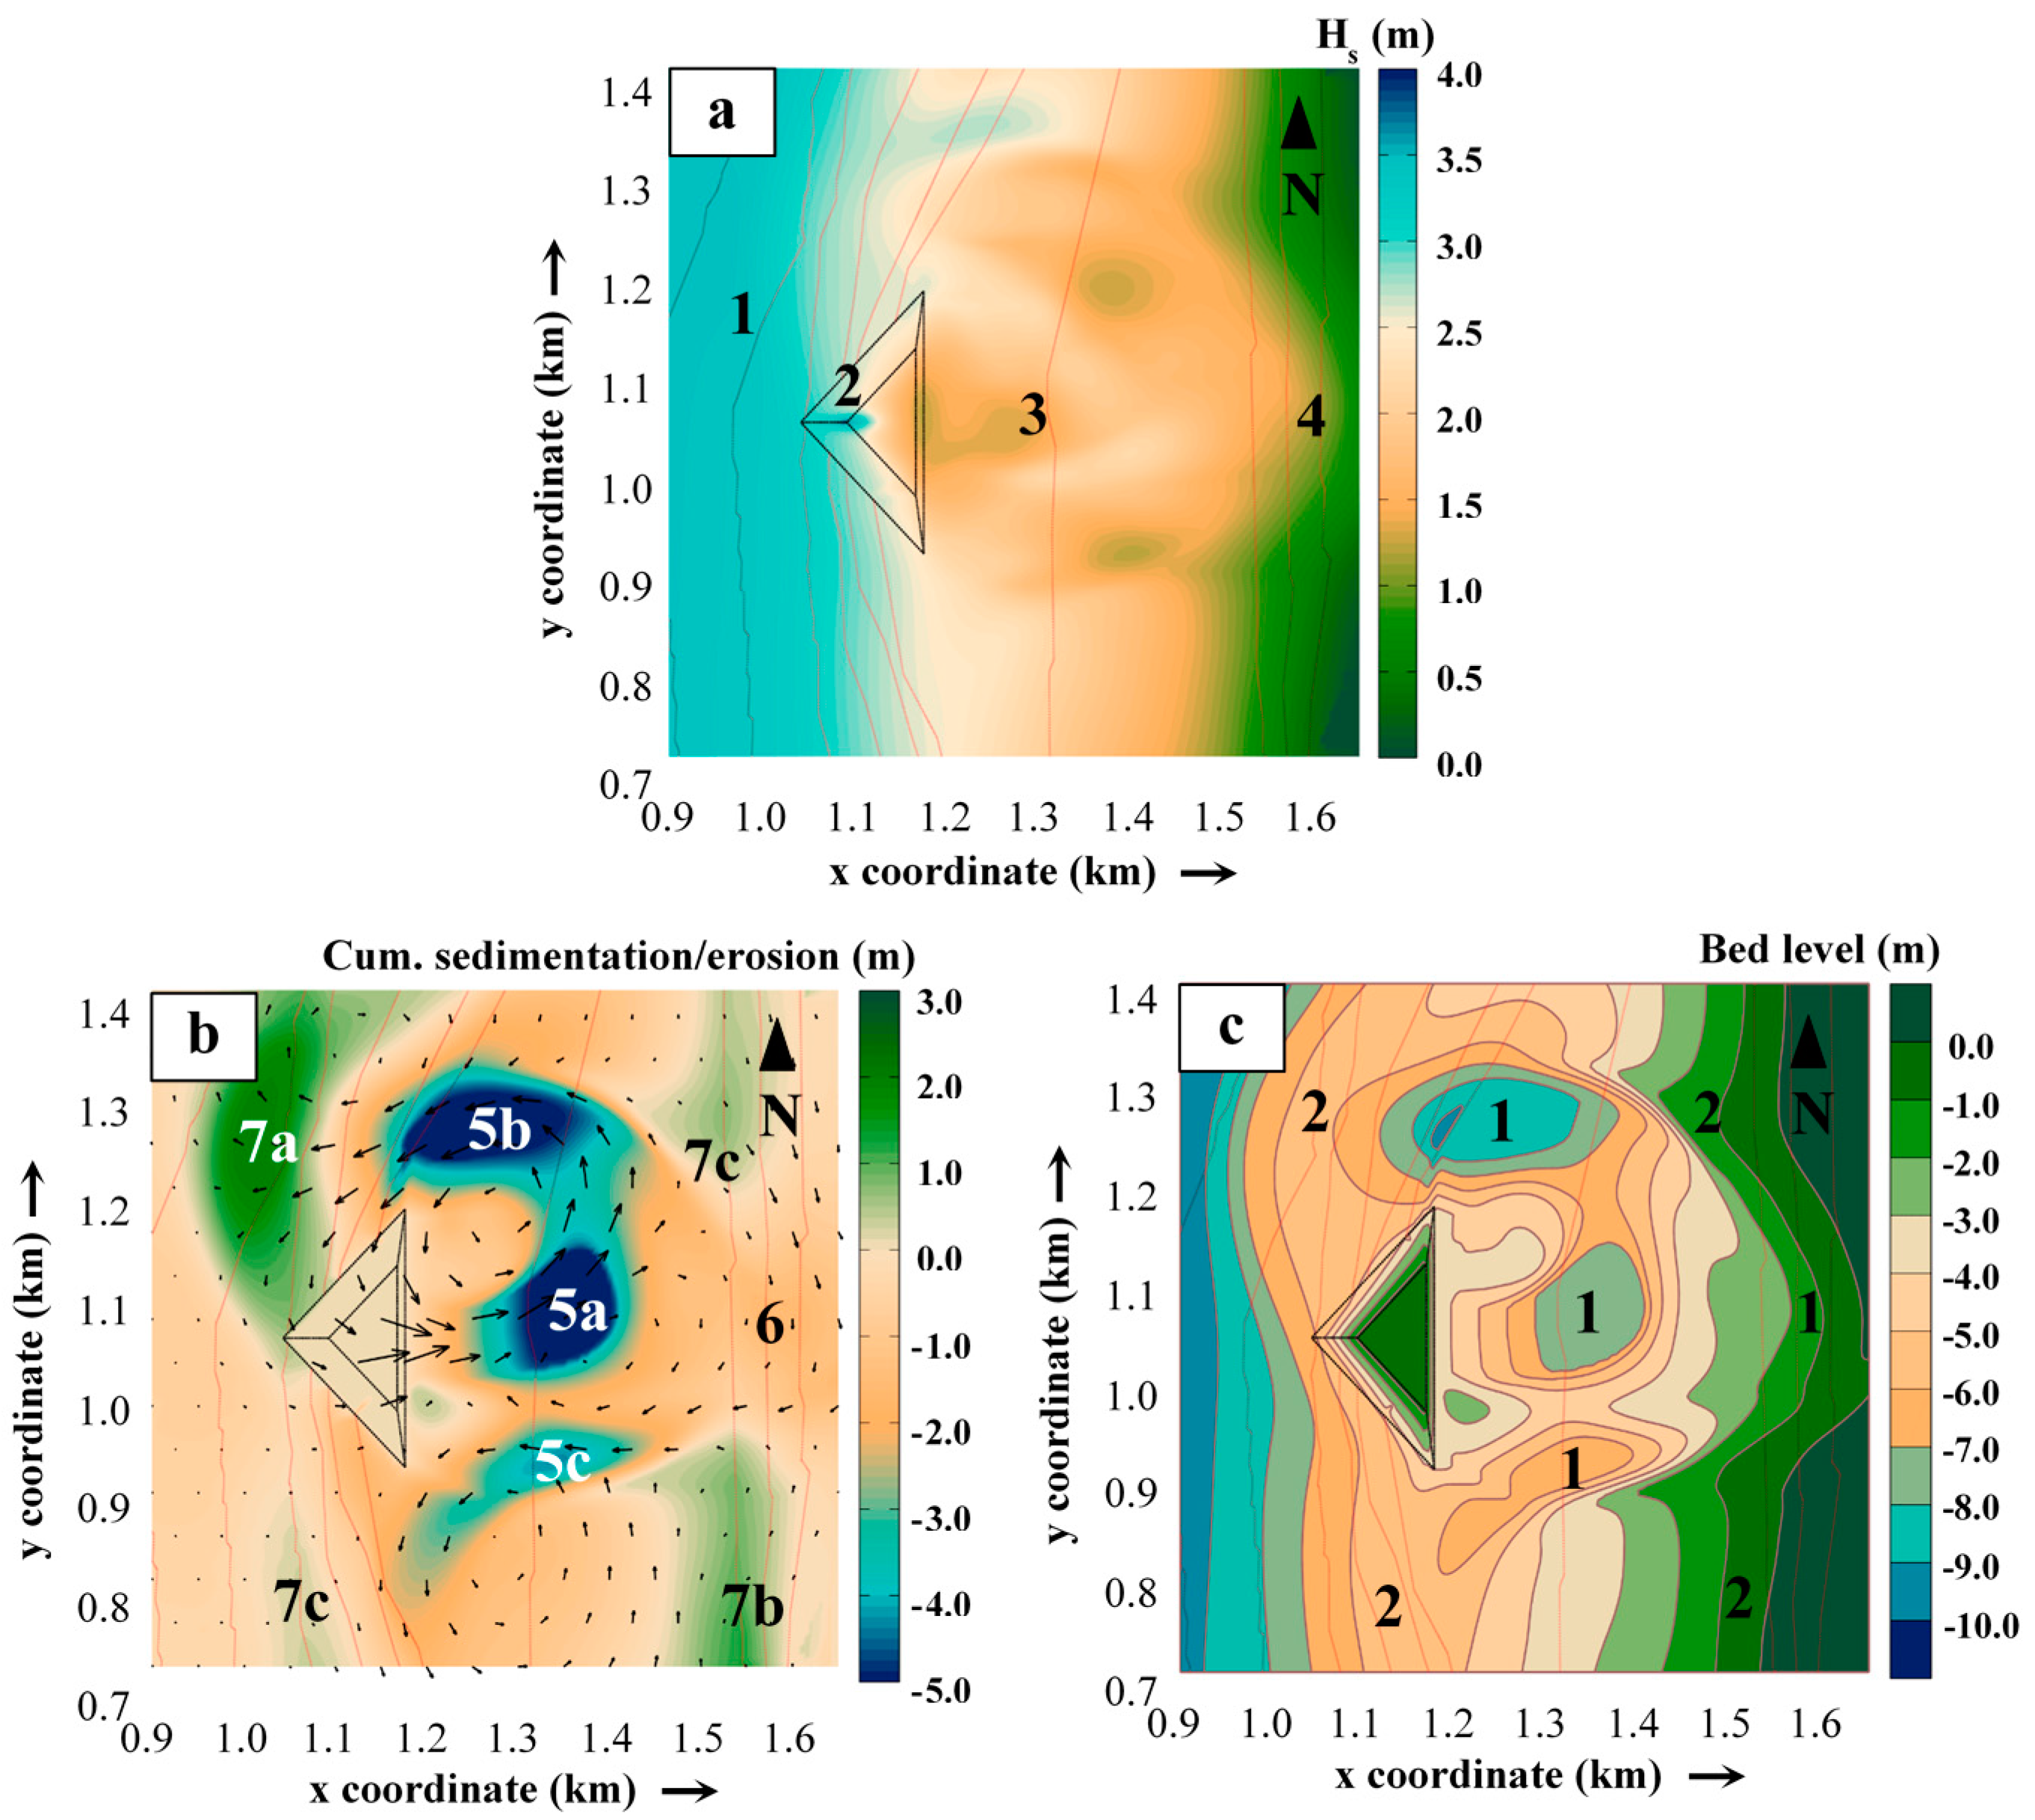
4.5. Storm Scenario: Hydrodynamics and Morphodynamics

In order to analyse the MFAR performance on a storm wave condition (Hs = 4.0 m, T = 15 s) with a west wave direction, we conducted numerical simulations for hydrodynamics and morphodynamics using XBeach (Figure 9). Because these conditions create a shallow water environment (significant wave height/wavelength < 0.05), SWAN was not considered for this scenario due to its unrealistic results (wavelength is above 100 m). Output for hydrodynamics consisted of significant wave height results for a 2 h simulation and, for morphodynamics, an evaluation of cumulative sedimentation/erosion and bed level after 20 years.

5. Discussion

5.1. SWAN Hydrodynamic Results

From the results presented in Figure 5, for both west and northwest wave directions, wave shoaling (increase of the wave height) in every structure was evident due to a decrease of the depth. This phenomenon was visible at the outward extremity along the submerged detached breakwater (represented by number 1 in Figure 5a1 (Hs = 1.7 m) and Figure 5a2 (Hs = 1.6 m) for the west and northwest wave directions, respectively), along the emerged detached breakwaters (also represented by number 1 in Figure 5b1 (Hs = 1.7 m) and Figure 5b2 (Hs = 1.6 m) for the west and northwest wave directions, respectively), and at the apex of the MFAR (represented by number 2 in Figure 5c1 (Hs = 1.8 m) and Figure 5c2 (also Hs = 1.8 m) for the west and northwest wave directions, respectively). For the northwest wave direction scenarios, the wave shoaling mentioned was less intense.
At the inward side of all structures, wave shoaling was also visible for both wave directions. For the submerged detached breakwater, a progressive increase in significant wave heights is also visible from the structure inward (protected) extremity to position 1.4 km (represented by number 3 in Figure 5a1 (Hs = 1.1 m to Hs = 1.3 m) and Figure 5a2 (also Hs = 1.1 m to Hs = 1.3 m) for the west and northwest wave directions, respectively). For the emerged detached breakwater, this phenomenon was more noticeable for waves incoming from the northwest direction (represented by number 3 in Figure 5b2 (Hs = 0.0 m to Hs = 1.1 m)), although wave shoaling was also visible for the west wave (represented by number 3 in Figure 5b1 (Hs = 0.0 m to Hs = 0.9 m)). For the MFAR, this phenomenon was also present where an increase in significant wave heights was perceptible from the structure inward extremity to position 1.4 km (represented by number 3 in Figure 5c1 (Hs = 0.8 m to Hs = 1.3 m) and Figure 5c2 (also Hs = 0.8 m to Hs = 1.3 m) for the west and northwest wave directions, respectively). These phenomena were explained by the shoaling and breaking due to depth decrease. After these positions, the significant wave heights progressively decreased towards the shoreline.
Relative to the influence of a structure on significant wave heights, it was clear that all structures contributed to a significant wave heights reduction for both wave directions. The most substantial decrease was for the emerged detached breakwater, where it was clear that there was a negligible overtopping on the structure of approximately 0.2 m (represented by number 4 in Figure 5b1 (Hs = 1.2 m) and Figure 5b2 (also Hs = 1.2 m) for the west and northwest wave directions, respectively), which contributed to a very calm area immediately after the structure (represented by number 5 in Figure 5b1 (Hs = 0.2 m) and Figure 5b2 (also Hs = 0.2 m) for the west and northwest wave directions, respectively).
After position 1.4 km, the increase in significant wave heights was explained by the diffraction phenomena (represented by number 6 in Figure 5b1 (Hs = 0.2 m to Hs = 0.8 m) and Figure 5b2 (also Hs = 0.2 m to Hs = 0.8 m) for the west and northwest wave directions, respectively) that was observed by the convergence of the mean wave direction vectors. For all northwest wave direction scenarios, the shadow zone triggered by the structures presence took a southeast direction, relative to the structures, as expected. This effect lessened the protection purpose at the structures alignment relative to the shoreline. Near the shoreline, it can be concluded that the emerged detached breakwater and the MFAR had a more substantial and larger shadow zone than the submerged detached breakwater.

5.2. XBeach Hydrodynamic Results

Similar to SWAN results, for both west and northwest wave directions, wave shoaling in every structure was evident due to a decrease in the depth along the outward extremity of the submerged detached breakwater (represented by number 1 in Figure 6a1 (Hs = 1.7 m) and Figure 6a2 (Hs = 1.6 m) for the west and northwest wave directions, respectively), along the outward extremity of the emerged detached breakwaters (also represented by number 1 in Figure 6b1 (Hs = 1.7 m) and Figure 6b2 (Hs = 1.6 m) for the west and northwest wave directions, respectively), and at the apex of the MFAR (represented by number 2 in Figure 6c1 (Hs = 1.8 m) and Figure 6c2 (also Hs = 1.8 m) for the west and northwest wave directions, respectively). As in the SWAN numerical model, the wave shoaling was less intense for the northwest wave direction scenarios.
At the inward side of all structures, wave shoaling was also visible for both wave directions. For the submerged detached breakwater, a progressive increase in significant wave heights was visible from the structure inward extremity to position 1.3 km (represented by number 3 in Figure 6a1 (Hs = 1.1 m to Hs = 1.5 m) and Figure 6a2 (Hs = 1.0 m to Hs = 1.2 m) for the west and northwest wave directions, respectively). For the emerged detached breakwater, this phenomenon was also noticeable for waves incoming from the west direction (represented by number 3 in Figure 6b1 (Hs = 0.3 m to Hs = 0.8 m)), and the northwest wave (represented by number 3 in Figure 6b2 (Hs = 0.2 m to Hs = 0.8 m)) for different positions. For the MFAR, this phenomenon was very noticeable for both waves incoming from the west direction (represented by number 3 in Figure 6c1 (Hs = 0.4 m to Hs = 0.8 m)), and for the northwest direction (represented by number 3 in Figure 6c2 (Hs = 0.9 m to Hs = 1.1 m)) also for different positions. After these locations, the significant wave heights gradually decreased towards the shoreline.
Concerning the influence of a structure on significant wave heights, it is clear that all structures contributed to a substantial decrease in wave heights for both wave directions. Comparatively to SWAN model results, XBeach presented smaller significant wave heights in the inward zones (from structures to the coast). This phenomenon was represented by number 4 in all six scenarios in Figure 6, and can be detected by the wide areas of small values for significant wave heights. The most substantial decrease in significant wave heights was, as presented in SWAN numerical model results, for the emerged detached breakwater. A negligible wave overtopping on this structure (approximately 0.1 m) was also simulated by XBeach (represented by number 5 in Figure 6b1 (Hs = 1.1 m) and Figure 6b2 (Hs = 1.1 m) for the west and northwest wave directions, respectively). The shadow zone, spawned immediately after the structure, presented a narrower width when compared to SWAN results (represented by number 6 in Figure 6b1 (Hs = 0.3 m) and Figure 6b2 (Hs = 0.2 m) for the west and northwest wave directions, respectively). The increase in significant wave heights in position number 6 was explained by the diffraction phenomena. The MFAR presented the second most substantial reduction in significant wave heights. For the northwest wave direction condition (Figure 6c2), results were similar to those obtained with SWAN. Regarding the submerged detached breakwater (Figure 6a1,a2), results were also close to the ones presented in SWAN. In all emerged detached breakwater and MFAR scenarios in Figure 6, shoreline width was noticeably affected by the structure with apparent accretion areas (represented by number 4 in Figure 6b1,c1 for the west wave direction, and Figure 6b2,c2 for the northwest wave direction) and erosion areas (represented by number 7 in Figure 6b1 for the west wave direction). For the submerged detached breakwater, this effect was not substantial. The shadow zones generated by the incoming north-western waves that arrived at all structures had a southeast direction relative to the structures, as expected.

5.3. SWAN vs. XBeach Hydrodynamic Results

As mentioned before, the wave shoaling due to a sudden depth change immediately before the structure was visible for all cases. From the analysis of Figure 7, it was clear that both SWAN and XBeach simulated this phenomenon for all structures, and that SWAN simulated a wave shoaling due to the slope change starting at position 1.23 km. The XBeach model also represented a substantial wave shoaling at the same position for all structures, except for the submerged detached breakwater in this cross-section. Immediately after the emerged detached breakwater, both models showed slight turbulence due to wave overtopping.
Table 2 presents an overall comparison between SWAN and XBeach hydrodynamic results taken from Figure 7, and an overall percentage of significant wave height result reduction before and after the structures for the west wave direction.
From the results presented in Table 2, it was evident that the significant wave height results computed by SWAN before the structures were lower than those calculated by the XBeach model for the submerged detached breakwater and the MFAR (−0.05 m and −0.05 m, respectively), and were larger after the mentioned structures (0.18 m and 0.19 m, respectively). For the emerged detached breakwater, the SWAN and XBeach results for significant wave heights were the same before the structure (0.00 m); after the structure, the SWAN computed results were smaller than those obtained with XBeach (−0.43 m).
Regarding the difference between significant wave heights before and after the structures, XBeach presented greater reduction values than the SWAN model for the submerged detached breakwater and MFAR, and a smaller reduction for the emerged detached breakwater. Regarding structure performance, the emerged detached breakwater had the best performance (for both numerical models) due to higher reduction values, whereas the submerged detached breakwater was the least effective. Because wave energy is proportional to wave heights, the same conclusion can be drawn for wave energy.

5.4. Morphodynamic Results

From the results depicted in Figure 8, it was evident that the most substantial erosion areas were at the inward area of the MFAR for the west wave direction, 120 m away from the structure, and at the south extremity, 110 m away from the structure, for the northwest wave direction (represented by number 1 in Figure 8c1 (−5 m) and Figure 8c2 (also −5 m), respectively); at the north extremity for the emerged detached breakwater, 70 m away from the structure, (represented by number 1 in Figure 8b1 (−1.5 m)); and at the south extremities for the submerged and emerged detached breakwater, 110 m and 50 m away from the structure, respectively, for the northwest wave direction (represented by number 1 in Figure 8a2 (−2.0 m) and Figure 8b2 (−5.0 m), respectively). For the MFAR (Figure 8c1 for the west wave direction) the local scouring may be explained by the increase in wave velocities and a small wave refraction due to wave propagation at different depths, whereas for the northwest wave direction (Figure 8c2), erosion may have been induced by the combination of the waves diffracted due to the structure presence and the incoming waves from the north that created fields with more intense velocities at this area. For the submerged and emerged detached breakwaters (Figure 8a2,b2 for the northwest wave direction), the erosion was induced by the combination of waves incoming from the north and the increased waves velocities incoming from along the structure. Regarding the emerged detached breakwater for the west wave direction, local scouring was induced by the vortexes formed near the inward area of the structure. Erosion in the structures outward areas due to wave reflexion were present in all scenarios (represented by number 2), with more intense values for the west wave direction condition. Observations on the increase of wave velocities, in the submerged and the MFAR (represented by number 3 in Figure 8a1 (−1.5 m) and Figure 8c1 (−1.0 m) for the west wave direction), and on the vortexes presented in the emerged detached breakwater (represented by numbers 4 and 5 in Figure 8b1 (−1.5 m and −1.0 m, respectively) for the west wave direction) suggested that local scouring was present at these positions.
By the observation of the convergence of both vortexes presented in the emerged detached breakwater results (Figure 8b1 for the west wave direction) it was clear that accretion areas were created due to the intensity of currents in the structure inward zone (represented by number 6 (+3.0 m)). On the shoreline, accretion at the structure alignment with a formation of a noticeable salient (represented by number 7 (+2.0 m)) was created due to the decreasing of wave velocities. For the submerged detached breakwater and the MFAR (Figure 8a1,c1 for the west wave direction), a slight sediment accretion was created in the structure inward zone (represented by number 6 (+0.5 m and +1.0 m, respectively)). Along the shoreline, great sediment accretion was visible (represented by number 7), particularly for the MFAR (Figure 8c1 (+1.5 m) for the west wave direction) where, similar to the emerged detached breakwater, a formation of a salient was evident. This salient was developed immediately after the erosion area represented by number 1, which may suggest that part of the sediments on the eroded area settled further ahead. For the emerged detached breakwater, a noticeable sediment accretion south of the structure was developed due to decrease in wave velocity from the outer contour of the south vortex (represented by number 8 in Figure 8b1 (+2.0 m) for the west wave direction). Regarding results for the northwest direction, similar sediment accretion patterns were visible for the submerged detached breakwater and the MFAR (represented by numbers 6 (+0.5 m), 7 (+2.0 m), 8 (+1.0 m), and 9 (+1.0 m)), although with greater areas of sediment accumulation for the MFAR (Figure 8c2). For the emerged detached breakwater, great sediment accretion was visible at three different locations: in the structure inward zone, southeast of the structure, and south of the structure (represented by numbers 6 (+1.5 m), 7 (+2.5 m), and 8 (+1.5 m) in Figure 8b2 for the northwest wave direction, respectively). All the protection patterns reported in the observation of the attenuation of significant wave heights by the structures were corroborated by the presented morphodynamic results.
Overall, by observation of the west wave condition results, it is clear that a pronounced variation on wave velocities induced more accumulation and erosion areas. This asymmetrical layout may have been related to the incidence of incoming waves on the non-symmetric bathymetry. The vortexes presented in the emerged detached breakwater by observation of the wave velocity vectors indicated sediment accretion and erosion at different locations, with formation of a substantial salient (as previously mentioned), similar to the study in [38] where patterns of salient formations were created for similar conditions. A salient formation inwards the MFAR was also observed Sediment accretion patterns presented for the MFAR corroborated the studies developed by [25,26], where the authors expected sediments to accumulate at the structure alignment through the observation of wave velocity vectors. This way, it can be concluded that the studies of [25,26] were consistent, and that, similar to the study of [22], slight cell circulation systems can be found for this scenario. The coherence between the previous and the presented results confirmed the quality of results in this research work. It is important to note that despite these salients being formed, erosion areas along the shoreline were present for the west wave direction.
In relation to the substantial erosion areas verified, it is worth mentioning that protection of the structure itself is a concern the authors would address in future publication.

5.5. Storm Scenario: Hydrodynamic and Morphodynamic Results

Regarding the performance of the MFAR in reducing wave energy, it is clear that the XBeach model indicated a positive and substantial wave height reduction from the observed outward and inward extreme results (represented by numbers 1 (Hs = 3.5 m) and 4 (Hs = 1.0 m) in Figure 9a).
Similar to the previous results for frequent wave condition, for this scenario, XBeach computed the wave shoaling at the apex of the structure (represented by number 2 in Figure 9a) and a slight wave shoaling due to depth decrease (represented by number 3 in Figure 9a) from the inward extremity to position 1.3 km. Near the shoreline, the XBeach model presented a vulnerable area at the structure alignment (represented by number 4 in Figure 9a). This noticeable disturbance in shoreline width indicated apparent erosion at that particular stretch. The increase in significant wave heights in position number 4, when compared with areas located north and south, may have resulted from the erosion that occurs in the back of the MFAR, as presented in Figure 9c.
Similar to the results presented for the emerged detached breakwater for the west wave direction, two vortexes were presented in the MFAR inward area by observing the wave velocity vectors (Figure 9b). The local scouring represented by number 5a in Figure 9b (−5.0 m) may be explained by the increase in the wave velocities and a small wave refraction due to wave propagation at different depths, whereas the erosion represented by number 5b (also −5.0 m) may be explained by the combination of incoming waves from the north with the vortex, which created more intense velocity fields at this area. The erosion represented by number 5c in Figure 9b (−4.0 m) was induced by the fact that both vortexes had the same direction, which aggravated local scouring on the area where they both met. Wave velocity vectors in the storm wave scenario indicated a more turbulent state than the condition for frequent waves. Near the shoreline, the wave velocity vectors that indicated the waves incoming from the north (represented by number 6 in Figure 9b (−2.0 m)), due to turbulence induced by the north vortex, contributed to local scouring at the structure alignment. This phenomenon was mentioned by observations of significant wave height results.
Regarding sediment accretion, it is clear that the areas with smaller wave velocity vectors indicated calmer zones, which contributed to accretion (represented by numbers 7a, 7b, and 7c in Figure 9b (+2.0 m, +1.0 m, and +0.5 m, respectively)). These less turbulent areas that were located away from the vortexes were induced by the decreased magnitude of this phenomenon, and were located away from the structure; they also appeared in the MFAR outward zone. Substantial sediment accretion was observed in the structure outward zone (7a) and at the southeast (7b) of the structure (along the shoreline), whereas smaller areas of sediment accretion were presented northeast of the structure, near the shoreline (7c) and south of the structure (7c). This scenario did not create any salient at the structure alignment.
From the results presented in Figure 9c, it can be concluded that there were substantial changes in morphology for this scenario where the erosion (1) and sedimentation (2) phenomena altered the bed level.

6. Conclusions

Coastal zones are a much-appreciated environment that attract people, as they are supportive of a large amount of activities and leisure. Despite the fact these environments are highly vulnerable to natural and anthropogenic hazards, it has been noted by the European Environment Agency that coastal population growth is evident on some coasts of the Mediterranean (Spain, France, and Italy). This growth requires special attention when dealing with climate change consequences, and new strategies to deal with sea level rise are crucial.
This study aimed to evaluate the performance of an MFAR and two traditional coastal protection solutions (submerged and emerged detached breakwaters) in dissipating wave energy and protecting the beach (through significant wave heights and sediment accumulation) using numerical models implemented with SWAN and XBeach. In addition, a comparison between SWAN and XBeach hydrodynamic results was also performed. In previous studies, the wave climate at Leirosa beach was evaluated for frequent and typical storm conditions, and a possible option consisting of a submerged structure of triangular shape (plan view) with multi-functions (MFAR) was also analysed. The results obtained in those studies were compared with the numerical results obtained in the present work for a structure with identical characteristics (MFAR). The proximity (qualitative and quantitative) of the results of those studies with the results of the numerical models used in the present work was reliable proof of good behaviour of the SWAN and XBeach numerical models to analyse and compare the efficiencies of the three possible options of structures to be installed. Moreover, the wave dissipation was quantitatively compared, and similar results were obtained. Thus, the MFAR characteristics were based on previous research works, and all structures analysed were simulated for frequent wave conditions with waves incoming from the west and northwest directions. A storm wave condition scenario was also addressed to the MFAR for the west wave direction.
Regarding significant wave height results for both SWAN and XBeach models, a substantial decrease between before and after every structure shape was clear for both wave directions, which indicated that all structures had a great influence on reducing significant wave heights and wave energy. Amongst all structures, the emerged detached breakwater was the most efficient in reducing significant wave heights at a larger scale compared to the submerged detached breakwater and the MFAR. This was corroborated by the fact that the emerged detached breakwater presented a more substantial and larger shadow zone than the other two solutions, which was expected because it constituted a higher obstacle to the incoming waves. Regarding both submerged structures (detached breakwater and the MFAR), the MFAR presented a more substantial shadow zone. Overall, for the west wave direction scenarios, all structures provided protection at the structures alignment, whereas for the northwest wave direction scenarios, protection was observed in the southeast of all structures.
Comparing both models, it can be concluded that at the inward zones of the submerged detached breakwater and the MFAR, the SWAN numerical model presented greater significant wave height results than the XBeach model, and that XBeach presented greater percentages of substantial reduction of wave heights for frequent wave conditions. For the emerged detached breakwater, SWAN presented lower significant wave height results compared with the XBeach model, as well as greater percentages of substantial reduction of wave heights. Despite the differences, both numerical models indicated that, regarding structure performance, the emerged detached breakwater had the best performance due to higher reduction values, whereas the submerged detached breakwater was the least effective. The same conclusions can be drawn for wave energy results. Near the shoreline, although the three cases did not present any substantial differences for the SWAN model, the same cannot be stated for the XBeach. From the analysis of XBeach results, the emerged detached breakwater and the MFAR insight changed in the shoreline for both wave directions. For the submerged detached breakwater, there were no substantial changes. For the northwest wave direction, XBeach results for the submerged detached breakwater and the MFAR were similar to those of SWAN. For the emerged detached breakwater results, the SWAN numerical model presented a wider shadow zone than the XBeach model.
Regarding morphodynamics, the obtained results presented favourable tendencies to sediment accretion near the shoreline, as well as at the inward areas for the three structures, as the greatest values for accretion were located in these sites. The most substantial sediment accretion at the shoreline was noticeable for the emerged detached breakwater for both wave directions. Comparing the three structures for the western incoming waves, it was observable that for the emerged detached breakwater and the MFAR, the shoreline sediments accumulated at the structures alignment, forming a substantial salient, whereas for the submerged detached breakwater, the sediments accumulated continuously along the shoreline. For the northwest incoming waves, sediment accretions for the submerged detached breakwater and the MFAR were developed continuously along the shoreline and had similar patterns. The emerged detached breakwater had substantial sediment accumulation in the southeast and inwards of the structure. All protection patterns reported in the attenuation of significant wave heights by the structures were corroborated by the morphodynamic results presented.
Erosion areas were, however, also evident along the shoreline and near all structures. Contribution to overall coastal erosion protection would only be ensured if accretion rates were higher than the erosion rates. Lower accretion rates would compromise shoreline stability, and substantial erosion near the structures may also put structures stability at risk due to local scouring. This is a concern the authors would address in a future publication. Substantial erosion areas were visible inwards the MFAR for the west incoming waves and at the south extremity for the northwest wave direction, as well as at the north extremity for the emerged detached breakwater, and at the south extremities for the submerged and emerged detached breakwaters for the northwest wave direction. Along the shoreline, substantial erosion was depicted for the emerged detached breakwater and for the MFAR for the west wave direction, with more noticeable values for the emerged detached breakwater. For the submerged detached breakwater, no noticeable erosion areas along the shoreline were visible for either wave directions. For all the northwest wave direction scenarios, no noticeable erosion areas were visible along the shoreline. Although further analysis is required, for the west incoming waves, the sedimentation immediately after the erosion area in the MFAR suggested that part of the sediments on the eroded area may have settled further ahead. Erosions outwards the structures due to wave reflexion appeared in all scenarios, with more intense values for the west wave direction condition.
Regarding structures overall benefits, it can be concluded that for the west and northwest wave predominance, the submerged detached breakwater and the MFAR presented overall better solutions for morphodynamics, considering the balance of erosion and accretion rates.
Regarding the storm wave condition on the performance of the MFAR, the XBeach numerical model indicated positive and substantial significant wave height reduction. Near the shoreline, the XBeach model for hydrodynamics presented a vulnerable area at the structure alignment with noticeable disturbance in shoreline width that indicated apparent erosion at that particular stretch. These observations were corroborated with the morphodynamic results. Wave velocity vectors in the storm wave scenario indicated a more turbulent state than the condition for frequent waves, as expected. Substantial sediment accretion was observed outwards of the structure and on the shoreline. This scenario did not create any salient at the structure alignment. Similar to results presented for the emerged detached breakwater for the west wave direction (frequent wave condition), two vortexes were created inwards the MFAR by wave velocity vector observation. This phenomenon contributed to substantial erosion areas located around the structure, which added substantial changes in the bed level.

Author Contributions

Conceptualization, B.F.V.V., J.L.S.P., J.A.O.B., and J.S.A.d.C.; methodology, B.F.V.V., J.L.S.P., J.A.O.B., and J.S.A.d.C.; validation, B.F.V.V., J.L.S.P., J.A.O.B., and J.S.A.d.C.; formal analysis, B.F.V.V., J.L.S.P., J.A.O.B., and J.S.A.d.C.; investigation, B.F.V.V. and J.L.S.P.; resources, B.F.V.V. and J.L.S.P.; writing—original draft preparation, B.F.V.V.; writing—review and editing, B.F.V.V., J.L.S.P., J.A.O.B., and J.S.A.d.C.; supervision, J.L.S.P. and J.A.O.B. All authors have read and agreed to the published version of the manuscript.

Funding

This research was funded by the Portuguese Foundation for Science and Technology (FCT), PhD grant number SFRH/BD/141381/2018.

Acknowledgments

The authors acknowledge the support provided by the FCT and also by the project EcOffShorBe – Eco Offshore Built Environment, no. 37417, R&D cores in Copromoção, 14/SI/2017, NORTE-01-0247-FEDER-037417, supported by ANI (FEDER).

Conflicts of Interest

The authors declare no conflict of interest. The funders had no role in the design of the study; in the collection, analyses, or interpretation of data; in the writing of the manuscript; or in the decision to publish the results.

Appendix A

Figure A1. (a) Salient formation at the end of simulation conducted by [38]; (b) replication of [38] study.
Jmse 08 00175 g0a1

References

  1. Antunes do Carmo, J.S. Coastal Adaptation: Past Behaviors, Contemporary Management, and Future Options. In Coastal and Marine Environments—Physical Processes and Numerical Modelling; IntechOpen: London, UK, 2019; p. 20. [Google Scholar]
  2. Antunes do Carmo, J.S. The changing paradigm of coastal management: The Portuguese case. Sci. Total. Environ. 2019, 695, 133807. [Google Scholar] [CrossRef] [PubMed]
  3. Bergillos, R.J.; Rodríguez-Delgado, C.; Millares, A.; Ortega-Sánchez, M.; Losada, M.A. Impact of river regulation on a Mediterranean delta: Assessment of managed versus unmanaged scenarios. Water Resour. Res. 2016, 52, 5132–5148. [Google Scholar] [CrossRef]
  4. Reis, C.S.; Carmo, J.A.D.; Freitas, H. Learning with Nature: A Sand Dune System Case Study (Portugal). J. Coast. Res. 2008, 246, 1506–1515. [Google Scholar] [CrossRef]
  5. Granja, H.; Pinho, J.L. Coastal Defense in NW Portugal: The Improbable Victory. In Pitfalls of Shoreline Stabilization: Selected Case Studies; Cooper, J.A.G., Pilkey, O.H., Eds.; Springer: Dordrecht, The Netherlands, 2012; pp. 251–266. [Google Scholar]
  6. Narra, P.; Coelho, C.; Sancho, F.; Palalane, J. CERA: An open-source tool for coastal erosion risk assessment. Ocean Coast. Manag. 2017, 142, 1–14. [Google Scholar] [CrossRef]
  7. United Nations. Transforming Our World: The 2030 Agenda for Sustainable Development A/RES/70/1; UN General Assembly: New York, NY, USA, 2015. [Google Scholar]
  8. Weinberg, J. The Big Squeeze: Coastal Megacities Face Growing Pressure from Sea and Land; Stockholm Waterfront: Stockholm, Sweden, 2015; pp. 5–7. [Google Scholar]
  9. Castelle, B.; Guillot, B.; Marieu, V.; Chaumillon, E.; Hanquiez, V.; Bujan, S.; Poppeschi, C. Spatial and temporal patterns of shoreline change of a 280-km high-energy disrupted sandy coast from 1950 to 2014: SW France. Estuarine Coast. Shelf Sci. 2018, 200, 212–223. [Google Scholar] [CrossRef]
  10. EEA. European Environment Agency—The Changing Faces of Europe’s Coastal Areas; Office for Official Publications of the European Communities: Copenhagen, Denmark, 2006. [Google Scholar]
  11. Gilbert, J.; Vellinga, P. Climate Change: The IPCC Response Strategies - Chapter 5. In Report prepared for Intergovernmental Panel on Climate Change by Working Groups III; Digitization and Microform Unit (2010), UNOG Library: Genève, Switzerland, 1990; p. 330. [Google Scholar]
  12. IPCC. Managing the Risks of Extreme Events and Disasters to Advance Climate Change Adaptation. A Special Report of working groups I and II of the Intergovernamental Panel on Climate Change; Cambridge University Press: Cambridge, UK, 2012. [Google Scholar]
  13. Adriana-Gracia, C.; Rangel-Buitrago, N.; Oakley, J.A.; Williams, A. Use of ecosystems in coastal erosion management. Ocean Coast. Manag. 2018, 156, 277–289. [Google Scholar] [CrossRef]
  14. Charlier, R.H.; Chaineux, M.C.P.; Morcos, S. Panorama of the History of Coastal Protection. J. Coast. Res. 2005, 211, 79–111. [Google Scholar] [CrossRef] [Green Version]
  15. Griggs, G.B. The impacts of coastal armoring. Shore Beach 2005, 73, 13–22. [Google Scholar]
  16. Pilkey, O.H.; Cooper, J.A.G. The Last Beach; Duke University Press: Durham, NC, USA, 2014. [Google Scholar]
  17. Pranzini, E.; Williams, A.T. Coastal Erosion and Protection in Europe, 1st ed.; Routledge: London, UK, 2013. [Google Scholar]
  18. Rangel-Buitrago, N.; Williams, A.; Anfuso, G. Hard protection structures as a principal coastal erosion management strategy along the Caribbean coast of Colombia. A chronicle of pitfalls. Ocean Coast. Manag. 2018, 156, 58–75. [Google Scholar] [CrossRef]
  19. Williams, A.T.; Rangel-Buitrago, N.; Pranzini, E.; Anfuso, G. The management of coastal erosion. Ocean Coast. Manag. 2018, 156, 4–20. [Google Scholar] [CrossRef]
  20. Pilarczyk, K. Remarks on Coastal Stabilization and Alternative Solutions. In Handbook of Coastal and Ocean Engineering; World Scientific: Singapore, 2009; pp. 521–551. [Google Scholar]
  21. Bergillos, R.J.; López-Ruiz, A.; Medina-Lopez, E.; Moñino, A.; Ortega-Sánchez, M. The role of wave energy converter farms on coastal protection in eroding deltas, Guadalfeo, southern Spain. J. Clean. Prod. 2018, 171, 356–367. [Google Scholar] [CrossRef]
  22. Ranasinghe, R.; Turner, I.; Symonds, G. Shoreline response to multi-functional artificial surfing reefs: A numerical and physical modelling study. Coast. Eng. 2006, 53, 589–611. [Google Scholar] [CrossRef]
  23. Black, K.P.; Andrews, C.J. Sandy Shoreline Response to Offshore Obstacles Part 1: Salient and Tombolo Geometry and Shape. J. Coast. Res. 2001, 29, 82–93. [Google Scholar]
  24. Ranasinghe, R.; Turner, I. Shoreline response to submerged structures: A review. Coast. Eng. 2006, 53, 65–79. [Google Scholar] [CrossRef]
  25. Mendonça, A.; Fortes, C.; Capitão, R.; Neves, M.; Moura, T.; Carmo, J.S.A.D. Wave hydrodynamics around a multi-functional artificial reef at Leirosa. J. Coast. Conserv. 2012, 16, 543–553. [Google Scholar] [CrossRef]
  26. Mendonça, A.; Fortes, C.; Capitão, R.; Neves, M.; Carmo, J.S.A.D.; Moura, T. Hydrodynamics around an Artificial Surfing Reef at Leirosa, Portugal. J. Waterw. Port Coastal Ocean Eng. 2012, 138, 226–235. [Google Scholar] [CrossRef]
  27. Lynett, P.J.; Liu, P.L.-F. Modeling Wave Generation, Evolution, and Interaction with Depth-Integrated, Dispersive Wave Equations. COULWAVE Code Manual. In Long and Intermediate Wave Modeling Package, v. 2.0; Cornell University: Ithaca, NY, USA, 2008; p. 90. [Google Scholar]
  28. SWAN. SWAN Manual. 2018. Available online: http://swanmodel.sourceforge.net/online_doc/swanuse/node3.html (accessed on 8 February 2019).
  29. Deltares. XBeach. 2019. Available online: https://www.deltares.nl/en/software/xbeach (accessed on 12 February 2019).
  30. Pinho, J.; Vieira, J.M.P.; Carmo, J.S.A.D. Hydroinformatic environment for coastal waters hydrodynamics and water quality modelling. Adv. Eng. Softw. 2004, 35, 205–222. [Google Scholar] [CrossRef]
  31. Paredes, R.; Callapez, P.M.; Danielsen, R.; Dinis, P.; Carvalho, M.; Soares, A.F. Paleoecologia da malacofauna salobra e biofácies da laguna holocénica de Leirosa (Figueira da Foz) / Paleoecology of brackish malacofauna and biofacies of the holocene lagoon of Leirosa (Figueira da Foz)). In Proceedings of the VII National Geology Congress, Estremoz, Portugal, 5–7 July 2006; pp. 737–740. [Google Scholar]
  32. Rocha, F.; Bernardes, C. Caracterização mineralógica dos níveis lodosos no sistema de dunas costeiras a sul do Cabo Mondego (Leirosa, Portugal) / Mineralogical characterization of muddy levels in the coastal dune system south of Cabo Mondego (Leirosa, Portugal). Estud. do Quaternário / Quat. Stud. 1997, 72, 67–72. [Google Scholar] [CrossRef]
  33. Deltares. Delft3D 4 Suite (structured). 2019. Available online: https://www.deltares.nl/en/software/delft3d-4-suite (accessed on 7 February 2019).
  34. Capitão, R.; Fortes, C. Análise comparativa entre estimativas do modelo SWAN e medições de agitação marítima efectuadas na Praia da Amoreira, Portugal / Comparative analysis between estimates of SWAN model and field measurements of sea waves at Praia da Amoreira, Portugal. Rev. Gestão Costeira Integr./J. Integr. Coast. Zone Manag. 2011, 11, 283–296. [Google Scholar] [CrossRef] [Green Version]
  35. Bolle, A.; Mercelis, P.; Roelvink, D.; Haerens, P.; Trouw, K. Application and Validation of Xbeach for Three Different Field Sites. In Proceedings of the 32nd Conference on Coastal Engineering, Shanghai, China, 30 June–5 July 2010; pp. 1–14. [Google Scholar] [CrossRef] [Green Version]
  36. Roelvink, D.; McCall, R.; Mehvar, S.; Nederhoff, K.; Dastgheib, A. Improving predictions of swash dynamics in XBeach: The role of groupiness and incident-band runup. Coast. Eng. 2018, 134, 103–123. [Google Scholar] [CrossRef]
  37. Vieira, B.F.V. Wave Hydrodynamics in Coastal Stretches Influenced by Detached Breakwaters. Master’s Thesis, Civil Engineering, University of Minho, Guimarães, Portugal, 2014. [Google Scholar]
  38. Bin Ab Razak, M.S.; Nor, N.A.Z.M. XBeach Process-Based Modelling of Coastal Morphological Features Near Breakwater. MATEC Web Conf. 2018, 203, 1007. [Google Scholar] [CrossRef] [Green Version]
  39. Hanson, H. Wave transformation, 2019, [Online]. Available online: http://www.tvrl.lth.se/fileadmin/tvrl/files/vvr040/3_Wave_transformation_3pp.pdf (accessed on 28 October 2019).
  40. MetED. Wave Energy Equation. Wave Types and Characteristics. 2012. Available online: https://www.meted.ucar.edu/marine/mod1_wv_type_char/print.htm#page_4.5.4 (accessed on 5 November 2019).
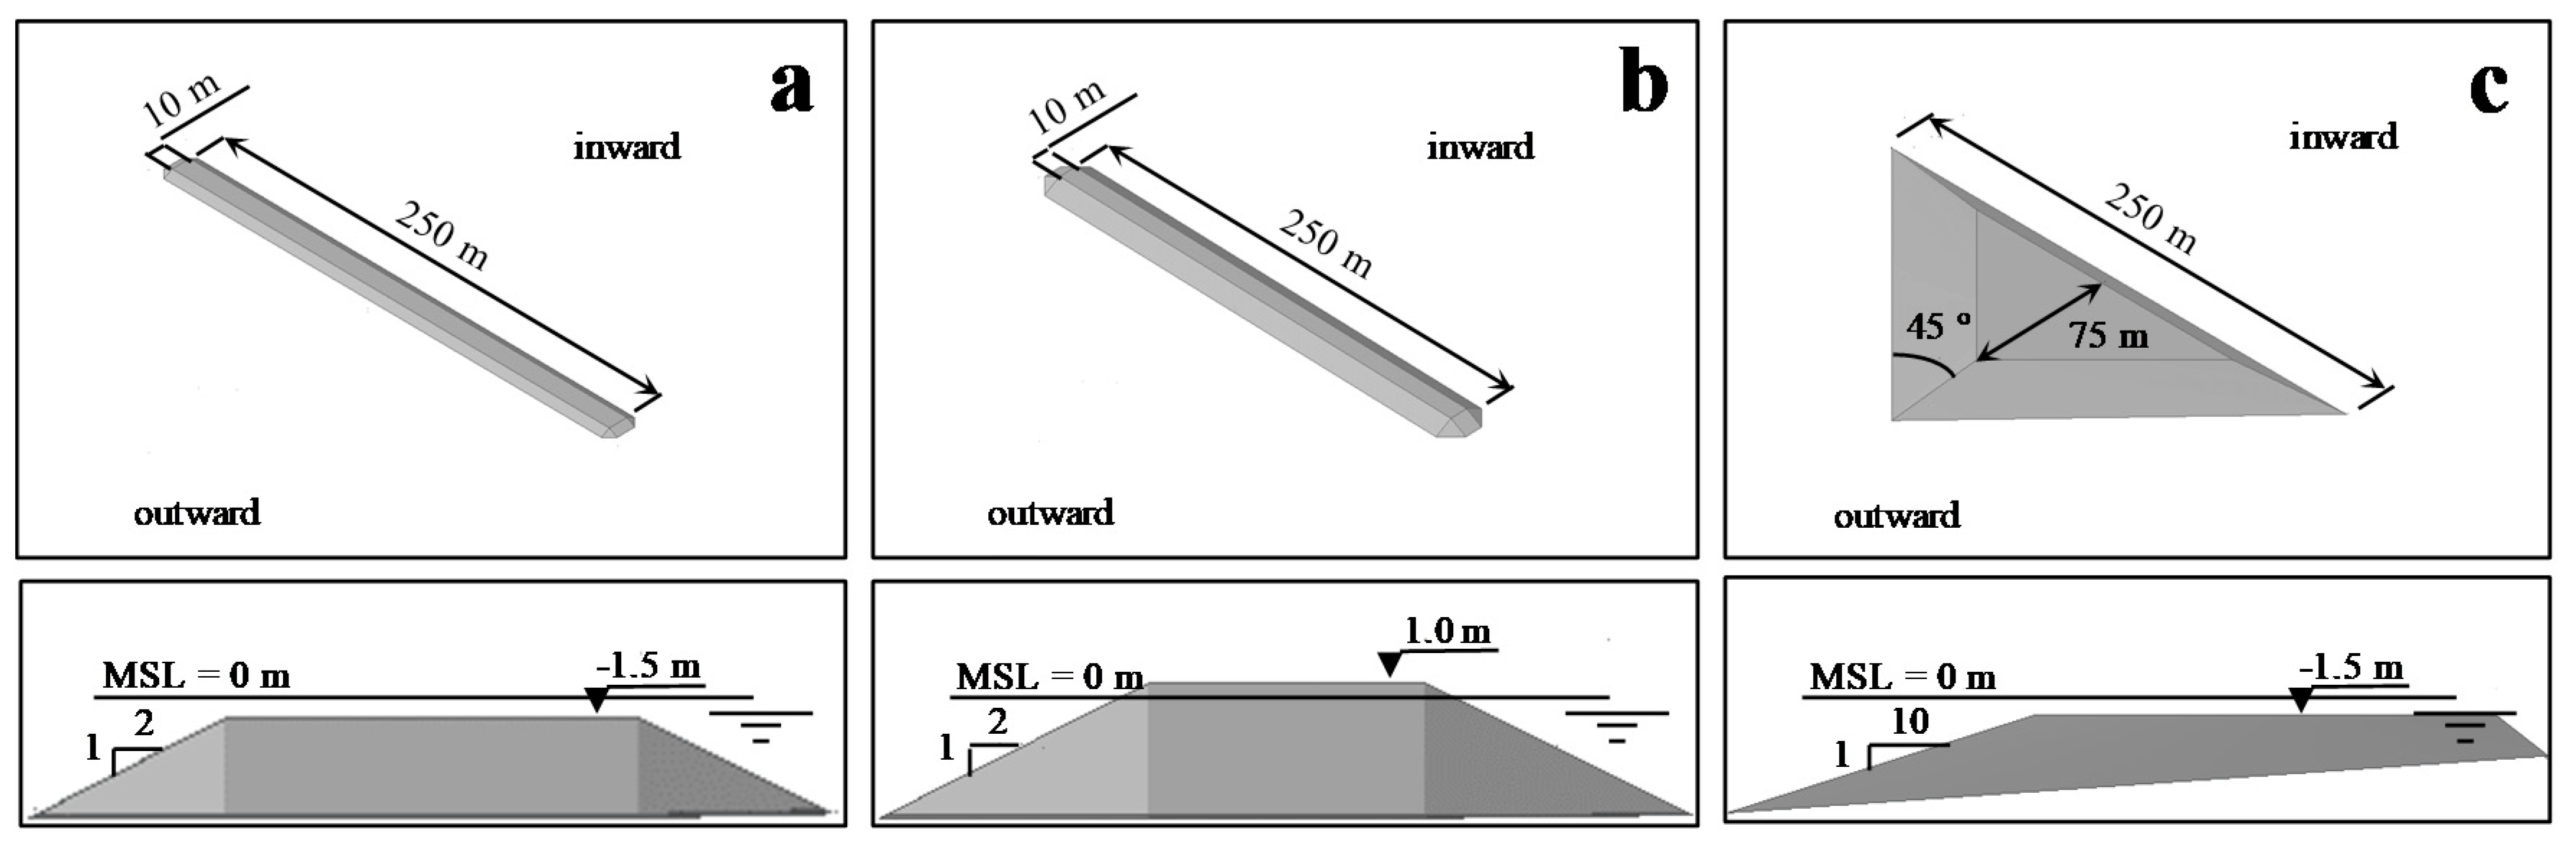
Figure 1. (a) Velocity pattern around the reef structure (adapted from [25]); (b) Leirosa location in Portugal.
Jmse 08 00175 g001
Figure 2. Reef shape and location: definition of Sa.
Jmse 08 00175 g002
Figure 3. (a) Wave rose: wave direction relative frequency distribution (%) in Cabo Mondego, near Leirosa beach (adapted from [4]); and (b,c) frequency histogram for significant wave heights and peak periods, respectively, in Leirosa (red bar) (adapted from [1,2]).
Jmse 08 00175 g003
Figure 4. Geometrical shapes considered in this study (upper panel: plan view; lower panel: cross-section): (a) submerged detached breakwater; (b) emerged detached breakwater; (c) multifunctional artificial reefs (MFAR).
Jmse 08 00175 g004
Figure 5. Significant wave height dissipation (arrows represent their mean direction) for frequent wave condition (SWAN model) for the west wave direction (upper panel): submerged detached breakwater (a1), emerged detached breakwater (b1), and MFAR (c1); and for the northwest wave direction (lower panel): submerged detached breakwater (a2), emerged detached breakwater (b2), and MFAR (c2). The indicated numbers relate to: 1—wave shoaling in the structure outward zone; 2—wave shoaling at the structure apex; 3—wave shoaling in the structure inward zone; 4—negligible overtopping; 5—pronounced shadow zone; 6—significant wave height increase due to diffraction.
Jmse 08 00175 g005
Figure 6. Significant wave height dissipation for frequent wave condition (XBeach model) for the west wave direction (upper panel): submerged detached breakwater (a1), emerged detached breakwater (b1), and MFAR (c1); and for the northwest wave direction (lower panel): submerged detached breakwater (a2), emerged detached breakwater (b2), and MFAR (c2). The indicated numbers relate to: 1—wave shoaling in the structure outward zone; 2—wave shoaling at the structure apex; 3—wave shoaling in the structure inward zone; 4—significant wave height decrease (suggesting accretion); 5—negligible overtopping; 6—pronounced shadow zone; 7—waves progression towards shoreline (indicating erosion problems).
Jmse 08 00175 g006
Figure 7. Comparison between the SWAN and XBeach significant wave height results for frequent wave condition (west direction): submerged detached breakwater (section A-A), emerged detached breakwater (section B-B), and MFAR (Section C-C).
Jmse 08 00175 g007
Figure 8. Cumulative sedimentation and erosion (arrows represent wave velocity vectors) for frequent wave condition (XBeach model) for the west direction (upper panel): submerged detached breakwater (a1), emerged detached breakwater (b1), and MFAR (c1); and the northwest direction (lower panel): submerged detached breakwater (a2), emerged detached breakwater (b2), and MFAR (c2). The indicated numbers relate to: 1—substantial erosion; 2—erosion in the structure outward zone due to wave reflexion; 3—erosion due to increase of wave velocity; 4 and 5—erosion due to vortexes local scouring near shoreline; 6—accretion in the structure inward zone; 7—noticeable accretion near shoreline; 8—accretion southwards the structure.
Jmse 08 00175 g008
Figure 9. Effect of storm wave condition with west wave direction on an MFAR for (a) significant wave heights dissipation for XBeach model, (b) cumulative sedimentation and erosion (arrows represent wave velocity vectors) for XBeach, and (c) configuration of bed level. The indicated numbers in (a) and (b) relate to: 1—substantial significant wave heights in the structure outward zone; 2—wave shoaling at the structure apex; 3—wave shoaling in the structure inward zone due to depth decrease; 4—wave progression towards shoreline (indicating erosion problems); 5a—substantial erosion due to local scouring from the increase in waves velocity and small wave refraction (due to wave propagation at different depths); 5b—substantial erosion due to local scouring from the combination of incoming waves from the north and the vortex (increased waves velocity); 5c—substantial erosion due to local scouring from the intersection of both vortexes in the same direction; 6—noticeable erosion near shoreline; 7a—substantial accretion in the structure outward zone; 7b—substantial accretion southeast of the structure, near shoreline; 7c—accretion near shoreline and southwards the structure. The indicated numbers in (c) relate to 1—erosion phenomenon; 2—sedimentation phenomenon.
Jmse 08 00175 g009
Table 1. Information regarding structure dimensions and input conditions for SWAN and XBeach models.
Structure Geometry
Submerged Detached BreakwaterEmerged Detached BreakwaterMFAR
Length (m)250250250
Crest level (m)−1.51.0−1.5
Crest width (m)101075
Side slope2:12:11:10
Opening angle (°)45
Distance to shoreline (m)440440440
Numerical Model Conditions
SWAN (hydrodynamics)XBeach (hydrodynamics)XBeach (morphodynamics)
Tide level (m)000
Wave conditionFrequentFrequentFrequent
Wave directionsWest and northwestWest and northwestWest and northwest
Wave condition (extra scenario for MFAR)StormStorm
Wave direction (extra scenario for MFAR)WestWest
Boundary conditions for frequent wave scenario (west)North, west, and south: Hs = 1.5 m, T = 9 s, Direction = 270°Front and back: abs_2d
Left and right: wall
Front and back: abs_2d
Left and right: wall
Boundary conditions for frequent wave scenario (northwest)North, west, and south: Hs = 1.5 m, T = 9 s, Direction = 315°Front and back: abs_2d
Left and right: wall
Front and back: abs_2d
Left and right: wall
Boundary conditions for storm wave scenarioFront and back: abs_2d
Left and right: wall
Front and back: abs_2d
Left and right: wall
Sediments dimensions (µm)D50 = 200
D90 = 300
Morphological acceleration factor (morfac)100
Chèzy60
Directional energy distribution (dtheta)10
Wave type processJONSWAP spectrumJONSWAP spectrumStationary mode
Simulation time (hours)221800
Computational domain (m)1670 × 1870 (crosshore × longshore)
Grid spatial resolution (m)dx = dy = 5
Table 2. Comparison of numerical model results before and after each structure considering the west wave direction condition.
Structure: Submerged Detached Breakwater
ModelHs = 1.5 m, T = 9 s, West Wave Direction
Before (m)After (m)Reduction (%)Energy Reduction (%)
SWAN1.491.2416.7730.72
XBeach1.541.0631.0052.38
SWAN - XBeach−0.050.18
Structure: Emerged Detached Breakwater
ModelHs = 1.5 m, T = 9 s, West Wave Direction
Before (m)After (m)Reduction (%)Energy Reduction (%)
SWAN1.490.3775.493.9
XBeach1.490.8046.171.0
SWAN - XBeach0.00−0.43
Structure: MFAR
ModelHs = 1.5 m, T = 9 s, West Wave Direction
Before (m)After (m)Reduction (%)Energy Reduction (%)
SWAN1.491.1423.3041.17
XBeach1.540.9538.2161.82
SWAN - XBeach−0.050.19

