Numerical Analysis of Vertical Breakwater Stability under Extreme Waves


1
Marine Science and Information Research Center, National Academy of Marine Research, Kaohsiung 80661, Taiwan
2
Department of Civil Engineering, National Cheng Kung University, Tainan 701, Taiwan
3
Department of Marine Environment and Engineering, National Sun Yat-sen University, Kaohsiung 80424, Taiwan
4
Harbor and Marine Technology Center, Institute of Transportation, Ministry of Transportation and Communications, Taichung 435058, Taiwan
*
Author to whom correspondence should be addressed.
J. Mar. Sci. Eng. 2020, 8(12), 986; https://doi.org/10.3390/jmse8120986
Submission received: 6 October 2020
/
Revised: 27 November 2020
/
Accepted: 1 December 2020
/
Published: 3 December 2020
(This article belongs to the Special Issue Wave Interactions with Coastal Structures)
Abstract
:The purpose of this study is to perform a numerical simulation of caisson breakwater stability concerning the effect of wave overtopping under extreme waves. A numerical model, which solves two-dimensional Reynolds-averaged Navier–Stokes equations with the k−ε turbulence closure and uses the volume of fluid method for surface capturing, is validated with the laboratory observations. The numerical model is shown to accurately predict the measured free-surface profiles and the wave pressures around a caisson breakwater. Considering the dynamic loading on caisson breakwaters during overtopping waves, not only landward force and lift force but also the seaward force are calculated. Model results suggest that the forces induced by the wave overtopping on the back side of vertical breakwater and the phase lag of surface elevations have to be considered for calculating the breakwater stability. The numerical results also show that the failure of sliding is more dangerous than the failure of overturning in the vertical breakwater. Under extreme waves with more than 100 year return period, the caisson breakwater is sliding unstable, whereas it is safe in overturning stability. The influence of wave overtopping on the stability analysis is dominated by the force on the rear side of the caisson and the phase difference on the two ends of caisson. For the case of extreme conditions, if the impulse force happens at the moment of the minimum of load in the rear side, the safety factor might decrease significantly and the failure of sliding might cause breakwater damage. This paper demonstrates the potential stability failure of coastal structures under extreme sea states and provides adapted formulations of safety factors in dynamic form to involve the influence of overtopping waves.
1. Introduction
It is important to provide guidelines of structure stability for designing coastal protection structures or harbor breakwaters. Many previous studies on wave-structure interaction have discussed the seaward and lifting forces including those induced by the effects of wave overtopping and breaking from the physical or numerical models. Among these studies, the most important historical failures of the vertical structure have been documented [1]. Large-scale hydraulic experiments have been performed over the past several decades, leading to different empirical formulations that allow for the calculation of loads induced by wave breaking on vertical breakwaters [2,3,4,5]. Some semi-empirical equations for impulsive loads on vertical breakwaters are based on experimental data and, in some cases, with prototype-measured data [6]. Recently, the most commonly semi-empirical formulas for calculating pressures on a vertical structure wave have been developed [7,8,9]. When the wave obliquely enters the elongated structure, the maximum wave force decreases [10,11]. Lately, research results have reported that an increase in wave pressure caused by the diffracted wave can be one of the reasons for destruction of the conventional caisson breakwater [12].
In the theoretical analysis, there are some idealized analytical models which have been presented to study the forces exerted on the vertical structures [13,14]. However, these analytical approaches are complicated and inconvenient due to the complex geometries. In order to overcome the limitations, the numerical models have been developed since they are more flexible and efficient. The nonlinear shallow water or Boussinesq equations are developed to simulate the wave–structure interaction in coastal processes, especially for porous structures [15,16,17,18,19,20,21,22]. Besides, a boundary element method was used to solve the unsteady Forchheimer equations and described the wave transmission and reflection by a multilayer breakwater with arbitrary shapes [23]. Recently, the development of more efficient Navier–Stokes solvers have allowed a more sophisticated modelling of the wave-structure interaction problem [24,25,26,27]. For instance, the Reynolds-averaged Navier–Stokes (RANS) approach employing the volume of fluid (VOF) method for the modelling of complex (turbulent) flows has become popular in the past two decades [28,29,30]. A robust model was presented to investigate the functionality of rubble mound breakwaters with special attention focused on wave overtopping processes [31]. Then a numerical analysis considering wave loads corresponding to a low-mound and a rubble-mound breakwater with both regular and irregular incident wave conditions was carried out [32]. The results showed that this RANS equation model had a high potential to become a complementary tool to analyze the hydraulic response of caisson structures.
However, the existing research described above only considered the forces on the seaward and bottom of the caisson breakwater. The harbor-side loads induced by wave overtopping on a caisson breakwater have been investigated [33] and concluded that the backward loads should be considered as failure mode when designing the caisson breakwater. Very little information has been reported on wave forces acting on the backward side of caisson breakwater, which is an important factor in calculating the sliding and overturning stabilities for the engineering design. In this study, we shall extend the numerical model based on the Reynolds-averaged Navier–Stokes (RANS) equations to simulate the extreme wave overtopping induced loads on the front, bottom and rear sides of caisson breakwater. The numerical results are validated with the experimental data of surface elevations and wave pressures acting on the caisson breakwater [34]. The numerical model is applied to actual caisson breakwaters under various extreme wave conditions and the results are compared to the empirical formulas to discuss the stability of sliding and overturning [35]. Finally, some conclusions are made.
2. The Numerical Model
In this paper we used a numerical model (COBRAS model) which is a depth and time resolving 2DV numerical model solving the Reynolds-averaged Navier–Stokes (RANS) equations and the turbulence closure model to check experimental data. The RANS equations for the ensemble-averaged velocity, , and the ensemble-averaged pressure, <p>, are well-known and can be expressed as
in which i, j = 1, 2 for two-dimensional flow and is the viscous stress. , and t denote the water density, pressure and time. The Reynolds stress is calculated with a nonlinear eddy viscosity relationship [36]. This nonlinear closure relationship for Reynolds stress mimics the more complete Reynolds stress closure without solving the transport equations of Reynolds stress. A demonstratation showed that standard linear eddy viscosity closure tends to over predict the diffusion of turbulence under breaking waves [29], and the nonlinear relationship suggested above predicts better turbulence statistics when compared with laboratory data of breaking wave over sloping beaches [37]. The governing equations are solved by a finite difference scheme. A two-step projection method is adopted to calculate the RANS equation. The evolution of free surface is calculated by the VOF method. The functionality of rubble mound breakwaters with special attention focused on wave overtopping processes uses the COBRAS model, and the numerical result comparison with experimental data has good agreement [38]. The mean overtopping discharge at the root of the South Breakwater of Póvoa de Varzim Harbour (Portugal) modelling by COBRAS model has good agreement with physical model tests [38].
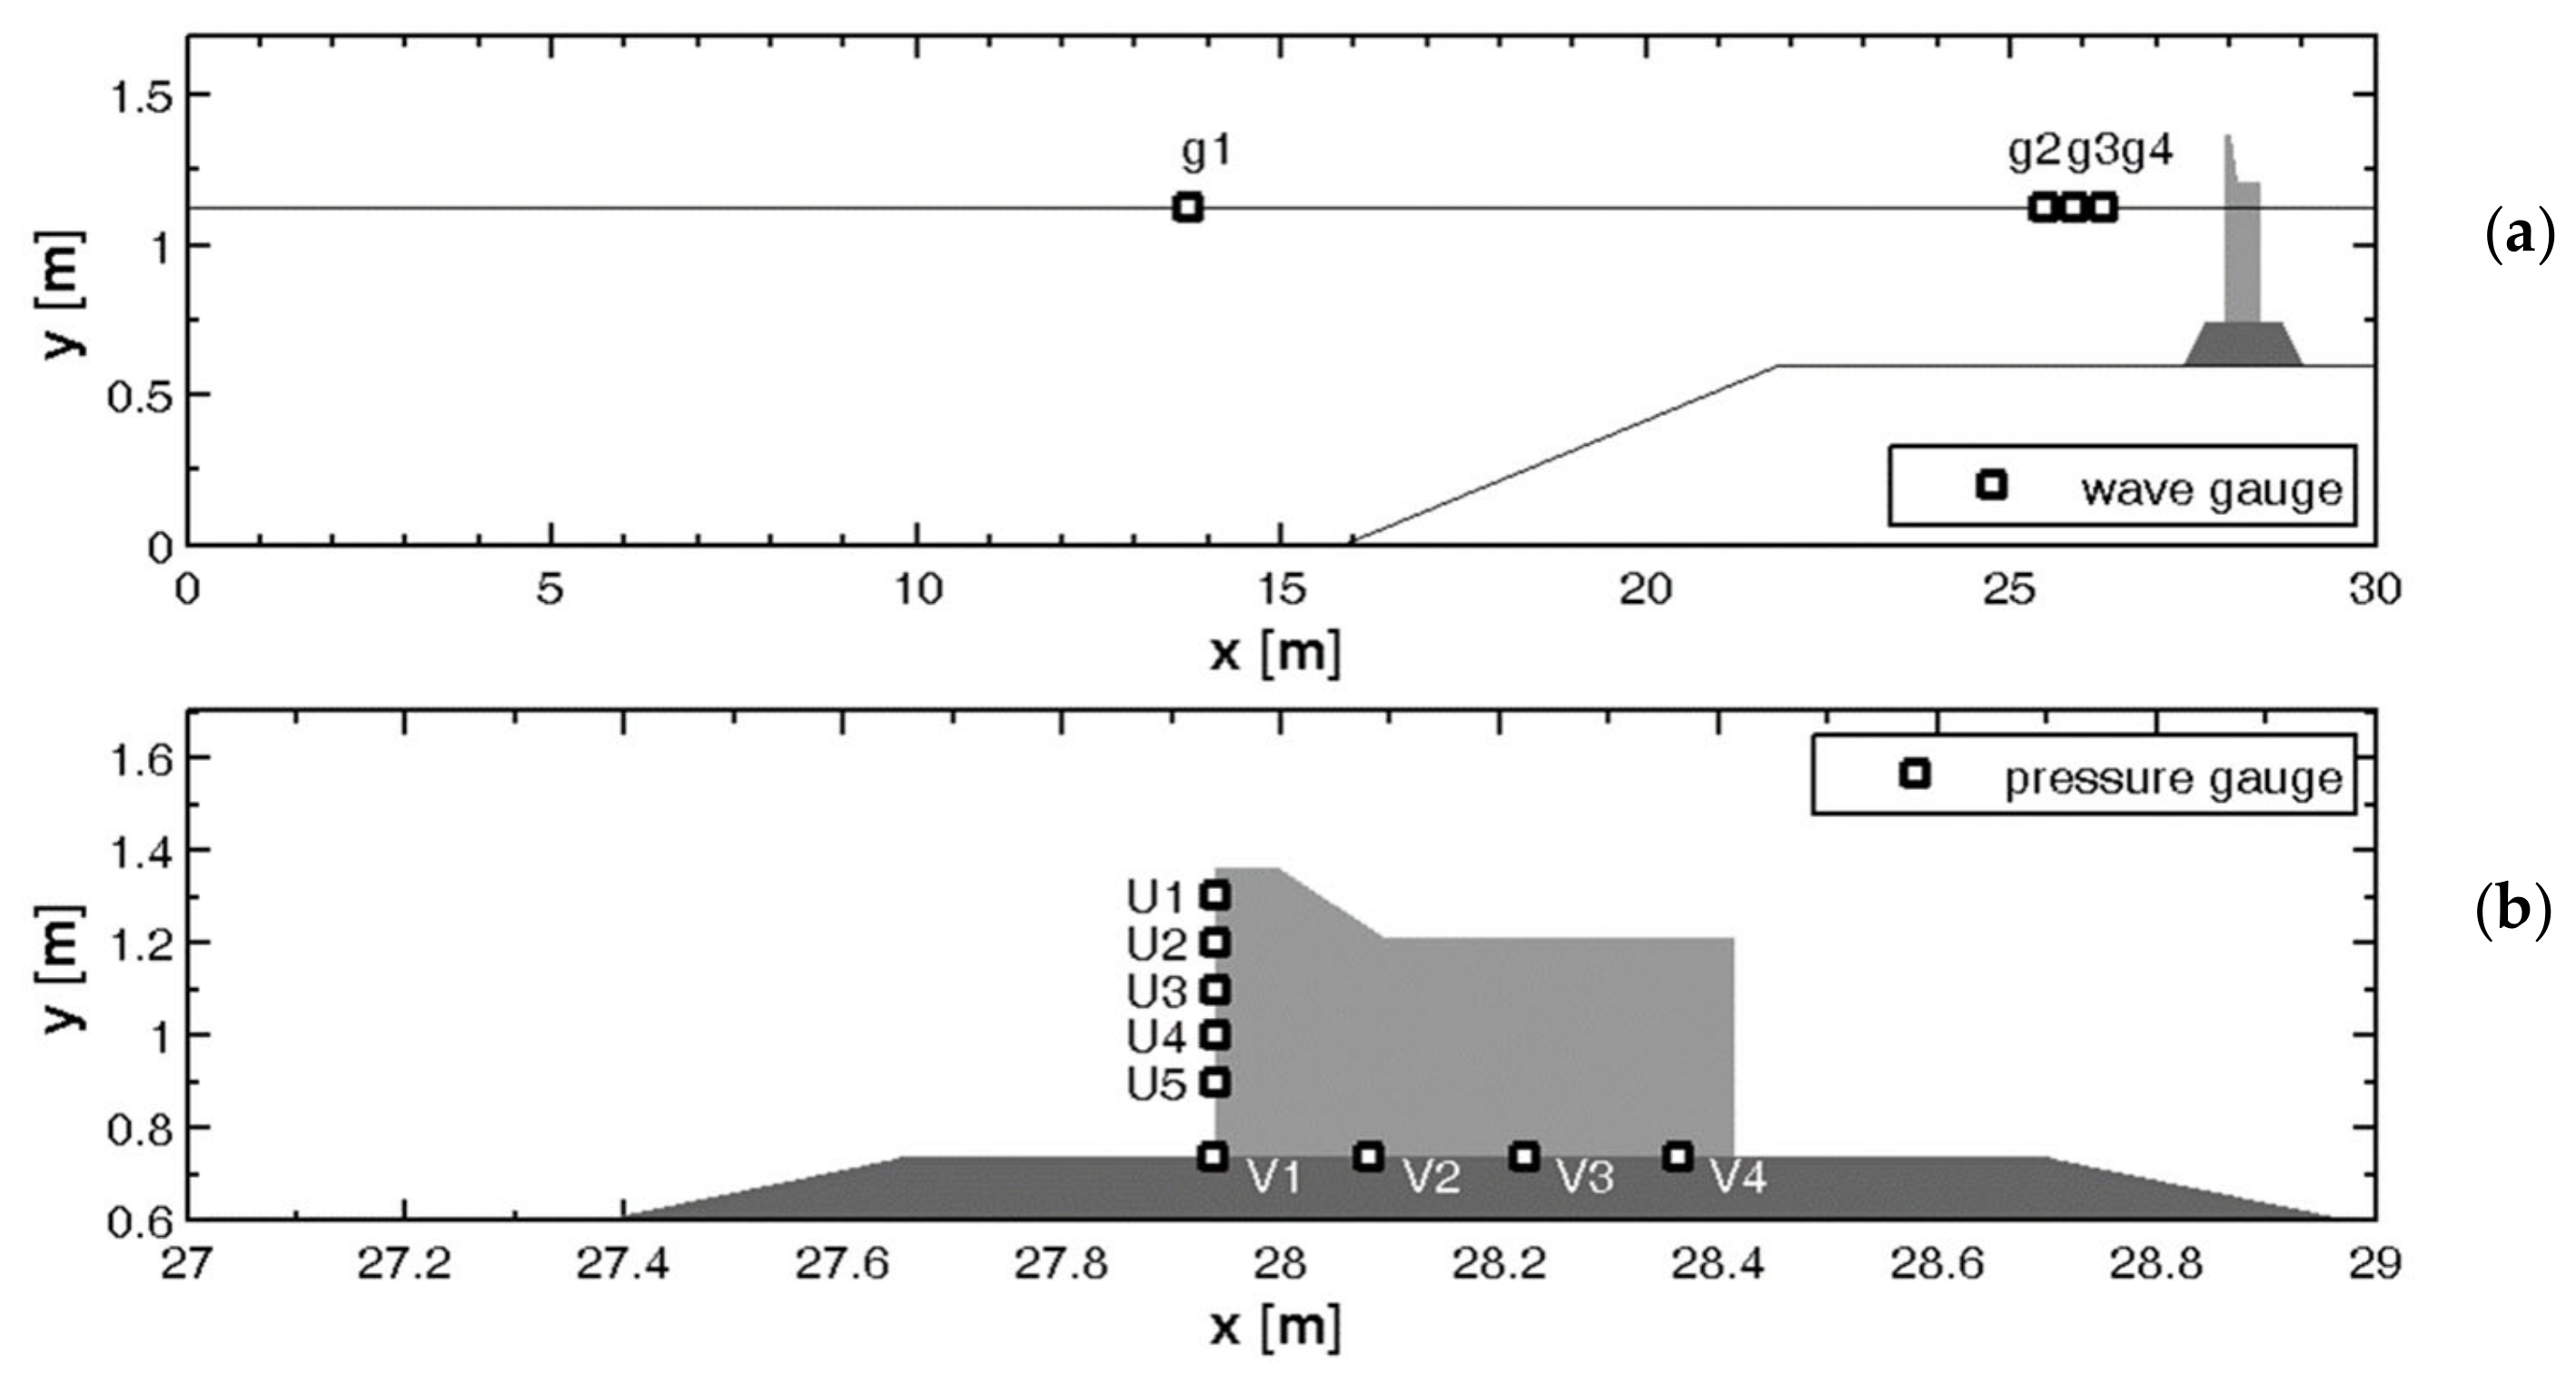
A small-scale (1:36) physical model was carried out in a wave flume (100 m × 1.5 m × 2 m) to study the wave forces on a composite vertical breakwater [34], which was composed of an impermeable vertical caisson and permeable rubble foundation as shown in Figure 1. The specifications of the breakwater were as follows: the water depth was 0.526 m, the freeboard height was 0.153 m, the mound height was 0.138 m and the caisson weight was 780.66 kg. There were four wave gauges marked g1–g4 to measure the surface elevations and nine pressure transducers to measure wave pressures where five pressure transducers were along the front face of the caisson (U1–U5) and four pressure transducers were set on the bottom of the caisson (V1–V4). For the permeable rubble foundation, the median diameter was 0.7 cm and the porosity was 0.49. The incident wave height and period was experimental measured at wave gauge g1. Wave gauges (g2–g4) were used to calculate the reflection of the breakwater. A numerical flume was implemented with the same characteristics in the experimental setup. The computational grid system was discretized with non-uniform meshes in the x and z directions ( = 0.1 m, = 0.05 m). Thus, the total number of cell meshes was 300 × 34. Additionally, the total simulation time was 64 s and the Courant number was 0.3 for all cases. The corresponding time step was automatically adjusted during calculations to satisfy stability constrains by both advection and diffusion processes, in which the maximum time step was adequately chosen as s compared with experimental measurements. The aforementioned computational conditions were used throughout this study.
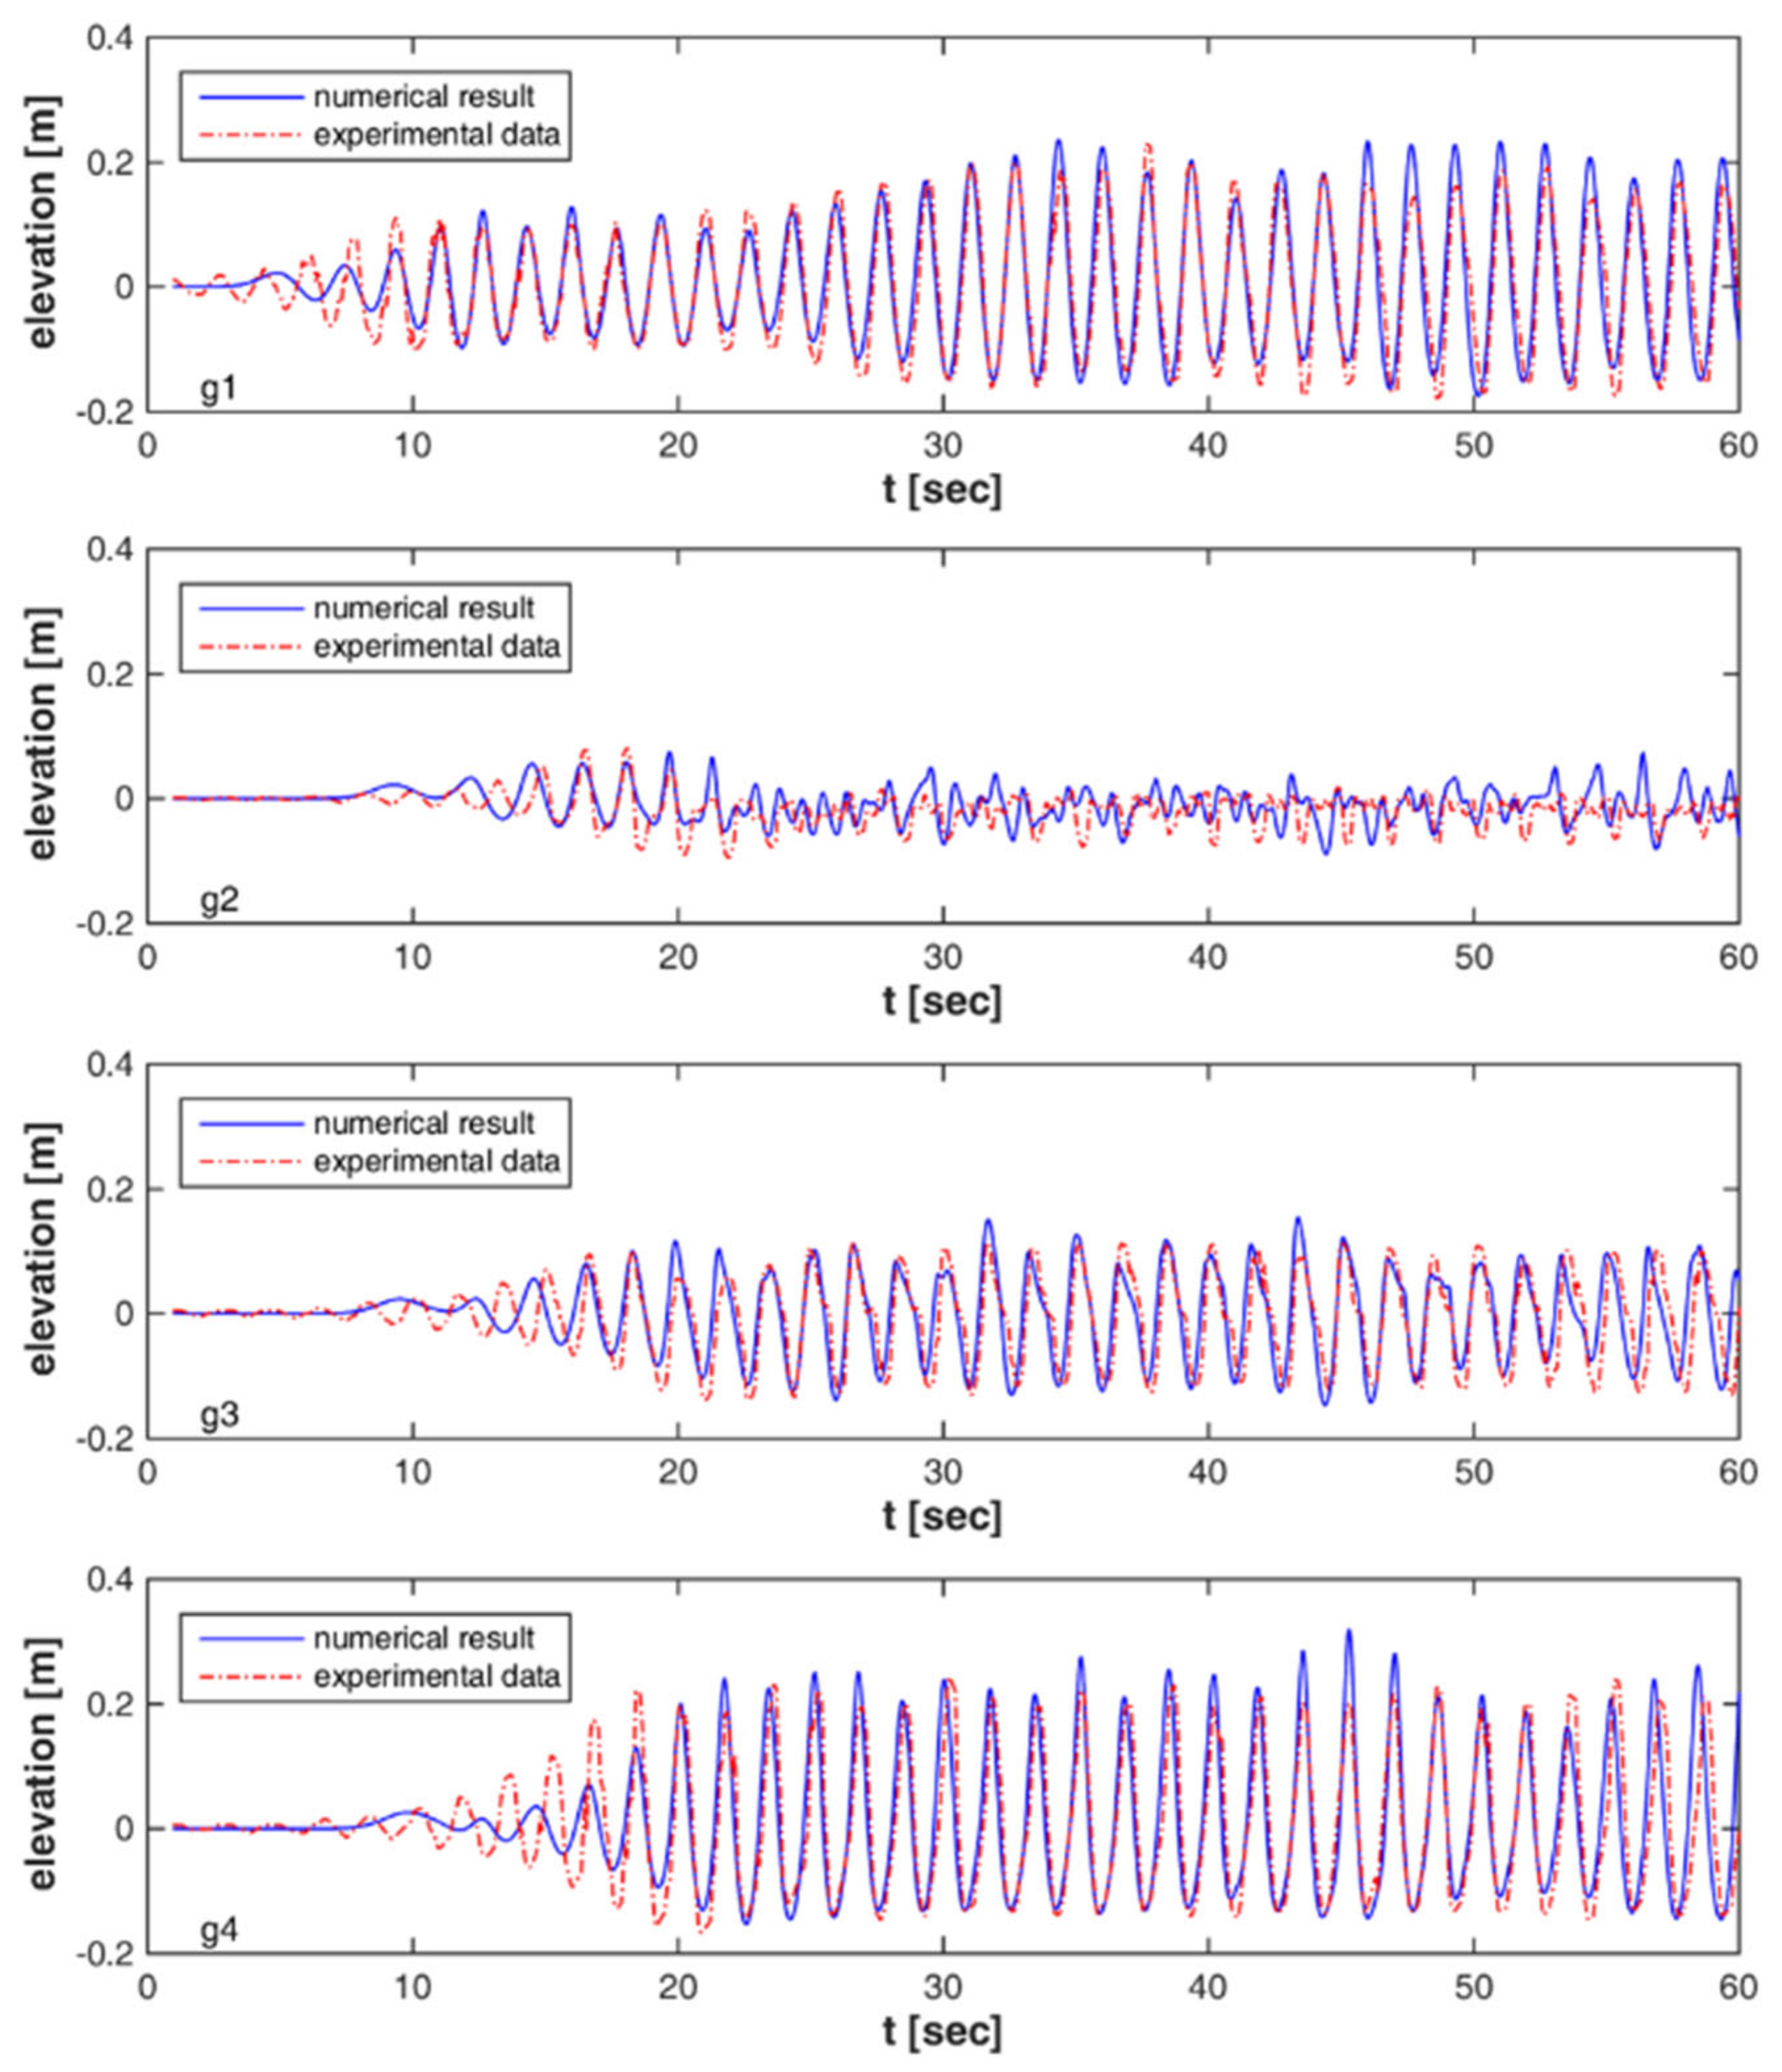
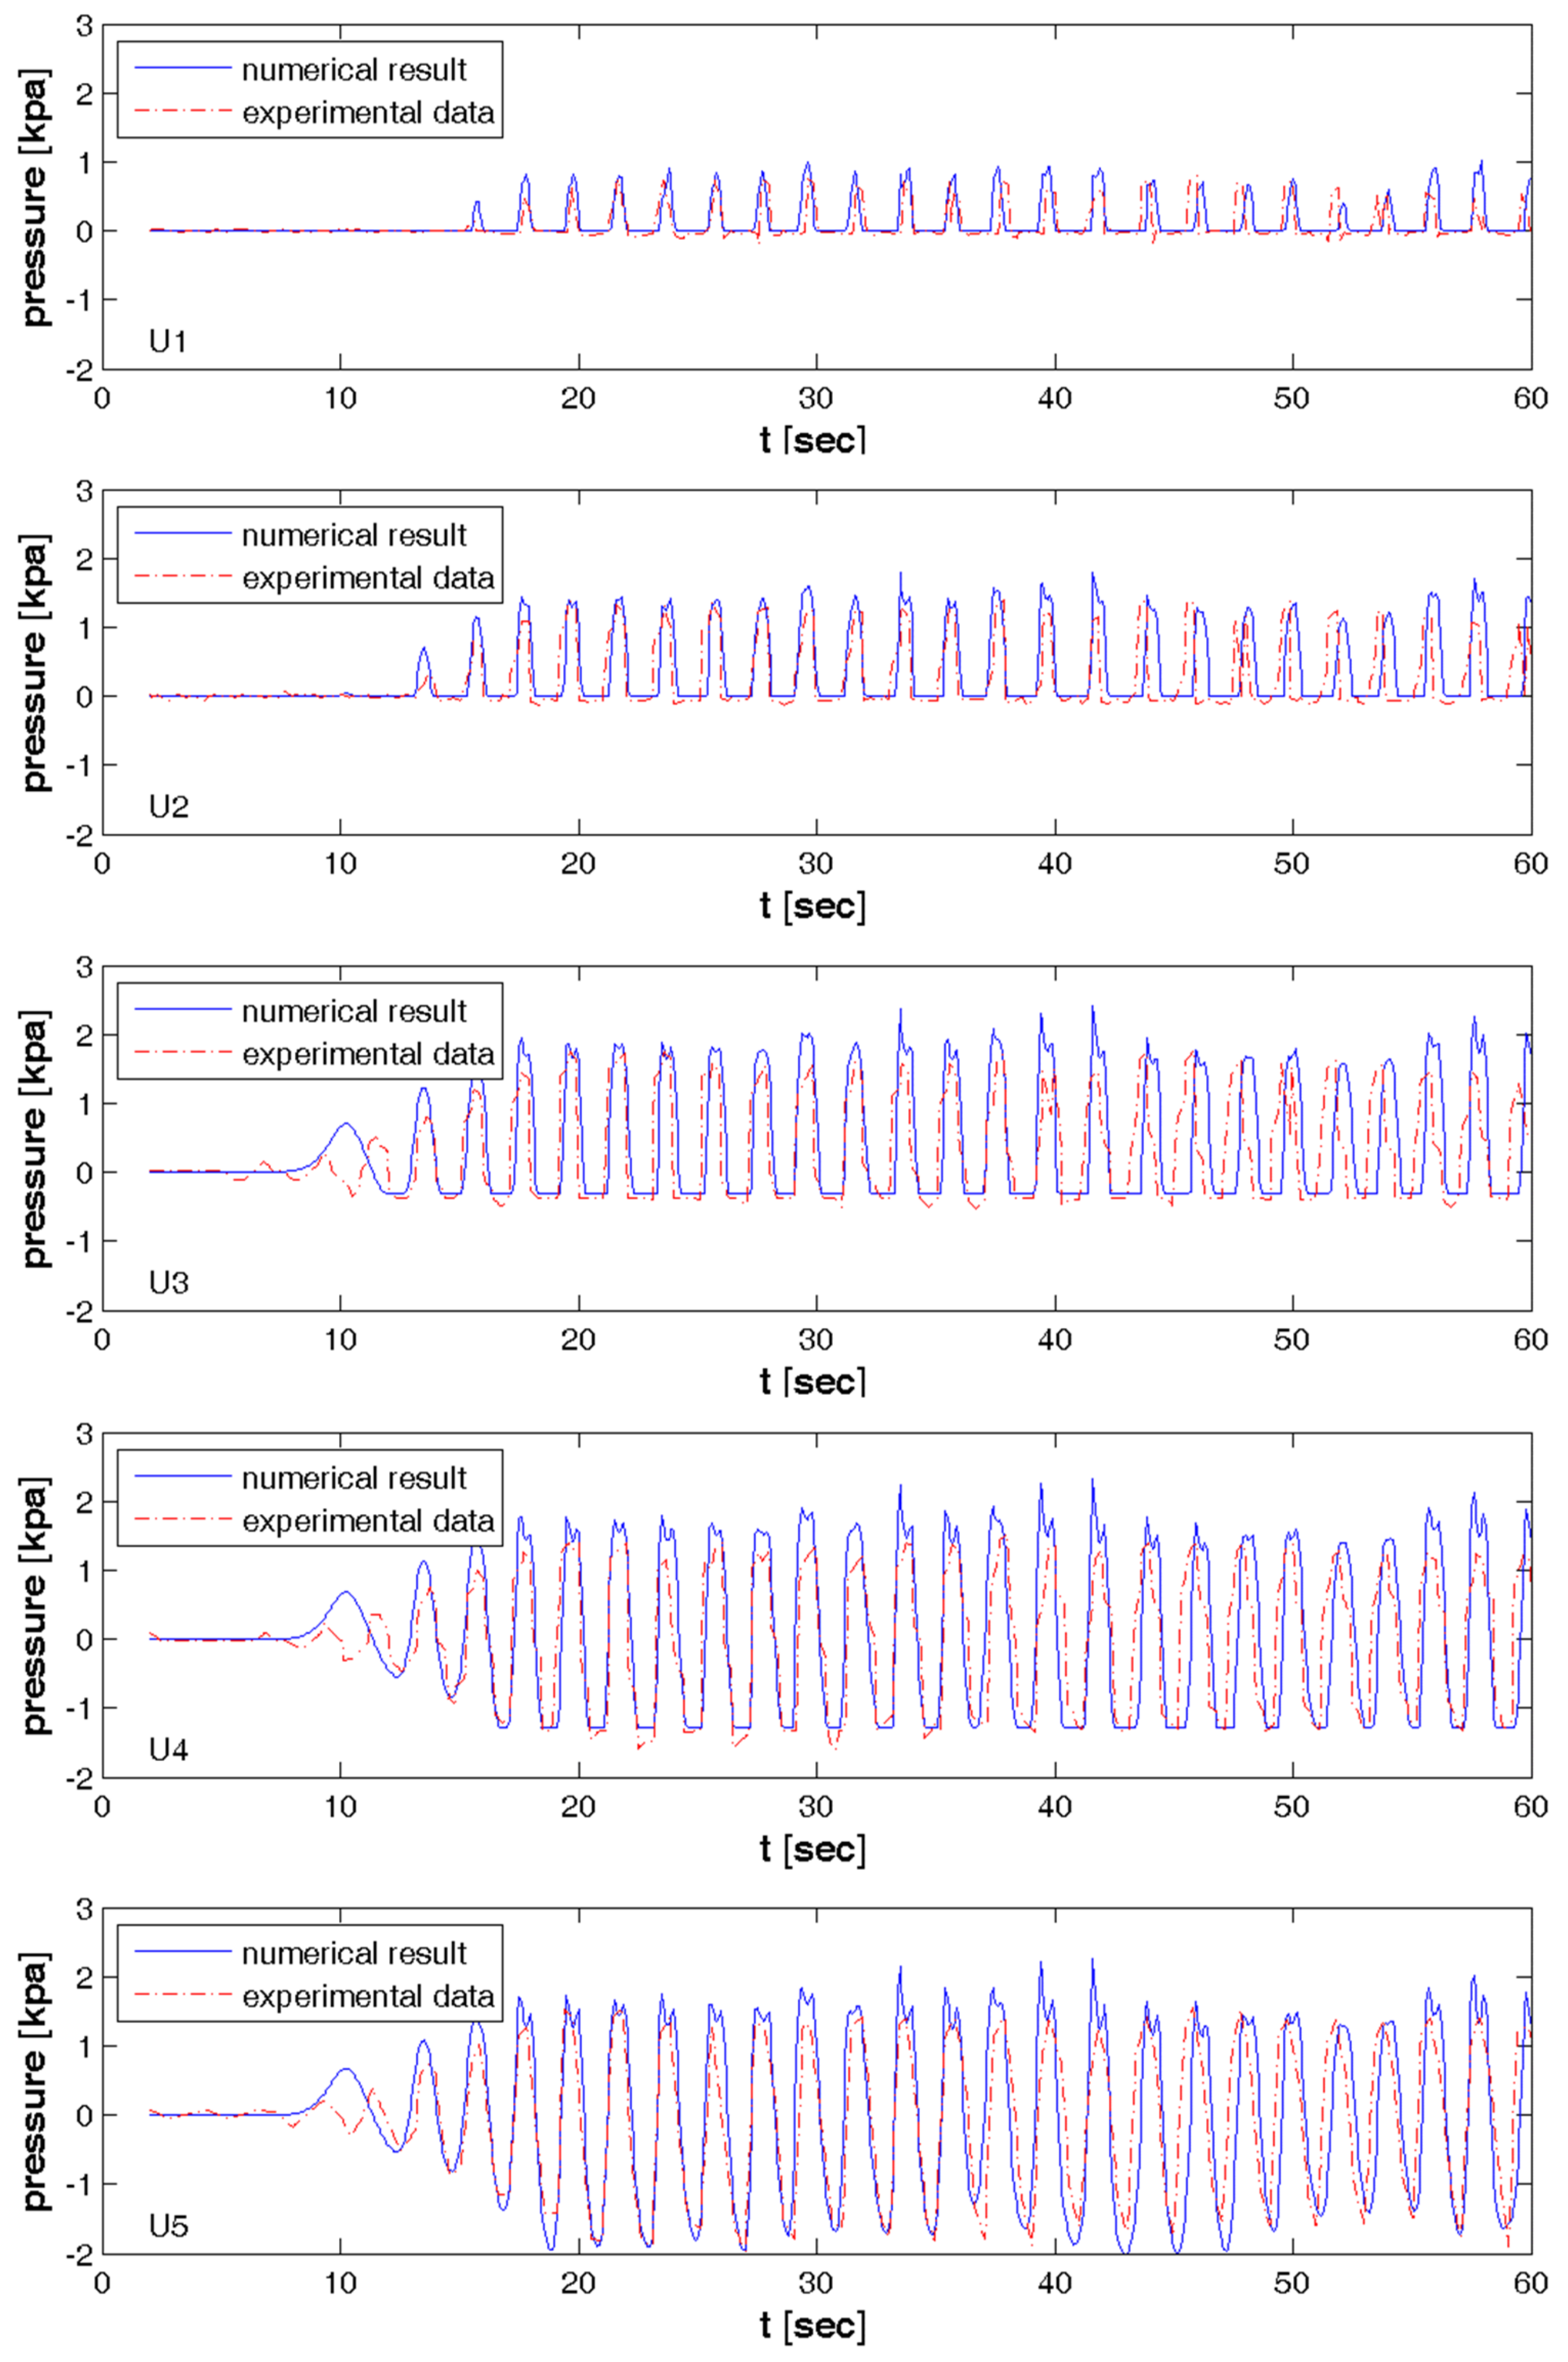
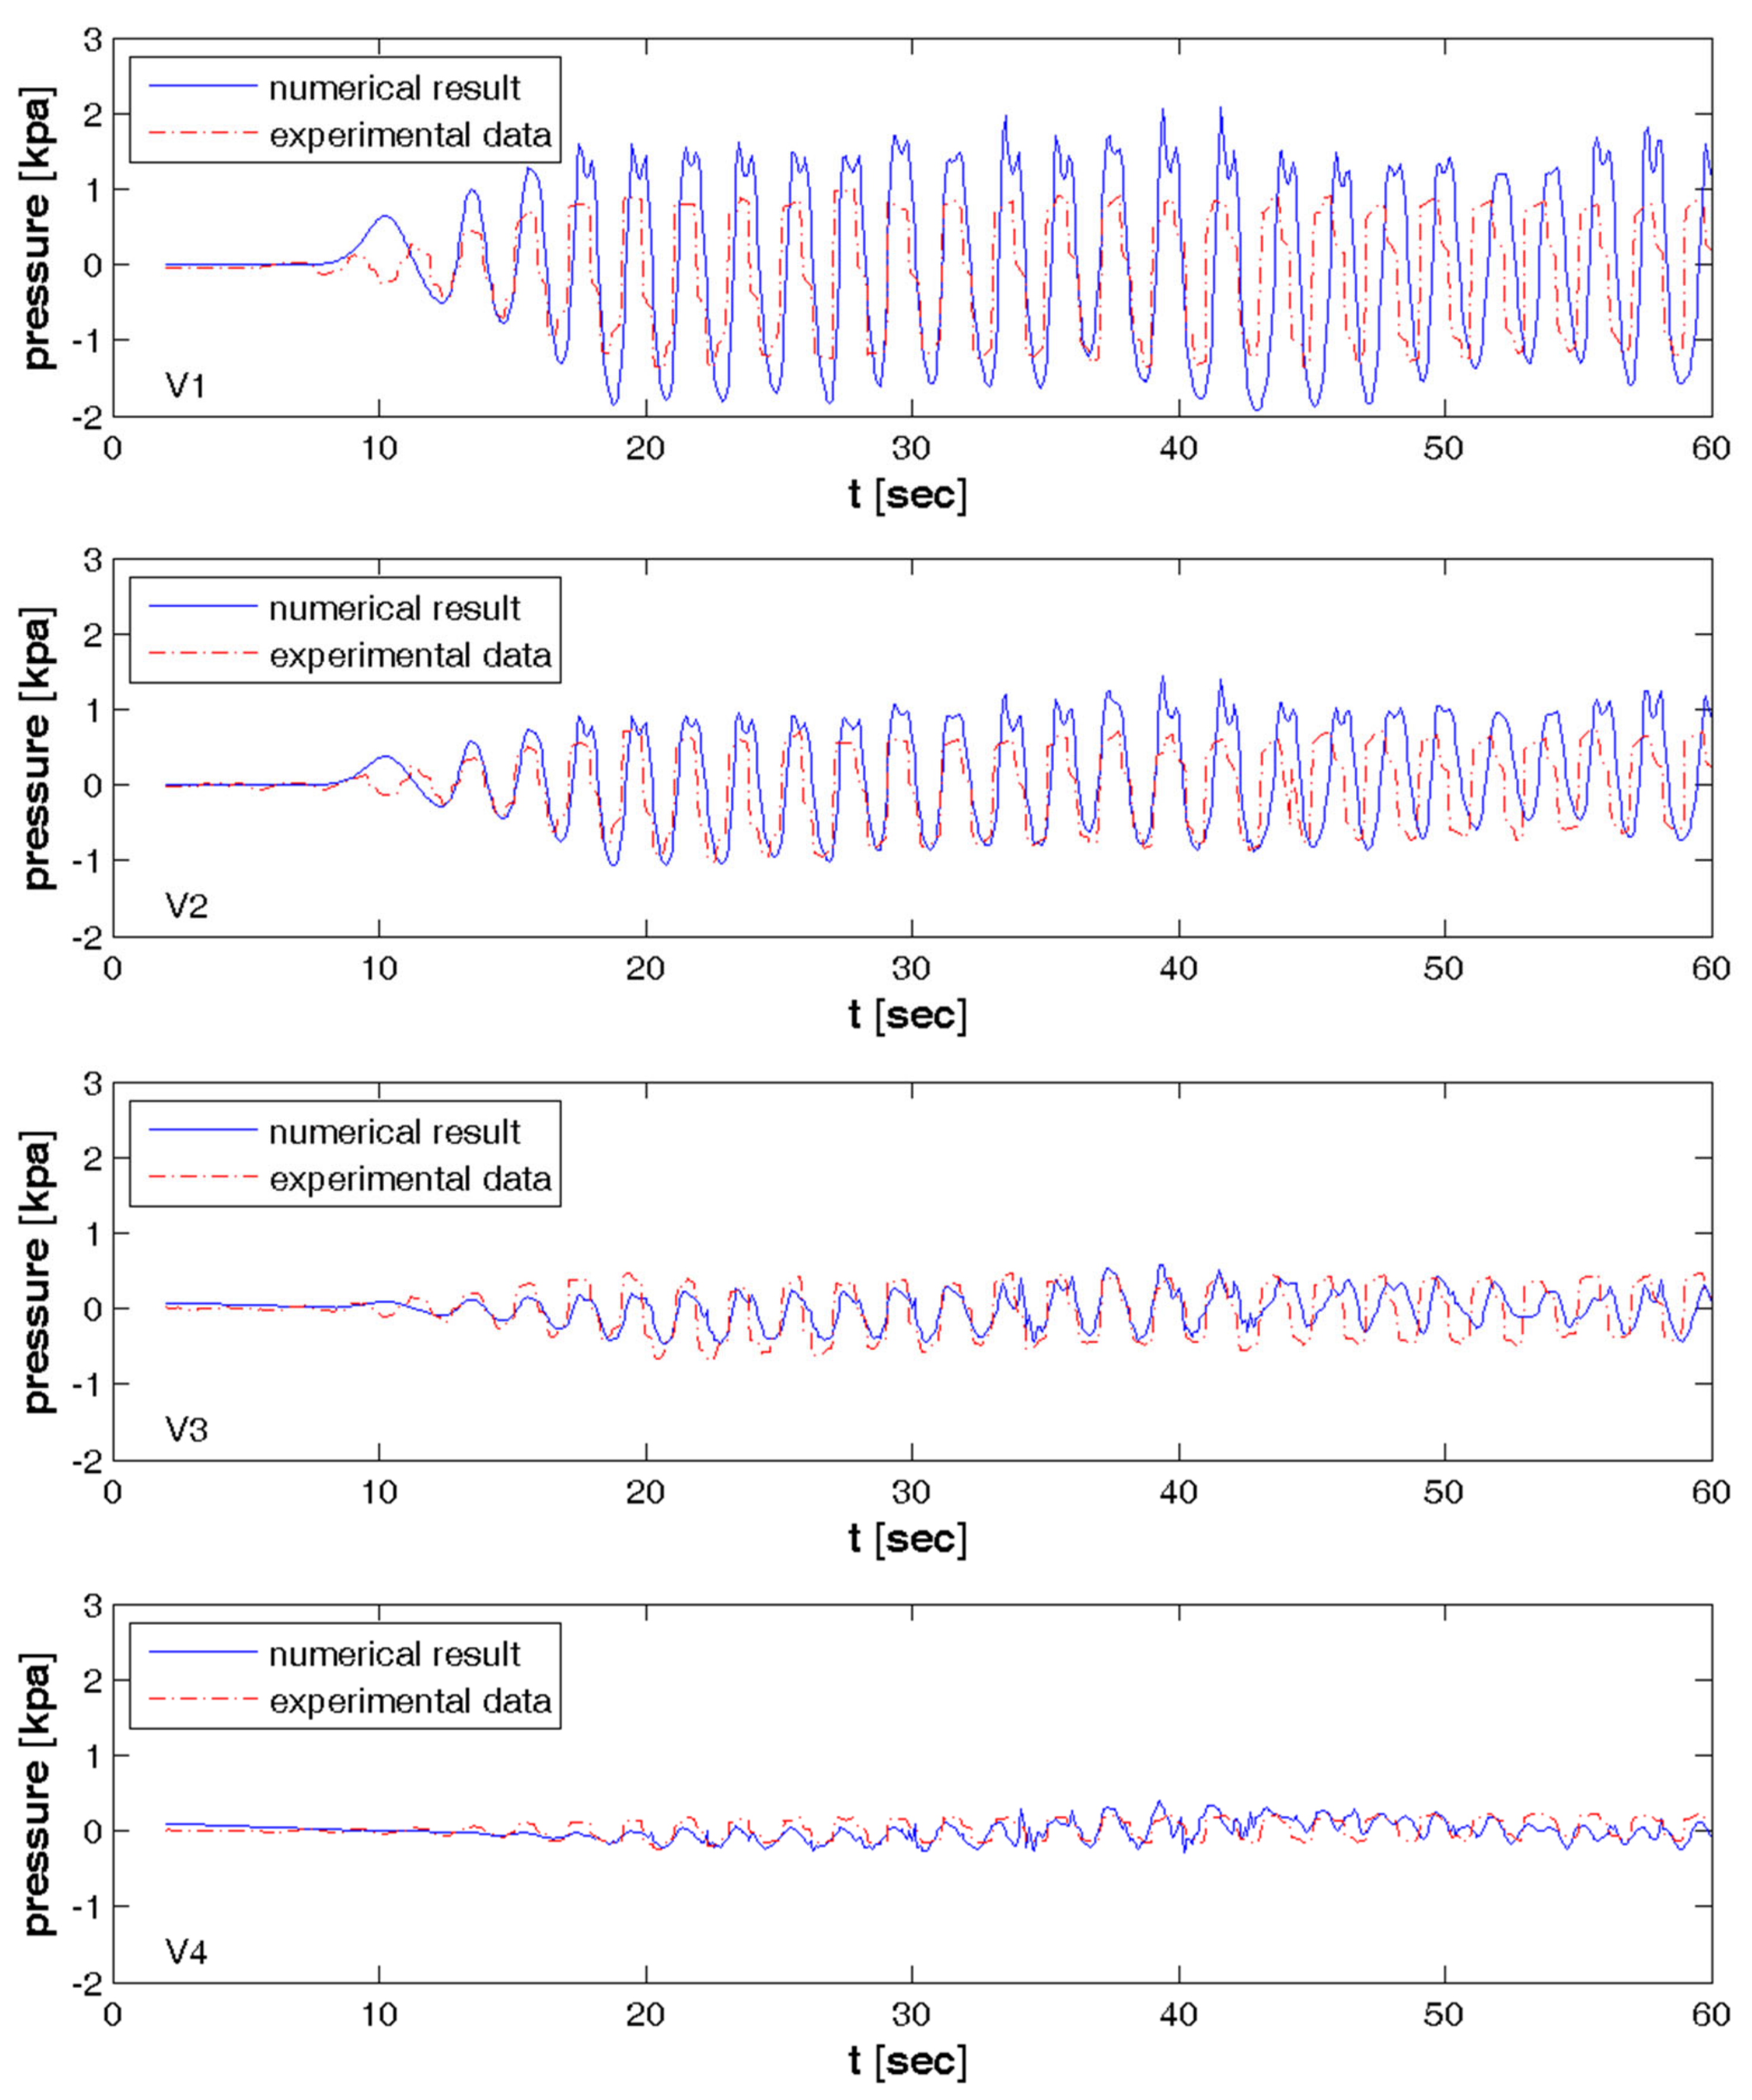
The comparison of wave surface elevations for the four wave gauges between the numerical results and experimental data for wave overtopping is shown in Figure 2. The agreement between numerical results and experimental data was good except the wave gauge g2, where the vicinity of a node of the partial standing wave effected the interaction of the incident wave and reflection wave. Figure 3 and Figure 4 show the comparison of wave dynamic pressure time series between the numerical simulations and experimental data for the regular overtopping wave condition (H = 0.25 m and T = 2 s). The pressure transducers U1~U2 were above the still water label. In Figure 3, the pressure transducers U3~U4 are exposed to air under the wave trough in that wave condition. The comparison includes five pressure transducers along the vertical front face of the caisson (U1–U5) and four pressure transducers underneath the caisson (V1–V4). The solid line represents the numerical simulations while the dashed line represents the laboratory measurements. From Figure 2, Figure 3 and Figure 4, good qualitative comparisons between numerical simulation and experimental data are investigated. It indicates that the numerical model could simulate the waves propagating through the porous medium. In general, the COBRAS numerical model has a good prediction for the dynamic wave pressure time series at the vertical face of the caisson than those beneath the caisson. To quantify the comparisons, a validation method proposed by Wilmott was used as Equation (3) [39]
In Equation (3), Xnum is the numerical result, Xexp is the experimental data and the “” is an averaging operator. The index of validation (φ), ranging from 0 to 1, represents the degree of agreement between numerical predictions and experimental data, and the unit is dimensionless. The validated results are shown as Table 1. The value of validated index, ranging from 0.71 to 0.96, is acceptable. However, it has to be noted that a smaller index is found for the wave dynamic pressure beneath the caisson breakwater. In general, the average value of all validated indexes is 0.8, which indicates that numerical predictions from the COBRAS model and experimental data are consistent. Consequently, the comparisons results provide confidence in the subsequent application of the model to the prototype scale, and which is described in the next section. In this study, we focus on the load on the rear sides of caisson breakwater induced by wave overtopping, so the overtopping discharge won’t be concerned.
3. Stability Analysis of Prototype Vertical Breakwater
3.1. Prototype Wave Load Analysis
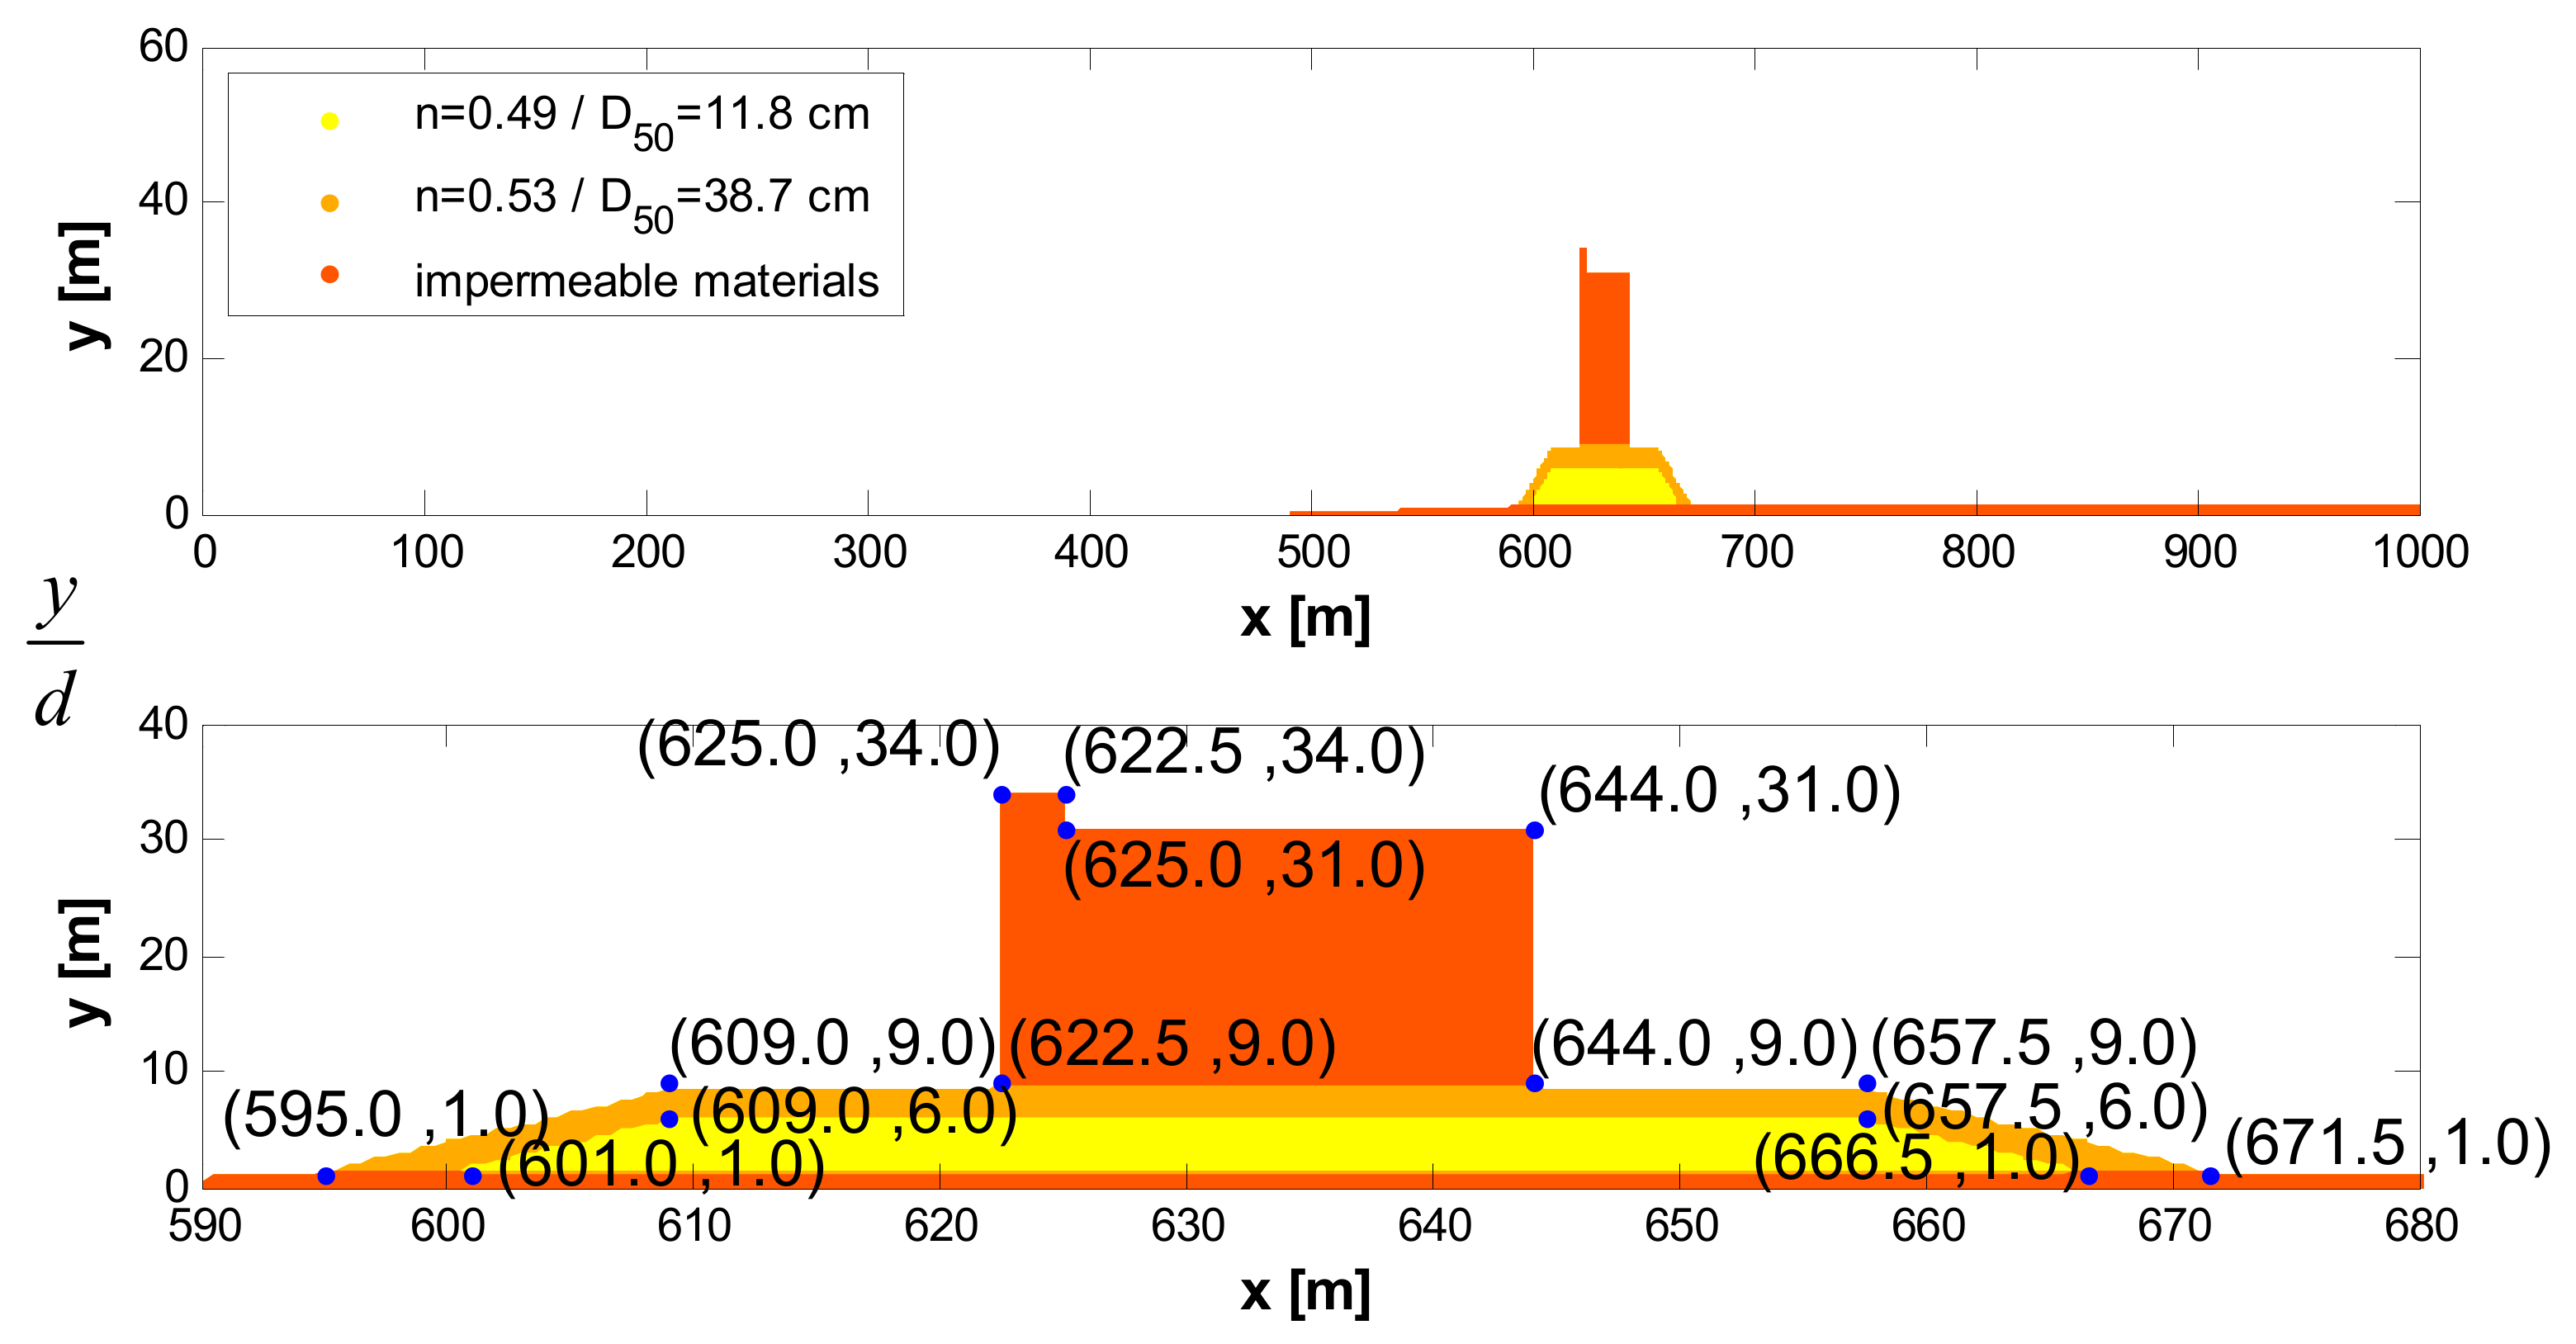
The validated numerical model was used to evaluate the total wave forces on the caisson breakwater in Taiwan at a prototype scale. There are two parts of the caisson breakwater: the porous rubble foundation and vertical caisson with parapet [40]. The vertical caisson is installed on a rubble foundation, which has a thin filter layer between caisson and foundation and is placed on a foreshore slope of 1 on 100. The design wave condition for the breakwater of Taichung harbor is 50 year return period wave condition. The specifications of the breakwater is as follows: the water depth is 22 m, the freeboard height is 11 m and the mound height is 6 m. Figure 5 shows a vertical breakwater cross-section at Taichung harbor in Taiwan. Tests were simulated using regular waves for various values of wave conditions as shown in Table 2. In order to understand the force contribution clearly, the regular wave was applied. Besides the condition of different return period typhoon waves, extreme waves due to climate change were also used [41]. According to [41], the wave height will increase up to 65% and the corresponding wave period might increase to 25% in 2039 around Taiwan. The numerical domain is 1125 m long and 80 m height. The mesh resolution at the structure is 0.2 m in the x-direction and 0.5 m in the y-direction. The rubble mounted layers beneath the caisson are defined using the porous flow parameter in Table 3.
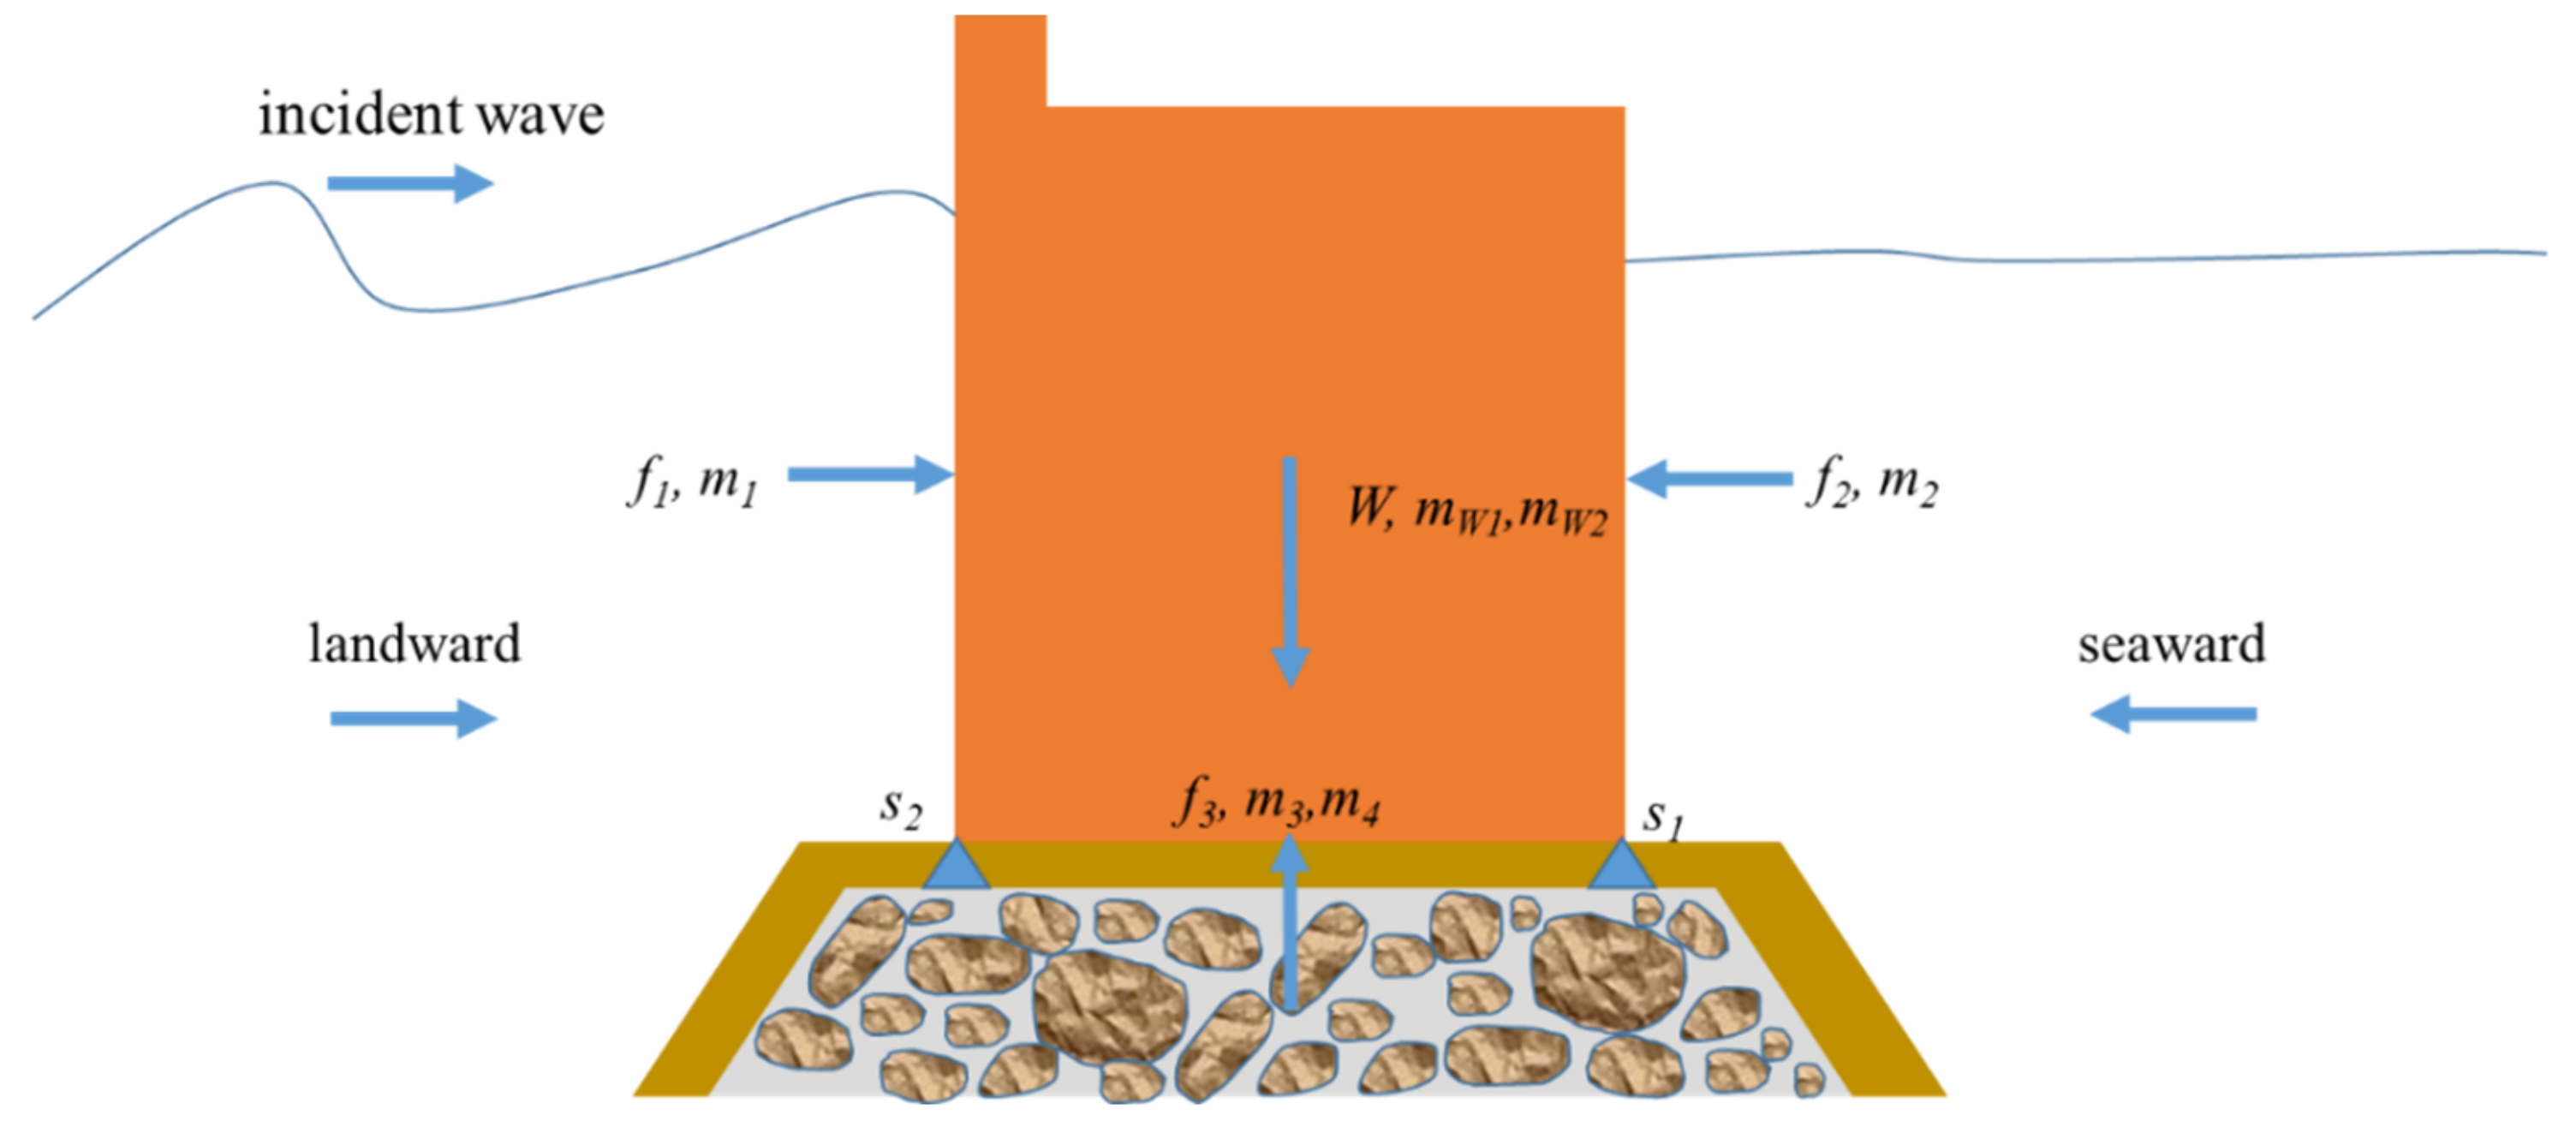
In the past, the existing researches only considered the forces on the seaward and bottom of the caisson breakwater. Very little information has been reported on overtopping wave forces acting on the backward side of caisson breakwater, which is an important factor in calculating the sliding and overturning stabilities for the engineering design. In order to bring more insight on the wave forces induced by the overtopping waves, the numerical model is extended for simulating the wave pressure acting on the front, bottom and back sides of the caisson breakwater. A free body diagram shown in Figure 6 was used to analyze the overtopping wave induced forces and moments acting on the caisson breakwater. In Figure 6, W denotes the weight of caisson, f1 denotes the horizontal force acting on the front face of the caisson, f2 denotes the horizontal force acting on the rear face of the caisson and f3 denotes the uplift force acting on the bottom of the caisson. Buoyancy force is included in still water. The fixed reference point of the moment for the landward overturning is denoted by the point s1, while that for seaward overturning is denoted by the point s2. The moment of f1 is m1, and the moments of f2 is m2. The moment of f3 at fixed point s1 is denoted by m3, and the moment of f3 at fixed point s2 is denoted by m4. The moment of W at fixed point s1 is mw1, and the moment of W at fixed point s2 is mw2.
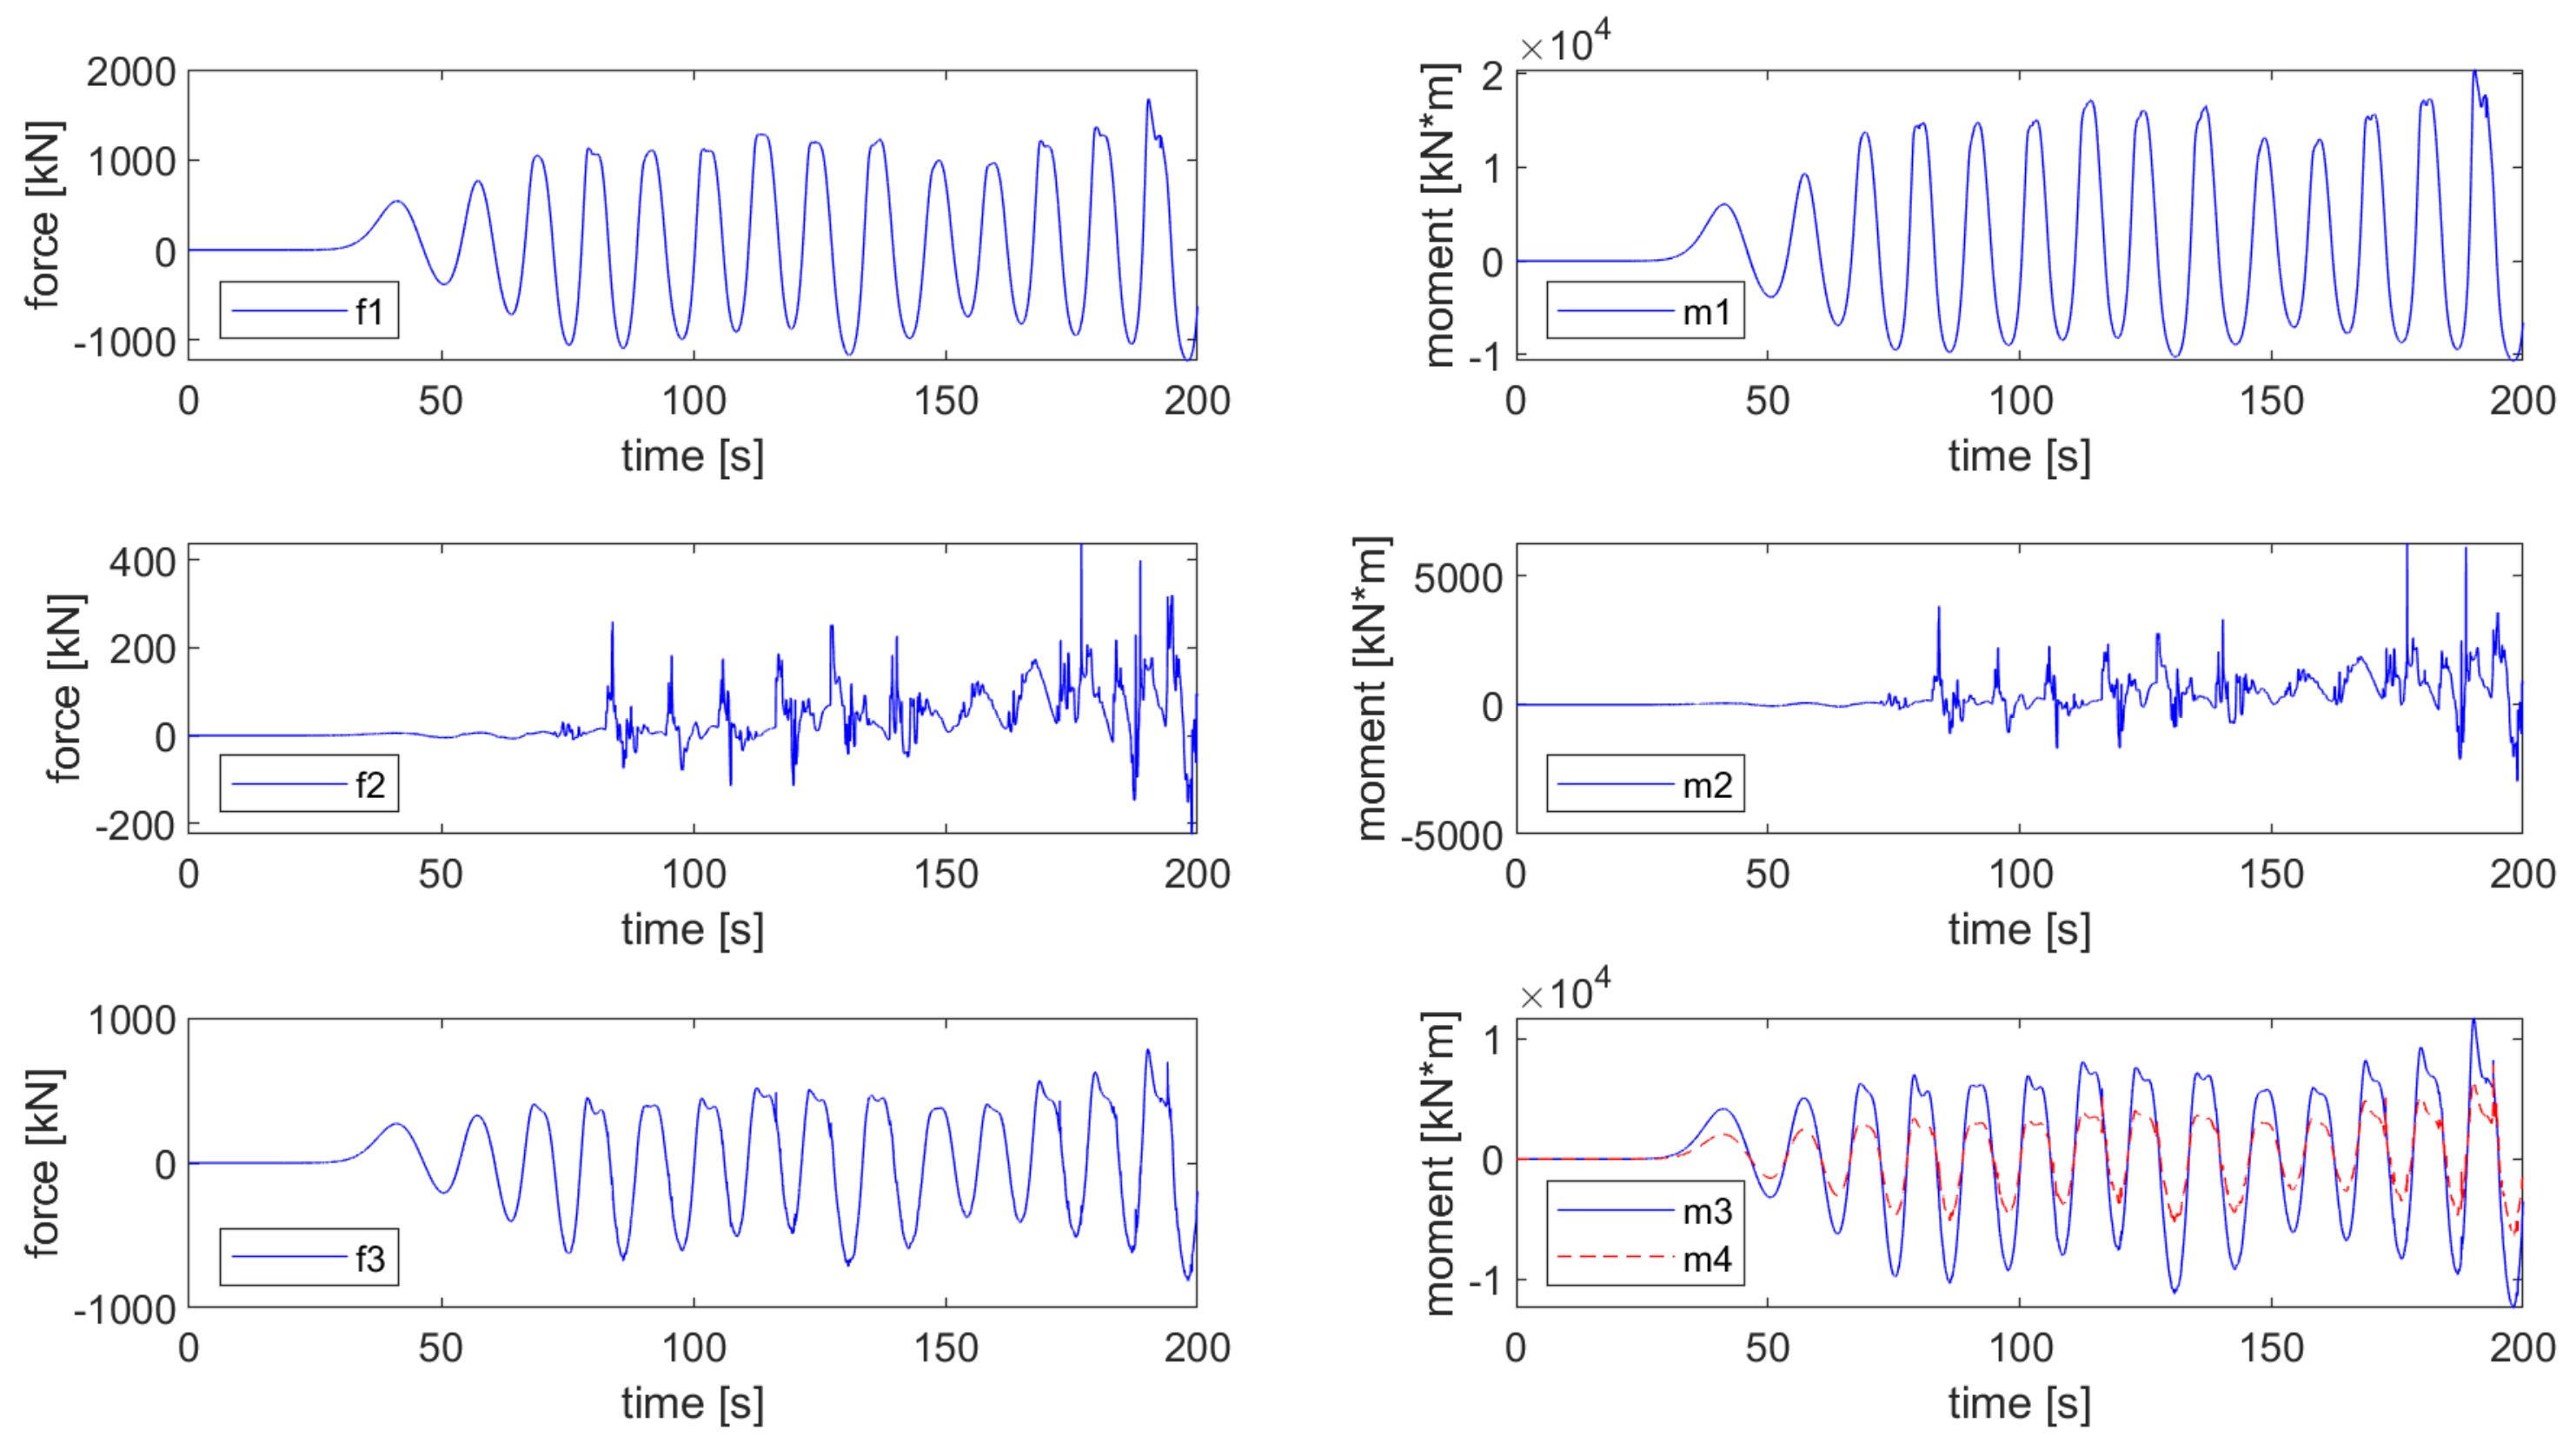
The relative forces and moments acting on a vertical structure can be determined by integrating the numerically calculated pressure over a portion of vertical structure. Figure 7 presents the time histories of horizontal forces on the seaward-side (upper panel), harbor-side (middle panel) and uplift force for the studied case 1. In case 1, wave overtopping happens, indicating that all cases in Table 2 are necessary to investigate the influence of wave overtopping (IWO) on the structure stability. The force calculated included the behavior of flow transmitting through the rubble mound. In case 1, the overtopping wave happened after t = 75 s, so the transmitting flow disturbed a fluctuation of f2 before overtopping. The calculated moments induced by the three forces are shown in Figure 7. From Figure 7, the oscillation of the rear force f2 and the induced moment m2 occurs after wave overtopping. Moreover, the peak values occasionally appear at some instantaneous time which might be caused by the jet of the overtopping wave. In addition, the differences between the water level on the front face and that on the rear side of caisson breakwater will influence the pressure distribution underneath the caisson. Therefore, the corresponding upward force f3 and the induced moments (m3 and m4) will vary with the surface elevation difference for wave overtopping. The negative maximum of f3 is larger than the positive maximum of f3, which is the same as the experimental results in [34].
3.2. Stability Analysis
It is important to safely design a vertical breakwater with respect to the stability criteria of sliding and overturning. The movements of a caisson breakwater are influenced by the total active forces exerted on the seaward, harbor side and underneath the vertical structure. The minimum safety factors for sliding and overturning are suggested by [35] for engineering design and these values must not be less than 1.2 in practice. These safety factors for sliding and overturning are reviewed as the following:
Using an empirical formula to calculate the safety factors for sliding and overturning, the force acting on the rear side of the caisson was usually taken to be static for simplicity’s sake. Few literatures studied the horizontal force acting on the rear side along the caisson for overturning wave. Therefore, the total force determination requires a good understanding of the overtopping wave behavior in the front and rear sides of the caisson as well as beneath the caisson. Here, the sliding safety factor and overturning safety factor without the force on the backward side can be presented as Equations (4) and (5).
where is the coefficient of friction between the caisson and the foundation, W denotes the weight of caisson, fp denotes the maximum horizontal force along the front side of caisson, mp denotes the moment of fp at the point s1, and mw denotes the moment of W at the point s1.
Due to the rear side force being considered, the safety factor against seaward sliding and overturning should be accounted. Consequently, the corresponding safety factor against landward sliding and seaward are presented as Equations (6)–(9), where superscript “+” and “−” represent landward and seaward, respectively. The subscript “s” and “o” mean the sliding and overturning.
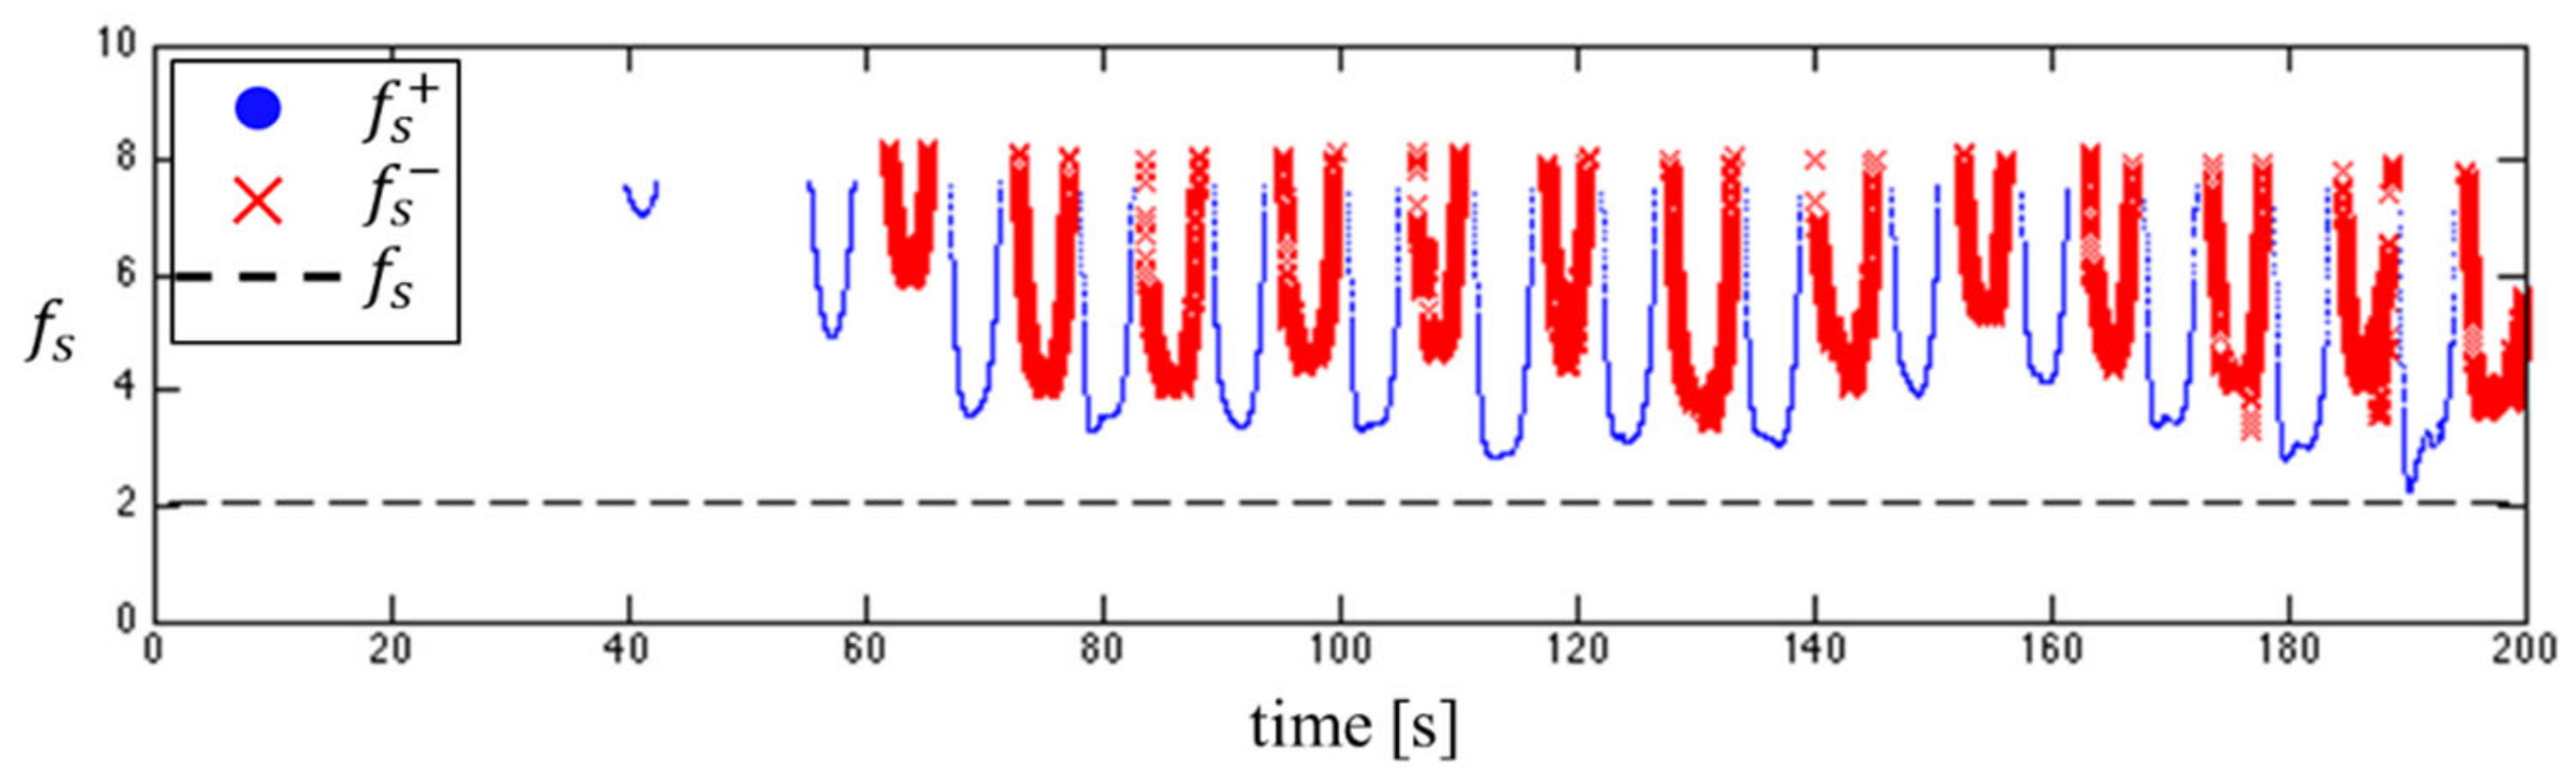
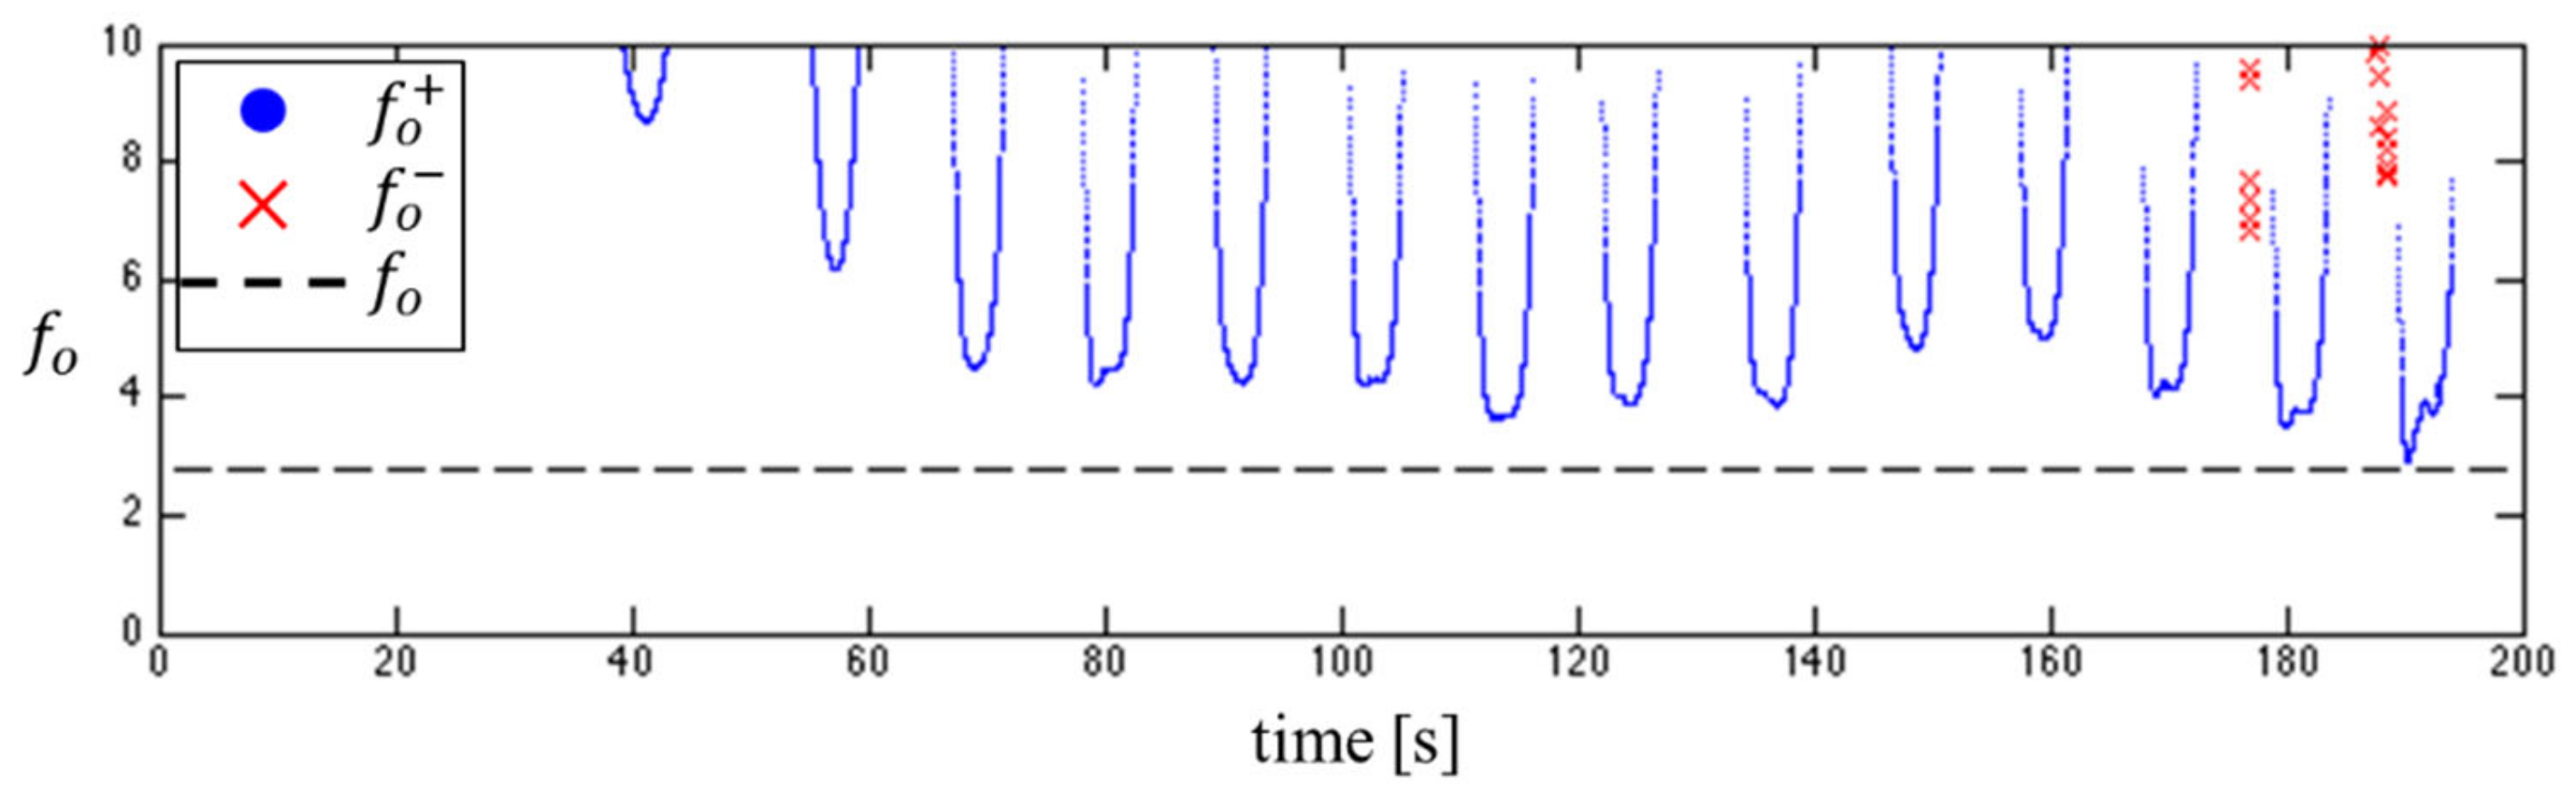
For example, the time histories of the safety factors against sliding including sliding safety factor (fs), landward sliding safety factor (fs+) and seaward sliding safety factor (fs−) in case 1 are shown as Figure 8, and that against overturning including overturning safety factor , landward overturning safety factor and seaward overturning safety factor in case 1 are shown as Figure 9. The water wave in the rear side caused the sliding safety factor and overturning safety factor to oscillate, which means Equations (6)–(9) provide a time series variation value as shown in Figure 8 and Figure 9. Overall, the caisson breakwater in Taichung harbor has sufficient stability for sliding and overturning on the IWO in the 50 year return period wave condition.
4. Results and Discussions
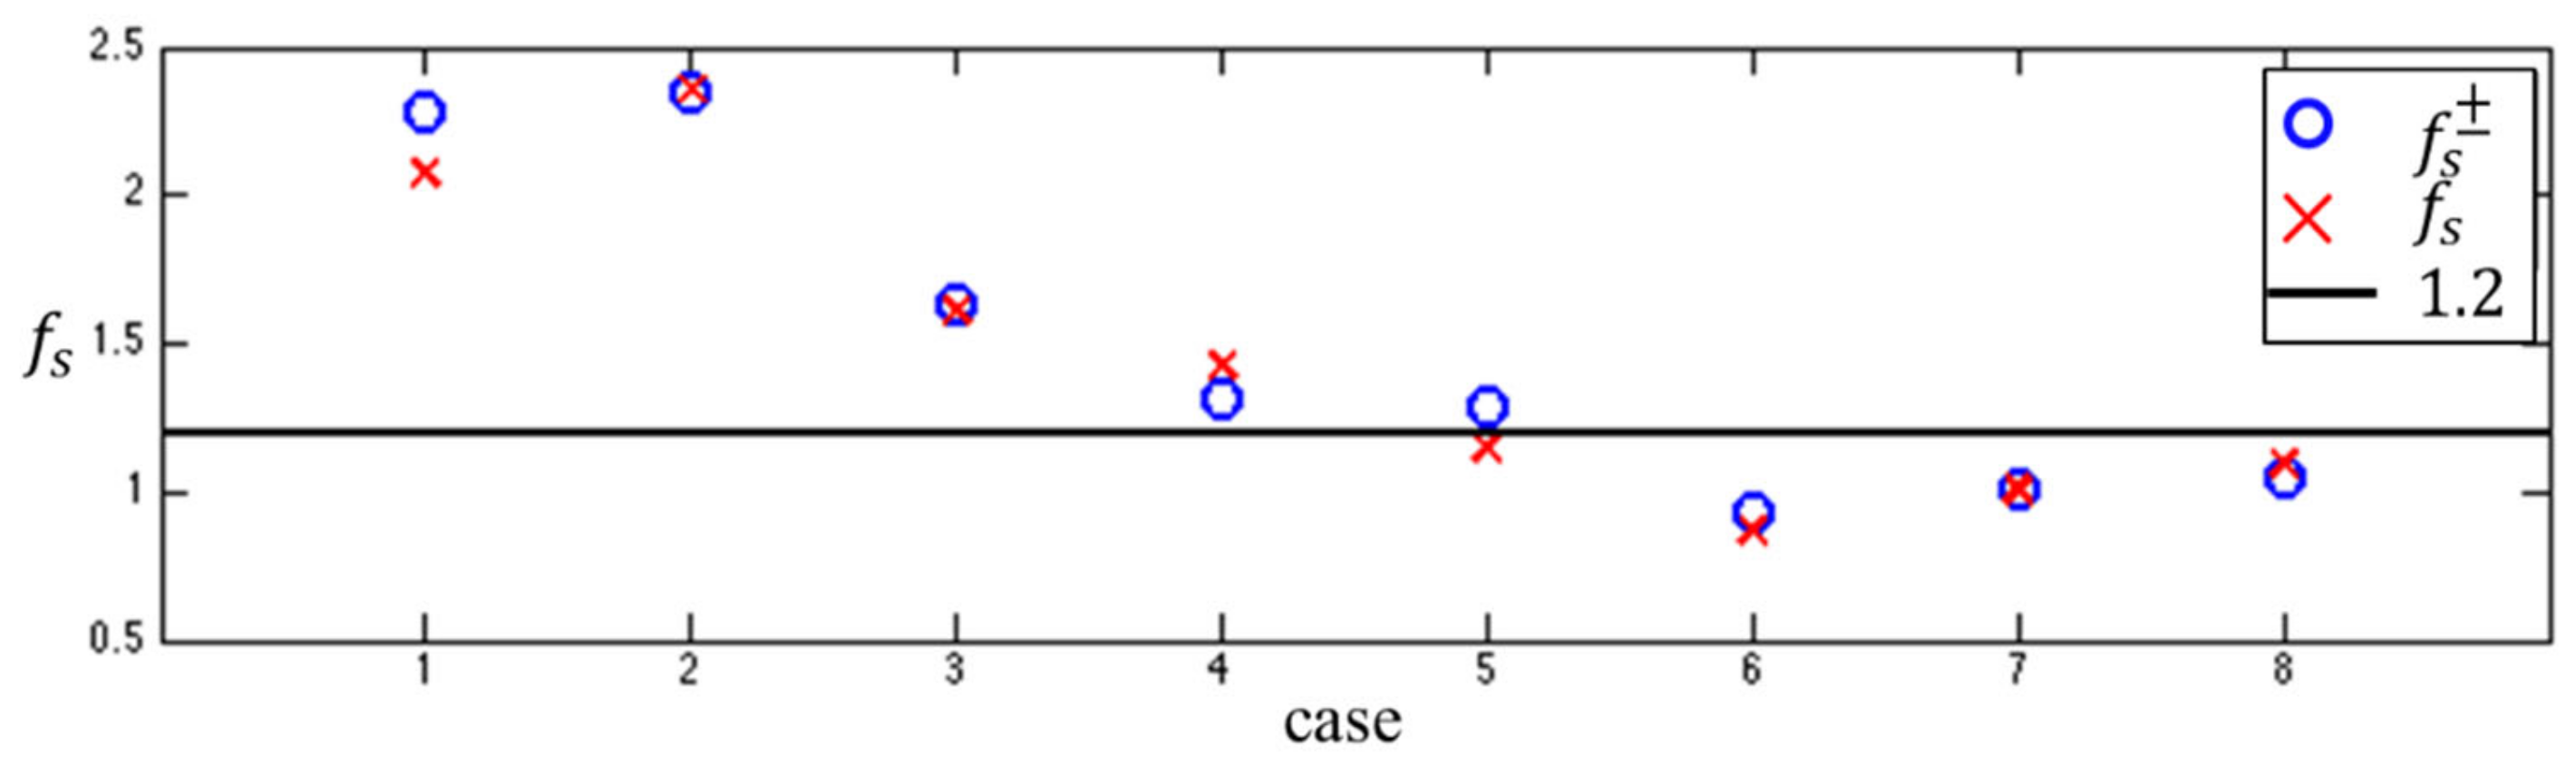
To investigate the structure stability on the IWO, the sliding and overturning safety factors considering the water level fluctuates on the rear side of caisson were calculated under 50 to 250 year return period typhoon wave conditions as well as extreme wave conditions. The represented safety factors for sliding on the IWO determined by the minimum of landward sliding safety factor and seaward sliding safety factor was denoted by fs±. In the same way, the overtopping safety factors determined by the landward overturning safety factor and seaward overturning safety factor, was denoted by fo±. The comparisons of the safety factors against sliding are shown as Figure 10. Generally, the safety factors following severe wave conditions get lower, and cases 6–8 are less than 1.2, indicating the risk of sliding failure might occur in extreme wave conditions. Although fs± is closed to fs, fs± varies due to the IWO.
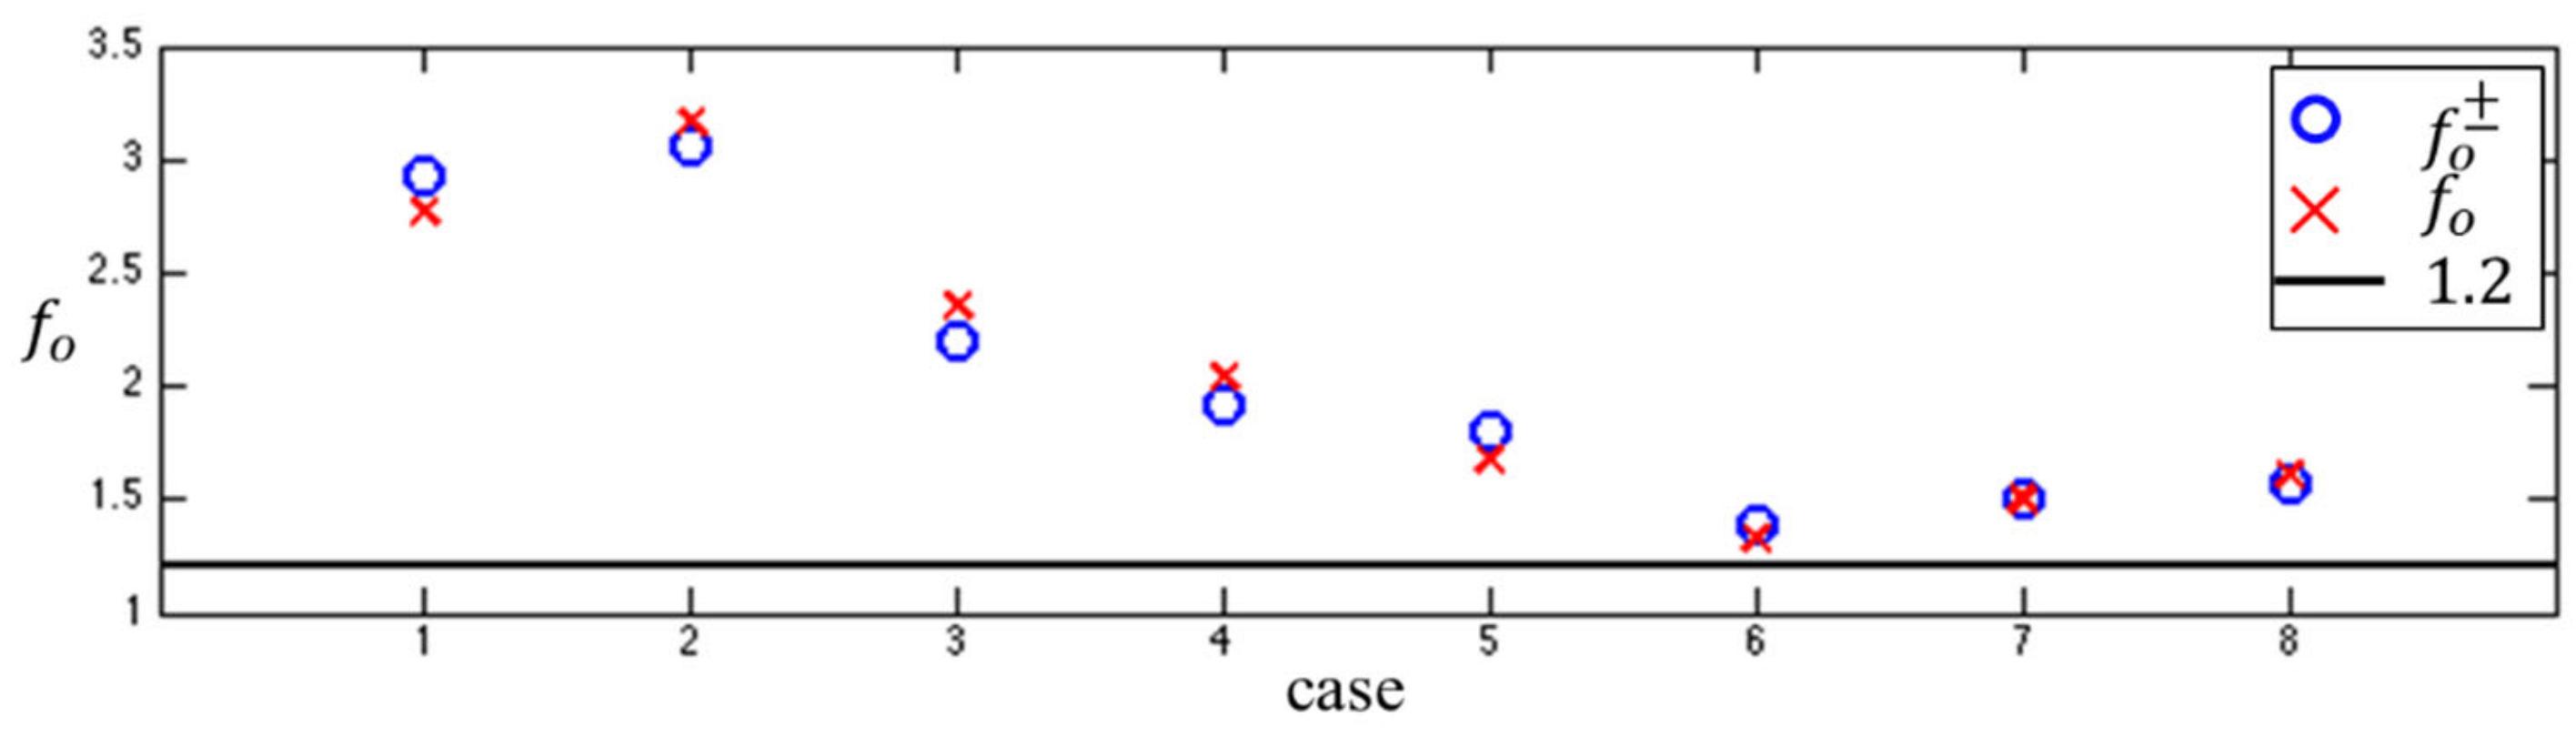
The safety factors against overturning are shown as Figure 11. All of the cases are greater than 1.2. Therefore, sliding failure is more dangerous than the overturning failure in Taichung harbor breakwater. Comparing between Figure 10 and Figure 11, the tendency of safety factors between sliding and overturning are similar. This study shows the impact of overtopping waves in respect of the phase difference between the front and rear side. Not only wave condition but also the configuration of caisson such as its width and crown height might also affect the safety factor of breakwater. The impact on the fluctuation of the safety factor in case 2 is smaller than in case 1.
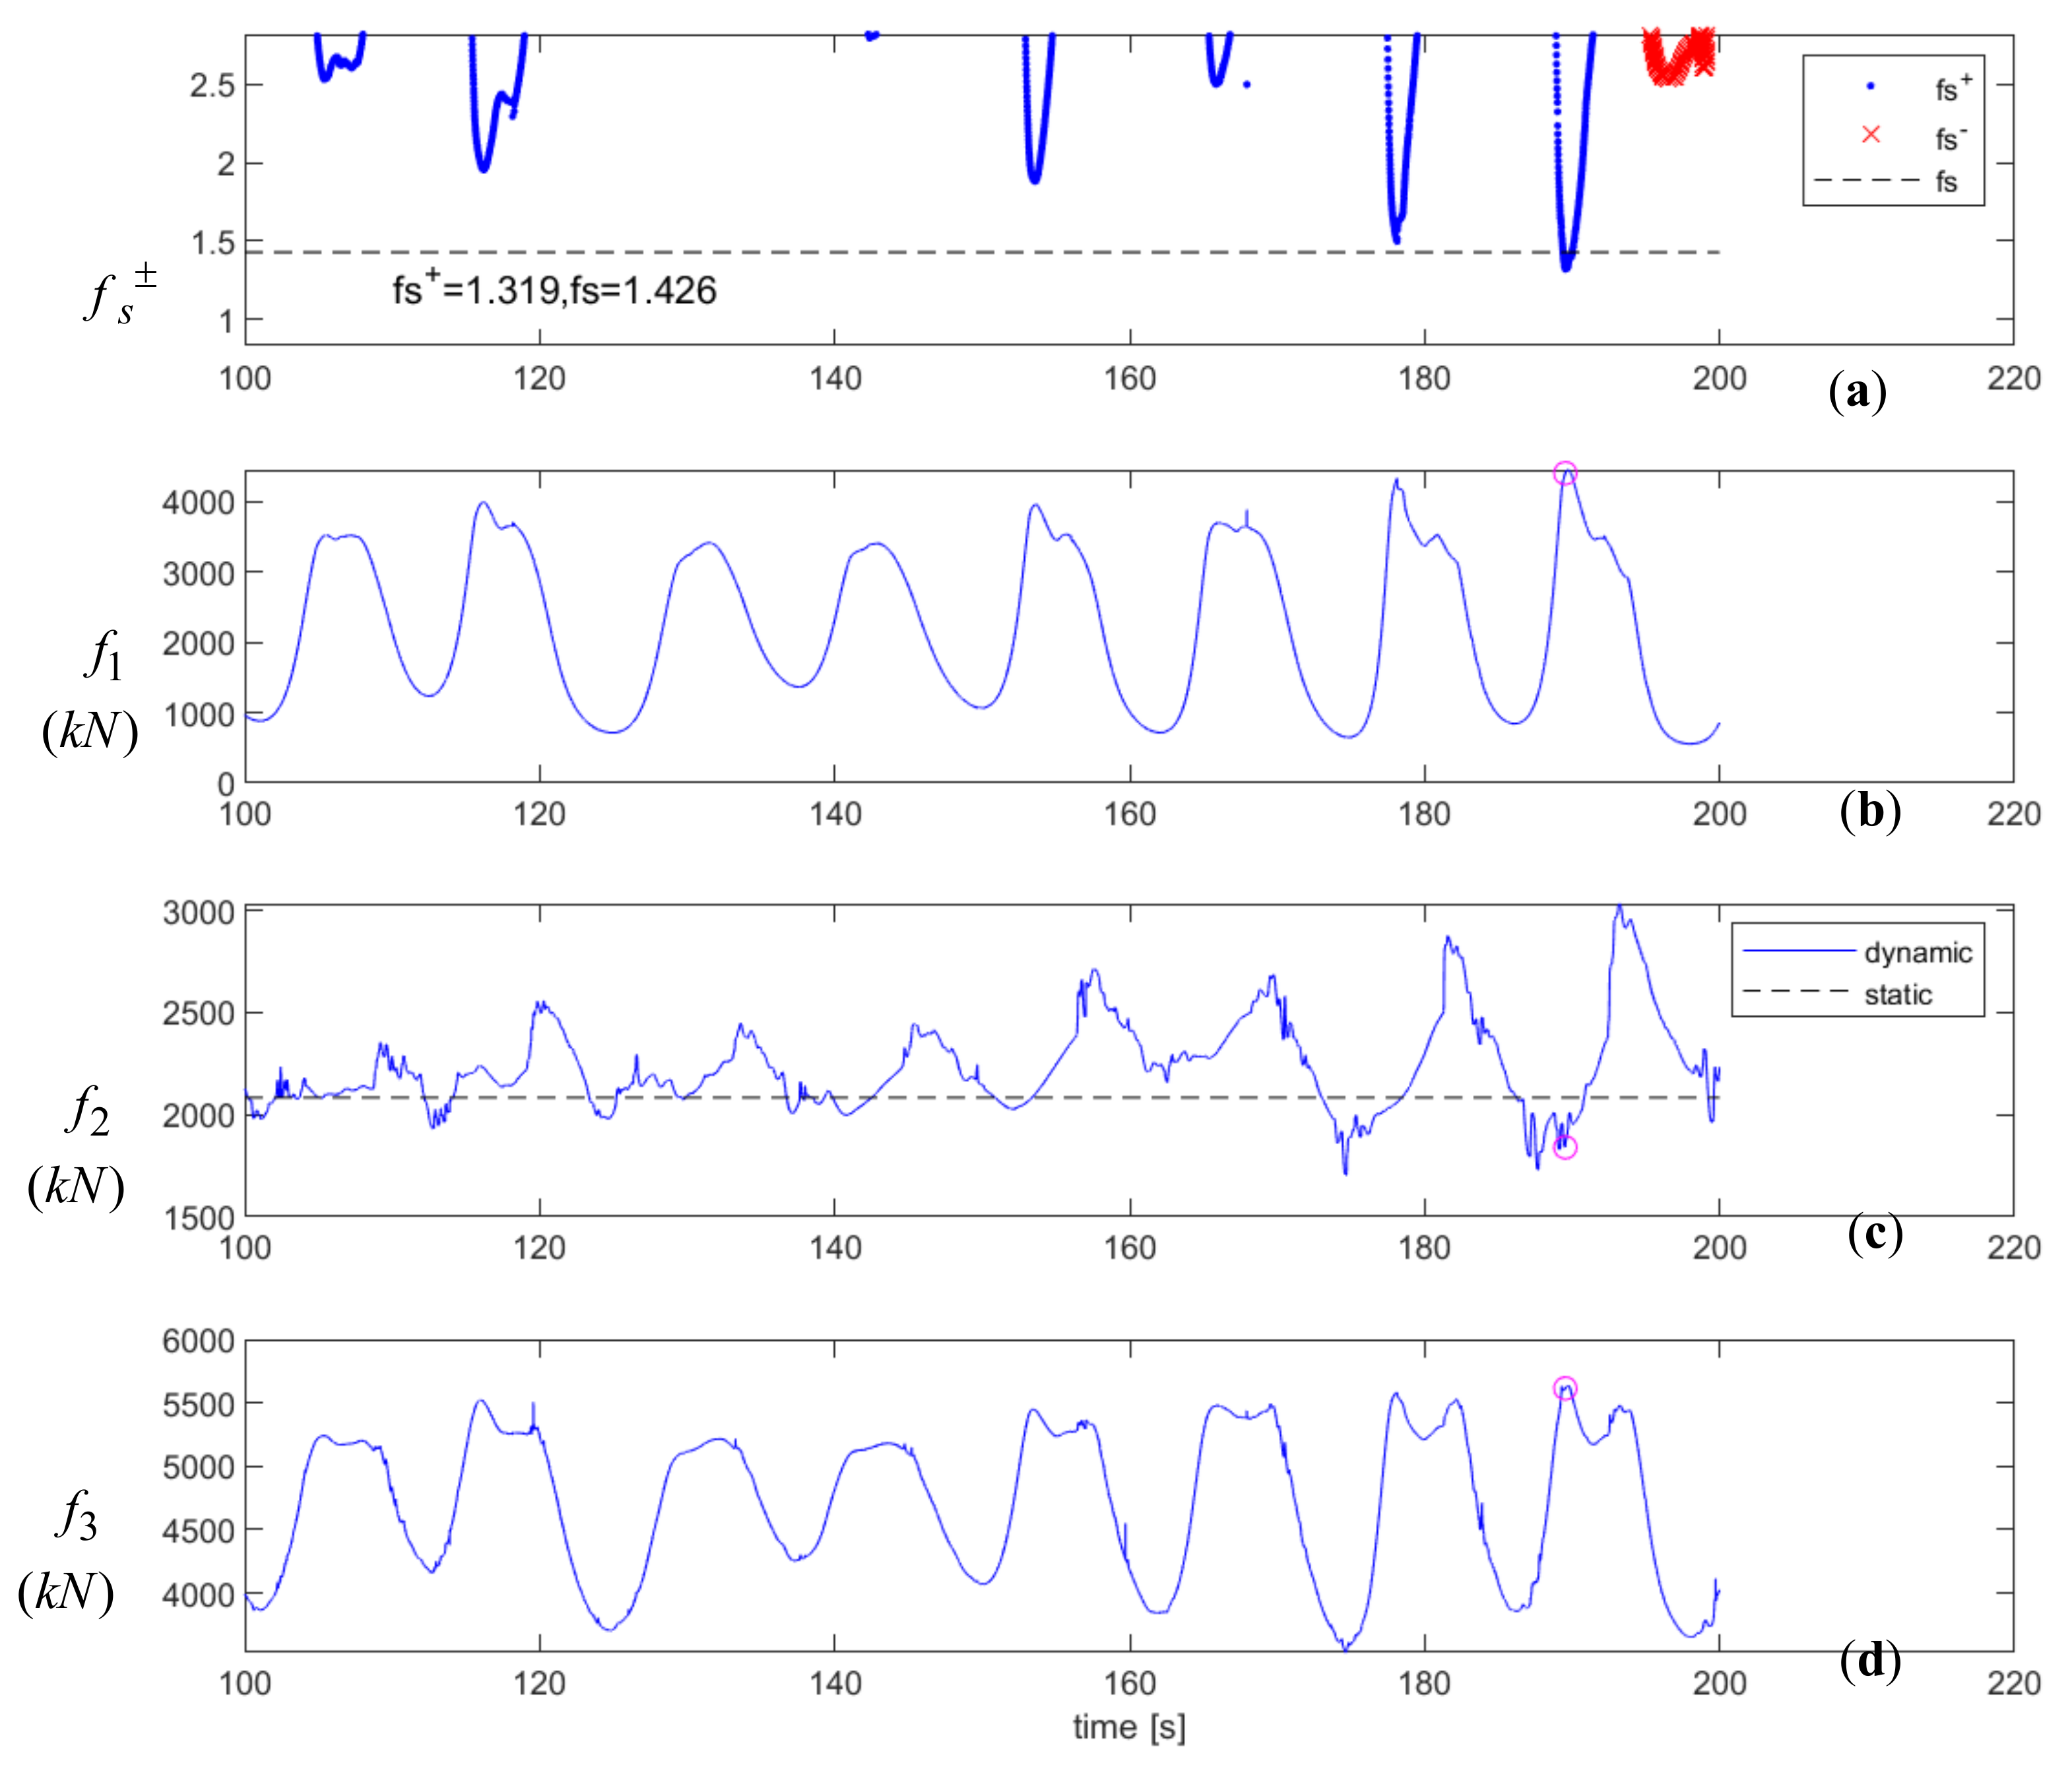
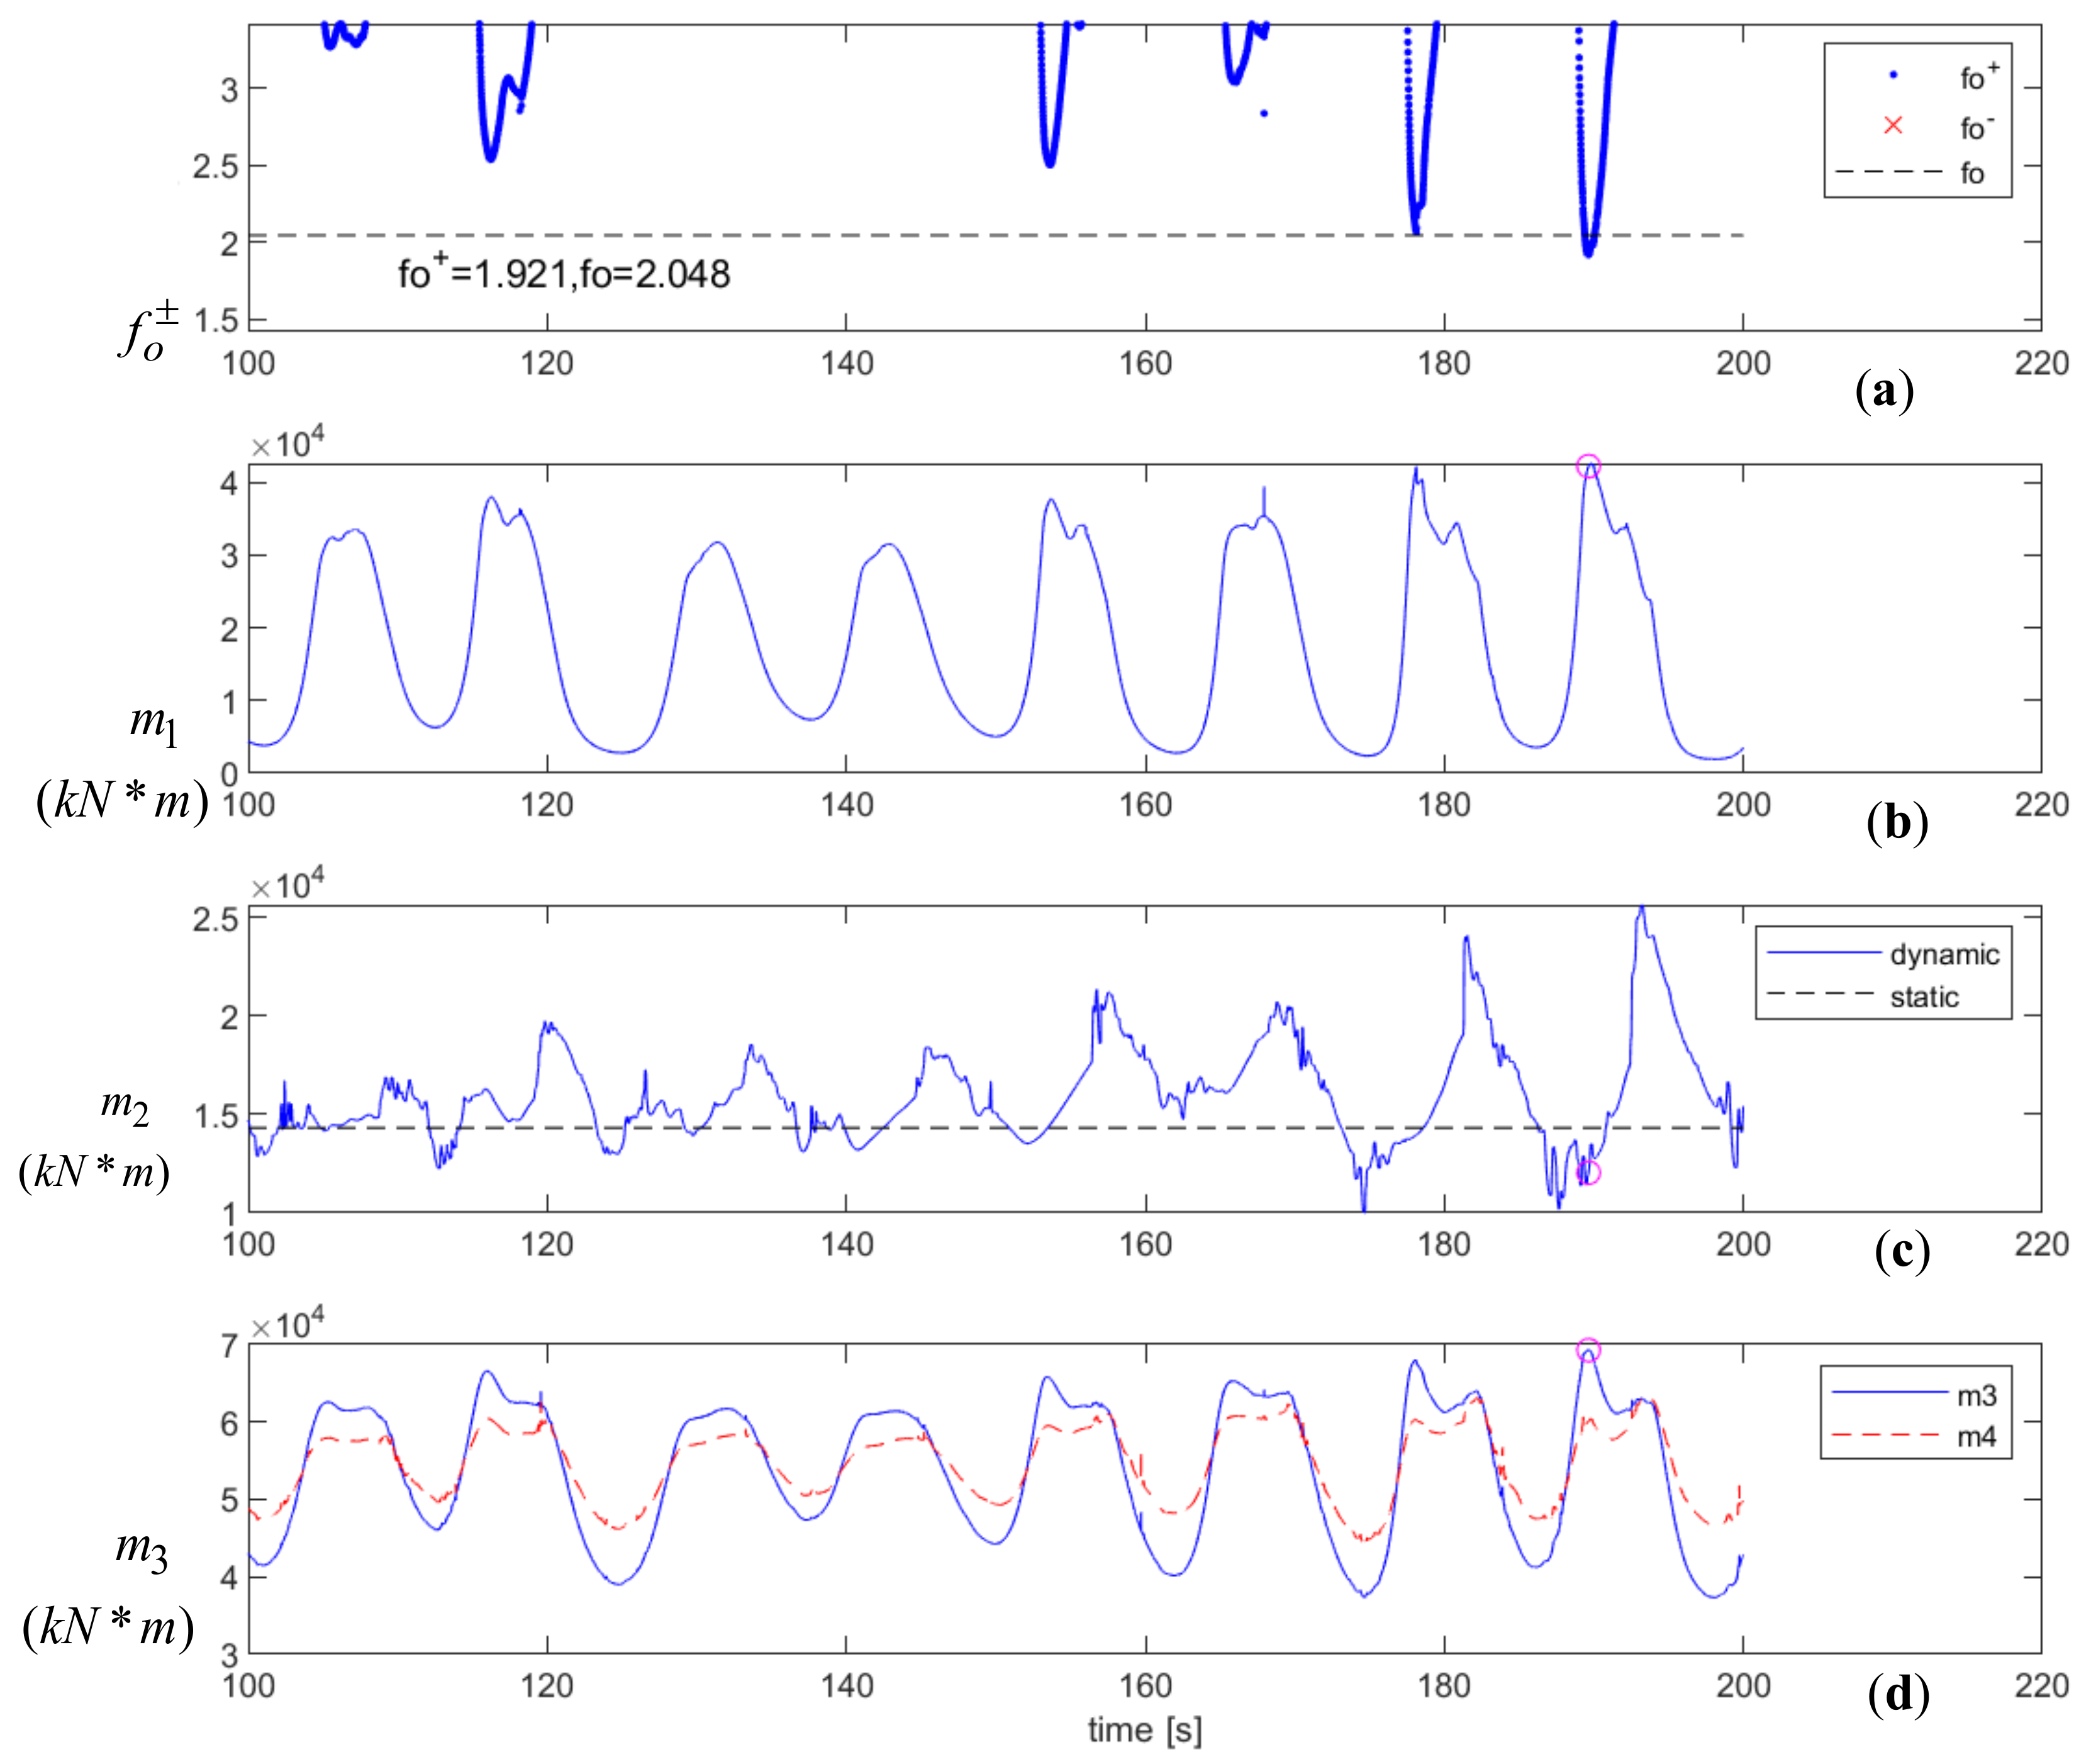
To focus on the IWO on the stability analysis of vertical breakwaters, the load analysis of case 4, an example of fo± < fo, is shown as Figure 12. When time is 189.5 s, the minimum safety factor against sliding on the IWO fs± = 1.32 is greater than the safety factor against sliding in static fs = 1.43. At that time, the force f1 in Figure 12b is 4395 kN and the force f2 in Figure 12c in dynamic is 1840 kN, while that in static is 2084 kN, and the force f3 in Figure 12d is 5614 kN. Because the force on the rear side of caisson considers the IWO is less than the force in still water, that caused the corresponding safety factor against sliding to be lower. Therefore, the impulse force happens at the moment of the minimum of load in the rear side, the safety factor drops significantly and the failure of sliding might cause breakwater damage. Furthermore, overtopping safety factors in case 4, an example of fo± < fo, are shown at Figure 13. At 189.6 s, the minimum safety factor against overturning on the IWO fo± = 1.921 is less than the safety factor against overturning in static fo = 2.048. At the time point, the moment m1 in Figure 13b is 42,230 kNm, the moment m2 in Figure 13c in dynamic is 12,035 kNm; while that in static is 14,317 kNm and the moment m3 in Figure 13d is 69,279 kNm. Since the moment m2 on the IWO is less than that in static, the corresponding safety factor against overturning is lower.
In summary, the risk of sliding is greater than that of overturning in Taichung harbor breakwater. Under the extreme wave more than 100 year return period, the breakwater is unstable due to sliding, but safe from overturning. The IWO on the stability analysis is dominated by the force on the rear side of the caisson and the phase difference on the two ends of caisson.
5. Conclusions
To evaluate the stability of caisson breakwater concerning the effect of wave overtopping, a 2D VOF-type RANS model using a k−ε turbulence closure (COBRAS) has been demonstrated to be suitable for simulating the complex hydrodynamics induced by overtopping waves. Experimental wave profiles and dynamic wave pressures on the seaward, backward and the bottom of the caisson breakwater can be suitably simulated by the present model. The horizontal forces on the front and rear sides and the uplift force as well as the moments on the caisson could also be analyzed. According to the numerical simulations, the risk of sliding is greater than that of overturning in the case of caisson breakwater in Taichung harbor. Under the extreme wave more than 100 year return period, the caisson breakwater is unstable due to sliding, but that is safe for overturning. Therefore, it is important to calculate the force on the rear side of the caisson and the phase difference of surface elevation on the two sides of the caisson as we analyze the stability analysis for wave overtopping for engineering design.
Author Contributions
Conceptualization, H.-C.H.; methodology, H.-C.H.; software, M.-S.L. and C.-J.H.; validation, M.-S.L. and C.-J.H.; formal analysis, H.-C.H. and L.-H.T.; writing—Original draft preparation, H.-C.H., M.-S.L. and C.-J.H.; writing—Review and editing, H.-C.H. and L.-H.T.; funding acquisition, H.-C.H. and L.-H.T. All authors have read and agreed to the published version of the manuscript.
Funding
This research was funded by the Harbor and Marine Technology Center, Ministry of Transportation and Communications, grant number MOTC-IOT-104-H2DB004a and the Ministry of Science and Technology, Taiwan, R.O.C., grant number 107-2221-E-110-077-MY3 and MOST 107-2221-E-006-087.
Conflicts of Interest
The authors declare no conflict of interest.
References
- Oumeraci, H. Review and analysis of vertical breakwater failures—Lessons learned. Coast. Eng. 1994, 22, 3–29. [Google Scholar]
- Allsop, N.W.; Hawkes, P.I.; Jackson, F.A.; Franco, L. Wave Run-Up on Steep Slopes-Model Tests under Random Waves; Report No. SR2; Hydraulics Research Station: Wallingford, UK, 1985. [Google Scholar]
- Bullock, G.; Obhrai, C.; Peregrine, D.; Bredmose, H. Violent breaking wave impacts. Part 1: Results from large-scale regular wave tests on vertical and sloping walls. Coast. Eng. 2007, 54, 602–617. [Google Scholar] [CrossRef]
- Cuomo, G.; Allsop, W.; Bruce, T.; Pearson, J. Breaking wave loads at vertical seawalls and breakwaters. Coast. Eng. 2010, 57, 424–439. [Google Scholar] [CrossRef] [Green Version]
- Oumeraci, H.; Kortenhaus, A.; Allsop, N.W.H.; De Groot, M.B.; Crouch, R.S.; Vrijling, J.K.; Voortman, H.G. Probabilistic Design Tools for Vertical Breakwater; Balkema: Rotterdam, The Netherlands, 2001. [Google Scholar]
- Minikin, R.C.R. Winds, Waves, and Maritime Structures: Studies in Harbour Making and in the Protection of Coasts; Griffin: London, UK, 1963. [Google Scholar]
- Goda, Y. New wave pressure formulae for composite breakwater. In Coastal Engineering 1974, Proceedings of the 14th Conference on Coastal Engineering, Copenhagen, Denmark, 24–28 June 1974; ASCE: New York, NY, USA, 1974; pp. 1702–1720. [Google Scholar]
- Ewing, J.A. Random Seas and Design of Maritime Structures, 3rd ed.; World Scientific: Singapore, 1985. [Google Scholar]
- Takahashi, S.; Tanimoto, K.; Simosako, K. A proposal of impulsive pressure coefficient for the design of composite breakwaters. In In HYDRO-PORT ‘94: Proceedings of the International Conference on Hydro-Technical Engineering for Port and Harbor Construction: Yokosuka, Japan, 19–21 October 1994; Coastal Development Institute of Technology: Yokosuka, Japan, 1994; Volume 1, pp. 489–504. [Google Scholar]
- Takahashi, S.; Shimosako, K. Reduction of Wave Force on a Long Caisson of Vertical Breakwater and Its Stability; Technical Notes No. 685 of Port and Harbour Research Institute; Port and Harbour Research Institute: Nagase, Yokosuka, Japan, 1990; pp. 1–20. (In Japanese) [Google Scholar]
- Burcharth, H.F.; Liu, Z. Force Reduction of Short-Crested Non-Breaking Waves on Caissons. In Final Report of Mast III Project PROVERBS; (PRObabilistic Design Tools for VERtical BreakwaterS); Technical University of Braunschweig: Braunschweig, Germany, 1999; Volume II, Chapter 4.3; pp. 1–26. [Google Scholar]
- Mares-Nasarre, P.; Van Gent, M.R. Oblique wave attack on rubble mound breakwater crest walls of finite length. Water 2020, 12, 353. [Google Scholar] [CrossRef] [Green Version]
- Sollitt, C.K.; Cross, R.H. Wave transmission through permeable breakwaters. In Proceedings of the 13th International Conference on Coastal Engineering, Vancouver, BC, Canada, 10–14 July 1972; ASCE: New York, NY, USA, 1972; pp. 1827–1846. [Google Scholar]
- Vidal, C.; Losada, M.A.; Medina, R.; Rubio, J. Solitary wave transmission through porous breakwaters. In Coastal Engineering 1988, Proceedings of 21th International Conference on Coastal Engineering, Costa del Sol-Malaga, Spain, 20–25 June 1988; ASCE: New York, NY, USA, 1988; pp. 1073–1083. [Google Scholar]
- Liu, P.L.-F.; Wen, J. Nonlinear diffusive surface waves in porous media. J. Fluid Mech. 1997, 347, 119–139. [Google Scholar] [CrossRef]
- Kobayashi, N.; Wurjanto, A. Wave transmission over submerged breakwaters. J. Waterw. Port Coast. Ocean Eng. 1989, 115, 662–680. [Google Scholar] [CrossRef]
- Kobayashi, N.; Wurjanto, A. Wave overtopping on coastal structures. J. Waterw. Port Coast. Ocean Eng. 1989, 115, 235–251. [Google Scholar] [CrossRef]
- Kobayashi, N.; Wurjanto, A. Numerical model for wave on rough permeable slopes. J. Coast. Res. 1990, 7, 149–166. [Google Scholar]
- Mingham, C.G.; Causon, D.M. High-resolution finite-volume method for shallow water flows. J. Hydraul. Eng. 1998, 124, 605–614. [Google Scholar] [CrossRef]
- Hu, K.; Mingham, C.; Causon, D. Numerical simulation of wave overtopping of coastal structures using the non-linear shallow water equations. Coast. Eng. 2000, 41, 433–465. [Google Scholar] [CrossRef]
- Hubbard, M.E.; Dodd, N. A 2D numerical model of wave run-up and overtopping. Coast. Eng. 2002, 47, 1–26. [Google Scholar] [CrossRef]
- Stansby, P.K.; Feng, T. Surf zone wave overtopping a trapezoidal structure: 1-D modelling and PIV comparison. Coast. Eng. 2004, 51, 483–500. [Google Scholar] [CrossRef]
- Sulisz, W. Wave reflection and transmission at permeable breakwaters of arbitrary aross-section. Coast. Eng. 1985, 9, 371–386. [Google Scholar] [CrossRef]
- Shigematsu, T.; Liu, P.L.F.; Oda, K. Numerical modeling of the initial stages of dam-break waves. J. Hydraul. Res. 2004, 42, 183–195. [Google Scholar] [CrossRef]
- Özgökmen, T.M.; Iliescu, T.; Fischer, P.F.; Srinivasan, A.; Duan, J. Large eddy simulation of stratified mixing in two-dimensional dam-break problem in a rectangular enclosed domain. Ocean Model. 2007, 16, 106–140. [Google Scholar] [CrossRef]
- Khayyer, A.; Gotoh, H. On particle-based simulation of a dam break over a wet bed. J. Hydraul. Res. 2010, 48, 238–249. [Google Scholar] [CrossRef]
- Shakibaeinia, A.; Jin, Y.-C. A mesh-free particle model for simulation of mobile-bed dam break. Adv. Water Resour. 2011, 34, 794–807. [Google Scholar] [CrossRef]
- Lin, P.Z.; Liu, P.L.-F. A numerical study of breaking waves in the surf zone. J. Fluid Mech. 1998, 359, 239–264. [Google Scholar] [CrossRef]
- Lin, P.; Liu, P.L.-F. Turbulence transport, vorticity dynamics, and solute mixing under plunging breaking waves in surf zone. J. Geophys. Res. Space Phys. 1998, 103, 15677–15694. [Google Scholar] [CrossRef]
- Lin, P.; Xu, W. Newflume: A numerical water flume for two-dimensional turbulent free surface flows. J. Hydraul. Res. 2006, 44, 79–93. [Google Scholar] [CrossRef]
- Losada, I.J.; Lara, J.L.; Guanche, R.; Gonzalez-Ondina, J.M. Numerical analysis of wave overtopping of rubble mound breakwaters. Coast. Eng. 2008, 55, 47–62. [Google Scholar] [CrossRef]
- Guanche, R.; Losada, I.J.; Lara, J.L. Numerical analysis of wave loads for coastal structure stability. Coast. Eng. 2009, 56, 543–558. [Google Scholar] [CrossRef]
- Walkden, M.; Wood, D.; Bruce, T.; Peregrine, D. Impulsive seaward loads induced by wave overtopping on caisson breakwaters. Coast. Eng. 2001, 42, 257–276. [Google Scholar] [CrossRef]
- Chiu, Y.F.; Lee, J.Y.; Chang, S.C.; Lin, Y.J.; Chen, C.H. An experiment study of wave forces on vertical breakwater. J. Mar. Sci. Technol. 2007, 15, 158–170. [Google Scholar]
- Goda, Y.; Takahashi, S. Advanced Design of Maritime Structures in the 21st Century; Port and Harbour Research Institute: Yokosuka, Japan, 2001. [Google Scholar]
- Shih, T.-H.; Zhu, J.; Lumley, J.L. Calculation of wall-bounded complex flows and free shear flows. Int. J. Numer. Methods Fluids 1996, 23, 1133–1144. [Google Scholar] [CrossRef]
- Ting, F.C.; Kirby, J.T. Observation of undertow and turbulence in a laboratory surf zone. Coast. Eng. 1994, 24, 51–80. [Google Scholar] [CrossRef]
- Neves, M.D.G.; Reis, M.T.; Losada, I.J.; Hu, K. Wave overtopping of Póvoa de varzim breakwater: Physical and numerical simulations. J. Waterw. Port Coast. Ocean Eng. 2008, 134, 226–236. [Google Scholar] [CrossRef]
- Willmott, C.J. On the validation of models. Phys. Geogr. 1981, 2, 184–194. [Google Scholar] [CrossRef]
- Cheng, K.G.; Chien, C.C.; Su, C.H.; Tseng, H.M.; Chen, G.Y.; Chen, Y.C. Taichung Harbour Extension Design Phase II—Primary; Institute of Transportation; MOTC: Taipei City, Taiwan, 1999. (In Chinese) [Google Scholar]
- Hsu, T.W. A Study of Adaptation Capacity of Coastal Disasters Due to Climate Change in Order to Strengthen Northwest and Northeast Areas of Taiwan (2/2); Water Resources Agency; MOEA: Taipei City, Taiwan, 2013. (In Chinese) [Google Scholar]
Figure 1.
Experimental setup for regular wave [34]. (a) is the side view; (b) is the detailed view of the caisson breakwater.
Figure 1.
Experimental setup for regular wave [34]. (a) is the side view; (b) is the detailed view of the caisson breakwater.

Figure 2.
Comparisons of the surface elevation in regular wave condition (H = 0.19 m, T = 1.67 s) between numerical results (dashed line) and experimental data (solid line).
Figure 2.
Comparisons of the surface elevation in regular wave condition (H = 0.19 m, T = 1.67 s) between numerical results (dashed line) and experimental data (solid line).

Figure 3.
Comparisons of the dynamic wave pressure along the front face of the caisson breakwater in the typhoon wave condition (H = 0.25 m, T = 2 s) between numerical results (dashed line) and experimental data (solid line).
Figure 3.
Comparisons of the dynamic wave pressure along the front face of the caisson breakwater in the typhoon wave condition (H = 0.25 m, T = 2 s) between numerical results (dashed line) and experimental data (solid line).

Figure 4.
Comparisons of the dynamic wave pressure on the bottom of the caisson breakwater in the typhoon wave condition (H = 0.25 m, T = 2 s) between numerical results (dashed line) and experimental data (solid line).
Figure 4.
Comparisons of the dynamic wave pressure on the bottom of the caisson breakwater in the typhoon wave condition (H = 0.25 m, T = 2 s) between numerical results (dashed line) and experimental data (solid line).

Figure 5.
The wave-structure interaction model setup of Taichung harbor setup [41].
Figure 5.
The wave-structure interaction model setup of Taichung harbor setup [41].

Figure 6.
Free body diagram of load analysis.

Figure 7.
The time histories of wave-induced forces and their moment acting on caisson in case 1.

Figure 8.
The time histories of the safety factors against sliding among fs+(˙), fs− (×) and fs (---) for case 1.
Figure 8.
The time histories of the safety factors against sliding among fs+(˙), fs− (×) and fs (---) for case 1.

Figure 9.
The time histories of the safety factors against overturning among fo+ (˙), fo− (×) and fo (---) for case 1.
Figure 9.
The time histories of the safety factors against overturning among fo+ (˙), fo− (×) and fo (---) for case 1.

Figure 10.
Comparisons of the safety factors against sliding among the minimum of fs± (o), fs (×) and safety criteria 1.2(—).
Figure 10.
Comparisons of the safety factors against sliding among the minimum of fs± (o), fs (×) and safety criteria 1.2(—).

Figure 11.
Comparisons of the safety factors against overturning among the minimum of fo ± (o), fo (×) and safety criteria 1.2(—).
Figure 11.
Comparisons of the safety factors against overturning among the minimum of fo ± (o), fo (×) and safety criteria 1.2(—).

Figure 12.
Comparisons of time histories of the safety factors against sliding and their loads for case 4. (a) The safety factors against sliding among fs+(˙), fs− (×) and fs (---); (b) The forces f1 (—); (c) The forces f2 in static (---) and in dynamic (—); (d) The forces f3 (—).
Figure 12.
Comparisons of time histories of the safety factors against sliding and their loads for case 4. (a) The safety factors against sliding among fs+(˙), fs− (×) and fs (---); (b) The forces f1 (—); (c) The forces f2 in static (---) and in dynamic (—); (d) The forces f3 (—).

Figure 13.
Comparisons of time histories of the safety factors against overturning and their moments for case 4. (a) The safety factors against overturning among fo+ (˙), fo− (×) and fo (---); (b) The moment m1 (—); (c) The moment m2 in static (---) and in dynamic (—); (d) The moment m3 (—) and the moment m4 (---).


Table 1.
The index of model validation.
| Case | φ | Case | φ | Case | φ |
|---|---|---|---|---|---|
| g1 | 0.960 | U1 | 0.723 | V1 | 0.714 |
| g2 | 0.638 | U2 | 0.777 | V2 | 0.741 |
| g3 | 0.873 | U3 | 0.772 | V3 | 0.739 |
| g4 | 0.920 | U4 | 0.888 | V4 | 0.708 |
| -- | -- | U5 | 0.895 | -- | -- |
Table 2.
The wave conditions (including return period of typhoon wave and extreme condition).
| Case | H (m) | T (s) | Return Period (Year) |
|---|---|---|---|
| 1 | 7.77 | 11.30 | 50 |
| 2 | 8.46 | 11.70 | 100 |
| 3 | 9.24 | 12.20 | 200 |
| 4 | 9.45 | 12.30 | 250 |
| 5 | 12.87 | 14.13 | 50 * |
| 6 | 13.70 | 14.63 | 100 * |
| 7 | 14.47 | 15.25 | 200 * |
| 8 | 14.63 | 15.38 | 250 * |
mean water depth = 28.86 m at x = 0 m. * represents the climate change effected extreme wave condition [41].
Table 3.
The porous flow parameter for rubble mounted layers.
| Layer | Porosity | The Median Diameter (m) |
|---|---|---|
| 1 | 0.49 | 0.118 |
| 2 | 0.53 | 0.387 |
| 3 | impermeable materials | |
Publisher’s Note: MDPI stays neutral with regard to jurisdictional claims in published maps and institutional affiliations. |
© 2020 by the authors. Licensee MDPI, Basel, Switzerland. This article is an open access article distributed under the terms and conditions of the Creative Commons Attribution (CC BY) license (http://creativecommons.org/licenses/by/4.0/).
Share and Cite
MDPI and ACS Style
Li, M.-S.; Hsu, C.-J.; Hsu, H.-C.; Tsai, L.-H. Numerical Analysis of Vertical Breakwater Stability under Extreme Waves. J. Mar. Sci. Eng. 2020, 8, 986. https://doi.org/10.3390/jmse8120986
AMA Style
Li M-S, Hsu C-J, Hsu H-C, Tsai L-H. Numerical Analysis of Vertical Breakwater Stability under Extreme Waves. Journal of Marine Science and Engineering. 2020; 8(12):986. https://doi.org/10.3390/jmse8120986
Chicago/Turabian StyleLi, Meng-Syue, Cheng-Jung Hsu, Hung-Chu Hsu, and Li-Hung Tsai. 2020. "Numerical Analysis of Vertical Breakwater Stability under Extreme Waves" Journal of Marine Science and Engineering 8, no. 12: 986. https://doi.org/10.3390/jmse8120986
Note that from the first issue of 2016, this journal uses article numbers instead of page numbers. See further details here.