Crownwall Failure Analysis through Finite Element Method
by
 , , ,
, , ,
Dimitrios Dermentzoglou
1 ,
,
Myrta Castellino
2,
Paolo De Girolamo
2,
Maziar Partovi
3,
Gerd-Jan Schreppers
3 and
Alessandro Antonini
1,*
1
Delft University of Technology, 2628 Delft, The Netherlands
2
Sapienza University of Rome, 00185 Roma, Italy
3
DIANA FEA BV, 2629 Delft, The Netherlands
*
Author to whom correspondence should be addressed.
J. Mar. Sci. Eng. 2021, 9(1), 35; https://doi.org/10.3390/jmse9010035
Submission received: 30 November 2020
/
Revised: 19 December 2020
/
Accepted: 26 December 2020
/
Published: 31 December 2020
(This article belongs to the Special Issue Dynamic Response of Marine Structures under Wave Action)
Abstract
:Several failures of recurved concrete crownwalls have been observed in recent years. This work aims to get a better insight within the processes underlying the loading phase of these structures due to non-breaking wave impulsive loading conditions and to identify the dominant failure modes. The investigation is carried out through an offline one-way coupling of computational fluid dynamics (CFD) generated wave pressure time series and a time-varying structural Finite Element Analysis. The recent failure of the Civitavecchia (Italy) recurved parapet is adopted as an explanatory case study. Modal analysis aimed to identify the main modal parameters such as natural frequencies, modal masses and modal shapes is firstly performed to comprehensively describe the dynamic response of the investigated structure. Following, the CFD generated pressure field time-series is applied to linear and non-linear finite element model, the developed maximum stresses and the development of cracks are properly captured in both models. Three non-linear analyses are performed in order to investigate the performance of the crownwall concrete class. Starting with higher quality concrete class, it is decreased until the formation of cracks is reached under the action of the same regular wave condition. It is indeed shown that the concrete quality plays a dominant role for the survivability of the structure, even allowing the design of a recurved concrete parapet without reinforcing steel bars.
1. Introduction
Vertical breakwaters are structures widely used around the world. They are primarily designed for the protection of boats harbored within ports and of harbor facilities from wave action. In such construction, it is also crucial to protect the port-side of the breakwater from wave overtopping, in order to allow easier manoeuvres within the harbor structure [1,2]. For this reason, parapet walls, that is, seaward extensions of vertical walls, are often adopted. This type of structures is commonly made of reinforced concrete that in turn induces a rather stiff nature to the structure, thus the dynamic behavior of each individual element is highly sensitive to the impulsive or dynamic load that can be exerted by the wave actions. The interconnected nature of the wave action and the dynamic behavior of coastal structures is not a new concept. Indeed, it was firstly observed by Muraki [3] and later further elaborated by Goda [4] and Oumeraci and Kortenhaus [5] and by Martinelli and Lamberti [6] for caisson breakwaters. In these works the caissons were considered fully rigid due to the lower stiffness of the beneath rubble mound and foundation. Therefore, the dynamic properties of the caissons were only the described through a simplified mass, spring dash-pot. More recently, the intertwined structural dynamic and dynamic wave loading aspects were analyzed for several offshore rock lighthouses, within the STORMLAMP project framework [7,8,9], highlighting, once again, how these aspects cannot be considered separately. These works describe the opposite framework of the previously mentioned investigations, indeed, the lighthouses are usually built on rather stiff rock pinnacle, hence the dynamic response of the cylindrical shape is dominant. It has been shown that the different natural frequencies play a leading role in the response of impulsive wave loading, highlighting how the proper description of the wave impulse duration and intensity can significantly affect the reliability of the assessment of a dynamically “sensible” coastal structure [10].
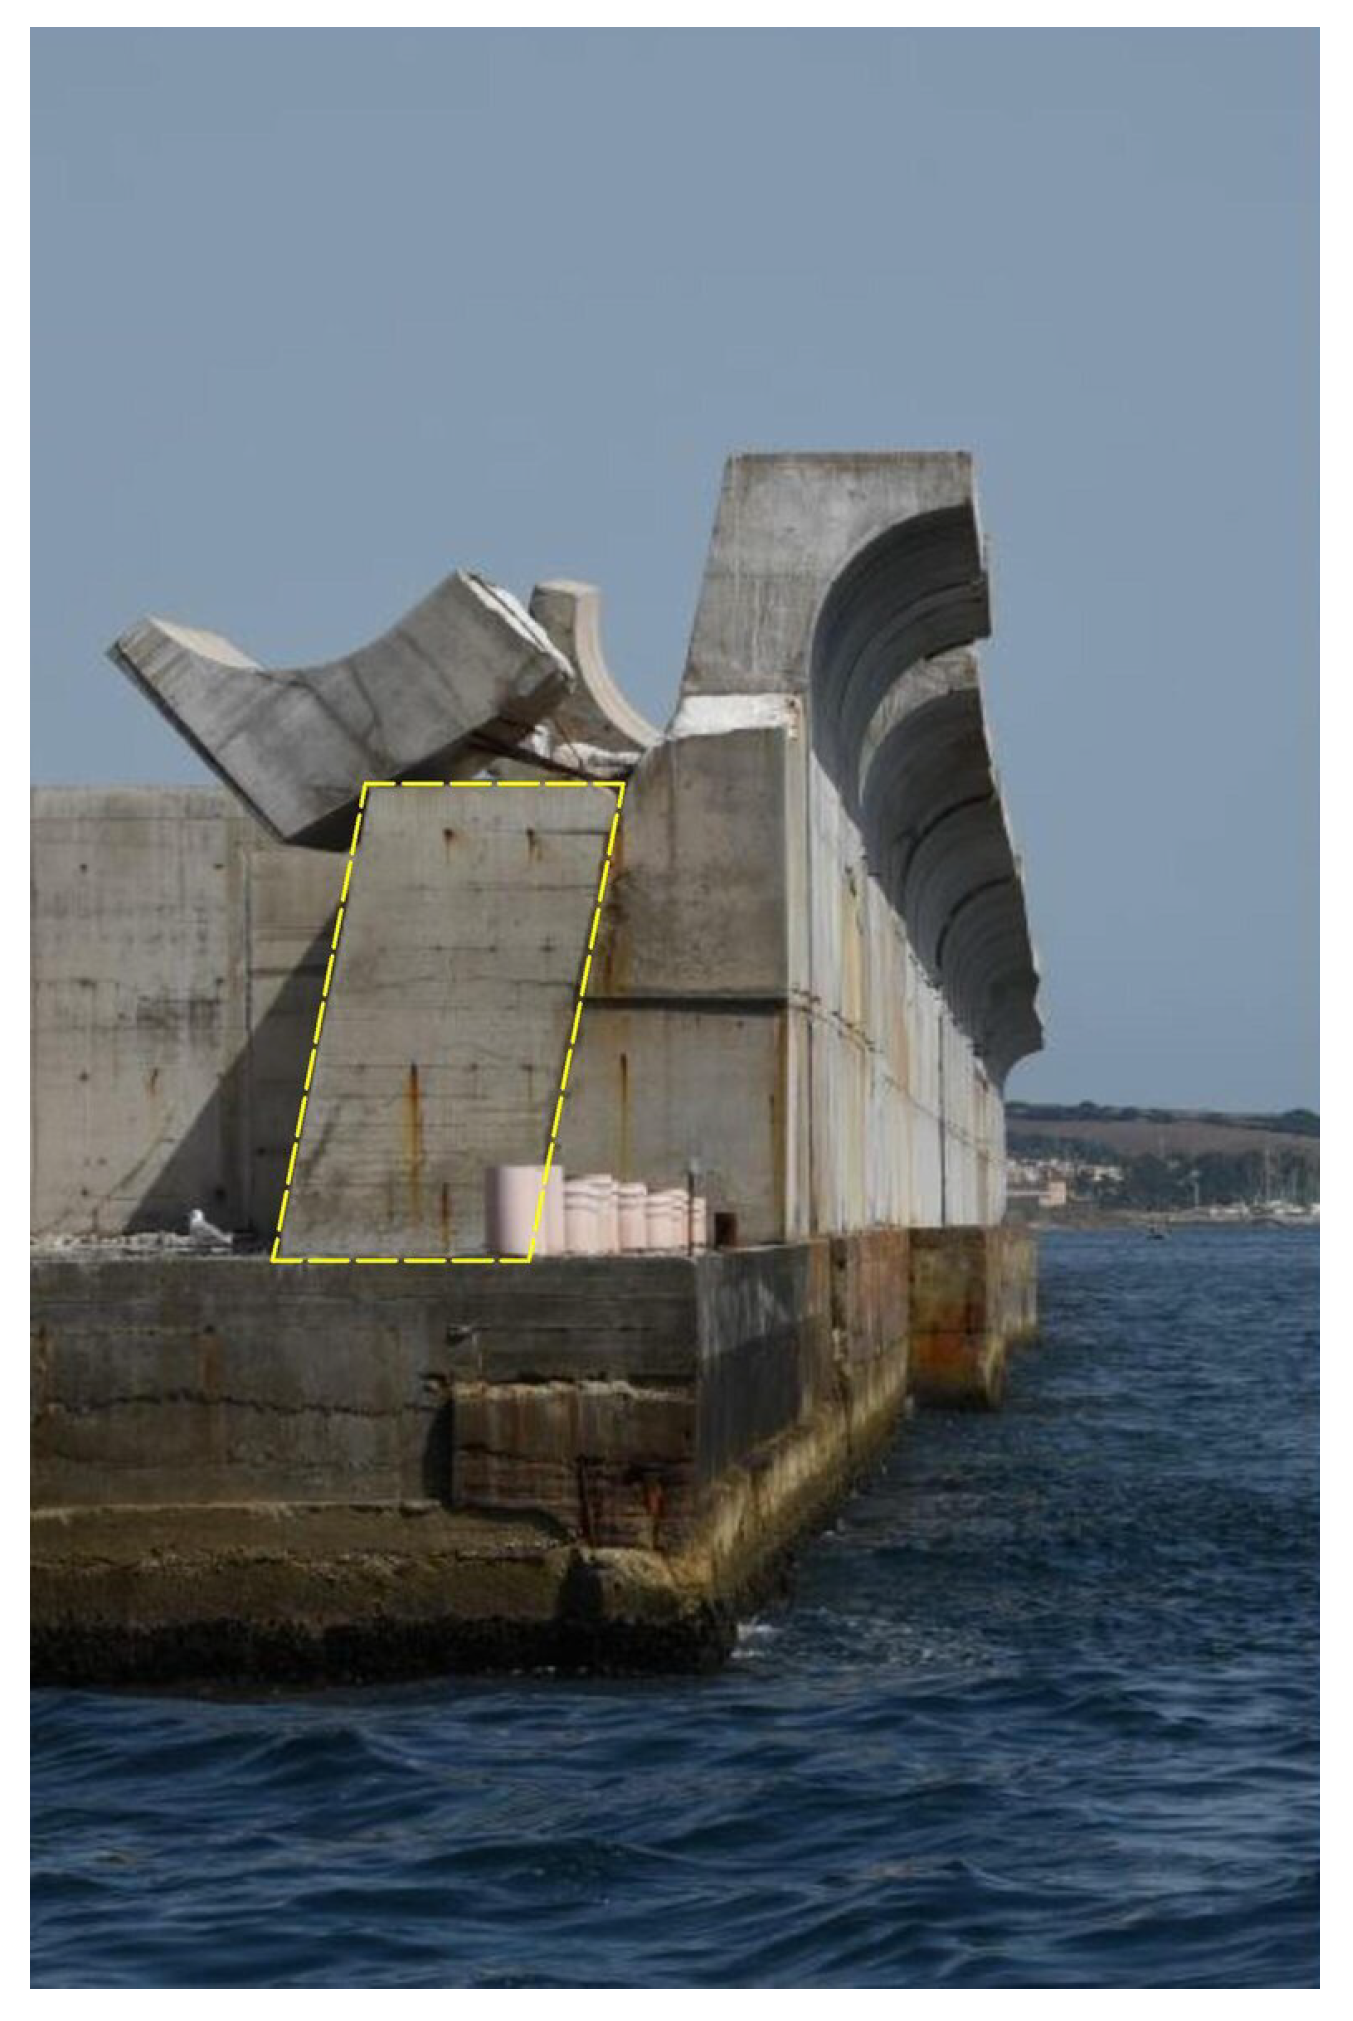
In the recent past, several breakwater parapet failures have been observed. Damages occurred for example in Pico Island (Azores, Portugal) [11] and in Strand (South Africa) [12,13] both characterized by a recurved wall. Typically, this type of failure occurs due to breaking waves interacting with the top of the wall. The waves are then blocked and deflected offshore leading to rather high impulsive wave pressures. Recent experimental investigations of breaking waves interaction with seawalls characterised by a horizontal cantilever slab were carried out by Kisacik et al. [14,15], while Ravindar et al. [16] investigates the loading of breaking waves on parapets with a recurve. Generally, it has been observed that under breaking wave conditions, the maximum impulsive pressure is located near the Sea Water Level (SWL). Whereas for non-breaking wave conditions the maximum impulsive pressure is reached near the tip of the recurved parapet [17,18]. Another example of such a failure is shown in Figure 1 which occurred in Civitavecchia Harbor, Italy. A storm event that happened on 22 November 2015 resulted in the complete overturning of some of the concrete parapets. The remarkable aspects of this failure are—(i) the structure was a relatively new construction and (ii) no waves broke on the structure due to the large water depth around 25 m at the toe of the breakwater, rendering its study rather interesting. Indeed, the impact pressure was induced by a non-breaking wave that hits the overhang of the structure. This phenomenon has been called Confined-Crest Impact (C-CI) [18]. In this case the maximum impact pressure acts at the top part of the recurved parapet, possibly inducing an even more detrimental loading condition for the rigid parapet structure. Interestingly, Figure 1 shows that only some of the parapets failed, but the underlying reasons are unclear. No concrete quality inspection results, that is, coring, are available and therefore it is not possible to certainly say if this was the leading process. However, from a visual inspection, intensive corrosive concrete cover breakdown has been observed. Moreover, 3D effects can be excluded a priori because the wave direction is usually orthogonal to the structure. Hence, it can only be speculated that the leading reason for the failure was the poor, non-homogeneous, quality of the concrete.
This paper will focus on the study of Civitavecchia’s recurved crownwall failure, while attempting to get a better overall insight into the failure mechanisms affecting this type of structures and their response to dynamic wave forcing. To achieve this goal, the offline one-way coupling between a finite element model (FEM) and the pressure time series generated from a computational fluid dynamics (CFD) software [18] is adopted. The dynamic characterization of the structure is also performed to obtain a better overall understanding of the crownwall behaviour; while later in the manuscript the linear and non-linear structural analyses under impulsive non-breaking wave loadings are performed.
The paper is structured as follows. In Section 2, the applied methods are discussed, the underlying assumptions, the CFD data, the finite element model set-up and mesh sensitivity analysis are described. In Section 3, the results regarding the modal analysis, the structural linear and non-linear analysis under non-breaking impulsive wave loading are presented. Finally, in Section 4 the main conclusions and research ideas for future works are gathered.
2. Methods
2.1. Model Set-Up and Adopted Hypotheses
This problem is approached with a Finite Element Analysis (FEA) by using the well-known and extensively validated commercial software DIANA FEA 10.3 [19,20,21,22,23,24]. The main adopted hypotheses for setting up the model are listed below:
- The recurved parapet wall is assumed placed above the breakwater and there is no connection with steel bars between the two bodies. For this reason, only the parapet wall is considered in the Finite Element Analysis;
- It is assumed that the deformations of the crownwall can develop only within the x-y plan. Therefore, a 2D Plane-Strain model is applied;
- Fully rigid connection is assumed between the parapet wall and the beneath breakwater. For this reason, pinned supports all over the bottom of the parapet wall are assumed;
- No reinforcement bars are considered within the simulations. As clearly highlighted in Figure 1 the steel bars are not located on the seaside of the structure where the maximum tensile stress is developed (see Section 3.3), but on the rear. Therefore, within the simulations we assume no presence of reinforcing steel bars;
- A typical density for concrete is applied with a value of = 2400 kg/m;
- Young’s modulus is retrieved from Tables of “EN 1992-1-1: Eurocode 2: Design of concrete structures” [25] for the various cement classes used for the different simulations;
- This structure can be classified as XS3 exposure class. A concrete class of C35/45 is then suggested for this specific case [25], therefore the preliminary investigation will be carried out under this assumption;
- Poisson’s ratio is taken equal to [25];
- An additional concrete wall was constructed behind the parapet as highlighted in Figure 1 for reasons of overall stability. This additional wall is modelled through fixed high stiffness boundary interface. The normal and shear stiffness modulus were given a value of N/m and N/m respectively.
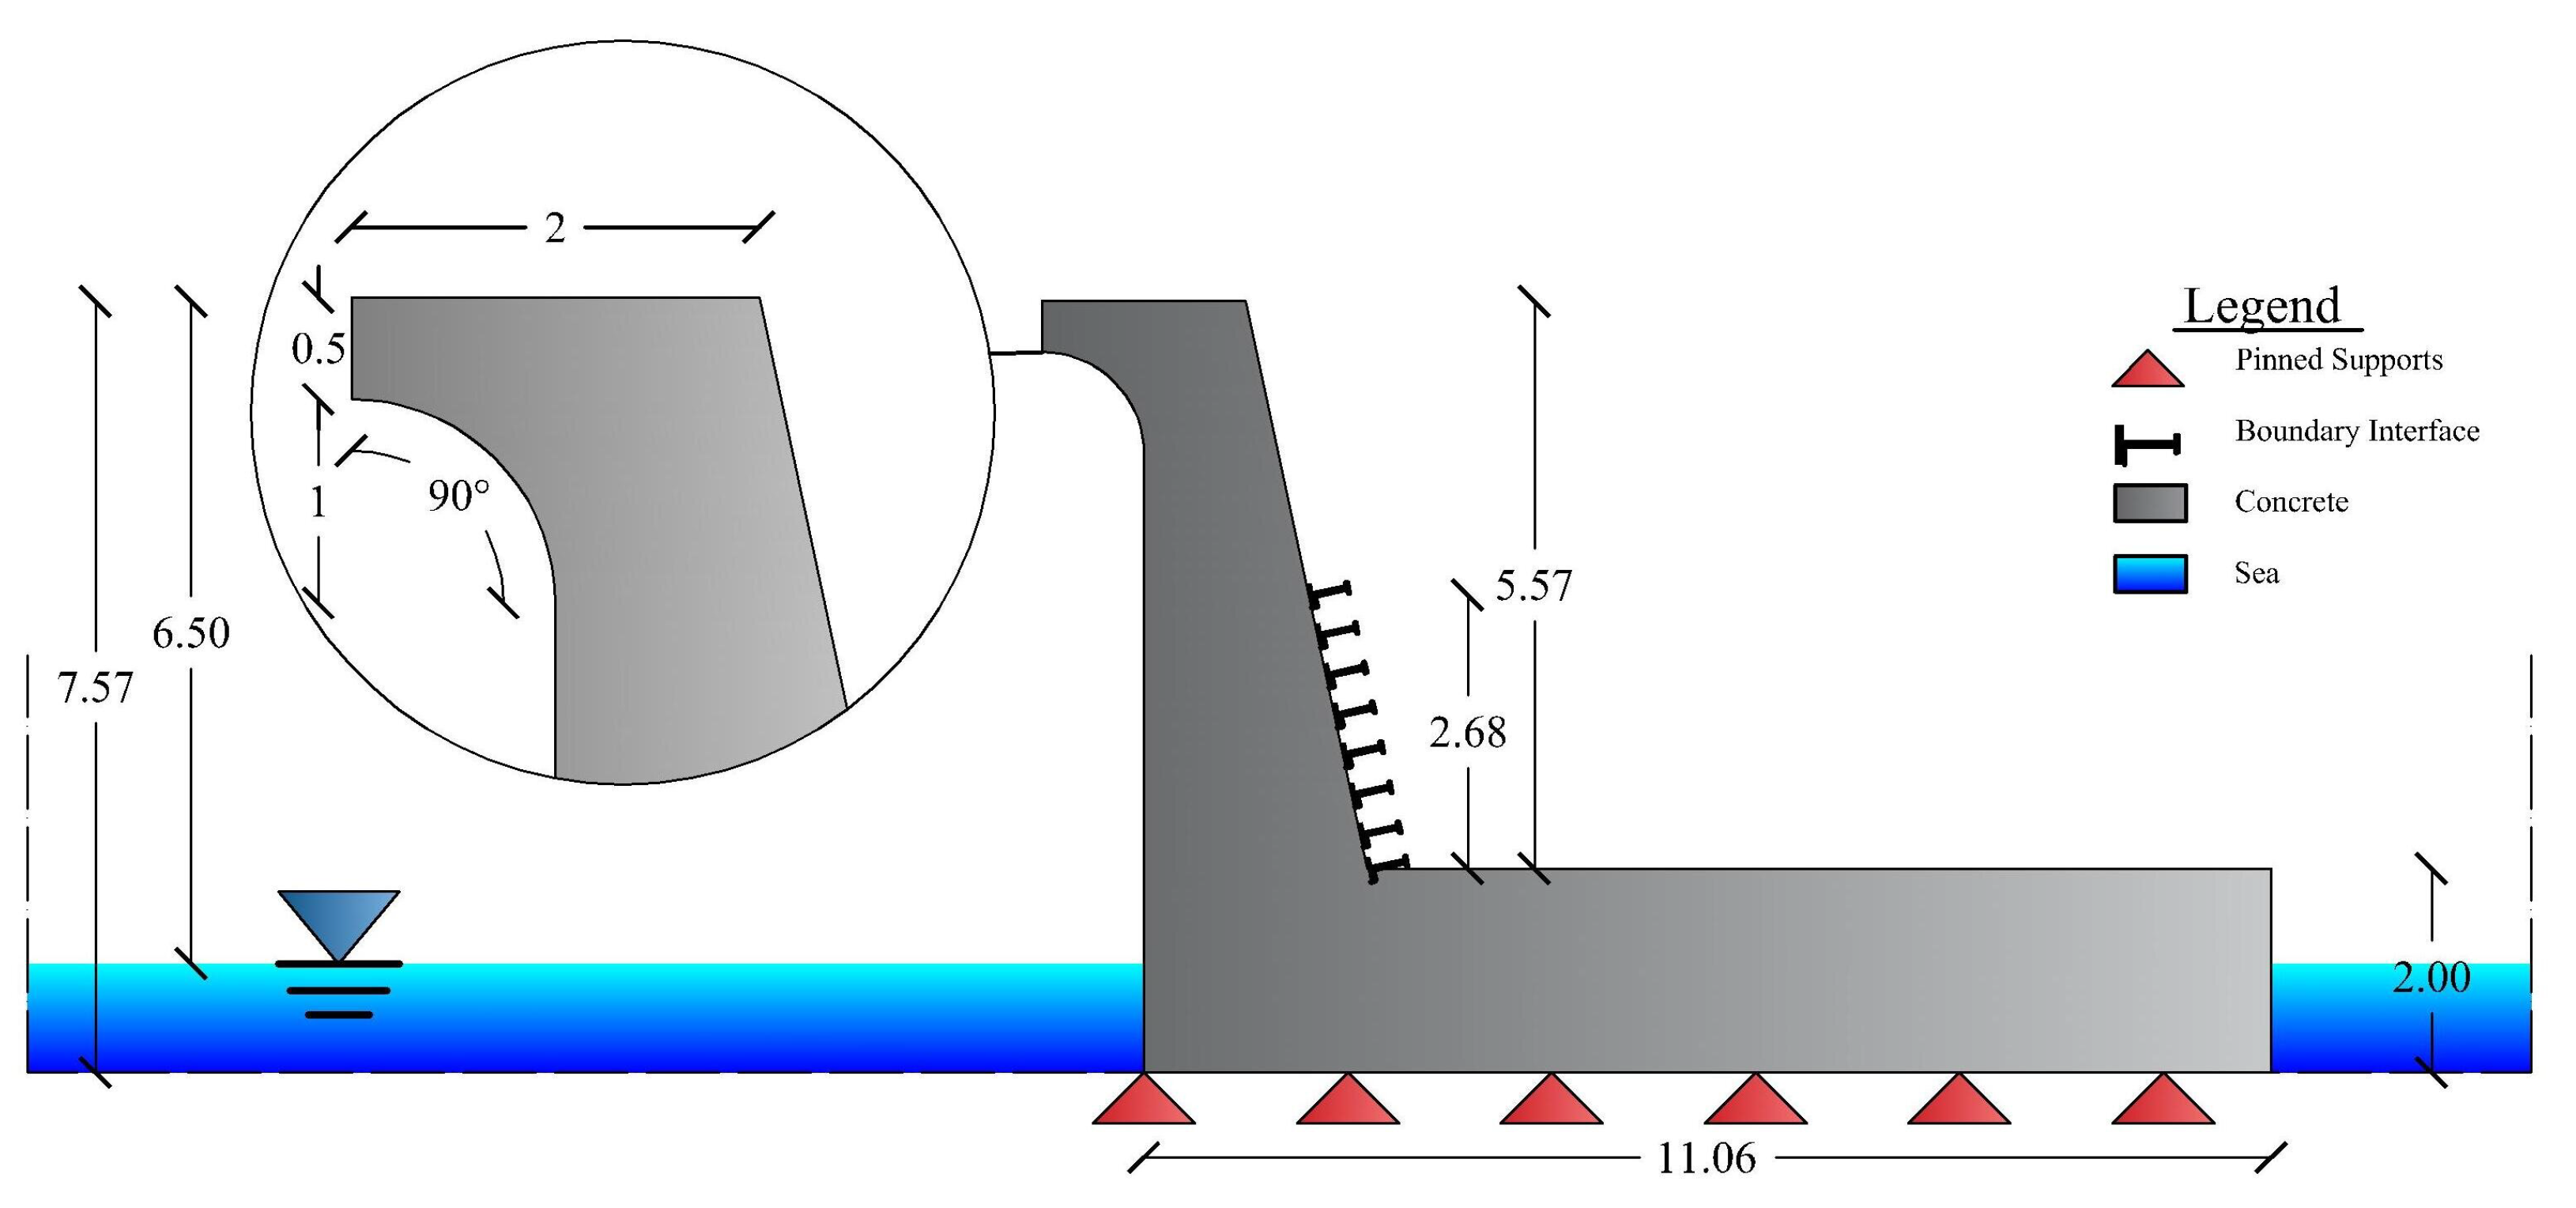
The adopted geometry is shown in Figure 2.
2.2. Pressure Field Time Series
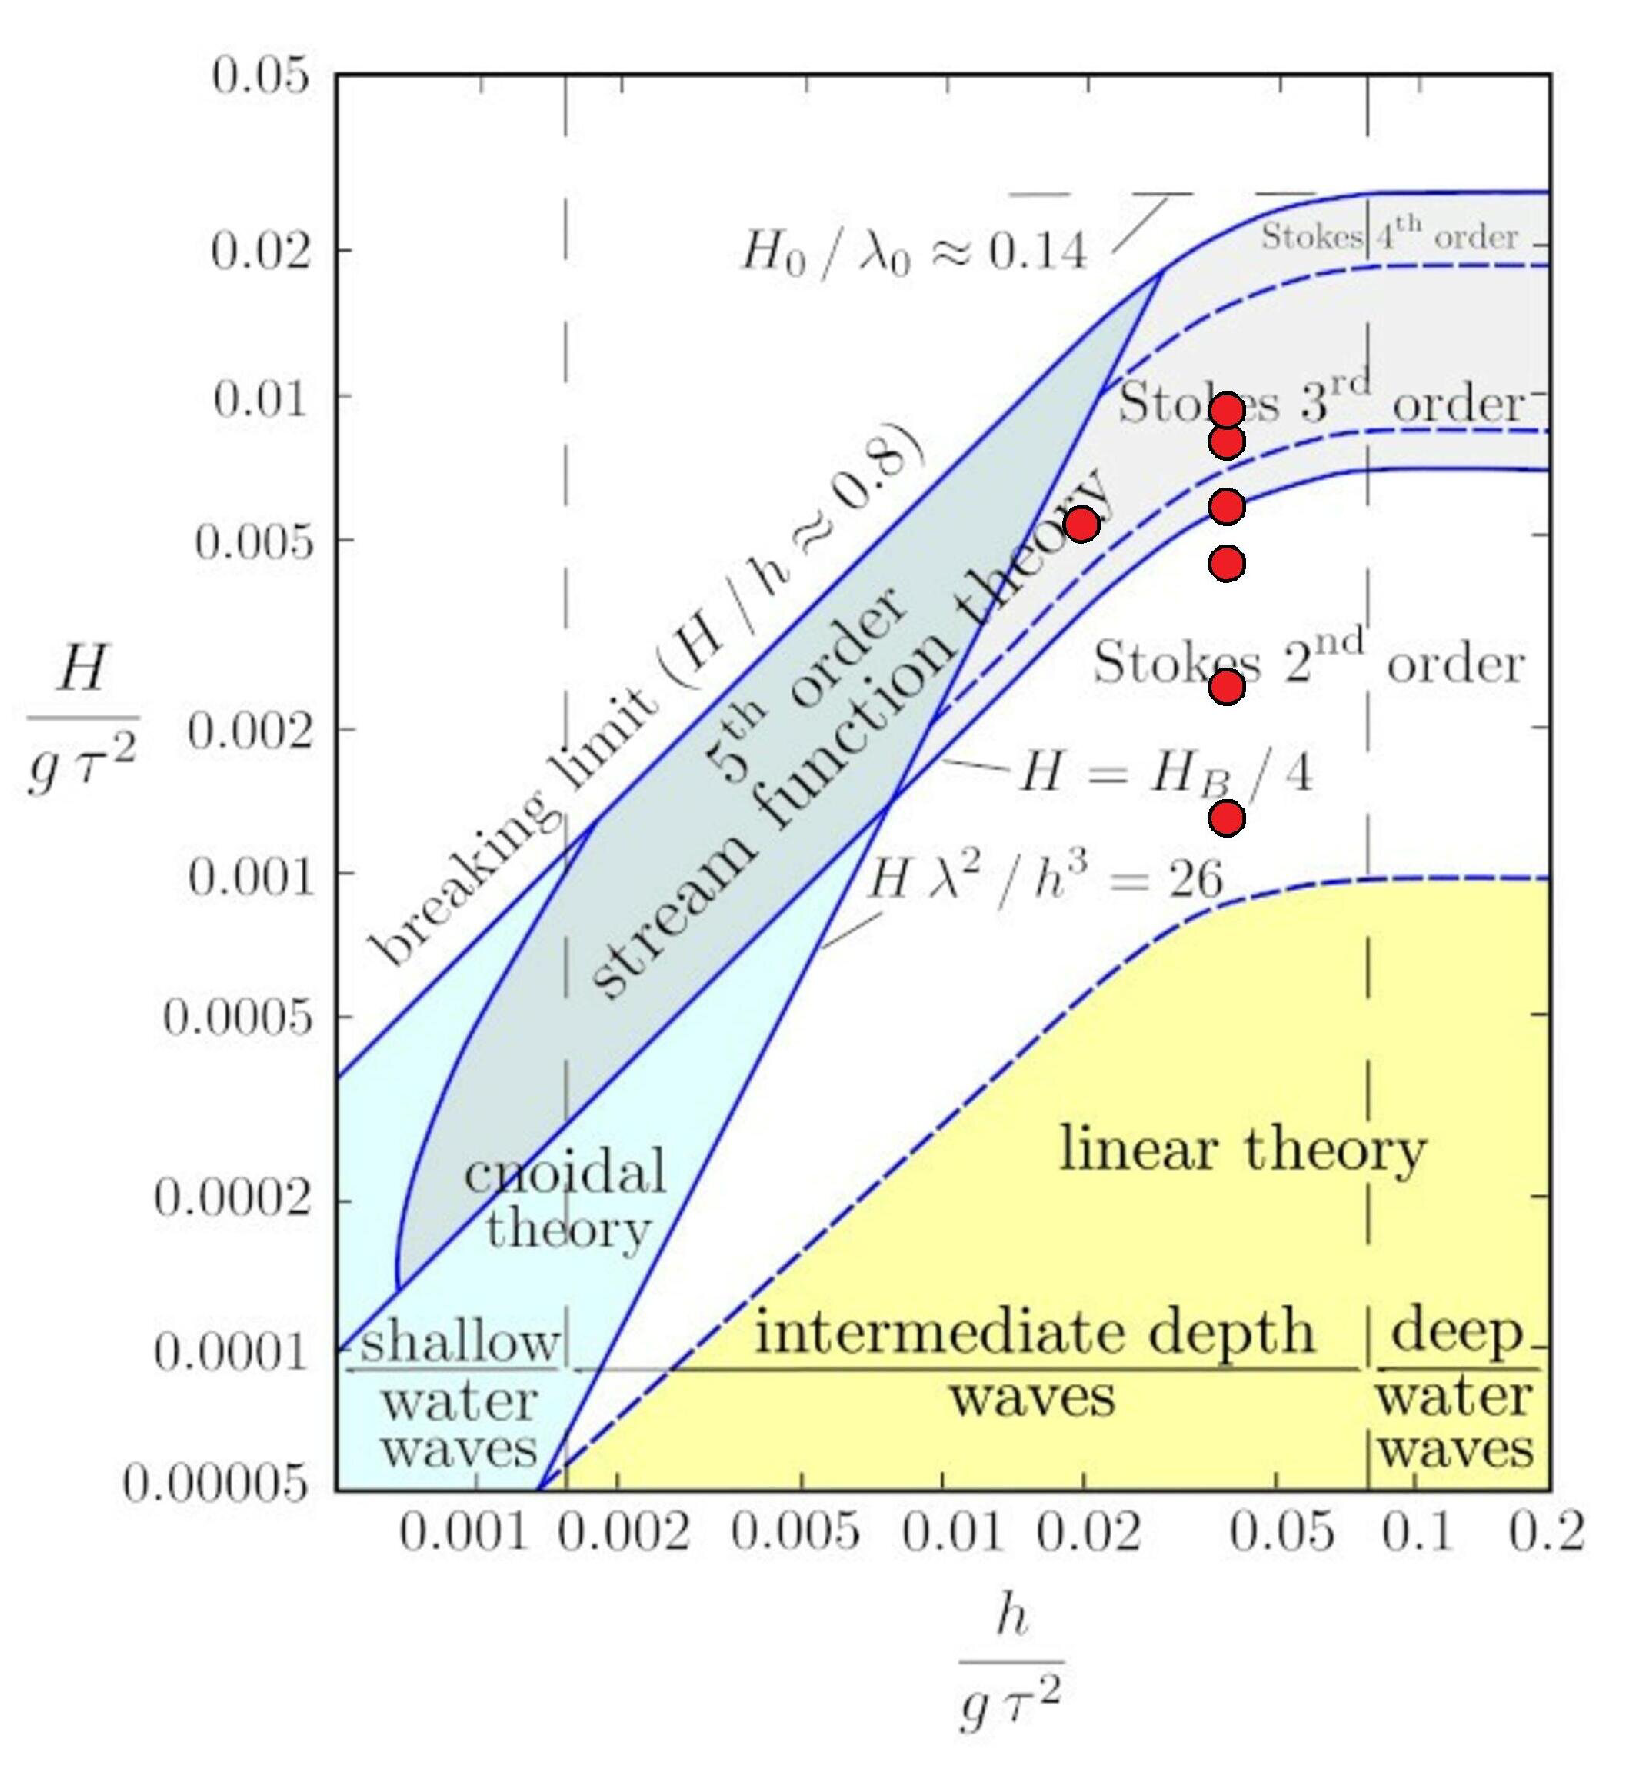
The numerical computations were performed applying OpenFOAM®, which solves the 3D RANS equations for multiphase flows (air and water for the present case). Furthermore, the IHFOAM numerical solver has been adopted for the wave generation [26,27,28,29]. The waves were generated on the basis of the information provided by Le Méhauté diagram [30] as shown in Figure 3. Accordingly, the adopted wave theory for the generation in the numerical wave flume ranged from Stokes 2nd order to Stokes 3rd order. The investigated wave conditions are presented in Table 1, with their respective wave height (H), period (T), freeboard to wave height ratio (), wave height to wave length ratio () and wave height to water depth ().
From a visual inspection of the breakwater site, a rough estimation of the wave condition that might have led to the failure of the crownwall was possible that is, WS5 ( m and s). However, the intrinsic inaccuracy of this estimation led to test via the CFD model a broader range of all possible wave conditions that are provided in Table 1, all coherent with the wave climate at Civitavecchia harbour. As shown by Castellino et al. [17], the adoption of regular wave conditions has the inherent advantage to reduce the computational time with limited downsides in terms of accuracy. However, a different analysis with wave groups containing the maximum wave height, for example, NewWave theory already applied to investigate the interaction between coastal structure and extreme wave [31], or longer irregular wave states might allow to account for less evident phenomena such as the effect of the waves preceding the maximum wave height and the changes in groupiness induced by the gamma factor characterising the underlying wave spectrum.
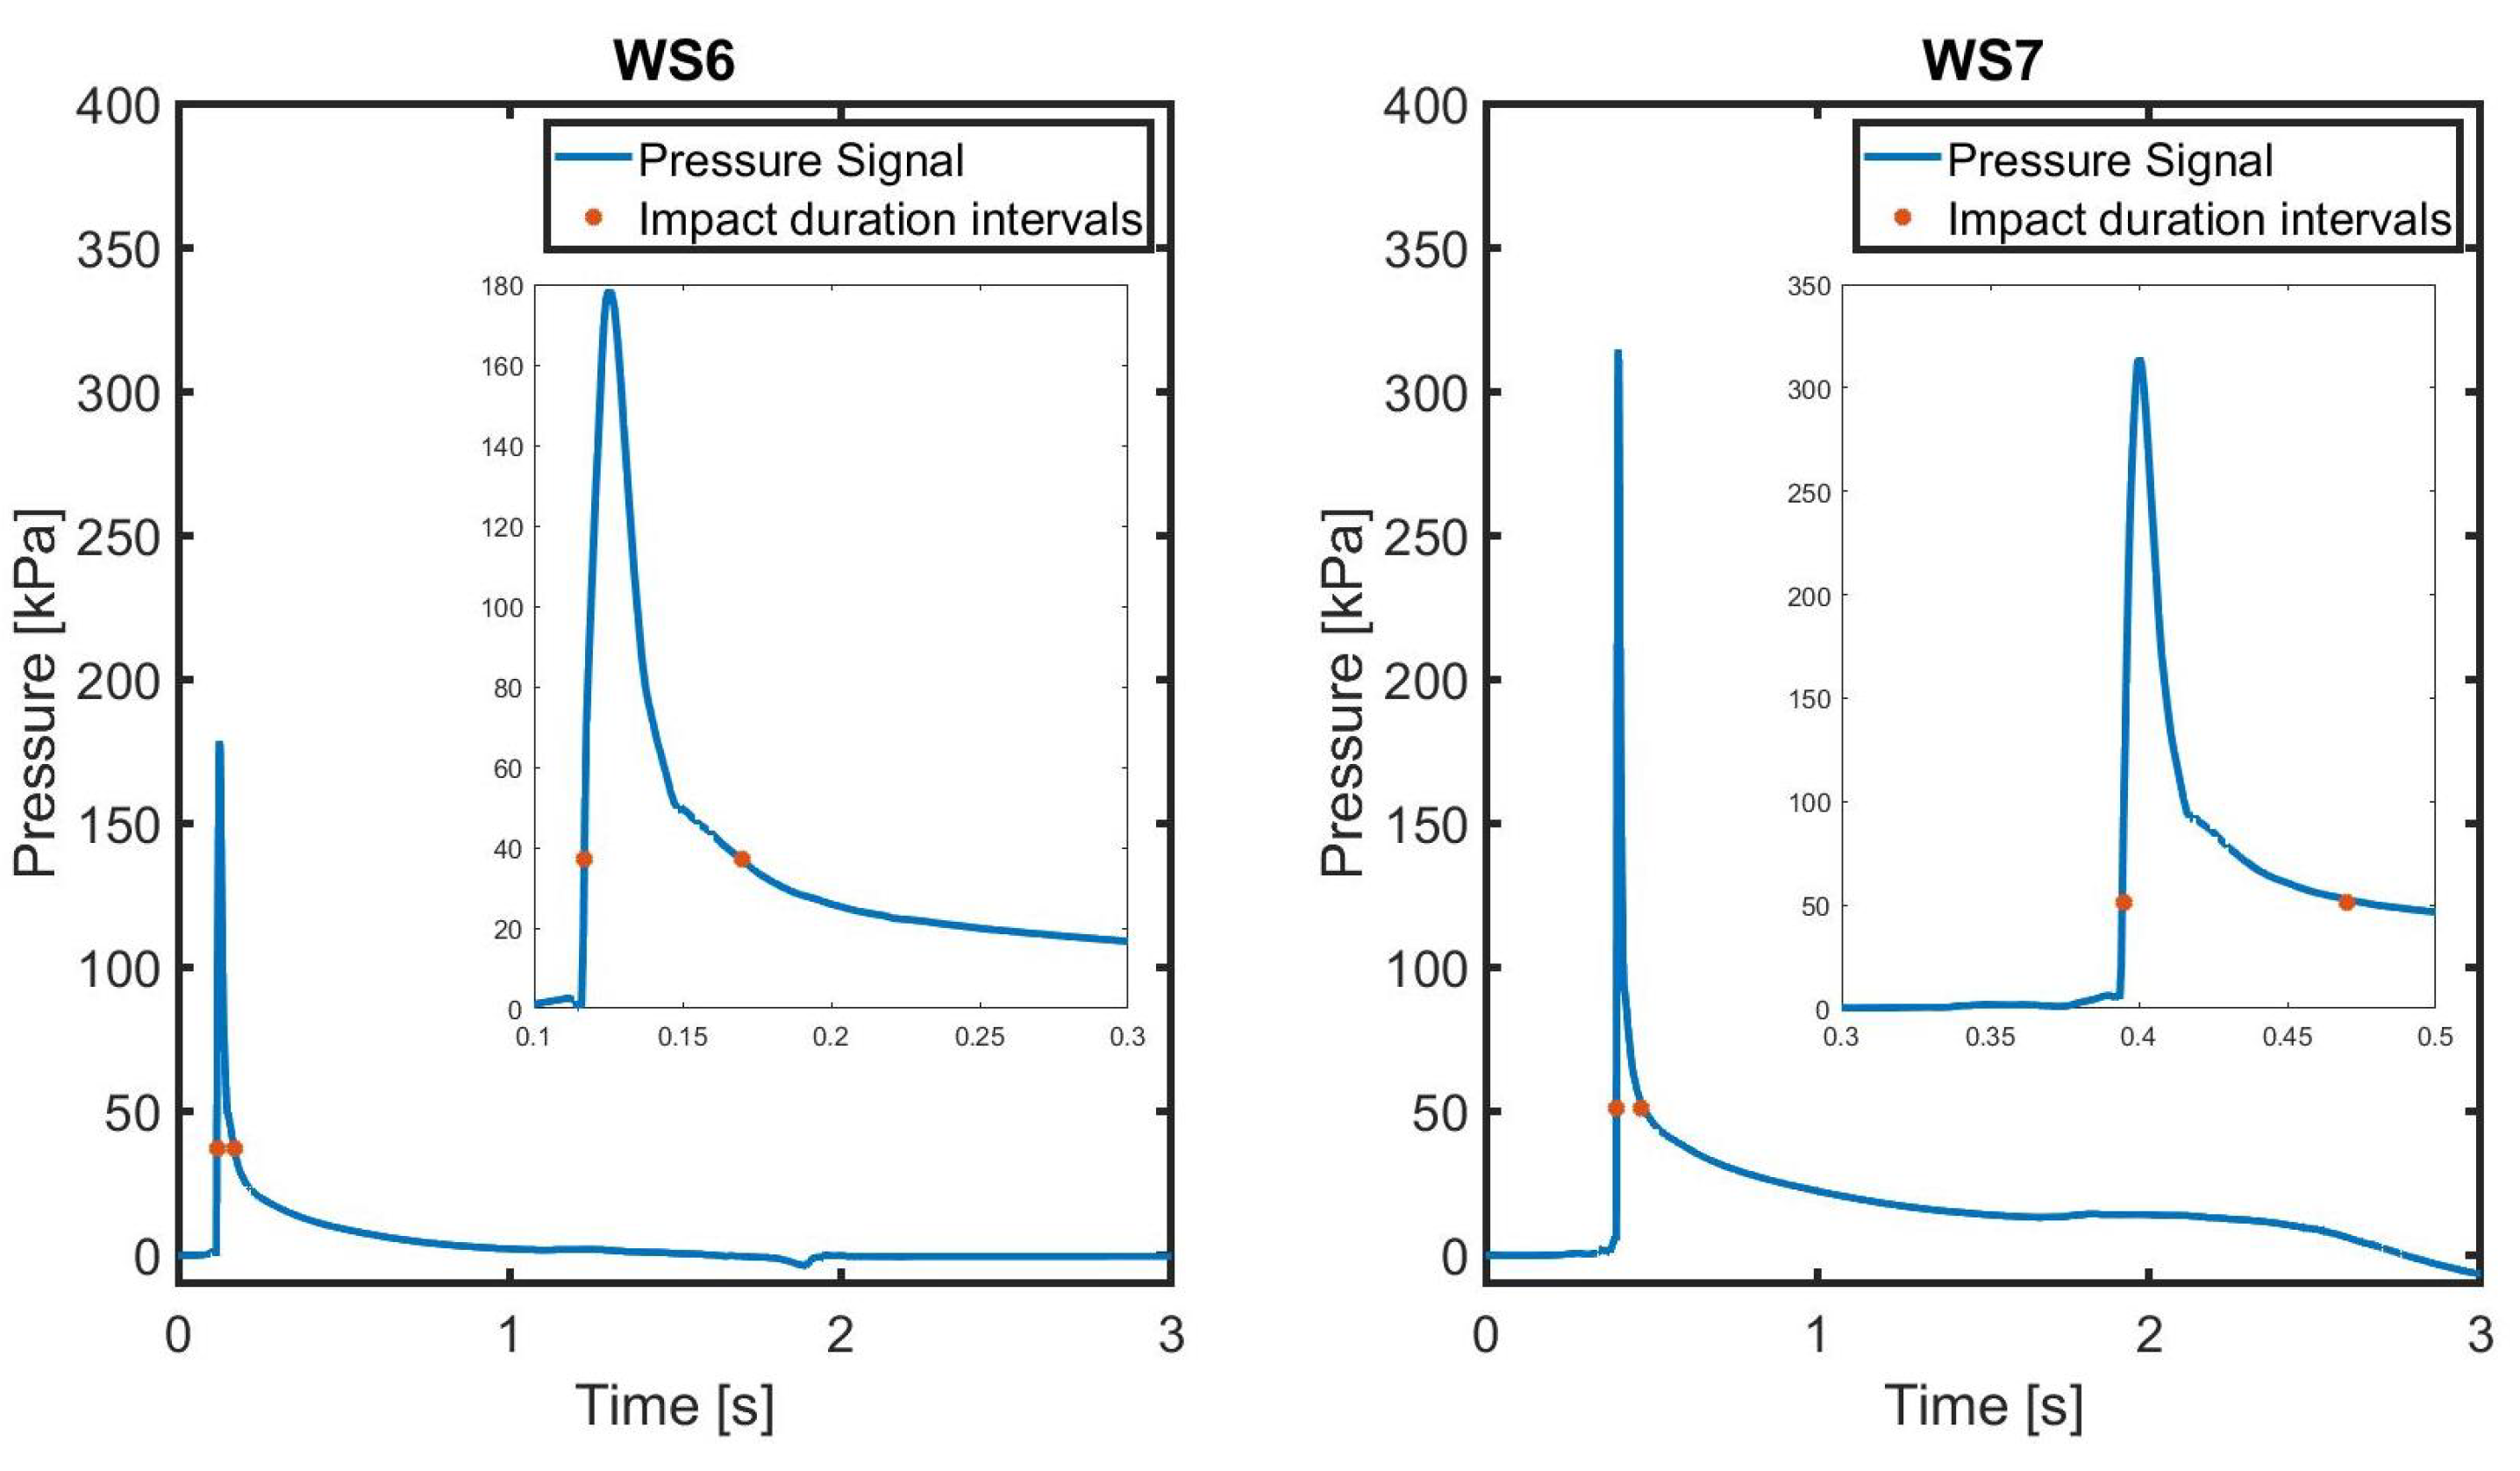
The wave induced pressure is measured all along the front parapet wall on 155 points. For a further description of the numerical setup, the readers can refer to Castelino et al. [18]. The lowest sea states are not presented in the current work as they lead to very low or no dynamic pressures on the sea side of the parapet. For this reason, only the two highest wave states are used for the structural analysis. Although WS7 produced higher dynamic pressure compared to WS6, both wave states are tested in order to preliminarily assess the effect of the wave period on the overall structural loading. Examples of the applied pressure time series at the upper edge of the parapet, that is, control point 8 in Figure 6, are shown in Figure 4.
Dynamic wave loadings can be categorised in three different domains according to the relative duration of the impulsive part and natural period of the structure [32], as shown in Table 2.
Where is the duration of the impulsive force calculated according to the methodology described by de Almeida and Hofland [33] and is the natural period of the structure. In Figure 4 the dynamic wave pressure for both wave states 6 and 7 is shown. The duration of the impulsive pressure component (Figure 4, red dots), for WS6 is around s while for is s. The calculated 1st natural frequency ranges from 54.5–56.6 Hz depending on the concrete quality (see Section 3.1), therefore this leads to for and for WS7 meaning that both wave states belong to the dynamic domain. Therefore, the time varying pressure field should be applied to properly analyze the parapet structure, both for linear and non-linear finite element analysis. To this aim, a one-way offline coupling approach is adopted, in which the CFD calculated pressure fields are interpolated on surfaces composing the crownwall’s front side and are imported as a forcing in the FEM model, therefore the coupling has not been achieved within a single software.
2.3. Model Set-Up
Modal analysis, in its broader meaning, predicts the linear response of a system subjected to a continuous series of harmonic excitations. When the loading has a deterministic frequency content, a steady-state linear dynamic analysis can be performed to describe the dynamic behavior of the investigated structure [34]. A series of preliminary eigenvalue analyses is performed to access the damping values and the element-size requirements of the mesh for dynamic analysis.
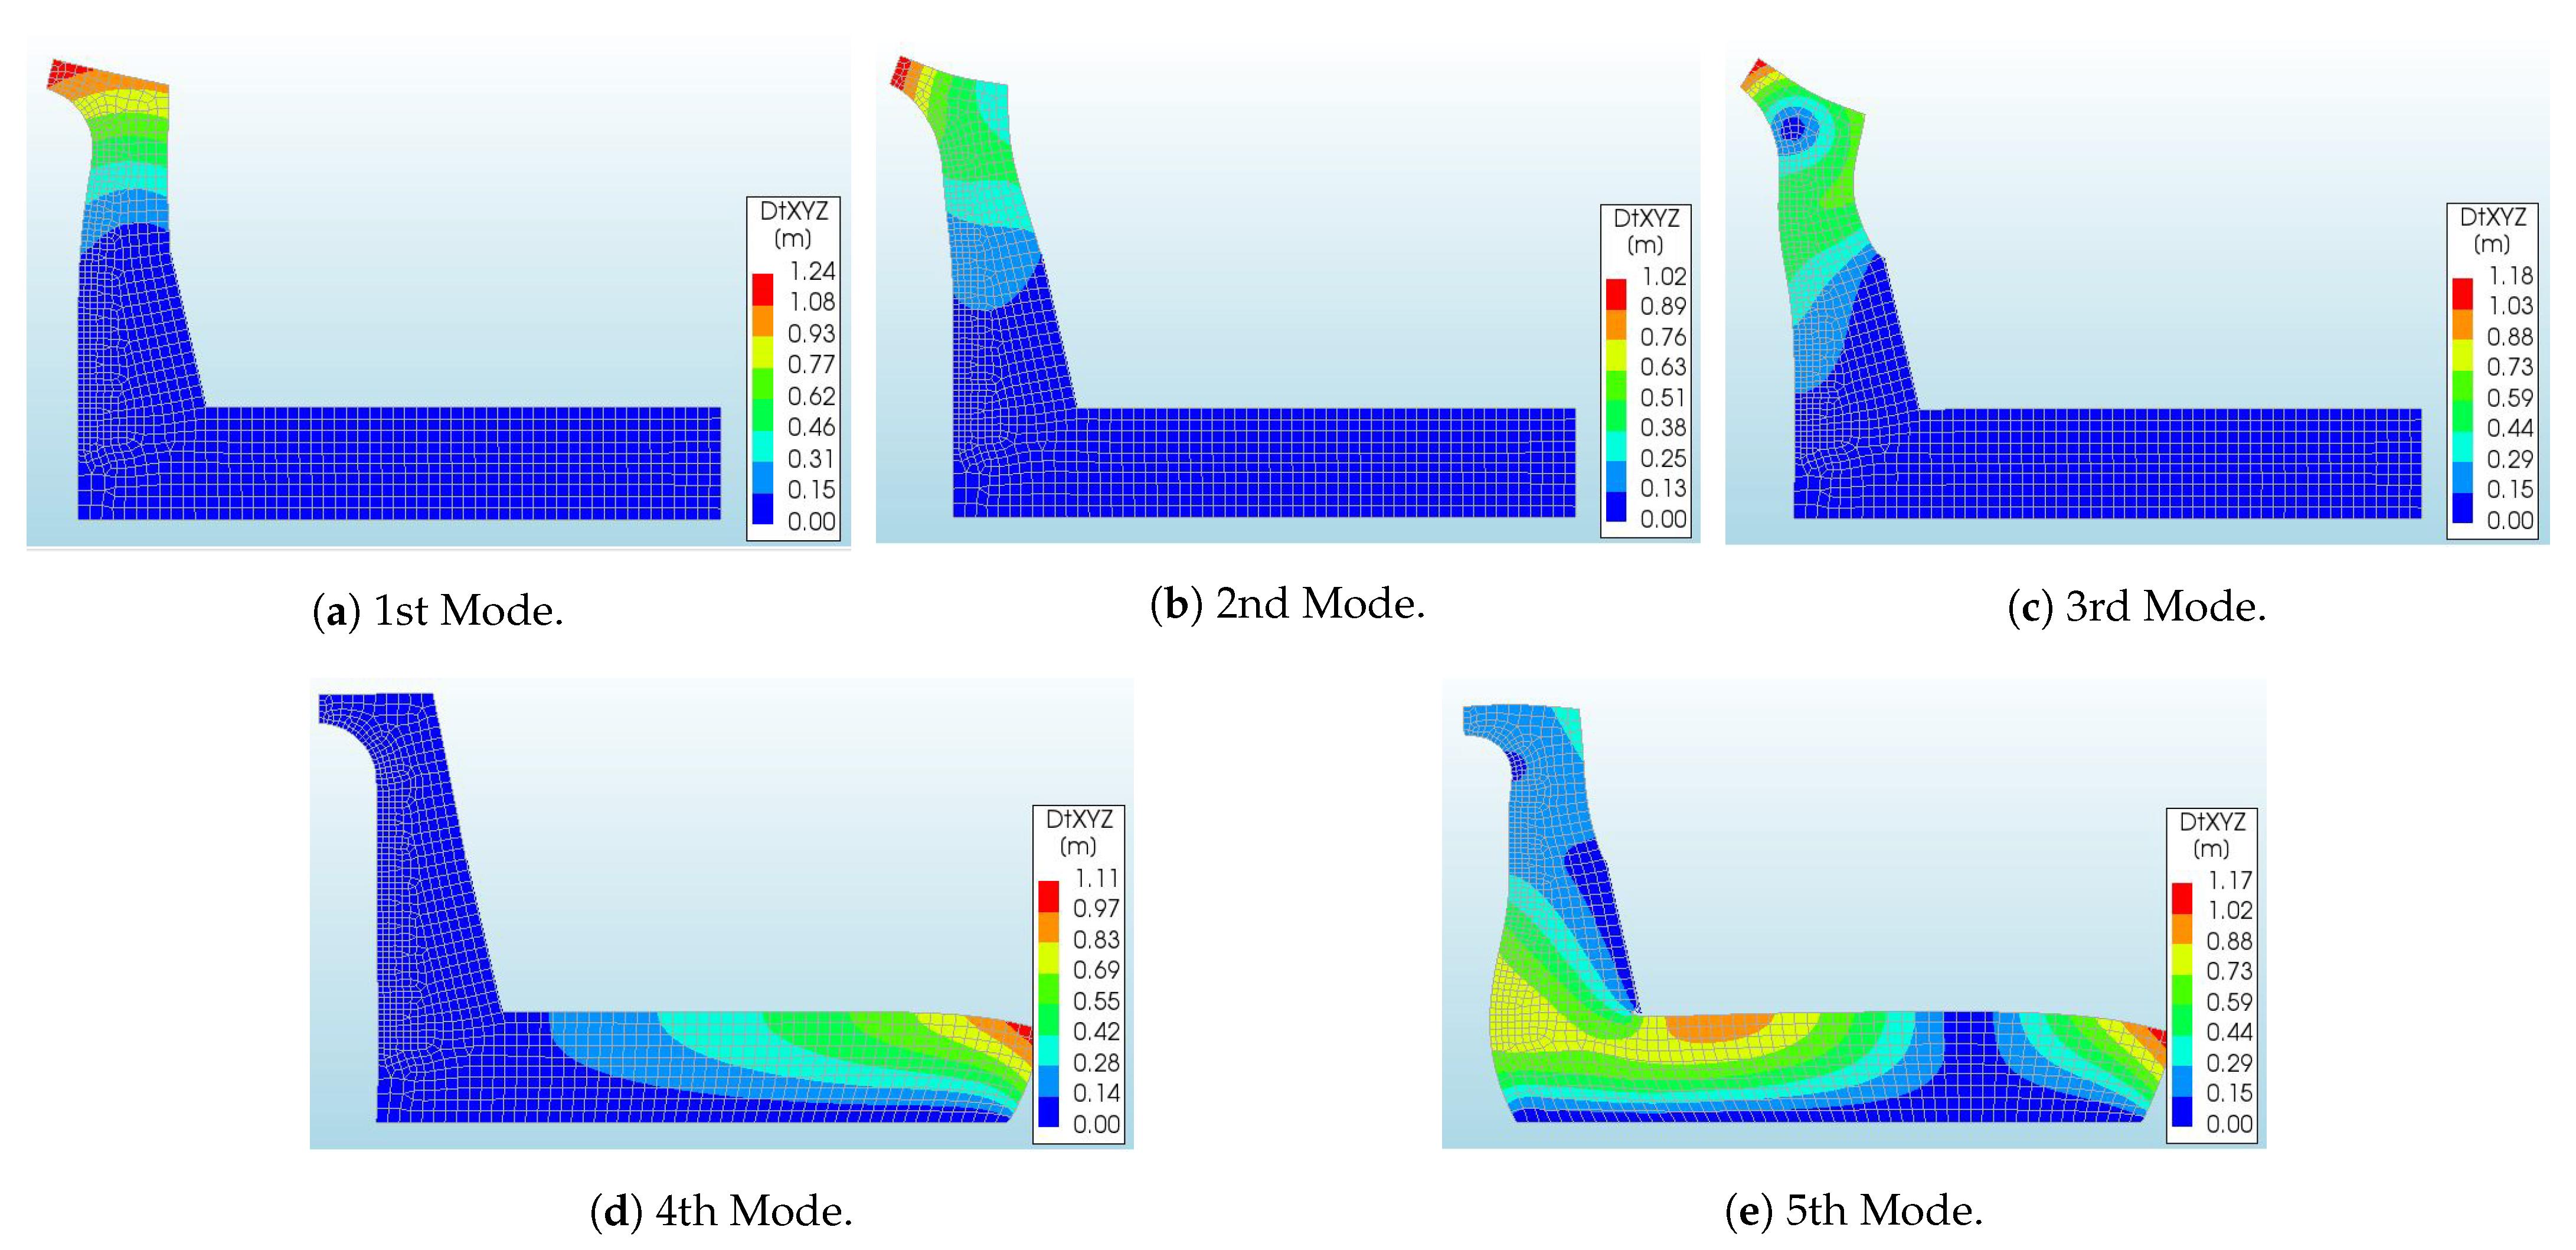
Mesh sensitivity analysis. Several modal analyses are performed for different mesh sizes in order to assess the effect of the applied mesh size on the solution. The analyses are performed on a structure characterized by the concrete class C35/45. Eleven mesh sizes are tested and the induced variation on the natural frequency values is adopted as a proxy to describe the convergence behavior of the model. The main outputs of the procedure are shown in Table 3, where an evident convergent trend is identified, reaching almost to no variation (less than ) for a mesh size smaller than m. The shapes of the first five modes are shown in Figure 5, while higher modes are neglected due to the minimum effect on the structure response to the wave loadings. Hence, hereinafter the model adopted for the analysis is characterized by m mesh size.
Adopted Damping Model. The Rayleigh Damping model is adopted. The coefficients and are calculated by taking into account that the sum of the effective modal masses must be over of the total vibrating mass of the system [35]. Thus, the adopted level of damping is assumed as for 50 and 500 Hz leading to the Rayleigh coefficients of and .
3. Results
3.1. Modal Analysis and Concrete Class Effect on the Crownwall Dynamic Behavior
Modal analysis is performed to investigate the effect of the three different concrete classes adopted within the non-linear analysis (i.e., C35/45, C30/37 and C25/30) aiming to detect the influence of the material properties on the effective mass participation factor (EMPF), and accordingly, on the effective modal mass for each natural mode. The EMPF represents the percentage of the system mass (effective modal mass) that participates in a particular mode. It provides a measure of the energy contained within each mode, therefore a mode with a large EMPF is usually a significant contributor to the dynamic response of a system.
The main results are presented in Table 4, Table 5 and Table 6 for the x-direction, that is, positive x is directed from offshore toward the coast. The 4th and 5th modes are clearly dominant, due to the involvement of the horizontal bottom slab leading to the larger EMPF. However, looking at the 4th and 5th modal shapes (Figure 5d,e), the involved part of the structure is not directly affected by the wave load, hence the 4th and 5th modes will not massively respond to the incident wave load. The 1st mode is the dominant one for the vertical part of the crownwall and also likely to be the modal shape (Figure 5a) that triggers the investigated failure mechanism due to its relatively large EMPF. Moreover, by comparing the values presented in Table 4, Table 5 and Table 6, it is evident that the concrete classes partially affect the dynamic behavior of the overall structure. The natural frequencies, as expected, decrease with the decreasing of the concrete quality, whereas the effects on the EMPF are minimal.
3.2. Dominant Mode Variation along the Crownwall
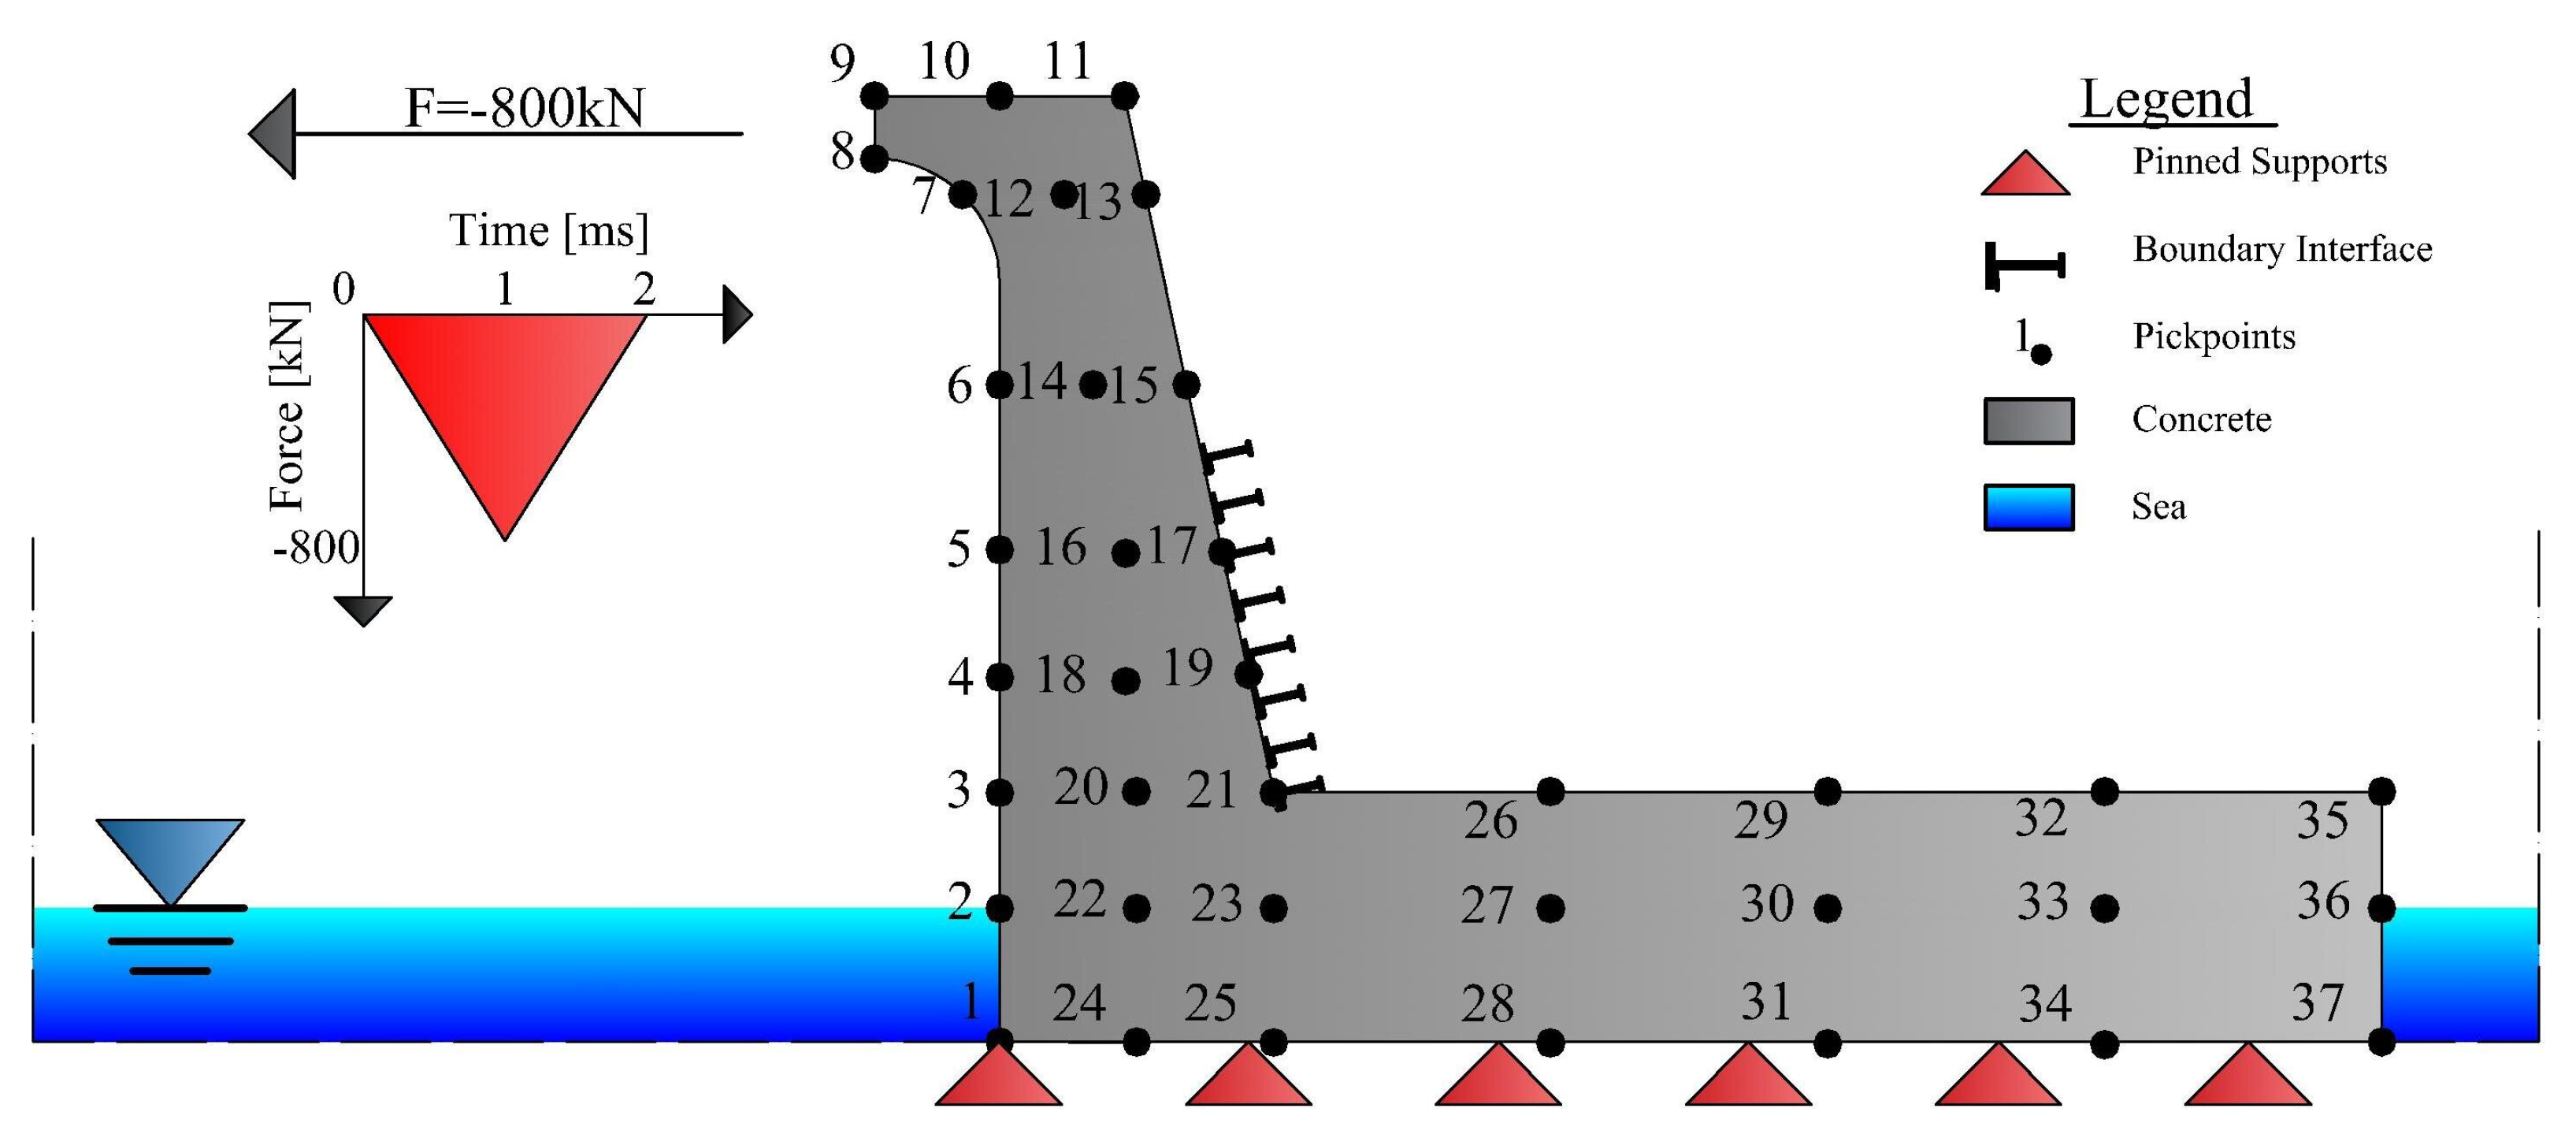
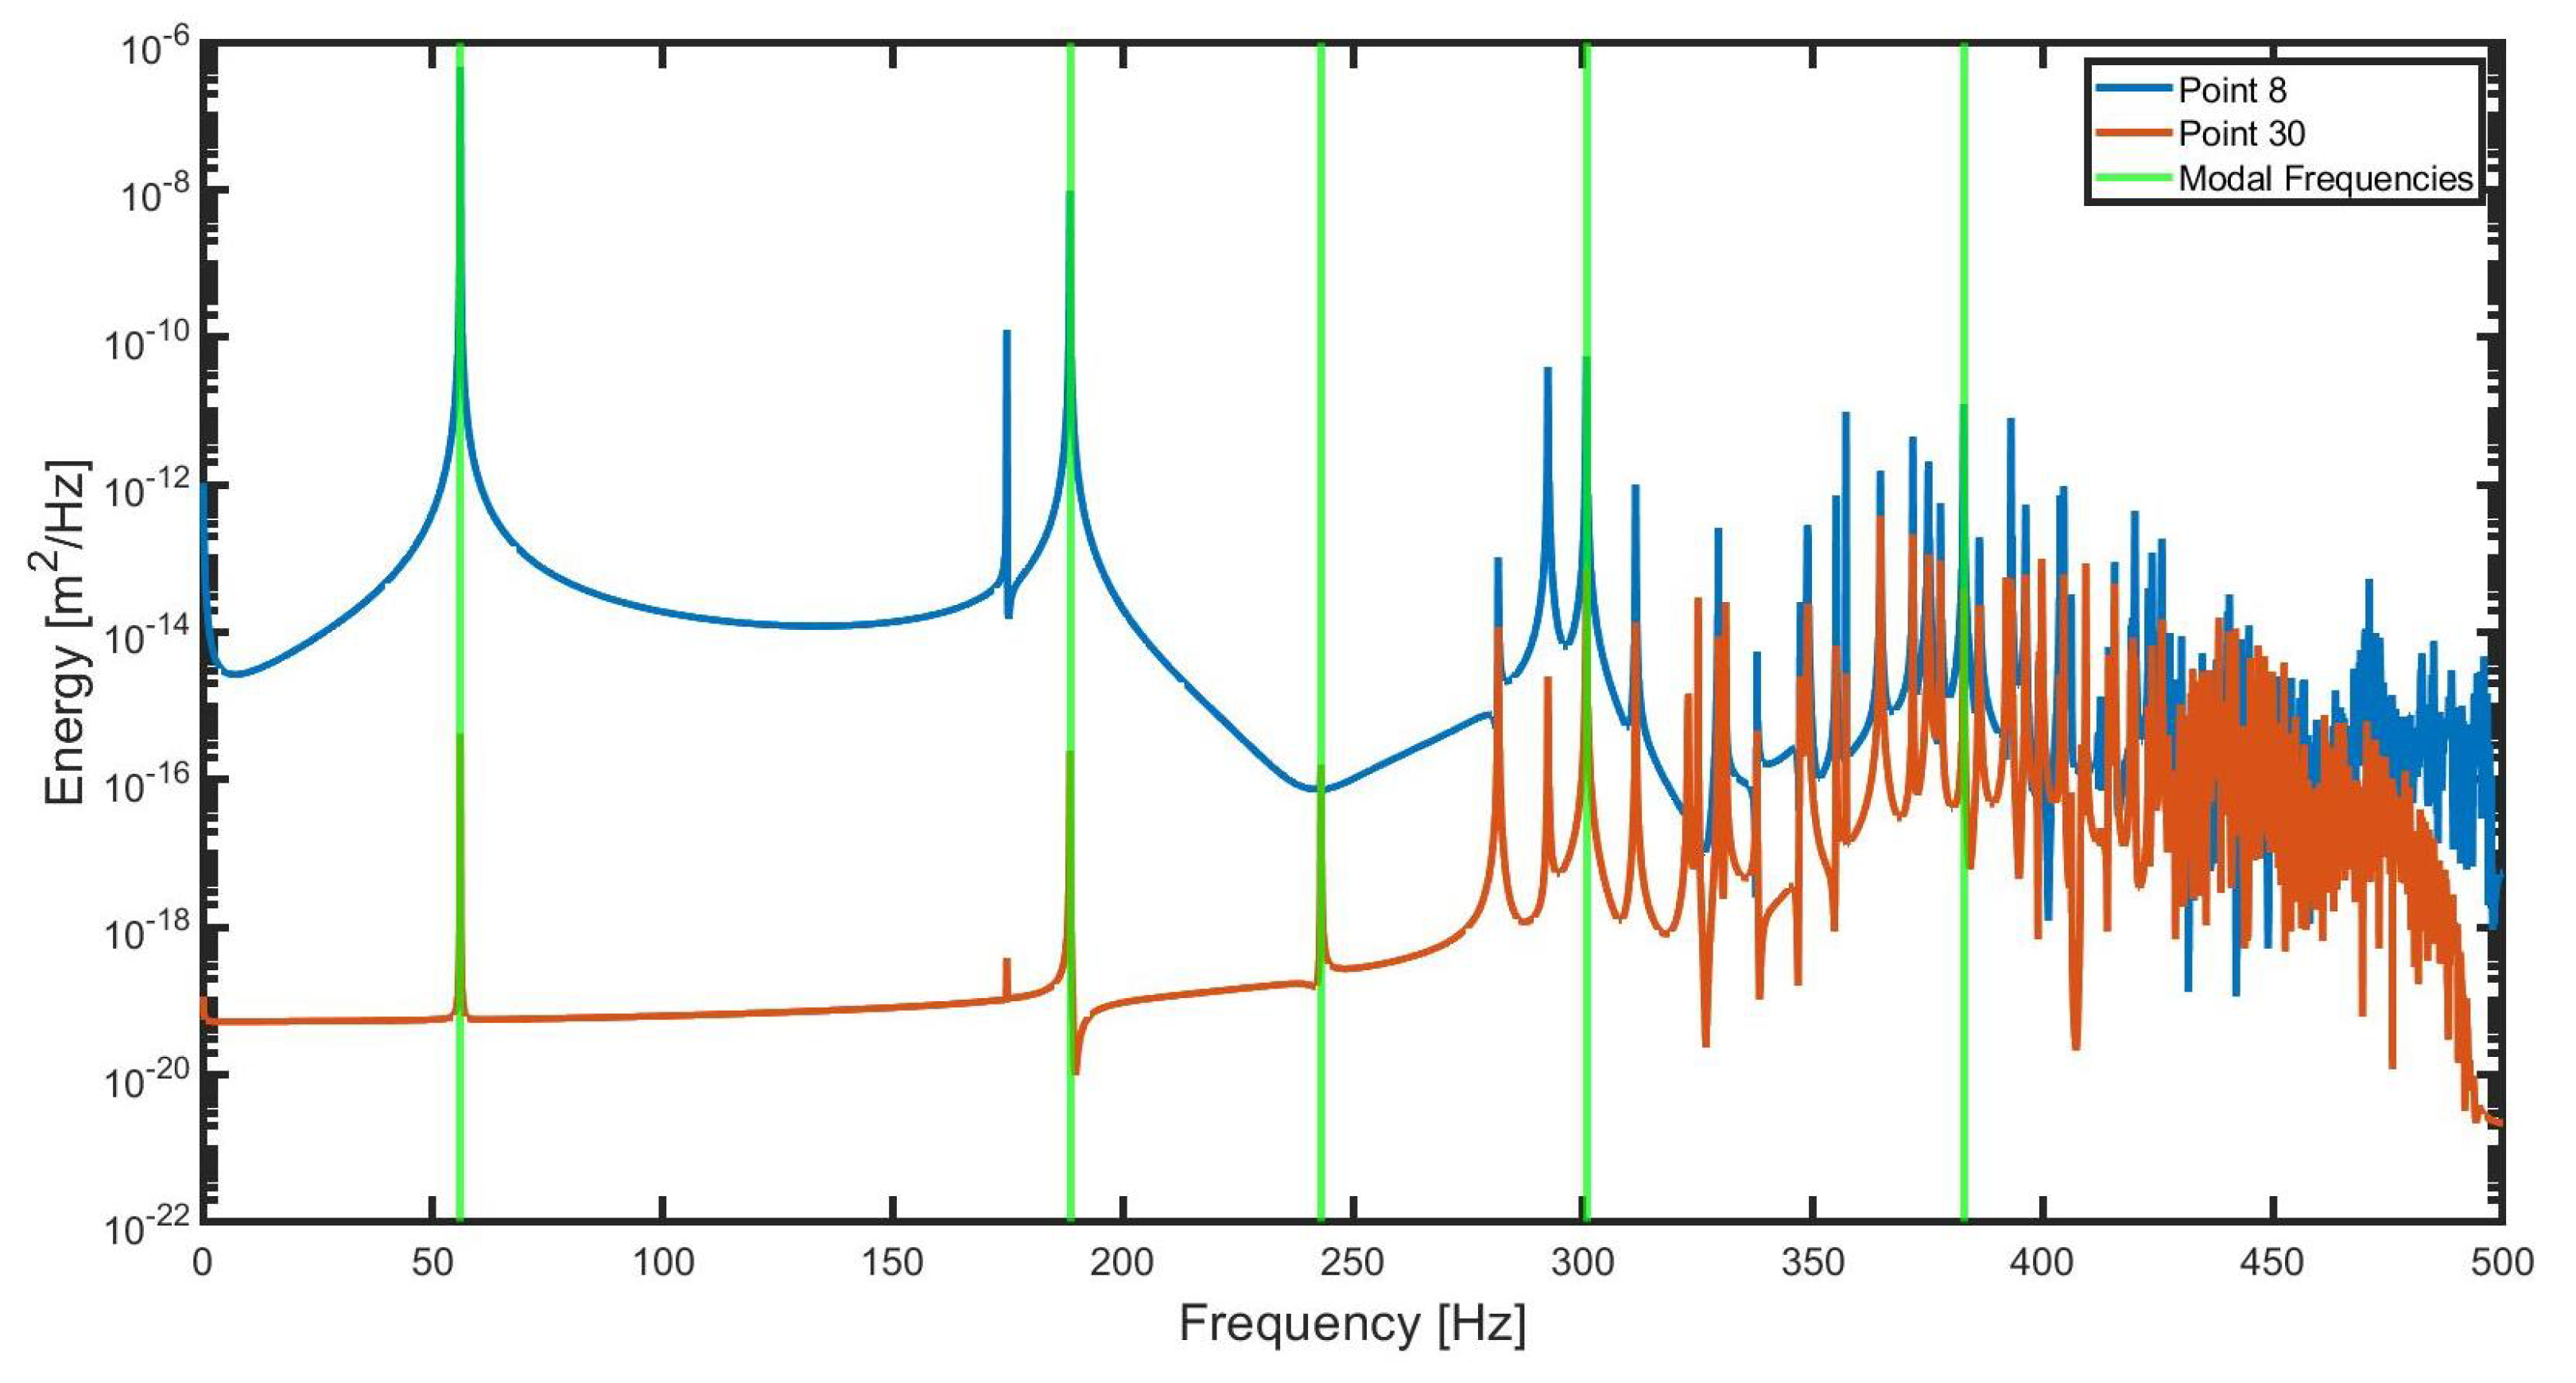
The purpose of this analysis is to identify which natural mode is dominant within the structure, which also describes which mode should have the largest effect on the response to the impulsive wave load. A virtual impact hammer test is performed to this scope. The top part of the crownwall is subjected to a time-varying triangular impulsive horizontal force with a peak value equal to 800 kN and a duration equal to s (Figure 6). After the virtual hammer impact, the structure is let free to vibrate while recording the displacements along the x-direction of 37 different control points on the structure for the following s, Figure 6. Then, through a standard frequency analysis, for each of the recorded displacement time series the first five dominant modes are defined as the high-energy peaks (Figure 7). The dominant mode for every control point is defined as the one corresponding to the frequency with the highest energy. Due to the negligible effect of the concrete class on the overall dynamic behavior of the structure only C35/45 concrete class is taken into account for this analysis. The example energy spectra resulting from the aforementioned procedure are provided in Figure 7 for control points 8 and 30, while the identified natural frequencies are highlighted with vertical green lines.
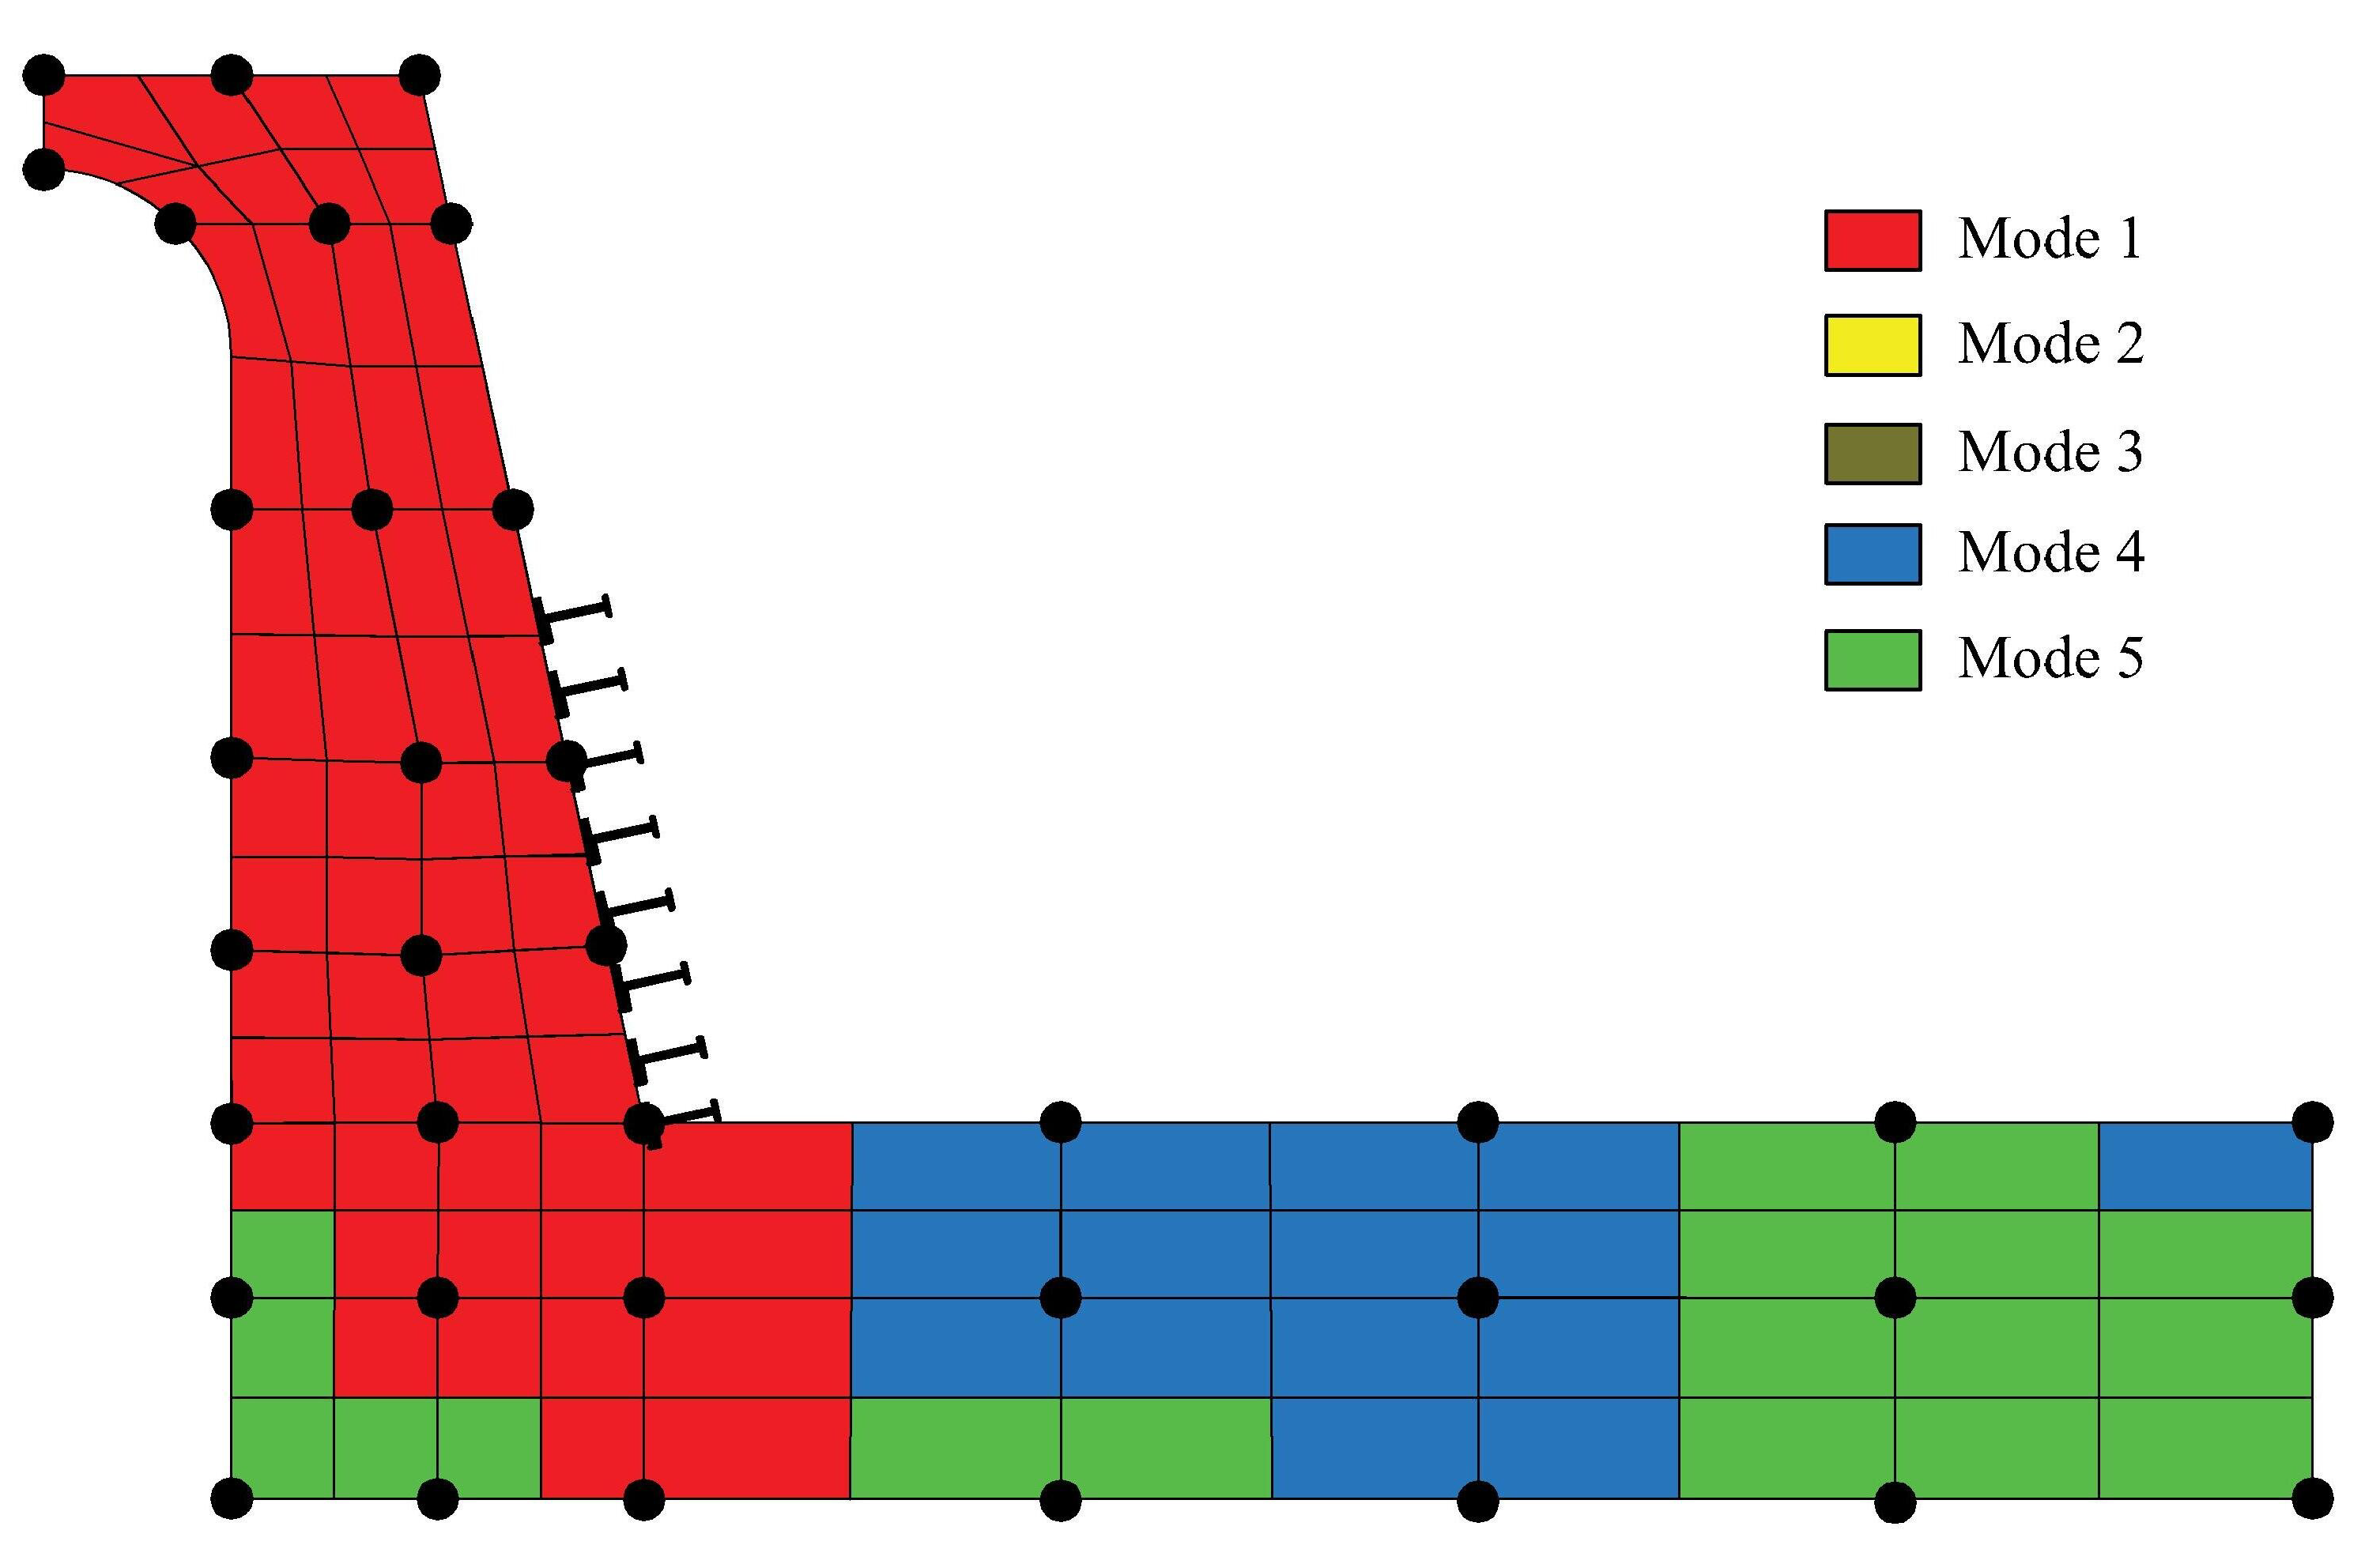
Figure 8 summarizes the results of the analysis, while a more detailed numerical description is provided in Appendix A. It can be observed how the 1st mode dominates the dynamic behavior of the entire vertical part of the crownwall protruding its effect also within the frontal part of the horizontal slab. The 4th and 5th modes are only relevant within the second half of the horizontal slab, confirming their relatively weak influence on the overall structural response under dynamic wave loading. The lower left corner of the structure seems to be slightly more affected by the 5th mode than the rest of the frontal surface of the structure. However, this area is not relevant for the response to the dynamic wave loading due to the larger stiffness of the structure at this location compared with the vertical cantilever part. As expected, due to associated small values of EMPF, the 2nd and 3rd modes are not relevant for the dynamic response of the crownwall under wave action.
3.3. Linear Analysis
A transient dynamic analysis with linear material properties is performed to identify the stress distribution and to define which of the two wave states produces the maximum stress value in the crownwall so that it can later be investigated via the non-linear analysis. The impulsive nature of the wave loadings presented in Figure 4 imposes the adoption of a rather short time step to properly capture the dynamic response of the crownwall under such fast-varying time load. Therefore, a varying time step is applied ranging between the minimum value equal to s and the maximum value s for the impulsive and quasi-static parts, respectively. The linear analysis is performed to investigate normal stresses in both the x (horizontal) and y (vertical) direction, that is, and . The maximum stresses are what eventually is going to lead to the failure of the structure, therefore identifying the maximum peak pressures is important for defining the worst loading case. The analysis is performed for the concrete class of , and for both wave states WS6 and WS7. The only variable that changes and affects the results of the linear analysis is Young’s elasticity parameter (), equal respectively to GPa, GPa and GPa. The main results in terms of maximum and values are presented in Table 7 and Table 8.
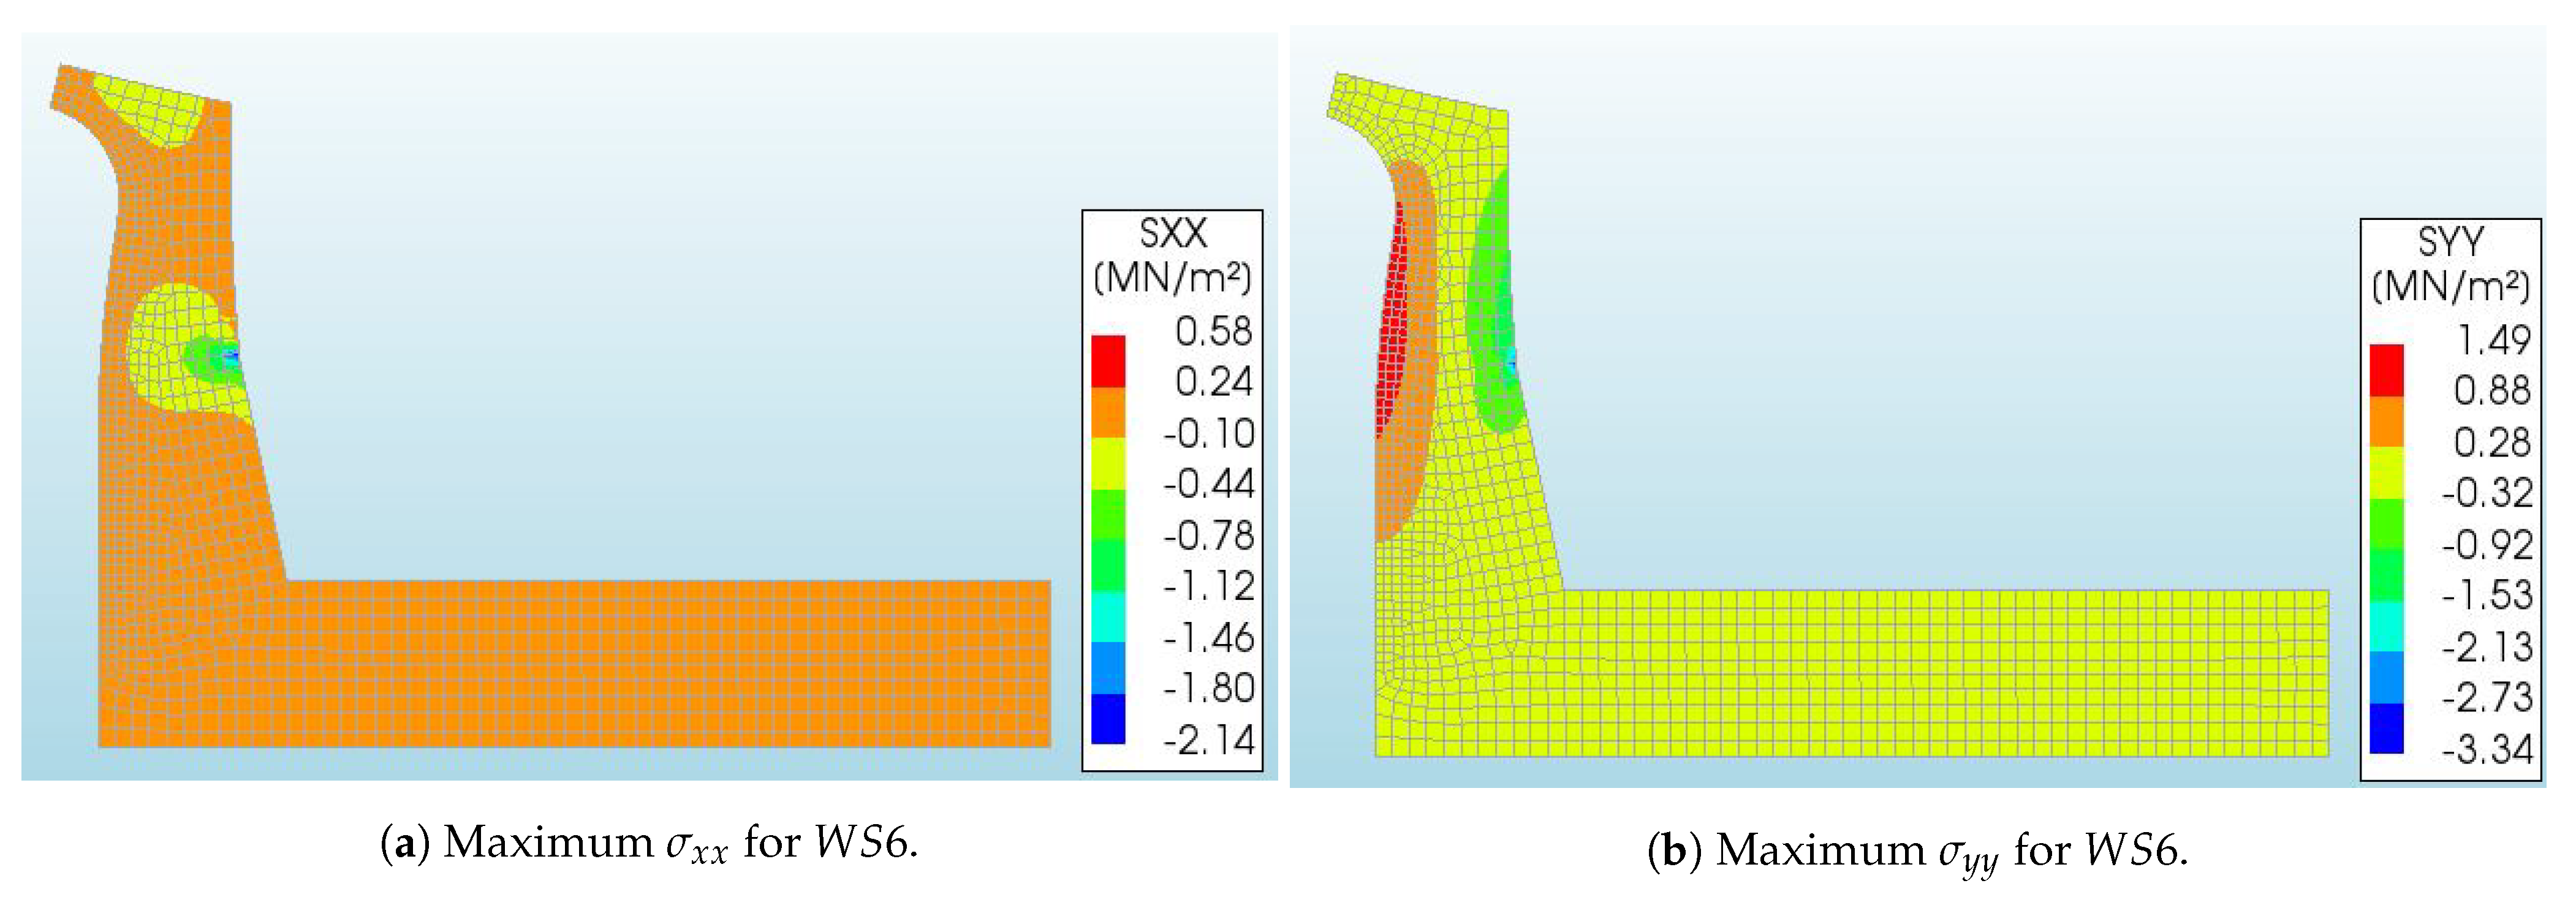
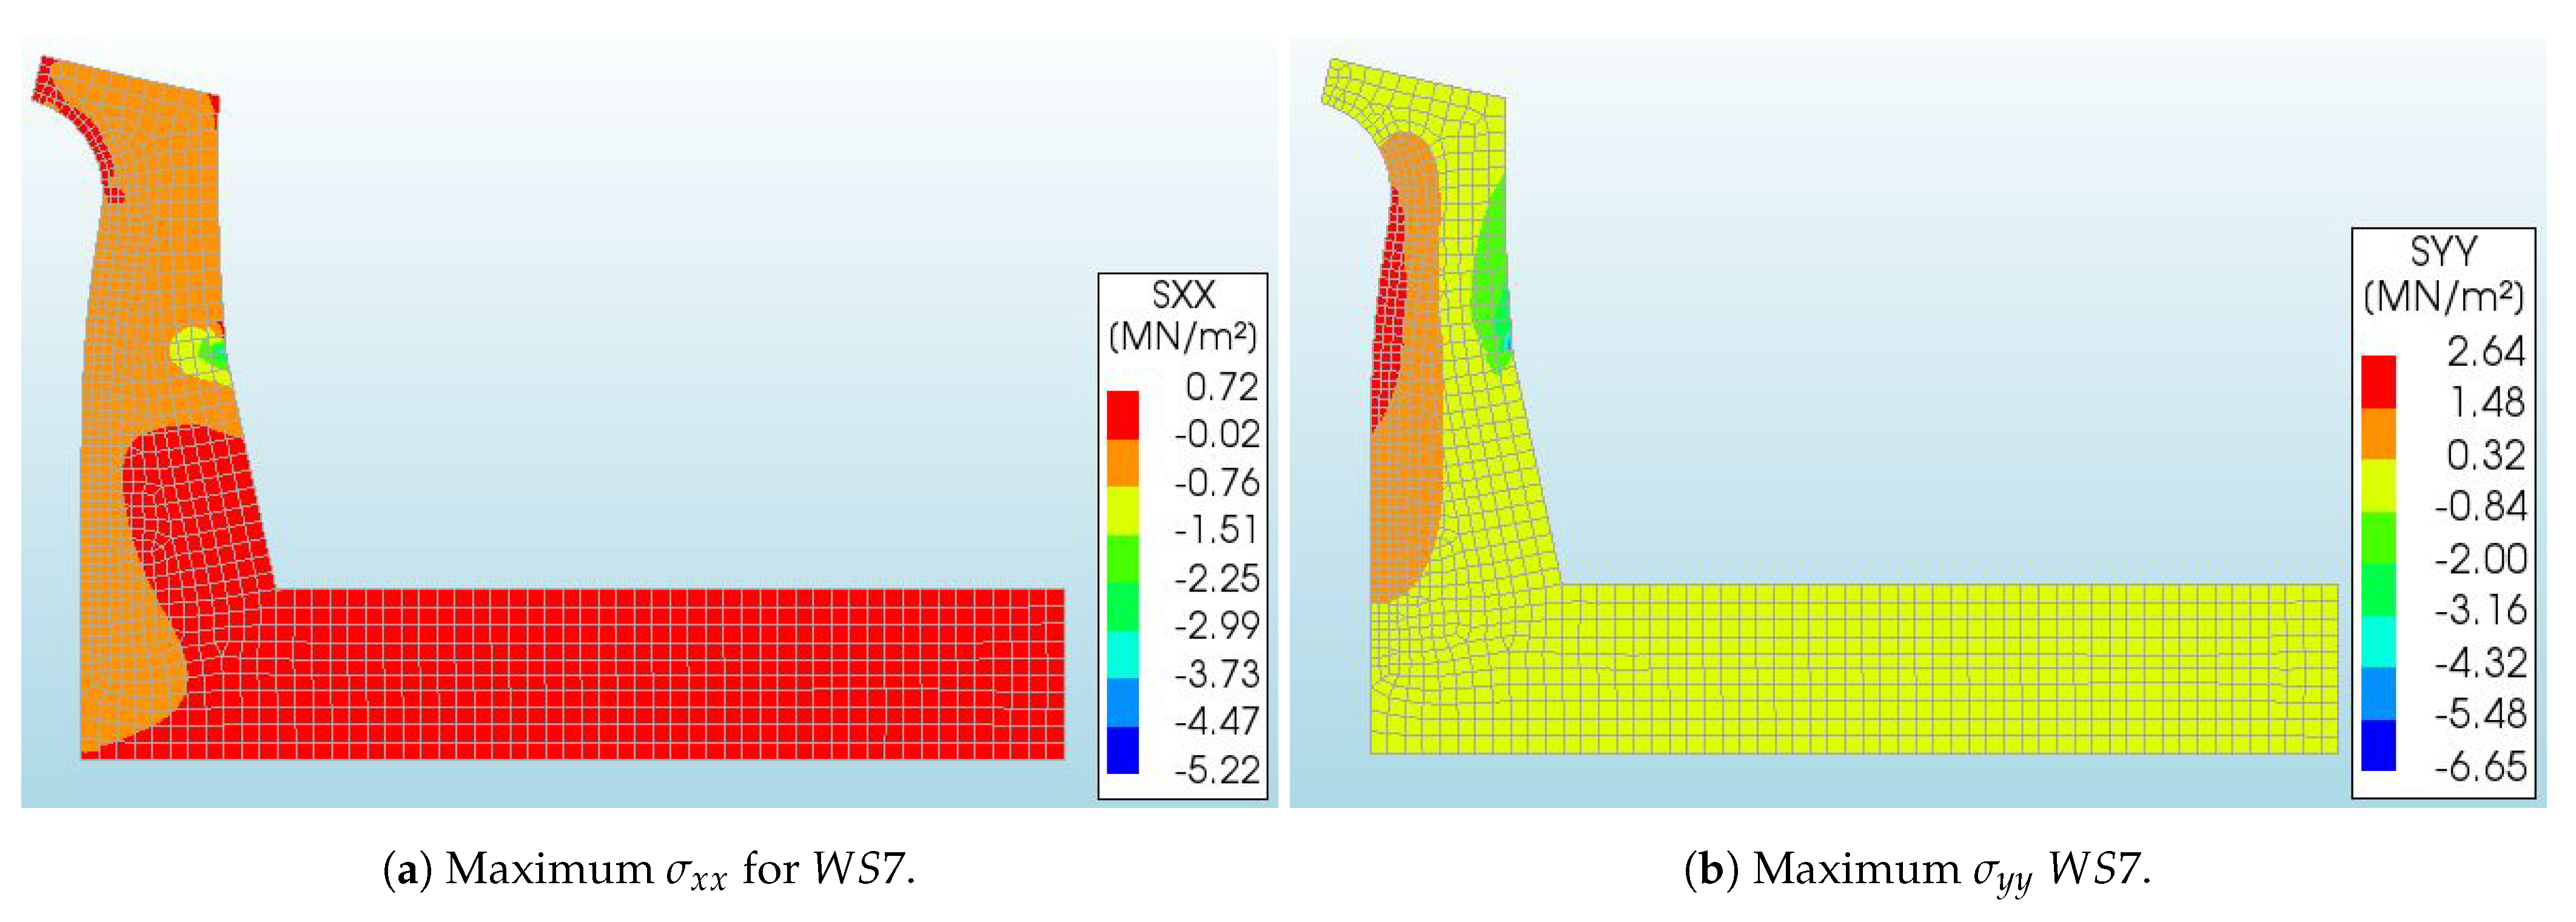
As anticipated, there is a minor difference on the load as all stresses change by less than for different concrete classes. The stress distribution at the moment of maximum stress for both wave states and concrete class C35/40 is shown in Figure 9 and Figure 10. From the comparison between the results for WS6 and WS7, it is evident that the stress distributions follow a similar trend. However, as expected, the maximum tensile and compression stresses caused by WS7 are generally larger. Regarding the x-direction, the maximum tensile stress of WS7 (Figure 10a, red color), is larger than the corresponding stress generated by WS6 (Figure 9a, red color), whereas the maximum compression stress value of WS7 (Figure 10a, blue color) is around larger than WS6 (Figure 9a, blue color). The distribution and magnitudes of the stresses in the y-direction changes slightly, as for WS7, the maximum tensile stress (Figure 10b, red color) is larger than WS6 (Figure 9b, red color), while the compression stress of WS7 (Figure 10b, blue color) is around larger than that generated by WS6 (Figure 9b, blue color). It should be mentioned that WS7’s energy per unit width is around larger than WS6’s one, that in turn leads to arguing that the dynamic behaviour of the parapet plays a major role in the loading process of the structure. According to Eurocode 2 [25], the mean tensile strength () of , and is MPa, MPa and MPa respectively, while the maximum calculated tensile stress is equal to MPa, therefore, from this preliminary analysis only the lower concrete class is at high risk of cracking. The characteristic compression strength () for the three concrete classes is respectively 35 MPa, 30 MPa and 25 MPa, approximately 4 to 5 times larger than the maximum calculated compression stress, that is, MPa, thus no failure is expected. The aforementioned leads to the conclusion that cracking is expected in the y-direction highest tensile stress areas (Figure 9b and Figure 10b, red color) only for the stresses caused by WS7. Moreover, due to the natural intrinsic uncertainties in the model we do not only investigate the development of cracks for the concrete class C25/30 whose is lower than the calculated maximum tensile stress, but also for higher concrete classes, whose is just slightly larger than the maximum calculated tensile stress. Accordingly, only WS7 pressure time series will be used within the non-linear analysis, and all the concrete classes will be tested.
3.4. Non-Linear Analysis
Non-Linear analysis is performed in order to provide an overview on what might have caused the Civitavecchia crownwall failure, as well as to investigate and highlight the phenomena leading to the formation of cracks in this type of structures. In order to get a realistic response of the damaged structure, a total strain crack model is adapted based on a fixed criterion which describes the tensile and compressive behaviour of the material with one stress-strain relationship. The constitutive model is based on the modified compression field theory [36] which was specifically developed from tests on cracked reinforced concrete panels and is focused on describing the stress–strain response for cracked reinforced concrete under plane stress conditions [36], later extended to three-dimensional stress conditions by Selby and Vecchio [37]. The underlying stress–strain relationships are based on an orthotropic non-linear elastic model that acknowledges the asymmetric response of concrete under multiaxial stress conditions. The extended three-dimensional formulation can account for complex behaviour such as concrete strength enhancement due to confinement, concrete strength degradation due to transverse cracking, tension stiffening, and crack slip [37]. Moreover, in addition to the maximum tensile and compressive principal strains, also the status of the crack orientation remains as a status parameter so that the main stress-strain conditions are evaluated within an orthogonal coordinate system. This model, therefore, is particularly suited for short-term loading conditions.
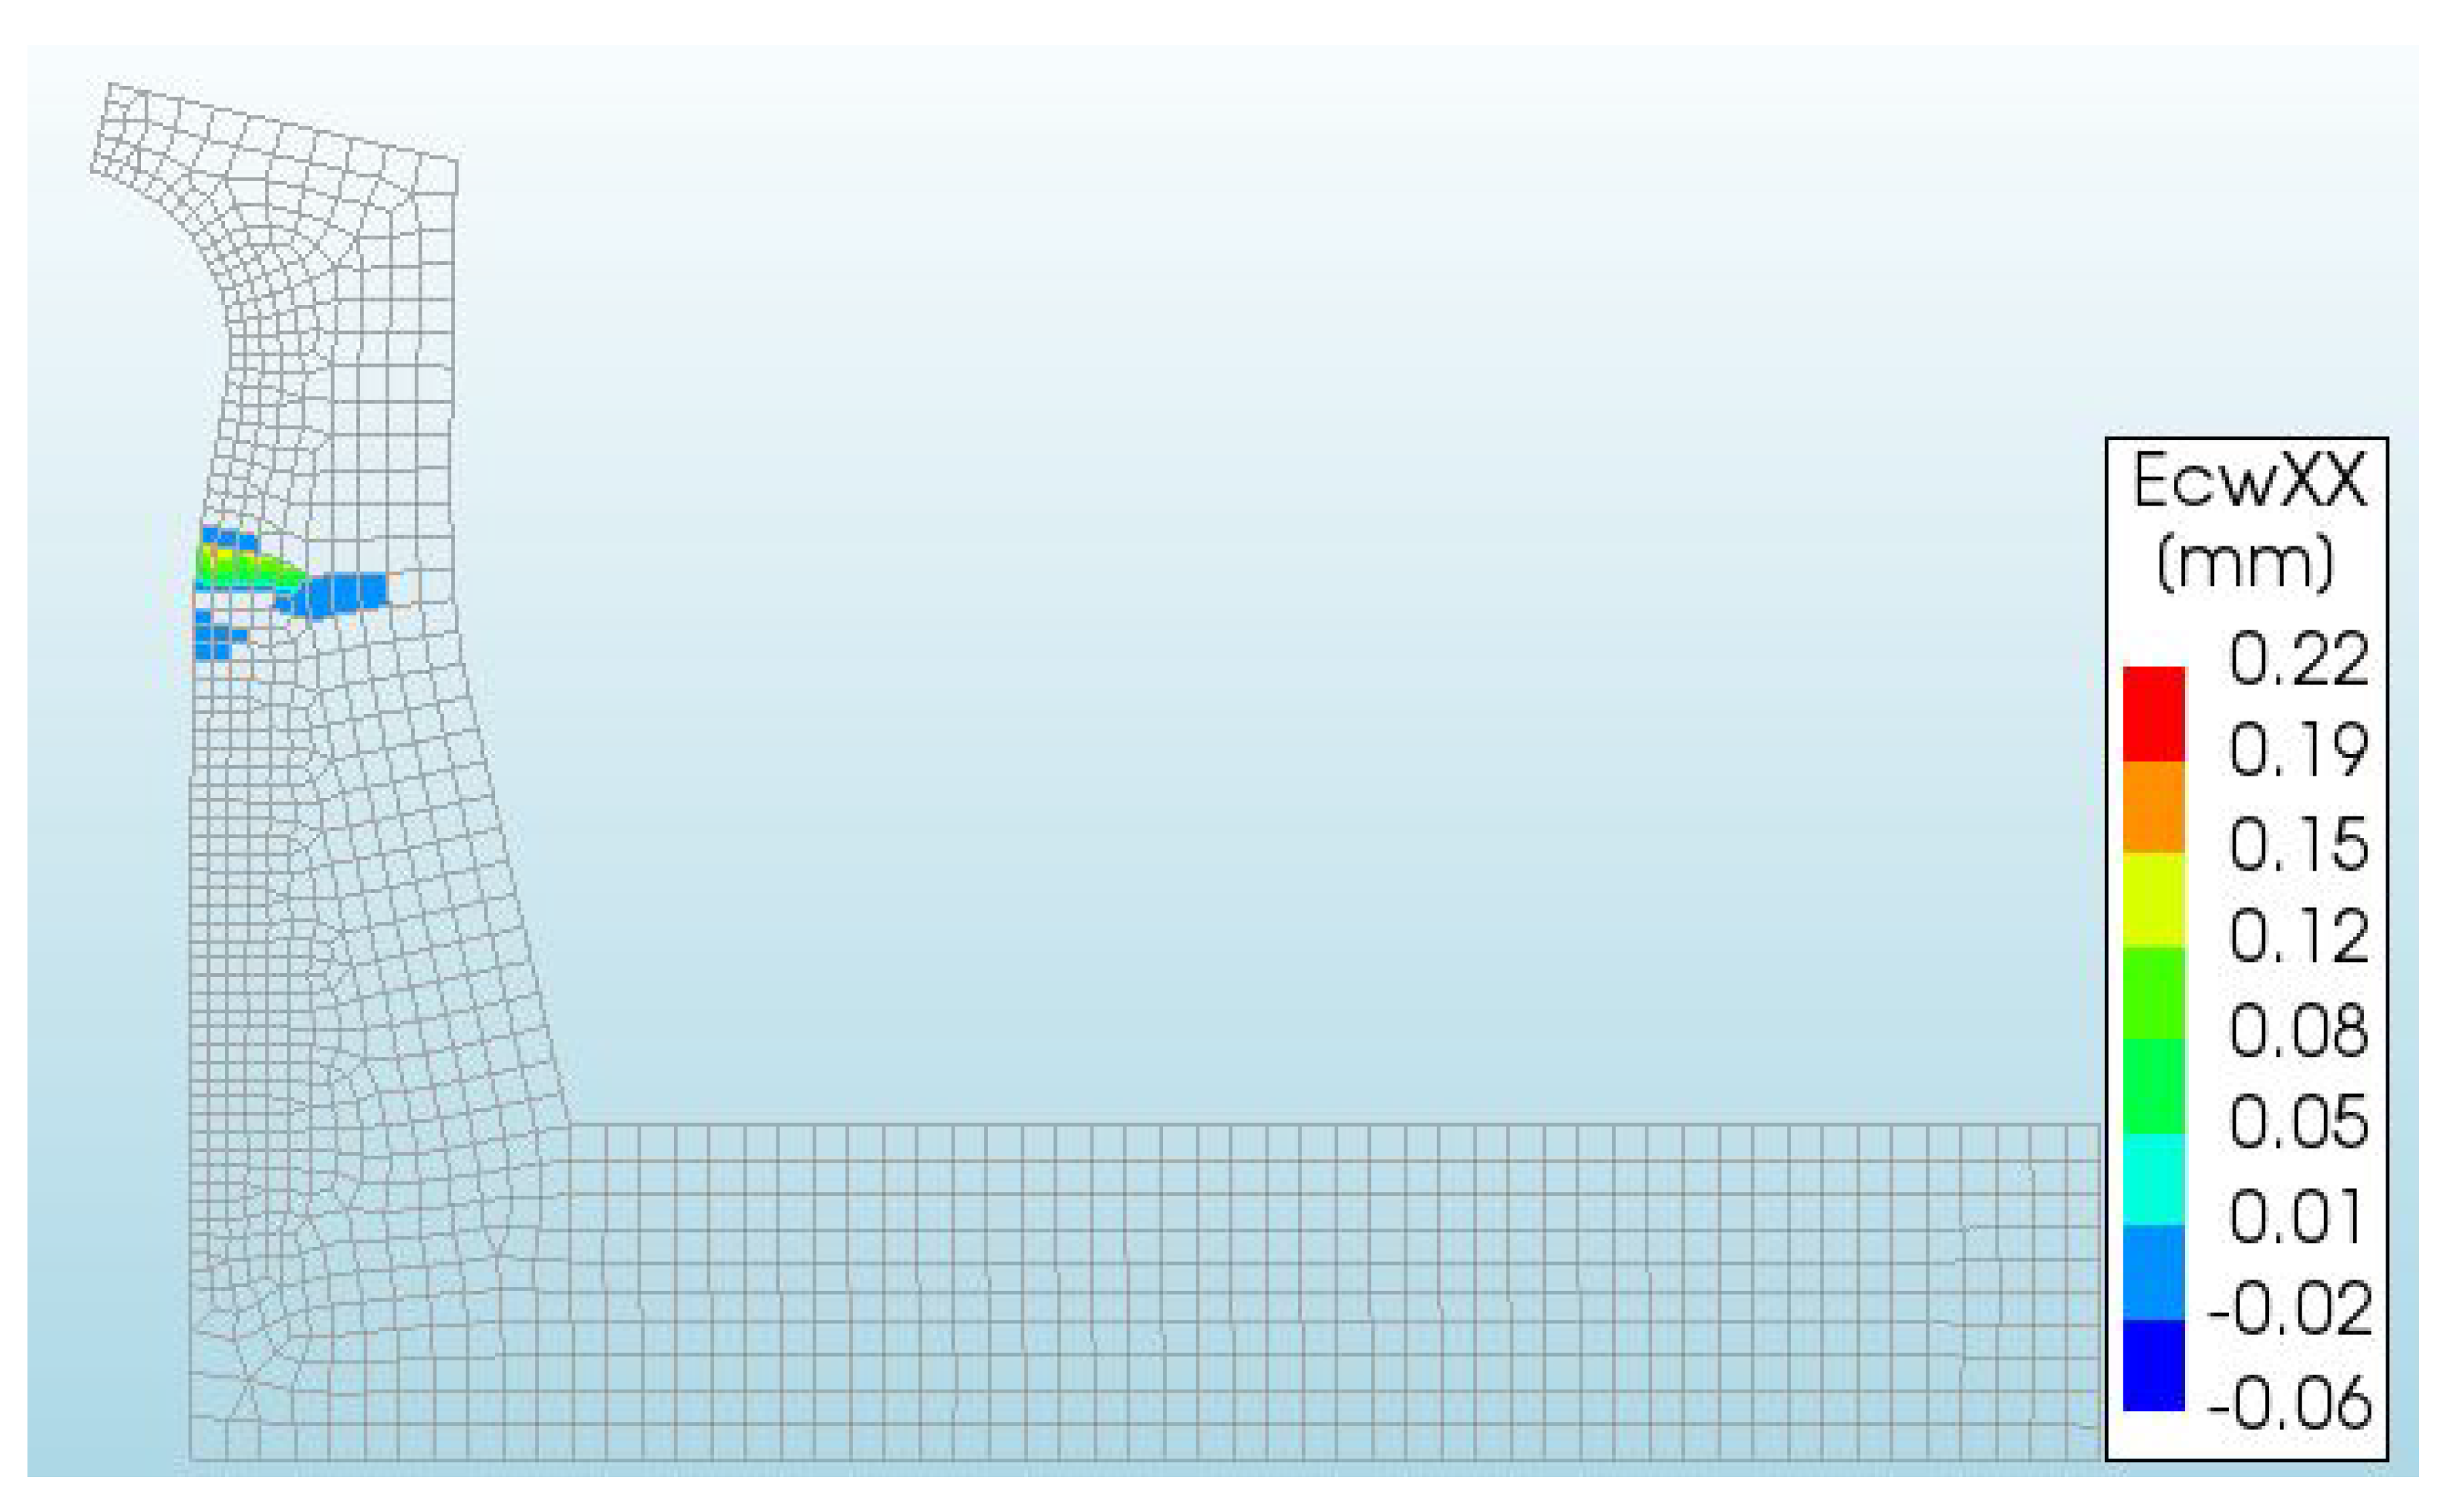
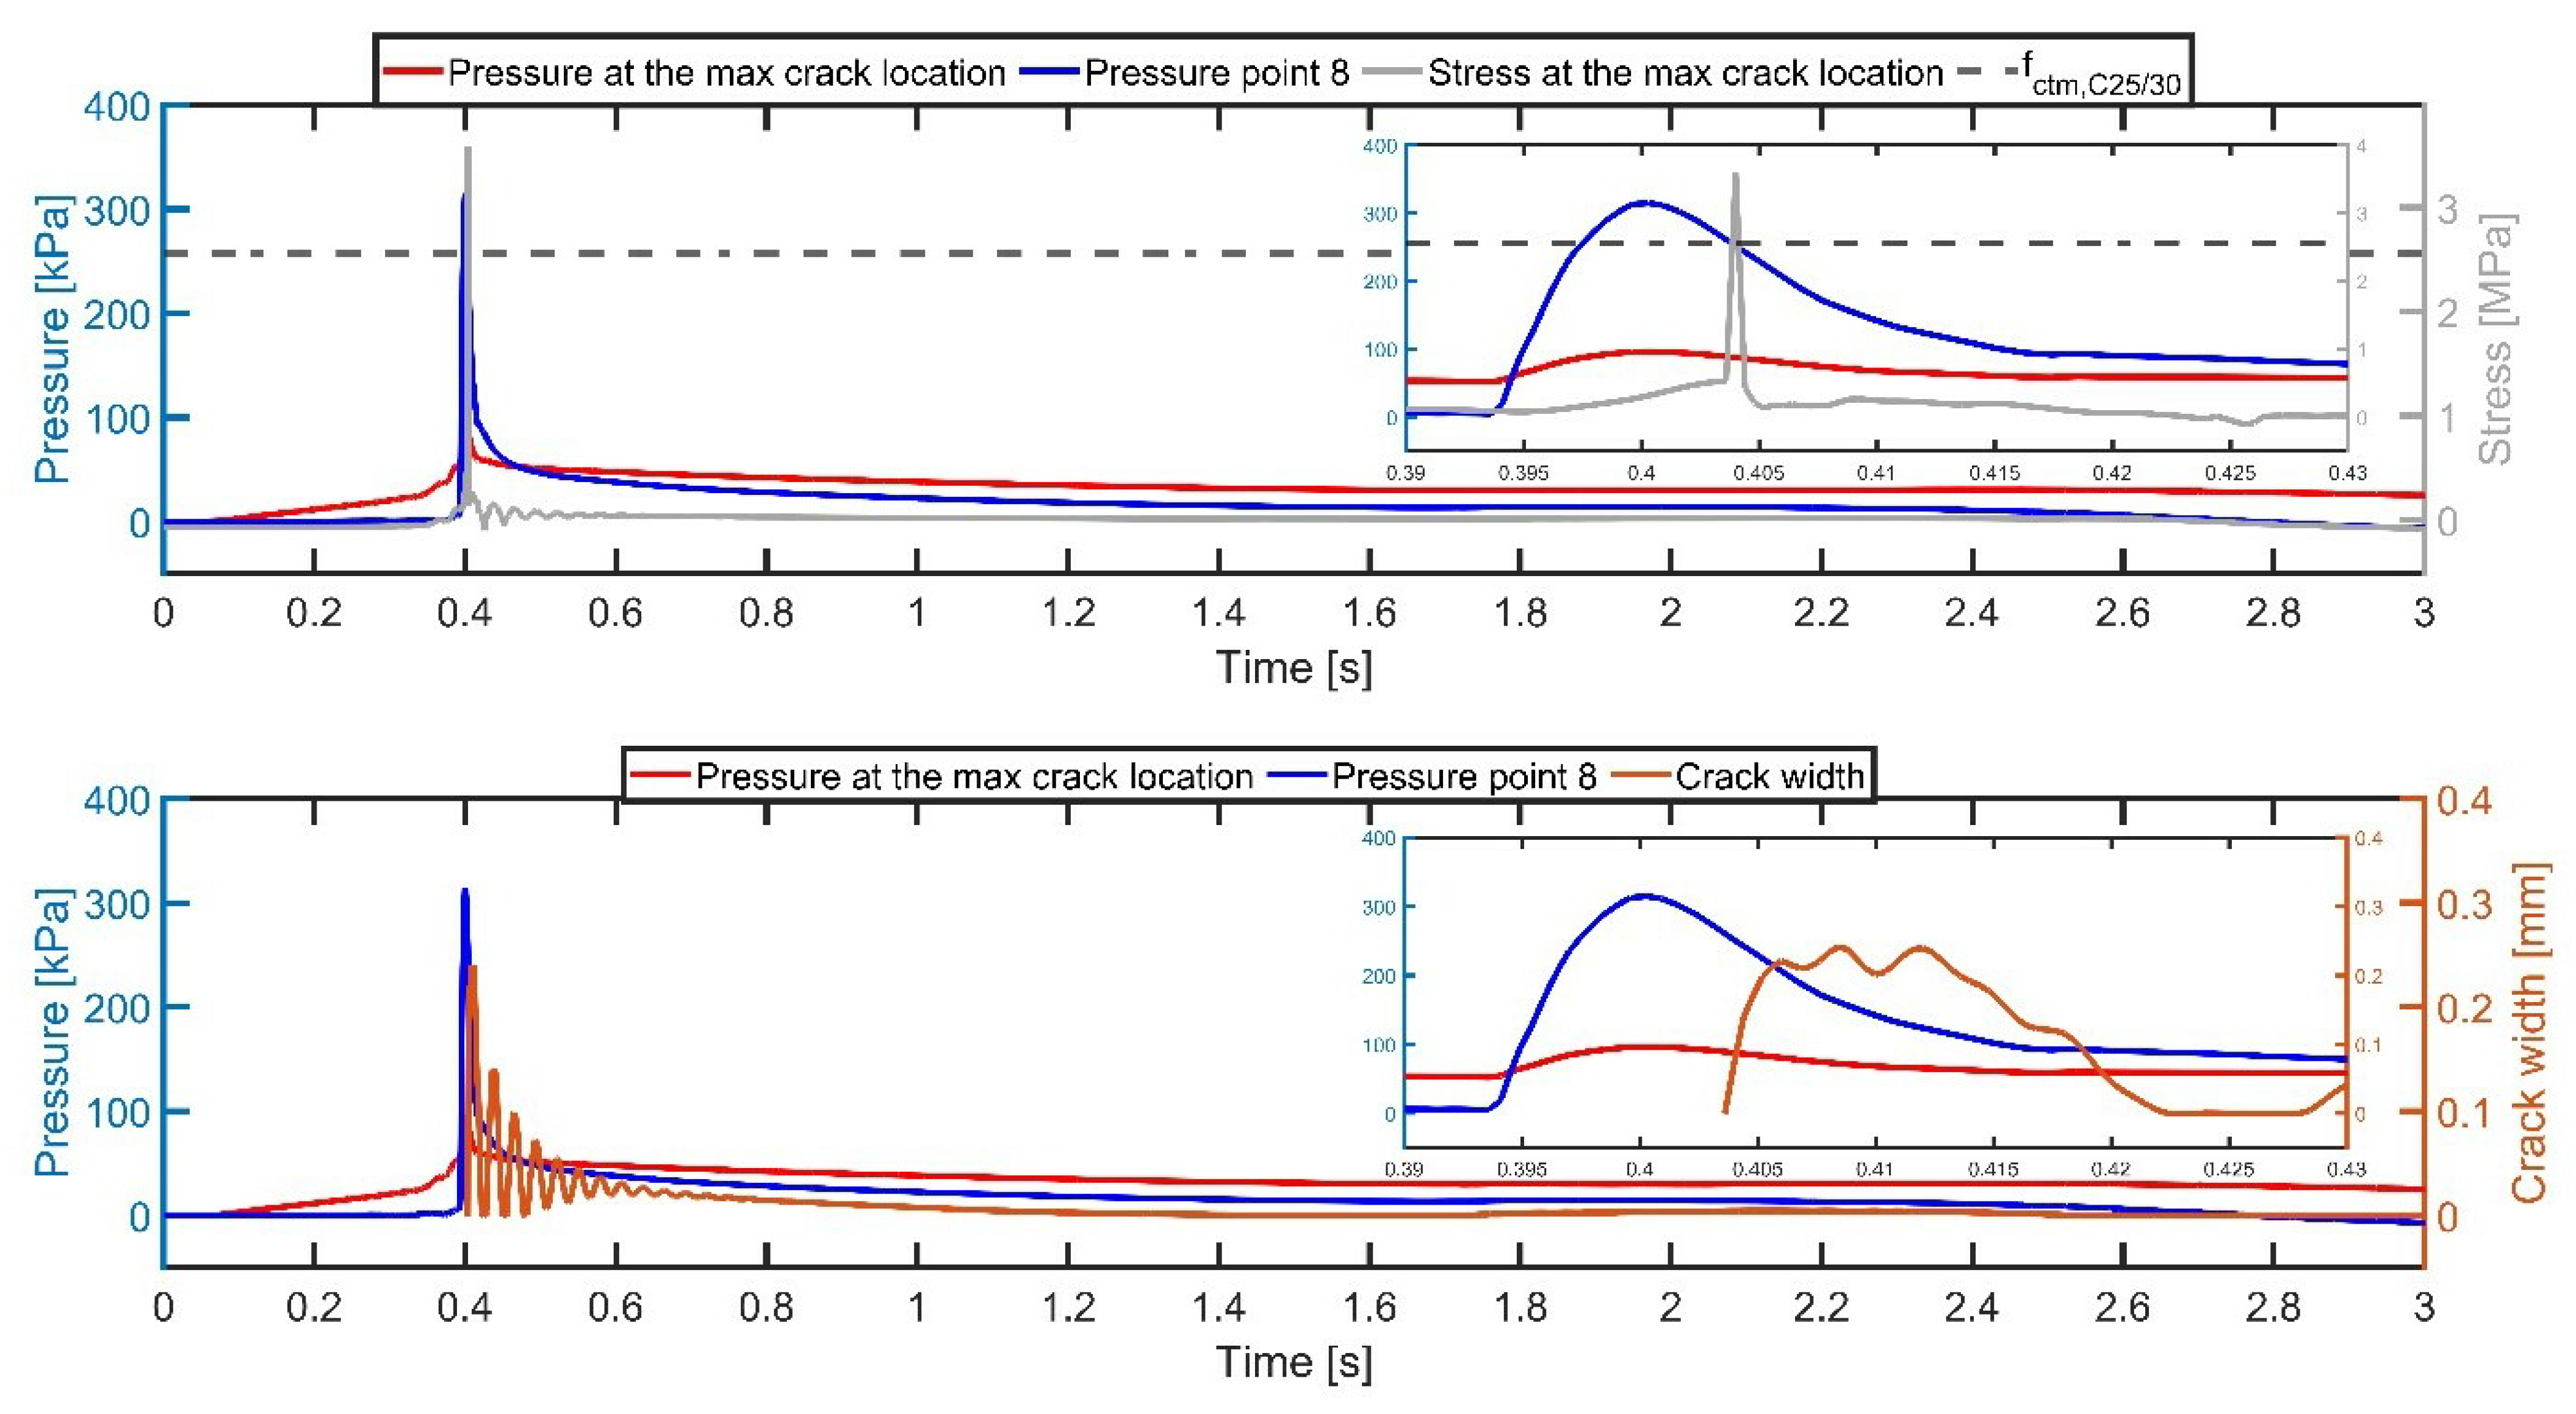
The analyses are performed accounting for all the above mentioned concrete classes, however, as expected only C25/30 leads to the development of cracks and therefore to the failure of the structure. The results regarding the location of the developed cracks are shown in Figure 11, while in Figure 12 top panel, the pressure (red line) and stress (grey line) time series at the point of the calculated maximum crack are overlaid with the pressure time series imposed on control point 8 (blue line) and the tensile strength of C25/30 (, dark grey dotted line). In Figure 12 bottom panel, the same pressure time series are overlaid with the time evolution of the crack width (orange line), so that a full overview of the processes leading to the structure failure can be captured.
As shown in Figure 11, cracking is localized around the maximum stress area depicted in Figure 10b and starts developing when the stress exceeds the tensile strength . The wave induced run-up reaches the point of the maximum identified crack around s, just after the beginning of the simulation (Figure 12, red line), then the water keeps rising until it reaches the recurved part of the parapet. During this phase the exerted hydraulic load is quasi-static, so the pressure signal and induced stress are rather smooth. As soon as control point 8, that is, the edge of the parapet, is reached by the water surface (around s) C-CI phenomenon becomes dominant and the impulsive pressure loading develops along the water column encompassed between the vertical wall surface and the parapet edge. The shock pressure simultaneously acts all along the structure and it decreases in terms of intensity going down towards the free water surface. Interestingly, the cracking threshold (i.e., the for the investigated concrete class C25/30) is suddenly exceeded just a few instants after the maximum pressure; after these localized stress conditions, both pressure and stress within the structure drop. The pressure becomes smoother as expected for a quasi-static load, while the stress weakly oscillates around zero until it damps to zero. The crack development follows similar trend. After the sudden failure also the crack amplitude exponentially decreases toward zero with a characteristic frequency around 27 Hz, that is, roughly half of the first natural frequency. It is evident that the dynamic behavior of the structure plays a dominant role within the overall loading phase as well as the concrete quality dominates within the survivability aspect of the structure.
4. Discussion
This manuscript presents the recurved concrete crownwall response to non-breaking impulsive wave loading. The combined use of CFD time-varying pressure map and linear and non-linear finite element analysis is adopted as an overall tool to get a better insight in the loading and response process, with the final aim to investigate the recent failure of the Civitavecchia port crownwall.
Modal analysis is performed to identify the modal parameters of the structure and the influence of the concrete class on the overall structural dynamic response. The concrete class does not have a dominant effect on the modal shape and effective mass participation factor EMPF, while as expected, the natural frequencies slightly change according to the different modulus of elasticity associated with the concrete class. Virtual impact hammer test is performed to describe the dominant modes along the structure development. The 1st natural mode is identified as the dominant one for the vertical part of the structure and likely to be the main mode triggering the failure of the Civitavecchia crownwall. The 2nd and 3rd modes show small to none influence on the overall dynamic behavior of the structure, whereas 4th and 5th modes dominate the horizontal concrete slab. However, due to their modal shape and location of the concrete slab they do not play a dominant role in the response of the structure under the wave loading. Indeed, the 4th modal shape only affects the rear side of the concrete slab, while the 5th one influences the whole lower and chunky part of the parapet so that the wave pressure is not such as to induce relevant deformation of the element.
The linear analysis highlights the effect of the additional concrete wall located on the rear side of the of crownwall, indeed the highest tensile stress is localized just on the opposite side at the same height. Moreover, the linear analysis clearly points out that only the largest regular wave state ( m and s) can lead to the failure of the structure due to the developed tensile stress. The concrete quality plays a huge role for the structural failure. Among the investigated concrete classes (i.e., C25/30, C30/37 and C35/45) only the lowest one is characterized by a mean tensile strength () lower than the calculated maximum stress. Based on this result an advanced non-linear analysis is carried out to investigate the development of cracking within the structure. The non-linear analysis confirms again the dominant role of the concrete class for the survivability of the overall structure. Despite no reinforcing steel bars are considered within the finite element model, the two higher concrete classes do not show any cracking formation, whereas the structure characterized by the C25/30 class fails due to the developed high tensile stress developed under the action of the induced non-breaking impulsive wave loading.
From a preliminary estimation of the sea condition that generated the failure of Civitavecchia crownwall it can be argued that WS5 ( m and s) was the maximum wave that triggered the failure. However, even for the lowest tested concrete class (C25/30) we could not identify any failure for this wave state, leading to the conclusion that the crownwall might have been built with even lower concrete class, despite the EUROCODE prescription imposes C35/45 as the minimum concrete class for marine structures, that is, XS3 exposure class. Overall, the adopted coupled CFD and FEA analysis provides an effective framework to assess and design this type of rigid structures exposed to impulsive wave loading. The main findings highlight the importance of the concrete class and open new design questions whether the reinforcing steel bars are really needed or can be avoided if the shape of the structure and the quality of the adopted materials are properly designed.
Author Contributions
D.D. conducted the study and wrote the draft manuscript, M.C. and P.D.G. provided the CFD pressure field time series and edited the manuscript, M.P. and G.-J.S. supervised the finite element modelling and reviewed the manuscript, A.A. supervised the study, wrote-reviewed and edited the manuscript. All authors have read and agreed to the published version of the manuscript.
Funding
This research received no external funding.
Institutional Review Board Statement
Not applicable.
Informed Consent Statement
Not applicable.
Data Availability Statement
Data is contained within the article.
Acknowledgments
This work was supported by the software company DIANA FEA BV.
Conflicts of Interest
The authors declare no conflict of interest.
Appendix A. Frequency Analysis Results

Table A1.
Spectrum density at different locations of the Crownwall. Highest densities are highlighted red, second highest densities are highlited yellow.
Table A1.
Spectrum density at different locations of the Crownwall. Highest densities are highlighted red, second highest densities are highlited yellow.
| Point | Mode 1 [m/Hz] | Mode 2 [m/Hz] | Mode 3 [m/Hz] | Mode 4 [m/Hz] | Mode 5 [m/Hz] |
|---|---|---|---|---|---|
| 1 | 3.27E-14 | 1.05E-14 | 7.87E-18 | 5.14E-14 | 2.40E-13 |
| 2 | 2.33E-12 | 3.36E-13 | 4.74E-16 | 2.47E-12 | 6.62E-12 |
| 3 | 1.80E-11 | 1.25E-12 | 4.91E-16 | 3.64E-12 | 4.14E-12 |
| 4 | 3.35E-11 | 3.46E-14 | 8.42E-17 | 2.16E-12 | 4.24E-12 |
| 5 | 1.25E-10 | 3.36E-11 | 5.69E-16 | 6.97E-14 | 2.39E-12 |
| 6 | 1.17E-08 | 4.28E-10 | 6.40E-15 | 1.20E-12 | 4.67E-12 |
| 7 | 2.58E-07 | 7.01E-11 | 1.95E-15 | 4.59E-12 | 1.95E-12 |
| 8 | 3.60E-07 | 3.01E-11 | 1.24E-15 | 2.38E-12 | 1.83E-11 |
| 9 | 5.66E-07 | 1.33E-09 | 1.28E-14 | 1.45E-11 | 1.31E-10 |
| 11 | 5.46E-07 | 6.09E-10 | 1.14E-14 | 6.46E-14 | 9.51E-12 |
| 12 | 2.30E-07 | 1.23E-10 | 2.53E-15 | 1.55E-12 | 1.38E-12 |
| 13 | 2.67E-07 | 3.39E-11 | 1.35E-15 | 7.13E-13 | 4.75E-12 |
| 14 | 1.19E-08 | 4.37E-10 | 6.56E-15 | 2.47E-12 | 1.90E-12 |
| 15 | 9.85E-09 | 3.11E-10 | 4.71E-15 | 2.98E-12 | 4.89E-13 |
| 16 | 1.99E-11 | 1.11E-11 | 1.91E-16 | 6.39E-14 | 7.42E-13 |
| 17 | 2.65E-12 | 4.03E-14 | 6.47E-19 | 1.78E-15 | 1.61E-14 |
| 18 | 5.20E-11 | 1.06E-12 | 5.06E-17 | 9.35E-13 | 1.28E-12 |
| 19 | 2.95E-13 | 1.12E-13 | 1.97E-18 | 1.86E-14 | 3.48E-14 |
| 20 | 2.68E-11 | 3.09E-12 | 5.79E-16 | 2.98E-12 | 2.48E-12 |
| 21 | 1.37E-12 | 2.67E-13 | 1.17E-16 | 8.27E-14 | 6.96E-14 |
| 22 | 1.18E-11 | 2.19E-12 | 7.95E-16 | 1.56E-12 | 1.83E-12 |
| 23 | 7.51E-12 | 1.67E-12 | 1.50E-15 | 4.95E-13 | 6.05E-13 |
| 24 | 1.48E-13 | 3.54E-14 | 1.31E-17 | 1.60E-14 | 2.42E-13 |
| 25 | 1.56E-13 | 3.84E-14 | 2.61E-17 | 7.50E-15 | 5.87E-14 |
| 26 | 7.45E-13 | 2.89E-13 | 1.18E-14 | 4.64E-12 | 6.00E-13 |
| 27 | 5.23E-13 | 1.97E-13 | 5.80E-15 | 1.76E-12 | 2.00E-13 |
| 28 | 1.01E-14 | 3.58E-15 | 7.71E-17 | 1.58E-14 | 2.84E-14 |
| 29 | 9.88E-14 | 7.29E-14 | 3.34E-14 | 5.14E-12 | 9.82E-13 |
| 30 | 4.93E-14 | 3.62E-14 | 1.68E-14 | 2.26E-12 | 3.70E-13 |
| 31 | 7.22E-16 | 5.05E-16 | 2.24E-16 | 2.43E-14 | 1.30E-14 |
| 32 | 1.39E-14 | 2.40E-14 | 8.20E-14 | 1.46E-13 | 1.24E-12 |
| 33 | 6.79E-15 | 1.11E-14 | 3.45E-14 | 2.68E-14 | 4.95E-13 |
| 34 | 9.59E-17 | 1.45E-16 | 3.89E-16 | 1.25E-15 | 1.07E-14 |
| 35 | 8.47E-15 | 2.52E-14 | 1.80E-13 | 7.57E-12 | 1.70E-12 |
| 36 | 3.06E-15 | 8.53E-15 | 5.58E-14 | 1.54E-12 | 1.75E-12 |
| 37 | 3.47E-17 | 9.55E-17 | 6.06E-16 | 1.73E-14 | 2.19E-14 |
References
- De Girolamo, P.; Castellino, M.; Romano, A. Improvement in workability of terminals placed alng the inner side of port vertical breakwaters by means of recurved parapet walls. WIT Trans. Built Environ. 2019, 187, 23–30. [Google Scholar]
- De Girolamo, P.; Di Risio, M.; Beltrami, G.M.; Bellotti, G.; Pasquali, D. The use of wave forecasts for maritime activities safety assessment. Appl. Ocean. Res. 2017, 62, 18–26. [Google Scholar] [CrossRef]
- Muraki, Y. Field Observations of Wave Pressure, Wave Run-Up, and Oscillation of Breakwater. In Coastal Engineering 1966; American Society of Civil Engineers: Reston, VA, USA, 1966; pp. 302–321. [Google Scholar] [CrossRef]
- Goda, Y. Dynamic response of upright breakwaters to impulsive breaking wave forces. Coast. Eng. 1994, 22, 135–158. [Google Scholar] [CrossRef]
- Oumeraci, H.; Kortenhaus, A. Analysis of the dynamic response of caisson breakwaters. Coast. Eng. 1994, 22, 159–183. [Google Scholar] [CrossRef]
- Martinelli, L.; Lamberti, A. Dynamic response of caisson breakwaters: Suggestions for the equivalent static analysis of a single caisson in the array. Coast. Eng. J. 2011, 53, 1–20. [Google Scholar] [CrossRef]
- Antonini, A.; Raby, A.; Brownjohn, J.M.W.; Pappas, A.; D’Ayala, D. Survivability assessment of fastnet lighthouse. Coast. Eng. 2019, 150, 18–38. [Google Scholar] [CrossRef]
- Brownjohn, J.M.W.; Raby, A.; Au, S.K.; Zhu, Z.; Wang, X.; Antonini, A.; Pappas, A.; D’Ayala, D. Bayesian operational modal analysis of offshore rock lighthouses: Close modes, alignment, symmetry and uncertainty. Mech. Syst. Signal Process. 2019, 133, 106306. [Google Scholar] [CrossRef]
- Raby, A.; Antonini, A.; Pappas, A.; Dassanayake, D.; Brownjohn, J.M.W.; D’Ayala, D. Wolf Rock lighthouse: Past developments and future survivability under wave loading. Philos. Trans. R. Soc. A 2019, 377, 20190027. [Google Scholar] [CrossRef]
- Pappas, A.; D’Ayala, D.; Dassanayake, D.T.; Antonini, A.; Raby, A. Rocking of offshore lighthouses under extreme wave impacts: Limit analysis, analytic formulations and distinct element method. Eng. Struct. 2021, 228, 111534. [Google Scholar] [CrossRef]
- Martinelli, L.; Ruol, P.; Volpato, M.; Favaretto, C.; Castellino, M.; De Girolamo, P.; Franco, L.; Romano, A.; Sammarco, P. Experimental investigation on non-breaking wave forces and overtopping at the recurved parapets of vertical breakwaters. Coast. Eng. 2018, 141, 52–67. [Google Scholar] [CrossRef]
- Roux, G.B. Reduction of Seawall Overtopping at the Strand. Master’s Thesis, Stellenbosch University, Stellenbosch, South Africa, 2013. [Google Scholar]
- Schoonees, T. Impermeable Recurve Seawalls to Reduce Wave Overtopping. Master’s Thesis, Stellenbosch University, Stellenbosch, South Africa, 2014. [Google Scholar]
- Kisacik, D.; Troch, P.; Van Bogaert, P. Description of loading conditions due to violent wave impacts on a vertical structure with an overhanging horizontal cantilever slab. Coast. Eng. 2012, 60, 201–226. [Google Scholar] [CrossRef]
- Kisacik, D.; Troch, P.; Van Bogaert, P.; Caspeele, R. Investigation of uplift impact forces on a vertical wall with an overhanging horizontal cantilever slab. Coast. Eng. 2014, 90, 12–22. [Google Scholar] [CrossRef]
- Ravindar, R.; Sriram, V.; Schimmels, S.; Stagonas, D. Characterization of breaking wave impact on vertical wall with recurve. ISH J. Hydraul. Eng. 2019, 25, 153–161. [Google Scholar] [CrossRef]
- Castellino, M.; Romano, A.; Lara, J.L.; Losada, I.J.; De Girolamo, P. Confined-crest impact: Forces dimensional analysis and extension of the Goda’s formulae to recurved parapets. Coast. Eng. 2020, 163, 103814. [Google Scholar] [CrossRef]
- Castellino, M.; Sammarco, P.; Romano, A.; Martinelli, L.; Ruol, P.; Franco, L.; De Girolamo, P. Large impulsive forces on recurved parapets under non-breaking waves. A numerical study. Coast. Eng. 2018, 136, 1–15. [Google Scholar] [CrossRef]
- Maleska, T.; Beben, D. Numerical analysis of a soil-steel bridge during backfilling using various shell models. Eng. Struct. 2019, 196, 109358. [Google Scholar] [CrossRef]
- Bianchini, N.; Mendes, N.; Lourenço, P. Seismic evaluation of Bagan heritage site (Myanmar): The Loka-Hteik-Pan temple. In Structures; Elsevier: Amsterdam, The Netherlands, 2020; Volume 24, pp. 905–921. [Google Scholar]
- Naeimi, N.; Moustafa, M.A. Numerical modeling and design sensitivity of structural and seismic behavior of UHPC bridge piers. Eng. Struct. 2020, 219, 110792. [Google Scholar] [CrossRef]
- van Zijl, G.P.; de Jager, D.J. Improved ductility of SHCC retrofitted unreinforced load bearing masonry via a strip-debonded approach. J. Build. Eng. 2019, 24, 100722. [Google Scholar] [CrossRef]
- Pachla, F.; Kowalska-Koczwara, A.; Tatara, T.; Stypuła, K. The influence of vibration duration on the structure of irregular RC buildings. Bull. Earthq. Eng. 2019, 17, 3119–3138. [Google Scholar] [CrossRef] [Green Version]
- de Putter, A. Towards a Uniform and Optimal Approach for safe NLFEA of Reinforced Concrete Beams: Quantification of the Accuracy of Multiple Solution Strategies Using a Large Number of Samples. Master’s Thesis, Delft University of Technology, Delft, The Netherlands, 2020. [Google Scholar]
- EN 1992-1-1. Eurocode 2: Design of Concrete Structures—Part 1-1: General Rules and Rules for Buildings; European Committee for Standardization: Brussels, Belgium, 2004. [Google Scholar]
- Higuera, P.; Lara, J.L.; Losada, I.J. Simulating coastal engineering processes with OpenFOAM®. Coast. Eng. 2013, 71, 119–134. [Google Scholar] [CrossRef]
- Higuera, P.; Lara, J.L.; Losada, I.J. Realistic wave generation and active wave absorption for Navier–Stokes models: Application to OpenFOAM®. Coast. Eng. 2013, 71, 102–118. [Google Scholar] [CrossRef]
- Higuera, P.; Lara, J.L.; Losada, I.J. Three-dimensional interaction of waves and porous coastal structures using OpenFOAM®. Part I: Formulation and validation. Coast. Eng. 2014, 83, 243–258. [Google Scholar] [CrossRef]
- Higuera, P.; Lara, J.L.; Losada, I.J. Three-dimensional interaction of waves and porous coastal structures using OpenFOAM®. Part II: Application. Coast. Eng. 2014, 83, 259–270. [Google Scholar] [CrossRef]
- Le Méhauté, B. An Introduction to Hydrodynamics and Water Waves; Springer Science & Business Media: Berlin/Heidelberg, Germany, 2013. [Google Scholar]
- Antonini, A.; Archetti, R.; Lamberti, A. Wave Simulation for the Design of an Innovative Quay Wall: The Case of Vlorë Harbour; University of Plymouth: Plymouth, MA, USA, 2017. [Google Scholar]
- Chen, X.; Hofland, B.; Molenaar, W.; Capel, A.; Van Gent, M.R. Use of impulses to determine the reaction force of a hydraulic structure with an overhang due to wave impact. Coast. Eng. 2019, 147, 75–88. [Google Scholar] [CrossRef]
- de Almeida, E.; Hofland, B. Validation of pressure-impulse theory for standing wave impact loading on vertical hydraulic structures with short overhangs. Coast. Eng. 2020, 159, 103702. [Google Scholar] [CrossRef]
- DIANA FEA BV. DIANA Finite Element Analysis—User’s Manual 10.3; DIANA FEA BV: Delft, The Netherlands, 2019. [Google Scholar]
- EN 1998-1. Eurocode 8: Design of Structures for Earthquake Resistance—Part 1: General Rules, Seismic Actions and Rules for Buildings; European Committee for Standardization: Brussels, Belgium, 2004. [Google Scholar]
- Vecchio, F.J.; Collins, M.P. The modified compression-field theory for reinforced concrete elements subjected to shear. ACI J. 1986, 83, 219–231. [Google Scholar]
- Selby, R.G. Three-Dimensional Constitutive Relations for Reinforced Concrete. Ph.D. Thesis, University of Toronto, Toronto, ON, Canada, 1995. [Google Scholar]
Figure 1.
Civitavecchia’s crownwall failure. Yellow dashed line highlights the additional concrete wall that was constructed on a later stage.
Figure 1.
Civitavecchia’s crownwall failure. Yellow dashed line highlights the additional concrete wall that was constructed on a later stage.

Figure 2.
Civitavecchia’s Crownwall. Black elements on the back of the crownwall represent the stiff boundary interface.
Figure 2.
Civitavecchia’s Crownwall. Black elements on the back of the crownwall represent the stiff boundary interface.

Figure 3.
Wave theories validity fields according to Le Méhauté [30]. Red dots represent the wave states.
Figure 3.
Wave theories validity fields according to Le Méhauté [30]. Red dots represent the wave states.

Figure 4.
Impact Duration. Red markers symbolize the start and end of the impact.

Figure 5.
First five crownwall modal shapes.

Figure 6.
Crownwall free vibration forcing and control points.

Figure 7.
Energy spectrum of the displacement time series analysis for control point 8 (blue), control point 30 and the identified structure modal frequencies (vertical green lines).
Figure 7.
Energy spectrum of the displacement time series analysis for control point 8 (blue), control point 30 and the identified structure modal frequencies (vertical green lines).

Figure 8.
Dominant Modes in different areas of the Crownwall.

Figure 9.
Maximum and stresses for WS6 and C35/40, positive values refer to tensile stresses and negative values refer to compression stresses.
Figure 9.
Maximum and stresses for WS6 and C35/40, positive values refer to tensile stresses and negative values refer to compression stresses.

Figure 10.
Maximum and stresses for WS7 and C35/40, positive values refer to tensile stresses and negative values refer to compression stresses.
Figure 10.
Maximum and stresses for WS7 and C35/40, positive values refer to tensile stresses and negative values refer to compression stresses.

Figure 11.
Crack width for fixed cracks model and C25/30, t = 0.4 s.

Figure 12.
Evolution of pressure, stresses and cracks over time due to WS7.

Table 1.
Generated wave pressure time series.
| Wave State | H [m] | T [s] | [-] | [-] | [-] |
|---|---|---|---|---|---|
| WS1 | 1.00 | 8.00 | 6.50 | 0.010 | 0.04 |
| WS2 | 2.00 | 8.00 | 3.25 | 0.020 | 0.08 |
| WS3 | 3.00 | 8.00 | 2.16 | 0.030 | 0.12 |
| WS4 | 4.00 | 8.00 | 1.62 | 0.040 | 0.16 |
| WS5 | 5.00 | 8.00 | 1.30 | 0.050 | 0.20 |
| WS6 | 6.00 | 8.00 | 1.08 | 0.060 | 0.24 |
| WS7 | 7.00 | 11.00 | 0.92 | 0.037 | 0.28 |
Table 2.
Possible loading domains of a structure.
| Loading Domain | |
|---|---|
| Quasi-Static | ≥4 |
| Dynamic | 0.25–4 |
| Impulsive | <0.25 |
Table 3.
Mesh sensitivity analysis.
| Mesh Size [m] | Element Count [-] | Mode 1 [Hz] | Mode 2 [Hz] | Mode 3 [Hz] | Mode 4 [Hz] | Mode 5 [Hz] |
|---|---|---|---|---|---|---|
| 1 | 190 | 58.01 | 196.72 | 219.15 | 306.16 | 395.21 |
| 0.9 | 199 | 57.76 | 196.17 | 218.00 | 306.07 | 394.91 |
| 0.8 | 202 | 57.71 | 195.97 | 217.38 | 305.94 | 394.44 |
| 0.7 | 247 | 57.41 | 195.70 | 216.96 | 305.42 | 392.64 |
| 0.6 | 271 | 57.25 | 195.40 | 216.33 | 305.36 | 392.06 |
| 0.5 | 348 | 57.08 | 195.20 | 215.84 | 305.15 | 391.32 |
| 0.4 | 418 | 56.89 | 195.05 | 215.17 | 305.01 | 390.55 |
| 0.3 | 586 | 56.73 | 194.90 | 214.65 | 304.91 | 389.79 |
| 0.2 | 1096 | 56.59 | 194.79 | 214.14 | 304.78 | 388.81 |
| 0.1 | 3091 | 56.47 | 194.72 | 213.70 | 304.68 | 387.83 |
| 0.05 | 12,460 | 56.44 | 194.70 | 213.54 | 304.63 | 387.38 |
Table 4.
Concrete class : first 5 natural modes with their natural frequencies, effective mass participation factor (EMPF), effective mass, mass percentage and cumulative mass percentage.
Table 4.
Concrete class : first 5 natural modes with their natural frequencies, effective mass participation factor (EMPF), effective mass, mass percentage and cumulative mass percentage.
| Mode | Frequency [Hz] | EMPF [X] | Eff. Mass X [kg] | Mass Percentage [%] | Cum. Percentage [%] |
|---|---|---|---|---|---|
| 1 | 56.59 | 80.94 | 6551.20 | 8.84 | 8.84 |
| 2 | 194.79 | −48.64 | 2365.70 | 3.19 | 12.04 |
| 3 | 214.14 | −27.57 | 760.29 | 1.03 | 13.06 |
| 4 | 304.78 | 166.16 | 27,610.00 | 37.27 | 50.33 |
| 5 | 388.81 | −133.94 | 17,941.00 | 24.22 | 74.55 |
Table 5.
Concrete class : first 5 natural modes with their natural frequencies, EMPF, effective mass, mass percentage and cumulative mass percentage.
Table 5.
Concrete class : first 5 natural modes with their natural frequencies, EMPF, effective mass, mass percentage and cumulative mass percentage.
| Mode | Frequency [Hz] | EMPF X [-] | Eff. Mass [kg] | Mass Percentage [%] | Cum. Percentage [%] |
|---|---|---|---|---|---|
| 1 | 55.60 | 80.90 | 6544.60 | 8.83 | 8.83 |
| 2 | 191.62 | −48.77 | 2378.70 | 3.21 | 12.05 |
| 3 | 210.34 | −27.31 | 745.83 | 1.01 | 13.05 |
| 4 | 299.19 | 166.11 | 27,592.00 | 37.25 | 50.30 |
| 5 | 381.83 | −133.87 | 17,921.00 | 24.19 | 74.49 |
Table 6.
Concrete class : first 5 natural modes with their natural frequencies, EMPF, effective mass, mass percentage and cumulative mass percentage.
Table 6.
Concrete class : first 5 natural modes with their natural frequencies, EMPF, effective mass, mass percentage and cumulative mass percentage.
| Mode | Frequency [Hz] | EMPF X [-] | Eff. Mass [kg] | Mass Percentage [%] | Cum. Percentage [%] |
|---|---|---|---|---|---|
| 1 | 54.50 | 80.85 | 6537.20 | 8.82 | 8.82 |
| 2 | 188.05 | −48.92 | 2393.60 | 3.23 | 12.06 |
| 3 | 206.07 | −27.01 | 729.33 | 0.98 | 13.04 |
| 4 | 292.93 | 166.05 | 27,572.00 | 37.22 | 50.26 |
| 5 | 374.00 | −133.79 | 17,900.00 | 24.16 | 74.42 |
Table 7.
Compression stresses in x () and y () direction, tensile stresses in x () and y () direction for .
Table 7.
Compression stresses in x () and y () direction, tensile stresses in x () and y () direction for .
| Concrete Class | [MPa] | [MPa] | [MPa] | [MPa] |
|---|---|---|---|---|
| C35/40 | −2.14 | −3.34 | 0.58 | 1.49 |
| C30/37 | −2.17 | −3.35 | 0.59 | 1.49 |
| C25/30 | −2.19 | −3.36 | 0.59 | 1.49 |
Table 8.
Compression stresses in x () and y () direction, tensile stresses in x () and y () direction for .
Table 8.
Compression stresses in x () and y () direction, tensile stresses in x () and y () direction for .
| Concrete Class | [MPa] | [MPa] | [MPa] | [MPa] |
|---|---|---|---|---|
| C35/40 | −5.22 | −6.65 | 0.72 | 2.64 |
| C30/37 | −5.23 | −6.62 | 0.73 | 2.63 |
| C25/30 | −5.22 | −6.58 | 0.73 | 2.62 |
Publisher’s Note: MDPI stays neutral with regard to jurisdictional claims in published maps and institutional affiliations. |
© 2020 by the authors. Licensee MDPI, Basel, Switzerland. This article is an open access article distributed under the terms and conditions of the Creative Commons Attribution (CC BY) license (http://creativecommons.org/licenses/by/4.0/).
Share and Cite
MDPI and ACS Style
Dermentzoglou, D.; Castellino, M.; De Girolamo, P.; Partovi, M.; Schreppers, G.-J.; Antonini, A. Crownwall Failure Analysis through Finite Element Method. J. Mar. Sci. Eng. 2021, 9, 35. https://doi.org/10.3390/jmse9010035
AMA Style
Dermentzoglou D, Castellino M, De Girolamo P, Partovi M, Schreppers G-J, Antonini A. Crownwall Failure Analysis through Finite Element Method. Journal of Marine Science and Engineering. 2021; 9(1):35. https://doi.org/10.3390/jmse9010035
Chicago/Turabian StyleDermentzoglou, Dimitrios, Myrta Castellino, Paolo De Girolamo, Maziar Partovi, Gerd-Jan Schreppers, and Alessandro Antonini. 2021. "Crownwall Failure Analysis through Finite Element Method" Journal of Marine Science and Engineering 9, no. 1: 35. https://doi.org/10.3390/jmse9010035
Note that from the first issue of 2016, this journal uses article numbers instead of page numbers. See further details here.