Article

The Use of News Information Published in Newspapers to Estimate the Impact of Coastal Storms at a Regional Scale

by
Amanda Sancho-García
1,*,
Jorge Guillén
2,
Vicente Gracia
3,
Ana Carlota Rodríguez-Gómez
1 and
Belén Rubio-Nicolás
1
1
Institute of Environment and Marine Science Research (IMEDMAR-UCV), Universidad Católica de Valencia, 46001 Valencia, Spain
2
Institute of Marine Sciences (ICM-CSIC), 08003 Barcelona, Spain
3
Laboratori d’Enginyeria Marítima, Universitat Politècnica de Catalunya Barcelona Tech, 08034 Barcelona, Spain
*
Author to whom correspondence should be addressed.
J. Mar. Sci. Eng. 2021, 9(5), 497; https://doi.org/10.3390/jmse9050497
Submission received: 27 April 2021 / Accepted: 1 May 2021 / Published: 4 May 2021
(This article belongs to the Special Issue Novel Technologies and Solutions for Coastal Evolution and Management)

Abstract

:
The evaluation of coastal damage caused by storms is not straightforward and different approaches can be applied. In this study, damage caused by extreme storms is evaluated at a regional scale based on news information published in regional newspapers. The data derived from the news are compared with hydrodynamic parameters to check the reliability of this methodology as a preliminary” fast approach” to evaluate storm damage and to identify hotspots along the coast. This methodology was applied to the two most extreme storms ever recorded along the Spanish Mediterranean coast, which occurred in January 2017 and January 2020, severely impacting the coast and causing significant community concerns. The news information from different media sources was processed and weighted to describe the resulting erosion, inundation, sand accumulation, and destruction of infrastructures. Moreover, an accuracy index for scoring the quality of the information was proposed. In spite of some limitations of the method, the resulting regional coastal hazard landscape of damage provides a rapid overview of the intensity and distribution of the damage and enables one to identify the location of potential hotspots for the analyzed extreme storm events. The results show that estimated damage intensity is better related to maximum wave energy than cumulative wave energy during a storm, and that beach characteristics should also be included for understanding the distribution of coastal damage.

1. Introduction

During the last decades, there has been an increase in the impact of coastal hazards because of the high degree of coastal occupation and a reduction in sediment riverine inputs. In the future, the expected rise in sea level will make the coast one of the most vulnerable areas. For the 21st century, the predicted climatic change will increase storminess and sea level rise rates and a significant increase in coastal damage is expected [1]. According to the Intergovernmental Panel on Climate Change (IPCC) [2], extreme coastal events with 100 years of recurrence period in the past could occur at least once per year at many locations by 2050 in all Representative Concentration Pathway (RCP) scenarios. Extreme storm events damage infrastructures and ecosystem services, and consequently have economic, social, and cultural impacts. Therefore, an adequate assessment of impacts caused by extreme storm events, as part of the strategy for evaluating coastal risks, is crucial and urgent to address the effects of climate change [3].
Coastal managers require more innovative approaches for coastal risk assessment and management, due to increasing coastal risks associated with the intensification of hazard and exposure magnitudes [4]. A risk assessment in a coastal zone requires the knowledge of the hazard and its impacts. Impacts that include monetary and non-monetary losses are usually subdivided into direct exposure (the density of receptors) and vulnerability parameters [5]; both of these parameters are evaluated using different approaches. Most of the studies about storm-induced damage have focused on the long-term scale or they have been site specific [6,7,8], however, the approaches used usually fail when they are integrated at larger spatial scales due to the lack of information about the impacts. In the last decade, remote sensing techniques have enabled the monitoring of flooding and erosion impacts during storms at a very large spatial scale [9]. This information should be later transformed to some normalized scale to be included in a risk analysis. In the context of the RISC-KIT project [10], a five-point scale (none, low, medium, high, and very high impacts) for measuring the direct impacts from inundation or erosion hazard and a scoring of the quality of the input data were used in the coastal risk assessment framework (CRAF). However, such types of measurements are unavailable at large spatial scales.
Within this context, faced with the difficulties of accurately estimating damage at a regional scale, using news information reported in local newspapers has been proposed to be used as a “fast-response” evaluation method [7,11,12,13]. This information can help to better understand coastal impacts caused by storms, although a careful verification of their uncertainties and potential bias is required before its incorporation to a robust model for coastal risk assessment [8,12].
In this study, we assess the use of news information reported in the most popular newspapers to estimate the coastal damage caused by extreme storm events at a regional scale. The methodology is tested along the Spanish Mediterranean coast, which, with more than 1100 beaches, covers almost all kinds of coastal archetypes [14] from highly urbanized to almost pristine environments of high ecological value including wetlands, dune chains, cliffs, deltas, and seagrass meadows. Impacts caused by two extreme storms that occurred in January 2017 and January 2020 (the highest wave height ever recorded in the study area were recorded in both storms) were estimated. The reliability of the results is checked through a comparison between the inferred damage and different erosion and inundation indexes based on the measured hydrodynamic parameters to characterize the potential wave erosion and inundation of these storm events.

2. Materials and Methods
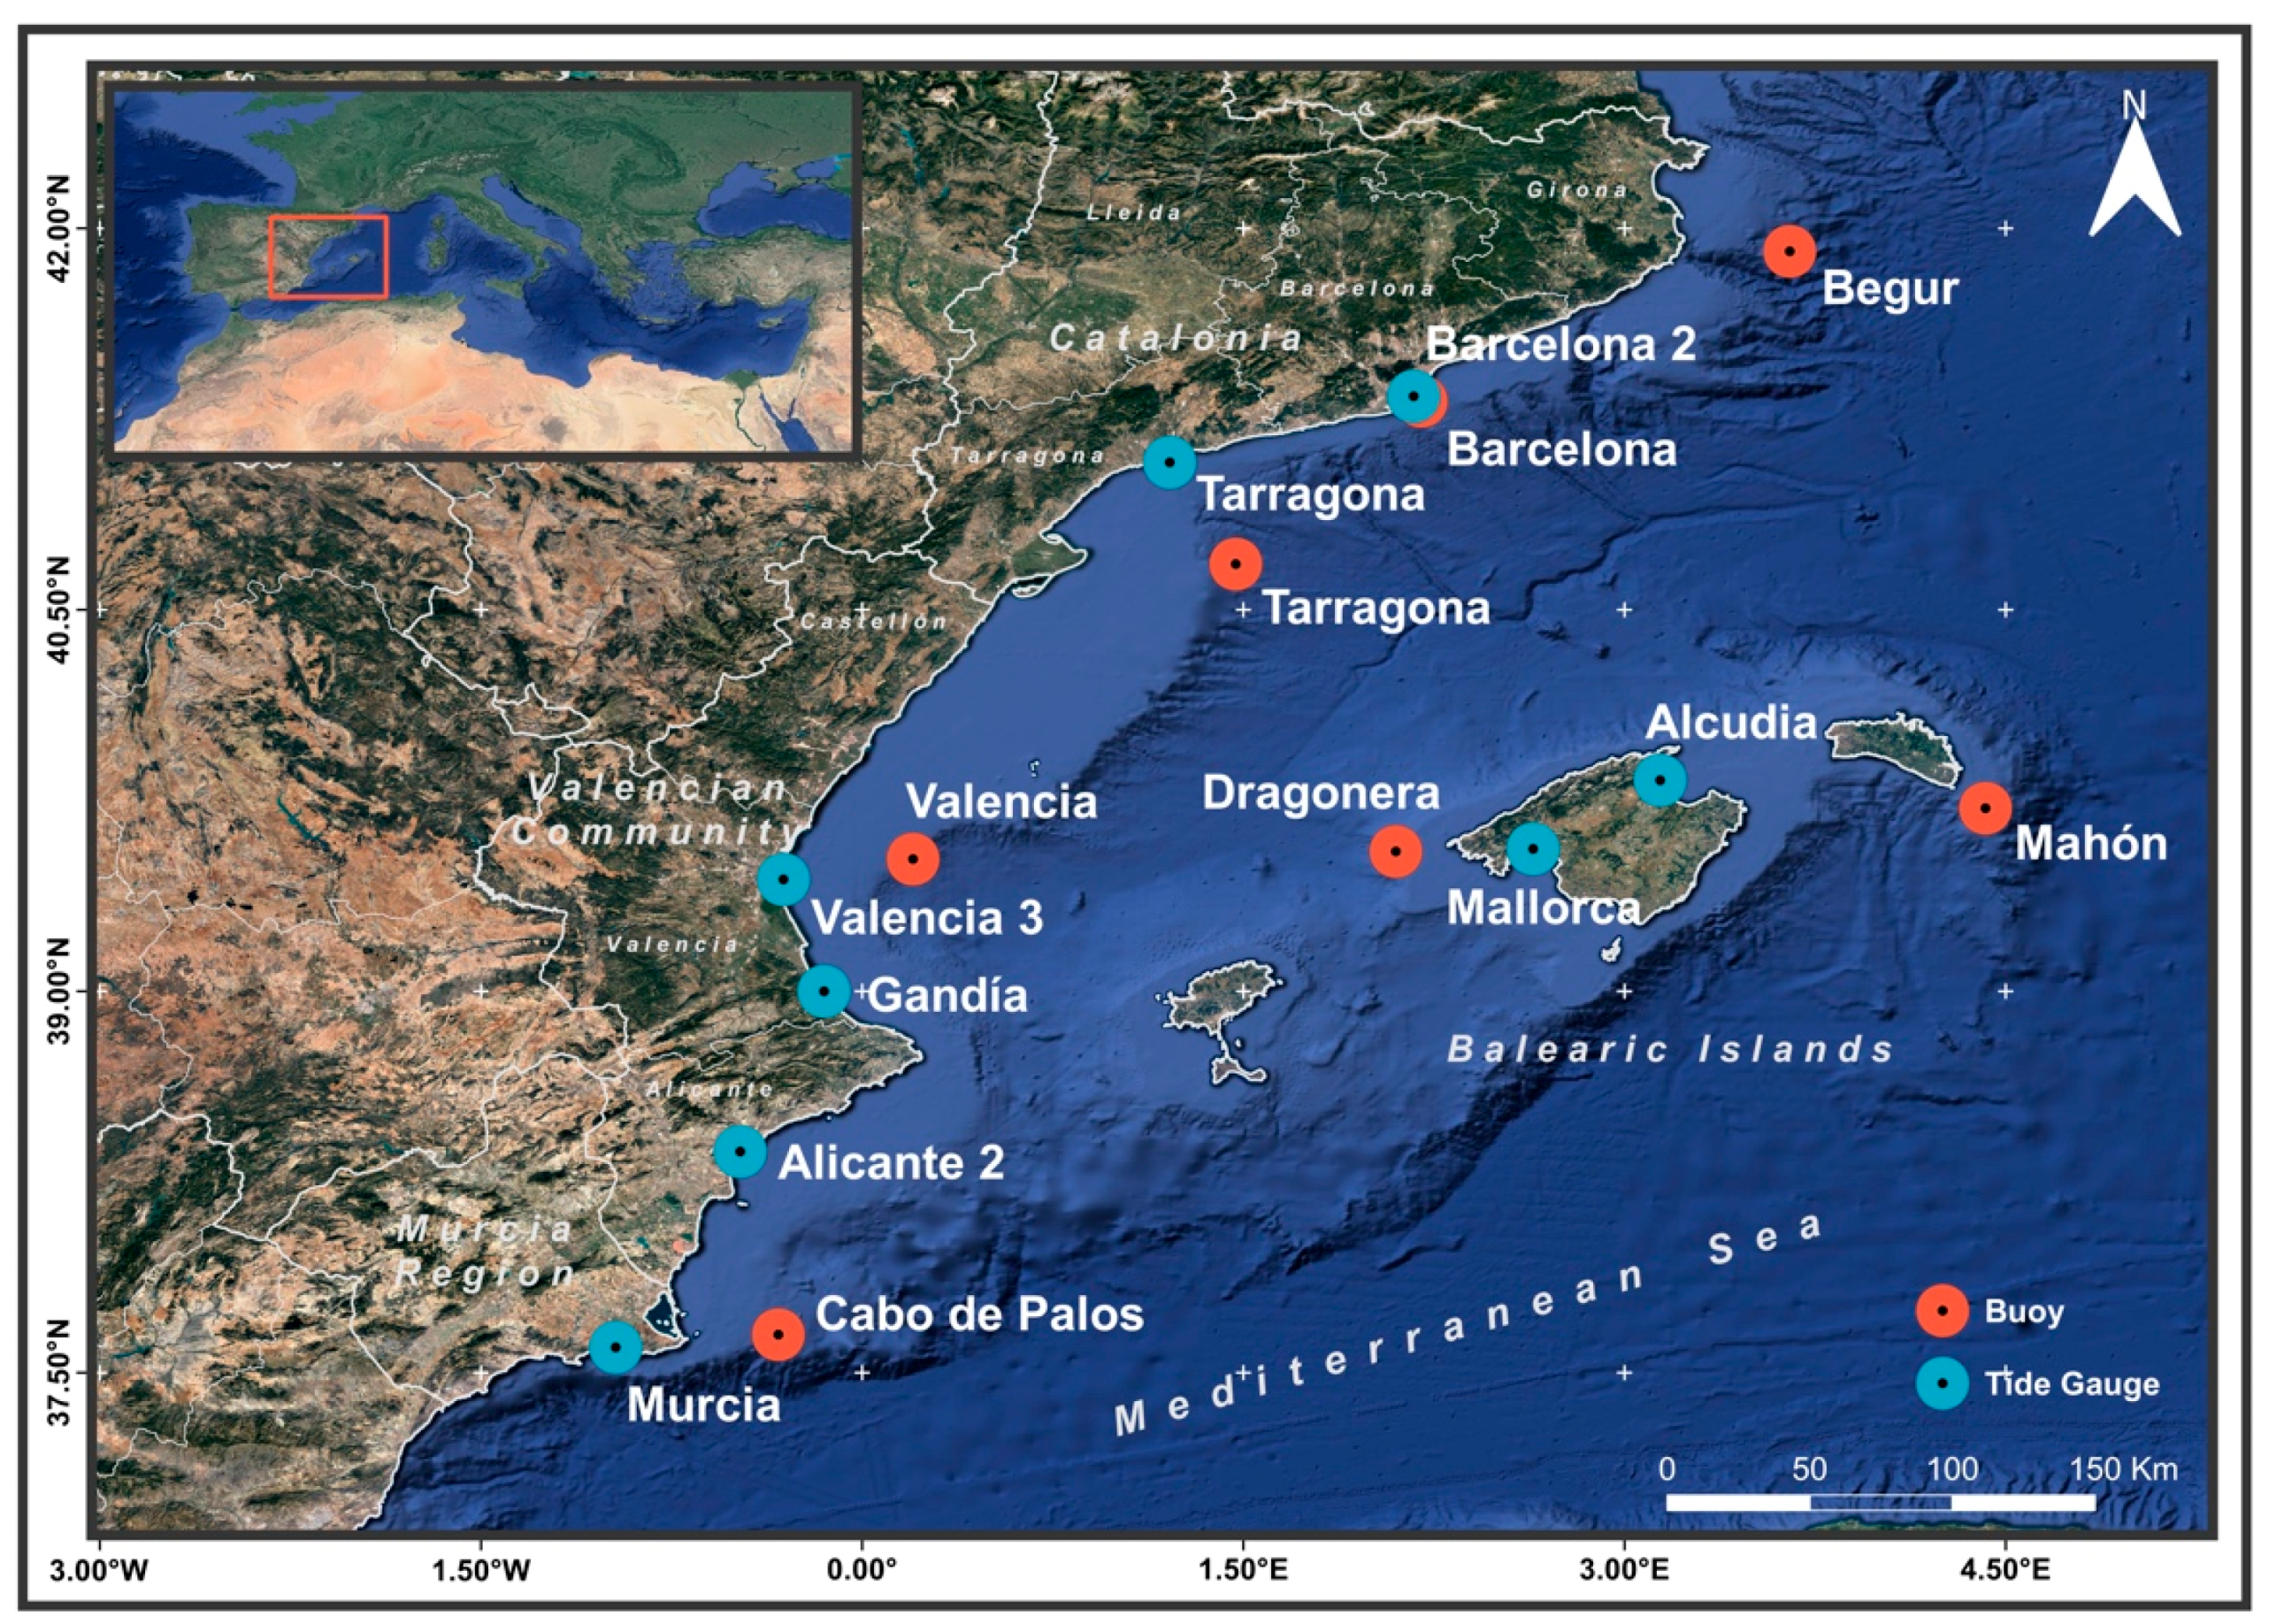
2.1. Study Area

The study area comprises the regions of the Spanish Mediterranean Sea affected by the January 2017 and January 2020 storms, i.e., Catalonia (Girona, Barcelona, and Tarragona provinces); Valencian Community (Castellón, Valencia, and Alicante provinces); and the Region of Murcia, from north to south along the Iberian Peninsula, and the Balearic Islands (Mallorca) (Figure 1). It corresponds to a total coastline length of about 2100 km (680 km of sandy beaches [15]) comprising a high diversity of coastal geomorphologies (from cliffs to deltas, embayed or urban beaches) and more than 1100 beaches (Table 1). The analyzed coastal stretch is a fetch-limited microtidal environment (range <0.2 m) with a median significant wave height (Hs) ranging from 0.5 m to 1 m, approximately, excluding calm conditions (Hs <0.2 m) with associated most frequent peak periods between 5 s and 6 s [16]. This moderate wave energy content gives a false perception of security to the communities; however, extreme storm events can reach an Hs up to 8 m. Three main storm directions impact the coast, the NE, the E, and the south. The eastern components have the higher energy content.

2.2. Potential Wave Erosion and Inundation

Wave and sea-level measurements from different buoys and tide gauges located along the Mediterranean Spanish coast were provided by the meteo-oceanographic network of Puertos del Estado [16] and Instituto Geográfico Nacional [18] (Figure 1). For the characterization of these storm events, the maximum significant wave height (Hsmax) and their associated peak period (TpHsmax) and wave direction (θHsmax), the storm duration (τ), and the sea level (η) were obtained. The wave height threshold used to estimate the storm duration was 1.5 m according to [19]. The considered zero sea level at each site was the mean sea level provided by the tide-gauge station.
The intensity of a storm, understood as the total energy content that impacts a specific coastal stretch, depends on several factors such as wave height and wave period, obliquity of the waves approaching the coast, and event duration. The coastal responses to such high energy content events depend on the existing morphology, which is a function, among others, of sediment size, sediment budget, sequence of storm events, and human interventions [20,21]. In order to characterize the potential erosion and destruction of these events, the maximum storm power index (SPImax) of [22], i.e., the energy content for the storm and the maximum wave energy (E) were calculated. The SPI index (either SPImax) is applied for evaluating the impacts of storms in coastal zones and their causality [20,23,24,25]. As the integrated and maximum power index are almost linearly proportional [24], SPImax was used for simplicity as follows:
SP I max = Hs max 2 · τ
where Hsmax is the maximum significant wave height and τ is the duration in hours.
E = Hs max 2 · Tp H max
where TpHmax is the peak period associated with the maximum significant wave height.
For the estimation of the potential inundation and backshore accumulation, it was defined as the inundation index (ID), as the sum of the runup (R2%) [26] and the measured sea level. In the runup evaluation, the maximum significant wave height (Hsmax) and the associated peak period (TpHmax) were used to calculate the deep water significant wave wavelength (L0), and a constant foreshore beach slope (βf ) of 0.1 was used for simplicity (extreme values comprise from 0.03 to 0.40 [27]). This beach slope value is the threshold between dissipative and reflective beaches used by [28] for calculating the wave runup on natural beaches, and they suggest that the dimensional vertical scaling of runup distributions may be independent of beach slope and proportional to (H0·L0)1/2 for βf < 0.1. The value of the sea level was that corresponding to the maximum wave height (ηHsmax) measured during the storm. ID is calculated as follows:
ID = R 2 % + η Hs max = 1.1 ( 0.35 β f ( Hs max L 0 ) 0.5 + [ Hs max L 0 ( 0.563 β f 2 + 0.004 ) ] 0.5 2 ) + η Hs max

2.3. Storm-Induced Damage

A systematic analysis of the news information published in the most relevant newspapers of each region between December 2016 and March 2020 was carried out to characterize the storm-induced damage corresponding to the events analyzed (Table 2). The information was gathered from open access libraries (La Vanguardia), digital libraries (Las Provincias and Diario de Mallorca), and a digital subscription (Kiosko y Mas) in the case of La Verdad. In most cases, storm impacts were reported in the newspapers by images of the damage produced on the beaches and to the infrastructures (mainly beach promenades) on the frontpage of most of the newspapers after both events, which revealed the exceptionality of the events studied.
First, news information including references of storm impacts were selected from the newspapers database. The following information was collected for each storm event: date, location (beach, municipality, and province), and type and extent of the damage. The type of damage reported was classified into the following four classes: destruction (damage to infrastructures such as beach promenade or beach furniture), erosion, inundation, and sand accumulation. An intensity index using a three-class scale (maximum, medium, and low) for each type of damage following [7] was associated with each beach from the information gathered from the news. An accuracy index (Q), as defined by [29], was applied to weight the importance of each damage based on the degree of precision in the location (sometimes the damage is described to a specific location and others from a wider region). Thus, if the news referred to a specific site/beach the accuracy index was 3, to the municipality the value was 2, and to the province the assigned value was 1. Such scale combination better characterizes the reported damage as:
TD = ( I d + I e + I sa + I in ) · Q
where TD is the total damage for a beach, Id is the intensity index for destruction, Ie for erosion, Isa for sand accumulation, and Iin for inundation.
To compare the regional variability, the sum of the total damage of all affected beaches of a province was weighted by the corresponding length of the coastline. The same procedure was followed for each typology of damage.
Finally, following the definition from [30], beaches with high single score indexes or with a co-existence of multiple hazards (most affected) were considered to be hotspots. Here, a hotspot was defined as a beach affected by both storms, with a score higher than the doble of the sum of the mean score per beach for January 2017 and January 2020. They represent points of potential high risk for extreme storms that should receive special interest from a coastal management perspective.

3. Results

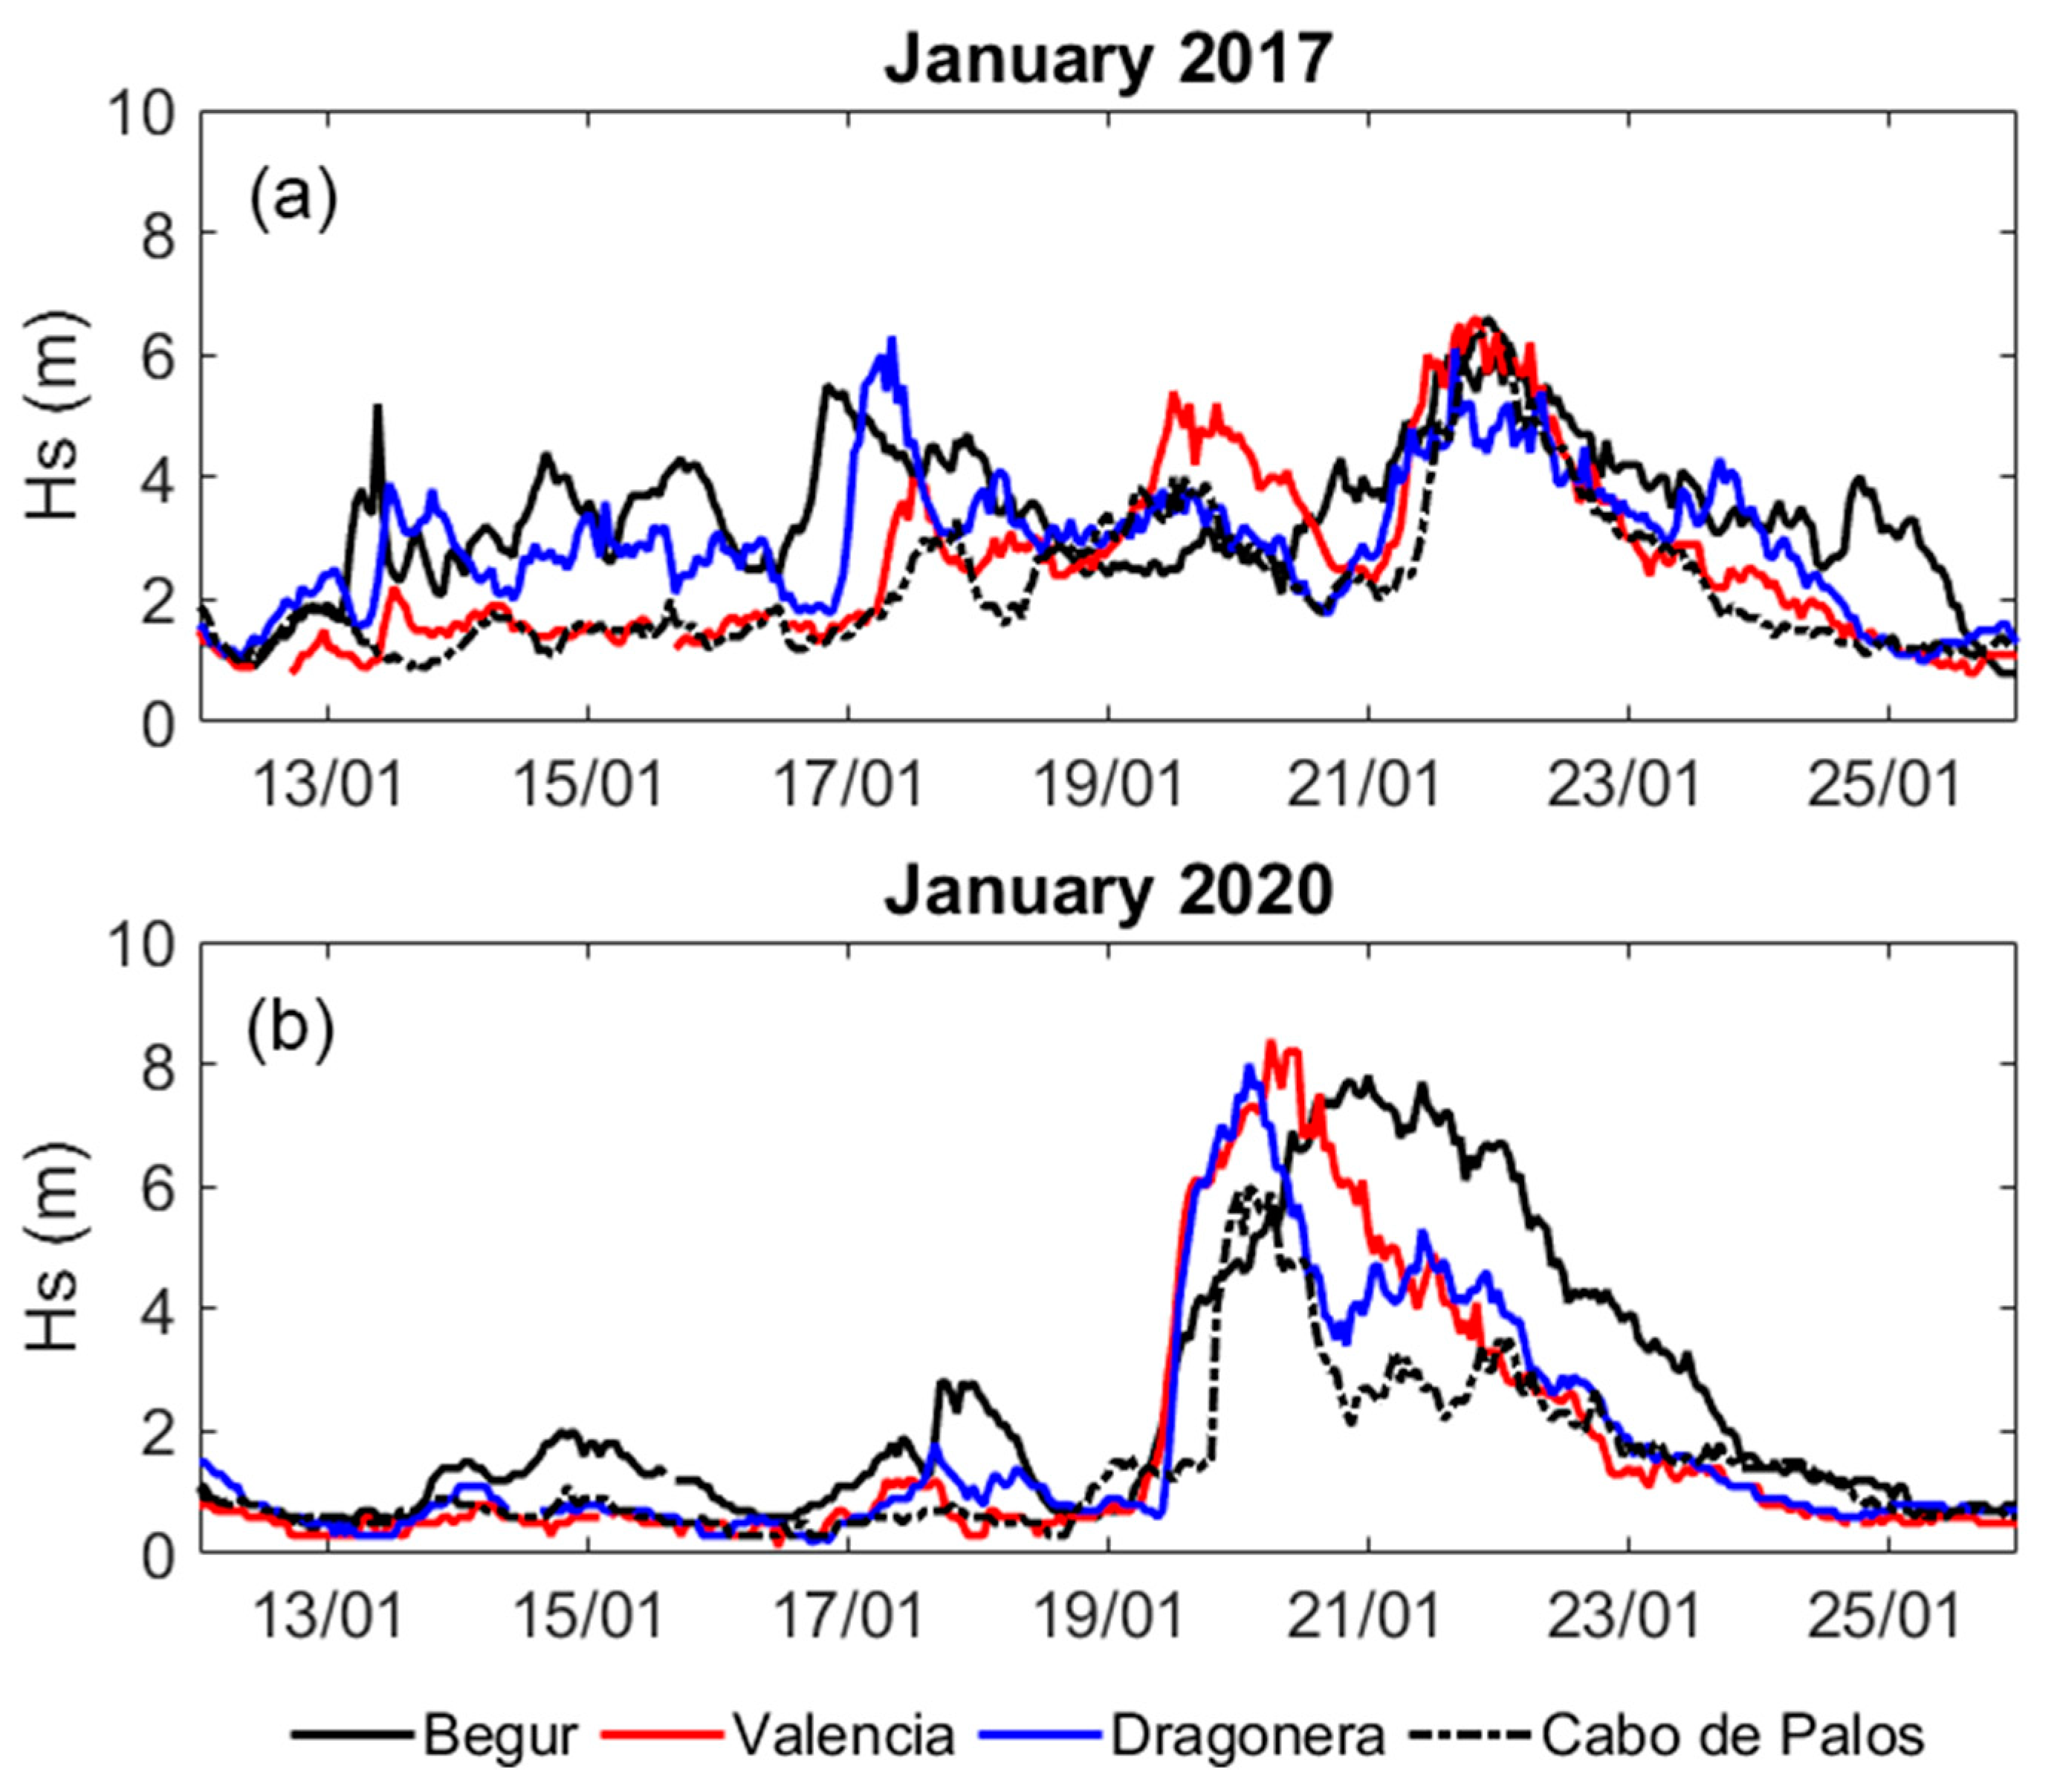
3.1. Selected Extreme Storms

The 2017 storm occurred between 19 and 24 January 2017. Its genesis can be associated with the collision between an anticyclone centered in Europe and the low pressure located on the Mediterranean. Strong northern winds generated large NE waves, with significant wave heights recorded at the peak of the storm that was higher than 6.2 m at all the sites (Table 3). This storm exhibited consecutively three maximum wave heights (triple-peaked storm) in some of the locations, with a time span of two/three days (Figure 2). The significant wave height was higher than 2 m several days before reaching the peak of the storm.
The Valencia and Cabo de Palos buoys (see Figure 1 for location) recorded the highest Hs of about 6.6 m (return period >20 years [31] estimated from observations during the period 2006–2017) on 21 January. The Dragonera buoy registered a double peak event on 17 January (Hs about 6.3 m) and on 21 January (Hs = 6.1 m) (Figure 2). The mean duration of this event was about 250 hours.
The January 2020 storm (called “Gloria”) was a low-pressure system coming from the Atlantic that made landfall in the northwestern part of the Iberian Peninsula on 17 January 2020. It evolved towards the southeast until reaching the Spanish Mediterranean Coast on 19 January 2020. It was absorbed by a larger low-pressure system centered over the Alboran Sea and it lasted until 26 January 2020 [32].
The wave characteristics during the January 2020 storm are presented in Table 4. In general, wave conditions during the storm showed a rapid increase in the wave height and period until the peak and later a slower decrease in storm conditions (Figure 2). The wave direction was from the NE at all the sites. The recorded Hs at the peak of the storm was higher than 7.6 m at all the sites (except at the Cabo de Palos buoy) and the mean duration of this event was 115 h. The maximum Hs was measured at the Valencia buoy (8.4 m, return period >225 years [33] estimated from observations during the period 2005–2007) (Figure 2). All buoys, except Mahón and Cabo de Palos, reached the highest ever measured Hs.
Table 5 shows the maximum sea level (ηmax) measured during both storms and the sea level that occurred simultaneously with the maximum wave height (ηHsmax) along measurement stations. An analogous pattern was observed for ηmax and ηHsmax. A similar spatial distribution of ηmax was recorded for both events with the maximum values located at the central part of the analyzed coastal stretch, between Valencia and Alicante, whereas at the north and south the values were significantly smaller. The highest ηmax (0.62 m) and ηHsmax (0.55) were reached in the January 2020 storm. Fortunately, from the perspective of the potential damage, the maximum wave energy and the maximum water level did not coincide in time in any of both events.

3.2. Wave Power, Wave Energy and Inundation Index

The SPImax and E indexes were calculated during the peak of both events using the wave parameters measured by the wave buoys of the study area (Table 3 and Table 4). During the January 2017 storm, the SPImax ranged from 4000 to 16,000 m2·h and E from 300 to 500 m2·s. During the January 2020 storm, the SPImax ranged from 4000 to 8000 m2·h and the wave energy (E) from 400 to 800 m2·s. For both storms, the maximum wave energy during the peak of the storm corresponds to the Valencia site, and the highest SPImax to the Mahón and Begur sites, where the duration of the storm was longer. The wave energy distributed mostly homogeneously along the Western Mediterranean coast during the January 2017 storm, whereas, during the January 2020 storm, it was different among the locations, being higher in the Gulf of Valencia and Balearic Islands and decreasing from Valencia to Murcia.
Runup estimations reached several meters along the coast during the peak of the storms and the combination of runup and storm surge surpassed 4 m during the January 2020 storm and 3 m during the January 2017 storm from Girona to North Alicante areas (Table 6). These estimations of the inundation index and wave runup are really large during both storm events for such microtidal coast, suggesting that flooding of the beaches was generalized along the coast.

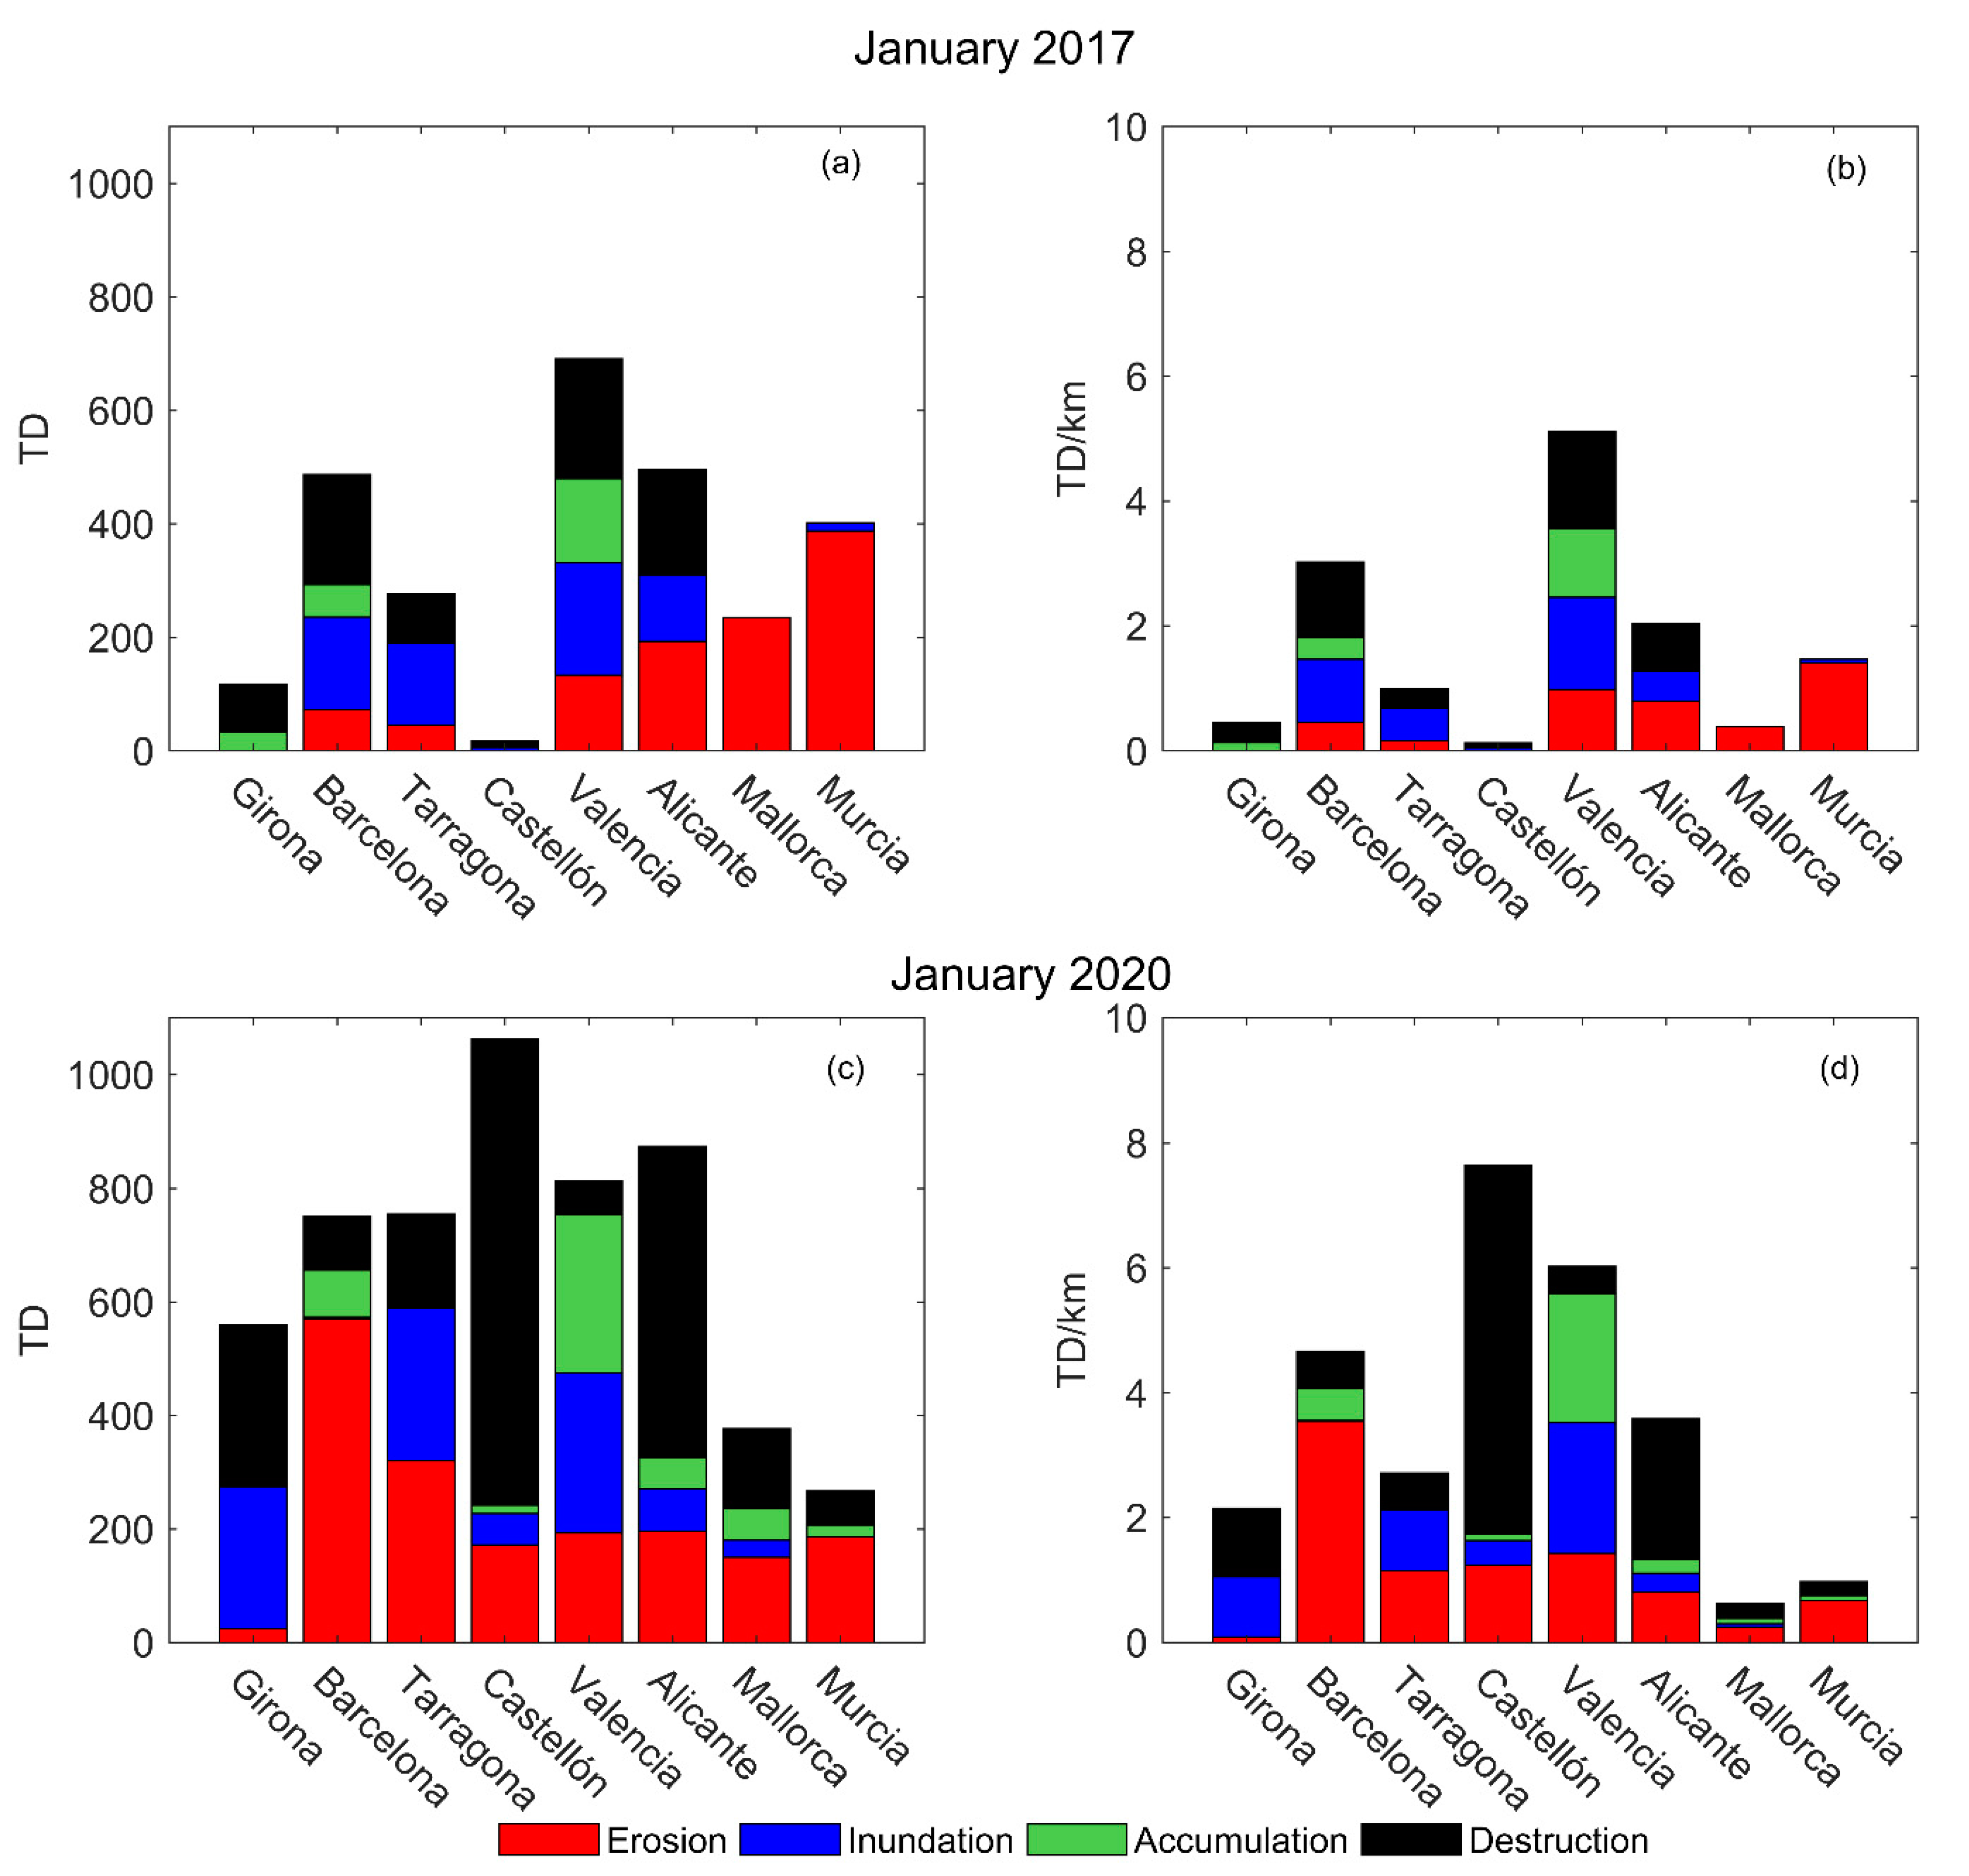
3.3. Reported Damage

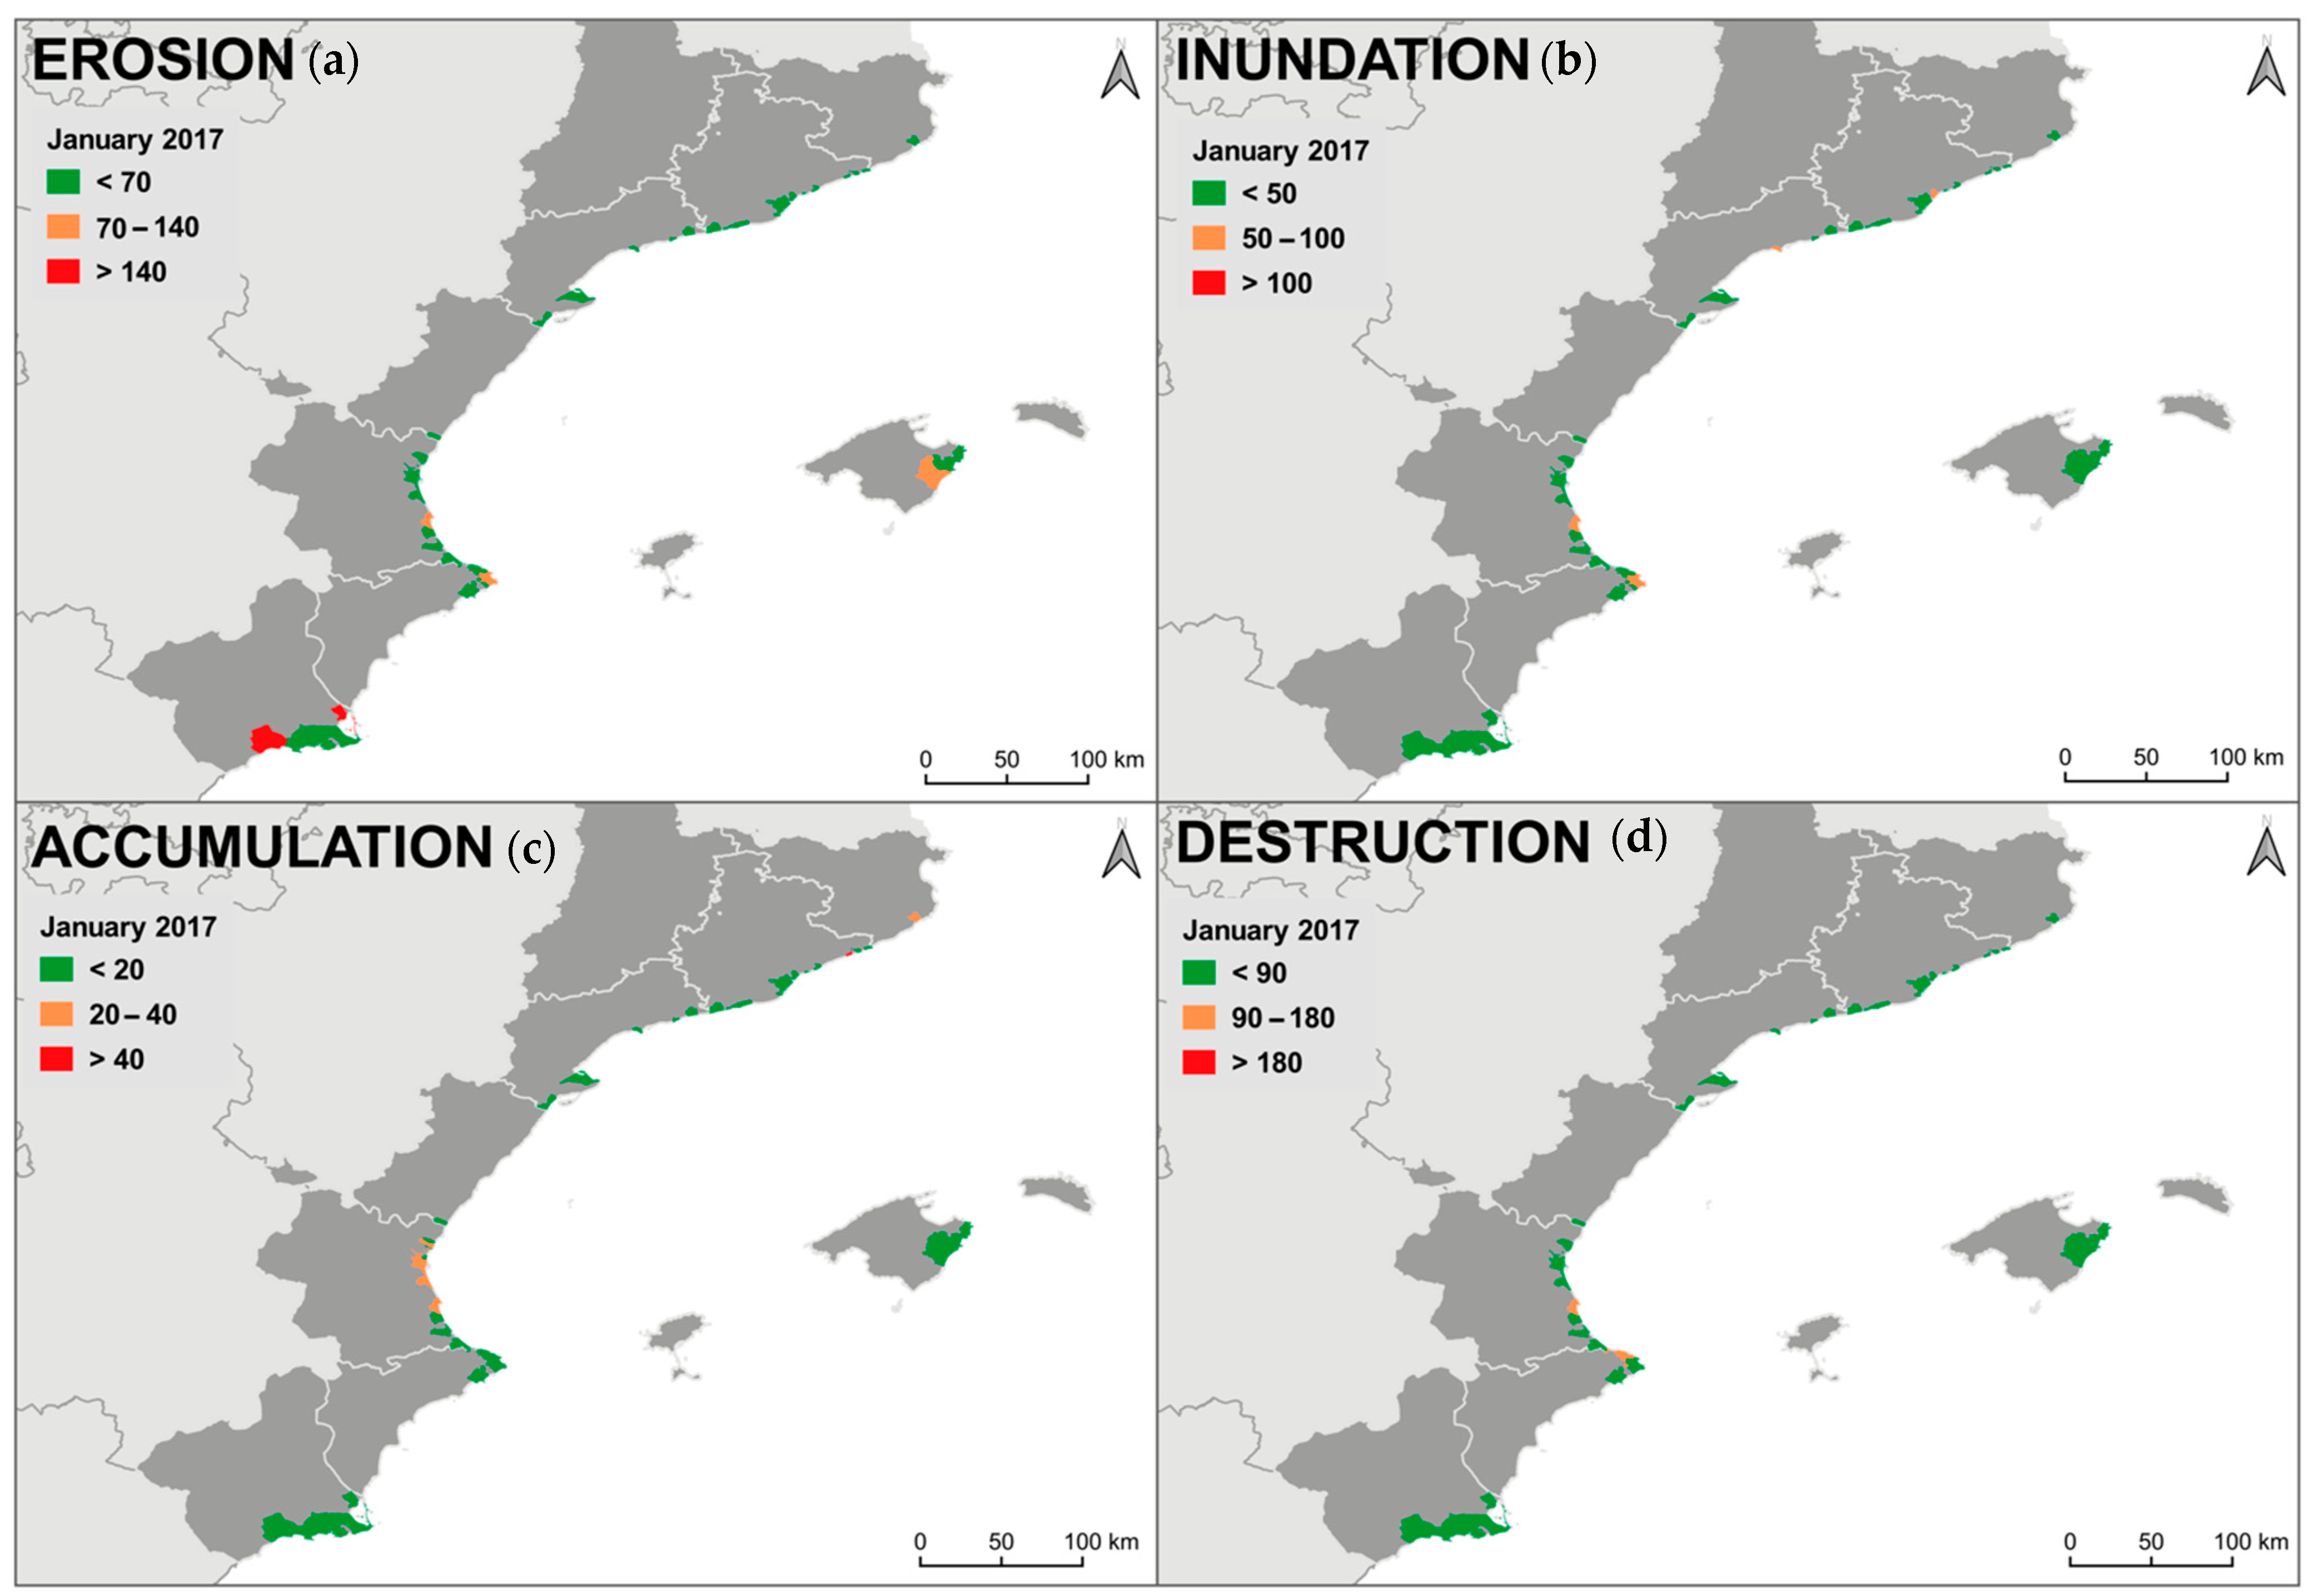
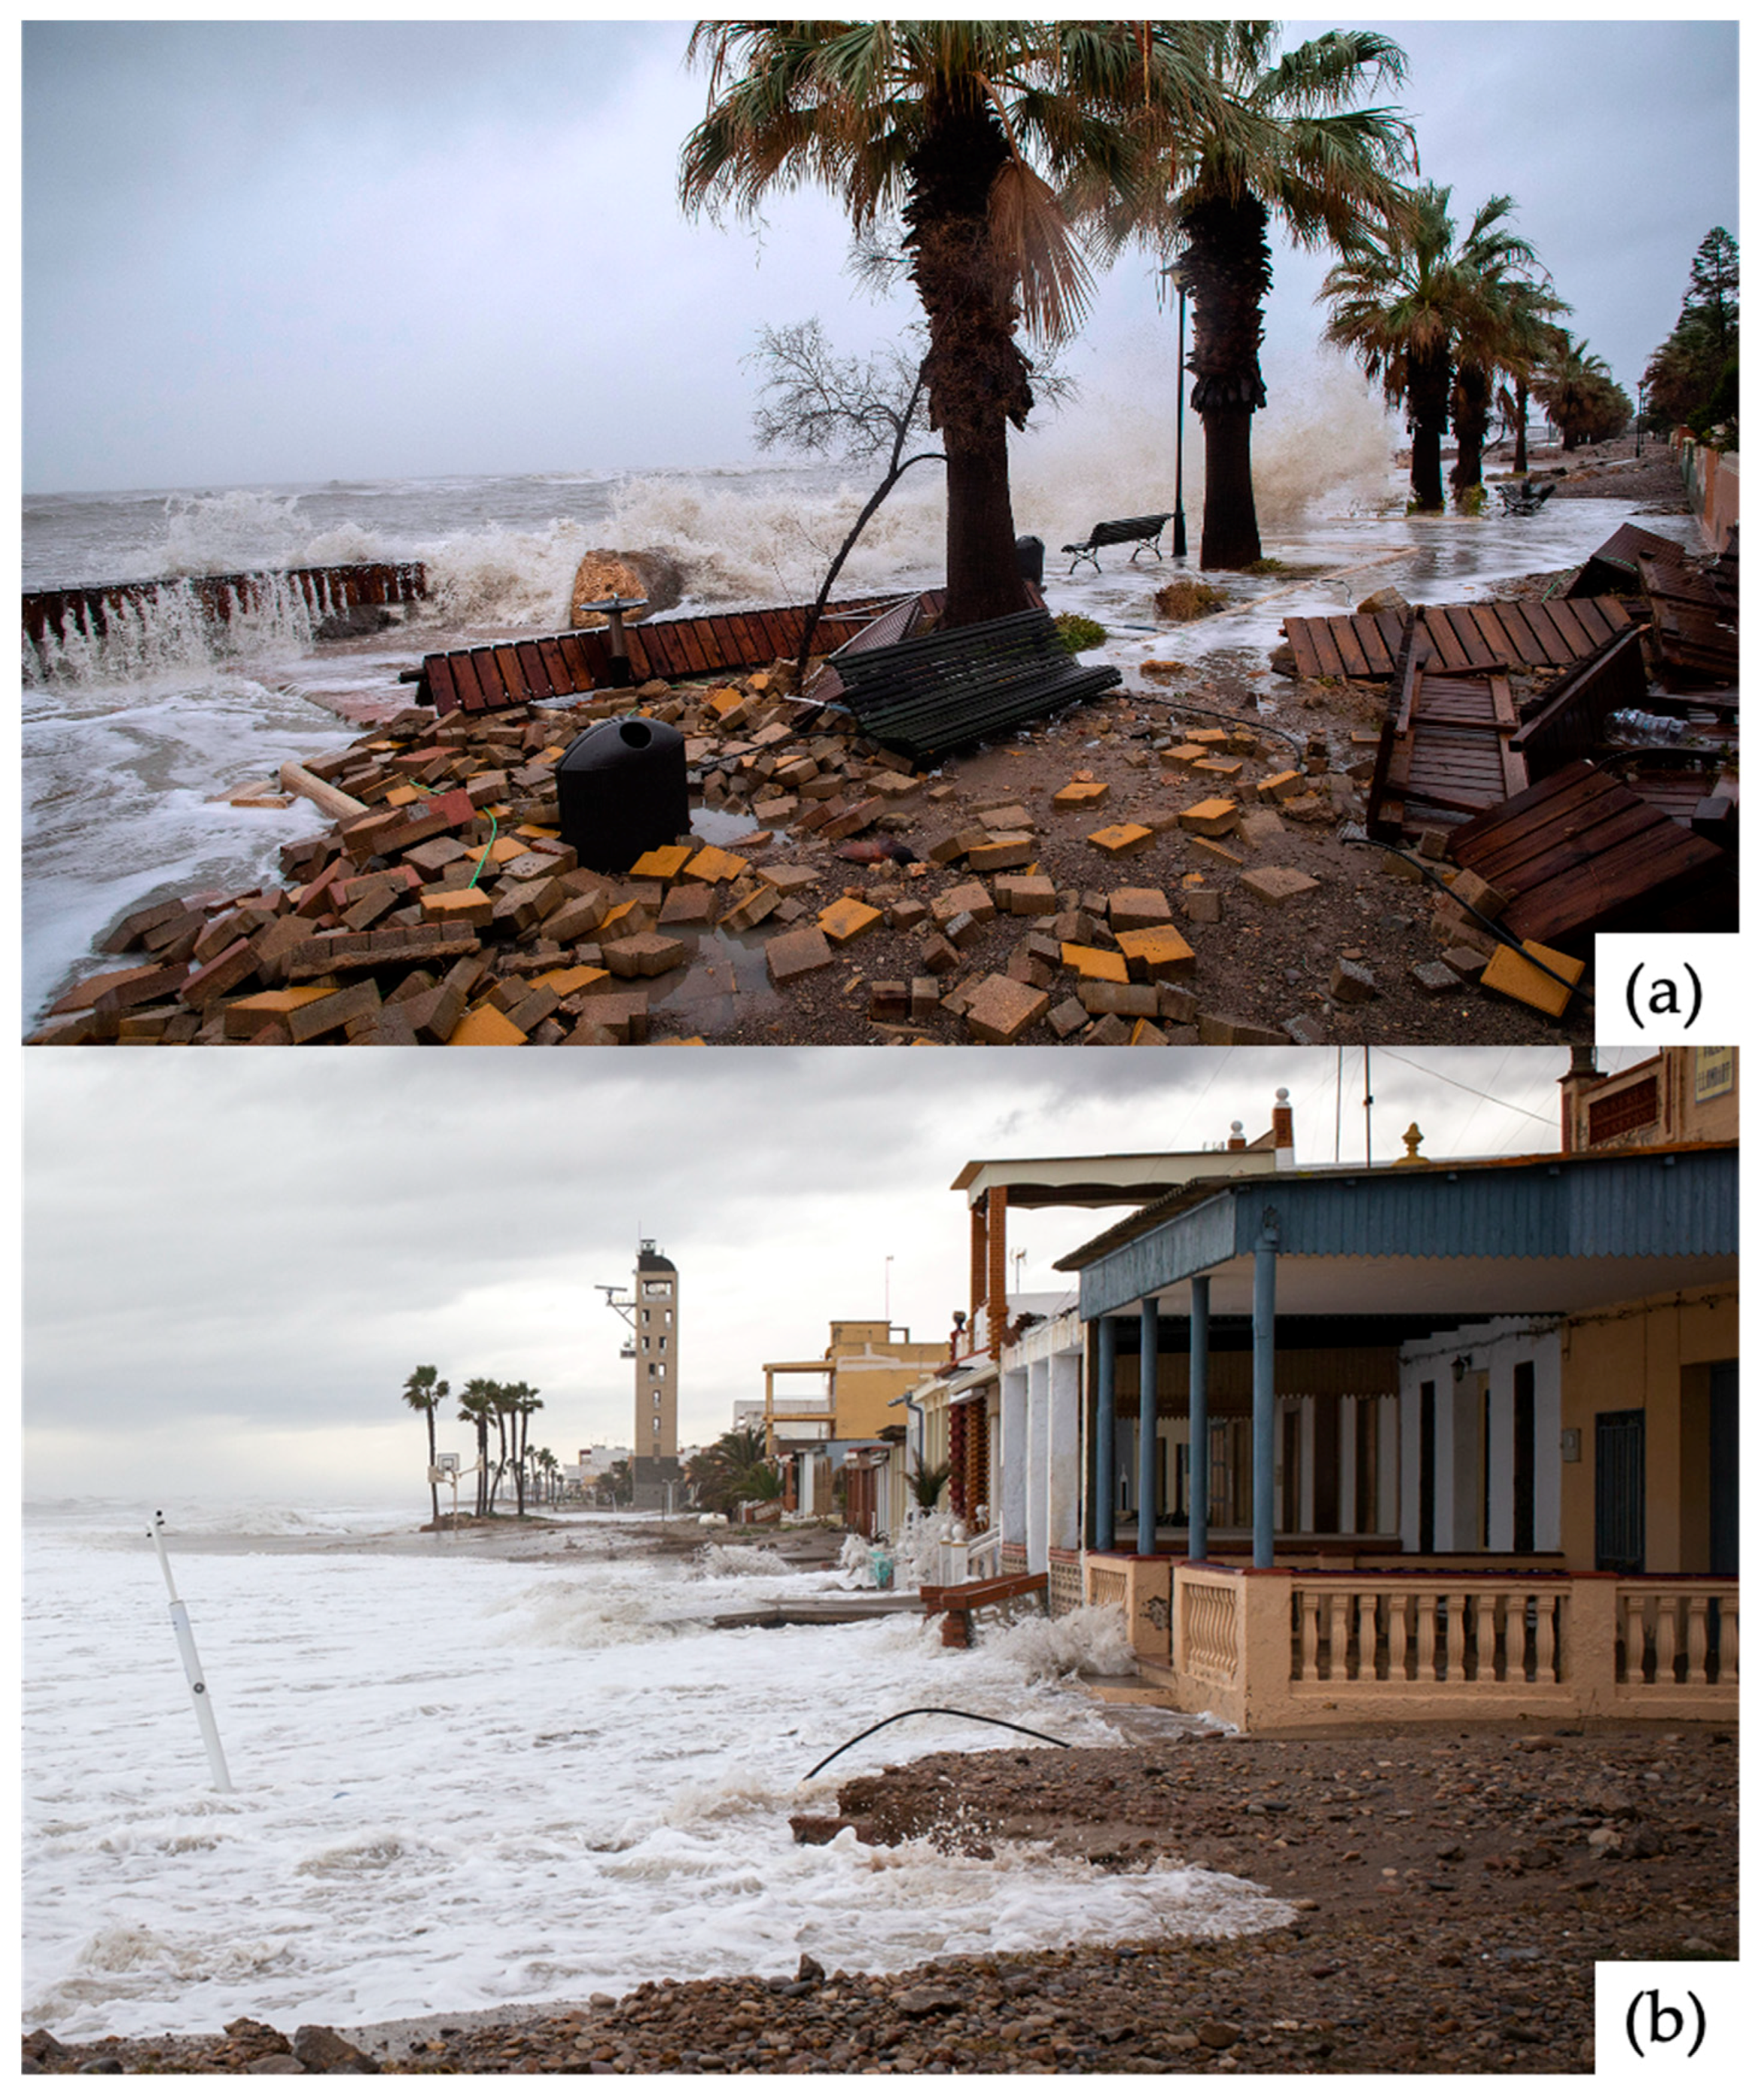
3.3.1. January 2017 Storm

The number of days that the newspapers reported damage related to this storm event was 6 days in the Valencian community, 4 days in Catalonia, and 3 days in Mallorca and the Region of Murcia. In all cases, the January 2017 storm was reported in the front page of the newspaper the day after the peak of the storm, and the extreme wave heights and the high wind speed were highlighted.
The inventory of beach damage reported in newspapers during the January 2017 storm showed that the province with the greatest number of beaches affected to some extent (i.e., without considering the quantification of the damage) by the storm was Murcia (62 beaches, 31% from the total number of beaches in the province), followed by Barcelona (47 beaches 42%); Mallorca (41 beaches, 23%); Valencia (38 beaches, 58%); Tarragona (30 beaches, 23%); Alicante (28 beaches, 16%); Girona (13 beaches, 7%); and Castellón (1 beach, 1%).
The regional variability of damage induced by the January 2017 storm along the Spanish Mediterranean coast is presented in Figure 3. The main reported damages were erosion and inundation. In terms of normalized cumulative damage, the province of Valencia was the most severely impacted by the storm, followed by Barcelona and Alicante. Mallorca and Murcia were mainly affected by beach erosion and impacts in Castellón were hardly reported.

3.3.2. January 2020 Storm

The January 2020 storm had significant media impact, with news information on the front page of all newspapers during some days along with detailed reports with photographs and videos. The number of days that the newspapers reported news related to this storm event was 21 days in Catalonia, 12 days in Valencian Community, 8 days in Mallorca, and 4 days in Murcia.
The inventory of beach damage caused by the January 2020 storm reported in newspapers showed that the highest number of affected beaches occurred in Castellón (94 beaches, 98% of the beaches in the province), followed by Alicante (87 beaches, 49%), Tarragona (80 beaches, 61%), Barcelona (79 beaches, 70%), Valencia (63 beaches, 95%), Mallorca (55 beaches, 31%), Girona (54 beaches, 29%), and Murcia (30 beaches, 15%).
The main reported damages were erosion and destruction, although inundation and accumulation were also relevant in some areas. Considering the normalized cumulative damages, Castellón was the most severely damaged (mainly destruction) followed by Valencia (erosion, inundation, and sand accumulation), Barcelona (erosion), and Tarragona (erosion, inundation, and destruction) (Figure 3).

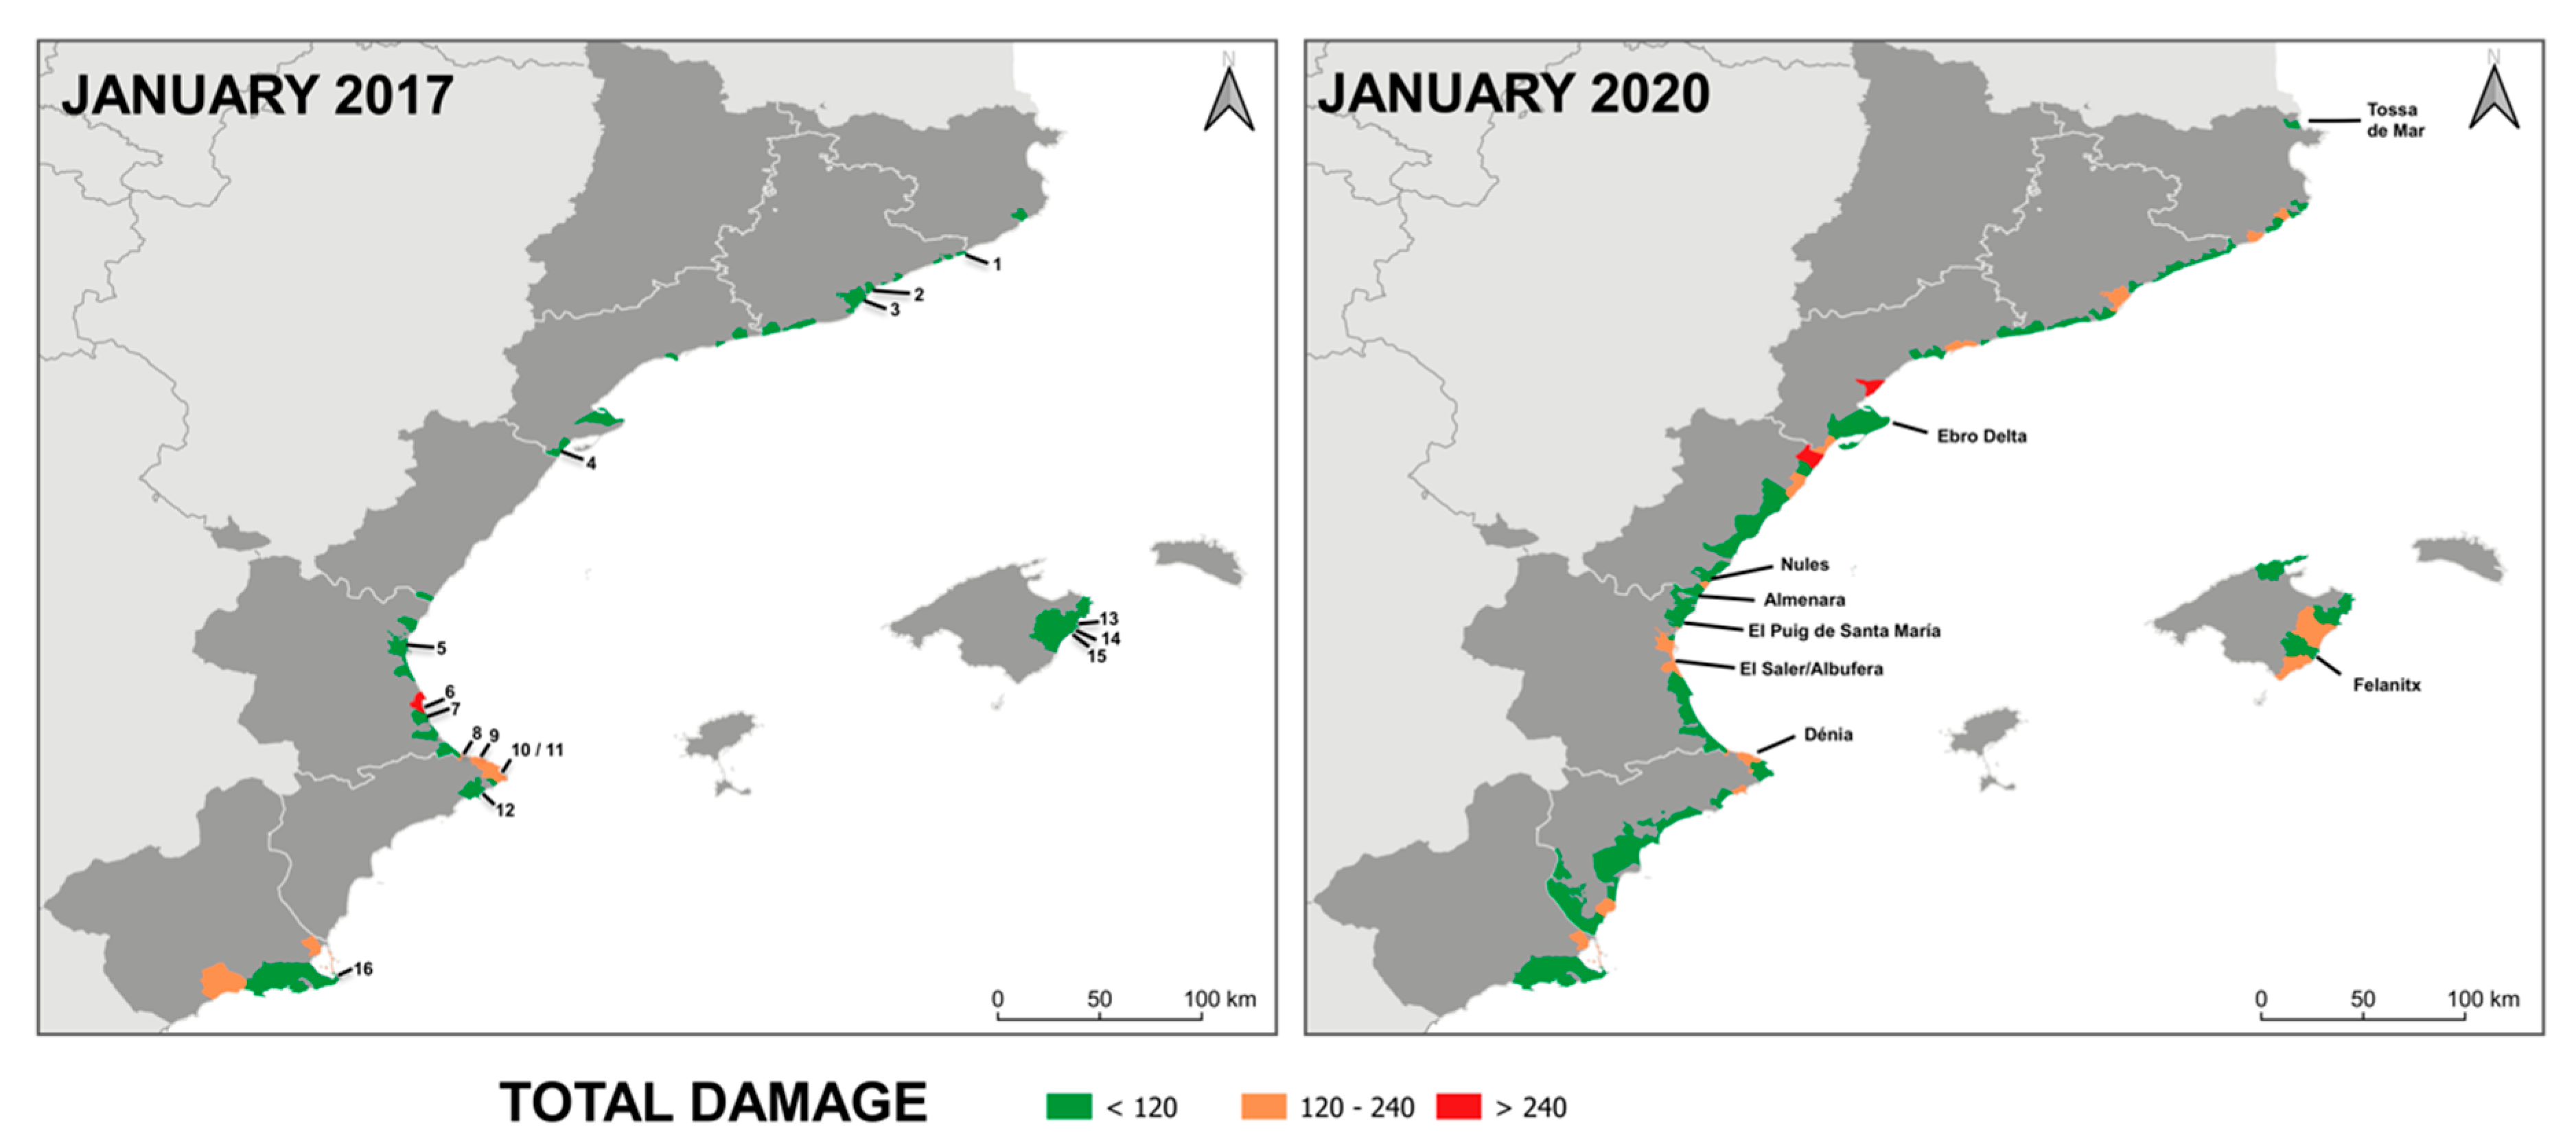
3.3.3. Comparison of Damage between Both Storms and Hotspots

Globally, the January 2020 storm-induced damage along the Spanish Mediterranean coast was higher than that by the January 2017 storm, excepting in Murcia by far (Figure 3). The sum of the total damage (TD) was higher for the January 2020 storm (5459) than the January 2017 storm (2724). The greatest differences between damages were found in the destruction index, which had a score of 759 for the January 2017 storm, whereas the January 2020 storm achieved a value almost three times greater (2174). The damages were two times greater for erosion (1061 and 1811) and sand accumulation (244 and 509) and increased significantly for inundation (645 and 965) for the January 2017 and January 2020 storms, respectively.
The distribution of the overall reported damage along the study area is presented in Figure 4, according to the affected municipalities along the coast, as the smallest administrative unit with responsibilities in beach management (the affected area comprises 157 municipalities including beaches). Again, it can be observed that the coastal impacts of the January 2020 storm were more severe, affecting more municipalities (100) than the January 2017 storm (39). The province with more municipalities affected by both storms was Barcelona (11 by the January 2017 storm and 22 by the January 2020 storm), followed by Valencia (9 and 18, respectively). The most drastic change occurred in Castellón, where only one municipality was reported for the January 2017 storm and 15 municipalities for the January 2020 storm. Finally, Murcia was the only region where the municipalities affected by the January 2017 storm (3) were higher than by the January 2020 storm (2).
As far as the distribution of damage by typology is concerned (see Figure 5 and Figure 6), the storms analyzed present differences in terms of the extent of the damage. To start with, erosion occurred in more municipalities in January 2020 (19 in January 2017 and 69 in January 2020), and in the case of inundation, 21 and 34, respectively. The province of Valencia comprises the most municipalities affected by inundation for both storms. Finally, regarding accumulation (11 and 39, respectively) and destruction (20 and 53, respectively), in both cases the January 2020 storm produced the largest values. The province of Valencia was the area with the most municipalities affected by accumulation for both storms.
The following sixteen potential hotspots were identified, from north to south provinces (Figure 4): Barcelona (Playa de la Punta de la Tordera, Platja del Pont de Petroli, and Sant Sebastià); Tarragona (Les Cases d’Alcanar); Valencia (Malvarrosa, El Marenyet, and Goleta); Alicante (Les Deveses, Les Marines, La Grava, El Arenal, and Playa de La Fossa); Mallorca Island (Cala Millor, Cala Moreia/Cala S’Illot, and Porto Cristo); and Murcia (Playa de Levante).

4. Discussion

4.1. Inferred Damage and Storm Conditions

The January 2017 storm had a longer duration (more than 300 hours in some stations) and lower maximum wave height and period than the January 2020 storm (Table 2). Consequently, the January 2017 storm exhibited a higher SPImax but a lower wave energy during the peak of the storm than the January 2020 storm. The inundation index was also much higher for the January 2020 storm.
The estimated damages were much greater during the January 2020 storm than during the January 2017 storm, suggesting that higher wave energy and sea level during the peak of a storm can better explain the intensity of the reported damages than the SPImax. When normalized values are considered, the most affected area during the January 2017 storm and the second most affected area during the January 2020 storm were in agreement with this trend, i.e., Valencia had the highest wave energy in both storms. Moreover, some association between the inundation index (ID) and inundation damages was observed for the January 2020 storm. For instance, inundation results for the Ebro Delta (Tarragona), Felanitx (eastern coast of Mallorca Island), and Dénia (Alicante) are in agreement with the simulation of this storm event carried out by [32] in which the flooding of the Ebro Delta and the wave overtopping of Felanitx (whose spray reached up to 30 m high) were reproduced. However, a clear correlation between the damage intensity distribution (i.e., erosion, destruction, or total damage) and SPImax along the coast was found.
Focusing on the inundation, Valencia and Tarragona reached the maximum runup and inundation index during both events (Table 6). These conditions and the presence of low-lying areas (Ebro Delta in Tarragona and El Saler/Albufera in Valencia) favor large coastal flooding caused by extreme storm events that are also captured by the damage indexes. For instance, extreme coastal flooding of 3 km inland and overwashing of the sand barrier in the Ebro Delta were reported [34] during the January 2020 storm, which is highlighted in the distribution map of inundation (Figure 6). Such coastal responses have also been identified for past extreme storm events in the area [35,36].
While a general relation between wave energy and intensity of damage can be established comparing both extreme storms, this is not the case for the distribution of damage along the coast, where only some patterns can be inferred. Probably, regional differences in wave characteristics during these extreme storms are small in the study area and preclude a clear zonation of damage. Moreover, the almost homogeneous distribution of the damage along the coast during extreme storm events suggest that the locations of the highest damaged areas mainly depend on the beach characteristics (beach orientation, beach slope, previous morphological conditions, sediment size, indentation, and beach width and length) rather than the differential wave conditions in the basin during these storms.
Regarding the hotspots obtained, it should be highlighted that most of beaches are located in an urban coastline with a high occupation density and display a narrow beach width (<40 m). In addition, some of these beaches have recurrent erosion problems and different protection works have been carried out, such as Goleta [37], Cala Millor [38,39,40], Les Deveses [41], and Sant Sebastià [19,42]. There was only one of the hotspots (Playa de la Punta de la Tordera) located in a non-urbanized coastline. The identification of this hotspot is in agreement with [6] which, using a completely different approach, also identified this area as a hotspot for storm impacts. In general, it seems that the identification of hotspots from newspaper sources introduces a bias, because non-urbanized coasts are usually less reported, probably because the impacts and beach responses are considered to be natural processes.

4.2. Limitations in the Use of the Methodology

Coastal damage indexes based on published news include aggregate information about beach exposure and vulnerability, as well as other considerations such as social relevance or beach location which are difficult to quantify. The main advantages of this approach as compared with other methods are its simplicity, speed, and its ability to incorporate local or regional scales. It also incorporates some social perception of the damage, as filtered by news media. The use of news information becomes a good proxy data source for obtaining information about damage magnitude in the absence of systematic databases of storm-induced damage [7], although some bias has been identified in how newspapers report and disseminate scientific information such as the news concerning climate change [43]. In regional studies, such as in the present work where different newspapers should to be used to report impacts, different biases should also be considered which include: (1) the distinct access to the newspaper archive: La Vanguardia has a search engine for the open access newspaper archive, but a search engine is only available for the digital edition in the other newspapers; (2) the diverse editorial positions can modify the overall interest for coastal damages or favor the interest of some sectors of the coast; (3) the accurate manner in which the damage is reported by each newspaper and (4) the different lengths of the coast and the number of beaches in each sector require some normalization of data to be compared.
Finally, the position and frequency of storm damage reports in the newspapers compete with other relevant news that occurs at local or global scales, which can diminish or even remove the storm interest. This fact, which is independent of the severity of storms and their effects, can introduce some bias when comparing different storms.
The accuracy of news is partially corrected using the accuracy index of [29], although very often the news does not include a detailed report of damage, but a general description of the most relevant impacts according to the newspaper criteria about the kind of damage. For example, the houses behind the beach at Nules (Castellón) were flooded during the January 2020 storm (Figure 7). However, newspapers reported only damage to the infrastructures (breakwaters) and some sand loss at the beaches, but flooding was not mentioned. A different example occurred for the beach with the highest values of inundation index (Tossa de Mar, Girona) during the January 2020 storm. The flood consisted of a foam generated by the stirring of phytoplankton during the storm that aroused media interest, giving higher rates of inundation index than other more severe floods. Therefore, the damage reported by the news sometimes are not the true damage but the perceived damage by the journalist.
Finally, as a major constraint, the method provides a general picture of the intensity and distribution of damage along the coast but is not able to describe, due to the type of information sources, the characteristics of the beach (type of sediment, slope, orientation, morphodynamics, or degree of urbanization and protection). The detailed interpretation of the causes of these damages requires a more thorough analysis.

5. Conclusions

The use of news information published in different local newspapers to estimate the coastal impacts is tested for the two most extreme storm events affecting the Spanish Mediterranean coast ever recorded (January 2017 and January 2020). Inferred impacts were analyzed at a regional (province), municipal, and beach (hotspots) spatial scales.
Several biases and uncertainties in the data obtained from the news can affect the estimation of location, type, and intensity of damage. Moreover, the use of different newspapers requires the normalization of the data before their integration at a regional scale study. In spite of these difficulties, this approach provides the basis for a comparative analysis of the impact of extreme storms on this coast. The total damage along the Spanish Mediterranean coast was two times more during the January 2020 storm than during the January 2017 storm, especially for destruction (three times greater) and erosion and accumulation (two times greater) damage indexes. These results suggest that damages evaluated immediately after the storm are better related to the maximum energy than with the total energy accumulated during the storm.
The relation between the spatial distribution of damage and wave conditions is unclear. This could be due to the moderate differences in waves and sea level at a regional scale and, more important, because the impact of extreme storm events largely depends on local beach characteristics, which are not included in the analysis. However, the mapping of the damage distribution enables one to quickly locate the provinces and municipalities more impacted by these extreme storms, only a few days after the peak of the storm, focusing the coastal management from a regional to a local perspective, including the identification of potential hotspots along the coast.
Finally, in a future scenario, where the information from social and press media will probably be systematically incorporated to manage coastal risks, this study emphasizes the need to establish synergies between scientists and media to improve the dissemination of scientific information related to the impact of coastal storm events.

Author Contributions

Conceptualization, methodology, writing—original draft preparation, and formal analysis A.S.-G.; writing—review, methodology, formal analysis, supervision, and funding acquisition J.G.; writing review and methodology V.G.; data collection from newspapers A.C.R.-G. and B.R.-N. All authors have read and agreed to the published version of the manuscript.

Funding

This work has been done in the framework of the MOCCA research project (RTI2018-093941-B-C32) funded by the Spanish Ministry of Science, Innovation and Universities, National Agency of Research. This work acknowledges the ‘Severo Ochoa Centre of Excellence’ accreditation (CEX2019-000928-S) to ICM-CSIC.

Institutional Review Board Statement

Not applicable.

Informed Consent Statement

Not applicable.

Data Availability Statement

The results obtained in this study are available on request from the corresponding author. The original source of the data used is indicated in the references.

Acknowledgments

We thank Puertos del Estado (Spanish Ministry of Public Works) and the Instituto Geográfico Nacional (IGN, Ministry of Development), in particular Mª Ángeles Fraile, for supplying wave data and water levels used in this study. We thank Sara Soto from the Data Science Department (Servicio de Ciencia de Datos) of ICM-CSIC for the technical support with the preparation of the maps. We thank Carmen Ripollés and Ángel Sánchez for the photographs. We also want to thank the newspapers that provided the data, i.e., La Vanguardia, Las Provincias, Diario de Mallorca, and La Verdad (in particular to Antonio Rubio). We would like to thank reviewers for their comments and suggestions on the original manuscript.

Conflicts of Interest

The authors declare no conflict of interest. The funders had no role in the design of the study; in the collection, analyses, or interpretation of data; in the writing of the manuscript, or in the decision to publish the results.

References

  1. Androulidakis, Y.S.; Kombiadou, K.D.; Makris, C.V.; Baltikas, V.N.; Krestenitis, Y.N. Storm Surges in the Mediterranean Sea: Variability and Trends under Future Climatic Conditions. Dyn. Atmos. Ocean. 2015, 71, 56–82. [Google Scholar] [CrossRef]
  2. Pörtner, H.-O.; Roberts, D.C.; Alegría, A.; Nicolai, M.; Okem, A.; Petzold, J.; Rama, B.; Weyer, N.M. The Ocean and Cryosphere in a Changing Climate A Special Report of the Intergovernmental Panel on Climate Change Edited By; Intergovernmental Panel on Climate Change: Geneva, Switzerland, 2019. [Google Scholar]
  3. Fatorić, S.; Chelleri, L. Vulnerability to the Effects of Climate Change and Adaptation: The Case of the Spanish Ebro Delta. Ocean Coast. Manag. 2012, 60, 1–10. [Google Scholar] [CrossRef]
  4. Sanuy, M.; Duo, E.; Jäger, W.S.; Ciavola, P.; Jiménez, J.A. Linking Source with Consequences of Coastal Storm Impacts for Climate Change and Risk Reduction Scenarios for Mediterranean Sandy Beaches. Nat. Hazards Earth Syst. Sci. 2018, 18, 1825–1847. [Google Scholar] [CrossRef] [Green Version]
  5. van Dongeren, A.; Ciavola, P.; Viavattene, C.; de Kleermaeker, S.; Martinez, G.; Ferreira, O.; Costa, C.; McCall, R. RISC-KIT: Resilience-Increasing Strategies for Coasts - ToolKIT. J. Coast. Res. 2014, 70, 366–371. [Google Scholar] [CrossRef]
  6. Jiménez, J.A.; Sanuy, M.; Ballesteros, C.; Valdemoro, H.I. The Tordera Delta, a Hotspot to Storm Impacts in the Coast Northwards of Barcelona (NW Mediterranean). Coast. Eng. 2018, 134, 148–158. [Google Scholar] [CrossRef]
  7. Jiménez, J.A.; Sancho-García, A.; Bosom, E.; Valdemoro, H.I.; Guillén, J. Storm-Induced Damages along the Catalan Coast (NW Mediterranean) during the Period 1958-2008. Geomorphology 2012, 143–144, 24–33. [Google Scholar] [CrossRef]
  8. Arnoux, F.; Abadie, S.; Bertin, X.; Kojadinovic, I. Coastal Flooding Event Definition Based on Damages: Case Study of Biarritz Grande Plage on the French Basque Coast. Coast. Eng. 2021, 103873. [Google Scholar] [CrossRef]
  9. Klemas, V. The Role of Remote Sensing in Predicting and Determining Coastal Storm Impacts. J. Coast. Res. 2009, 25, 1264–1275. [Google Scholar] [CrossRef] [Green Version]
  10. Viavattene, C.; Jiménez, J.A.; Ferreira, O.; Priest, S.; Owen, D.; McCall, R. Selecting Coastal Hotspots to Storm Impacts at the Regional Scale: A Coastal Risk Assessment Framework. Coast. Eng. 2018, 134, 33–47. [Google Scholar] [CrossRef]
  11. Ibsen, M.L.; Brunsden, D. The Nature, Use and Problems of Historical Archives for the Temporal Occurrence of Landslides, with Specific Reference to the South Coast of Britain, Ventnor, Isle of Wight. Geomorphology 1996, 15, 241–258. [Google Scholar] [CrossRef]
  12. Garnier, E.; Ciavola, P.; Spencer, T.; Ferreira, O.; Armaroli, C.; McIvor, A. Historical Analysis of Storm Events: Case Studies in France, England, Portugal and Italy. Coast. Eng. 2018, 134, 10–23. [Google Scholar] [CrossRef] [Green Version]
  13. Gil-Guirado, S.; Pérez-Morales, A.; Lopez-Martinez, F. SMC-Flood Database: A High-Resolution Press Database on Flood Cases for the Spanish Mediterranean Coast (1960-2015). Hazards Earth Syst. Sci 2019, 19, 1955–1971. [Google Scholar] [CrossRef] [Green Version]
  14. Sánchez-Arcilla, A.; García-León, M.; Gracia, V.; Devoy, R.; Stanica, A.; Gault, J. Managing Coastal Environments under Climate Change: Pathways to Adaptation. Sci. Total Environ. 2016, 572, 1336–1352. [Google Scholar] [CrossRef] [PubMed] [Green Version]
  15. Ministerio para la Transición Ecológica y el Reto Demográfico Guía de Playas. Available online: https://www.miteco.gob.es/es/costas/servicios/guia-playas/default.aspx (accessed on 30 November 2020).
  16. Puertos Del Estado. Available online: http://www.puertos.es/es-es (accessed on 16 November 2020).
  17. Instituto Geográfico Nacional Datos Geográficos y Toponimia. Available online: https://www.ign.es/web/ign/portal/ane-datos-geograficos/-/datos-geograficos/datosGenerales?tipoBusqueda=longCosta (accessed on 20 June 2020).
  18. Instituto Geográfico Nacional Red Mareógrafos. Available online: https://www.ign.es/web/gds-red-mareografos (accessed on 27 May 2020).
  19. Ojeda, E.; Guillén, J. Shoreline Dynamics and Beach Rotation of Artificial Embayed Beaches. Mar. Geol. 2008, 253, 51–62. [Google Scholar] [CrossRef]
  20. Anfuso, G.; Rangel-Buitrago, N.; Cortés-Useche, C.; Iglesias Castillo, B.; Gracia, F.J. Characterization of Storm Events along the Gulf of Cadiz (Eastern Central Atlantic Ocean). Int. J. Climatol. 2016, 36, 3690–3707. [Google Scholar] [CrossRef]
  21. Amarouche, K.; Akpınar, A. Increasing Trend on Storm Wave Intensity in the Western Mediterranean. Climate 2021, 9, 11. [Google Scholar] [CrossRef]
  22. Dolan, R.; Davis, E. An Intensity Scale for Atlantic Coast Northeast Storms. J. Coast. Res. 1992, 8, 840–853. [Google Scholar]
  23. Amarouche, K.; Akpınar, A.; Çakmak, R.E.; Houma, F.; Bachari, N.E.I. Assessment of Storm Events along the Algiers Coast and Their Potential Impacts. Ocean Eng. 2020, 210. [Google Scholar] [CrossRef]
  24. Eichentopf, S.; Alsina, J.M.; Christou, M.; Kuriyama, Y.; Karunarathna, H. Storm Sequencing and Beach Profile Variability at Hasaki, Japan. Mar. Geol. 2020, 424. [Google Scholar] [CrossRef]
  25. Rangel-Buitrago, N.; Anfuso, G. Coastal Storm Characterization and Morphological Impacts on Sandy Coasts. Earth Surf. Process. Landf. 2011, 36, 1997–2010. [Google Scholar] [CrossRef]
  26. Stockdon, H.F.; Holman, R.A.; Howd, P.A.; Sallenger, A.H. Empirical Parameterization of Setup, Swash, and Runup. Coast. Eng. 2006, 53, 573–588. [Google Scholar] [CrossRef]
  27. Llibre Verd de l’estat de La Zona Costanera a Catalunya. Available online: https://territori.gencat.cat/ca/01_departament/documentacio/territori-i-urbanisme/ordenacio_territorial/llibre_verd_estat_de_la_zona_costanera/ (accessed on 25 March 2021).
  28. Nielsen, P.; Hanslow, D.J. Wave Runup Distribution on Natural Beaches. J. Coast. Res. 1991, 7, 1139–1152. [Google Scholar]
  29. Gracia, V.; Sancho-García, A.; García-León, M.; Ye, L. Inventory of Contemporary Coastal Disasters Related to Storms. Drivers Characterization and Beach Targets; Centre Int. d’Inv. dels Recursos Costaners (CIIRC): Barcelona, Spain, 2015. [Google Scholar]
  30. Totaro, F.; Alberico, I.; di Martire, D.; Nunziata, C.; Petrosino, P. Pozzuoli Municipalities (Southern Italy). J. Maps 2020, 16, 68–78. [Google Scholar] [CrossRef]
  31. Puertos del Estado. Extremos Máximos de Oleaje Por Direcciones Boya Cabo de Palos; Ministerio de Fomento: Madrid, Spain, 2017.
  32. Amores, A.; Marcos, M.; Carrió, D.; Gómez-Pujol, L. Coastal Impacts of Storm Gloria (January 2020) over the Northwestern Mediterranean. Nat. Hazards Earth Syst. Sci. 2020, 1–19. [Google Scholar] [CrossRef]
  33. Puertos del Estado. Extremos Máximos de Oleaje Por Direcciones Boya de Valencia; Ministerio de Fomento: Madrid, Spain, 2017.
  34. Copernicus Emergency Management Service The Copernicus Emergency Management Service Monitors Impact of Flood in Spain | Copernicus Emergency Management Service. Available online: https://emergency.copernicus.eu/mapping/ems/copernicus-emergency-management-service-monitors-impact-flood-spain (accessed on 29 June 2020).
  35. Gracia, V.; García, M.; Grifoll, M.; Sánchez-Arcilla, A. Breaching of a Barrier under Extreme Events. The Role of Morphodynamic Simulations. J. Coast. Res. 2013, 65, 951–956. [Google Scholar] [CrossRef]
  36. Grases, A.; Gracia, V.; García-León, M.; Lin-Ye, J.; Sierra, J.P. Coastal Flooding and Erosion under a Changing Climate: Implications at a Low-Lying Coast (Ebro Delta). Water 2020, 12, 346. [Google Scholar] [CrossRef] [Green Version]
  37. Cabezas-Rabadán, C.; Pardo-Pascual, J.E.; Palomar-Vázquez, J.; Fernández-Sarría, A. Characterizing Beach Changes Using High-Frequency Sentinel-2 Derived Shorelines on the Valencian Coast (Spanish Mediterranean). Sci. Total Environ. 2019, 691, 216–231. [Google Scholar] [CrossRef]
  38. Gainza, J.; González, E.M.; Medina, R. A Process Based Shape Equation for a Static Equilibrium Beach Planform. Coast. Eng. 2018, 136, 119–129. [Google Scholar] [CrossRef]
  39. Enríquez, A.R.; Marcos, M.; Álvarez-Ellacuría, A.; Orfila, A.; Gomis, D. Changes in Beach Shoreline Due to Sea Level Rise and Waves under Climate Change Scenarios: Application to the Balearic Islands (Western Mediterranean). Nat. Hazards Earth Syst. Sci. Discuss. 2016, 1–25. [Google Scholar] [CrossRef] [Green Version]
  40. Gómez-Pujol, L.; Orfila, A.; Álvarez-Ellacuría, A.; Tintoré, J. Controls on Sediment Dynamics and Medium-Term Morphological Change in a Barred Microtidal Beach (Cala Millor, Mallorca, Western Mediterranean). Geomorphology 2011, 132, 87–98. [Google Scholar] [CrossRef]
  41. Alonso Heras, J. Proyecto de Recuperación de La Playa de Les Deveses, T.M. Dénia (Alicante); Ministerio para la Transición Ecológica: Madrid, Spain, 2018.
  42. Sancho-García, A.; Guillén, J.; Ojeda, E. Storm-Induced Readjustment of an Embayed Beach after Modification by Protection Works. Geo-Mar. Lett. 2013, 33, 159–172. [Google Scholar] [CrossRef] [Green Version]
  43. Bohr, J. “Reporting on Climate Change: A Computational Analysis of U.S. Newspapers and Sources of Bias, 1997–2017.”. Glob. Environ. Chang 2020, 61. [Google Scholar] [CrossRef]
Figure 1. Study area, location of the buoys (red), and tide gauges (blue) (source, Google satellite).
Jmse 09 00497 g001
Figure 2. Temporal evolution of the significant wave height (Hs) (data from [16]) during the storms January 2017 (a) and January 2020 (b), in several buoys, i.e., Begur (black solid line), Valencia (red line), Dragonera (blue line), and Cabo de Palos (black dashed line). See Figure 1 for buoy location.
Jmse 09 00497 g002
Figure 3. Regional distribution (by provinces) of the damage caused by the storms analyzed. January 2017: (a) raw damage; (b) damage normalized by the length of the coastline. January 2020: (c) raw damage; (d) damage normalized by the length of the coastline.
Jmse 09 00497 g003
Figure 4. Regional distribution of the total damage (TD) by municipalities for the January 2017 storm (left) and the January 2020 storm (right). Numbers refers to the location of the hotspots. (1) Playa de la Punta de la Tordera (Malgrat de Mar); (2) Platja del Pont de Petroli (Barcelona); (3) Sant Sebastià (Barcelona); (4) Les Cases d’Alcanar (Alcanar); (5) Malvarrosa (Valencia); (6) El Marenyet (Cullera); (7) Goleta (Tavernes de la Valldigna); (8) Les Deveses (Dénia); (9) Les Marines (Dénia); (10) La Grava (Jávea); (11) El Arenal (Jávea); (12) Playa de La Fossa (Calp); (13) Cala Millor (Son Servera); (14) Cala Moreia/Cala S’Illot (Sant Llorenç des Cardassar); (15) Porto Cristo (Manacor); (16) Playa de Levante (Cartagena).
Jmse 09 00497 g004
Figure 5. Regional distribution of the storm-induced damage in municipalities by the January 2017 storm. (a) Erosion; (b) inundation; (c) accumulation; (d) destruction.
Jmse 09 00497 g005
Figure 6. Regional distribution of the storm-induced damage in municipalities by the January 2020 storm. (a) Erosion; (b) inundation; (c) accumulation; (d) destruction.
Jmse 09 00497 g006
Figure 7. Examples of coastal damage at different locations during the January 2020 storm. (a) Destruction, erosion, and inundation at Almenara beach (Almenara, Castellón). Reproduced with permission from Ángel Sánchez (IG @angelsanchez_photo) 2021; (b) Inundation at Nules beach (Nules, Castellón). Reproduced with permission from Carmen Ripollés (IG @carmeripo) 2021. See the locations in Figure 4.
Jmse 09 00497 g007
Table 1. Coastline length (data from [17]) and number of beaches (data from [15]) in each coastal region.
RegionCoastline Length (km)Number of Beaches
Girona260187
Barcelona161113
Tarragona278131
Castellón13996
Valencia13566
Alicante244179
Mallorca606180
Murcia274200
Table 2. Newspapers sources used in this study.
Covered RegionNewspaperNewspaper Library Link
Catalonia (Girona, Barcelona, Tarragona)La Vanguardiahttps://www.lavanguardia.com/hemeroteca (accessed on 9 November 2020)
Valencian Community (Castellón, Valencia, Alicante)Las Provinciashttps://www.lasprovincias.es/hemeroteca/ (accessed on 18 December 2020)
Region of MurciaLa Verdadhttps://www.laverdad.es/hemeroteca/ (accessed on 12 December 2020)
Mallorca IslandDiario de Mallorcahttps://www.diariodemallorca.es/servicios/html/hemeroteca.html (accessed on 6 December 2020)
Table 3. Wave characteristics (maximum significant wave height (Hsmax) and the associated peak period (TpHsmax) and wave direction and the duration), maximum storm power index (SPImax),and wave energy (E) during the peak of the January 2017 storm, measured in different buoys. Wave data from [16].
BUOYHsmax
(m)
TpHmax
(s)
θHmax
(º Nmag)
Duration (h)SPImax (m2·h)E
(m2·s)
Coastline of Influence
Begur6.410.28132113,148418Girona
Barcelona5.210.61041373704287Barcelona
Tarragona6.210.5752298803404Tarragona/
Castellón
Valencia6.610.6712279888462Valencia/North of Alicante (Cabo la Nao)
Cabo de Palos6.69.5351968538414South of Alicante/Murcia
Dragonera (Mallorca)6.310.73330512,105425Mallorca (W)
Mahón6.510.75438116,097452Mallorca (E)
Table 4. Wave characteristics (maximum significant wave height (Hsmax) and the associated peak period (TpHsmax ) and wave direction and the duration), maximum storm power index (SPImax), and wave energy (E) during the peak of the Januray 2020 storm, measured at different buoys. Wave data obtained from [16].
BUOYHsmax
(m)
TpHmax
(s)
θHmax
(º Nmag)
Duration (h)SPImax (m2·h)E
(m2·s)
Coastline of Influence
Begur7.812.5621247544761Girona
Barcelona *3.6 *8.1 *73 *34 *441 *105 *Barcelona
Tarragona7.611.9841237104687Tarragona/
Castellón
Valencia8.411.751956703826Valencia/North of Alicante (Cabo la Nao)
Cabo de Palos611.7231174212421South of Alicante/Murcia
Dragonera (Mallorca)811.9281096976762Mallorca (W)
Mahón812.3871278128787Mallorca (E)
* Barcelona buoy stopped to register at the beginning of the peak of the storm.
Table 5. Maximum sea level measured at each tide gauge (ηmax) and sea level associated with the maximum wave height (ηHmax). Water level data from [16], except for Alicante and Murcia tide gauges (data is from [18]).
Tide GaugeJanuary 2017January 2020Coastline
ηmax (m)ηHsmax (m)ηmax (m)ηHsmax (m)
Barcelona 20.100.040.230.07Barcelona
Tarragona0.170.060.410.28Tarragona/Castellón
Valencia 30.310.220.510.37Valencia
Gandia0.350.300.620.55Gandia/North of Alicante (Cabo la Nao)
Alicante0.350.310.520.34South of Alicante
Murcia0.250.150.330.08Murcia
Palma de Mallorca0.21−0.040.110.02Mallorca (W)
Alcudia0.170.150.120.02Mallorca (E)
Table 6. Inundation index (ID) and runup (R2%) along the Spanish Mediterranean coast affected by the January 2017 and January 2020 storms, respectively.
CoastlineJanuary 2017January 2020
ID (m)R2% (m)ID (m)R2% (m)
Girona 1-2.98-4.03
Barcelona 22.832.79-
Tarragona/Castellón3.073.024.063.79
Valencia3.363.144.283.91
Gandia/North of Alicante (Cabo la Nao)3.453.144.473.91
Alicante (South)3.132.823.643.31
Murcia2.962.823.393.31
Mallorca (W)3.063.103.903.89
Mallorca (E)3.303.154.044.02
1 No water level measurements are available in this area. 2 Barcelona buoys failed to register before the peak of the January 2020 storm.
Publisher’s Note: MDPI stays neutral with regard to jurisdictional claims in published maps and institutional affiliations.

