
Use of Nanosilica for Increasing Dune Erosion Resistance during a Sea Storm

 , ,
, ,
Abstract
:1. Introduction
2. Laboratory Facility and Nanosilica Grout
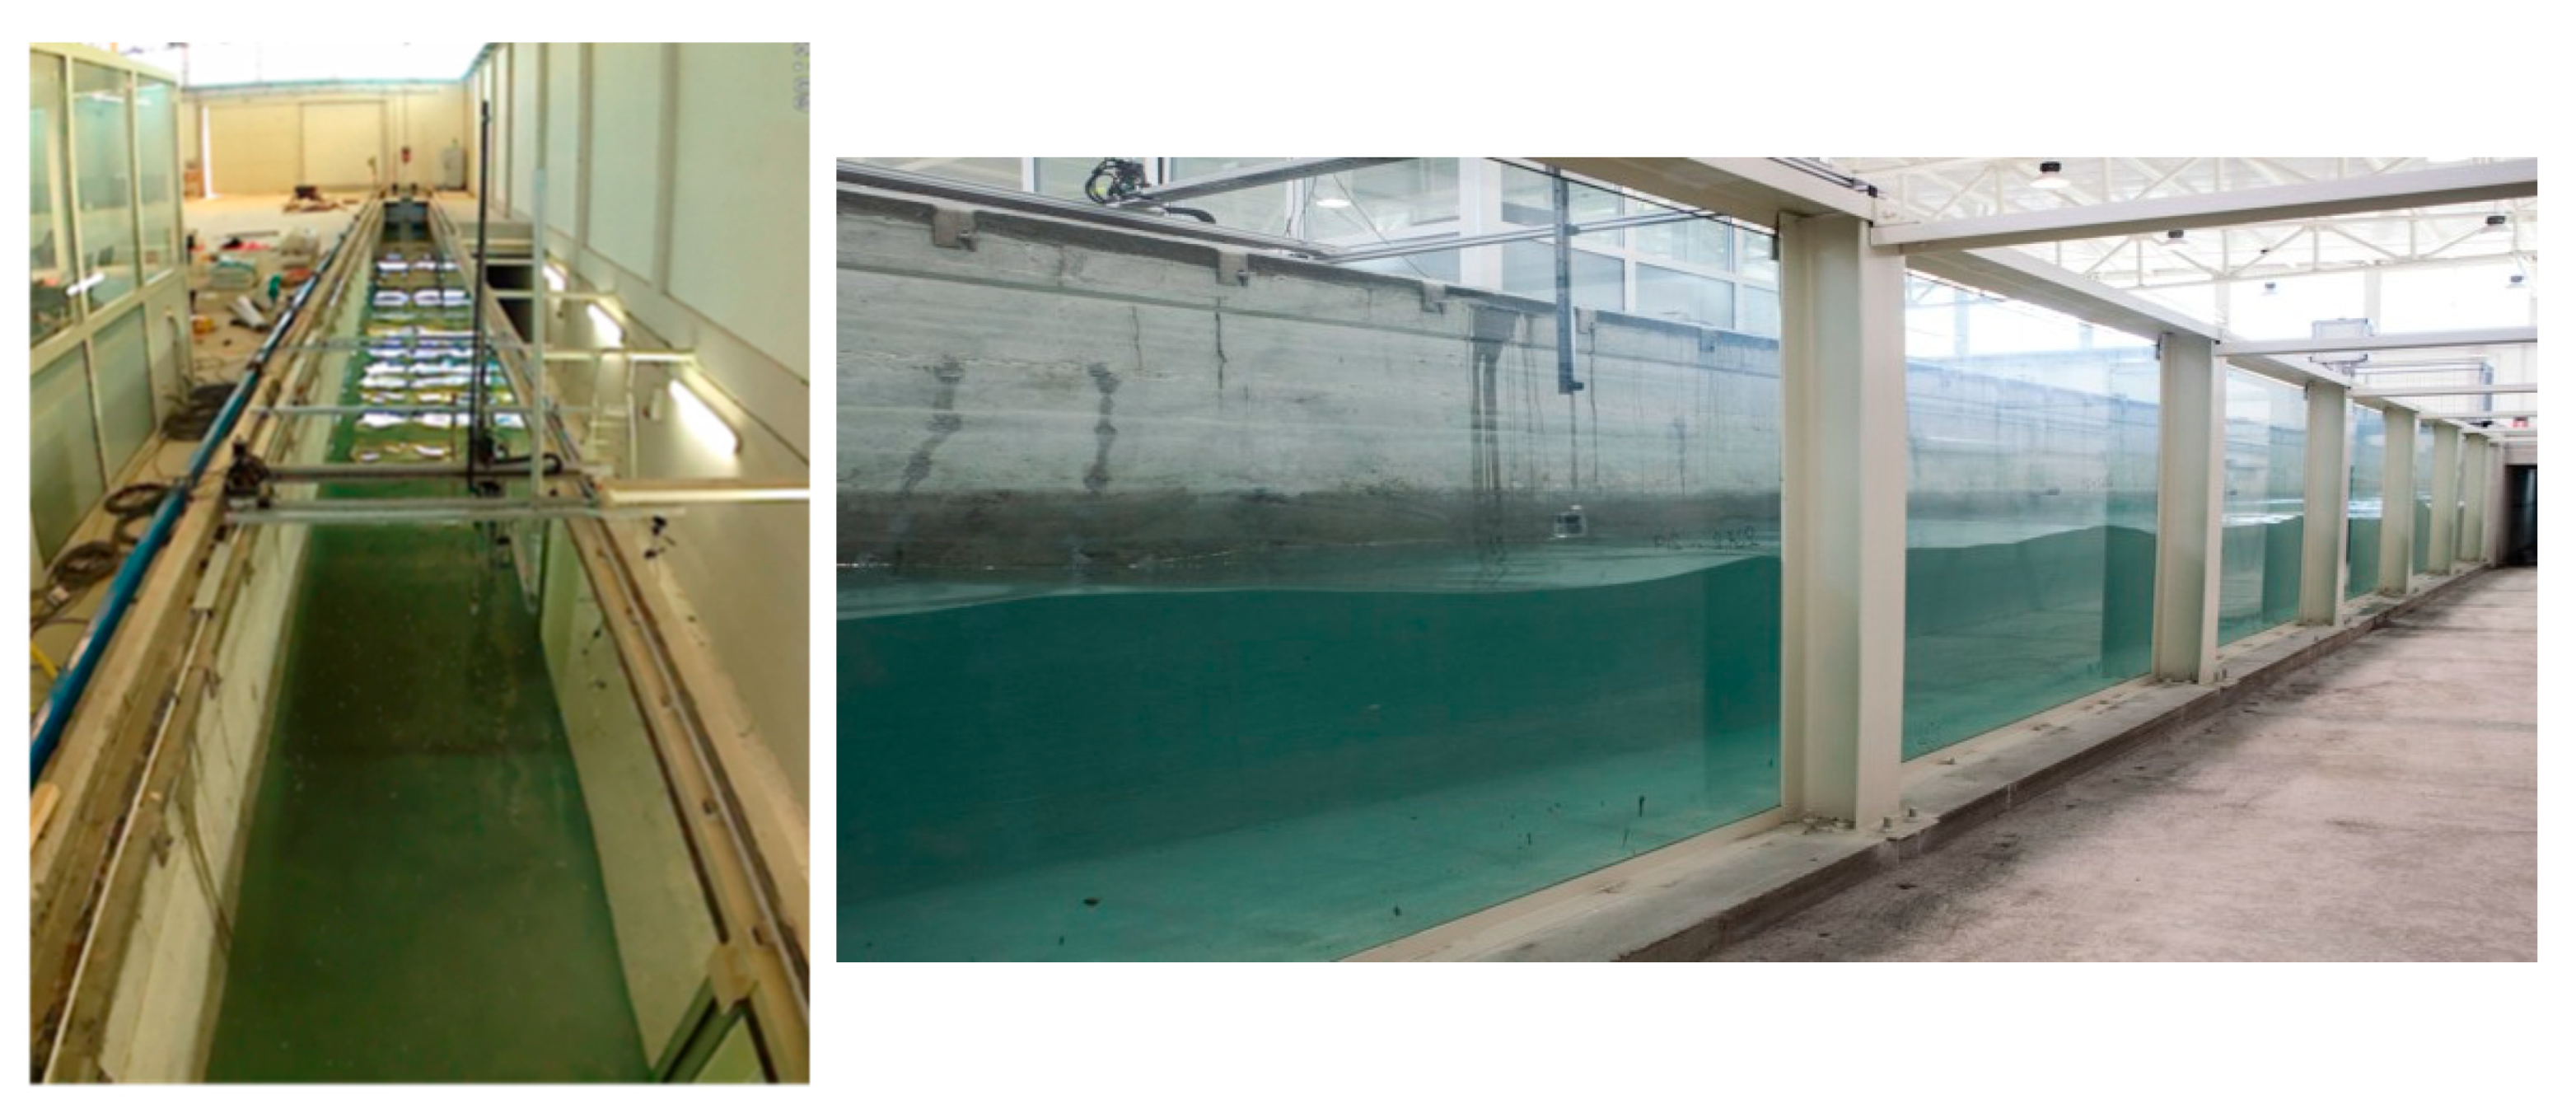
2.1. Experimental Facility
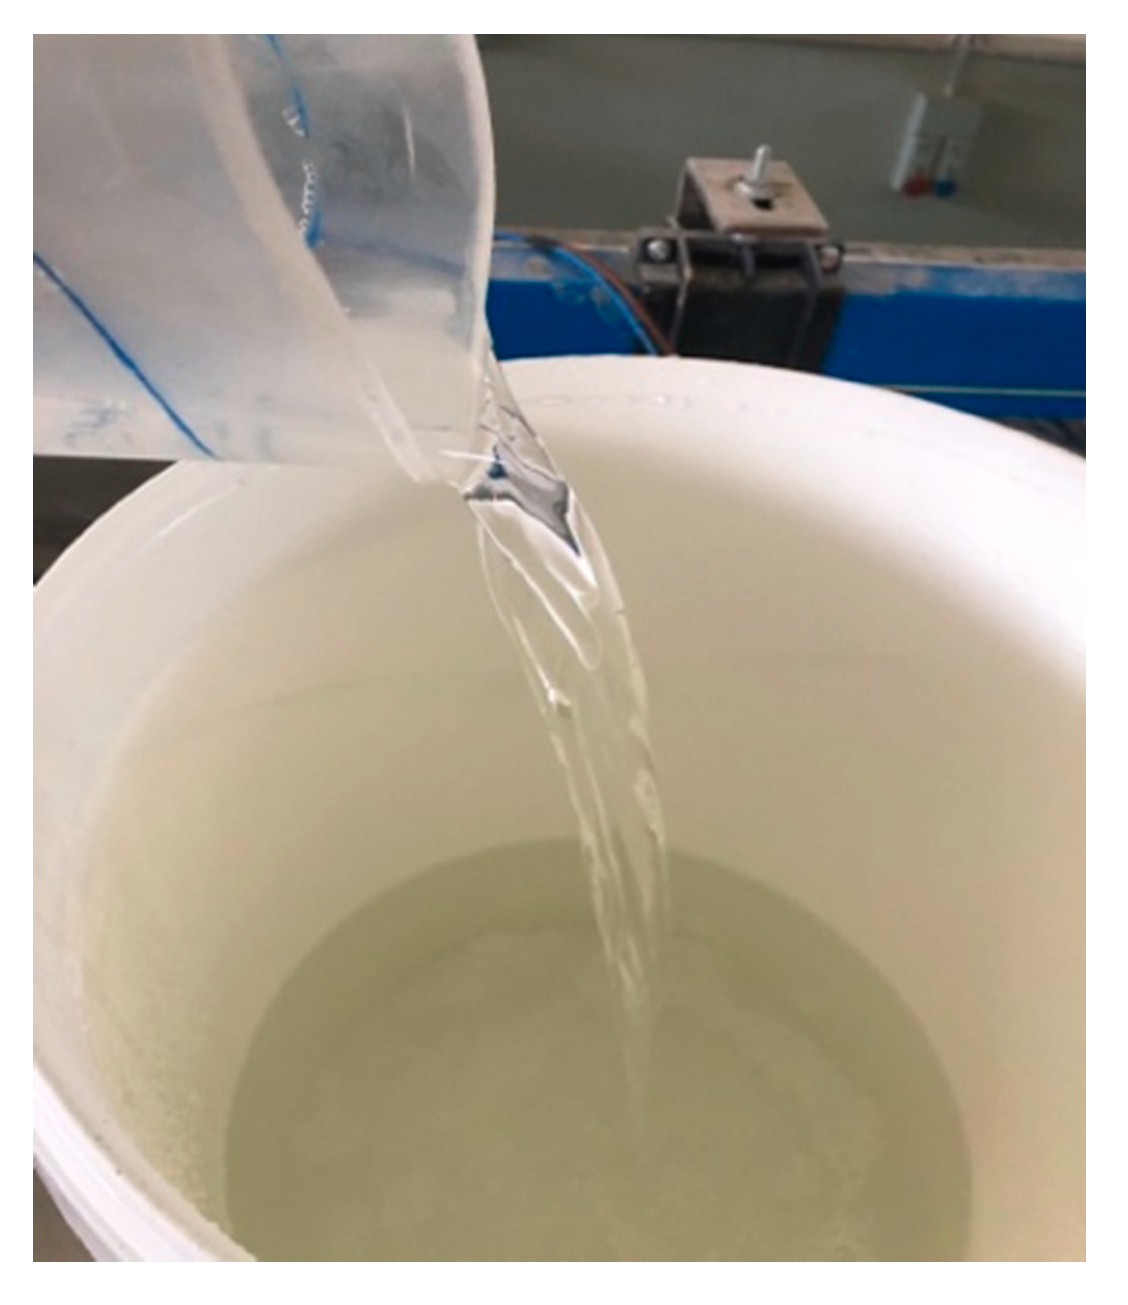
2.2. Nanosilica-Based Grout
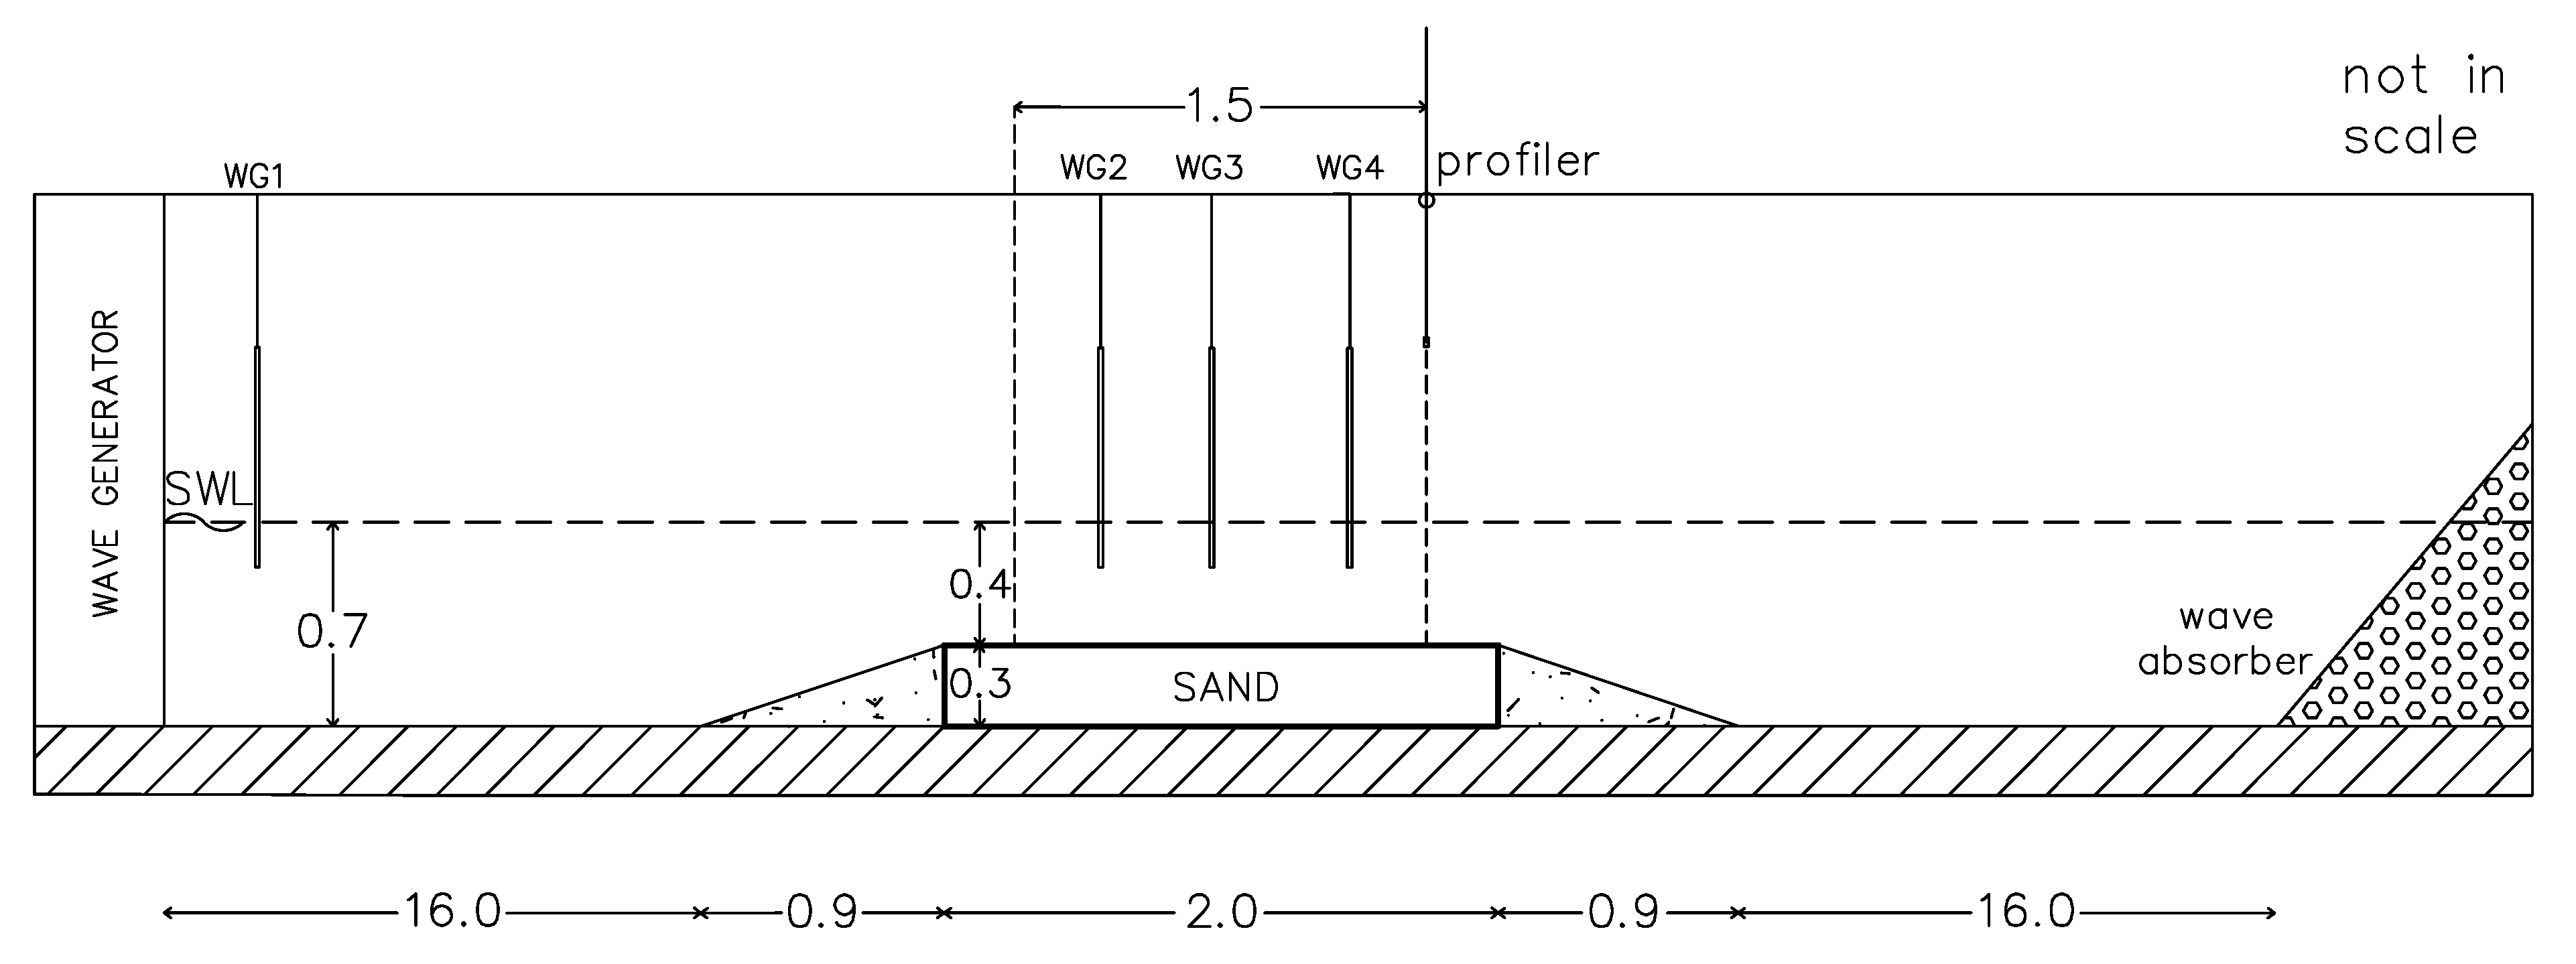
3. Horizontal Bed Experiments
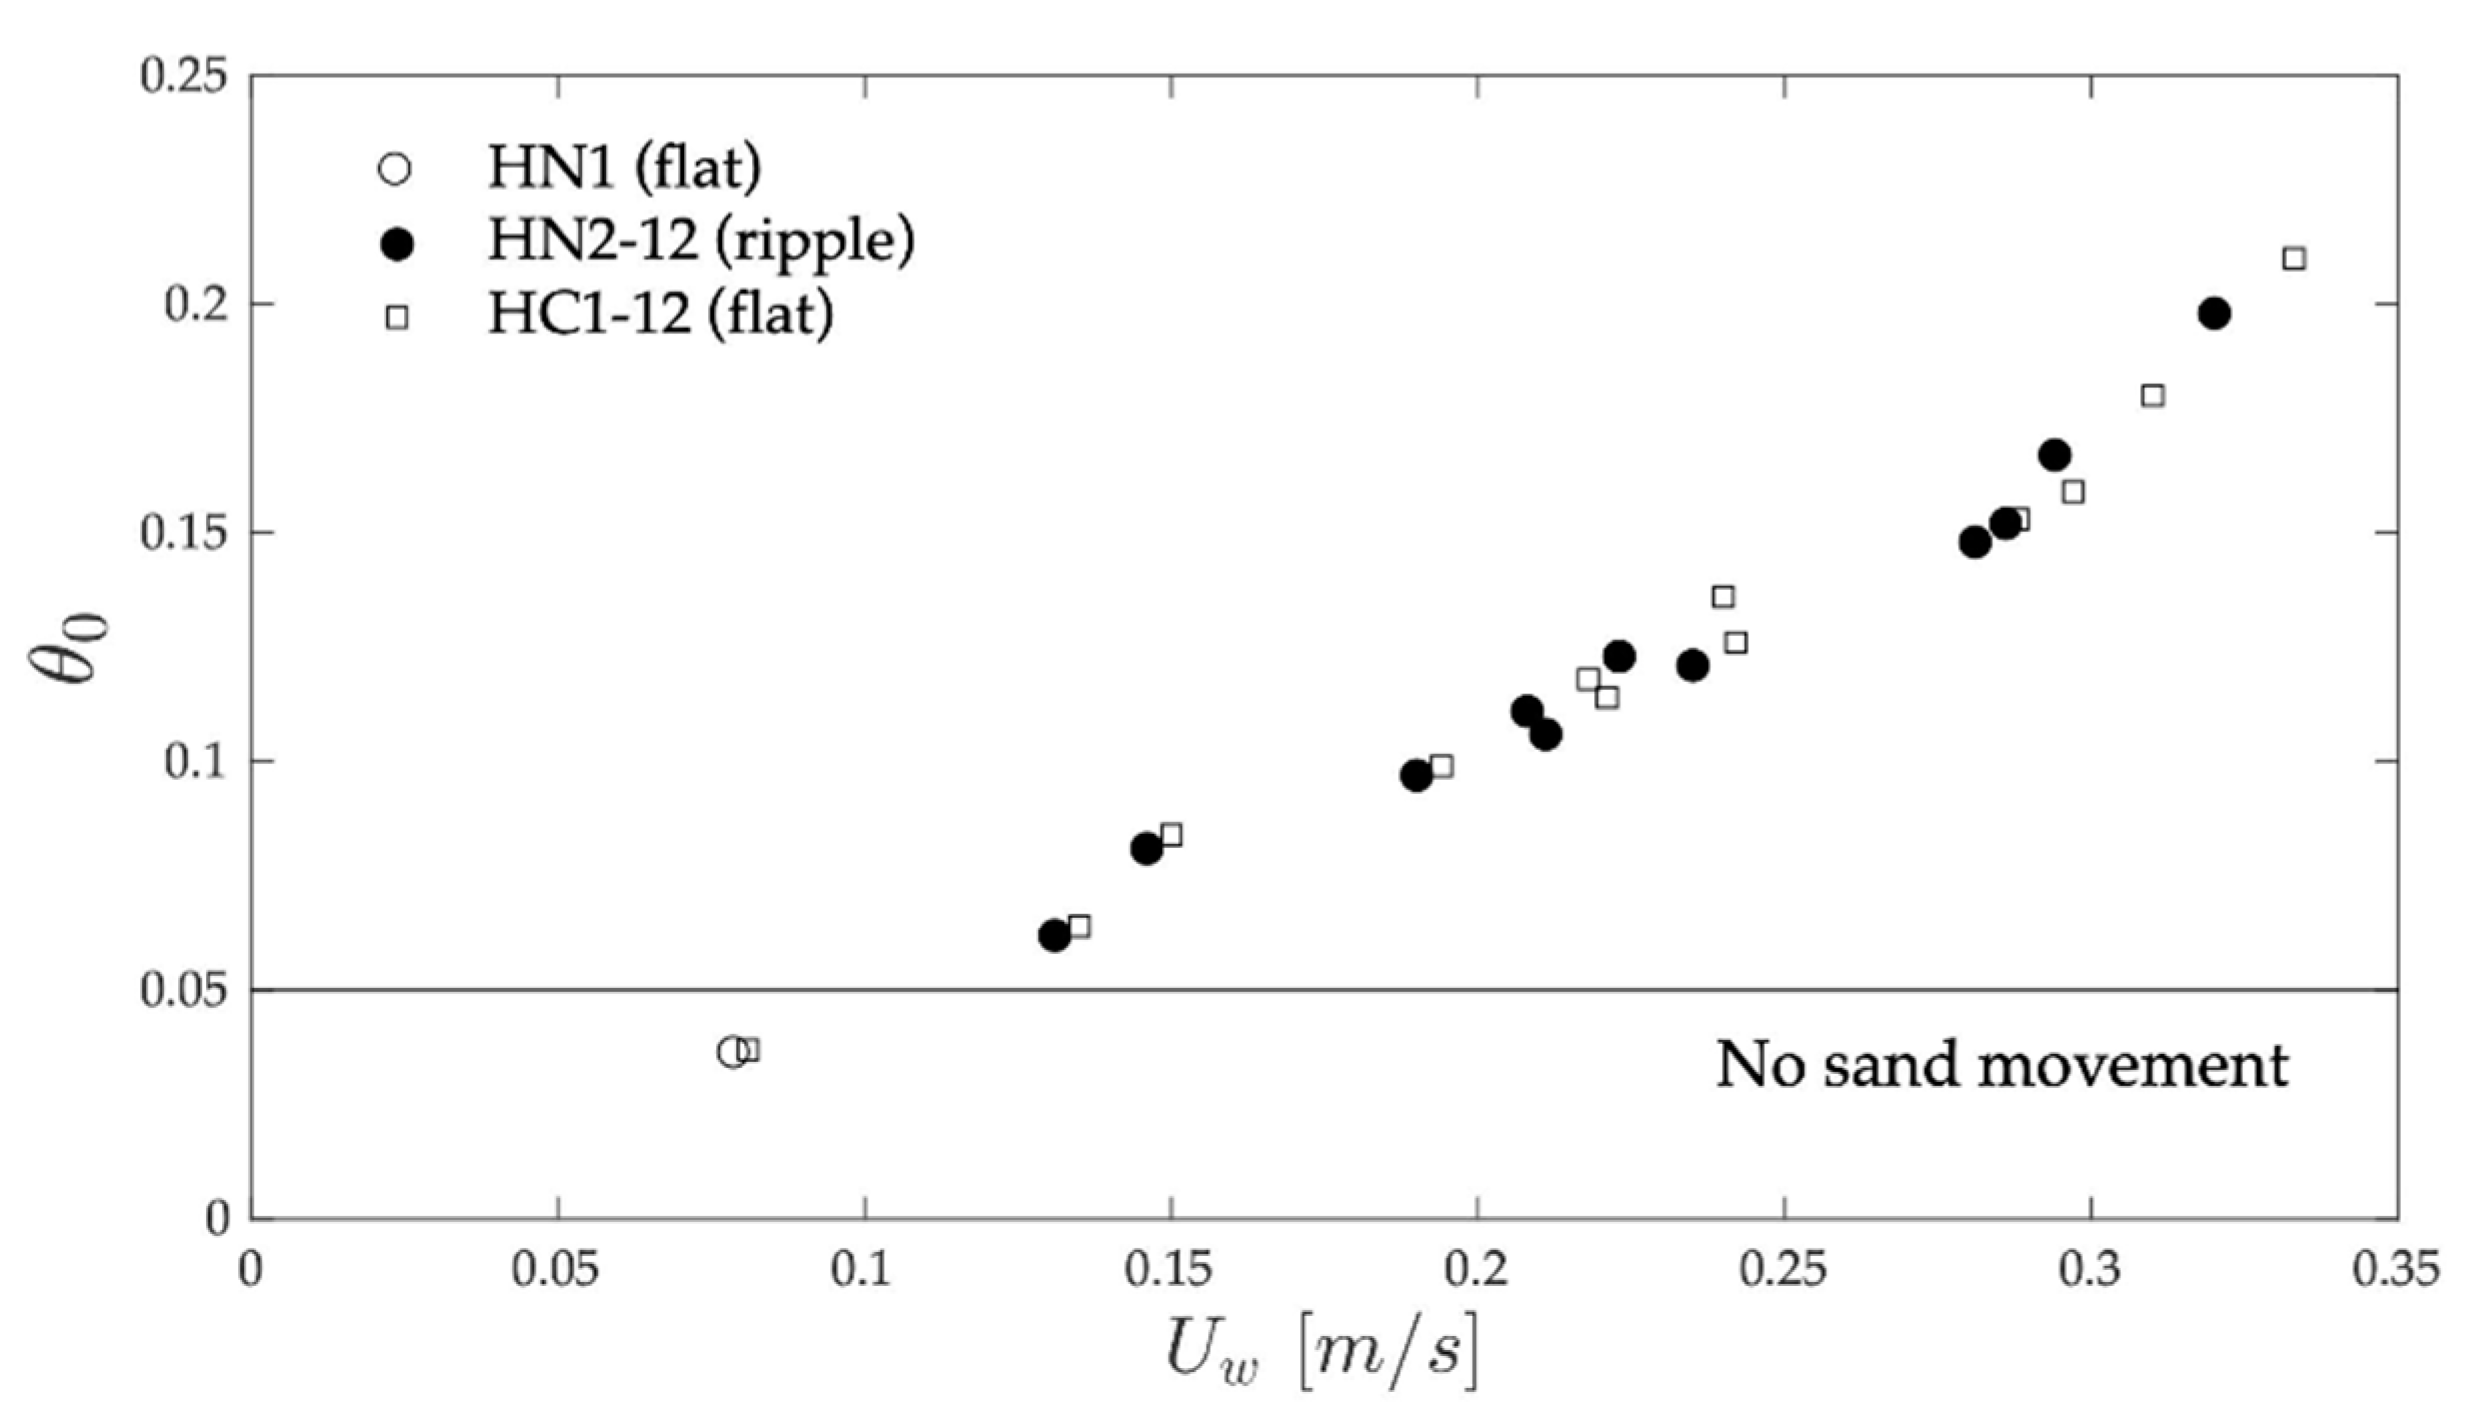
4. Movement of Natural and Consolidated Sands
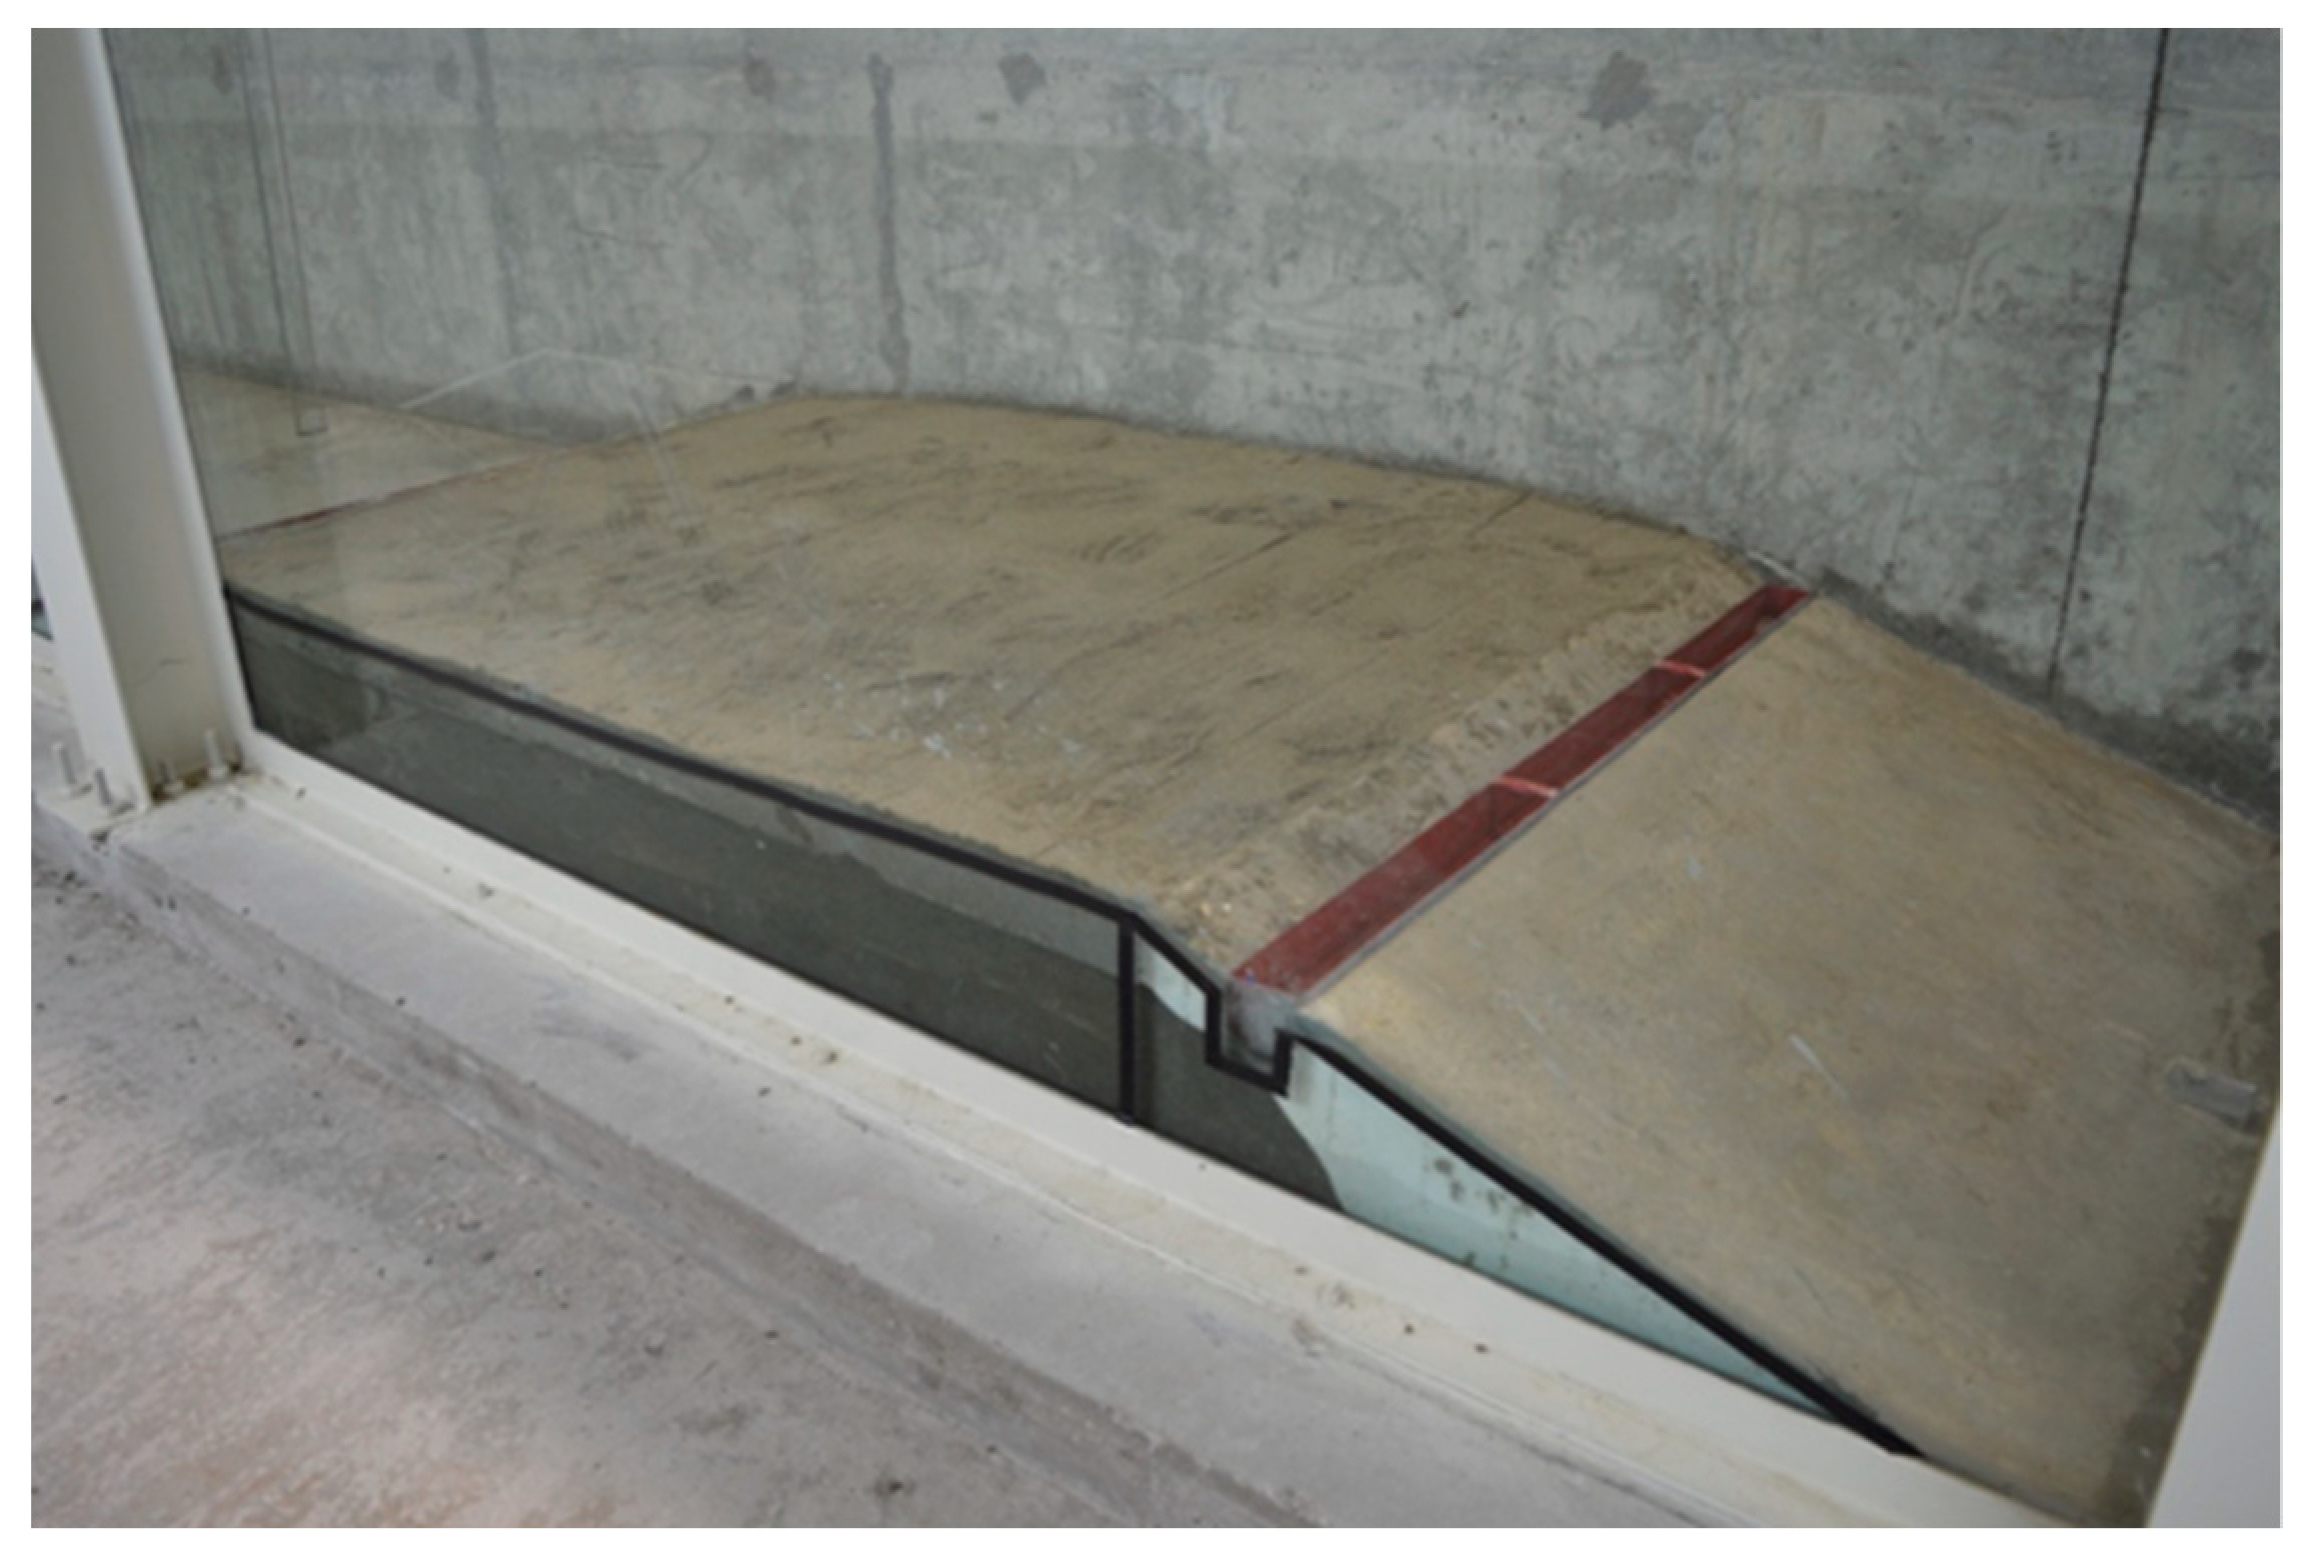
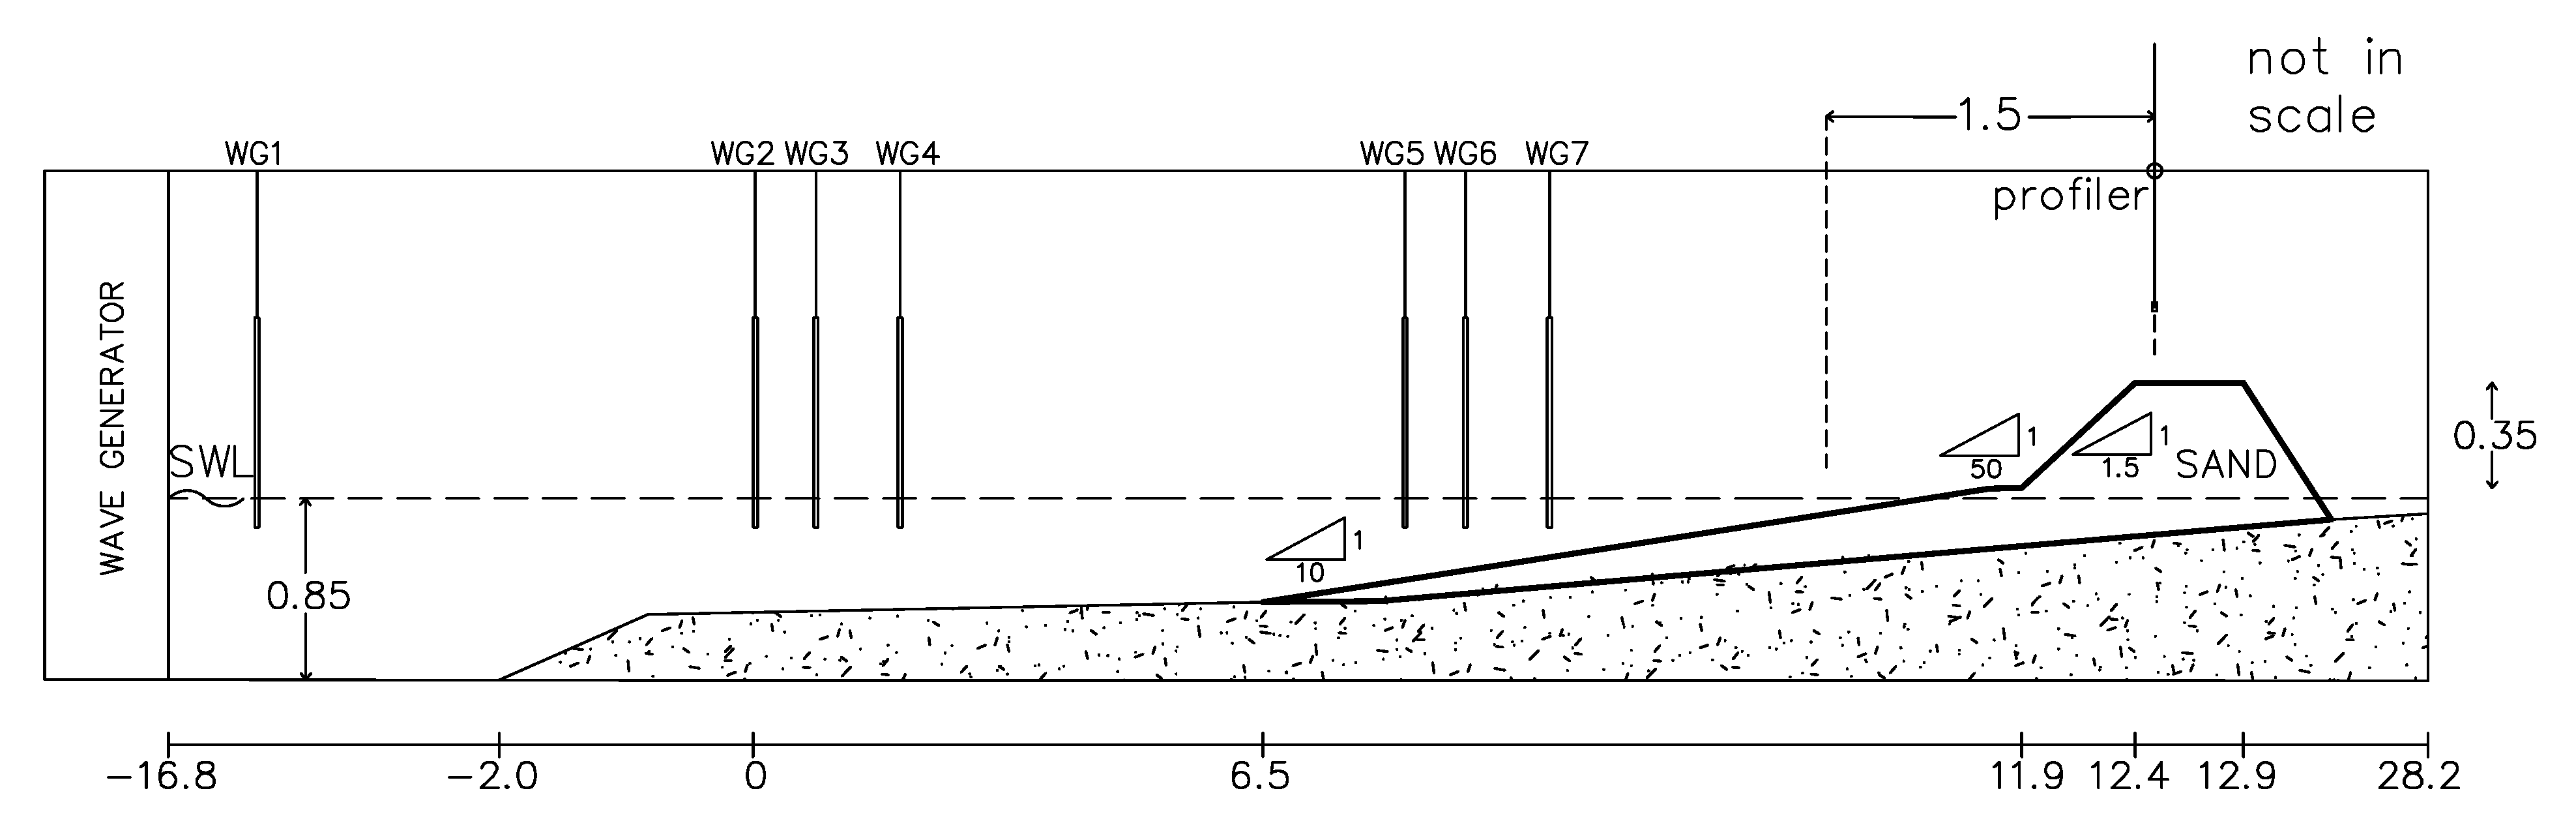
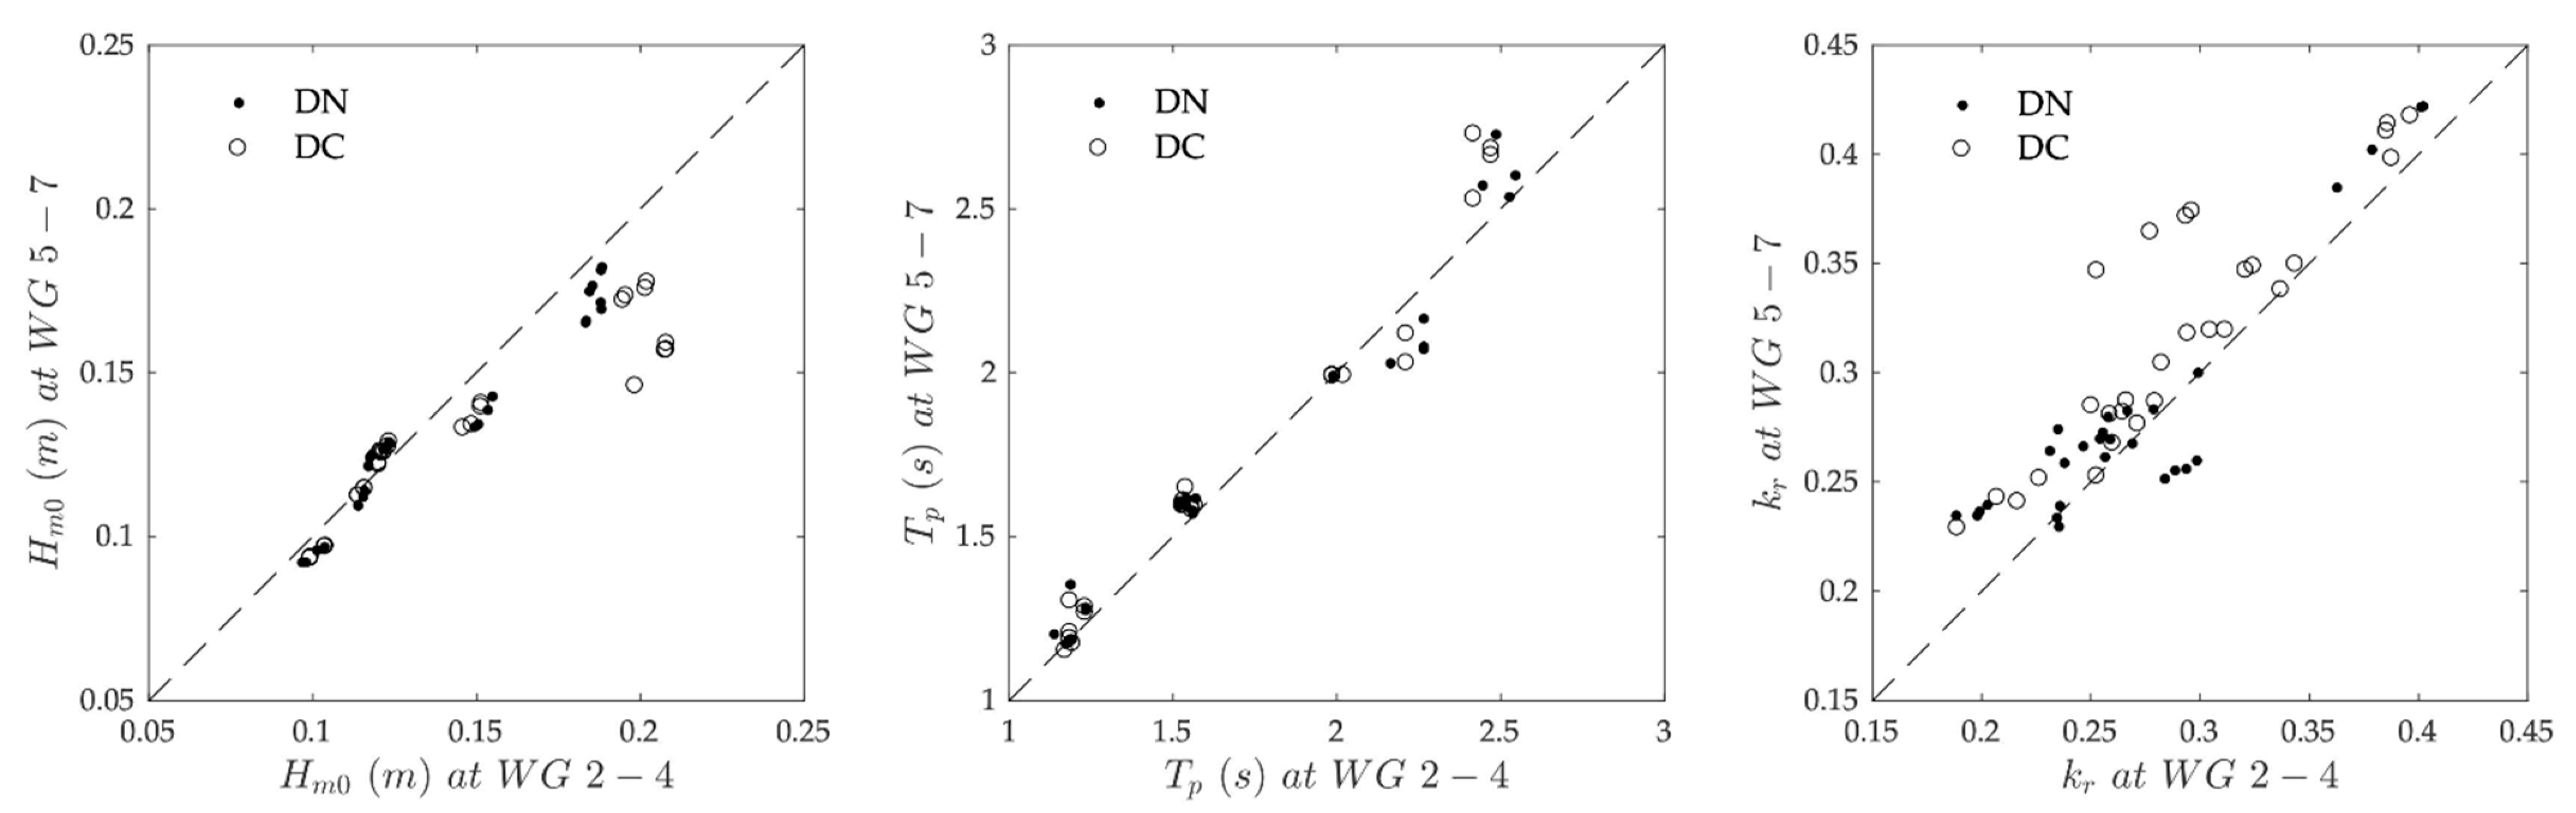
5. Dune Erosion Experiments
6. Erosion of Natural and Consolidated Dunes
7. Conclusions
Author Contributions
Funding
Institutional Review Board Statement
Informed Consent Statement
Data Availability Statement
Acknowledgments
Conflicts of Interest
References
- Taveira-Pinto, F.; Rosa-Santos, P.; Fazeres-Ferradosa, T. Anthropogenic influences on Integrated Coastal Zone Management. Rev. Gestão Costeira Integr. 2020, 20, 215–217. [Google Scholar] [CrossRef]
- Hamza, W.; Tomasicchio, G.R.; Ligorio, F.; Lusito, L.; Francone, A. A Nourishment Performance Index for Beach Ero-sion/Accretion at Saadiyat Island in Abu Dhabi. J. Mar. Sci. Eng. 2019, 7, 173. [Google Scholar] [CrossRef] [Green Version]
- Gann, G.D.; McDonald, T.; Walder, B.; Aronson, J.; Nelson, C.R.; Jonson, J.; Hallett, J.G.; Eisenberg, C.; Guariguata, M.R.; Liu, J.; et al. International principles and standards for the practice of ecological restoration. Second edition. Restor. Ecol. 2019, 27, S1–S46. [Google Scholar] [CrossRef] [Green Version]
- Gencarelli, R.; Johnson, B.; Kobayashi, N.; Tomasicchio, G.R. On dune erosion and breaching. In Proceedings of the 5th International Conference of Coastal Structures, Venice, Italy, 2–4 June 2007. [Google Scholar]
- Gencarelli, R.; Tomasicchio, G.R.; D’Alessandro, F.; Frega, F. Dune erosion prediction during storm surges. In Proceedings of the International Conference on the Application of Physical Modelling to Port and Coastal Protection—Coastlab 08, Bari, Italy, 2–5 July 2008; Nuova Editoriale BIOS: Cosenza, Italy; pp. 113–116, ISBN 978-88-6093-046-0. [Google Scholar]
- Martínez, M.L.; Hesp, P.A.; Gallego-Fernandez, J.B. Coastal Dune Restoration: Trends and Perspectives; Springer: Berlin/Heidelberg, Germany, 2013; pp. 323–339. [Google Scholar]
- Gencarelli, R.; Tomasicchio, G.R.; Kobayashi, N.; Johnson, B. Effects of Hurricane Isabel along the North Carolina Coastline: Beach Profile Evolution and Dune Erosion. In Proceedings of the 3rd SCACR—International Short Conference on Applied Coastal Research, Lecce, Italy, 2–4 June 2008. [Google Scholar]
- Fazeres-Ferradosa, T.; Welzel, M.; Schendel, A.; Baelus, L.; Santos, P.R.; Pinto, F.T. Extended characterization of damage in rubble mound scour protections. Coast. Eng. 2020, 158, 103671. [Google Scholar] [CrossRef]
- Maza, M.; Lara, J.L.; Losada, I.J. Experimental analysis of wave attenuation and drag forces in a realistic fringe Rhizophora mangrove forest. Adv. Water Resour. 2019, 131, 103376. [Google Scholar] [CrossRef]
- Kobayashi, N.; Gralher, C.; Do, K. Effects of Woody Plants on Dune Erosion and Overwash. J. Waterw. Port Coastal Ocean Eng. 2013, 139, 466–472. [Google Scholar] [CrossRef] [Green Version]
- Kutiel, P.; Kutiel, H.; Lavee, H. Vegetation response to possible scenarios of rainfall variations along a Mediterranean–extreme arid climatic transect. J. Arid. Environ. 2000, 44, 277–290. [Google Scholar] [CrossRef]
- Mason, T.; French, K.; Russell, K. Moderate impacts of plant invasion and management regimes in coastal hind dune seed banks. Biol. Conserv. 2007, 134, 428–439. [Google Scholar] [CrossRef]
- Jonsson, I.G. Wave Boundary Layers and Friction Factors. Coast. Eng. 1967, 127–148. [Google Scholar] [CrossRef]
- Madsen, O.S.; Grant, W.D. Quantitative Description of Sediment Transport by Waves. Coast. Eng. 1977, 1092–1112. [Google Scholar] [CrossRef]
- Sleath, J.F. Sea Bed Mechanics; Ocean Engineering; Wiley: New York, NY, USA, 1984. [Google Scholar]
- Nielsen, P. Coastal Bottom Boundary Layers and Sediment Transport; Tuh Tuck Link; World Scientific: Singapore, 1992; Volume 4. [Google Scholar]
- Fredsøe, J.; Deigaard, R. Mechanics of Coastal Sediment Transport; World Scientific: Singapore, 1992; Volume 3, p. 369. [Google Scholar]
- Van Rijn, L.C. Principles of Sediment Transport in Rivers, Estuaries and Coastal Seas; Aqua Publications: Amsterdam, The Netherlands, 1993; Volume 1006, pp. 11–13. [Google Scholar]
- Soulsby, R.L. Dynamics of marine sands: A manual for practical applications. Oceanogr. Lit. Rev. 1997, 9, 947. [Google Scholar]
- Nairn, R.B.; Southgate, H.N. Deterministic profile modelling of nearshore processes. Part 2. Sediment transport and beach profile development. Coast. Eng. 1993, 19, 57–96. [Google Scholar] [CrossRef]
- Kobayashi, N.; Johnson, B.D.; Karjadi, E.A. Cross-Shore Sand Transport on Beaches. Coast. Eng. 2001, 3165–3178. [Google Scholar] [CrossRef]
- Dean, R.G.; Dalrymple, R.A. Coastal Processes with Engineering Applications; Cambridge University Press: Cambridge, UK, 2002. [Google Scholar]
- Tomasicchio, G.R.; D’Alessandro, F.; Barbaro, G. Composite modelling for large-scale experiments on wave–dune interaction. J. Hydraul. Res. 2011, 49, 15–19. [Google Scholar] [CrossRef]
- Tomasicchio, G.R.; Sánchez-Arcilla, A.; D’Alessandro, F.; Ilic, S.; James, M.R.; Sancho, F.; Fortes, C.J.; Schüttrumpf, H. Large-scale experiments on dune erosion processes. J. Hydraul. Res. 2011, 49, 20–30. [Google Scholar] [CrossRef]
- D’Alessandro, F.; Tomasicchio, G.R. Wave–dune interaction and beach resilience in large-scale physical model tests. Coast. Eng. 2016, 116, 15–25. [Google Scholar] [CrossRef]
- D’Alessandro, F.; Tomasicchio, G.R.; Musci, F.; Ricca, A. Dune erosion physical, analytical and numerical modelling. In Proceedings of the Coastal Engineering, Santander, Spain, 14 December 2012. [Google Scholar]
- Sancho, F.; Abreu, T.; D’Alessandro, F.; Tomasicchio, G.R.; Silva, P.A. Surf hydrodynamics under collapsing coastal dunes. J. Coast. Res. 2011, 64, 144–148. [Google Scholar]
- Brunone, B.; Tomasicchio, G. Wave Kinematics at Steep Slopes: Second-Order Model. J. Waterw. Port Coast. Ocean Eng. 1997, 123, 223–232. [Google Scholar] [CrossRef]
- Paul, M.; Kamphuis, J.; Brebner, A. Similarity of Equilibrium Beach Profiles. Coast. Eng. 1972, 1217–1236. [Google Scholar] [CrossRef]
- Henry, P.Y.; Aberle, J. Hydralab+ Deliverable D8.3 Protocols for Scaling Morphodynamics in Time; Zendo: Genève, Switzerland, 2018. [Google Scholar]
- Wallingford, H.R. Wave Gauge System: User Manual. Available online: http://equipit.hrwallingford.com/products/wave-gauges/wave-gauge-systems-8-channels (accessed on 10 September 2019).
- Wallingford, H.R. 2D Bed Profiling System for Physical Models. Available online: https://www.hrwallingford.com/expertise/equipment-and-technology/instrumentation-and-software-physical-models (accessed on 10 September 2019).
- Chieregato, A.; Salazar, C.G.O.; Todaro, C.; Martinelli, D.; Peila, D. Test di Laboratorio di Iniezione per L’impermeabilizzazione e Consolidamento di Terreni Granulari per Mezzo di Materiali Innovativi; GEAM (GEoingegneria Ambientale e Mineraria): Milan, Italy, 2014. [Google Scholar]
- Mansard, E.; Funke, E. The Measurement of Incident and Reflected Spectra Using a Least Squares Method. Coast. Eng. 1980, 154–172. [Google Scholar] [CrossRef] [Green Version]
- Frostick, L.E.; McLelland, S.J.; Mercer, T.G. Users Guide to Physical Modelling and Experimentation: Experience of the HY-DRALAB Network; CRC Press: Boca Raton, FL, USA, 2011. [Google Scholar]
- Mariotti, G.; Fagherazzi, S. Wind waves on a mudflat: The influence of fetch and depth on bed shear stresses. Cont. Shelf Res. 2013, 60, S99–S110. [Google Scholar] [CrossRef]
- Zhu, Q.; van Prooijen, B.; Wang, Z.; Yang, S. Bed-level changes on intertidal wetland in response to waves and tides: A case study from the Yangtze River Delta. Mar. Geol. 2017, 385, 160–172. [Google Scholar] [CrossRef]
- Shi, B.; Cooper, J.R.; Pratolongo, P.D.; Gao, S.; Bouma, T.J.; Li, G.; Li, C.; Yang, S.; Wang, Y.P. Erosion and Accretion on a Mudflat: The Importance of Very Shallow-Water Effects. J. Geophys. Res. Oceans 2017, 122, 9476–9499. [Google Scholar] [CrossRef] [Green Version]
- Shields, A. Application of Similarity Principles and Turbulence Research to Bed-Load Movement. 1936. Available online: https://resolver.caltech.edu/CaltechKHR:HydroLabpub167 (accessed on 25 November 2019).
- Van Gent, M.; Steetzel, H.; Boers, M.; Smith, J.M.; Coeveld, E.; Walstra, D.; Van De Graaff, J. Dune erosion tests to study the influence of wave periods. In Proceedings of the 30th ICCE, San Diego, CA, USA, 3–8 September 2006. [Google Scholar]
- Zordan, J.; Juez, C.; Schleiss, A.J.; Franca, M.J. Entrainment, transport and deposition of sediment by saline gravity currents. Adv. Water Resour. 2018, 115, 17–32. [Google Scholar] [CrossRef]
- Vahdati, V.J.; Yaghoubi, S.; Torabipour, A.; Correia, J.A.; Fazeres-Ferradosa, T.; Taveira-Pinto, F. Combined solutions to reduce scour around complex foundations: An experimental study. Mar. Syst. Ocean Technol. 2020, 15, 81–93. [Google Scholar] [CrossRef]


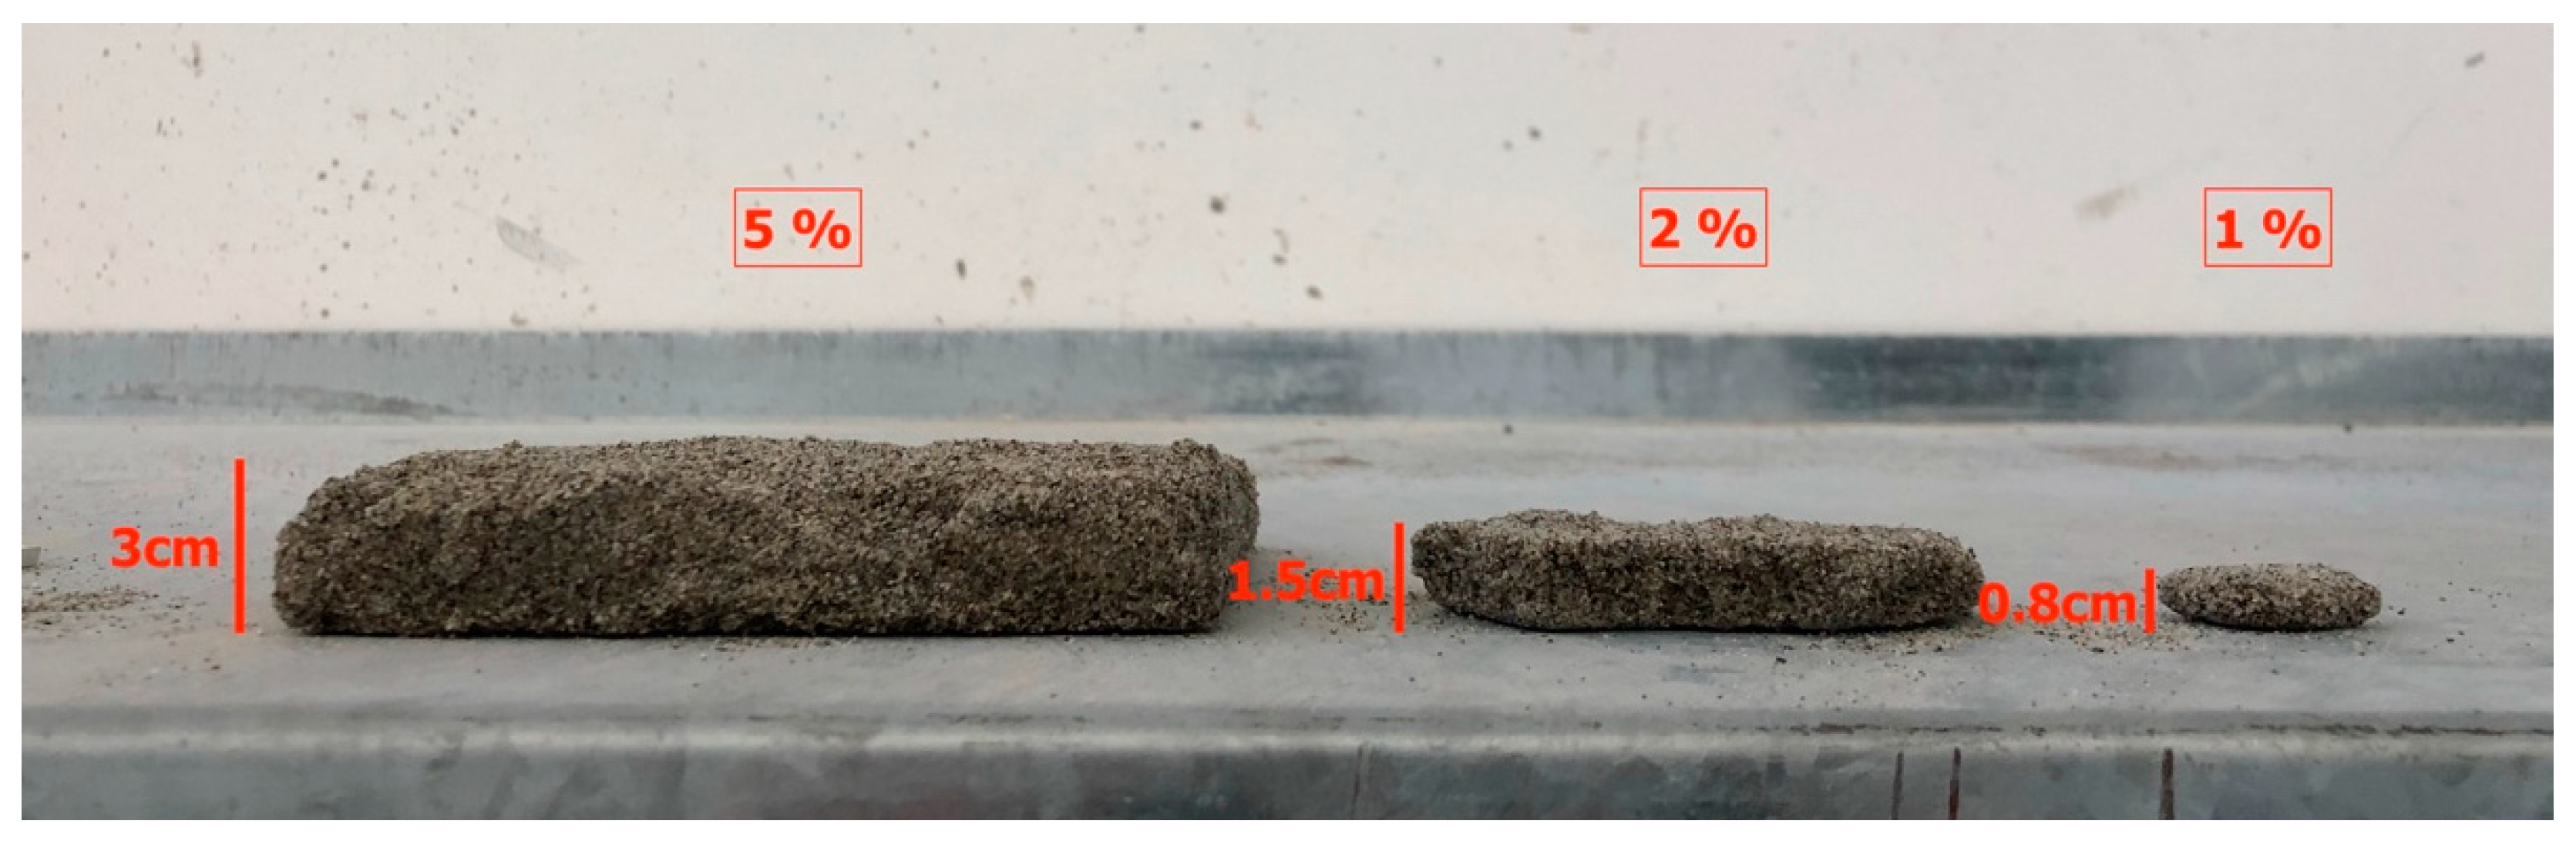
| Percentage of Nanosilica | hc [cm] | ε [-] |
|---|---|---|
| 5% | 3.0 | 0.20 |
| 2% | 1.5 | 0.24 |
| 1% | 0.8 | 0.25 |
| Test Group | Test Name | Wave Type | h [m] | H/Hm0 [m] | T/Tp [s] | Duration [s] |
|---|---|---|---|---|---|---|
| HN | HN1 | Regular | 0.40 | 0.116 | 1.00 | 180 |
| HN2 | 0.40 | 0.138 | 1.20 | 216 | ||
| HN3 | 0.50 | 0.153 | 1.79 | 324 | ||
| HN4 | 0.50 | 0.219 | 1.99 | 360 | ||
| HN5 | 0.60 | 0.195 | 1.79 | 324 | ||
| HN6 | 0.60 | 0.220 | 2.19 | 396 | ||
| HN7 | Irregular | 0.40 | 0.095 | 1.48 | 8145 | |
| HN8 | 0.40 | 0.118 | 1.79 | 2574 | ||
| HN9 | 0.50 | 0.146 | 2.01 | 2460 | ||
| HN10 | 0.50 | 0.183 | 2.42 | 1752 | ||
| HN11 | 0.60 | 0.182 | 2.15 | 1606 | ||
| HN12 | 0.60 | 0.206 | 2.41 | 1752 | ||
| HC | HC1 | Regular | 0.40 | 0.118 | 1.00 | 180 |
| HC2 | 0.40 | 0.141 | 1.20 | 216 | ||
| HC3 | 0.50 | 0.160 | 1.80 | 324 | ||
| HC4 | 0.50 | 0.227 | 2.00 | 360 | ||
| HC5 | 0.60 | 0.209 | 1.80 | 324 | ||
| HC6 | 0.60 | 0.231 | 2.19 | 396 | ||
| HC7 | Irregular | 0.40 | 0.097 | 1.48 | 8145 | |
| HC8 | 0.40 | 0.120 | 1.80 | 2574 | ||
| HC9 | 0.50 | 0.153 | 2.02 | 2460 | ||
| HC10 | 0.50 | 0.189 | 2.46 | 1752 | ||
| HC11 | 0.60 | 0.188 | 2.15 | 1606 | ||
| HC12 | 0.60 | 0.211 | 2.42 | 1752 |
| Wave Gauge (WG) | WG1 | WG2 | WG3 | WG4 | WG5 | WG6 | WG7 |
|---|---|---|---|---|---|---|---|
| Onshore X [m] | −15.8 | 0 | 0.4 | 0.9 | 7.0 | 7.3 | 7.7 |
| Depth [m] | 0.85 | 0.53 | 0.53 | 0.52 | 0.44 | 0.41 | 0.38 |
| Test | Run | Hm0 [m] | Tp [s] | s [-] | kr [-] | Test | Run | Hm0 [m] | Tp [s] | s [-] | kr [-] |
|---|---|---|---|---|---|---|---|---|---|---|---|
| DN1 | 1 | 0.101 | 1.17 | 0.047 | 0.203 | DC1 | 1 | 0.104 | 1.17 | 0.048 | 0.189 |
| 2 | 0.104 | 1.14 | 0.051 | 0.199 | 2 | 0.104 | 1.20 | 0.047 | 0.207 | ||
| 3 | 0.098 | 1.19 | 0.044 | 0.198 | 3 | 0.100 | 1.19 | 0.045 | 0.217 | ||
| 4 | 0.097 | 1.19 | 0.044 | 0.188 | 4 | 0.100 | 1.19 | 0.045 | 0.227 | ||
| DN2 | 1 | 0.116 | 1.56 | 0.030 | 0.257 | DC2 | 1 | 0.116 | 1.56 | 0.031 | 0.253 |
| 2 | 0.115 | 1.56 | 0.030 | 0.236 | 2 | 0.116 | 1.56 | 0.031 | 0.260 | ||
| 3 | 0.114 | 1.57 | 0.030 | 0.235 | 3 | 0.114 | 1.57 | 0.030 | 0.272 | ||
| 4 | 0.114 | 1.54 | 0.031 | 0.235 | 4 | 0.114 | 1.53 | 0.031 | 0.280 | ||
| DN3 | 1 | 0.118 | 1.99 | 0.019 | 0.299 | DC3 | 1 | 0.121 | 1.99 | 0.020 | 0.337 |
| 2 | 0.118 | 1.99 | 0.019 | 0.279 | 2 | 0.121 | 2.02 | 0.019 | 0.344 | ||
| 3 | 0.117 | 2.16 | 0.016 | 0.258 | 3 | 0.120 | 2.21 | 0.016 | 0.321 | ||
| 4 | 0.117 | 2.27 | 0.015 | 0.238 | 4 | 0.120 | 2.21 | 0.016 | 0.325 | ||
| DN4 | 1 | 0.123 | 2.49 | 0.013 | 0.402 | DC4 | 1 | 0.124 | 2.42 | 0.014 | 0.388 |
| 2 | 0.123 | 2.45 | 0.013 | 0.401 | 2 | 0.123 | 2.42 | 0.013 | 0.397 | ||
| 3 | 0.122 | 2.55 | 0.012 | 0.379 | 3 | 0.122 | 2.47 | 0.013 | 0.386 | ||
| 4 | 0.122 | 2.53 | 0.012 | 0.363 | 4 | 0.122 | 2.47 | 0.013 | 0.386 | ||
| DN5 | 1 | 0.155 | 1.23 | 0.065 | 0.256 | DC5 | 1 | 0.152 | 1.23 | 0.064 | 0.259 |
| 2 | 0.154 | 1.23 | 0.065 | 0.269 | 2 | 0.152 | 1.23 | 0.064 | 0.265 | ||
| 3 | 0.150 | 1.19 | 0.068 | 0.247 | 3 | 0.149 | 1.19 | 0.068 | 0.267 | ||
| 4 | 0.151 | 1.19 | 0.068 | 0.254 | 4 | 0.146 | 1.19 | 0.066 | 0.251 | ||
| DN6 | 1 | 0.188 | 1.52 | 0.052 | 0.299 | DC6 | 1 | 0.202 | 1.53 | 0.055 | 0.283 |
| 2 | 0.188 | 1.52 | 0.052 | 0.294 | 2 | 0.202 | 1.53 | 0.055 | 0.295 | ||
| 3 | 0.184 | 1.52 | 0.051 | 0.289 | 3 | 0.196 | 1.54 | 0.053 | 0.305 | ||
| 4 | 0.183 | 1.54 | 0.049 | 0.284 | 4 | 0.195 | 1.56 | 0.051 | 0.312 | ||
| DN7 | 1 | 0.188 | 1.99 | 0.030 | 0.259 | DC7 | 1 | 0.208 | 1.99 | 0.034 | 0.278 |
| 2 | 0.188 | 1.99 | 0.030 | 0.267 | 2 | 0.208 | 1.99 | 0.034 | 0.294 | ||
| 3 | 0.185 | 2.27 | 0.023 | 0.235 | 3 | 0.208 | 1.99 | 0.034 | 0.297 | ||
| 4 | 0.185 | 2.27 | 0.023 | 0.231 | 4 | 0.199 | 1.99 | 0.032 | 0.244 |
| Test | Run | s [-] | Ae [m2] | [-] | test | Run | s [-] | Ae [m2] | [-] |
|---|---|---|---|---|---|---|---|---|---|
| DN1 | 1 | 0.047 | 0.0018 | 0.175 | DC1 | 1 | 0.048 | 0.0001 | 0.009 |
| 2 | 0.051 | 0.0019 | 0.177 | 2 | 0.047 | 0.0001 | 0.009 | ||
| 3 | 0.044 | 0.0020 | 0.209 | 3 | 0.045 | 0.0001 | 0.010 | ||
| 4 | 0.044 | 0.0022 | 0.235 | 4 | 0.045 | 0.0002 | 0.020 | ||
| DN2 | 1 | 0.030 | 0.0045 | 0.336 | DC2 | 1 | 0.031 | 0.0001 | 0.007 |
| 2 | 0.030 | 0.0059 | 0.443 | 2 | 0.031 | 0.0001 | 0.007 | ||
| 3 | 0.030 | 0.0081 | 0.625 | 3 | 0.030 | 0.0002 | 0.015 | ||
| 4 | 0.031 | 0.0087 | 0.671 | 4 | 0.031 | 0.0002 | 0.015 | ||
| DN3 | 1 | 0.019 | 0.0032 | 0.229 | DC3 | 1 | 0.020 | 0.0001 | 0.007 |
| 2 | 0.019 | 0.0049 | 0.355 | 2 | 0.019 | 0.0002 | 0.014 | ||
| 3 | 0.016 | 0.0050 | 0.365 | 3 | 0.016 | 0.0002 | 0.014 | ||
| 4 | 0.015 | 0.0068 | 0.497 | 4 | 0.016 | 0.0004 | 0.028 | ||
| DN4 | 1 | 0.013 | 0.0150 | 0.985 | DC4 | 1 | 0.014 | 0.0001 | 0.007 |
| 2 | 0.013 | 0.0208 | 1.370 | 2 | 0.013 | 0.0001 | 0.007 | ||
| 3 | 0.012 | 0.0227 | 1.525 | 3 | 0.013 | 0.0001 | 0.007 | ||
| 4 | 0.012 | 0.0247 | 1.673 | 4 | 0.013 | 0.0002 | 0.013 | ||
| DN5 | 1 | 0.065 | 0.0026 | 0.108 | DC5 | 1 | 0.064 | 0.0001 | 0.003 |
| 2 | 0.065 | 0.0035 | 0.149 | 2 | 0.064 | 0.0001 | 0.004 | ||
| 3 | 0.068 | 0.0037 | 0.166 | 3 | 0.068 | 0.0002 | 0.009 | ||
| 4 | 0.068 | 0.0047 | 0.207 | 4 | 0.066 | 0.0002 | 0.009 | ||
| DN6 | 1 | 0.052 | 0.0049 | 0.139 | DC6 | 1 | 0.055 | 0.0001 | 0.002 |
| 2 | 0.052 | 0.0069 | 0.195 | 2 | 0.055 | 0.0002 | 0.005 | ||
| 3 | 0.051 | 0.0101 | 0.300 | 3 | 0.053 | 0.0002 | 0.005 | ||
| 4 | 0.049 | 0.0152 | 0.452 | 4 | 0.051 | 0.0101 | 0.265 | ||
| DN7 | 1 | 0.030 | 0.0116 | 0.327 | DC7 | 1 | 0.034 | 0.0001 | 0.002 |
| 2 | 0.030 | 0.0121 | 0.342 | 2 | 0.034 | 0.0001 | 0.002 | ||
| 3 | 0.023 | 0.0186 | 0.541 | 3 | 0.034 | 0.0001 | 0.002 | ||
| 4 | 0.023 | 0.0227 | 0.667 | 4 | 0.032 | 0.0123 | 0.312 |
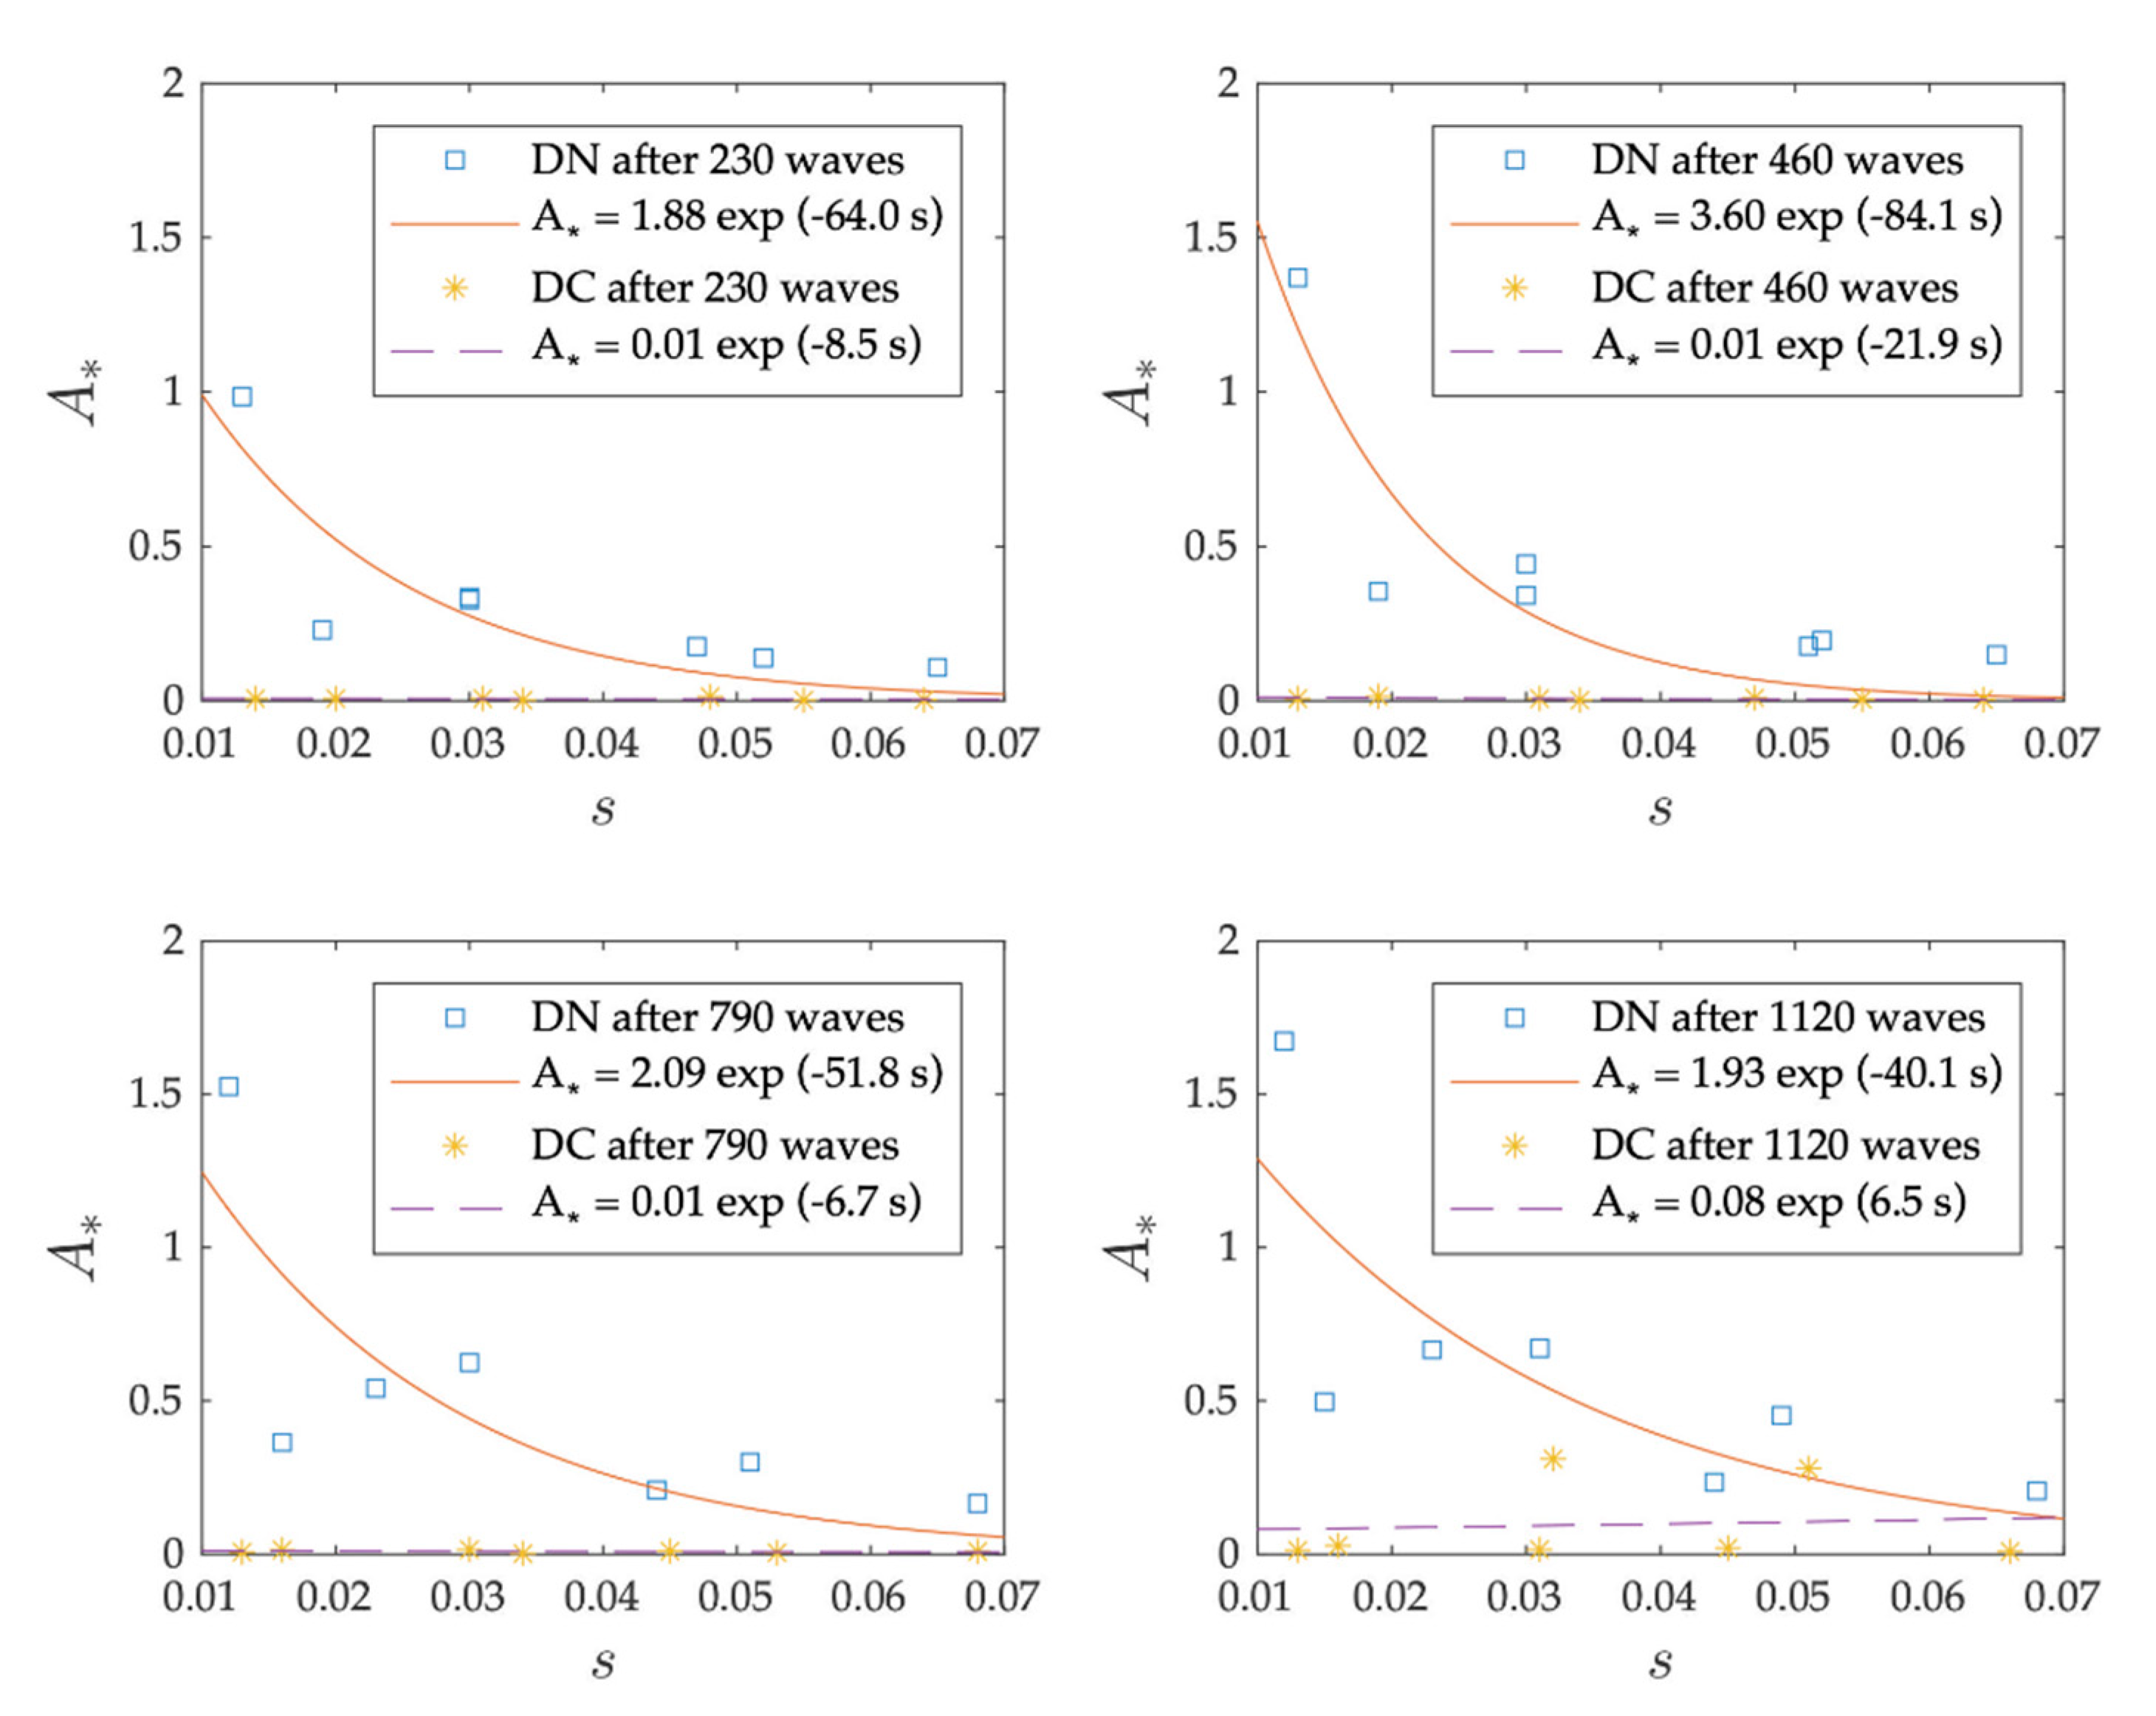
| N | a | b |
|---|---|---|
| 230 | 1.88 | 64.0 |
| 460 | 3.60 | 84.1 |
| 790 | 2.09 | 51.8 |
| 1120 | 1.93 | 40.1 |
| Test | Hm0 [m] | Tp [s] | s [-] | N | R | |
|---|---|---|---|---|---|---|
| DC1 | 0.104 | 1.17 | 0.048 | 230 | 0.09 | 0.10 |
| 0.104 | 1.20 | 0.047 | 460 | 0.05 | 0.19 | |
| 0.100 | 1.19 | 0.045 | 790 | 0.21 | 0.05 | |
| 0.100 | 1.19 | 0.045 | 1120 | 0.33 | 0.06 | |
| DC2 | 0.116 | 1.56 | 0.031 | 230 | 0.27 | 0.03 |
| 0.116 | 1.56 | 0.031 | 460 | 0.28 | 0.03 | |
| 0.114 | 1.57 | 0.030 | 790 | 0.45 | 0.03 | |
| 0.114 | 1.53 | 0.031 | 1120 | 0.56 | 0.03 | |
| DC3 | 0.121 | 1.99 | 0.020 | 230 | 0.55 | 0.01 |
| 0.121 | 2.02 | 0.019 | 460 | 0.73 | 0.02 | |
| 0.120 | 2.21 | 0.016 | 790 | 0.91 | 0.02 | |
| 0.120 | 2.21 | 0.016 | 1120 | 1.08 | 0.03 | |
| DC4 | 0.124 | 2.42 | 0.014 | 230 | 0.83 | 0.01 |
| 0.123 | 2.42 | 0.013 | 460 | 1.19 | 0.01 | |
| 0.122 | 2.47 | 0.013 | 790 | 1.12 | 0.01 | |
| 0.122 | 2.47 | 0.013 | 1120 | 1.18 | 0.01 | |
| DC5 | 0.152 | 1.23 | 0.064 | 230 | 0.03 | 0.11 |
| 0.152 | 1.23 | 0.064 | 460 | 0.02 | 0.28 | |
| 0.149 | 1.19 | 0.068 | 790 | 0.06 | 0.14 | |
| 0.146 | 1.19 | 0.066 | 1120 | 0.12 | 0.08 | |
| DC6 | 0.202 | 1.53 | 0.055 | 230 | 0.07 | 0.02 |
| 0.202 | 1.53 | 0.055 | 460 | 0.04 | 0.11 | |
| 0.196 | 1.54 | 0.053 | 790 | 0.15 | 0.03 | |
| 0.195 | 1.56 | 0.051 | 1120 | 0.27 | 0.99 | |
| DC7 | 0.208 | 1.99 | 0.034 | 230 | 0.27 | 0.01 |
| 0.208 | 1.99 | 0.034 | 460 | 0.28 | 0.01 | |
| 0.208 | 1.99 | 0.034 | 790 | 0.63 | 0.01 | |
| 0.199 | 1.99 | 0.032 | 1120 | 0.77 | 0.40 |
Publisher’s Note: MDPI stays neutral with regard to jurisdictional claims in published maps and institutional affiliations. |
© 2021 by the authors. Licensee MDPI, Basel, Switzerland. This article is an open access article distributed under the terms and conditions of the Creative Commons Attribution (CC BY) license (https://creativecommons.org/licenses/by/4.0/).
Share and Cite
Leone, E.; Kobayashi, N.; Francone, A.; Bartolo, S.D.; Strafella, D.; D’Alessandro, F.; Tomasicchio, G.R. Use of Nanosilica for Increasing Dune Erosion Resistance during a Sea Storm. J. Mar. Sci. Eng. 2021, 9, 620. https://doi.org/10.3390/jmse9060620
Leone E, Kobayashi N, Francone A, Bartolo SD, Strafella D, D’Alessandro F, Tomasicchio GR. Use of Nanosilica for Increasing Dune Erosion Resistance during a Sea Storm. Journal of Marine Science and Engineering. 2021; 9(6):620. https://doi.org/10.3390/jmse9060620
Chicago/Turabian StyleLeone, Elisa, Nobuhisa Kobayashi, Antonio Francone, Samuele De Bartolo, Davide Strafella, Felice D’Alessandro, and Giuseppe Roberto Tomasicchio. 2021. "Use of Nanosilica for Increasing Dune Erosion Resistance during a Sea Storm" Journal of Marine Science and Engineering 9, no. 6: 620. https://doi.org/10.3390/jmse9060620