
Focality-Oriented Selection of Current Dose for Transcranial Direct Current Stimulation

 , , and
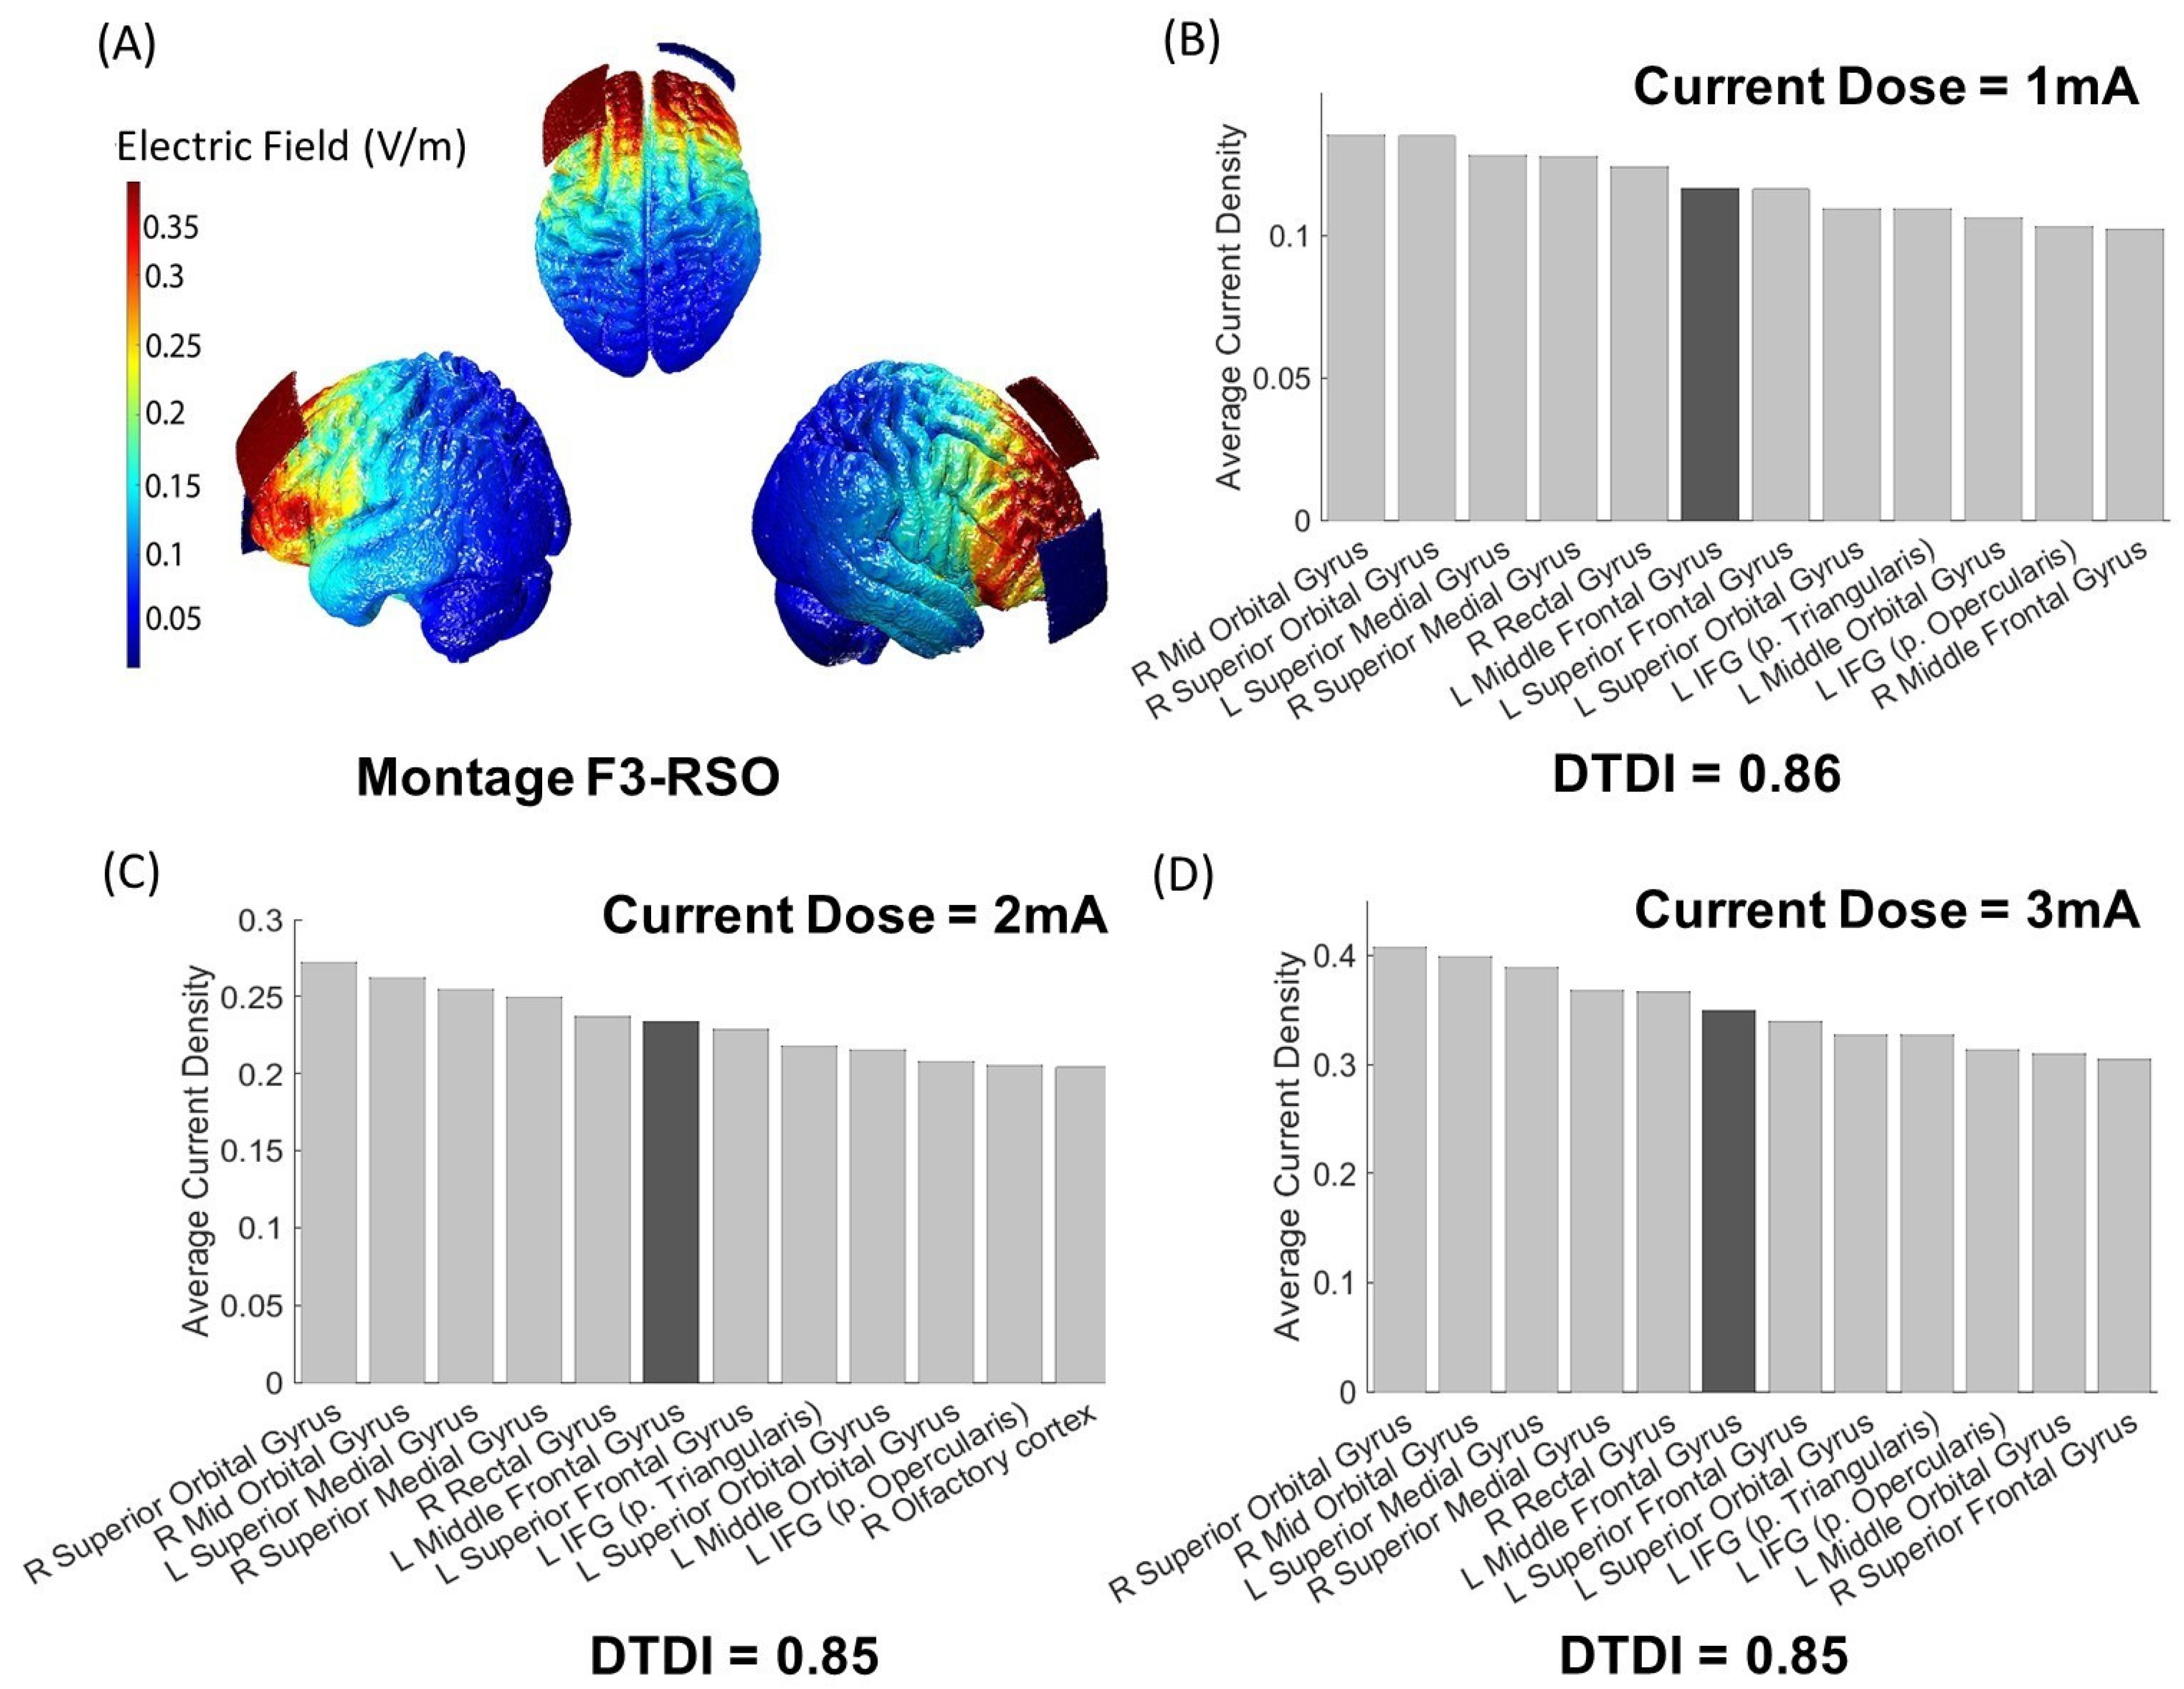
Abstract
:1. Introduction
2. Methods
2.1. Data
2.2. Preprocessing with ROAST
2.3. i-SATA(MNI)
2.4. Dose–Target Determination Index (DTDI)
2.5. Statistical Analysis of Variation in DTDI
2.6. Code Availability
3. Results
3.1. Output of i-SATA(MNI) on the Standard Head Model
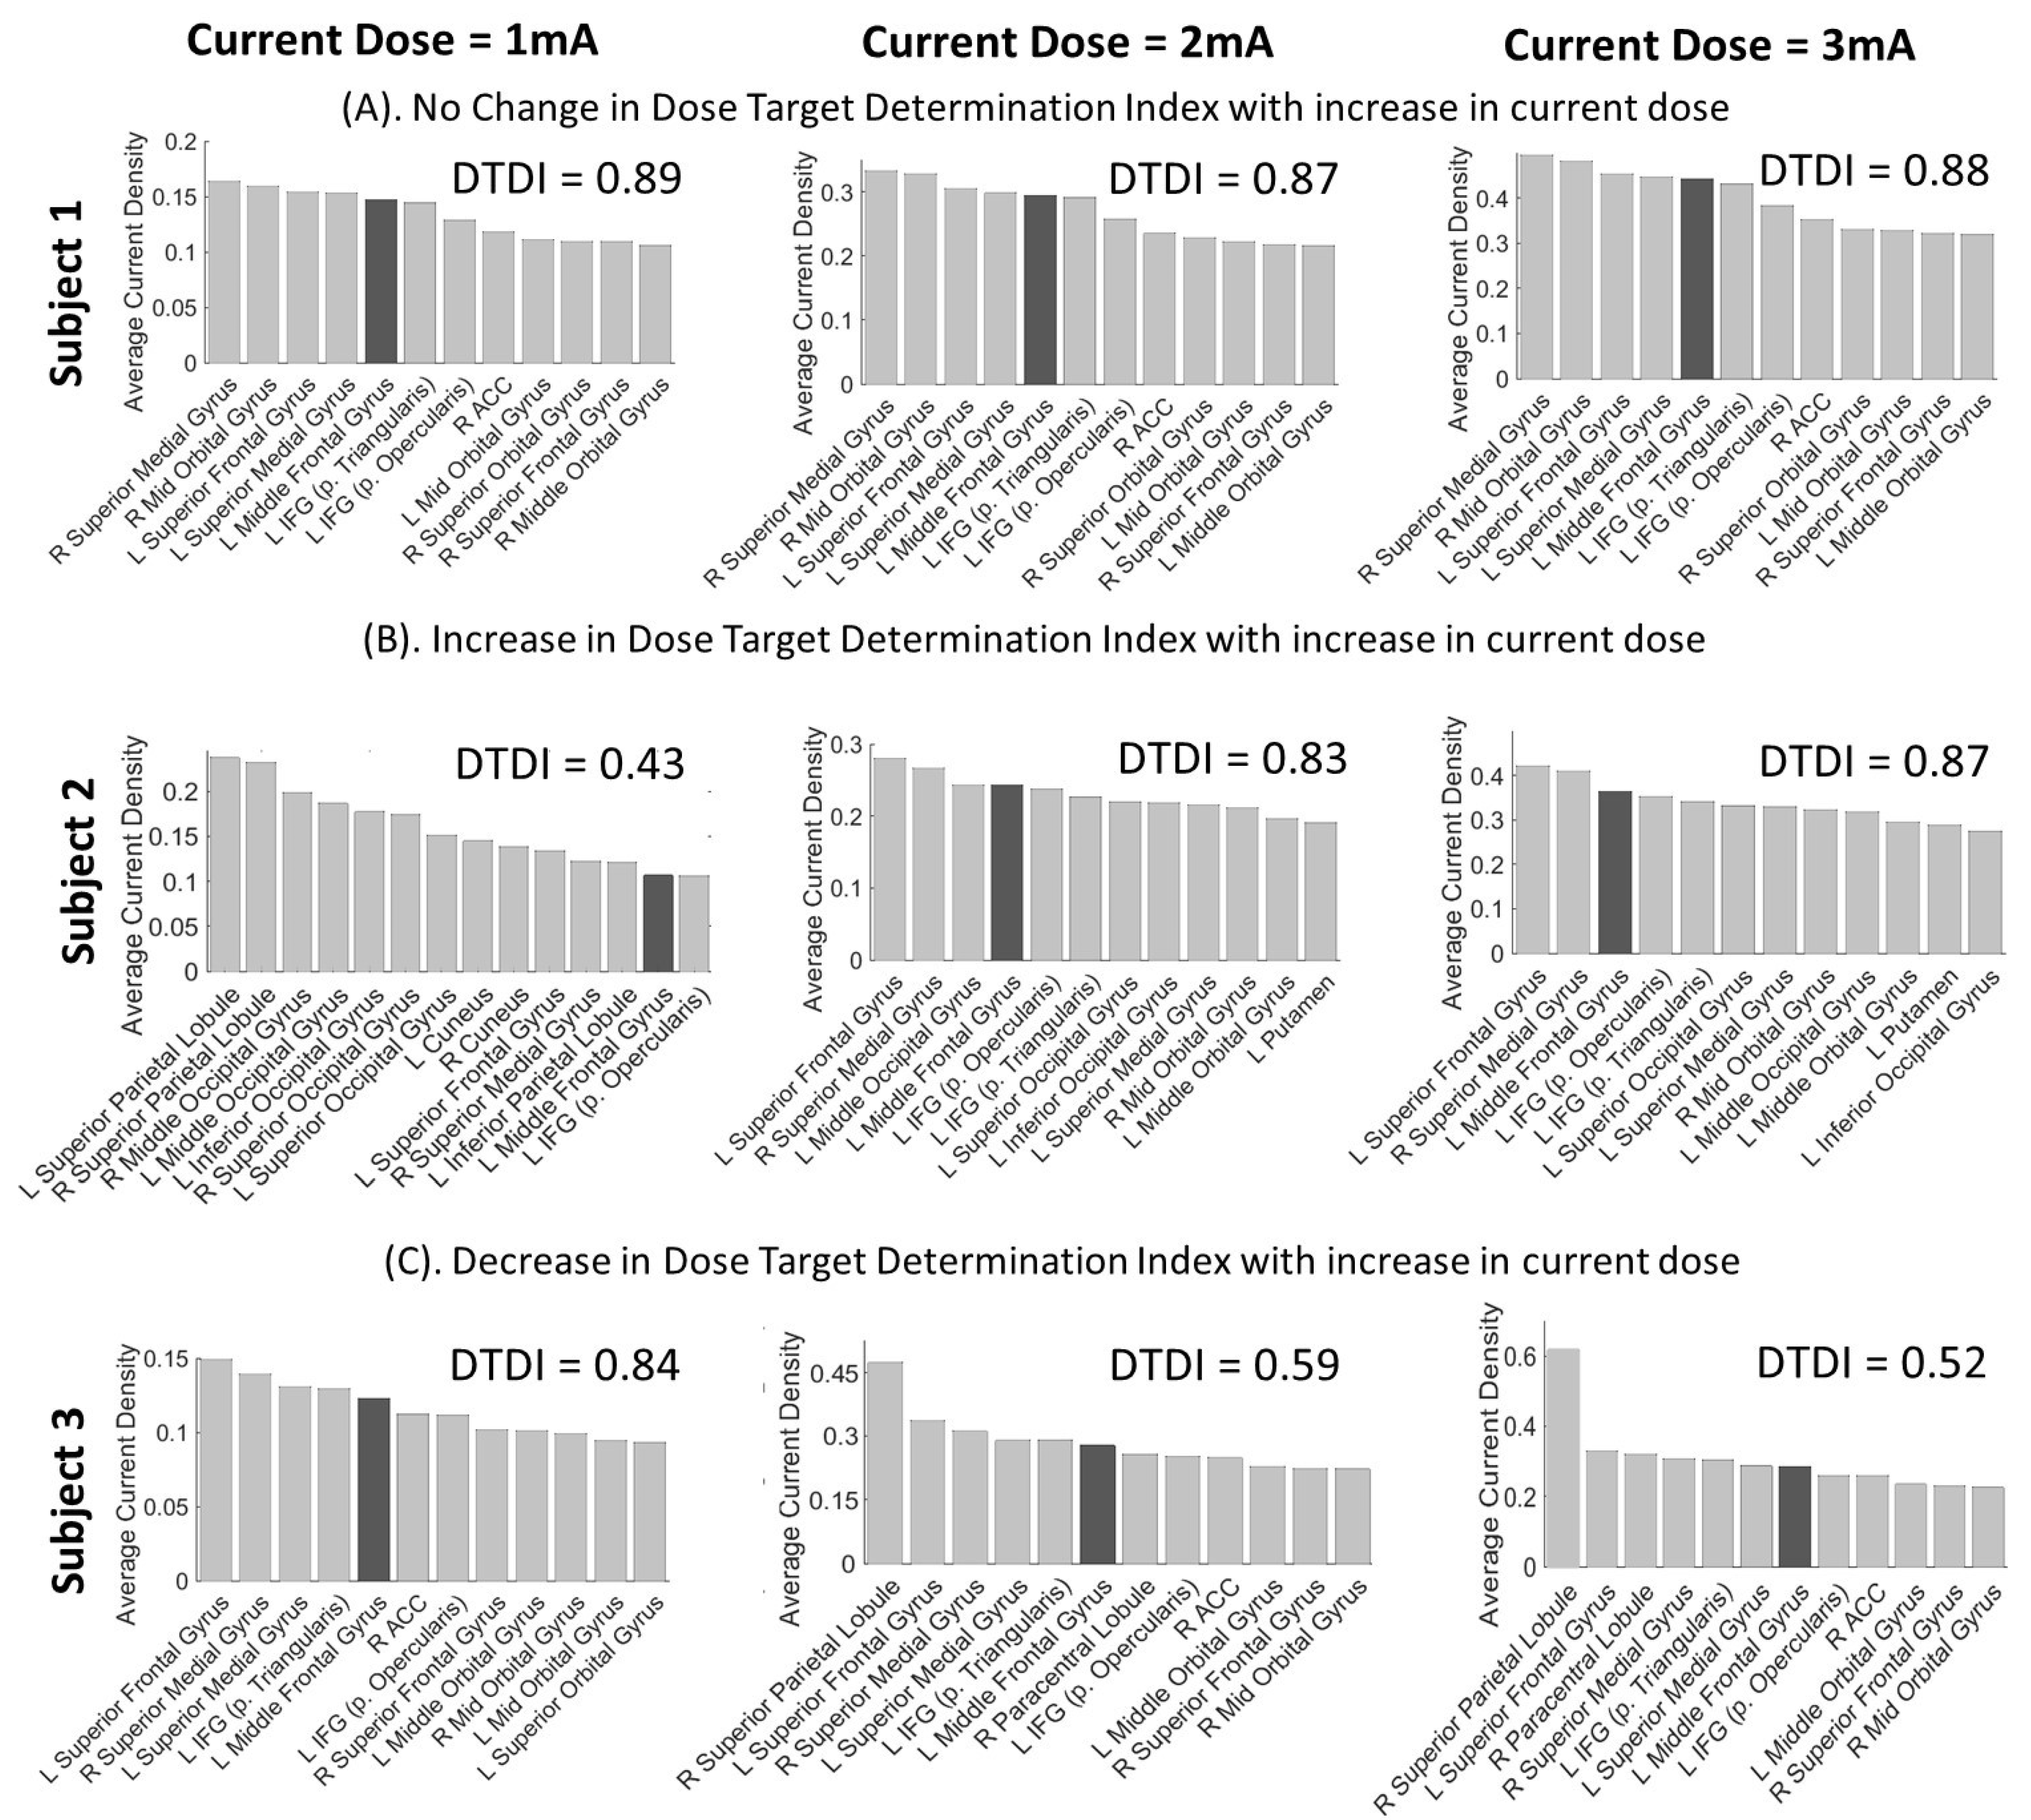
3.2. Interpretation of DTDI for Appropriate Selection of Current Dose
3.3. Statistical Analysis of Variance in DTDI
4. Discussion
How to Use DTDI
- (A). DTDI for Group-level Study
- (B). DTDI for Multiple Target ROIs
5. Limitations
6. Conclusions
Author Contributions
Funding
Institutional Review Board Statement
Informed Consent Statement
Data Availability Statement
Acknowledgments
Conflicts of Interest
References
- Antal, A.; Alekseichuk, I.; Bikson, M.; Brockmöller, J.; Brunoni, A.R.; Chen, R.; Cohen, L.G.; Dowthwaite, G.; Ellrich, J.; Flöel, A. Low intensity transcranial electric stimulation: Safety, ethical, legal regulatory and application guidelines. Clin. Neurophysiol. 2017, 128, 1774–1809. [Google Scholar] [CrossRef] [Green Version]
- Filmer, H.L.; Dux, P.E.; Mattingley, J.B. Applications of transcranial direct current stimulation for understanding brain function. Trends Neurosci. 2014, 37, 742–753. [Google Scholar] [CrossRef] [Green Version]
- Razza, L.B.; Palumbo, P.; Moffa, A.H.; Carvalho, A.F.; Solmi, M.; Loo, C.K.; Brunoni, A.R. A systematic review and meta-analysis on the effects of transcranial direct current stimulation in depressive episodes. Depress. Anxiety 2020, 37, 594–608. [Google Scholar] [CrossRef] [PubMed]
- Nitsche, M.A.; Doemkes, S.; Karakose, T.; Antal, A.; Liebetanz, D.; Lang, N.; Tergau, F.; Paulus, W. Shaping the effects of transcranial direct current stimulation of the human motor cortex. J. Neurophysiol. 2007, 97, 3109–3117. [Google Scholar] [CrossRef] [PubMed] [Green Version]
- Nitsche, M.A.; Paulus, W. Excitability changes induced in the human motor cortex by weak transcranial direct current stimulation. J. Physiol. 2000, 527, 633–639. [Google Scholar] [CrossRef] [PubMed]
- Datta, A.; Bansal, V.; Diaz, J.; Patel, J.; Reato, D.; Bikson, M. Gyri-precise head model of transcranial direct current stimulation: Improved spatial focality using a ring electrode versus conventional rectangular pad. Brain Stimul. 2009, 2, 201–207. [Google Scholar] [CrossRef] [PubMed] [Green Version]
- Batsikadze, G.; Moliadze, V.; Paulus, W.; Kuo, M.-F.; Nitsche, M.A. Partially non-linear stimulation intensity-dependent effects of direct current stimulation on motor cortex excitability in humans. J. Physiol. 2013, 591, 1987–2000. [Google Scholar] [CrossRef] [PubMed]
- Indahlastari, A.; Chauhan, M.; Sadleir, R. Benchmarking transcranial electrical stimulation finite element simulations: A comparison study. J. Neural Eng. 2019, 16, 026019. [Google Scholar] [CrossRef] [PubMed]
- Huang, Y.; Liu, A.A.; Lafon, B.; Friedman, D.; Dayan, M.; Wang, X.; Bikson, M.; Doyle, W.K.; Devinsky, O.; Parra, L.C. Measurements and models of electric fields in the in vivo human brain during transcranial electric stimulation. eLife 2017, 6, e18834. [Google Scholar] [CrossRef] [PubMed]
- Huang, Y.; Datta, A.; Bikson, M.; Parra, L.C. Realistic volumetric-approach to simulate transcranial electric stimulation—ROAST—a fully automated open-source pipeline. J. Neural Eng. 2019, 16, 056006. [Google Scholar] [CrossRef] [PubMed]
- Bhattacharjee, S.; Kashyap, R.; Rapp, B.; Oishi, K.; Desmond, J.E.; Chen, S.A. Simulation Analyses of tDcS Montages for the investigation of Dorsal and Ventral pathways. Sci. Rep. 2019, 9, 1–17. [Google Scholar] [CrossRef]
- Bikson, M.; Datta, A.; Rahman, A.; Scaturro, J. Electrode montages for tDCS and weak transcranial electrical stimulation: Role of “return” electrode’s position and size. Clin. Neurophysiol. Off. J. Int. Fed. Clin. Neurophysiol. 2010, 121, 1976. [Google Scholar] [CrossRef] [Green Version]
- Opitz, A.; Falchier, A.; Yan, C.-G.; Yeagle, E.M.; Linn, G.S.; Megevand, P.; Thielscher, A.; Milham, M.P.; Mehta, A.D.; Schroeder, C.E. Spatiotemporal structure of intracranial electric fields induced by transcranial electric stimulation in humans and nonhuman primates. Sci. Rep. 2016, 6, 1–11. [Google Scholar]
- Laakso, I.; Mikkonen, M.; Koyama, S.; Hirata, A.; Tanaka, S. Can electric fields explain inter-individual variability in transcranial direct current stimulation of the motor cortex? Sci. Rep. 2019, 9, 1–10. [Google Scholar]
- Caulfield, K.A.; Badran, B.W.; Li, X.; Bikson, M.; George, M.S. Can transcranial electrical stimulation motor threshold estimate individualized tDCS doses over the prefrontal cortex? Evidence from reverse-calculation electric field modeling. Brain Stimul. 2020, 13, 1150–1152. [Google Scholar] [CrossRef]
- Caulfield, K.A.; Badran, B.W.; DeVries, W.H.; Summers, P.M.; Kofmehl, E.; Li, X.; Borckardt, J.J.; Bikson, M.; George, M.S. Transcranial electrical stimulation motor threshold can estimate individualized tDCS dosage from reverse-calculation electric-field modeling. Brain Stimul. 2020, 13, 961–969. [Google Scholar] [CrossRef] [PubMed]
- Chew, T.; Ho, K.-A.; Loo, C.K. Inter-and intra-individual variability in response to transcranial direct current stimulation (tDCS) at varying current intensities. Brain Stimul. 2015, 8, 1130–1137. [Google Scholar] [CrossRef]
- López-Alonso, V.; Fernández-del-Olmo, M.; Costantini, A.; Gonzalez-Henriquez, J.J.; Cheeran, B. Intra-individual variability in the response to anodal transcranial direct current stimulation. Clin. Neurophysiol. 2015, 126, 2342–2347. [Google Scholar] [CrossRef] [PubMed]
- López-Alonso, V.; Cheeran, B.; Río-Rodríguez, D.; Fernández-del-Olmo, M. Inter-individual variability in response to non-invasive brain stimulation paradigms. Brain Stimul. 2014, 7, 372–380. [Google Scholar] [CrossRef] [PubMed]
- Evans, C.; Bachmann, C.; Lee, J.S.A.; Gregoriou, E.; Ward, N.; Bestmann, S. Dose-controlled tDCS reduces electric field intensity variability at a cortical target site. Brain Stimul. 2020, 13, 125–136. [Google Scholar] [CrossRef] [Green Version]
- Caulfield, K.A.; Indahlastari, A.; Nissim, N.R.; Lopez, J.W.; Fleischmann, H.H.; Woods, A.J.; George, M.S. Electric Field Strength From Prefrontal Transcranial Direct Current Stimulation Determines Degree of Working Memory Response: A Potential Application of Reverse-Calculation Modeling? Neuromodulation 2020. [Google Scholar] [CrossRef]
- Ammann, C.; Lindquist, M.A.; Celnik, P.A. Response variability of different anodal transcranial direct current stimulation intensities across multiple sessions. Brain Stimul. 2017, 10, 757–763. [Google Scholar] [CrossRef]
- Esmaeilpour, Z.; Marangolo, P.; Hampstead, B.M.; Bestmann, S.; Galletta, E.; Knotkova, H.; Bikson, M. Incomplete evidence that increasing current intensity of tDCS boosts outcomes. Brain Stimul. 2018, 11, 310–321. [Google Scholar] [CrossRef]
- Antal, A.; Polania, R.; Schmidt-Samoa, C.; Dechent, P.; Paulus, W. Transcranial direct current stimulation over the primary motor cortex during fMRI. Neuroimage 2011, 55, 590–596. [Google Scholar] [CrossRef] [PubMed]
- Bai, S.; Dokos, S.; Ho, K.-A.; Loo, C. A computational modelling study of transcranial direct current stimulation montages used in depression. Neuroimage 2014, 87, 332–344. [Google Scholar] [CrossRef]
- Wagner, T.; Fregni, F.; Fecteau, S.; Grodzinsky, A.; Zahn, M.; Pascual-Leone, A. Transcranial direct current stimulation: A computer-based human model study. NeuroImage 2007, 35, 1113–1124. [Google Scholar] [CrossRef] [PubMed]
- Deurloo, K.E.I.; Holsheimer, J.; Bergveld, P. Nerve stimulation with a multi-contact cuff electrode: Validation of model predictions. Arch. Physiol. Biochem. 2000, 108, 349–359. [Google Scholar] [CrossRef] [PubMed]
- Kosta, P.; Warren, D.J.; Lazzi, G. Selective stimulation of rat sciatic nerve using an array of mm-size magnetic coils: A simulation study. Healthc. Technol. Lett. 2019, 6, 70–75. [Google Scholar] [CrossRef]
- Tigra, W.; Guiraud, D.; Andreu, D.; Coulet, B.; Gelis, A.; Fattal, C.; Maciejasz, P.; Picq, C.; Rossel, O.; Teissier, J. Exploring selective neural electrical stimulation for upper limb function restoration. Eur. J. Transl. Myol. 2016, 26, 6035. [Google Scholar] [CrossRef] [Green Version]
- Kosta, P.; Mize, J.; Warren, D.J.; Lazzi, G. Simulation-Based Optimization of Figure-of-Eight Coil Designs and Orientations for Magnetic Stimulation of Peripheral Nerve. IEEE Trans. Neural Syst. Rehabil. Eng. 2020, 28, 2901–2913. [Google Scholar] [CrossRef]
- Mikkonen, M.; Laakso, I.; Tanaka, S.; Hirata, A. Cost of focality in TDCS: Interindividual variability in electric fields. Brain Stimul. 2020, 13, 117–124. [Google Scholar] [CrossRef] [Green Version]
- Opitz, A.; Yeagle, E.; Thielscher, A.; Schroeder, C.; Mehta, A.D.; Milham, M.P. On the importance of precise electrode placement for targeted transcranial electric stimulation. Neuroimage 2018, 181, 560–567. [Google Scholar] [CrossRef] [PubMed]
- Fischer, D.B.; Fried, P.J.; Ruffini, G.; Ripolles, O.; Salvador, R.; Banus, J.; Ketchabaw, W.T.; Santarnecchi, E.; Pascual-Leone, A.; Fox, M.D. Multifocal tDCS targeting the resting state motor network increases cortical excitability beyond traditional tDCS targeting unilateral motor cortex. Neuroimage 2017, 157, 34–44. [Google Scholar] [CrossRef]
- Bortoletto, M.; Rodella, C.; Salvador, R.; Miranda, P.C.; Miniussi, C. Reduced current spread by concentric electrodes in transcranial electrical stimulation (tES). Brain Stimul. 2016, 9, 525–528. [Google Scholar] [CrossRef]
- Kashyap, R.; Bhattacharjee, S.; Arumugam, R.; Oishi, K.; Desmond, J.E.; Chen, S.A. i-SATA: A MATLAB based toolbox to estimate current density generated by transcranial direct current stimulation in an individual brain. J. Neural Eng. 2020, 17, 056034. [Google Scholar] [CrossRef]
- Lancaster, J.L.; Woldorff, M.G.; Parsons, L.M.; Liotti, M.; Freitas, C.S.; Rainey, L.; Kochunov, P.V.; Nickerson, D.; Mikiten, S.A.; Fox, P.T. Automated Talairach Atlas labels for functional brain mapping. Hum. Brain Mapp. 2000, 10, 120–131. [Google Scholar] [CrossRef]
- Talairach, J.; Tournoux, P. Co-Planar Stereotaxic Atlas of the Human Brain 3-Dimensional Proportional System: An Approach to Cerebral Imaging; Georg Thieme Verlag: Stuttgart, Germany; New York, NY, USA, 1988. [Google Scholar]
- Collins, D.L.; Neelin, P.; Peters, T.M.; Evans, A.C. Automatic 3D intersubject registration of MR volumetric data in standardized Talairach space. J. Comput. Assist. Tomogr. 1994, 18, 192–205. [Google Scholar] [CrossRef]
- Evans, A.C.; Marrett, S.; Neelin, P.; Collins, L.; Worsley, K.; Dai, W.; Milot, S.; Meyer, E.; Bub, D. Anatomical mapping of functional activation in stereotactic coordinate space. Neuroimage 1992, 1, 43–53. [Google Scholar] [CrossRef]
- Holmes, C.J.; Hoge, R.; Collins, L.; Woods, R.; Toga, A.W.; Evans, A.C. Enhancement of MR images using registration for signal averaging. J. Comput. Assist. Tomogr. 1998, 22, 324–333. [Google Scholar] [CrossRef] [PubMed]
- Amunts, K.; Zilles, K. Advances in cytoarchitectonic mapping of the human cerebral cortex. Neuroimaging Clin. North Am. 2001, 11, 151–169. [Google Scholar]
- Zilles, K.; Schleicher, A.; Palomero-Gallagher, N.; Amunts, K. Quantitative analysis of cyto-and receptor architecture of the human brain. In Brain Mapping: The Methods; Elsevier: Amsterdam, The Netherlands, 2002; pp. 573–602. [Google Scholar]
- Eickhoff, S.B.; Stephan, K.E.; Mohlberg, H.; Grefkes, C.; Fink, G.R.; Amunts, K.; Zilles, K. A new SPM toolbox for combining probabilistic cytoarchitectonic maps and functional imaging data. Neuroimage 2005, 25, 1325–1335. [Google Scholar] [CrossRef] [PubMed]
- Eickhoff, S.B.; Heim, S.; Zilles, K.; Amunts, K. Testing anatomically specified hypotheses in functional imaging using cytoarchitectonic maps. Neuroimage 2006, 32, 570–582. [Google Scholar] [CrossRef] [PubMed]
- Eickhoff, S.B.; Paus, T.; Caspers, S.; Grosbras, M.-H.; Evans, A.C.; Zilles, K.; Amunts, K. Assignment of functional activations to probabilistic cytoarchitectonic areas revisited. Neuroimage 2007, 36, 511–521. [Google Scholar] [CrossRef]
- Moffa, A.H.; Martin, D.; Alonzo, A.; Bennabi, D.; Blumberger, D.M.; Benseñor, I.M.; Daskalakis, Z.; Fregni, F.; Haffen, E.; Lisanby, S.H. Efficacy and acceptability of transcranial direct current stimulation (tDCS) for major depressive disorder: An individual patient data meta-analysis. Prog. Neuro-Psychopharmacol. Biol. Psychiatry 2020, 99, 109836. [Google Scholar] [CrossRef] [PubMed]
- Nikolin, S.; Martin, D.; Loo, C.K.; Boonstra, T.W. Effects of TDCS dosage on working memory in healthy participants. Brain Stimul. 2018, 11, 518–527. [Google Scholar] [CrossRef] [PubMed]
- Taylor, J.R.; Williams, N.; Cusack, R.; Auer, T.; Shafto, M.A.; Dixon, M.; Tyler, L.K.; Henson, R.N. The Cambridge Centre for Ageing and Neuroscience (Cam-CAN) data repository: Structural and functional MRI, MEG, and cognitive data from a cross-sectional adult lifespan sample. Neuroimage 2017, 144, 262–269. [Google Scholar] [CrossRef] [PubMed]
- Shafto, M.A.; Tyler, L.K.; Dixon, M.; Taylor, J.R.; Rowe, J.B.; Cusack, R.; Calder, A.J.; Marslen-Wilson, W.D.; Duncan, J.; Dalgleish, T. The Cambridge Centre for Ageing and Neuroscience (Cam-CAN) study protocol: A cross-sectional, lifespan, multidisciplinary examination of healthy cognitive ageing. BMC Neurol. 2014, 14, 204. [Google Scholar] [CrossRef] [Green Version]
- Ardekani, B.A.; Bachman, A.H. Model-based automatic detection of the anterior and posterior commissures on MRI scans. Neuroimage 2009, 46, 677–682. [Google Scholar] [CrossRef] [Green Version]
- Oostenveld, R.; Fries, P.; Maris, E.; Schoffelen, J.-M. FieldTrip: Open Source Software for Advanced Analysis of MEG, EEG, and Invasive Electrophysiological Data. Comput. Intell. Neurosci. 2011, 2011, 156869. [Google Scholar] [CrossRef]
- Bhattacharjee, S.; Kashyap, R.; O’Brien, B.A.; McCloskey, M.; Oishi, K.; Desmond, J.E.; Rapp, B.; Chen, S.H.A. Reading proficiency influences the effects of transcranial direct current stimulation: Evidence from selective modulation of dorsal and ventral pathways of reading in bilinguals. Brain Lang. 2020, 210, 104850. [Google Scholar] [CrossRef]
- Tzourio-Mazoyer, N.; Landeau, B.; Papathanassiou, D.; Crivello, F.; Etard, O.; Delcroix, N.; Mazoyer, B.; Joliot, M. Automated anatomical labeling of activations in SPM using a macroscopic anatomical parcellation of the MNI MRI single-subject brain. Neuroimage 2002, 15, 273–289. [Google Scholar] [CrossRef]
- Bikson, M.; Truong, D.Q.; Mourdoukoutas, A.P.; Aboseria, M.; Khadka, N.; Adair, D.; Rahman, A. Modeling sequence and quasi-uniform assumption in computational neurostimulation. Prog. Brain Res. 2015, 222, 1–23. [Google Scholar] [PubMed]
- Bhattacharjee, S.; Chew, A.; Kashyap, R.; Wu, C.; Yeo, M.; O’Brien, B.; Rapp, B.; McCloskey, M.; Oishi, K.; Desmond, J.; et al. Could tDCS Modulate Bilingual Reading? Brain Stimul. 2019, 12, 569. [Google Scholar] [CrossRef]
- Horvath, J.C.; Carter, O.; Forte, J.D. Transcranial direct current stimulation: Five important issues we aren’t discussing (but probably should be). Front. Syst. Neurosci. 2014, 8, 2. [Google Scholar] [CrossRef] [PubMed]
- Horvath, J.C.; Forte, J.D.; Carter, O. Quantitative review finds no evidence of cognitive effects in healthy populations from single-session transcranial direct current stimulation (tDCS). Brain Stimul. 2015, 8, 535–550. [Google Scholar] [CrossRef]
- Horvath, J.C.; Carter, O.; Forte, J.D. No significant effect of transcranial direct current stimulation (tDCS) found on simple motor reaction time comparing 15 different simulation protocols. Neuropsychologia 2016, 91, 544–552. [Google Scholar] [CrossRef]
- Goldsworthy, M.R.; Hordacre, B. Dose dependency of transcranial direct current stimulation: Implications for neuroplasticity induction in health and disease. J. Physiol. 2017, 595, 3265–3266. [Google Scholar] [CrossRef] [PubMed]
- Jamil, A.; Batsikadze, G.; Kuo, H.-I.; Labruna, L.; Hasan, A.; Paulus, W.; Nitsche, M.A. Systematic evaluation of the impact of stimulation intensity on neuroplastic after-effects induced by transcranial direct current stimulation. J. Physiol. 2017, 595, 1273–1288. [Google Scholar] [CrossRef]
- Labruna, L.; Jamil, A.; Fresnoza, S.; Batsikadze, G.; Kuo, M.-F.; Vanderschelden, B.; Ivry, R.B.; Nitsche, M.A. Efficacy of anodal transcranial direct current stimulation is related to sensitivity to transcranial magnetic stimulation. Brain Stimul. 2016, 9, 8–15. [Google Scholar] [CrossRef] [PubMed] [Green Version]
- Kidgell, D.J.; Daly, R.M.; Young, K.; Lum, J.; Tooley, G.; Jaberzadeh, S.; Zoghi, M.; Pearce, A.J. Different current intensities of anodal transcranial direct current stimulation do not differentially modulate motor cortex plasticity. Neural Plast. 2013, 2013, 603502. [Google Scholar] [CrossRef] [Green Version]
- Saleem, G.T.; Ewen, J.B.; Crasta, J.E.; Slomine, B.S.; Cantarero, G.L.; Suskauer, S.J. Single-arm, open-label, dose escalation phase I study to evaluate the safety and feasibility of transcranial direct current stimulation with electroencephalography biomarkers in paediatric disorders of consciousness: A study protocol. BMJ Open 2019, 9, e029967. [Google Scholar] [CrossRef] [Green Version]
- Dmochowski, J.P.; Datta, A.; Huang, Y.; Richardson, J.D.; Bikson, M.; Fridriksson, J.; Parra, L.C. Targeted transcranial direct current stimulation for rehabilitation after stroke. Neuroimage 2013, 75, 12–19. [Google Scholar] [CrossRef] [PubMed] [Green Version]
- Dmochowski, J.P.; Koessler, L.; Norcia, A.M.; Bikson, M.; Parra, L.C. Optimal use of EEG recordings to target active brain areas with transcranial electrical stimulation. Neuroimage 2017, 157, 69–80. [Google Scholar] [CrossRef] [PubMed]
- Cancelli, A.; Cottone, C.; Tecchio, F.; Truong, D.Q.; Dmochowski, J.; Bikson, M. A simple method for EEG guided transcranial electrical stimulation without models. J. Neural Eng. 2016, 13, 036022. [Google Scholar] [CrossRef] [PubMed]
- Shahid, S.S.; Bikson, M.; Salman, H.; Wen, P.; Ahfock, T. The value and cost of complexity in predictive modelling: Role of tissue anisotropic conductivity and fibre tracts in neuromodulation. J. Neural Eng. 2014, 11, 036002. [Google Scholar] [CrossRef] [PubMed] [Green Version]
- Saturnino, G.B.; Antunes, A.; Thielscher, A. On the importance of electrode parameters for shaping electric field patterns generated by tDCS. NeuroImage 2015, 120, 25–35. [Google Scholar] [CrossRef]
- Gomez-Tames, J.; Asai, A.; Hirata, A. Significant group-level hotspots found in deep brain regions during transcranial direct current stimulation (tDCS): A computational analysis of electric fields. Clin. Neurophysiol. 2020, 131, 755–765. [Google Scholar] [CrossRef]
- Minjoli, S.; Saturnino, G.B.; Blicher, J.U.; Stagg, C.J.; Siebner, H.R.; Antunes, A.; Thielscher, A. The impact of large structural brain changes in chronic stroke patients on the electric field caused by transcranial brain stimulation. NeuroImage Clin. 2017, 15, 106–117. [Google Scholar] [CrossRef] [PubMed]
- Habich, A.; Fehér, K.D.; Antonenko, D.; Boraxbekk, C.-J.; Flöel, A.; Nissen, C.; Siebner, H.R.; Thielscher, A.; Klöppel, S. Stimulating aged brains with transcranial direct current stimulation: Opportunities and challenges. Psychiatry Res. Neuroimaging 2020, 306, 111179. [Google Scholar] [CrossRef] [PubMed]
- Hsu, W.-Y.; Ku, Y.; Zanto, T.P.; Gazzaley, A. Effects of noninvasive brain stimulation on cognitive function in healthy aging and Alzheimer’s disease: A systematic review and meta-analysis. Neurobiol. Aging 2015, 36, 2348–2359. [Google Scholar] [CrossRef] [PubMed] [Green Version]
- Brunoni, A.R.; Nitsche, M.A.; Bolognini, N.; Bikson, M.; Wagner, T.; Merabet, L.; Edwards, D.J.; Valero-Cabre, A.; Rotenberg, A.; Pascual-Leone, A.; et al. Clinical Research with Transcranial Direct Current Stimulation (tDCS): Challenges and Future Directions. Brain Stimul. 2012, 5, 175–195. [Google Scholar] [CrossRef] [Green Version]
- Datta, A. Inter-individual variation during transcranial direct current stimulation and normalization of dose using MRI-derived computational models. Front. Psychiatry 2012, 3, 91. [Google Scholar] [CrossRef] [Green Version]
- Rudroff, T.; Workman, C.D.; Fietsam, A.C.; Kamholz, J. Response variability in transcranial direct current stimulation: Why sex matters. Front. Psychiatry 2020, 11, 585. [Google Scholar] [CrossRef]
- Thomas, C.; Ghodratitoostani, I.; Delbem, A.C.B.; Ali, A.; Datta, A. Influence of gender-related differences in transcranial direct current stimulation: A Computational Study. In Proceedings of the 2019 41st Annual International Conference of the IEEE Engineering in Medicine and Biology Society (EMBC), Berlin, Germany, 23–27 July 2019; pp. 5196–5199. [Google Scholar]
- Russell, M.; Goodman, T.; Wang, Q.; Groshong, B.; Lyeth, B.G. Gender differences in current received during transcranial electrical stimulation. Front. Psychiatry 2014, 5, 104. [Google Scholar] [CrossRef] [PubMed] [Green Version]
- Indahlastari, A.; Albizu, A.; O’Shea, A.; Forbes, M.A.; Nissim, N.R.; Kraft, J.N.; Evangelista, N.D.; Hausman, H.K.; Woods, A.J.; Initiative, A.D.N. Modeling Transcranial Electrical Stimulation in the Aging Brain. Brain Stimul. 2020, 13, 664–674. [Google Scholar] [CrossRef] [PubMed] [Green Version]
- Wallace, D.; Cooper, N.R.; Paulmann, S.; Fitzgerald, P.B.; Russo, R. Perceived comfort and blinding efficacy in randomised sham-controlled transcranial direct current stimulation (tDCS) trials at 2 mA in young and older healthy adults. PLoS ONE 2016, 11, e0149703. [Google Scholar]
- Chhatbar, P.Y.; Chen, R.; Deardorff, R.; Dellenbach, B.; Kautz, S.A.; George, M.S.; Feng, W. Safety and tolerability of transcranial direct current stimulation to stroke patients–A phase I current escalation study. Brain Stimul. 2017, 10, 553–559. [Google Scholar] [CrossRef] [PubMed] [Green Version]
- Workman, C.D.; Kamholz, J.; Rudroff, T. The tolerability and efficacy of 4 mA transcranial direct current stimulation on leg muscle fatigability. Brain Sci. 2020, 10, 12. [Google Scholar] [CrossRef] [PubMed] [Green Version]
- Uddin, L.Q.; Yeo, B.T.; Spreng, R.N. Towards a universal taxonomy of macro-scale functional human brain networks. Brain Topogr. 2019, 32, 926–942. [Google Scholar] [CrossRef] [PubMed]
- Thomas Yeo, B.T.; Krienen, F.M.; Sepulcre, J.; Sabuncu, M.R.; Lashkari, D.; Hollinshead, M.; Roffman, J.L.; Smoller, J.W.; Zöllei, L.; Polimeni, J.R.; et al. The organization of the human cerebral cortex estimated by intrinsic functional connectivity. J. Neurophysiol. 2011, 106, 1125–1165. [Google Scholar] [CrossRef]
- Kashyap, R.; Ouyang, G.; Sommer, W.; Zhou, C. Neuroanatomic localization of priming effects for famous faces with latency-corrected event-related potentials. Brain Res. 2016, 1632, 58–72. [Google Scholar] [CrossRef] [PubMed]
- Kashyap, R.; Kong, R.; Bhattacharjee, S.; Li, J.; Zhou, J.; Yeo, B.T. Individual-specific fMRI-Subspaces improve functional connectivity prediction of behavior. NeuroImage 2019, 189, 804–812. [Google Scholar] [CrossRef] [PubMed]
- Kashyap, R.; Bhattacharjee, S.; Sommer, W.; Zhou, C. Repetition priming effects for famous faces through dynamic causal modelling of latency-corrected event-related brain potentials. Eur. J. Neurosci. 2019, 49, 1330–1347. [Google Scholar] [CrossRef] [PubMed]
- Kashyap, R.; Eng, G.K.; Bhattacharjee, S.; Gupta, B.; Ho, R.; Ho, C.S.; Zhang, M.; Mahendran, R.; Sim, K.; Chen, S.A. Individual-fMRI-approaches reveal cerebellum and visual communities to be functionally connected in obsessive compulsive disorder. Sci. Rep. 2021, 11, 1–15. [Google Scholar] [CrossRef]
- Kashyap, R.; Bhattacharjee, S.; Yeo, B.T.; Chen, S.A. Maximizing dissimilarity in resting state detects heterogeneous subtypes in healthy population associated with high substance use and problems in antisocial personality. Hum. Brain Mapp. 2020, 41, 1261–1273. [Google Scholar] [CrossRef] [PubMed]
- Csifcsák, G.; Boayue, N.M.; Puonti, O.; Thielscher, A.; Mittner, M. Effects of transcranial direct current stimulation for treating depression: A modeling study. J. Affect. Disord. 2018, 234, 164–173. [Google Scholar] [CrossRef] [Green Version]
- Siddiqi, S.H.; Schaper, F.L.W.V.J.; Horn, A.; Hsu, J.; Padmanabhan, J.L.; Brodtmann, A.; Cash, R.F.H.; Corbetta, M.; Choi, K.S.; Dougherty, D.D.; et al. Brain stimulation and brain lesions converge on common causal circuits in neuropsychiatric disease. Nat. Hum. Behav. 2021. [Google Scholar] [CrossRef] [PubMed]


Publisher’s Note: MDPI stays neutral with regard to jurisdictional claims in published maps and institutional affiliations. |
© 2021 by the authors. Licensee MDPI, Basel, Switzerland. This article is an open access article distributed under the terms and conditions of the Creative Commons Attribution (CC BY) license (https://creativecommons.org/licenses/by/4.0/).
Share and Cite
Kashyap, R.; Bhattacharjee, S.; Arumugam, R.; Bharath, R.D.; Udupa, K.; Oishi, K.; Desmond, J.E.; Chen, S.H.A.; Guan, C. Focality-Oriented Selection of Current Dose for Transcranial Direct Current Stimulation. J. Pers. Med. 2021, 11, 940. https://doi.org/10.3390/jpm11090940
Kashyap R, Bhattacharjee S, Arumugam R, Bharath RD, Udupa K, Oishi K, Desmond JE, Chen SHA, Guan C. Focality-Oriented Selection of Current Dose for Transcranial Direct Current Stimulation. Journal of Personalized Medicine. 2021; 11(9):940. https://doi.org/10.3390/jpm11090940
Chicago/Turabian StyleKashyap, Rajan, Sagarika Bhattacharjee, Ramaswamy Arumugam, Rose Dawn Bharath, Kaviraja Udupa, Kenichi Oishi, John E. Desmond, S. H. Annabel Chen, and Cuntai Guan. 2021. "Focality-Oriented Selection of Current Dose for Transcranial Direct Current Stimulation" Journal of Personalized Medicine 11, no. 9: 940. https://doi.org/10.3390/jpm11090940