Article

Spatial-Temporal Changes and Driving Force Analysis of Green Space in Coastal Cities of Southeast China over the Past 20 Years

1
Department of Geography and Spatial Information Techniques/Center for Land and Marine Spatial Utilization and Governance Research, Ningbo University, Ningbo 315211, China
2
Shandong Provincial Key Laboratory of Applied Microbiology, Ecology Institute, Qilu University of Technology (Shandong Academy of Sciences), 28789 East Jingshi Road, Jinan 250103, China
3
Institute of East China Sea, Ningbo University, Ningbo 315211, China
4
Coastal Ecosystems Research Station of the Yangtze River Estuary, Ministry of Education Key Laboratory for Biodiversity Science and Ecological Engineering, Institute of Biodiversity Science, School of Life Sciences, Fudan University, Shanghai 200433, China
5
Global Centre for Environmental Remediation (GCER), the University of Newcastle (UON), Newcastle 2308, Australia
*
Author to whom correspondence should be addressed.
Those authors contributed equally.
Land 2021, 10(5), 537; https://doi.org/10.3390/land10050537
Submission received: 14 April 2021 / Revised: 13 May 2021 / Accepted: 14 May 2021 / Published: 19 May 2021
(This article belongs to the Special Issue Dynamic of Natural Ecosystems under Anthropogenic Disturbances)

Abstract

:
The purpose of this study is to reveal the spatial-temporal change and driving factors of green space in coastal cities of southeast China over the past 20 years. A supervised classification method combining support vector machines (SVMs) and visual interpretation was used to extract the green space from Landsat TM/OLI imageries from 2000–2020. The landscape pattern index was used to calculate geospatial information of green space and analyze their spatial-temporal changes. The hierarchical partitioning analysis was then used to determine the influences of anthropogenic and geographic environmental factors on the spatial-temporal changes in green space. The results indicated that the total area of green space remained constant over the past 20 years in coastal cities of southeast China (1% reduction). The spatial change of green space mainly occurred in the area near the ocean and the southern region. 41.37% of forest land was transferred from cultivated land, while 44.56%, 41.83%, 43.20%, 46.31%, 41.98% and 40.20% of shrub land, sparse woodland, other woodland, high-coverage grassland, moderate-coverage grassland and low-coverage grassland were transferred from forest land. The number of patches, patch density, edge density, landscape shape index and Shannon’s diversity index increased from 2000–2015, and then decreased to the minimum in 2020, while largest patch index continued to decline from 2000–2020. The contribution of anthropogenic factors (0.53–0.61) on the spatial-temporal changes of green space continually increased over the past 20 years, which was also higher than geographical environment factors (0.39–0.41). Our study provides a new perspective to distinguish the impact of anthropogenic activities and geographical environmental factors on the change of green space area, thereby providing a theoretical support for the construction and ecological management of green space.

1. Introduction

Green space is a landscape composed of various types and sizes of plant cover within the city [1,2,3]. In the urban system, it provides ecosystem services, such as shading, climate regulation, carbon sinking, biodiversity conservation and pollutant removal [2,3]. It also provides recreation ground for residents and beautifies the city, which is closely related to human lives [4,5,6]. Since the 1980’s, with the continuous education and publicity of the concept of ecological protection, the ecological service function of green space has attracted increasing attention from urban residents in China [3]. Government implemented many landscape greening and forest protecting projects, such as “Garden City”, “Livable City” and “Eco-City”, to increase the proportion of green space in cities [7,8]. As a result, China’s green space has increased 3.65 fold over the past 20 years [9]. However, China’s per capita green area in 2020 is only 1/4 of high-income countries like the United States and Canada (14.4 m2). Additionally, green space varies among regions due to a wide variety of factors, from geographical location, city size, and economic status [1,10,11]. For example, Zhou et al. found that the per capita green area in large cities is higher than that in medium and small cities by investigating 620 cities in China [10]. Cui et al. indicated the proportion of green space in urban built-up area in coastal areas was higher than that in inland areas after comparing the change of green space among 31 provinces of China [11]. Increasing green space area and reducing the imbalance in green space distribution are the infrastructure projects that attracted most attention from the government and local residents at present [7,12].
The change of green space is mainly affected by anthropogenic activities and geographical environment [3,13,14]. Anthropogenic activities refer to the continuous activities of human beings to transform nature in order to survive, develop, and improve living standards. Socio-economic determinants are commonly used for quantitative representation of anthropogenic activities in geographical research, including built-up areas, gross domestic product (GDP), fixed-asset investment (FAT), population and proportion of non-agricultural population (PNAP) and so on [15,16,17]. Existing studies have shown that socio-economic determinants played a significant role in the spatial-temporal change of green space [18]. For example, there is a positive correlation between GDP and green space [19,20]. This is because residents’ demands for ecological services provided by green space will continue to increase with life quality after their basic living needs are met. Thus government will invest more resources to increase the green area [18,21]. Geographic environmental factors also promote or limit the change of green space, because they affect the life history of plant distribution, colonization, survival and reproduction [3,22]. In arid cities, for example, water availability limits the extension of green space [23,24]. In hilly cities, green land area is significantly related to altitude. The area with more undulating terrain is not suitable for construction land, but is the main distribution area of forest [25]. However, at present, most studies usually only considered the influence of socio-economic determinants on spatial-temporal change of green space, ignoring the contribution of geographical environment factors [12,18,19].
The relative contribution of socio-economic determinants and geographical environment factors to the change of green space may vary with time [12,14,26]. This is because residents’ demand for ecological service of green space is closely related to the life quality and the disposable income, both of which are influence by socio-economic determinants such as GDP, population and FAT [3,27]. These factors all change over time. Similarly, the effects of geographical environment factors on plant colonization and survival also varied among different years [28]. For example, green space, especially grassland, would increase greatly in a year with abundance precipitation [29]. However, few studies have analyzed the relative contribution of socio-economic determinants and geographical environment factors to the change of green space area over time [14,17,30].
The coastal cities of southeast accounted for about 3.1% of China’s land. It is one of the areas with the fastest urbanization and the best economic development in China. The coastal cities of southeast have higher per capita income and gross national product among China’s 661 cities (including county-level cities) [9]. Local residents have higher requirements on quality of ecological services of green space. Government also takes the construction and protection of green space as an important aspect of its governance behavior. At present, many scholars have carried out some studies on green space in coastal cities of southeast China [9,12,13,31]. For example, Di et al. and Zhang et al. analyzed the spatial-temporal changes of green space [31,32]. Zhang et al., Xu et al., Dou and Kuang analyzed the impact of policies and regional economic factor on the change of green space [9,13,33]. Wu and Kim measured the uneven distribution of green spaces among regions [34]. Liu et al. analyzed the influence of rural urbanization and expansion of rural settlements on green space [35]. However, most of these studies focusing on the change and driving factors of the green space in this region were taken as components of the southeast region of China or the national scale [3,12]. There are currently lacks of studies focusing on this region at the local scale. In addition, the existing large-scale studies usually only considered the relationship between socio-economic determinants and green space, while ignoring the influence of geographical environmental factors [14,20]. Moreover, due to the significant differences in hydro-thermal conditions, influence of geographical environment factors on green space in coastal region may be different from that in inland areas [19,28]. It is thus unsuitable to use the existing results from the large-scale research to guide the construction and pretention of green space in coastal regions.
In this study, we collected data from remote sensing imageries and statistical yearbook. Then we analyzed the spatial-temporal change of green space, and its relationship with socio-economic determinants and geographical environment factors. We aim to answer the following two scientific questions: (1) what is the spatial-temporal change of green space in the coastal cities of southeast China over the past 20 years? (2) Do socio-economic determinants and geographical environment factors contribute differently to the spatial-temporal change of green space, and do they change over time? Our results provide theoretical support for the construction and planning management of green space in coastal cities of southeast China.

2. Materials and Methods

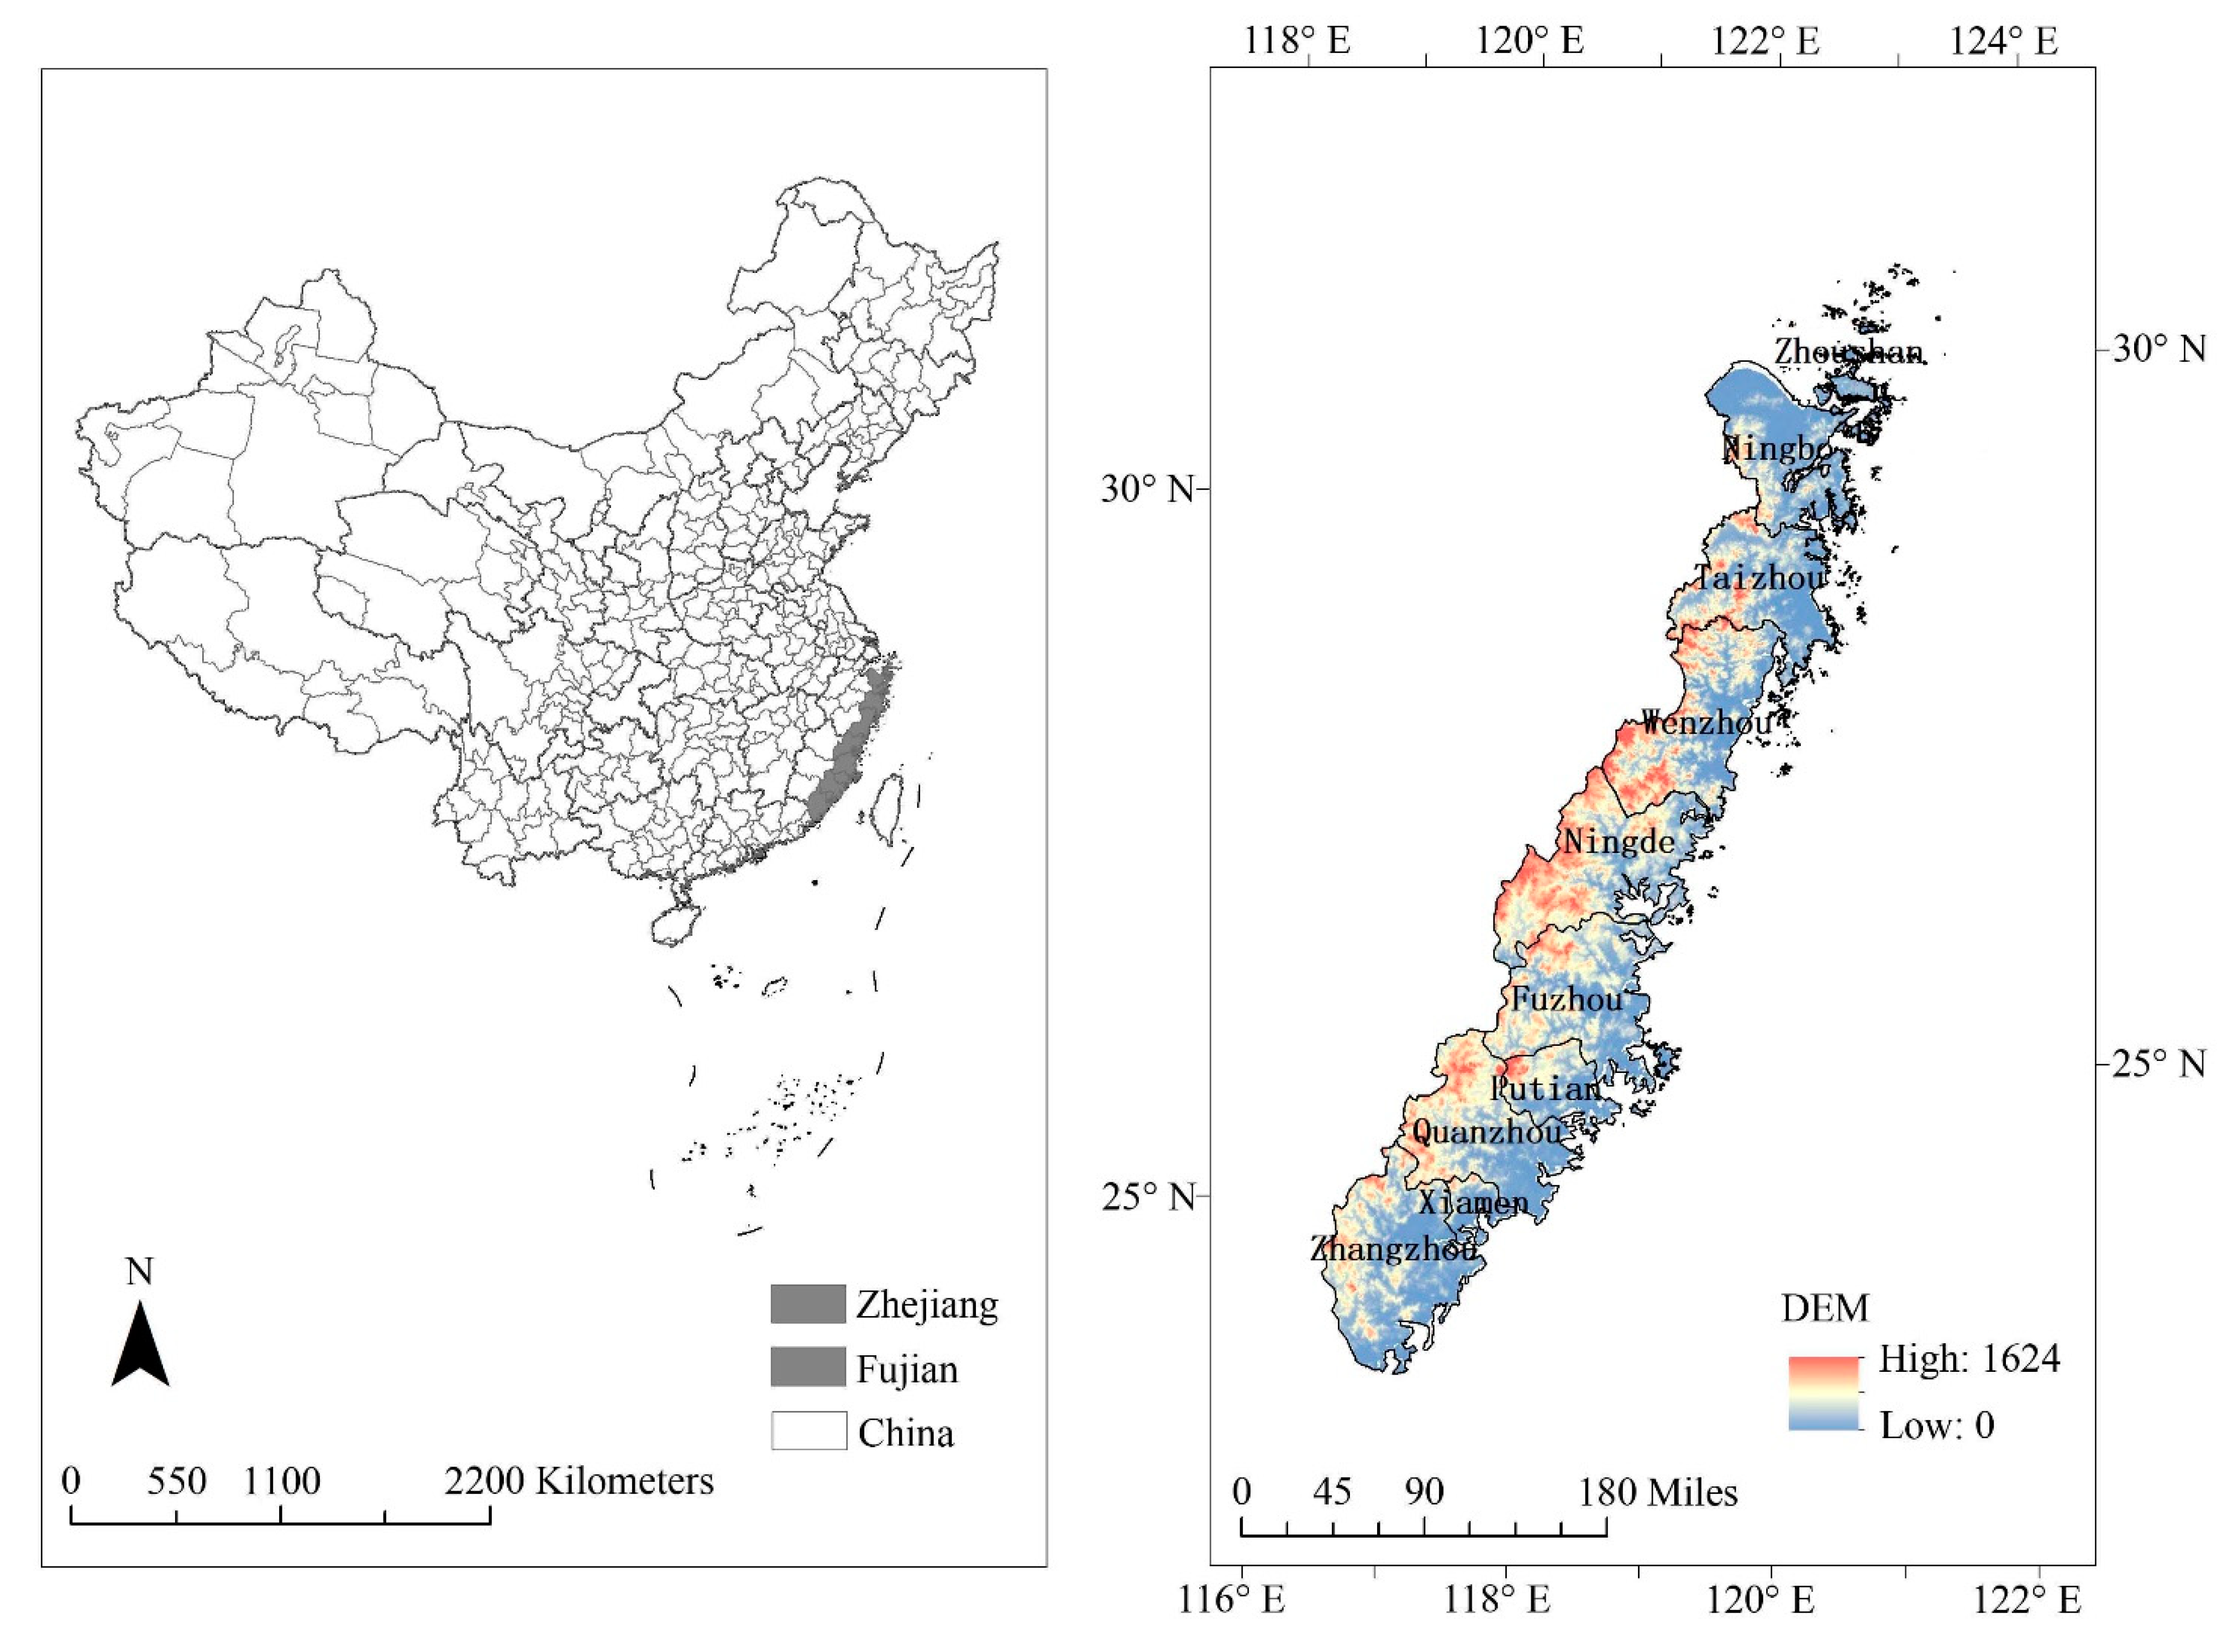
2.1. Experimental Site

The coastal cities of southeast China are mainly located in Zhejiang and Fujian provinces (23.8°~31.07° N, 117.00°~123.42° E), including Wenzhou, Ningbo, Zhoushan, Taizhou, Zhangzhou, Xiamen, Quanzhou, Putian, Fuzhou and Ningde (Figure 1). These cities have four distinct seasons and moderate climate due to the influence from the subtropical monsoon climate. The annual average temperature ranged from 17 °C to 20 °C, the highest average temperature is 28.0 °C in July, while the lowest is 5 °C in January. The annual precipitation is about 1400~2200 mm, and the annual evaporation ranged from 1300–1600 mm. This region belongs to the hilly landform. The landform type is mainly low mountains and hills. Most of the inland regions are mountainous and hills, while a small number of low alluvial plains distributes in the coastal areas. According to the World Reference Base for Soil Resources, the soil is Ferralsols [25]. The survival of local residents is mainly based on business as influenced by Marine culture in history. Small and medium-sized private enterprises accounted for about 60% of the total economic. According to the China Statistical Yearbook in 2020, permanent population of this region is more than 56 million, and the annual GDP reaches about 138,703 billion RMB [11].

2.2. Data Collection

The Landsat TM/OLI remote sensing imageries of five periods (i.e., 2000, 2005, 2010, 2015 and 2020) were downloaded from the Geospatial Data Cloud (http://www.gscloud.cn/, accessed on 5–10 February 2021). In order to avoid seasonal changes in the spectral information in the classification of green area, the remote sensing imageries were collected in September. If the cloud cover is larger than 20% in September, the imageries from their adjacent months were used. The ENVI 5.3 software was used to preprocess image data, such as geometric correction, registration, radiometric correction, stitching and clipping.
The influencing factors of the spatial-temporal change of green space included socio-economic determinants and geographical environment factors. Geographical environment factors included annual precipitation (AP), average temperature (AT), annual evaporation (AE), water resources per capita (WRPC), elevation and green area per capita (GAPC). Socio-economic determinants were composed of GDP, population, GDP per capita, proportion of non-agricultural population (PNAP), living space per person (LSPP), fixed-asset investment (FAT), real estate investment (REI) and the proportions of primary, secondary and tertiary industries (PPI, PSI and PTI). AP, AT and AE were obtained from China Meteorological Data Network (http://data.cma.cn/, accessed on 8 February 2021) (Table 1). Elevation was obtained from Digital Elevation Model (DEM) data, which was extracted from SRTM DEM data with 90 m resolution using SAGA GIS software. In order to maintain the consistency of elevation and other influencing factors of green space in the sampling area, the average of all grids (90 m × 90 m) in a given urban administrative area was used to represent the city elevation. The remaining factors were collected from China Statistical Yearbooks and regional statistical bulletins. The selection of socio-economic determinants and geographical environment factors was based on the previous studies [14,16,18]. All factors selected were proved to affect the change of green space.

2.3. Data Analysis

According to the classification standard of China Land Use and Land Cover Change (LUCC) [36], a supervised classification method combining support vector machines (SVMs) and visual interpretation was used to extract green space from Landsat TM/OLI remote sensing imageries in ENVI 5.3 software. Landsat TM/OLI imageries has spatial resolution of 30 m, which provides convenient and effective data support for the study of green space changes and is widely used by many scholars [9,13,19,25]. In a remote sensing imager, green space refers to the area with the significant difference in plant spectral information, such as Normalized difference vegetation index (NDVI), compared with the surrounding regions. It can be further divided into two categories: woodland and grassland [13,35]. Woodland refers to the land for the growth of trees, shrubs, bamboos, and coastal mangrove [35]. Grassland is a place dominated by grasses and other herbaceous plants and the coverage is more than 5% [26]. Based on the features of pixels, these two types of green space are further divided into four (forest land, shrub land, sparse woodland and other woodland) and three (high-, moderate- and low-coverage grasslands) sub-types, respectively (Table 2) [26,37]. Finally, ArcGIS 10.6 software was used to generate the distribution map of different sub-types of green space, and then their areas were calculated.
The landscape pattern index was used to analyze the change and morphological characteristics of green space, which included the number of patch (NP), patch density (PD), the largest patch index (LPI), edge density (Ed), landscape shape Index (LSI) and Shannon’s diversity index (SHDI) [38]. The calculation method of these indices was available at Jian et al., and Ren et al., [38,39]. In this study, all landscape pattern indexes were calculated using Fragstats4.2 software based on the distribution map of green space.
In order to analyze the transition between green space and other land-use types, five land-use types, including cultivated land, water area (i.e., river canal, lake, reservoir, beach and tidal flats), unused land, construction land and ocean, were further extracted from remote sensing imageries based on the classification standard of China LUCC [36]. Then, 500 points were randomly selected for testing the accuracy of the classified images by comparing with the land-use type of Google Earth. The overall classification accuracy was 92% and the Kappa coefficient was 0.79. After that, the Markov transition matrix was used to analyze the transfer rate between green space and other land-use types over the past 20 years. Hierarchical partitioning analysis was used to calculate the contributions of influencing factors (i.e., ten socio-economic determinants, and six geographical environment factors) on the spatial-temporal change of green space area. Implementation of Markov transition matrix and hierarchical partitioning analysis was completed in ArcGIS10.6 and R4.3.1 software, respectively.

3. Results

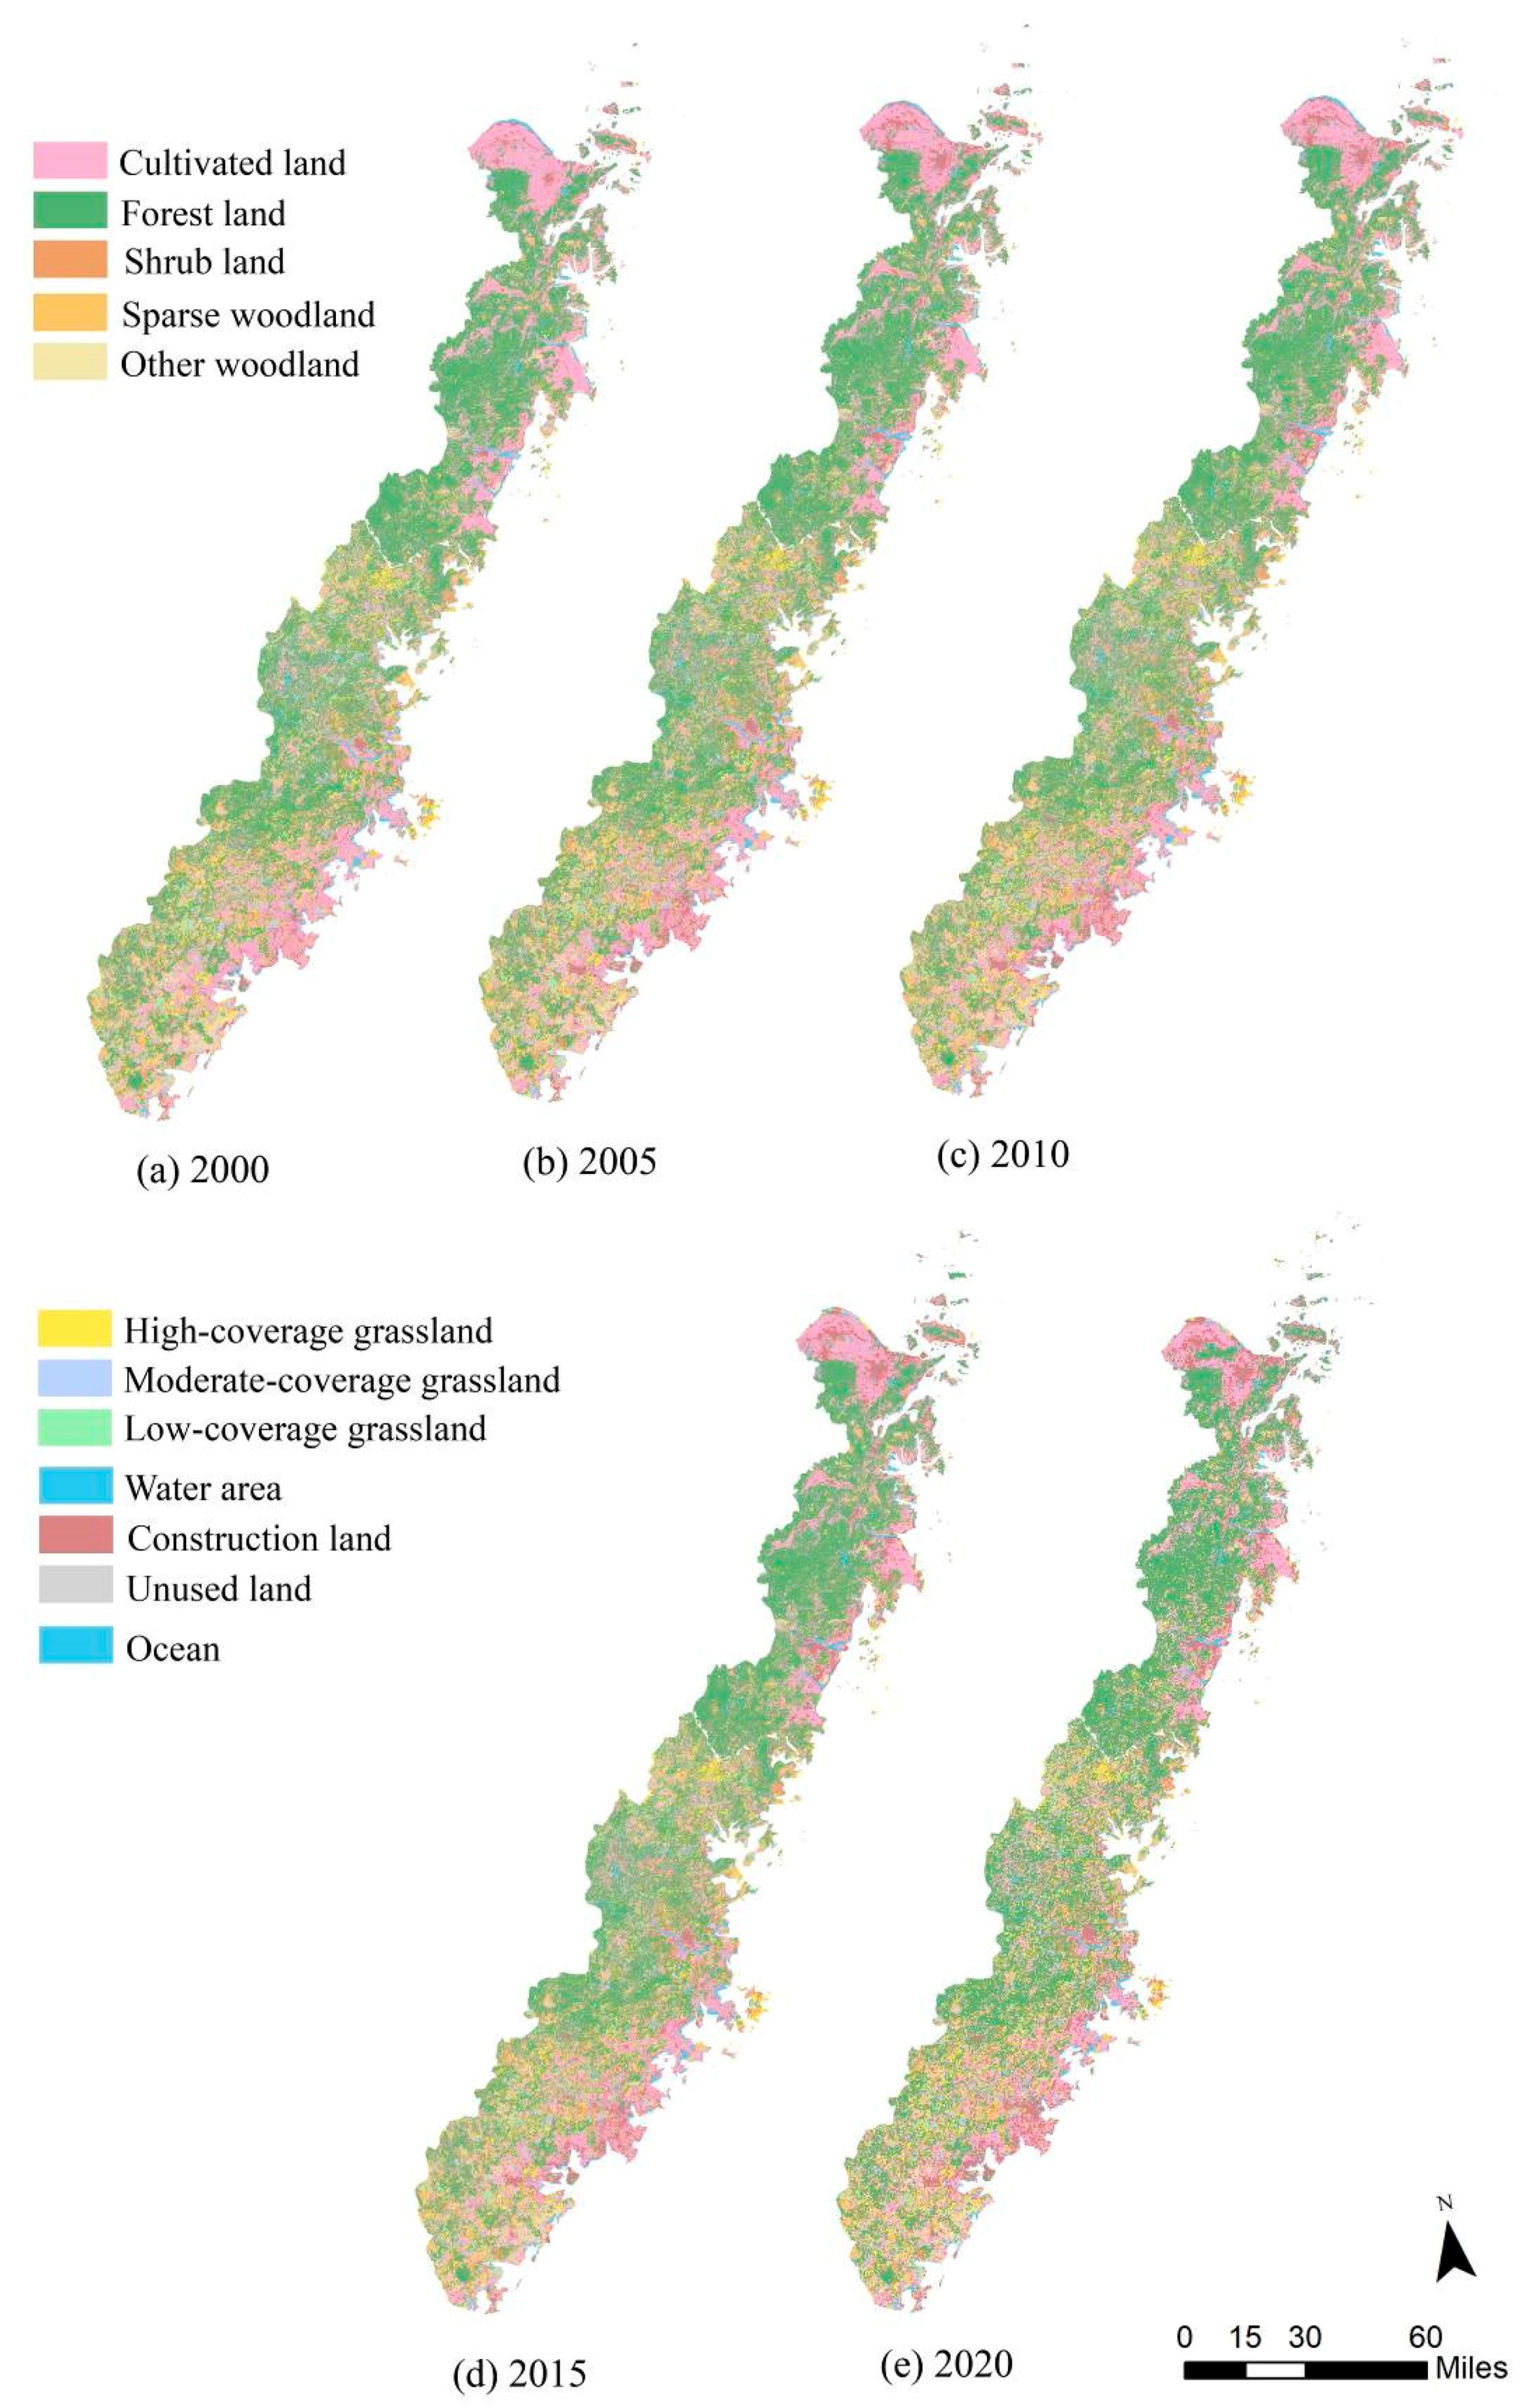
3.1. Changes in the Areas of Green Space and Its Five Sub-Types over Time and Space

The total area of green space of 2000, 2005, 2010, 2015 and 2020 in the coastal cities of southeast China was 58,003.76, 57,444.94, 57,252.69, 57,177.76 and 57,367.74 km2, respectively (Figure 2 and Table 3). Green space decreased by 636.01 km2, but the reduction rate was only 1% over the past 20 years (Figure 2 and Table 3). However, the change of green space differed among periods. Total area of green space continued to decline from 2000–2015, but it increased in the following five years (2015–2020) (Figure 2 and Table 3).
The changes of woodland differed from grassland over the past 20 years (Figure 2 and Table 3). Woodland has the similar change in area with green space, which decreased from 2000–2015 and increased since then. On the contrary, grassland area has been continuously decreasing over the past 20 years, with a total decrease of 360.20 km2 (Figure 2 and Table 3). Among three sub-types of grassland, high-coverage grassland showed a slight increasing trend, while moderate- and low-coverage grasslands decreased continuously over the past 20 years (Figure 2 and Table 3).
There are obvious spatial differences in green space over the past 20 years. The spatial change of green space mainly occurred in eastern regions close to the ocean, while inland located in central and western regions were less changed (Figure 2). Additionally, south had larger change of green space than that of north region (Figure 2).

3.2. Transformation between Different Sub-Types of Green Space

The results of Markov land-use transition matrix showed that the main source of forestland was cultivated land in the past 20 years, accounting for about 41.37% of its total change (3644/(35,157 − 26,349) = 41.37%) (Table 4).
The main sources of shrub land, sparse woodland, other woodland, high-, moderate- and low-coverage grasslands were forest land, which accounted for 44.56%, 41.83%, 43.20%, 46.31%, 41.98% and 40.20% of the total area change of these sub-types, respectively (Table 4).

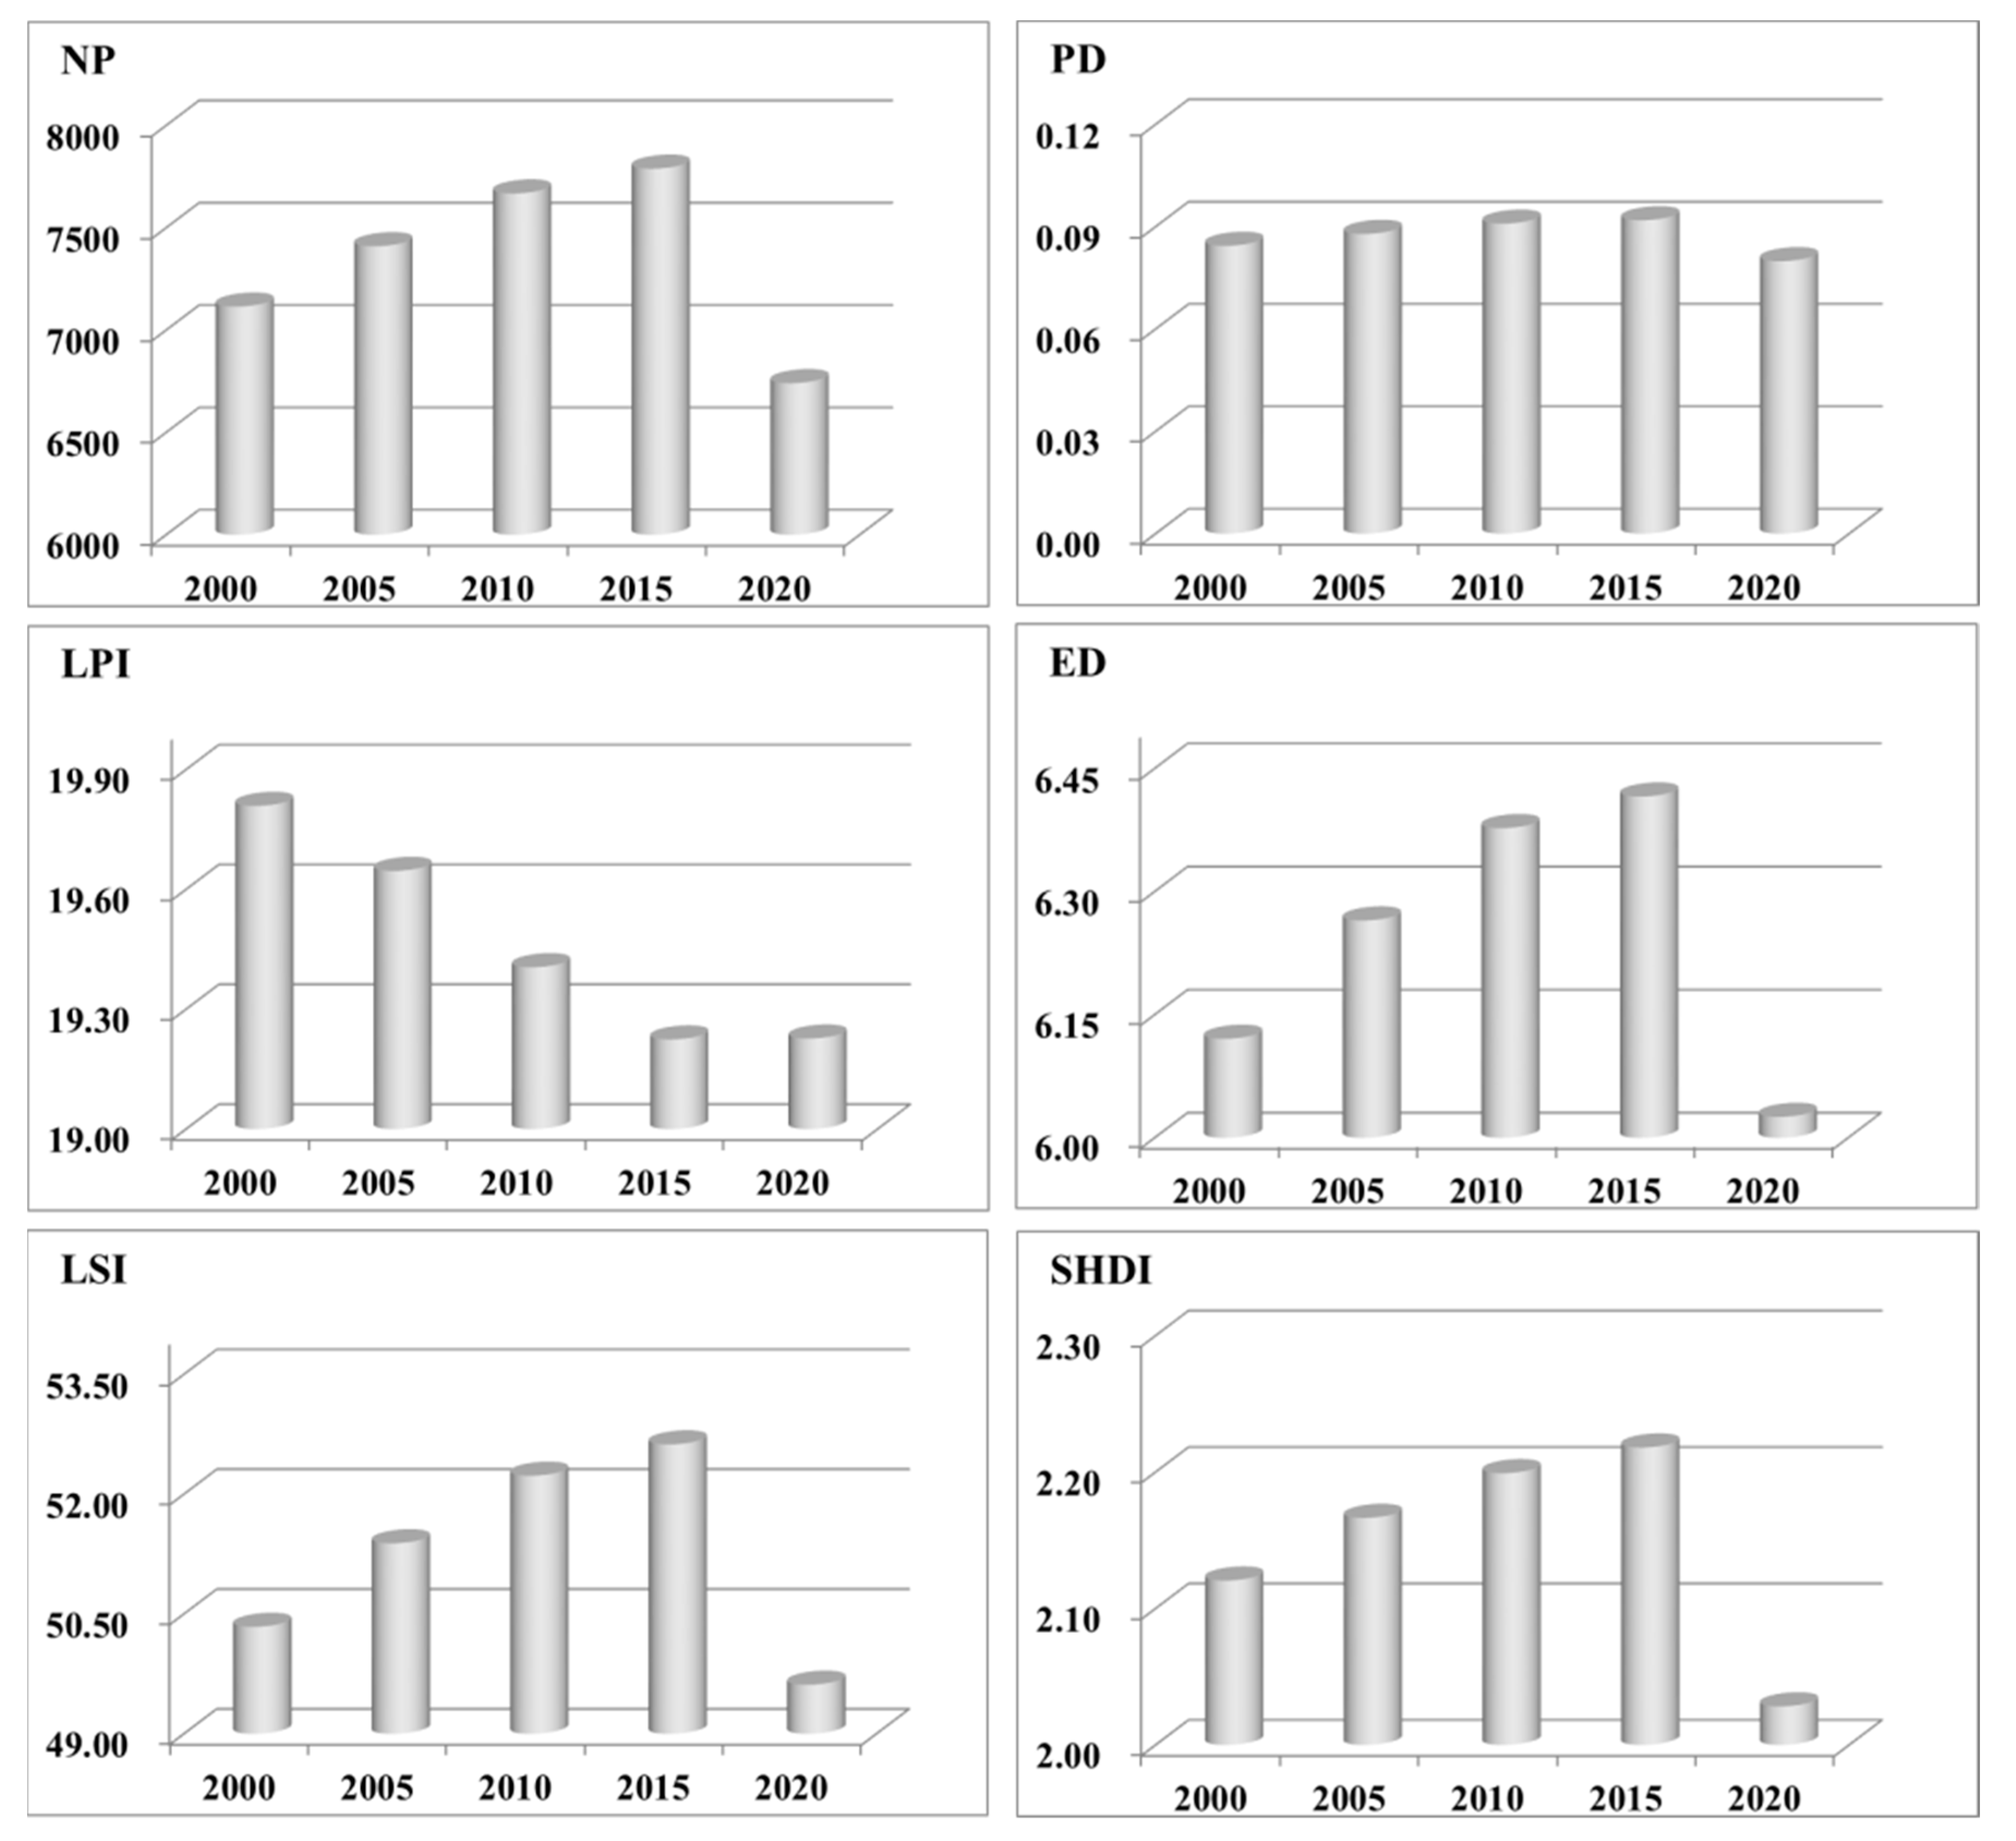
3.3. The Change of Landscape Pattern Index of Green Space

NP, PD, ED, LSI and SHDI increased from 2000 to 2015, and then began to decline rapidly in the last five years (2015–2020). In contrast, LPI has continued to decline over the past two decades (Figure 3).
NP, PD, ED, LSI and SHDI of green space in 2020 were all smaller than those in 2000, 2005, 2010 and 2015 (Figure 3), indicating that the fragmentation degree of green space in 2020 was lower than those in these previous years.
Moderate- and low-coverage grasslands showed an opposite change in landscape pattern indicators with the forest land, shrub land, sparse woodland, other woodland and high-coverage grassland. Specifically, NP, PD, ED, LSI of moderate- and low-coverage grasslands decreased over the past 20 years (Table 5).

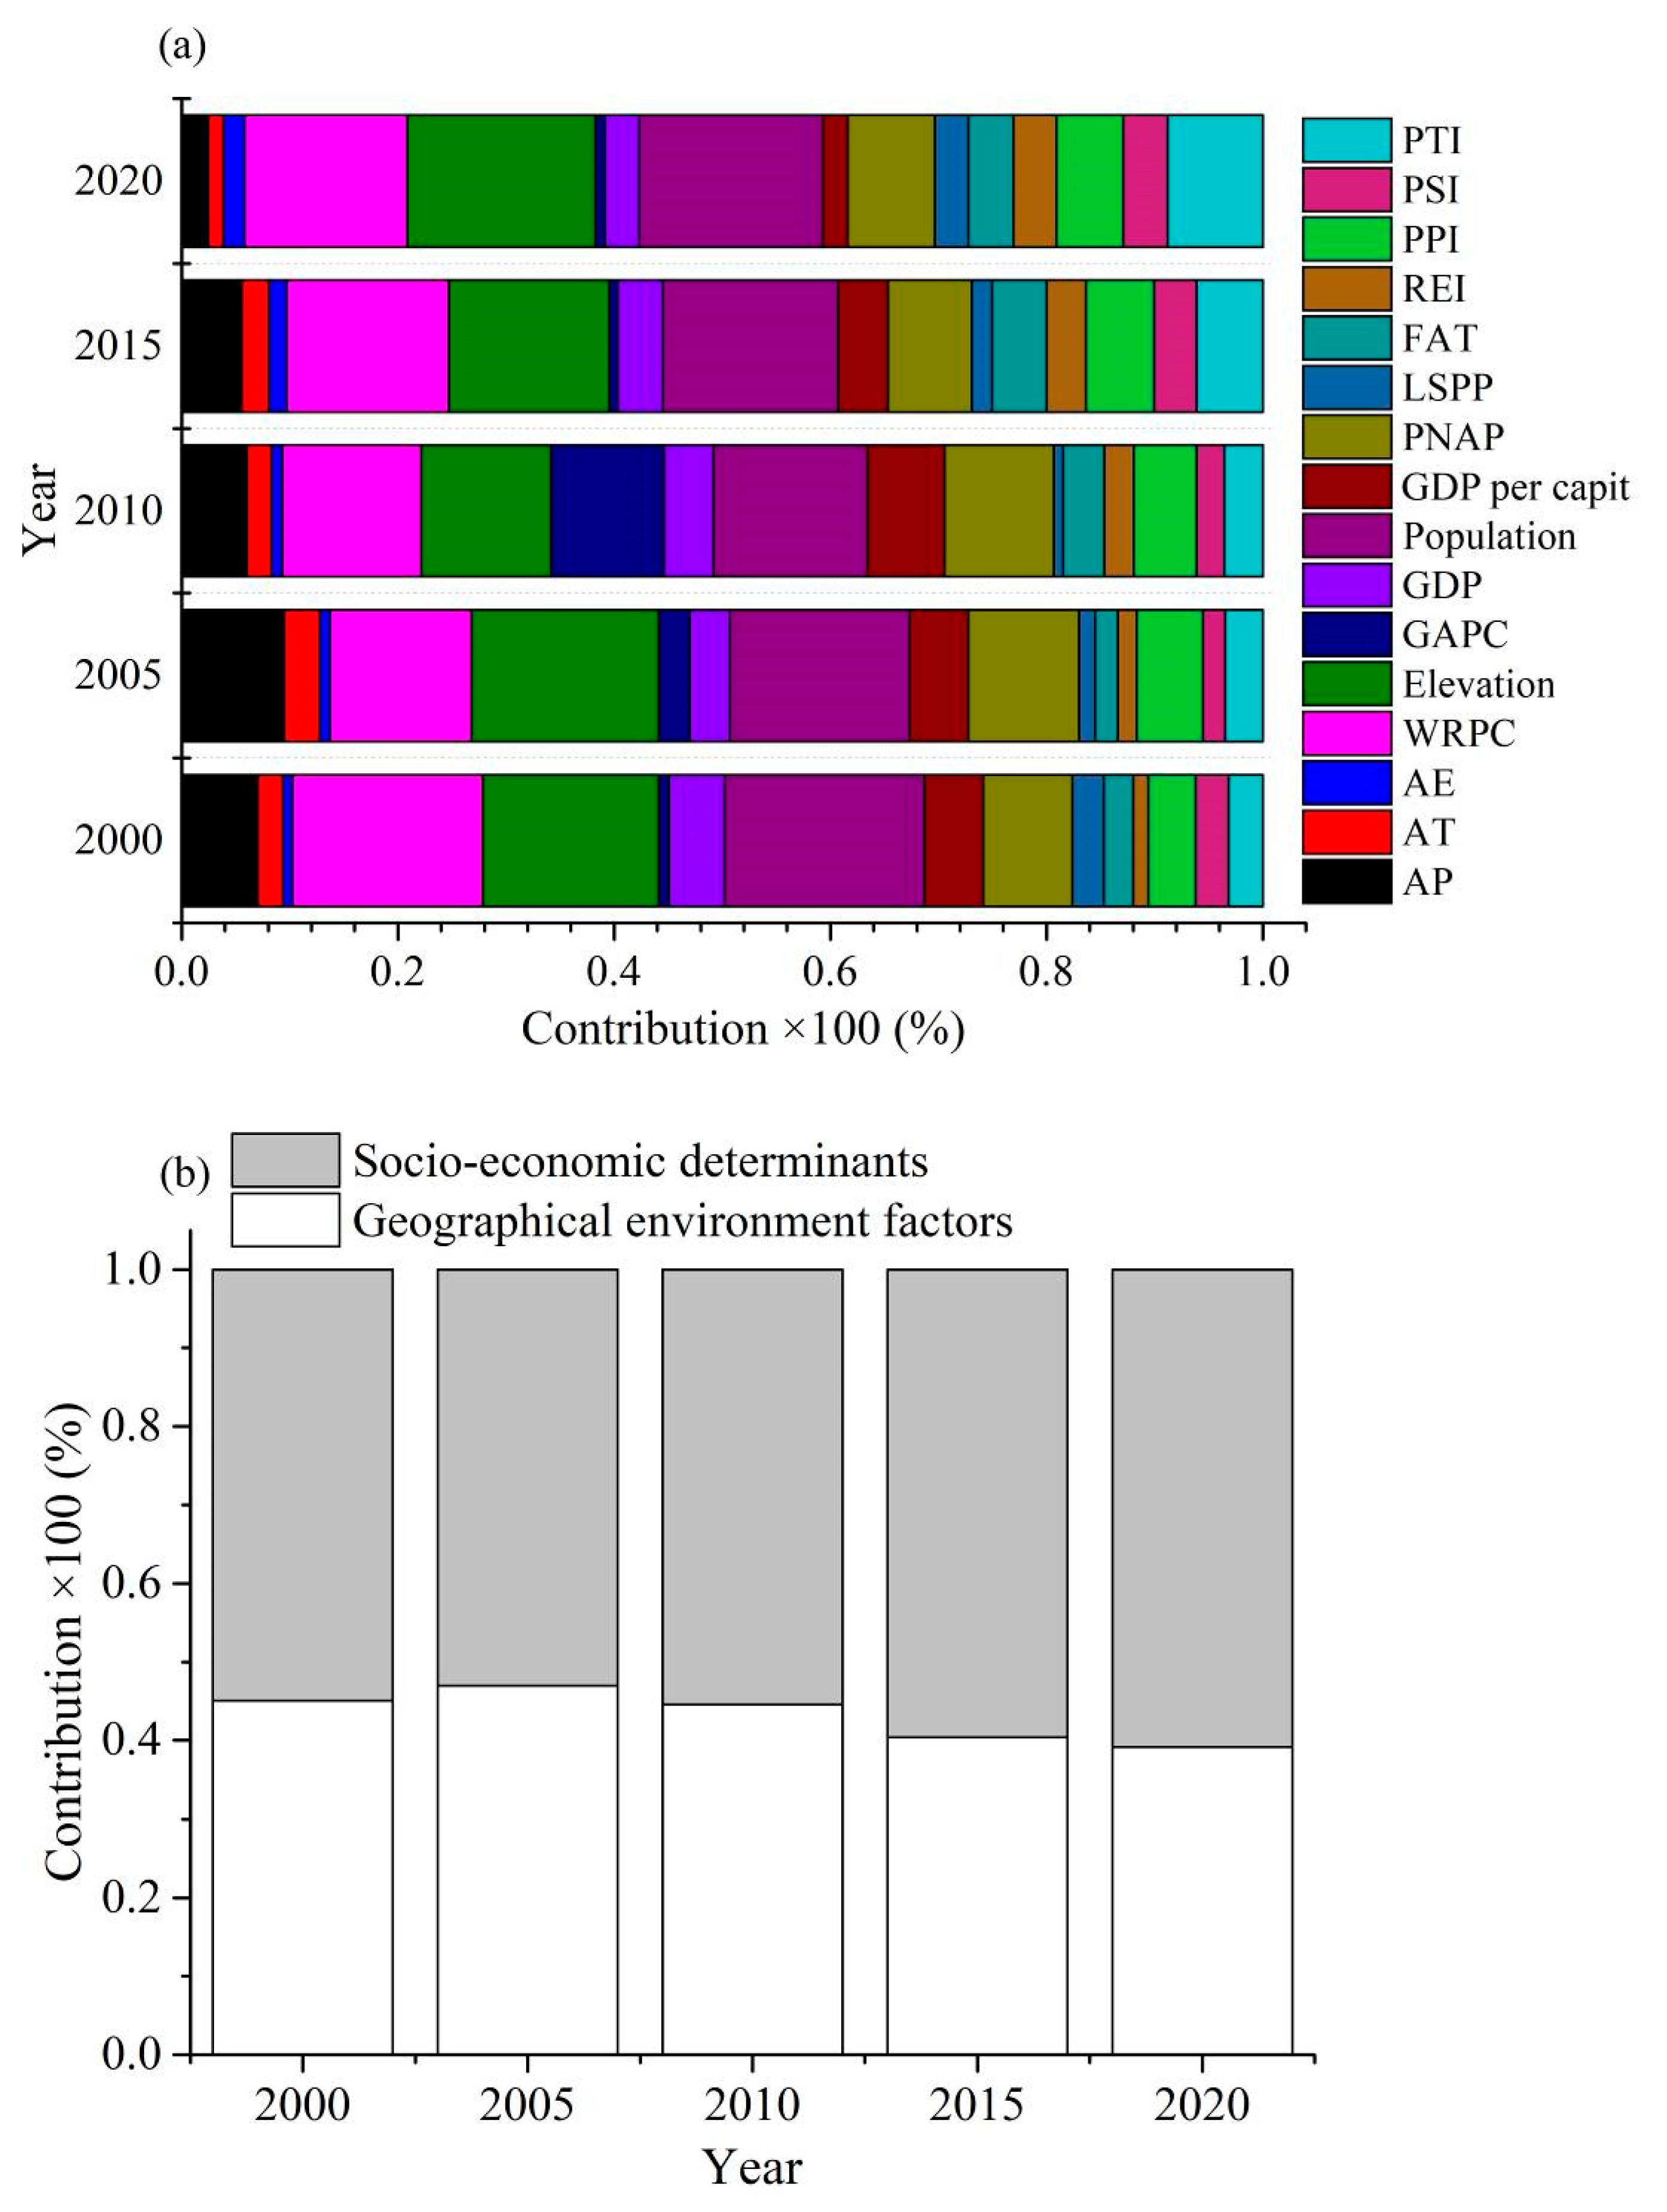
3.4. The Contribution of Socio-Economic Determinants and Geographical Environment Factors to the Spatial-Temporal Change of Green Space

The results of hierarchical partitioning analysis showed that the contribution of socio-economic determinants to the spatial-temporal change of green space (0.53–0.61) was higher than that of geographical environment factors (0.39–0.41) (Figure 4). Additionally, the contribution of socio-economic determinants to the change of green space increased with time, while that of geographical environment factors decreased gradually (Figure 4).
Among the 11 socio-economic determinants, population and PNAP contributed the most to the change of green space, which accounted for 17% ± 2% and 9% ± 1%, respectively (Figure 4). Elevation and WRPC were the most important factors for the change of green space compared with other geographical environmental factors, accounting for 15 ± 2% and 16 ± 2% of the variance of the green space change, respectively (Figure 4). Compared with elevation, WRPC, population and PNAP, the contribution of other residual factors to the spatial-temporal change of green space was all small, ranging from 0.01–0.06 (Figure 4).

4. Discussion

4.1. Spatial-Temporal Change of Green Space in Coastal Cities of Southeast China over the Past 20 Years

Our results showed that the total area of green space remained roughly stable in coastal cities of southeast China over the last 20 years. The results were similar to that reported in previous studies [30,40,41]. For example, Liu et al. found that green space area in Zhejiang Province decreased by only 5% from 1990–2015 [42]. Cui et al. suggested that the change of forestland and grassland in coastal areas of Zhejiang Province were all less than 1% from 1990–2010 [40]. However, the change of green space differed among periods, which declined from 2000–2015, while increased from 2015–2020. These two distinct changes were mainly related to the policies implemented by the Chinese government [14,43]. Before 2015, the rapid urbanization and economic development brought a large number of rural populations into cities, leading to more demand for construction land to meet housing, commercial and industrial buildings [12]. Although forest protection and green space construction were advocated by Chinese government in this period, the market-driven real estate development has transformed woodland, especially for forestland in plain region, into construction land, ultimately leading to a continuous decline in green space. In 2015, the real estate in cities became saturated as the rate of China’s urbanization increase began to slow [44,45]. The government began to implement some purchase restriction policies to reduce development of real estate [14]. The transformed area from woodland to construction land was reduced. At the same time, Chinese government has begun to pay attention to environmental protection and has adopted “green development” as an important concept for long-term economic and social development [46,47]. A prime example is that “clear waters and green mountains are as valuable as gold and silver” has been written into China’s central government documents [48]. The increasingly stringent environmental protection policies and implementation force reduced forest land from being converted to construction land. In addition, China has begun to promote the construction of “beautiful countryside” and “rural tourism” in order to integrate urban-rural development [8,49]. Governments and enterprises increased investment in the greening of rural areas in suburbs, resulting in an increase of green space [50].
Woodland showed a different spatial-temporal change from grassland in coastal cities of southeast China. This might relate to the natural landscape background of the local green space. Zhejiang and Fujian provinces belong to subtropical region, owing the superior natural conditions, especially abundance precipitation and suitable temperature for plant growth, which makes local zonal vegetation as the evergreen broad-leaved forest [25,51]. This can be proved by the distribution of sub-types of green space. Our results showed that woodland areas were about 5 times as larger as grassland. In the absence of anthropogenic disturbance, all areas were woodland. However, grassland will appear in the transition gap from grassland to construction land after deforestation. Further transformation from grasslands into construction land resulted in a decline of grassland from 2000–2015. After 2015, the adjustment of real estate and environmental protection policies enabled grassland to be nurtured into woodland, leading to a continuous decrease in grassland area [14,44].
High-coverage grassland showed an opposite change with moderate- and low-coverage grasslands in coastal cities of southeast China over the past 20 years. This may be due to their different sources. Moderate- and low-coverage grasslands were primarily the first successors of deforested land, or unused and pre-building lands where plants grow temporarily. On the contrary, in addition to the similar source with the moderate- and low-coverage grasslands, most of the high-coverage grassland was the lawn planted in parks, road green belt and residential areas [41]. In the past 20 years, development of unused and pre-building lands all resulted in a continuous decrease in the area of moderate- and low-coverage grasslands. However, as the increase of built-up areas, more and more artificial lawns were built in parks and residential areas, leading to a continuous increase in area of high-coverage grassland [52].
The spatial change of green space mainly occurred in the area near the ocean and the southern region. These might be determined by the topography. In the region studied, mountains mainly distributed in the central and western regions, while plains are located in the eastern region [25,53]. This made urban centers primarily locate in the eastern region [54]. As rapid urbanization mainly occurred around urban centers, green space changes caused by anthropogenic activities were mainly concentrated in eastern coastal regions. In the direction of latitude, the terrain in the north is more undulating than that in the south, resulting in difficulties in land development in the north [41]. Thus, the change of green space in the south was larger than that in the north.

4.2. Cultivated Land Transformed into Forestland, and Further Transformed into Other Sub-Types of Green Space

Our results showed that the majority of forestland was transformed from cultivated land. This result was caused by the change of local agriculture and forestry structure. Since the 1990’s, small and medium-sized private enterprises have gradually become the most important industrial type in coastal cities of southeast China. Farmers gradually changed from the traditional subsistence mode of farming to owners or workers of small and medium-sized enterprises [55]. 80% of the people in coastal cities of southeast China were employed in small and medium-sized private enterprises [39]. At the same time, a large number of green plants were required in real estate development and urban construction due to the rapid urbanization [18,19]. Local farmers leased their arable land to a handful of enterprises or individuals for planting green seedlings. A large proportion of cultivated land was transformed into plant nurseries.
Shrub land, sparse woodland, other woodland, high-, moderate- and low-coverage grasslands were mainly transformed from forest land. This was consistent with a continuous decline in forest land over the past 20 years. Specifically, urbanization resulted in transformation of some forest land into construction land. Before the house can be built, the secondary succession would cause the deforested land to temporarily change to other woodland types and grassland [40,41]. Moreover, in order to improve residential landscape aesthetics, many artificial green lands, such as parks and green belts, were constructed in the construction land [4,17]. However, it is difficult for the man-made green landscape to naturally evolve into forest land due to the isolation of nutrient and hydro-thermal circulation from natural environment. Instead, they can only grow into other sub-types of woodland with less environmental requirements, such as sparse woodland and grassland.

4.3. Anthropogenic Activities Increased the Fragmentation of Green Space

According to previous studies, the increase of NP, PD, ED, LSI and SHDI suggested the increase of fragmentation degree and irregular plaque [38,39]. The decrease of LPI reflected that the proportion of large plaque of green land reduced continuously [28]. The results in this study showed that there are differences in landscape pattern index between from 2000–2015 and that from 2015–2020. As mentioned above, Zhejiang and Fujian provinces belong to hilly terrain. Under the environmental conditions of abundant water and heat, the backland of land-use types was subtropical evergreen broad-leaved forest and paddy field, which mainly distributed on the mountain and plain, respectively [41,56]. With the rapid development of China’s economy after the 1980s, the intensification of urbanization lead to the transformation of large distributed forests and paddy fields into a variety of land-use types with small patches [26,57]. After 2015, China began to implement new environmental protection policies such as “Beautiful Countryside Construction” and “Rural Tourism” [46,47]. As a result, the area of green land began to increase, resulting in a decreasing trend of NP, PD, ED, LSI and SHDI. Similar with green land, NP, PD, ED and LSI of forest land, shrub land, sparse woodland, other woodland and high-coverage grassland all increased from 2000–2015, and then decreased in the next five years, while LPI showed a completely opposite trend (Table 5). This is consistent with the previous result of the change among different land-use types. More than 40% of shrub land, sparse woodland, other woodland and high-coverage grassland were transformed from forest land (Table 4). The rapid urbanization caused the transformation of large area of forest land into small area of fragmented distribution of other green land types [14,18,26]. This in turn resulted in the changes of these landscape pattern indicators.
The fragmentation degree of green space in 2020 was lower than those in 2000, 2005, 2010 and 2015. This suggested that environmental protection policies have a huge impact on the change of landscape pattern index in coastal cities of southeast China, which can offset the impact of urbanization on the fragmentation of green space in a short term [26,58]. However, the reduction in landscape pattern index after 2015 was not caused by an increase in the total area of green space, but by a rapid decrease in the number and area of low-quality patches. The implementation of environmental protection policies was to transform the low quality (or coverage) green space into the high quality one. At the same time, the small adjacent green patches were combined into the large one [14,44]. Since 2015, the strict implementation of environmental protection policies resulted in that green space rarely continue to be fragmented caused by urban construction in China [46,47]. On the contrary, human-induced vegetation restoration transformed and combined shrub land, sparse woodland, and other woodland into forest land. In addition, the rapid decrease of landscape pattern index of green space had also related to the local natural conditions. In the abundance hydro-thermal conditions, the lower quality green space can be transformed into high quality green space in a short time, which also reduced the number and area of the lower quality green space [41,53]. These changes in turn made NP, PD, ED, LSI and SHDI of green space decreased significantly, and reached the minimum in 2020 (Figure 3). This can also be seen in changes in sub-types of green space. The areas of shrub land, sparse woodland and other woodland decreased from 2015–2020, while that of forest land increased continuously (Figure 2 and Table 3).

4.4. Socio-Economic Determinants Had Larger Contribution to the Spatial-Temporal Change of Green Space Compared with Geographical Environment Factors

Our results showed that socio-economic determinants had larger impact on the spatial-temporal change of green space compared with geographical environment factors. This was consistent with the results of previous studies that anthropogenic activities, especially urbanization, were the largest drivers for land-use transformation after 1980s in China [3,12,14]. This result is verified by the differentiated contribution of different socio-economic determinants to the change of green space. Population and PNAP contributed the most to the change of green space (Figure 4). This was because these two indicators are closely related to the labor force that transforms nature [20]. The increase of labor force was the fundamental driving force of urbanization and the premise of human’s transformation of land-use [17,54]. The influence of other socio-economic determinants on the change of green space was indirectly driven by the change of labor force [14,40].
The total contribution of geographical environmental factors to the spatial-temporal change ranged from 0.39–0.41 (Figure 4). This value was different from the research results of Li et al. [16], Luo et al. [59] and Chang et al. [28] in northwest and central China, respectively. This may be due to differences in the natural environment. Although Zhejiang and Fujian provinces have the relatively high hydro-thermal conditions, the proportion of plains in the total land area is at a relatively low level due to the influence of hilly topography [41,53]. Therefore, the complex terrain, such as elevation and slope, was the main limiting factor of vegetation extension and anthropogenic activities to transform nature [55,60]. In addition, the amount of water resources was also an important factor limiting the change of green space. In the process of urbanization, the original forest land transformed into building land and other green land types. In cities, the man-made green land types, such as grassland in park and playgrounds, and green belt plants along the road, mainly depended on the secondary/reclaimed water to survival [61,62]. The amount of water resources had a close positive correlation with that of secondary water used for greening. In this case, WRPC had a limiting effect on the change of green space. This can also be proved in the results of this study. We found that elevation and WRPC were the most important factors for green space change compared with other geographical environmental factors, accounting for 15 ± 2% and 16 ± 2% of the variance of the green space change, respectively (Figure 4).
Except for elevation, WRPC, population and PNAP, the residual factors contributed little impact on the spatial-temporal change of green space (Figure 4). This suggested that these factors have little impact on the change of green space. Among these factors, average temperature and annual evaporation have the least influence on the change of green space (<0.02) (Figure 4). This is probably because temperature and evaporation are not the limiting factors of spatial distribution and survival of plants within a regional scale in subtropical region [56]. Our results also showed that the impact of PPI, PTI, PSI and REI on the change of green space continued to increase over the past 20 years, whereas that of other factors did not show a consistent tendency. PPI, PTI, PSI and REI are indicators related to the investments in land development. The increase of PPI, PTI, PSI and REI indicated the extension of residential, industrial and commercial areas [12,18,26]. In the process of urbanization, in order to improve the ecological service function of the plant system and the comfort of the landscape, the artificial green space, such as park, road green belt, and residential green space, will be continuously increased with the area of urban built-up area [7,26]. Therefore, the contribution of PPI, PTI, PSI and REI to the change of green space increased continuously over the past 20 years (Figure 4).
In addition to the 17 driving factors involved in this study, policies, especially for government policies and regulations on real estate development and environmental protection, are another important factor affecting the spatial-temporal change of green space [26,58,61]. In the past 20 years, Zhejiang and Fujian provinces implemented a series of key afforestation projects, such as “Urban Ecological Corridor Construction”, “Close Hillsides to Facilitate Afforestation”, “Greening Demonstration Village” and “Beautiful Village”, which greatly improved the greening area. However, in this study, we only assessed policy factors as the potential or explanatory factors affecting socio-economic determinants and green space. This limited the explanatory ability of our results on the spatial-temporal change of green space in coastal cities of southeast China, and more research should be conducted in the future.

5. Conclusions

The purpose of this study is to analyze the spatial-temporal change of green space in coastal cities of southeast China over the past 20 years, and to analyze the relative contributions of socio-economic determinants and geographical environmental factors to this change. Our results showed that the green space area remained stable over the past 20 years. After classifying green space into woodland and grassland, we found that the area has changed differently over the past 20 years. The total area of woodland decreased from 2000–2015, but since then it increased, whereas grassland decreased continuously over the past 20 years. The change of green space had mainly concentrated in the area near the ocean and the southern region. The results of land-use transfer matrix showed that the increase of forest land was mainly from cultivated land, but the main transfer sources of shrub land, sparse woodland, other woodland, high-coverage grassland, moderate-coverage grassland and low-coverage grassland were all from forested land. The rapid urbanization, especially the real estate development, changed the large area of green patches into scattered small patches, which changed landscape pattern indexes. However, moderate- and low-coverage grassland did not show such a trend, and they changed from small patches to large patches. The contribution of socio-economic determinants to the change of green space in coastal cities of southeast China was higher than that of geographical environmental factors. Among the 17 driving factors, elevation, WRPC, population and PNAP contributed more to the change of green space. Our results indicated that both anthropogenic activities and geographical environmental factors can affect the spatial-temporal change of green space in coastal cities of southeast China, but the role of the former was relatively greater than the latter. In the construction and management of green space, the dual influence of anthropogenic activities and geographical environmental factors should be considered simultaneously. The results are helpful to understand the driving factors of green space, and provide guidance for the protection of green space ecosystems in coastal cities of southeast China. National and local policies, such as urban planning, real estate development and environmental protection, can also influence the spatial-temporal change of green space. However, we did not include policies in the data analysis in this study, and more work needs to be done in the future.

Author Contributions

Conceptualization, H.W., F.C., R.M., X.S. and Y.G.; Funding acquisition, X.Y.; Investigation, H.W.; Methodology, H.W., Y.G. and X.Y.; Supervision, X.Y. and Y.G.; Writing—original draft, H.W., X.Y., Y.G. and L.Z.; Writing—review & editing, F.C., R.M., Y.L. and W.Z. All authors have read and agreed to the published version of the manuscript.

Funding

This work was supported by the National Natural Science Foundation of China (Grant Nos. 41771174, 41871031 and 31860111), and Ningbo Natural Science Foundation (202003N4133).

Data Availability Statement

All data used in this study are issued by Geospatial Data Cloud, China Meteorological Data Network and China Statistical Yearbooks and regional statistical bulletins. This data can be found here: (www.gscloud.cn/, accessed on 5–10 February 2021; http://data.cma.cn/, accessed on 8 February 2021).

Conflicts of Interest

The authors declare no conflict of interest.

References

  1. Semenzato, P.; Sievänen, T.; Oliveira, E.; Soares, A.L.; Spaeth, R. Natural Elements and Physical Activity in Urban. Green Space Planning and Design; Springer: Dordrecht, The Netherlands, 2011. [Google Scholar]
  2. Olga, B.; Jamie, A.T.; Paul, R.A.; Richard, G.F.; Pat, J.; Kevin, J.G. Who benefits from access to green space? a case study from sheffield, uk. Landscape Urban Plan. 2007, 83, 187–195. [Google Scholar]
  3. Li, X.; Ma, X.; Hu, Z.; Li, S. Investigation of urban green space equity at the city level and relevant strategies for improving the provisioning in China. Land Use Policy 2021, 101, 105144. [Google Scholar] [CrossRef]
  4. Chang, J.; Qu, Z.; Xu, R.; Pan, K.; Xu, B.; Min, Y.; Guofu, Y.; Ying, G. Assessing the ecosystem services provided by urban green spaces along urban center-edge gradients. Sci. Rep. 2017, 7, 11226. [Google Scholar] [CrossRef] [PubMed] [Green Version]
  5. Fuller, R.A.; Irvine, K.N.; Devine-Wright, P.; Warren, P.H.; Gaston, K.J. Psychological benefits of greenspace increase with biodiversity. Biol. Lett. 2007, 3, 390–394. [Google Scholar] [CrossRef] [PubMed]
  6. Maas, J.; Verheij, R.A.; Groenewegen, P.P.; Vries, S.D.; Spreeuwenberg, P. Green space, urbanity, and health: How strong is the relation? J. Epidemiol. Community Health 2006, 60, 587–592. [Google Scholar] [CrossRef] [Green Version]
  7. Zhou, Q.; van den Bosch, C.C.K.; Chen, Z.; Wang, X.; Zhu, L.; Chen, J.; Lin, Y.; Dong, J. China’s Green Space System Planning: Development, Experiences, and Characteristics. Urban For. Urban Green. 2021, 60, 127017. [Google Scholar] [CrossRef]
  8. Fu, H.; Cao, Y.; Yu, M. An empirical study on the dynamic mechanism of ecological civilization construction in beautiful countryside of Zhejiang Province. Ecol. Econ. 2018, 34, 218–223. [Google Scholar]
  9. National Bureau of Statistics of the People’s Republic of China (NBS). China Statistical Yearbook; China Statistics Press: Beijing, China, 2020.
  10. Dou, Y.; Kuang, W. A comparative analysis of urban impervious surface and green space and their dynamics among 318 different size cities in China in the past 25 years. Sci. Total Environ. 2020, 706, 135828. [Google Scholar] [CrossRef]
  11. Zhou, X.; Liu, Z.; Wang, J. Space-Temporal Evolution Characteristics of Urban Park Green Space Per Capita In China. Planners 2018, 34, 105–111. [Google Scholar]
  12. Cui, J.; Liu, H.; Chen, Y. Changes in green coverage rate of urban built-up areas in china and influencing factors. Ecol. Environ. Sci. 2021, 30, 331–339. [Google Scholar]
  13. Bürgi, M.; Hersperger, A.M.; Schneeberger, N. Driving forces of landscape change-current and new directions. Landsc. Ecol. 2004, 19, 857–868. [Google Scholar] [CrossRef]
  14. Xu, Z.; Zhang, Z.; Li, C. Exploring urban green spaces in China: Spatial patterns, driving factors and policy implications. Land Use Policy 2019, 89, 104249. [Google Scholar] [CrossRef]
  15. Michał, K.; Dariusz, Ś.; Magdalena, S.; Piotr, U. Changes in the area of urban green space in cities of western Poland. Bull. Geogr. Socio-Econ. Ser. 2018, 39, 65–77. [Google Scholar]
  16. Li, X.; Yang, X.; Gong, L. Evaluating the influencing factors of urbanization in the Xinjiang Uygur Autonomous Region over the past 27 years based on VIIRS-DNB and DMSP/OLS nightlight imageries. PLoS ONE 2020, 15, e0235903. [Google Scholar] [CrossRef]
  17. Dobbs, C.; Nitschke, C.; Kendal, D. Assessing the drivers shaping global patterns of urban vegetation landscape structure. Sci. Total Environ. 2017, 592, 171–177. [Google Scholar] [CrossRef] [PubMed]
  18. Wilkerson, M.L.; Mitchell, M.; Shanahan, D.; Wilson, K.A.; Ives, C.D.; Lovelock, C.E.; Rhodes, J.R. The role of socio-economic factors in planning and managing urban ecosystem services. Ecosyst. Serv. 2018, 31, 102–110. [Google Scholar] [CrossRef]
  19. Zhao, L.; Chen, W. Estimating urban green space production in the macroeconomy: From public goods to a profitable method of investment. Urban For. Urban Green 2018, 33, 16–26. [Google Scholar] [CrossRef]
  20. Wang, X.; Li, Y.; Chu, B.; Liu, S.; Yang, D.; Luan, J. Spatiotemporal Dynamics and Driving Forces of Ecosystem Changes: A Case Study of the National Barrier Zone, China. Sustainability 2020, 12, 6680. [Google Scholar] [CrossRef]
  21. Mcdonald, R.I. Ecosystem service demand and supply along the urban-to-rural gradient. J. Conserv. Plan 2009, 5, 1–14. [Google Scholar]
  22. Joyce, A.T. Land Use Change in Costa Rica as Influenced by Social, Economic, Political, and Environmental Factors: 1966–2006; Litografía e imprenta LIL, S.A.: San José, Costa Rica, 2006. [Google Scholar]
  23. Halik, M.; Welp, M.; Mamat, Z.; Abliz, A.; Shi, L. Urban green space accessibility and distribution equity in an arid oasis city: Urumqi, China. Forests 2020, 11, 1–17. [Google Scholar]
  24. Sun, D.M.; Fu, Y.L. Water Maintenance of Urban Green Space in the Northern China. North. Hortic. 2011, 12, 87–89. [Google Scholar]
  25. Zhang, Y.X.; Zang, G.M.; Li, H.L.; Niu, Z.H.; Mu, X.M. Management Pattern and Regionalization of Soil and Water Conservation in Hilly Area of Zhejiang and Fujian Province. Bull. Soil Water Conserv. 2013, 5, 112–116. [Google Scholar]
  26. Zhou, X.; Wang, Y.C. Spatial–temporal dynamics of urban green space in response to rapid urbanization and greening policies. Landsc. Urban Plan. 2011, 100, 268–277. [Google Scholar] [CrossRef]
  27. Tong, W.; Ni, S. An Analysis on the Relationship between Green Land Area and Economic Development Level of Nanjing Urban Area. J. Nanjing Norm. Univ. (Nat. Sci. Ed.) 2005, 2, 108–111. [Google Scholar]
  28. Chang, C.; Zhao, G.; Wang, L.; Zhu, X.; Li, T. Land use spatiotemporal changes and its driving forces analysis in vulnerable ecological region of Yellow River Estuary. Trans. Chin. Soc. Agric. Eng. 2012, 24, 226–234. [Google Scholar]
  29. Mu, S.; Yang, H.; Li, J.L.; Chen, Y.; Gang, C.; Zhou, W. Spatio-temporal dynamics of vegetation coverage and its relationship with climate factors in Inner Mongolia, China. Acta Geogr. Sin. 2013, 23, 231–246. [Google Scholar] [CrossRef]
  30. Chen, K.L.; Gong, J.Z.; Liu, Y.S.; Chen, X.Y. The Spatial-temporal Differentiation of Green Space and Its Fragmentation during the Past Thirty-five Years in Guangzhou. J. Nat. Resour. 2016, 7, 1100–1113. [Google Scholar]
  31. Peng, J.; Wang, Y.; Zhang, Y.; Wu, J.; Li, W.; Li, Y. Evaluating the effectiveness of landscape metrics in quantifying spatial patterns. Ecol. Indic. 2010, 10, 217–223. [Google Scholar] [CrossRef]
  32. Di, X.; Hou, X.; Wang, Y.; Wu, L. Spatial-temporal Characteristics of Land Use Intensity of Coastal Zone in China During 2000–2010. Chin. Geogr. Sci. 2015, 25, 51–61. [Google Scholar] [CrossRef]
  33. Zhang, Y.; Liu, Z.; Wang, J.; Shao, D. Analysis of Regional Differences in Urban Park Green Space Per Capita of Urban Agglomerations in China from 1996 to 2016. Plan. Gard. 2019, 5, 65–73. [Google Scholar]
  34. Zhang, C.; Zhong, S.; Wang, X.; Shen, L.; Liu, L.; Liu, Y. Land Use Change in Coastal Cities during the Rapid Urbanization Period from 1990 to 2016: A Case Study in Ningbo City, China. Sustainability 2019, 11, 2122. [Google Scholar] [CrossRef] [Green Version]
  35. Wu, L.; Kim, S.K. Exploring the equality of accessing urban green spaces: A comparative study of 341 Chinese cities. Ecol. Indic. 2020, 121, 107080. [Google Scholar] [CrossRef]
  36. Liu, Y.; Wang, L.; Long, H. Spatio-temporal analysis of land-use conversion in the eastern coastal China during 1996–2005. J. Geogr. Sci. 2008, 18, 274–282. [Google Scholar] [CrossRef]
  37. Zhang, J.; Feng, Z.; Jiang, L. Progress on studies of land use/land cover classification systems. Resour. Sci. 2011, 33, 1195–1203. [Google Scholar]
  38. Gao, Y.; Li, J.; Liu, R.; Wang, Z.; Wang, H.; Liu, Y. Temporal and spatial evolution of green space system and evaluation of ecosystem services in the core area of the Yangtze River Delta. Chin. J. Ecol. 2020, 39, 956–968. [Google Scholar]
  39. Ren, G.; Liu, L.; Fu, Y.; Yuan, C.; Song, Z. Analysis of characteristic and influencing factors of rural settlement landscape pattern in metropolitan suburbs. Trans. Chin. Soc. Agric. Eng. 2016, 32, 220–229. [Google Scholar]
  40. Shi, X.; Feng, G.; Yang, Y.; Zou, Y.; Ge, H.; Su, P. Temporal and Spatial Evolution Characteristics and Ecological Risk Assessment of Land Use Landscape Patterns in Central Zhejiang Urban Agglomeration. Trans. Chin. Soc. Agric. Mach. 2020, 51, 249–258. [Google Scholar]
  41. Cui, L.; Li, J.; Wang, Z. Analysis of variation of landscape pattern in Zhejiang coastal area. J. Huazhong Agric. Univ. 2015, 2, 31–35. [Google Scholar]
  42. Dai, F.; Bi, S.; Guo, X.; Chen, M. Research on the spatial pattern evolution of London green space system and its correlation with policy based on the analysis of morphological spatial pattern. Int. Urban Plan. 2021, 4, 1–14. [Google Scholar]
  43. Liu, R.; Li, J.; He, G.; Feng, B.; Huang, R.; Tian, P.; Wang, L. Spatiotemporal variation and ecosystem service value assessment of green space system in Zhejiang Province, China. Chin. J. Ecol. 2018, 37, 3119–3129. [Google Scholar]
  44. Yu, Z. Research on the implementation effect of sales restriction policy—Based on the data of 70 large and medium-sized cities in my country. Small Medium-Sized Enterp. Manag. Technol. 2020, 12, 162–163. [Google Scholar]
  45. Li, Y.; Zhu, D.; Zhao, J.; Zheng, X.; Zhang, L. Effect of the housing purchase restriction policy on the Real Estate Market: Evidence from a typical suburb of Beijing, China. Land Use Policy. 2020, 94, 104828. [Google Scholar] [CrossRef]
  46. Feng, J.; Zhao, Z.; Wen, Y.; Hou, Y. Organically Linking Green Development and Ecological Environment Protection in Poyang Lake, China Using a Social-Ecological System (SES) Framework. Int. J. Environ. Res. Public Health 2021, 18, 2572. [Google Scholar] [CrossRef] [PubMed]
  47. Harlan, T. Green development or greenwashing? A political ecology perspective on China’s green Belt and Road. Eurasian Geogr. Econ. 2020, 2, 1–25. [Google Scholar] [CrossRef]
  48. Peoples Network (PN). Clear Waters and Green Mountains are as Valuable as Gold and Silver. 2015. Available online: http://opinion.people.com.cn/n/2015/0327/c1003-26757780.html/ (accessed on 27 March 2015).
  49. Chen, H. Study on the strategy of rural tourism development under the background of beautiful countryside construction. In Proceedings of the 2018 7th International Conference on Energy, Environment and Sustainable Development (ICEESD 2018), Shenzhen, China, 30–31 March 2018. [Google Scholar]
  50. Liu, C.; Wang, F.; Gao, X.; Smith, H. Exploring Solutions to Improve the Evaluation of Development of Rural Villages: A Case Study of the Application of the Evaluation for the Construction of Beautiful Villages (ECBV) in a Village in South China. Sustainability 2021, 13, 1–23. [Google Scholar]
  51. Yang, X.D.; Yan, E.R.; Chang, S.X.; Da, L.J.; Wang, X.H. Tree architecture varies with forest succession in evergreen broad-leaved forests in Eastern China. Trees 2015, 29, 43–57. [Google Scholar] [CrossRef]
  52. Shi, C.; Zheng, Q.; Zhou, S.; Liu, G.; Lu, Y.; Zhang, X.; Xiao, B.; Zhang, H. Research on the current situation of grassland resources in Sichuan Province and the countermeasures of ecological environment protection. Grass Sci. 2020, 6, 48–53. [Google Scholar]
  53. Wang, C. Research on the Temporal and Spatial Changes of Urban Land in the Coastal Areas of Southeast Fujian. Master’s Thesis, Fujian Normal University, Fuzhou, China, 2004; pp. 38–52. [Google Scholar]
  54. Chen, Z.Q.; Chen, J.F. Geostatistical analysis on human impact indexes for land use/cover in Fujian Province and Fuzhou City. In Proceedings of the 2009 17th International Conference on Geoinformatics, Fairfax, VA, USA, 12–14 August 2009. [Google Scholar]
  55. Yang, L.X.; Yuan, S.F.; Wang, X.C. Spatial Pattern Disparity of Coordinating the Population Urbanization and Land Urbanization in 69 Counties of Zhejiang Province. China Land Sci. 2013, 11, 18–23. [Google Scholar]
  56. Zhao, M.; Wang, N.; Shi, H.; Jiang, L.; Wang, C. Spatial-temporal variation and its driving forces of vegetation coverage in China from 2001 to 2015. Arid Land Geogr. 2019, 42, 324–331. [Google Scholar]
  57. Che, T.; Li, C.; Luo, Y. The evolution characteristics and driving forces of the landscape pattern of construction land in the process of urban expansion. Acta Ecol. Sin. 2020, 40, 3283–3294. [Google Scholar]
  58. Kim, I.; Kwon, H. Assessing the Impacts of Urban Land Use Changes on Regional Ecosystem Services According to Urban Green Space Policies Via the Patch-Based Cellular Automata Model. Environ. Manag. 2021, 67, 192–204. [Google Scholar] [CrossRef] [PubMed]
  59. Shi, H.E.; Zeng, C. Comprehensive Evaluation and Analysis of Dynamic Land use Degree from 2005 to 2010 in Fujian Coastal Zone. J. Hainan Norm. Univ. 2013, 3, 314–319. [Google Scholar]
  60. Luo, Y.; Yang, S.; Zhao, C.; Liu, X.; Liu, C.; Wu, L.; Zhao, H.; Zhang, Y. The effect of environmental factors on spatial variability in land use change in the high-sediment region of China’s Loess Plateau. Acta Geogr. Sin. 2013, 24, 802–814. [Google Scholar] [CrossRef] [Green Version]
  61. Chen, Z.; Chen, J. Geostatistical Analysis of Human Impact Indexes for Land Use/Cover Change in Fujian. Resour. Sci. 2008, 30, 1700–1705. [Google Scholar]
  62. He, P.; Phan, L.; Gu, G.; Hervouet, G. Reclaimed municipal wastewater—A potential water resource in China. Water Sci. Technol. 2001, 43, 51–58. [Google Scholar]
Figure 1. The coastal cities of southeast China.
Land 10 00537 g001
Figure 2. Spatial-temporal change of green space in coastal cities of southeast China over the past 20 years.
Land 10 00537 g002
Figure 3. The change of landscape pattern index of green space in coastal cities of southeast China over the past 20 years. NP, PD, LPI, ED, LSI and SHDI are number of patches, patch density, the largest patch index, edge density, landscape shape Index and Shannon’s diversity index, respectively.
Land 10 00537 g003
Figure 4. The contributions of socio-economic determinants and geographical environmental factors to the spatial-temporal change of green space over the past 20 years. The explanations of REI, FAT, LSPP, PNAP, GAPC, WRPC, AE, AT, AP, PTI, PSI and PPI are given in Table 1. (a) The contributions of all influencing factors; (b) The contributions of socio-economic determinants and geographical environmental factors.
Land 10 00537 g004
Table 1. Abbreviations and data sources of the influencing factors of green space. “/” represents the related influencing factors has no abbreviations or units.
TypesThe Influencing FactorsAbbreviationUnitData Sources
Geographical environment factorsAnnual precipitationAPmmChina Meteorological Data Network (http://data.cma.cn/, accessed on 8 February 2021)
Average temperatureAT°C
Annual evaporationAEmm
Water resources per capitaWRPCm3China Statistical Yearbooks and regional statistical bulletins
Elevation/mDigital Elevation Model (DEM) data
Green area per capitaGAPCm2China Statistical Yearbooks and regional statistical bulletins
Socio-economic determinantsGDP/$YuanChina Statistical Yearbooks and regional statistical bulletins
Population//
GDP per capita/$Yuan
Proportion of non-agricultural populationPNAP%
Living space per person LSPPm2
Fixed-asset investmentFAT$Yuan
Real estate investment REI$Yuan
Proportions of primary industriesPPI%
Proportions of secondary industriesPSI%
Proportions of tertiary industriesPTI%
Table 2. The classification of green space.
Green SpaceSub-Types of Green SpaceDefinition
WoodlandForest landNatural forests and plantation with vegetation coverage >30%, including lumber forest, economic forest and protective forest.
Shrub landVegetation coverage >40%, including brush land and scrub land; crown height <2 m.
Sparse woodlandWoodland; 10% < Vegetation coverage < 30%.
Other woodlandWoodland refers to unformed woodland, deforested land, nursery and various garden plots (orchard, mulberry garden and tea garden, etc.)
GrasslandHigh-coverage grasslandVegetation coverage is higher than 50%, including natural grassland, improved grassland, and mowing grassland; better water condition and the grass is dense.
Moderate-coverage grasslandVegetation coverage ranges from 20% to 50%, including natural grassland and improved grassland; lacks water and the grass is sparse.
Low-coverage grasslandNatural grassland refers to the vegetation coverage ranging from 5% to 20%, lack of water, the grass is sparse and the utilization condition of livestock is poor.
Table 3. Changes of different land-use types in coastal cities of southeast China over the past 20 years (km2). HC, MC and LC grassland are high-, moderate-, and low-coverage grasslands. (+) and (−) represent the increase and decrease in green space area across adjacent five years, respectively.
Land-Use Types20002005201020152020Changes (%)
2000–20052005–20102010–20152015–2010
WoodlandForest land36,147.2935,673.7035,020.1034,956.0335,295.121.3 (−)1.8 (−)0.2 (−)1.0 (+)
Shrub land3263.383649.103587.543573.053486.0311.8 (+)1.7 (−)0.4 (−)2.4 (−)
Sparse woodland6486.736423.436510.096509.136492.241.0 (−)1.4 (+)0.0 (−)0.3 (−)
Other woodland2340.252325.492779.252716.562688.440.6 (−)19.5 (−)2.3 (−)1.0 (−)
Sum48,237.6548,071.7247,896.9847,754.7747,961.830.3 (−)0.4 (−)0.3 (−)0.4 (+)
GrasslandHC grassland5375.995391.585371.665453.345497.610.3 (+)0.4 (−)1.5 (+)0.8 (+)
MC grassland3025.442931.752942.712937.102878.073.1 (−)0.4 (+)0.2 (−)2.0 (−)
LC grassland1364.681049.891041.341032.551030.2323.1 (−)0.8 (−)0.8 (−)0.2 (−)
Sum9766.119373.229355.719422.999405.914.0 (−)0.2 (−)0.7 (+)0.2 (−)
Water area2103.002227.572309.932308.132220.625.9 (+)3.7 (+)0.1 (−)3.8 (−)
Construction land3067.854957.885477.946559.147224.3361.6 (+)10.5 (+)19.7 (+)10.1 (+)
Unused land52.2050.7350.7250.0423.002.8 (−)0.0 (−)1.3 (−)54.0 (−)
Cultivated land21,085.6119,631.0219,210.2718,583.6417,781.706.9 (−)2.1 (−)3.3 (−)4.3 (−)
Table 4. The transfer relationship between different land-use types in coastal cities of southeast China over the past 20 years. Numbers in the table are areas of the corresponding sub-types of green space (km2). HC, MC and LC grassland are high-, moderate-, and low-coverage grasslands.
2020Cultivated LandForest LandShrub LandSparse WoodlandOther WoodlandHC GrasslandMC GrasslandLC GrasslandWater AreaConstruction LandUnused LandOceanSum
2000
Cultivated land10,69036443309614436333448046434145121,007
Forest land329626,349893152376015047322342005679036,065
Shrub land291818145317670178101331995203236
Sparse woodland881133518328211564152219461268316439
Other woodland38332097118923905117662651/2331
HC grassland582137619439011621781916841174205313
MC grassland35171812224472197112446241133/3014
LC grassland11728915111631104614456390/1360
Water area296143184540761559953613102008
Construction land816156146370472451811665113043
Unused land6111513212415050
Sum17,70935,15734566463268154252867102720596964441383,866
Table 5. The change of landscape pattern index of seven sub-types of green space in coastal cities of southeast China over the past 20 years. NP, PD, LPI, ED and LSI are number of patches, patch density, the largest patch index, edge density and landscape shape Index, respectively.
Green SpaceYearNPPDLPIEDLSI
WoodlandForest land20004104.90E-0319.813.4340.55
20054225.00E-0319.653.4240.68
20104365.20E-0319.413.4341.15
20154425.20E-0319.223.4341.41
20204195.00E-0319.233.2939.53
Shrub land20005336.30E-030.160.6825.60
20056097.20E-030.170.7727.49
20106107.20E-030.170.7627.25
20156087.20E-030.170.7527.11
20205216.20E-030.070.6524.54
Sparse woodland20009481.12E-020.081.2634.78
20059501.13E-020.081.2534.93
20109771.16E-020.091.2734.99
20159711.15E-020.091.2635.20
20208901.06E-020.101.2433.95
Other woodland20003394.00E-030.150.4420.04
20053724.40E-030.100.4520.31
20104785.70E-030.100.5723.32
20154715.60E-030.100.5723.30
20204084.80E-030.160.5121.65
GrasslandHigh-coverage grassland20008671.03E-020.151.0832.79
20058811.04E-020.151.0933.12
20108751.04E-020.141.0832.86
20158921.05E-020.141.0933.42
20207809.30E-030.101.0431.62
Moderate-coverage grassland20005506.50E-030.040.6325.16
20055436.40E-030.040.6225.09
20105466.50E-030.040.6225.16
20155436.40E-030.040.6225.04
20204755.60E-030.040.5923.63
Low-coverage grassland20002673.20E-030.030.2816.92
20051942.30E-030.030.2014.33
20101922.30E-030.030.2014.06
20151902.20E-030.030.2014.38
20202052.40E-030.050.2315.27
Publisher’s Note: MDPI stays neutral with regard to jurisdictional claims in published maps and institutional affiliations.

