
Risks Identification and Management Related to Rural Innovation Projects through Social Networks Analysis: A Case Study in Spain


Escuela Técnica Superior de Ingeniería Agronómica, Alimentaria y de Biosistemas, Universidad Politécnica de Madrid, Avda. Puerta de Hierro 2, 28040 Madrid, Spain
*
Author to whom correspondence should be addressed.
Land 2021, 10(6), 613; https://doi.org/10.3390/land10060613
Submission received: 16 May 2021
/
Revised: 1 June 2021
/
Accepted: 5 June 2021
/
Published: 8 June 2021
(This article belongs to the Section Urban Contexts and Urban-Rural Interactions)
Abstract
:Risk identification and management are essential in innovation projects in the rural context, where cultural differences and relations between actors are decisive for assuring a project success. Risk management is especially important when considering innovation processes in rural areas that experience conflict or are lagging in development. Although there are studies focusing on the interaction of actors, there are only a few that approach the risks associated with stakeholders. This research aims to identify the risks and the associated stakeholders and draws on a risk map in order to develop effective risk management and action plans to mitigate risk. A rural project optimizing irrigation in Spain was taken as a case study and conduct semi-structural interviews with key actors were conducted. Social Network Analysis (SNA) was applied to recognize and investigate the network of stakeholder-associated risk factors. The main risks identified in the project were associated with technical, economic, and time problems and with irrigation communities and project developers. These findings offer a new visual perspective of risk management in rural innovation projects, improving the ability to assess and efficiently mitigate the risks.
1. Introduction
From the start of the project design stage, risk management is a key component of the decision-making process, with the goal of effectively reducing or preventing conflicts [1]. In rural innovation settings, various disputes related to stakeholders arise, which, having not been correctly identified beforehand, result in problems that can threaten the success of the project. Among the most evident problems in the literature about the materialization of risks associated with rural projects are social conflicts [2], limited funding [3], time delays in deliveries [4], poor construction methods [5] and, political problems associated with corruption [6]. Therefore, risk identification and management are crucial to prevent and reduce negative effects on the project and its main beneficiaries.
In rural innovation, projects related to an interactive multi-actor process involving researchers, developers, technical experts, farmers with different knowledge [7], where people with practical experience and scientific understanding, and related to several dimensions of agriculture mobilize resources needed for innovation [8]. Rural innovation is therefore dependent on interactions that foster the inclusion of actors and their wellbeing [9]. Innovation processes are essential, not only because they allow solving social conflicts [10] but also because it enables new development processes [11]. However, rural regions face challenges to attractive, competitive, and maintain sustainable economic growth [12], mainly due to their low level of R&D and innovation due to geographic isolation and the slow industrial development [13,14]; nevertheless, researchers have defined social innovation as an opportunity to find solutions to this kind of societal challenges [15], that prevent rural development from progressing. Through connected initiatives, social innovation is stimulated by society, creating economic, social, environmental, and technical challenges [16,17].
In rural areas, innovation is characterized by the pursuit of development strategies, with an emphasis on social welfare and rural region development [18]. One example with this approach is the Agricultural Knowledge and Innovation Systems (AKIS), focused on supporting farmers in Europe to obtain access to reliable and relevant knowledge through the interaction of people and organizations [19]. Another example is LEADER, a European initiative supporting rural growth that sees innovation as an opportunity to foster social relations and new cultures of collaborative learning in areas where expertise is typically scarce [20]. However, interaction among the different institutions and agents operating in a territory is characterized by being conflictive and entails risks that can be crucial to explain the success or failure of a project [21].
Institutions and individuals involved in the project are deemed as essential parts of the project since they generally control the information, skills and resources, and therefore have the potential to help or hinder their progress [22]. In innovation projects with many interactions between actors or institutions, risk management task are the most difficult in project management due to a significant degree of uncertainty regarding future results [23]. Nonetheless, social innovation can give an adaptive response, reacting to the various conflicts faced by the project [24].
One method to avoid the failure of innovation projects caused by the materialization of risks is to use tools to manage conflicts related to interactions between actors, analyzing the risks associated with them. These tools make it possible to develop a complete list of risks and identify their causes, contributing to effective decision-making throughout the project [25]. In recent years, bearing this in mind is important for analyzing the role of actors within projects, considering that the most relevant challenge for a project is communication and coordination in a multidisciplinary team [26]. Understanding the importance of managing risks between social groups, political arenas, geographical scales, research groups and industrial sectors can considerably simplify the negative impact of risks within innovation projects. Nonetheless, risk approaches associated with rural project actors have not been frequently applied, leaving the need for further research in this area, which deals with identifying and analyzing information relevant to rural development [27].
For risk management associated with actors to be carried out correctly, the sources of risk must be analyzed by each actor within a project, and measures must be taken to mitigate the consequences [28]. This way, it is feasible to detect the interactions of various actors involved within the project, providing an overview of risks. Previous studies on risk management and focusing on diverse research fields suggest a classical framework that identifies, evaluates, and responds to risks [29,30]. However, in terms of risks associated with stakeholders, this classical framework does not consider stakeholders effectively during assessment and analysis processes [31]. A tool that has the potential to contribute to identifying the risks associated with the actors happening within the project is the Social Network Analysis (SNA). Researchers have integrated the traditional risk management framework with SNA, stating that this tool can analyze risks based on stakeholders [31,32]. Some examples of its use are found in research contexts such as ecology construction [25], urban redevelopment projects [33], public engineering projects [34].
The main aim of this study is to investigate the social risks and their inter-relationship during the development of a rural innovation project from the perspective of stakeholders. Three specific objectives were established: (a) identify the risks affecting the development and management of rural projects; (b) analyze the relationship between risks and project stakeholders through applying SNA; and (c) generate strategies to manage the identified risks.
This research is based on one Spanish innovation project at the national level, focusing on irrigation in rural areas. In this project, there are many interactions between urban and rural actors involved and face various risks during its development. Integrating the actors involved from both rural and urban perspectives means treating industry and agriculture as an integrated whole rather than as isolated parts, allowing for a better articulation identifying the main conflicts that rural innovation projects face.
Among the results found in this research, the risks associated with changes in the project scope, additional costs, lack of access to funds, and excess project time and lack of compliance in applying environmental measures stand out. The main actors associated with risks were the irrigation communities and project developers, especially the project coordinator groups, water efficiency and energy efficiency. As an alternative, a series of strategies are proposed, which can simplify the network attained by applying SNA, and therefore, facilitate risk mitigation. The risk mitigation plans are effective financial management, control of the project quality standards and scope, and monitoring of the project schedule and delivery times.
The document is organized as follows: the first section reviews the risks that are most frequent in rural projects identified in the literature; the second describes methodological steps and case study of the research; the third presents and discusses the results; and the fourth is a compilation of conclusions.
2. Risk Review in Literature
Risk is the chance of something happening that has an impact upon objectives [35], a combination of exposure and hazard [36], or simply as the potential for the reaction of unwanted, negative consequences of an event [37]. According to the 5th Edition of the PMBOK® Guide, project risk is an uncertain event or condition that, if it occurs, affects one or more project objectives such as scope, schedule, cost, and quality [38]. A list of risks associated with the development and management of rural projects is presented (Table 1). Although currently, each innovation project is unique and there is no uniform classification of risks within projects [23], authors have decided to categorize them according to social, technical, economic, environmental and political components, as has been done in similar investigations [25,39].
Social risks are related to society, social groups, or individuals [40], such as conflicts related to limited communication, displacements, culture, human rights violations, and conflicts of interest. The technical component considers risk factors associated with a lack of technology, a shortage of skilled labor and management errors [41], non-compliance with specified standards, and changes in the initial design. Economic factors are related to economic policy, inflation, price fluctuations, interest rates and exchange rates [39]. Among the political risks, there are all those changes of government, including laws, regulations and policies, and the inadequate management of administration systems [41]. Environmental risks also play a fundamental role in unfavorable weather conditions, force majeure events, and adverse environmental impacts [42]. Failure to properly manage these types of risks can result in negative impacts on rural projects.

Table 1.
List of risks associated with development and management projects through literature review.
Table 1.
List of risks associated with development and management projects through literature review.
| Categorization | Types of Risks | References |
|---|---|---|
| Social risks | Thefts | [43] |
| Social exclusion | [44] | |
| Rural depopulation | [45] | |
| Lack of knowledge and experience | [46] | |
| Conflicts between cultures | [47] | |
| Internal armed conflicts | [48] | |
| Limited access to information and communication | [48,49] | |
| Displacement and resettlement | [50] | |
| Protest actions | [51] | |
| Violation of human rights | [52] | |
| Lost access to the property | [53] | |
| Technical risks | Poor machine operation | [43] |
| Contractor performance | [43] | |
| Poor construction methods | [5] | |
| Poor communication and coordination | [54] | |
| Material shortages | [54] | |
| Supply chain breakdown | [47] | |
| Limited accessibility | [55] | |
| Economic risks | Liquidity problems | [56] |
| Economic disadvantages | [57] | |
| High energy and water costs | [43] | |
| Cost overruns | [54] | |
| Late payments | [43] | |
| Change in interest rates | [56] | |
| Limited funding | [3] | |
| Fluctuation in currency and interest rates | [58] | |
| Inflation | [59] | |
| Crop loss | [60] | |
| Protectionism | [61] | |
| Political risks | Political instability | [62] |
| Changes in policies and regulations | [56] | |
| Corruption | [6] | |
| Agricultural policies | [56] | |
| Governance conflicts / Conflicts of Interest | [47,63] | |
| Environmental risks | Climate change | [64] |
| Adverse weather conditions | [42] | |
| Natural risks (droughts, floods, cyclones and storms) | [65] | |
| Quality of soil | [60] | |
| Degradation and loss of habitats and landscapes | [66] |
In general, a set of risks is associated with determined actors, depending on the latter impact within the project. Additionally, it has been shown that there is an interdependence between the different types of risks regardless of which category they belong to [39]. All these relationships of reciprocal dependence between risks and actors can be explained through the right tools, being it possible to analyze the actors, risks, and interrelation simultaneously.
3. Methodology
This research proposes the use of SNA as a tool for analyzing risks associated with actors. Although SNA has not been explicitly used in the development of rural innovation projects, it has been used in risk analysis within contexts such as ecology construction [25,31], prefabrication projects [32], urban redevelopment projects [33] and public engineering project [34]. However, there is broad support for using SNA to analyze interaction patterns between farmers and actors present in a network, allowing a better understanding of rural innovation processes [12,67,68].
SNA detects and interprets patterns derived from the relationships established between nodes, allowing a social structure to be described in terms of a network intended to interpret the existing relationships between them, taking into account their position within the structure. [67,69]. A network is made up of nodes bonded through a series of links, representing a specific type of relationship [70]. In this study, nodes have distinctive characteristics, commonly called attributes, and are defined as a combination of an actor and a risk; thus, each node has dual properties. All network interpretations must be performed from this definition, considering that nodes represent an actor and a risk simultaneously. Links are bonds that join two nodes distinguished by their magnitude, determined from the value of impact and probability (assessed by respondents in rating scale) that an actor and its associated risk may have on another actor. The fact that links are connected through common nodes (for example, link A → B shares a node in common with link B → C) creates chains or routes of nodes and links whose endpoints are indirectly connected. This structuring is what can be considered a network [69]. A similar methodology has been used in other studies [25,31,32,34].
There are two main benefits to stakeholder analysis using SNA: firstly, the quantitative assessment of links and the general network structure provides a rigorous analysis of the impacts of node interaction; secondly, it enables the visualization of complex and abstract relationships of stakeholders [71].
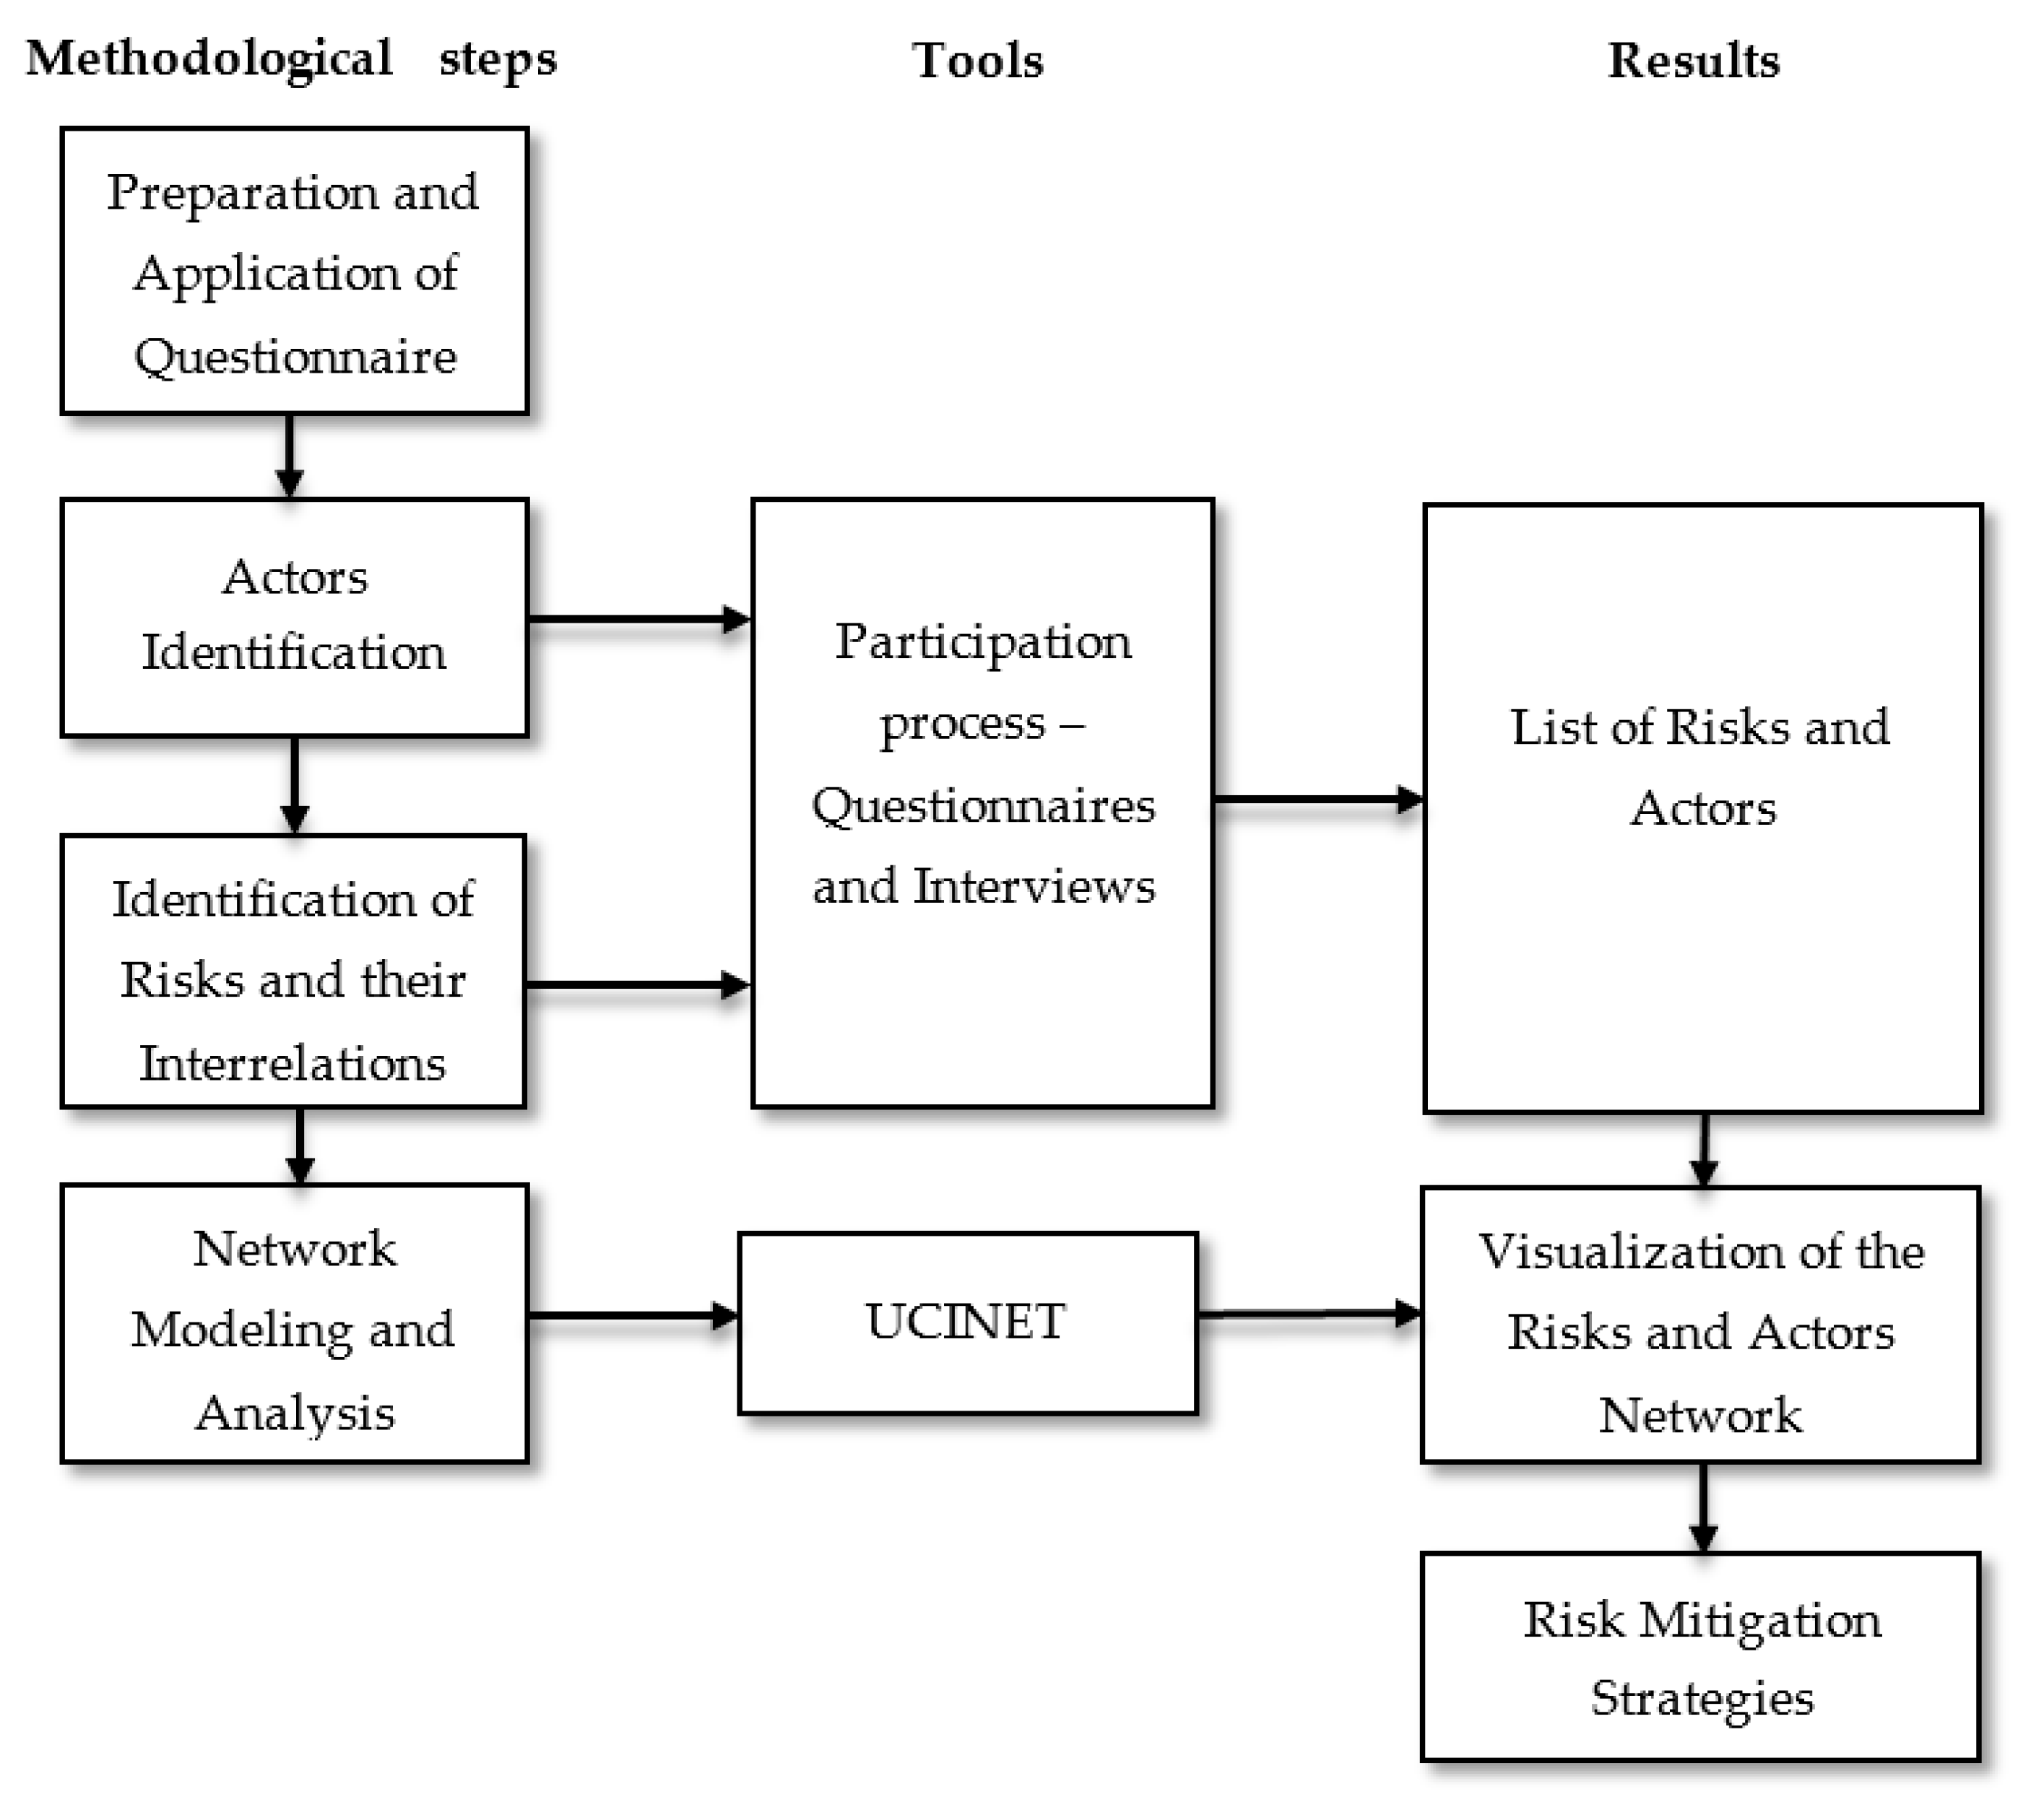
In Figure 1, the investigation procedure is presented, which was applied in four steps grouping. (1) preparation and application of questionnaire; (2); actors identification; (3) identification of risks and their interrelations; and (4) network modeling and analysis. Finally, as a result of the investigation, a set of strategies is proposed to mitigate identified risks.
3.1. Methodological Steps
3.1.1. Preparation and Application of Questionnaire
All actors are subjected to a semi-structured interview based on a previously prepared questionnaire. The questionnaire is the primary tool of this study since it allows to determine the existing risks in the project and how they are related to the actors. In the questionnaire, each actor is requested to identify from his or her perspective: (1) the risks present in the project, (2) the magnitude of that particular risk, and (3) the actors with whom the identified risks are related to.
To avoid ambiguities when filling out the questionnaire, the questions and their purpose are briefly explained. Additionally, the questionnaire is previously sent by email to each actor to be prepared when answering the questions. Interviews are carried out online or through telephone calls. Due to the sensitivity of the information that the actor provides, consent agreements are set for data processing. It is essential to bear in mind that, before starting with the data modeling, one of the tasks that must be carried out carefully for each of the questionnaires is reviewing the gathered information, debugging those incomplete or irrelevant data within the case study.
3.1.2. Actors Identification
The methods proposed by Yang and Zou (2014) were used to implement a robust list of actors who could contribute information to the research: the classical method and the snowball method.
The classical method is considered the most popular way to identify actors. Through this method, key actors are identified based on previous knowledge of the project. On the other hand, the snowball method allows the sampled actors to provide information about other actors, allowing researchers to increase the sample size exponentially [72]. In general, this approach does not allow assessors to map the entire network but rather to the networks surrounding the actors interviewed in the classical method [73]. In the research, the classical method has been used initially, requesting the project managers to designate an internal group of key stakeholders with whom to start the process. As interviews are conducted and questionnaires are filled out, new actors are identified through the snowball method added to the research process.
3.1.3. Identification of Risks and Their Interrelations
At his or her disposal, the respondent has a pre-established list with the most common risks within the development of projects, identified in Table 1. However, if necessary, they may include additional risks from his or her experience and knowledge. For each risk identified, the respondent is asked for an assessment of the impact and the probability: the assessment is made through a quantitative scale: “1” symbolizes an extremely low rate of occurrence and “5” extremely high of occurrence [25,33]. This step allows defining the magnitude of the links within the network, representing the relationships between different nodes [74]. Finally, each of the identified risks must be associated with the corresponding actor. The study is not limited to evaluating certain types of risks or actors but rather assesses and analyzes risks in general that may arise during the management and development of the rural innovation project according to the actors perspective.
3.1.4. Network Modeling and Analysis
Once the data on the actors, the associated risks, and the magnitude of each one had been collected, a matrix with the information on the values associated with the risk and the involved actors is generated. The matrix is imported into UCINET, a software package for analyzing social network data that allows graphing and quantitative analysis of the information entered [69]. The analyzed parameters that provide a general knowledge of the network and the nodes that compose it are described in Table 2.
3.2. Case Study
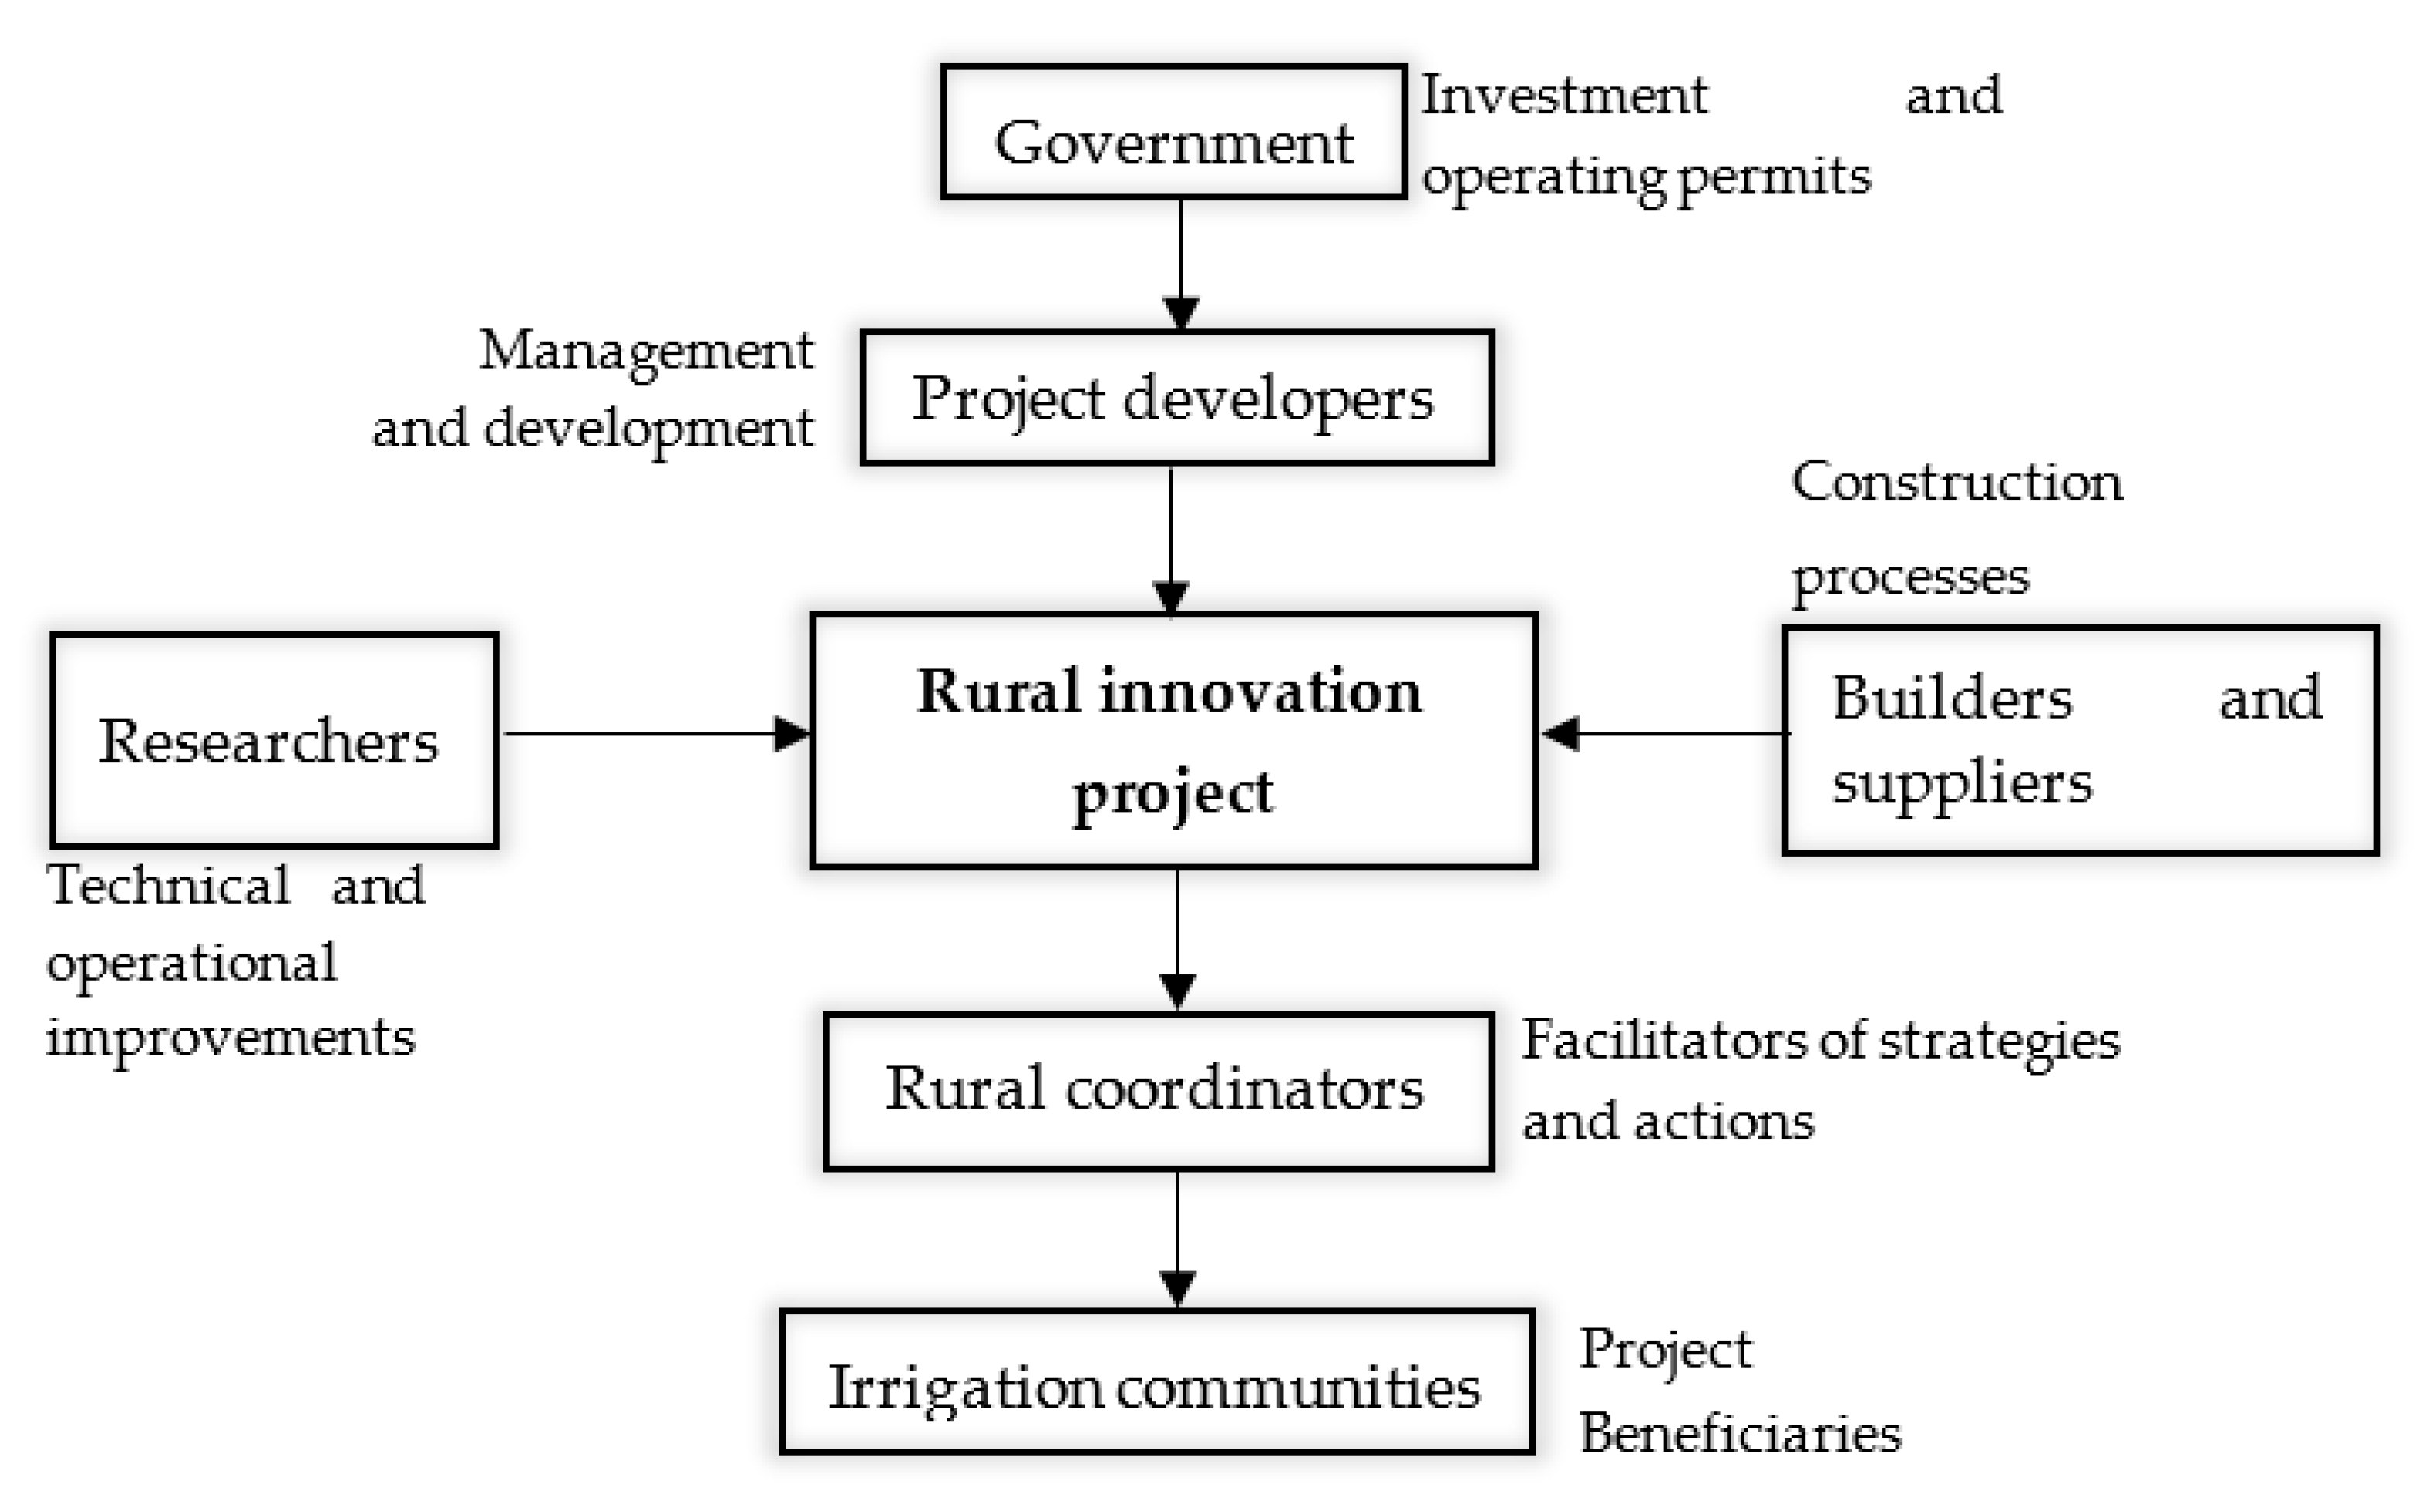
In Spain, 3.5 million hectares of irrigated land consume 16,000 hm3 of water per year (30% comes from underground sources), with 48%, 22% and 30% from micro-irrigation, sprinkling and surface irrigation systems, respectively, generating consumption above 68% of water consumption in the country [78]. This initiative is established, an I+D+I project, developed with public resources that seek to optimize the water and energy efficiency of irrigated areas in Spain, achieving their technification and increasing their economic profitability. Figure 2 describes how the actors in the project are structured and the main roles of each of them. The government is the financier of the project, which, through a public entity, manages and develops the project through five work blocks: (1) project coordination; (2) implementing renewable energies; (3) energy efficiency; (4) water efficiency, and (5) purchase and sale of energy. Additionally, some actors provide technical advice and support in construction activities through researchers from various universities and builders, respectively.
On the other hand, rural coordinators play an intermediate role between the actors named above and irrigation communities. They serve as facilitators between the various strategies carried out, especially those who require more technical knowledge and present disagreements between actors. Finally, and as the project primary beneficiaries, are the irrigation communities, who are the direct beneficiaries of the project, characterized by being those who carry out agricultural activities, generally through traditional methods.
The project focuses on the irrigating communities of Virgen del Aviso and Toro-Zamora in the province of Zamora (Figure 3), located in the community of Castilla y Leon, in the northwestern part of the Iberian Peninsula; which is a region where agricultural employment is twice as much as that in EU-15 on average [79].
As a rural innovation project, this initiative faces a series of challenges, among which conflicts arise between the various actors involved when developing and managing the project. On the one hand, there are irrigation communities and rural coordinators who, from a rural context, are characterized by their cultural roots and traditional work practices. On the other hand, there are actors established in urban areas, which are mainly made up of business teams and state companies, which seek to develop new business opportunities in rural areas to implement innovative technology and systems. To these two predominant actors, a group of actors involved from the spheres of state regulation, research, suppliers and construction contractors, which can be decisive when managing conflicts, is added. The constant participation between actors generally exchanges opinions, experiences, and decisions from their perspectives and interests. This participation can be highly beneficial to the project, although having a high level of interaction also brings a high burden of associated risks.
4. Results and Discussion
4.1. List of Risks and Actors
As part of this research, a total of 14 interviews with different key actors were conducted. The actors identified were: (S1) project coordination, (S2) energy efficiency group, (S3) water efficiency group, (S4) Leon field coordinators, (S5) research groups, (S6) irrigation community of Virgen del Aviso, (S7) community of irrigators at Toro-Zamora, (S8) state society of agrarian infrastructure, (S9) group for the purchase and sale of energy, (S10) energy suppliers, (S11) constructors and suppliers, (S12) government, (S13) field technicians and (S14) renewable energy group. This list includes both the actors who identified the risks and those who received them. Table 3 shows the identified risks, a total of 26, with their corresponding category and the actors with whom they were associated.
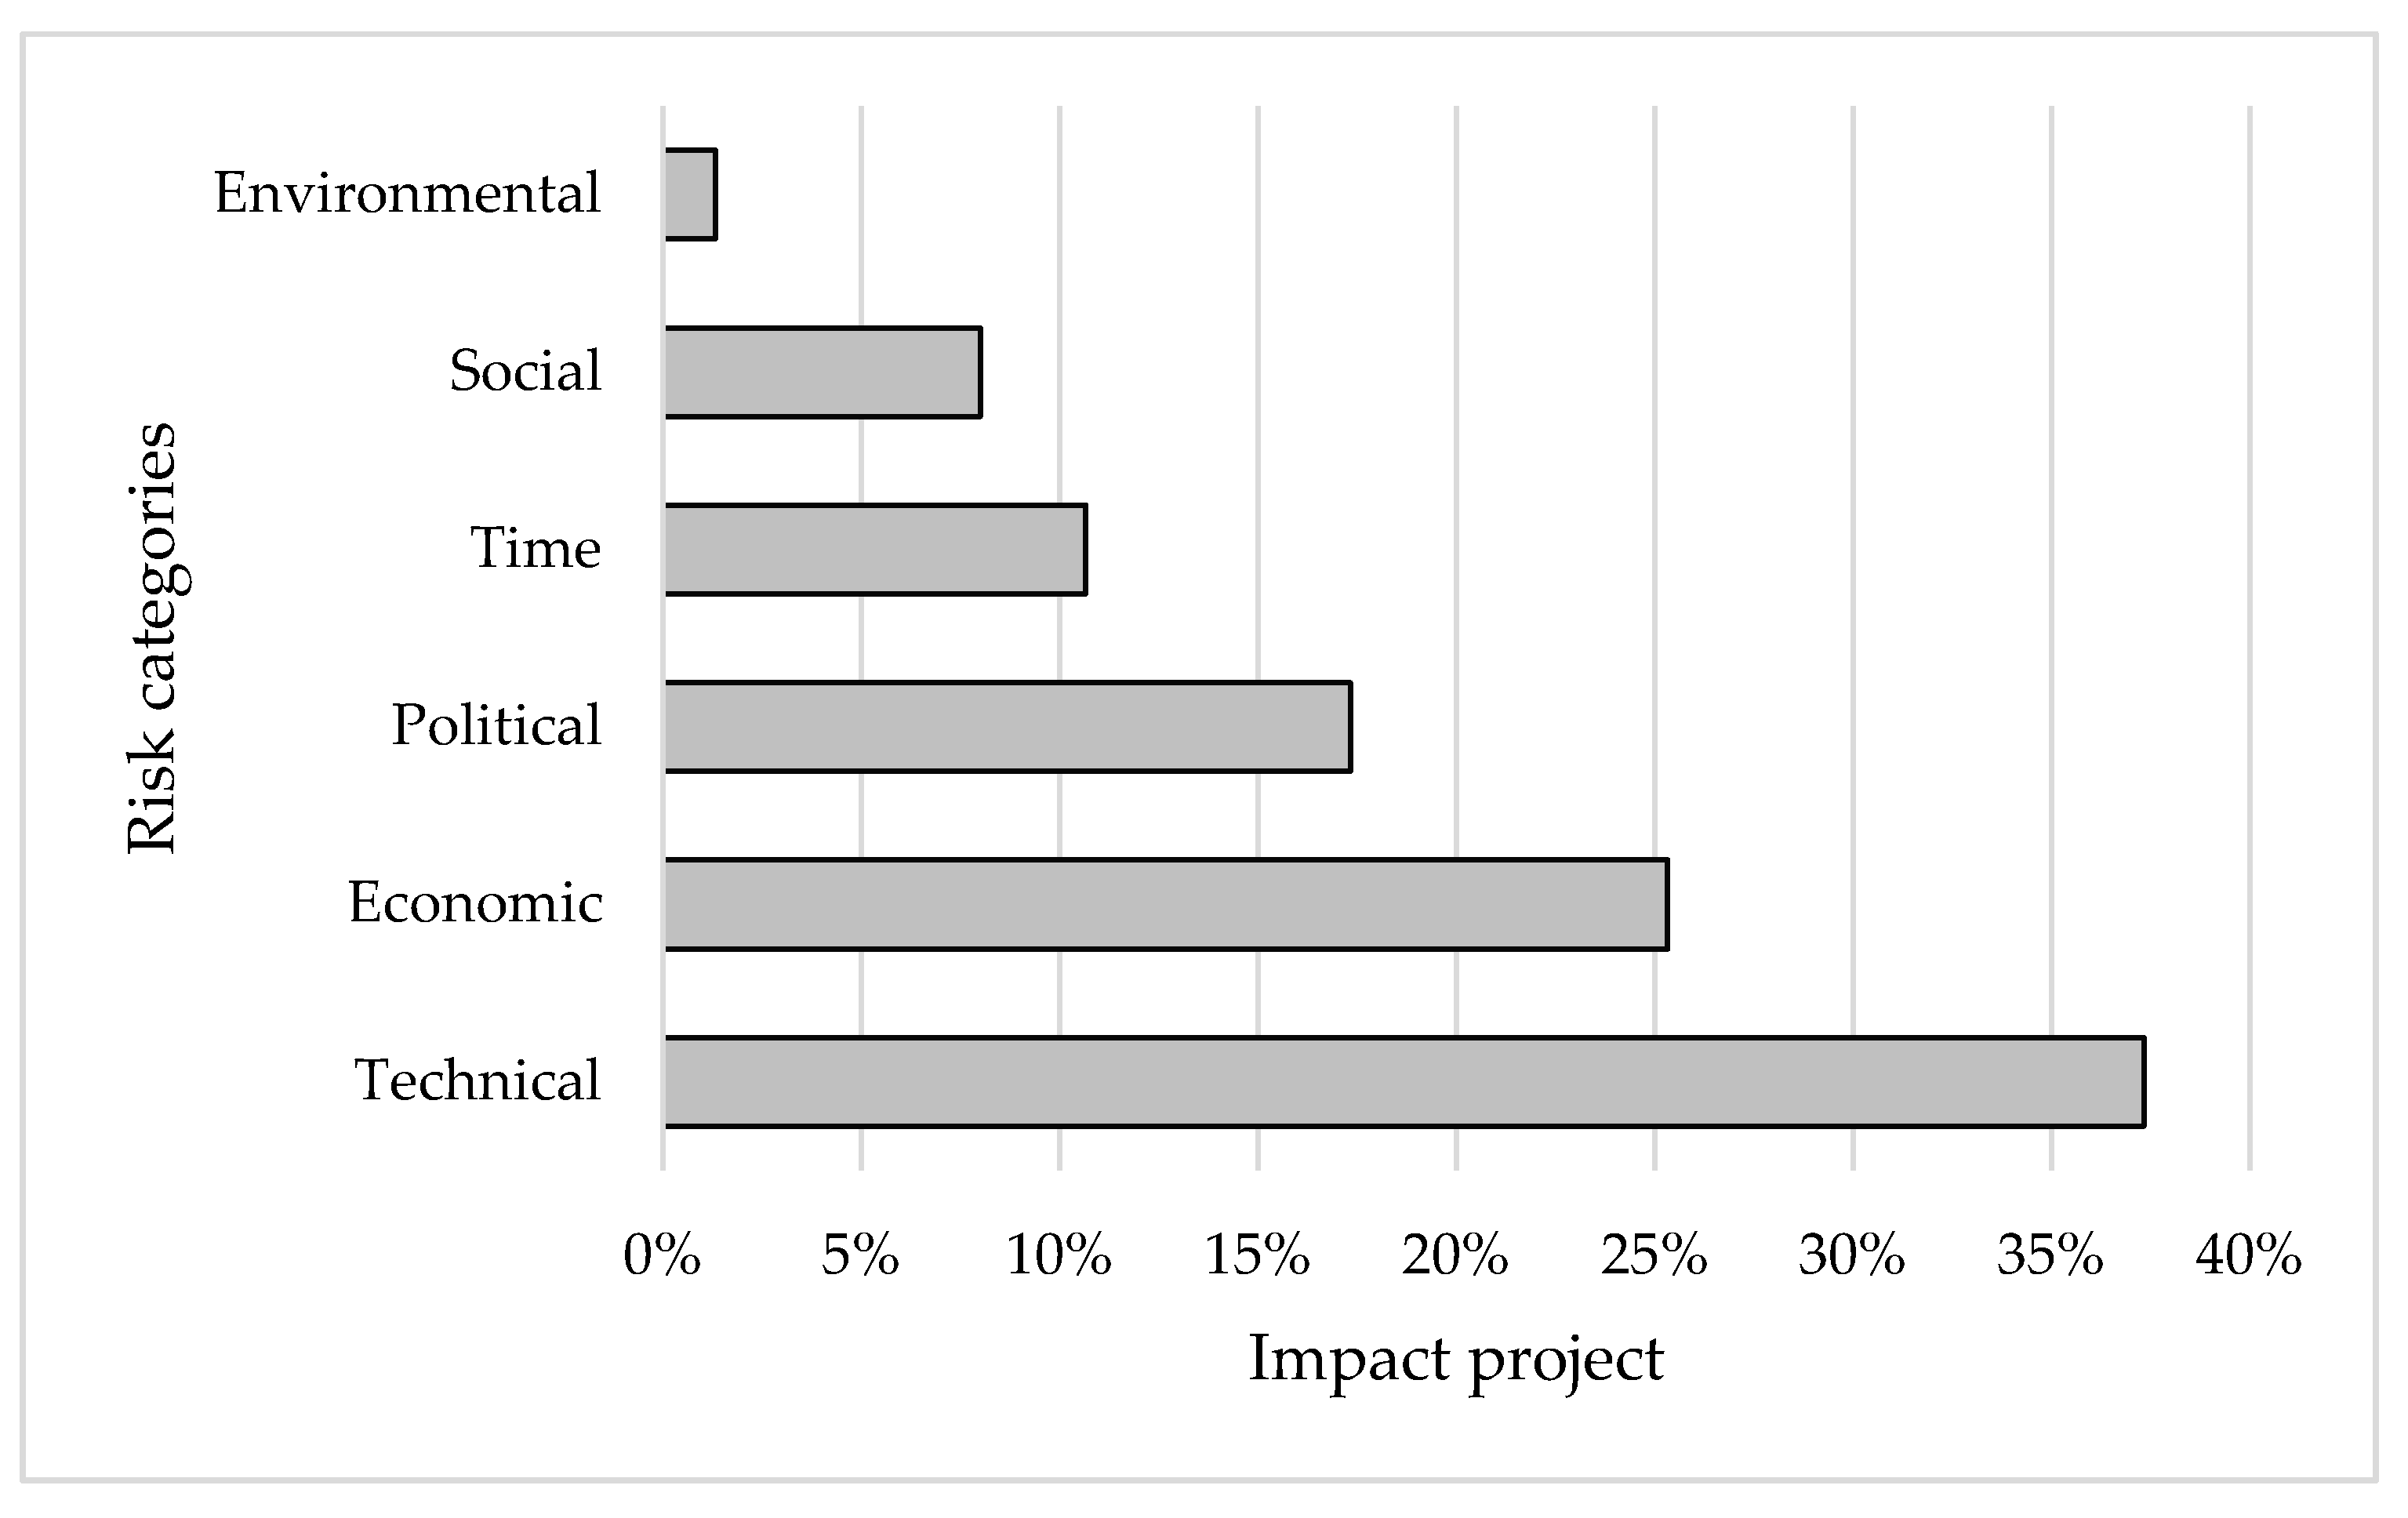
The network is equipped with 75 nodes, each of them formed by the actor relationship with risk. This information is consolidated by risk categories in Figure 4, identifying that the risk categories with the highest incidence are classified as technical and economic risks. The high incidence of technical risks may be due to the various difficulties that the project face when implemented in rural areas. The lack of technical resources is often evident; and the project continually faces changes due to factors associated with actors requirements. Regarding economic risks, they can be associated with the lack of planning on the part of the developers and funders of the project with technical and administrative issues. Environmental, social and time risks are focused more on specific processes within the project and not as general as the first two categories. Hence, their incidence is not as high.
Table 4 presents the risks associated with each of the 15 actors and their categorization according to their function within the project: project developers, irrigation communities, government entities, researchers, rural coordinators, builders and suppliers, and others.
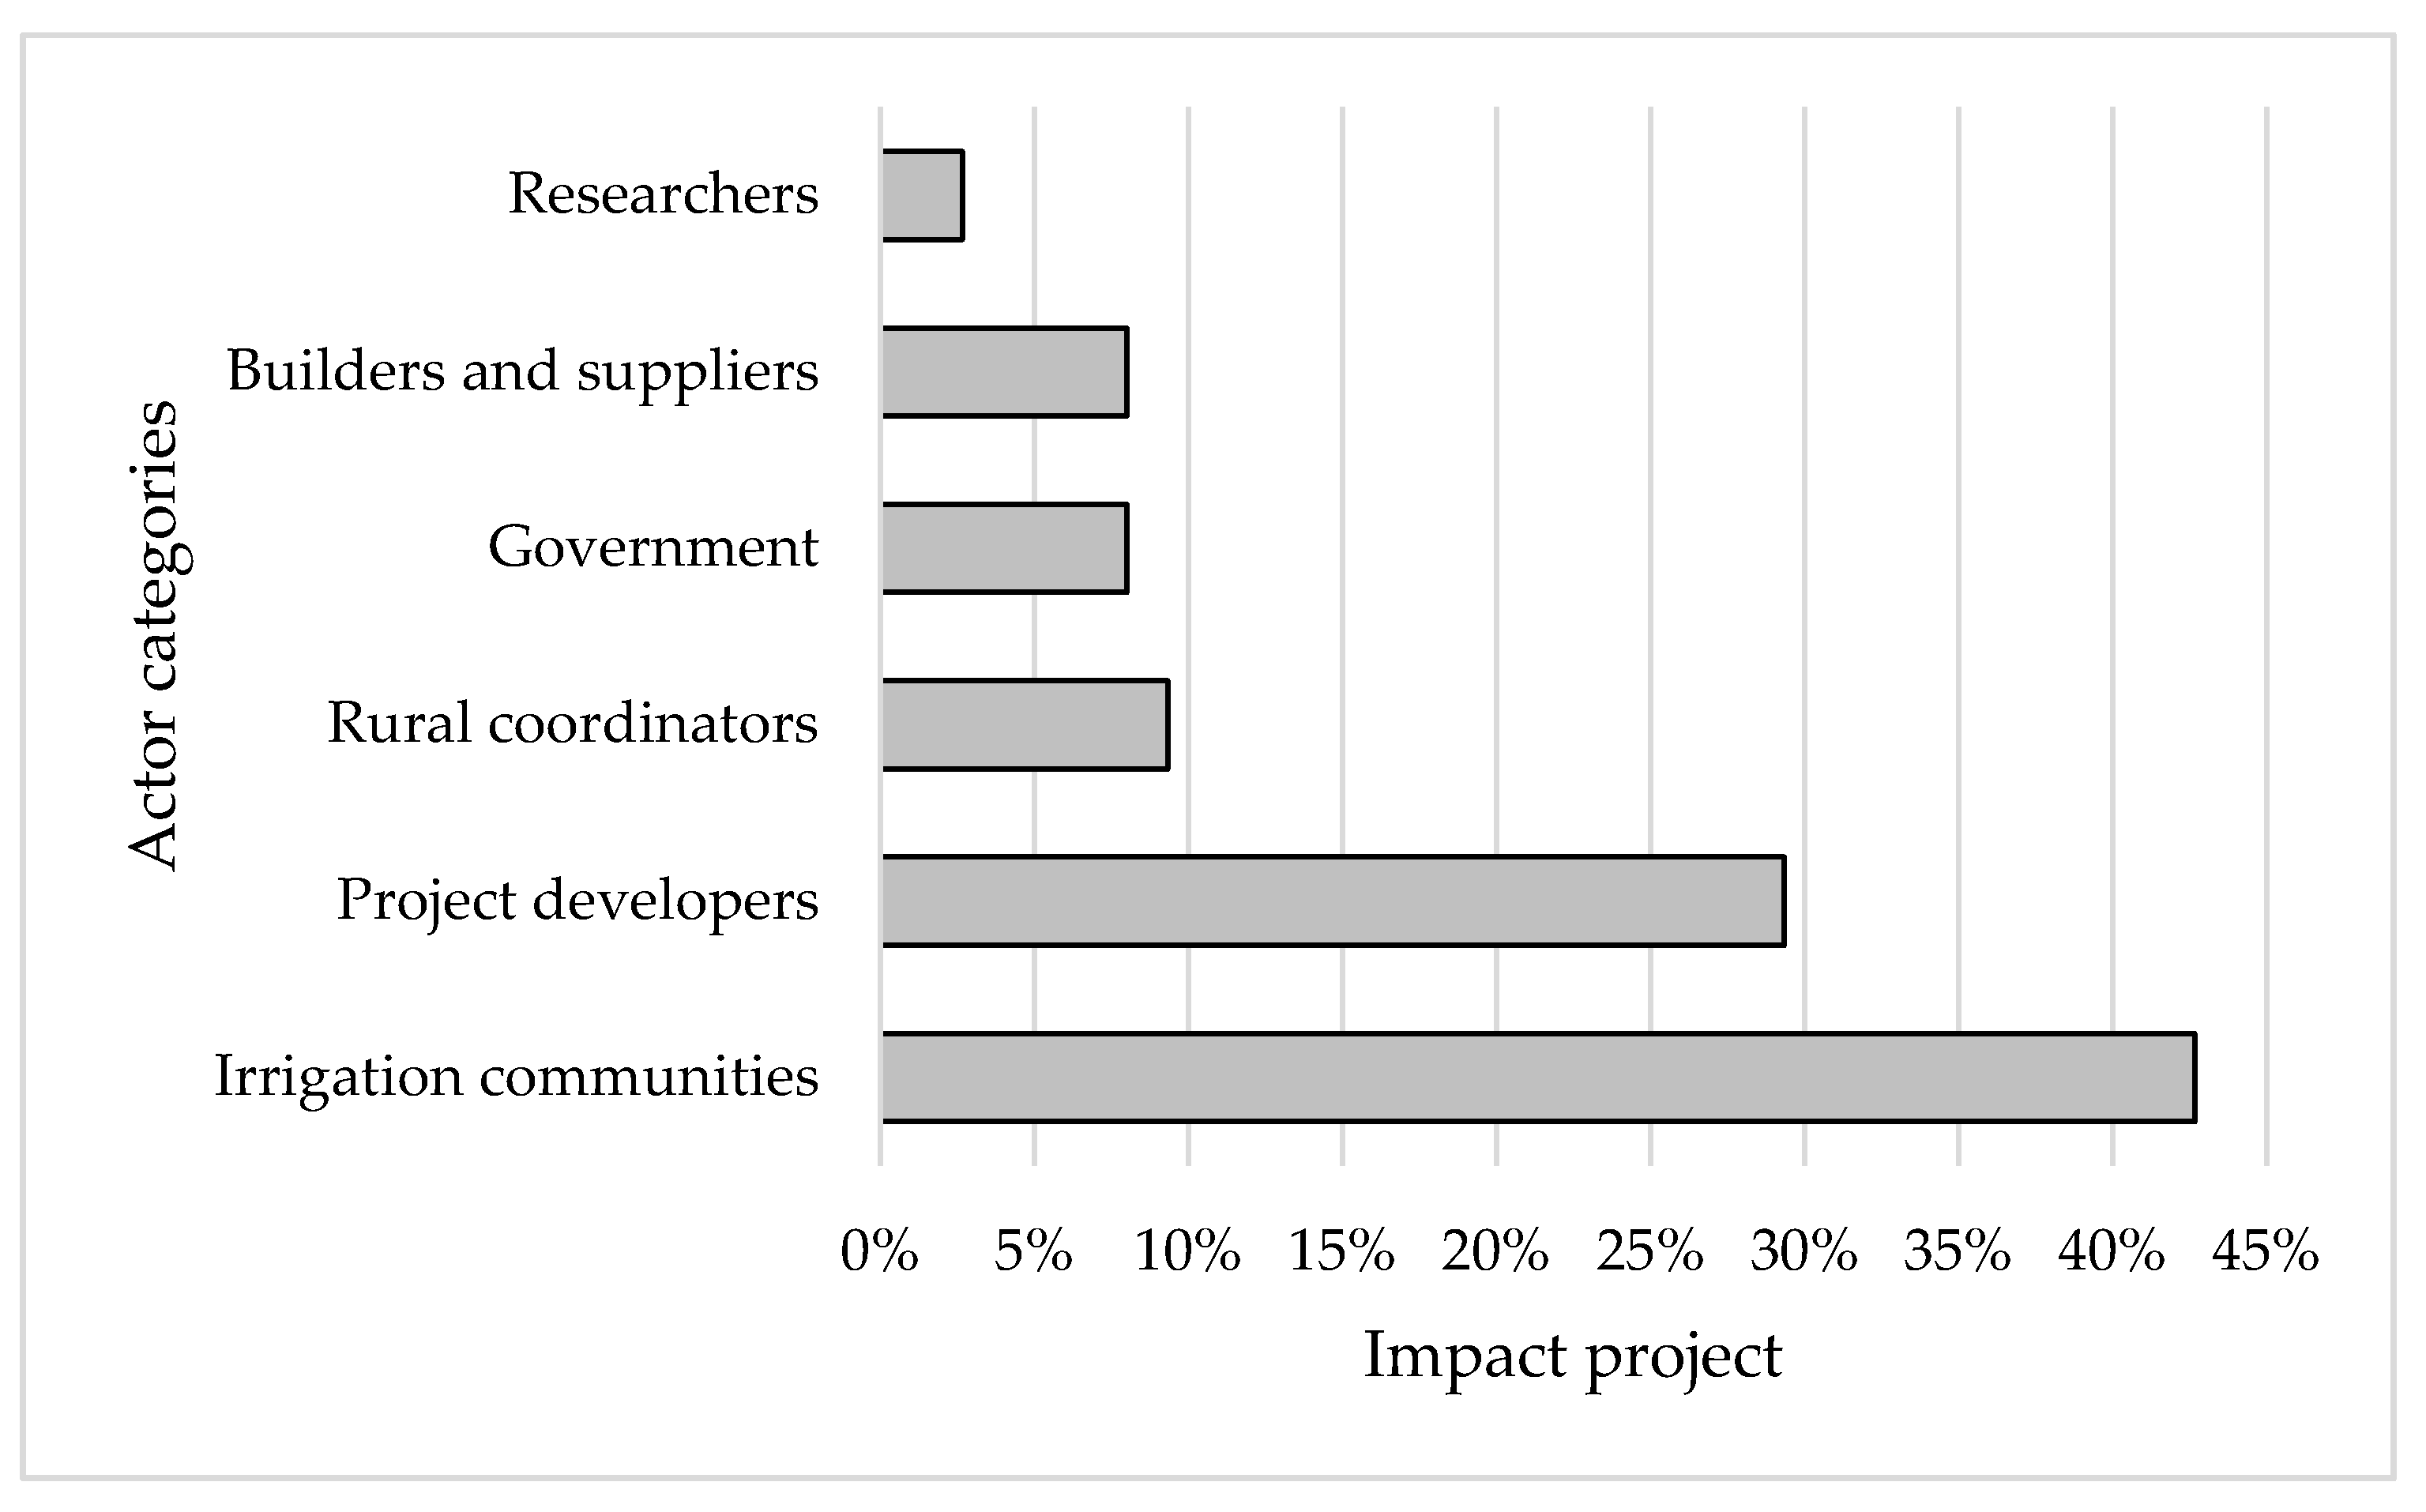
As shown in Figure 5, it is evident that the irrigation communities, as well as the project developers through the coordination blocks and water efficiencies, bear the greatest number of associated risks. Two main factors can interpret the high incidence of irrigation communities within the project: (1) they are the direct beneficiaries of the project and therefore are involved in an innovative and risky development process; and (2) the place where the project is carried out is directly on its plots, its rural environment being affected.
The project developers also play an essential role within the network, mainly because they are the direct promoters of the project, taking responsibility for all technical and economic matters. To a lesser extent, and because they are agents that participate in more specific processes, there are rural research coordinators, government entities, builders and suppliers, and researchers. These results reflect the importance of linking and socializing the project.
4.2. Visualization of the Risks and Actors Network
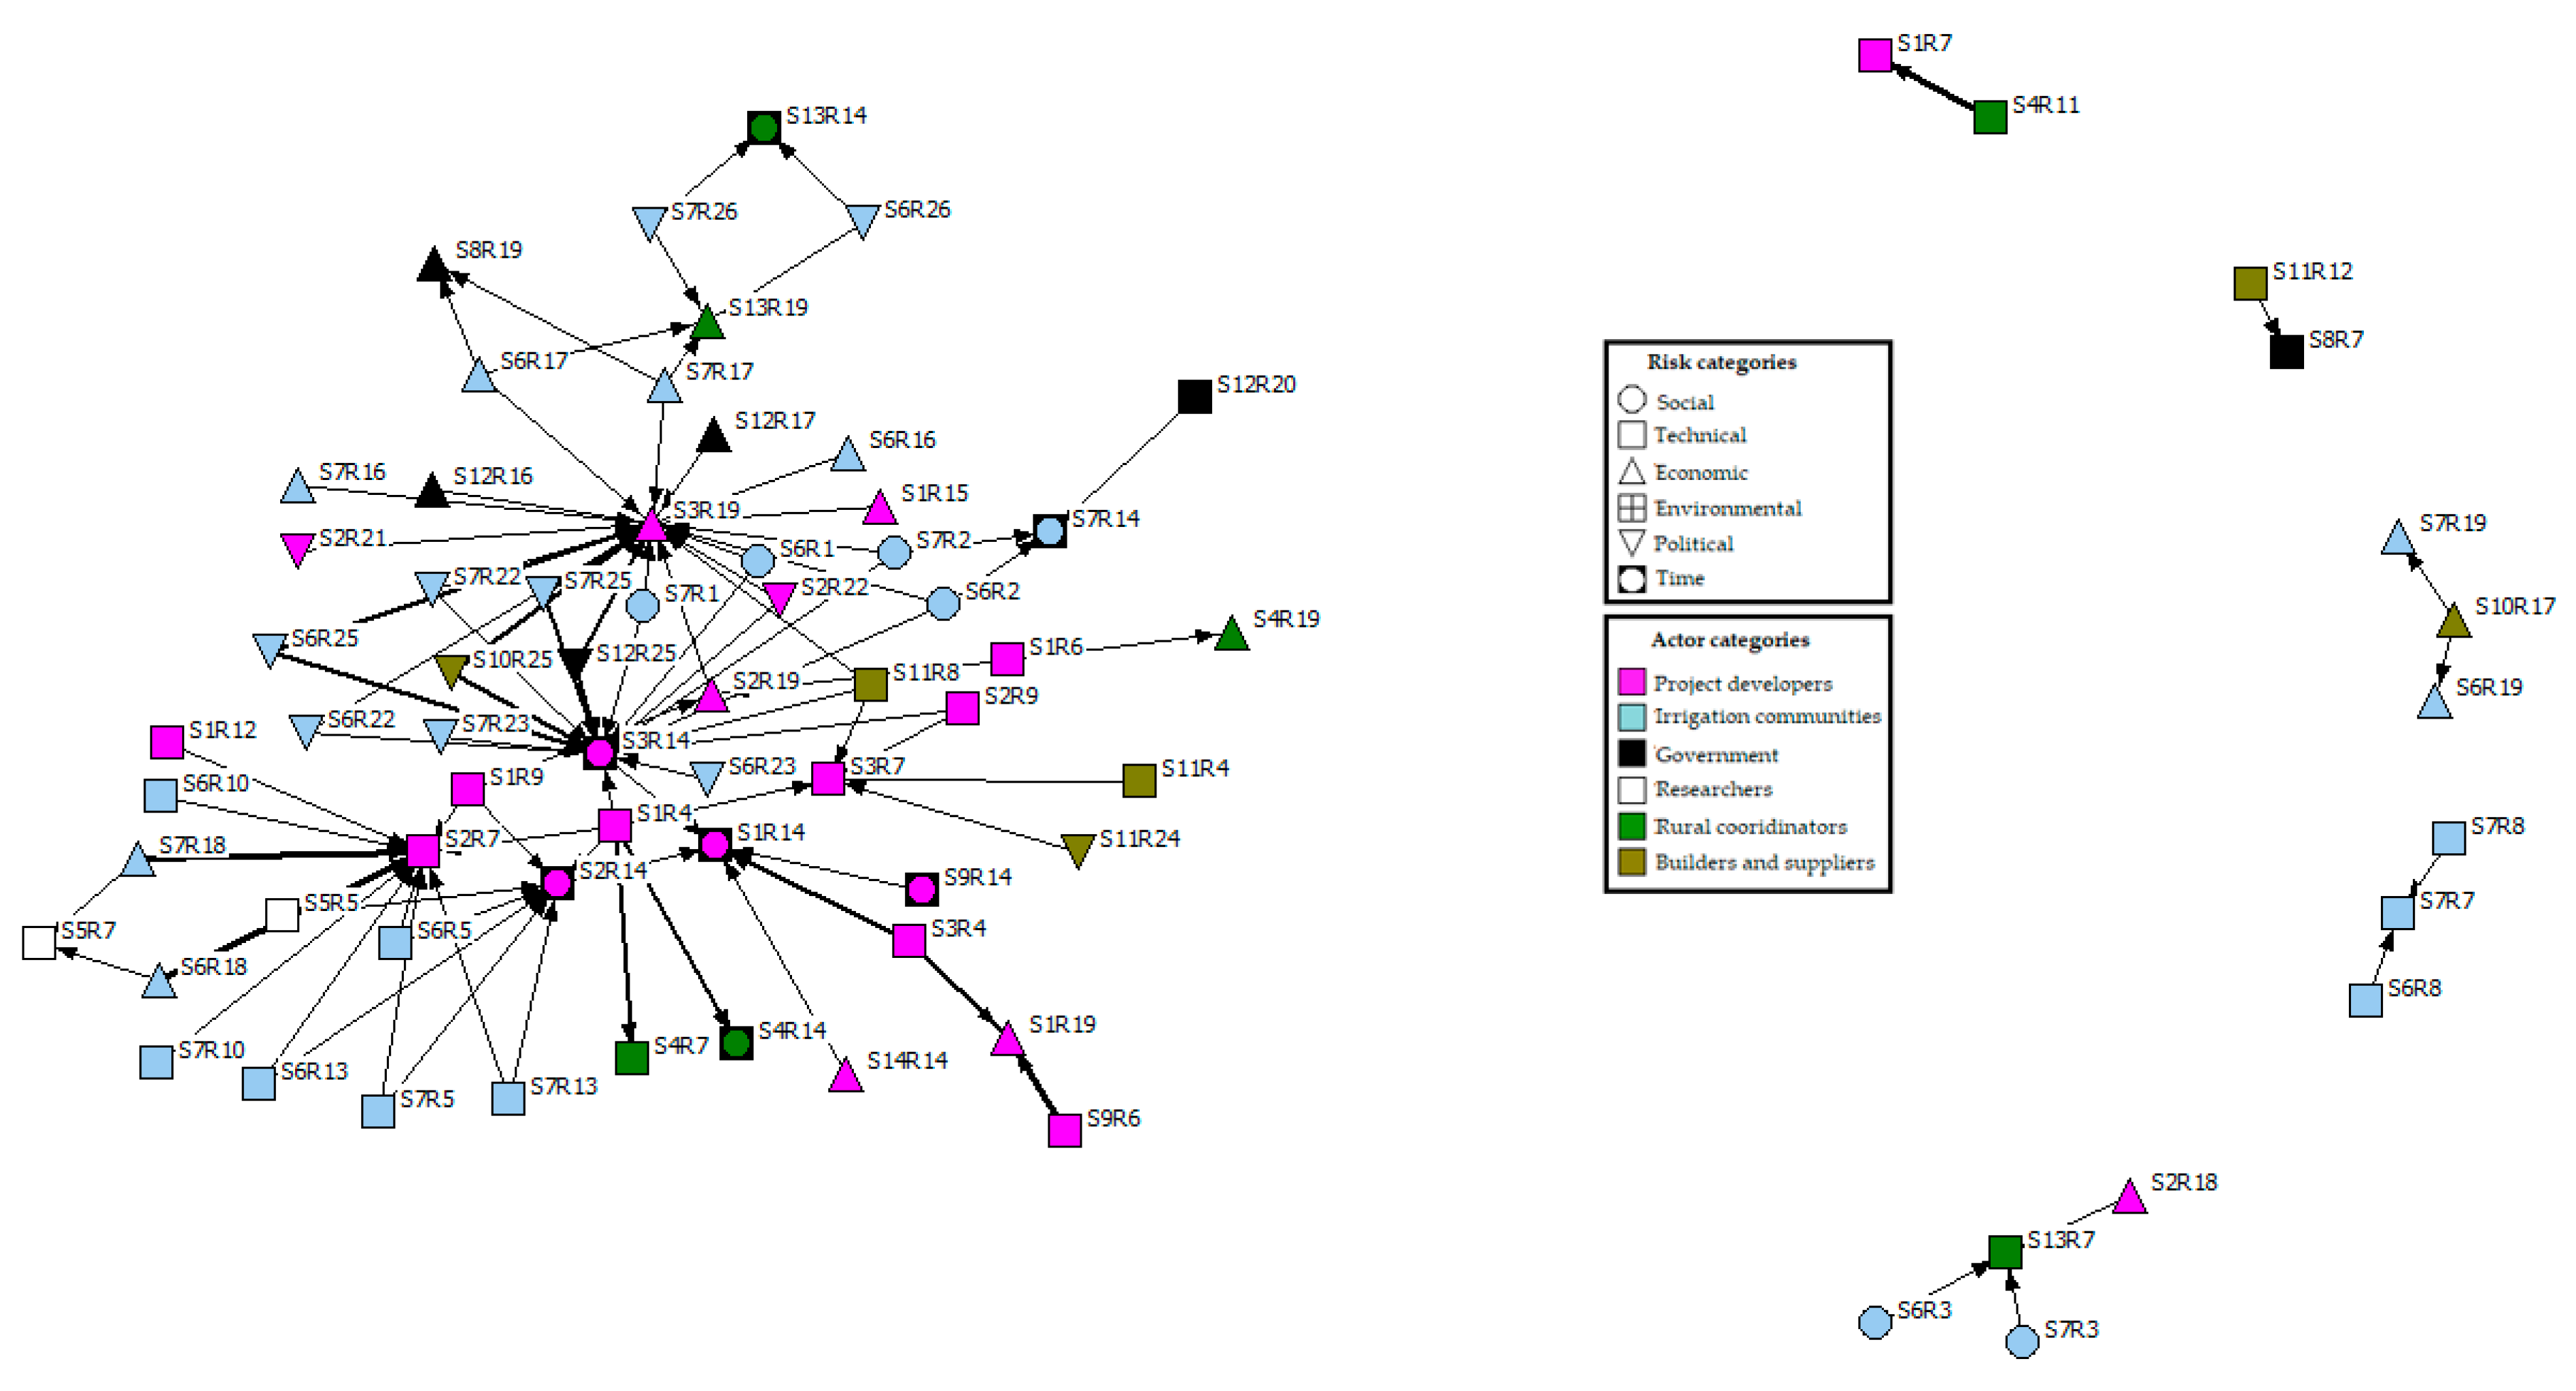
The network comprises 75 stakeholder risk nodes connected to 95 links, as shown in Figure 6. Colors symbolize the categories associated with the actors, the geometric figures represent the risk categories, and the thickness of the links represent the magnitude of the risk, as defined by the product between the impact and the probability. The nodes are coded as S#R#, where S represents the type of actor (S1 to S7) and R the type of risk (R1 to R26). Each link has a direction determined by an arrow that joins two nodes SaRb to ScRd, indicating that SaRb has identified risk Rd in actor Sc, which may negatively impact actor Sa associated with risk Rb. The matrix associated with SNA is found in Appendix A.
In the central part of the network, the nodes with the most connections are located, such as S1R14, S2R7, S2R14, S3R7, S3R14, S3R19. These dependent nodes are involved in the network to a bigger extent, that is, they have a greater domain of the network and therefore, any change that affects any of these nodes can considerably alter the others, increasing or decreasing the complexity of the network. In a second step, and as we move away from the central network area, there are interdependent nodes, defined as those involved with the most critical nodes of the network. Within this group, those nodes are included that, although they are not dependent, they do make part of the main structure of the network, and the links they are associated with are not as critical as the first. Finally, in the perimeter area of the network, five small groups of totally independent nodes are identified, and, although in one of them there are two nodes with a high-risk magnitude (S4R11 → S1R7), as there are no more associated nodes, can be managed in a more straightforward way than those located in the central part of the network. Due to their low rate of node exposure and the few connections within the network, the remaining four groups do not play any critical role. These findings indicate that, although not all nodes are connected homogeneously, most of them are related to two or more connections, which implies that even a small variation in a node could affect the general behavior of the network. Here is the key to why risk management processes are quite complex.
Regarding the stakeholder analysis, a group of purple nodes located in the central part of the network indicates that the project developers play a central role in risk management; their interactions represent the nodes with a comparatively high power of influence. Secondly, located around the purple nodes, of light blue color, most of the nodes of the network are agglutinated, corresponding to the irrigation communities, and, although the exposure is not as critical as the first ones, it is a group of nodes that continuously interacts with all other nodes, so its main role is to function as a risk transmission bridge.
Despite having the greatest number of associated risks, irritation communities are less central than developers due to their position in the network. This aspect must be taken into account when managing risks, because proposing risk management on irrigating communities would imply greater effort and possibly lower results than focusing on the central nodes of the network. With less influence within the network, but also important, are those risk nodes related to government entities, researchers, rural coordinators and builders and suppliers, represented by white, black, green, and beige colors, respectively.
Regarding the interpretation of the thickness of the links that join the different nodes of the network, closeness centrality was calculated, allowing to identify the nodes that have the best capacity to connect to the others. The results indicated that S1R14 was the node with the highest input closeness centrality, so any impact on any of the network nodes can immediately affect the project developers, generating additional costs. The following nodes with the highest closeness centrality were S3R19 and S3R14.
In addition to the graphic representation, the density was calculated to quantitatively examine the network and reflect the global characteristics of the risk structure. Researchers have used this metric to measure the overall degree of difficulty in managing risk [25,31]. The lower the density, the fewer links there are and therefore, it is easier to manage the risks identified in the network. The network density was only 0.017, which, expressed as a percentage, would be 1.7%; that is, the 95 links observed represent 1.7% of the possible links in the entire network. If all the nodes were connected, there would be a density of 100%, and no node would be dominant in the network; therefore, the network would be much more challenging to manage.
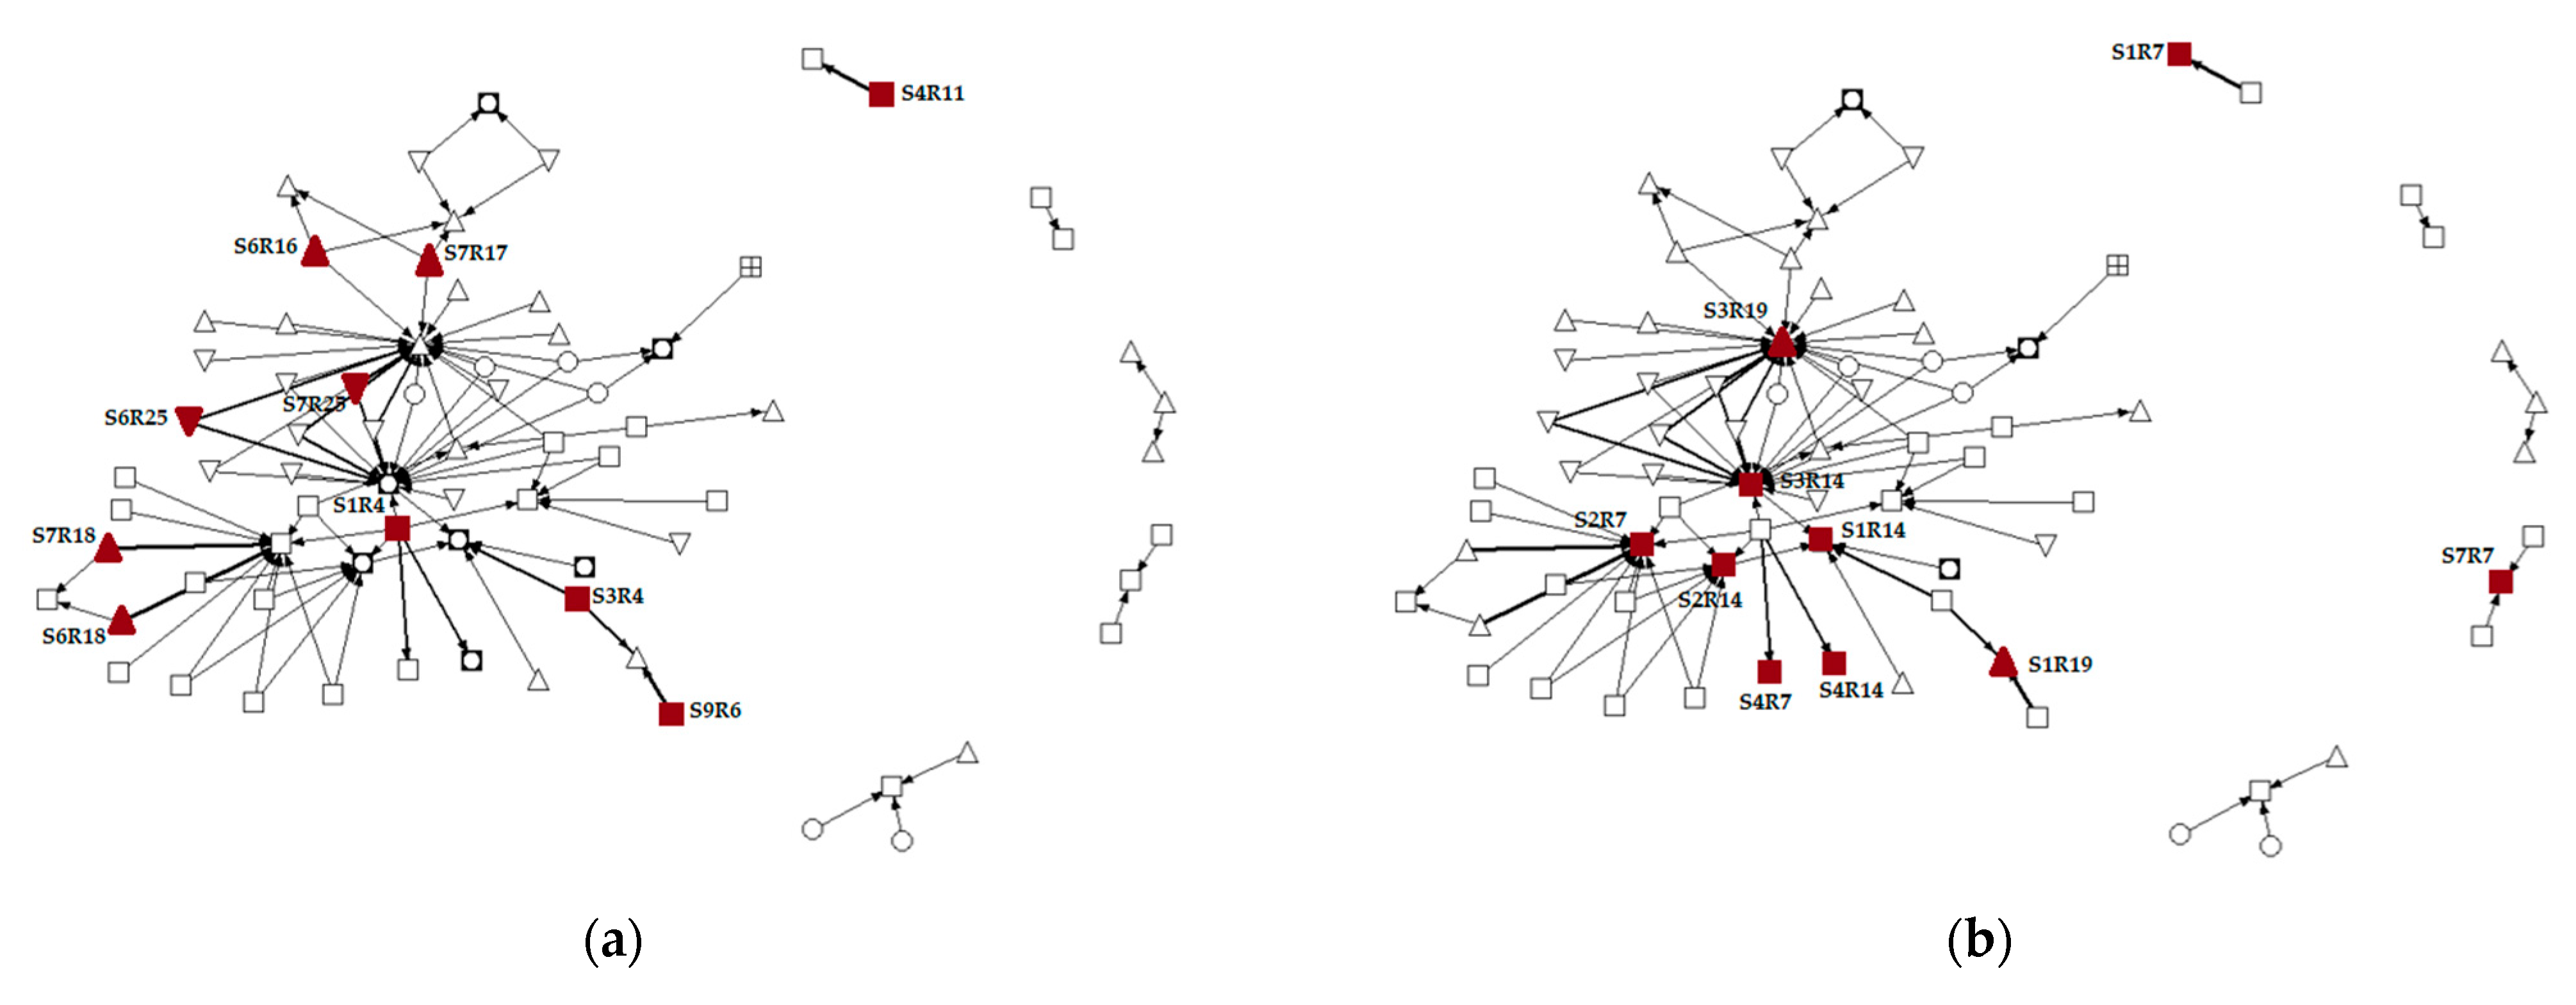
Table 5 and Table 6 show, respectively, the 10 nodes with the highest centrality by output and input index. In this sense, node S1R4 is the one with the highest output index (30) with 6 connected nodes, the risk “changes in the project scope” associated with the “project coordination” actor being the most critical due to output centrality. Therefore, the project coordination associated with the project developers category is the actor that identified the largest number of nodes with high intensity of risk within the network, which, since they are not managed, can generate negative consequences related to changes in the project scope. Figure 7a shows the primary nodes by output centrality, characterized by being the most affected in the network.
Analyzing the other results shown in Table 5, it is observed how the following four nodes (S6R18, S7R18, S4R11, S9R6) are also important to take into account for management, since they have considerable output indices, with economic and technical risks, primarily associated with costly sustainability measures (R18), loss of sustainable measures to achieve others (R11) and inaccurate cost estimation (R6). In this case, node degree can be a valuable parameter to compare with the output index since, despite being connected with only one or two nodes, they have high exposure within the network, with output rates of 25 or more, indicating that these risks are very likely to occur and have effects on other actors in the network.
Table 6 shows that the node with the highest input centrality is S3R19, representing the additional costs or lack of access to funds belonging to the category of economic risks associated with the water efficiency group, belonging to the category of project developers. Therefore, the project stakeholders see the water efficiency actor as the primary source of risk, considering that it can negatively impact the project through additional costs. Therefore, it can be considered a vulnerable node in the network, to which attention must be paid. This node is additionally the node of the entire network with the highest node degree corresponding to 21 total links received.
Nodes S3R14 and S2R7 complete the ranking of nodes with the highest input index in the network, introducing the category of time (R14) and technical (R7) risks. The S1R19 and S1R7 nodes, although they do not have as high an index as the previous three, they also have important exposure to network risks, with input rates above 20. These two risks are also related to economic (R19) and technical (R7) categories. The remaining five nodes (S1R14, S2R14, S4R7, S4R14, S7R7), despite not having the high values like the previous nodes, are also related to technical and time risks. Figure 7b shows the nodes most referred to by the actors as a source of risk.
Regarding betweenness centrality Table 7 shows the three nodes that connect the most pairs of nodes in the network (S3R14, S2R14, S2R19). Nodes S3R14, S2R14, and S2R19 represent time (R14) and economic (R19) risks associated with actors categorized as project developers (S3, S2). Nodes with a high level of betweenness centrality are strategic since they can retain, interrupt or distort the network [69]. Therefore, these nodes are the most critical when spreading risk within the network, being a hub for the entry and exit of links. Breaking the bonding of these nodes would simplify the most critical paths of the network, allowing each of the nodes to be managed more easily. Link betweenness centrality confirms that the project developers (S1, S3) associated time risks (R14), with an indicator of 16.5, play a fundamental role within the project network. In this sense, the link that connects nodes S3R14–S1R14 is the most critical, as it is the main connection bridge between groups of nodes with a high magnitude of risk. The findings in the analysis of betweenness centrality agree with the critical actors and risks presented above.
4.3. Discussion
In general, similar research results support the findings of this study, demonstrating that economic and technical issues are the primary source of risk in public projects, generating significant delays in delivery times [80]. However, even though the project was carried out with a high social innovation component, social risks did not mark as important a trend as the first two. One of the possible causes of these findings could be a lack of more active participation on the part of the social actors within the project, mainly due to the limitations that the project developers placed on these social groups.
In current studies, researchers point out that improper construction methods and insufficient qualification technical staff associated with technical problems are a source of delays in projects carried out in rural areas [4,81]. The results show a high impact of technical risks in the project, mainly associated with changes in the project scope and non-compliance with specified quality standards. Regarding the presence of economic risks, other research has been aligned with the results of this study, stating that factors such as additional costs [54] or changes in the price of raw material [43] are common to find in this type of rural innovation initiatives, mainly due to the limitations of access that exist in rural areas. Consequently, a set of delays in project delivery times is usually triggered due to these types of risks.
It is also important to emphasize that within the results obtained in the interviews, the actors included risks that had not been initially raised, such as the lack of interest on the part of the irrigating communities in participating in the project, lack of support to the work blocks by the project managers or non-compliance in the development of sustainability measures. These findings explain that, in rural areas, the risks are not limited; on the contrary, there are substantial continuous changes in the interaction patterns between actors [82], making project management increasingly challenging to develop.
Scholars have also agreed that the project developers do not have, at times, good communication with the community around the project, losing many privileges that could increase your expenses, generating more costs and excess project time [39]. Additionally, the critical role that rural communities play when implementing innovation projects has also been widely studied, and there is agreement on the difficulty that rural communities may have when becoming familiar with the use of new technologies [83]. Although there is an important number of papers that use SNA to identify risks from the viewpoint of the actors, the context of the case studies is not related to rural development, so it is not convenient to compare specific results of the network with other investigations. However, in studies focused on urban development projects, there is agreement that the actors that most generate conflicts are those related to the developers and the communities where the project is developed. [33]. This situation can occur because the internal stakeholders are the main body in planning, execution, and management in development processes, and they are also the direct beneficiaries of the project, as Wang et al. mentions [83]. At the same time, those external actors, who participate on an ad hoc basis, have a less critical role since they suggest and guide the project implementation. Promote innovation can encourage greater participation of stakeholders in the rural sphere, focusing on developing ideas in the same direction.
Finally, there is agreement on applying SNA as a tool that allow to assess the level of inclusion in rural development processes and the level of involvement of different, often opposing, stakeholders into mutually motivated work to achieve common goals, as Furmankiewicz states in his research [84].
4.4. Risk Mitigation Strategies
The results of SNA provided helpful information that made it possible to understand risk interactions. That is why a series of strategies are proposed to mitigate risks based on the indicators obtained in the previous section. It is based on the principle that risks must be managed by qualified stakeholders who have sufficient capacities and are adequate to counteract them [33]. Managing identified risks allows taking measures to optimize risk throughout the project life cycle [85].
The risks with their respective associated actors that are named in Table 5 and Table 6 must be mitigated with priority due to their consequences that they can generate for the project. Additionally, interrupting and distorting the critical interactions of nodes with risks associated with time and economic aspects, as indicated in Table 7, would considerably simplify the network into parts that are much simpler and easier to manage, reducing the propagation effects on the other nodes.
According to the quantitative results obtained through SNA, indicators show that nodes having risks related to economic, technical, and time aspects associated with the irrigation communities and project developers have greater influence within the network; therefore, within the proposed strategies for risk mitigation, alternatives related to efficient financial management; control of the quality standards and scope of the project; and monitoring the project schedule and delivery times are included. These strategies should be practical and applied to actors associated with these risks.
4.4.1. Efficient Financial Management
Financial management challenges are associated with cost overruns and lack of access to funds (S1R19, S2R19, S3R19). These relations are particularly true for rural areas because the socio-economic context is often characterized by minimal access to resources (physical, human and financial) [86]. To mitigate risks associated with cost overruns, inaccurate estimates of project costs should be avoided, as well as design changes in the construction phase [87]. In this sense, according to the results obtained, project developers, through the coordinators and water efficiency team, are the actors who must exercise the most control in this regard. Regular monitoring can efficiently reduce project cost overruns [88]. Otherwise, to guarantee access to monetary funds, late payments and financial deficiencies must be avoided [80].
4.4.2. Control of Quality Standards and Project Scope
For this type of project, the development and management process must be periodically monitored. Results show that risks associated with changes in the technical scope of the project (S1R4), changes in sustainability measures (S6R18, S7R18), as well as non-compliance with the project quality standards (S2R7, S1R7, S4R7) are critical. Some standards that manage and ensure project quality are ISO 9001 and IPMA standards related to a quality management system and technical skills [89]. This management should mainly charge the project coordination, the energy efficiency group, and field coordinators.
4.4.3. Follow-Up to the Project Schedule and Delivery Times
A delay in project delivery times typically generates cost overrun [80], so meeting the stipulated deadlines goes hand in hand with proper expense management. In this case, as the project is developed in rural areas and the availability of materials and qualified labor could be limited, execution times increased (S1R14, S3R14 S2R14, S3R14). Having good project planning through scheduling techniques such as the Gantt chart or PERT allows identifying critical routes, scheduling a risk analysis, revealing the interdependence of activities, and providing a means to verify the progress of the project [90]. On the other hand, the irrigation communities, in some cases, were not interested in participating in the project (S6R2, S7R2), so not having their participation and approval could imply delays or suspension of activities.
It must be taken into account that the networks of local actors play a crucial role in the mobilization of resources (local or external) for the development, adoption and implementation of different types of innovation in the productive system of rural areas [86]. Social problems associated with poor communication and pressure from irrigation communities (S6R3, S7R3, S6R1, S7R1) were also identified. Poor communication between stakeholders can delay the completion of projects [88]. Successful project communication is only possible when the entire project team communicates effectively. Even if project coordination is the focal point through which communications flow, other project members must also be effective in their interactions with stakeholders [91]. The transformation and improvement of social relations contribute to social development [92].
5. Conclusions
This research takes advantage of the collective knowledge of risks and stakeholders to generate solutions in risk management within the management and development process of rural innovation projects. Consequently, the set of information produced in this study will be a valuable basis for risk analysis of new rural development projects.
Through a literature review and interviews with key stakeholders, a risk list of 37 factors was compiled). Identifying risks within rural projects must be continuously monitored, mainly due to the adverse effects the risks may have on the entire project. The use of SNA was useful to identify the main risks and interactions that affect the development of projects in rural areas. In general, the network analysis showed that the difficulty of managing the nodes is low, with only 1.7% of possible links of the entire network. This percentage indicates that the links present in the network analysis can be interrupted, making it easier to manage as long as those nodes with high centrality indices are mitigated. The critical nodes were: S1R4, S6R18 and S7R18 by output index, and S3R19, S3R14 and S2R7 by input index. These nodes were associated with technical, economic and time risks, especially changes in the scope and quality standards (R4, R7), additional costs (R18, R19) and excess time in project execution (R14). The actors associated with these risks were project developers (S1, S2, S3) and the irrigation communities (S6, S7). As a solution to mitigate the main social risks identified in the project, strategies focused on efficient financial management, control of quality standards and project scope, and monitoring of the project schedule and delivery times were proposed.
The main limitations in this study were associated with: (1) The interviews were conducted with a limited group of actors. For this reason, it is possible that within the research, all the social risks associated with the development and management of rural innovation projects are not identified. (2) The sample size could affect the robustness of the results. However, this limitation does not entirely affect the research carried out, mainly because the interviews were carried out with the most representative stakeholders of the project. (3) The mitigation strategies proposed in this research were carried out based on a theoretical assumption, without empirical evidence.
The results also show the need to continue exploring new networks of increasingly large and complex actors within rural development that help identify new potential risks and interactions. Having a complete database that studies different case studies from Europe can allow a more in-depth analysis of the various interactions of actors and risks created within rural projects to be generated. Additionally, extending the time span of the study to the entire life cycle of the project could generate new information. Finally, it is necessary to carry out empirical studies that support the effectiveness of the three mitigation strategies proposed in this study, considering that the alternatives were based on a theoretical assumption.
Author Contributions
Conceptualization, D.S., J.M.D.-P. and M.B.; methodology, D.S. and M.B.; formal analysis, D.S. and M.B.; investigation, D.S.; resources, D.S.; writing—original draft preparation, D.S. and M.B.; writing—review and editing, J.M.D.-P.; supervision, J.M.D.-P. All authors have read and agreed to the published version of the manuscript.
Funding
This research received no external funding.
Data Availability Statement
The data presented in this study are available on request from the corresponding author. The data are not publicly available due to privacy concerns.
Acknowledgments
I would like to thank the Universidad Politécnica de Madrid, especially the research team at the Higher Technical School of Agricultural, Food and Biosystems Engineering.
Conflicts of Interest
The authors declare no conflict of interest.
Appendix A
Table A1.
Matrix associated with SNA. Within each cell of the matrix are the values associated with risks: the left represents the impact, while the digit located on the right side represents probability.
Table A1.
Matrix associated with SNA. Within each cell of the matrix are the values associated with risks: the left represents the impact, while the digit located on the right side represents probability.
| S1R7 | S1R14 | S1R19 | S2R7 | S2R14 | S2R19 | S3R7 | S3R14 | S3R19 | S4R7 | S4R14 | S4R19 | S5R7 | S6R19 | S7R7 | S7R14 | S7R19 | S8R7 | S8R19 | S13R7 | S13R14 | S13R19 | |
|---|---|---|---|---|---|---|---|---|---|---|---|---|---|---|---|---|---|---|---|---|---|---|
| S1R4 | (2,1) | (2,1) | (1,1) | (1,1) | (3,4) | (3,4) | ||||||||||||||||
| S1R6 | (2,1) | (2,3) | ||||||||||||||||||||
| S1R12 | (2,1) | |||||||||||||||||||||
| S1R9 | (2,1) | (2,1) | (2,1) | |||||||||||||||||||
| S1R15 | (1,3) | |||||||||||||||||||||
| S2R14 | (2,1) | |||||||||||||||||||||
| S2R9 | (1,1) | (1,1) | ||||||||||||||||||||
| S2R18 | (2,1) | |||||||||||||||||||||
| S2R19 | (1,3) | |||||||||||||||||||||
| S2R21 | (2,3) | |||||||||||||||||||||
| S2R22 | (2,3) | (2,3) | ||||||||||||||||||||
| S3R4 | (2,4) | (2,4) | ||||||||||||||||||||
| S3R14 | (2,1) | |||||||||||||||||||||
| S4R11 | (5,5) | |||||||||||||||||||||
| S5R5 | (2,1) | (2,1) | ||||||||||||||||||||
| S6R1 | (1,1) | (1,1) | ||||||||||||||||||||
| S6R2 | (2,1) | (2,1) | (2,2) | |||||||||||||||||||
| S6R3 | (2,2) | |||||||||||||||||||||
| S6R5 | (2,1) | (2,1) | ||||||||||||||||||||
| S6R8 | (2,3) | |||||||||||||||||||||
| S6R10 | (2,1) | |||||||||||||||||||||
| S6R13 | (2,1) | (2,1) | ||||||||||||||||||||
| S6R16 | (2,3) | |||||||||||||||||||||
| S6R17 | (2,3) | (2,3) | (2,2) | |||||||||||||||||||
| S6R18 | (5,5) | (2,2) | ||||||||||||||||||||
| S6R22 | (2,3) | (2,3) | ||||||||||||||||||||
| S6R23 | (2,3) | |||||||||||||||||||||
| S6R25 | (2,4) | (2,4) | ||||||||||||||||||||
| S6R26 | (1,2) | (1,2) | ||||||||||||||||||||
| S7R1 | (1,1) | (1,1) | ||||||||||||||||||||
| S7R2 | (2,1) | (2,1) | (2,2) | |||||||||||||||||||
| S7R3 | (2,2) | |||||||||||||||||||||
| S7R5 | (2,1) | (2,1) | ||||||||||||||||||||
| S7R8 | (2,3) | |||||||||||||||||||||
| S7R10 | (2,1) | |||||||||||||||||||||
| S7R13 | (2,1) | (2,1) | ||||||||||||||||||||
| S7R16 | (2,3) | |||||||||||||||||||||
| S7R17 | (2,3) | (2,3) | (2,2) | |||||||||||||||||||
| S7R18 | (5,5) | (2,2) | ||||||||||||||||||||
| S7R22 | (2,3) | (2,3) | ||||||||||||||||||||
| S7R23 | (2,3) | |||||||||||||||||||||
| S7R25 | (2,4) | (2,4) | ||||||||||||||||||||
| S7R26 | (1,2) | (1,2) | ||||||||||||||||||||
| S9R6 | (5,5) | |||||||||||||||||||||
| S9R14 | (2,1) | |||||||||||||||||||||
| S10R17 | (1,3) | (1,3) | ||||||||||||||||||||
| S10R25 | (2,4) | (2,4) | ||||||||||||||||||||
| S11R4 | (1,2) | |||||||||||||||||||||
| S11R8 | (1,3) | (1,3) | (1,3) | |||||||||||||||||||
| S11R12 | (2,2) | |||||||||||||||||||||
| S11R24 | (1,3) | |||||||||||||||||||||
| S12R16 | (2,3) | |||||||||||||||||||||
| S12R17 | (2,3) | |||||||||||||||||||||
| S12R20 | (1,2) | |||||||||||||||||||||
| S12R25 | (2,4) | (2,4) | ||||||||||||||||||||
| S14R14 | (2,1) |
References
- Yu, A.T.W.; Wu, Y.; Zheng, B.; Zhang, X.; Shen, L. Identifying risk factors of urban-rural conflict in urbanization: A case of China. Habitat Int. 2014, 44, 177–185. [Google Scholar] [CrossRef]
- Sinclair, S.; Baglioni, S. Social Innovation and Social Policy—Promises and Risks. Soc. Policy Soc. 2014, 13, 469–476. [Google Scholar] [CrossRef]
- Li, M.-M.; Han, X.-P. Financing Problems in China’s Rural Areas. J. Northeast Agric. Univ. Engl. Ed. 2014, 21, 80–89. [Google Scholar] [CrossRef]
- Cechin, A.; Da Silva Araújo, V.; Amand, L. Exploring the synergy between Community Supported Agriculture and agroforestry: Institutional innovation from smallholders in a brazilian rural settlement. J. Rural Stud. 2021, 81, 246–258. [Google Scholar] [CrossRef]
- Neumeier, S. Social innovation in rural development: Identifying the key factors of success. Geogr. J. 2017, 183, 34–46. [Google Scholar] [CrossRef]
- Brondizio, E.S.; Ostrom, E.; Young, O.R. Connectivity and the Governance of Multilevel Social-Ecological Systems: The Role of Social Capital. Annu. Rev. Environ. Resour. 2009, 34, 253–278. [Google Scholar] [CrossRef]
- Pyburn, R.; Woodhill, J. Dynamics of Rural Innovation: A Primer for Emerging Professionals; LM Publishers: Amsterdam, The Netherlands, 2015; ISBN 978-9460221590. [Google Scholar]
- Klerkx, L.; Aarts, N.; Leeuwis, C. Adaptive management in agricultural innovation systems: The interactions between innovation networks and their environment. Agric. Syst. 2010, 103, 390–400. [Google Scholar] [CrossRef]
- Moulaert, F.; MacCallum, D.; Hillier, J. Social innovation: Intuition, precept, concept, theory and practice. Int. Handb. Soc. Innov. 2013, 13–24. [Google Scholar] [CrossRef] [Green Version]
- Partanen, J.; Chetty, S.K.; Rajala, A. Innovation types and network relationships. Entrep. Theory Pract. 2014, 38, 1027–1055. [Google Scholar] [CrossRef]
- Provenzano, V.; Arnone, M.; Seminara, M.R. Innovation in the Rural Areas and the Linkage with the Quintuple Helix Model. Procedia—Soc. Behav. Sci. 2016, 223, 442–447. [Google Scholar] [CrossRef] [Green Version]
- Matuschke, I. Evaluating the impact of social networks in rural innovation systems: An overview. Int. food Policy Res. Inst. 2008, 36. Available online: https://books.google.com.hk/books?hl=zh-CN&lr=&id=GQYcwYUQDAQC&oi=fnd&pg=PR5&dq=Matuschke,+I.+Evaluating+the+impact+of+social+networks+in+rural+innovation+systems:+An+overview.+Int.+food+policy+Res.+Inst.+2008,+36.&ots=xroDlixvTX&sig=1Wiw1kM4WrCI501rCenBW10aAas&redir_esc=y#v=onepage&q&f=false (accessed on 6 June 2021).
- Landabaso, M.; Oughton, C. Learning Regions in Europe: Theory, Policy and Practice Through the Ris Experience. In Proceedings of the 3rd International Conference on Technology and Innovation Policy: Global knowledge Partnerships, Creating Value for the 21st Century, Austin, TX, USA, 30 August–2 September 1999. [Google Scholar]
- Tödtling, F.; Trippl, M. One size fits all?: Towards a differentiated regional innovation policy approach. Res. Policy 2005, 34, 1203–1219. [Google Scholar] [CrossRef]
- Moulaert, F.; MacCallum, D.; Mehmood, A.; Hamdouch, A.; Moulaert, F.; MacCallum, D.; Mehmood, A.; Hamdouch, A. General introduction: The return of social innovation as a scientific concept and a social practice. Int. Handb. Soc. Innov. 2013, 1–6. [Google Scholar] [CrossRef]
- Parés, M.; Ospina, S.; Subirats, J. Social Innovation and Democratic Leadership; Edward Elgar Publishing: Cheltenham, UK, 2017; ISBN 9781785367885. [Google Scholar]
- Evers, A.; Ewert, B. Social Innovation for Social Cohesion. In New Frontiers in Social Innovation Research; Palgrave Macmillan: London, UK, 2015; pp. 107–127. ISBN 9781137506801. [Google Scholar]
- Bruckmeier, K. LEADER in Germany and the discourse of autonomous regional development. Sociol. Ruralis 2000, 40, 219–227. [Google Scholar] [CrossRef]
- Knierim, A.; Boenning, K.; Caggiano, M.; Cristóvão, A.; Dirimanova, V.; Koehnen, T.; Labarthe, P.; Prager, K. The AKIS concept and its relevance in selected EU member states. Outlook Agric. 2015, 44, 29–36. [Google Scholar] [CrossRef]
- Dargan, L.; Shucksmith, M. LEADER and innovation. Sociol. Ruralis 2008, 48, 274–291. [Google Scholar] [CrossRef]
- Castellano-Álvarez, F.J.; Nieto Masot, A.; Castro-Serrano, J. Intangibles of Rural Development. The Case Study of La Vera (Extremadura, Spain). Land 2020, 9, 203. [Google Scholar] [CrossRef]
- Lowe, P.; Ray, C.; Ward, N.; Wood, D.; Woodward, R. Participation in Rural Development: A Review of European Experience; University of Newcastle upon Tyne, Centre for Rural Economy: Newcastle upon Tyne, UK, 1997; ISBN 978-1898655442. [Google Scholar]
- Batkovskiy, A.M.; Konovalova, A.V.; Semenova, E.G.; Trofimets, V.Y.; Fomina, A.V. Risks of development and implementation of innovative projects. Mediterr. J. Soc. Sci. 2015, 6, 243–253. [Google Scholar] [CrossRef] [Green Version]
- Castro-Arce, K.; Vanclay, F. Transformative social innovation for sustainable rural development: An analytical framework to assist community-based initiatives. J. Rural Stud. 2020, 74, 45–54. [Google Scholar] [CrossRef]
- Yang, R.J.; Zou, P.X. Stakeholder-associated risks and their interactions in complex green building projects: A social network model. Build. Environ. 2014, 73, 208–222. [Google Scholar] [CrossRef]
- Robichaud, L.B.; Anantatmula, V.S. Greening Project Management Practices for Sustainable Construction. J. Manag. Eng. 2011, 27, 48–57. [Google Scholar] [CrossRef]
- Salvia, R.; Egidi, G.; Vinci, S.; Salvati, L. Desertification risk and rural development in Southern Europe: Permanent assessment and implications for sustainable land management and mitigation policies. Land 2019, 8, 191. [Google Scholar] [CrossRef] [Green Version]
- Prum, D.A.; Percio, S. Del Green Building Claims: What Theories Will A Plaintiff Pursue, Who Has Exposure, And A Proposal For Risk Mitigation. Real Estate Law J. 2009, 37, 243–277. [Google Scholar]
- Shi, Q.; Liu, Y.; Zuo, J.; Pan, N.; Ma, G. On the management of social risks of hydraulic infrastructure projects in China: A case study. Int. J. Proj. Manag. 2015, 33, 483–496. [Google Scholar] [CrossRef]
- Miller, R.; Lessard, D. Understanding and managing risks in large engineering projects. Int. J. Proj. Manag. 2001, 19, 437–443. [Google Scholar] [CrossRef] [Green Version]
- Yang, R.J.; Zou, P.X.W.; Wang, J. Modelling stakeholder-associated risk networks in green building projects. Int. J. Proj. Manag. 2016, 34, 66–81. [Google Scholar] [CrossRef]
- Li, C.Z.; Hong, J.; Xue, F.; Shen, G.Q.; Xu, X.; Mok, M.K. Schedule risks in prefabrication housing production in Hong Kong: A social network analysis. J. Clean. Prod. 2016, 134, 482–494. [Google Scholar] [CrossRef] [Green Version]
- Yu, T.; Shen, G.Q.; Shi, Q.; Lai, X.; Li, C.Z.; Xu, K. Managing social risks at the housing demolition stage of urban redevelopment projects: A stakeholder-oriented study using social network analysis. Int. J. Proj. Manag. 2017, 35, 925–941. [Google Scholar] [CrossRef]
- Mok, K.Y.; Shen, G.Q.; Yang, R.J.; Li, C.Z. Investigating key challenges in major public engineering projects by a network-theory based analysis of stakeholder concerns: A case study. Int. J. Proj. Manag. 2017, 35, 78–94. [Google Scholar] [CrossRef]
- Cooper, D.; Grey, S.; Raymond, G.; Walker, P. Project Risk Management Guidelines Managing Risk in Large Projects and Complex Procurements; John Wiley & Sons, Ltd.: West Sussex, UK, 2005; ISBN 0470022817. [Google Scholar]
- Samsin, I. The Philosophy of Risk Aleksey; Thomas Telford Publishing: London, UK, 2015; ISBN 0727726668. [Google Scholar]
- Rowe, W. An “Anatomy” of Risk; U.S Environmental Protection Agency: Washington, DC, USA, 1975.
- Project Management Institute. A Guide to the Project Management Body of Knowledge, 5th ed.; Project Management Institute, Inc.: Pennsylvania, PA, USA, 2010; ISBN 9780470549179. [Google Scholar]
- Boateng, P.; Chen, Z.; Ogunlana, S.O. An Analytical Network Process model for risks prioritisation in megaprojects. Int. J. Proj. Manag. 2015, 33, 1795–1811. [Google Scholar] [CrossRef]
- Franks, D.M.; Davis, R.; Bebbington, A.J.; Ali, S.H.; Kemp, D.; Scurrah, M. Conflict translates environmental and social risk into business costs. Proc. Natl. Acad. Sci. USA 2014, 111, 7576–7581. [Google Scholar] [CrossRef] [Green Version]
- Zavadskas, E.K.; Turskis, Z.; Tamošaitiene, J. Risk assessment of construction projects. J. Civ. Eng. Manag. 2010, 16, 33–46. [Google Scholar] [CrossRef] [Green Version]
- Elahi, E.; Khalid, Z.; Tauni, M.Z.; Zhang, H.; Lirong, X. Extreme weather events risk to crop-production and the adaptation of innovative management strategies to mitigate the risk: A retrospective survey of rural Punjab, Pakistan. Technovation 2021, 102255. [Google Scholar] [CrossRef]
- Molle, F.; Rap, E.; EzzatAl-Agha, D.; AbouEl Hassan, W.; Freeg, M. Irrigation improvement projects in the Nile Delta: Promises, challenges, surprises. Agric. Water Manag. 2019, 216, 425–435. [Google Scholar] [CrossRef] [Green Version]
- Abreu, I.; Mesias, F.J. The assessment of rural development: Identification of an applicable set of indicators through a Delphi approach. J. Rural Stud. 2020, 80, 578–585. [Google Scholar] [CrossRef]
- Ubels, H.; Haartsen, T.; Bock, B. Social innovation and community-focussed civic initiatives in the context of rural depopulation: For everybody by everybody? Project Ulrum 2034. J. Rural Stud. 2019. [Google Scholar] [CrossRef]
- Futemma, C.; De Castro, F.; Brondizio, E.S. Farmers and Social Innovations in Rural Development: Collaborative Arrangements in Eastern Brazilian Amazon. Land Use Policy 2020, 99, 104999. [Google Scholar] [CrossRef]
- Khaled, R. The challenge of innovative method of culture more sustainable on the social aspect of rural areas: Empirical evidence from Mediterranean countries. Intellect. Econ. 2016, 10, 133–144. [Google Scholar] [CrossRef]
- Esteves, A.M.; Factor, G.; Vanclay, F.; Götzmann, N.; Moreira, S. Adapting social impact assessment to address a project’s human rights impacts and risks. Environ. Impact Assess. Rev. 2017, 67, 73–87. [Google Scholar] [CrossRef]
- European Comission. Empowering People, Driving Change. Social Innovation in the European Union; Publications Office of the European Union: Luxembourg, 2010; ISBN 9789279192753. [Google Scholar]
- Vanclay, F. Project-induced displacement and resettlement: From impoverishment risks to an opportunity for development? Impact Assess. Proj. Apprais. 2017, 35, 3–21. [Google Scholar] [CrossRef] [Green Version]
- Hanna, P.; Vanclay, F.; Langdon, E.J.; Arts, J. Conceptualizing social protest and the significance of protest actions to large projects. Extr. Ind. Soc. 2016, 3, 217–239. [Google Scholar] [CrossRef]
- Vanclay, F. Principles to gain a social licence to operate for green initiatives and biodiversity projects. Curr. Opin. Environ. Sustain. 2017, 29, 48–56. [Google Scholar] [CrossRef]
- Graetz, G.; Franks, D.M. Conceptualising social risk and business risk associated with private sector development projects. J. Risk Res. 2016, 19, 581–601. [Google Scholar] [CrossRef]
- Lukale, A.M. Determinants of Cost Overruns in Rural Roads Infrastructure Projects in Kenya. Ph.D. Thesis, Strathmore University, Nairobi, Kenya, 2018; pp. 1–115. [Google Scholar]
- Ogunsanya, A.A. Rural accessibility problems and human resource development: Case study from Nigeria. J. Rural Stud. 1987, 3, 31–42. [Google Scholar] [CrossRef]
- Ranganathan, T. Risk and risk management in agriculture. Contemp. Issues Sustain. Dev. 2020, 9–29. [Google Scholar] [CrossRef]
- Ludvig, A.; Weiss, G.; Sarkki, S.; Nijnik, M.; Živojinović, I. Mapping European and forest related policies supporting social innovation for rural settings. For. Policy Econ. 2018, 97, 146–152. [Google Scholar] [CrossRef]
- Ling, F.Y.Y.; Hoang, V.T.P. Political, economic, and legal risks faced in international projects: Case study of vietnam. J. Prof. Issues Eng. Educ. Pract. 2010, 136, 156–164. [Google Scholar] [CrossRef]
- Frone, S.; Frone, D.F. Economic Risks to a Regional Water Supply and Sanitation Project in Romania. Procedia Econ. Financ. 2015, 32, 550–557. [Google Scholar] [CrossRef] [Green Version]
- Bebbington, A.; Dharmawan, L.; Fahmi, E.; Guggenheim, S. Local Capacity, Village Governance, and the Political Economy of Rural Development in Indonesia. World Dev. 2006, 34, 1958–1976. [Google Scholar] [CrossRef]
- Komarek, A.M.; De Pinto, A.; Smith, V.H. A review of types of risks in agriculture: What we know and what we need to know. Agric. Syst. 2020, 178, 102738. [Google Scholar] [CrossRef]
- Semchenkova, S.V.; Zarankin, O.M. Agriculural investment opportunities within the region: Risks and development strategies. Int. Agric. J. 2017, 16. [Google Scholar] [CrossRef]
- Melichová, K.; Varecha, L. Endogenous political, institutional, cultural, and geographic determinants of intermunicipal cooperation-evidence from Slovakia. Sustainability 2020, 12, 709. [Google Scholar] [CrossRef] [Green Version]
- Wall, E.; Marzall, K. Adaptive capacity for climate change in Canadian rural communities. Local Environ. 2006, 11, 373–397. [Google Scholar] [CrossRef]
- Fahad, S.; Wang, J. Farmers’ risk perception, vulnerability, and adaptation to climate change in rural Pakistan. Land Use Policy 2018, 79, 301–309. [Google Scholar] [CrossRef]
- Firbank, L.G. Assessing the Ecological Impacts of Bioenergy Projects. BioEnergy Res. 2008, 1, 12–19. [Google Scholar] [CrossRef] [Green Version]
- Aguilar-Gallegos, N.; Martínez-González, E.G.; Aguilar-Ávila, J.; Santoyo-Cortés, H.; Muñoz-Rodríguez, M.; García-Sánchez, E.I. Social network analysis for catalysing agricultural innovation: From direct ties to integration and radiality. Estud. Gerenciales 2016, 32, 197–207. [Google Scholar] [CrossRef] [Green Version]
- Aguilar-Gallegos, N.; Olvera-Martínez, J.A.; Martínez-González, E.G.; Aguilar-Ávila, J.; Muñoz-Rodríguez, M.; Santoyo-Cortés, H. La intervención en red para catalizar la innovación agrícola. REDES. Rev. Hisp. para Análisis Redes Soc. 2017, 28, 9–31. [Google Scholar] [CrossRef] [Green Version]
- Borgatti, S.; Everett, M.; Johnson, J. Analyzing Social Networks; SAGE Publications Ltd.: London, UK, 2013; ISBN 978-1-4462-4740-2. [Google Scholar]
- Aguilar, N.; Martínez-González, E.G.; Aguilar-Ávila, J. Análisis de redes sociales: Conceptos clave y cálculo de indicadores; Universidad Autónoma Chapingo: Chapingo, Mexico, 2017; ISBN 9786071204332. [Google Scholar]
- Chinowsky, P.; Diekmann, J.; Galotti, V. Social network model of construction. J. Constr. Eng. Manag. 2008, 134, 804–812. [Google Scholar] [CrossRef]
- Scott, J.; Wassserman, S. Models and Methods in Social Network Analysis. Model. Methods Soc. Netw. Anal. 2005, 28–30. [Google Scholar] [CrossRef] [Green Version]
- Giuliani, E.; Pietrobelli, C. Social Network Analysis Methodologies for the Evaluation of Cluster Development Programs; Inter-American Development Bank: Washington, DC, USA, 2011. [Google Scholar]
- Yuan, J.; Chen, K.; Li, W.; Ji, C.; Wang, Z.; Skibniewski, M.J. Social network analysis for social risks of construction projects in high-density urban areas in China. J. Clean. Prod. 2018, 198, 940–961. [Google Scholar] [CrossRef]
- Borgatti, S.P.; Cross, R. A relational view of information seeking and learning in social networks. Manage. Sci. 2003, 49, 432–445. [Google Scholar] [CrossRef]
- Freeman, L.C. Centrality in social networks conceptual clarification. Soc. Netw. 1978, 1, 215–239. [Google Scholar] [CrossRef] [Green Version]
- Wasserman, S.; Faust, K. Social Network Analysis; Cambridge University Press: Cambridge, UK, 1994; Volume I, ISBN 9780521387071. [Google Scholar]
- Ministerio de agricultura, pesca y alimentación de E. Encuesta sobre Superficies y Rendimientos Cultivos (ESYRCE). Available online: https://www.mapa.gob.es/es/estadistica/temas/estadisticas-agrarias/agricultura/esyrce/ (accessed on 6 June 2020).
- Gómez-Limón, J.A.; Gómez-Ramos, A. Opinión pública sobre la multifuncionalidad del regadío: El caso de Castilla y León. Econ. Agrar. y Recur. Nat. 2011, 7, 3. [Google Scholar] [CrossRef] [Green Version]
- Amandin, M.M.; Kule, J.W. Project Delays on Cost Overrun Risks: A Study of Gasabo District Construction Projects Kigali, Rwanda. ABC J. Adv. Res. 2016, 5, 21–34. [Google Scholar] [CrossRef]
- Ramli, M.Z.; Malek, M.A.; Hanipah, M.H.; Lin, C.L.; Mahamad Sukri, M.F.; Zawawi, M.H.; Zainal Abidin, M.Z.; Mohamad Fuad, N.F.S. Study of factors influencing construction delays at rural area in Malaysia. J. Phys. Conf. Ser. 2018, 1049. [Google Scholar] [CrossRef]
- Van Der Ploeg, J.D.; Renting, H.; Brunori, G.; Knickel, K.; Mannion, J.; Marsden, T.; De Roest, K.; Sevilla-Guzmán, E.; Ventura, F. Rural development: From practices and policies towards theory. Rural Crit. Essays Hum. Geogr. 2017, 40, 201–218. [Google Scholar] [CrossRef]
- Anderson, J.R. Risk in rural development: Challenges for managers and policy makers. Agric. Syst. 2003, 75, 161–197. [Google Scholar] [CrossRef]
- Furmankiewicz, M.; Macken-walsh, Á.; Stefańska, J. Territorial governance, networks and power: Cross-sectoral partnerships in rural poland. Geogr. Ann. Ser. B, Hum. Geogr. 2014, 96, 345–361. [Google Scholar] [CrossRef]
- Titarenko, B.; Titov, S.; Titarenko, R. Risk management in innovation projects. Appl. Mech. Mater. 2014, 638–640, 2338–2341. [Google Scholar] [CrossRef]
- Esparcia, J. Innovation and networks in rural areas. An analysis from European innovative projects. J. Rural Stud. 2014, 34, 1–14. [Google Scholar] [CrossRef]
- Rathi, A.S.; Khandve, P.V. Study of Factors Influencing Cost Overruns: An Overview. Int. J. Sci. Res. 2016, 5, 334–336. [Google Scholar] [CrossRef]
- Al-Hazim, N.; Salem, Z.A.; Ahmad, H. Delay and Cost Overrun in Infrastructure Projects in Jordan. Procedia Eng. 2017, 182, 18–24. [Google Scholar] [CrossRef]
- Sanjuan, A.G.; Froese, T. The Application of Project Management Standards and Success Factors to the Development of a Project Management Assessment Tool. Procedia—Soc. Behav. Sci. 2013, 74, 91–100. [Google Scholar] [CrossRef] [Green Version]
- Kerzner, H. Project Management: A Systems Approach to Planning, Scheduling, and Controlling, 10th ed.; ASME Press: Little Falls, NJ, USA, 2010; ISBN 9780470278703. [Google Scholar]
- Frank, H. Effective communication for project success. OCLC Syst. Serv. 2014, 30, 74–77. [Google Scholar] [CrossRef]
- Castro-Arce, K.; Vanclay, F. Community-Led Green Land Acquisition: Social Innovative Initiatives for Forest Protection and Regional Development. Land 2020, 9, 109. [Google Scholar] [CrossRef] [Green Version]
Figure 1.
Research process carried out in the case study.

Figure 2.
Functions of the main actors involved in the project. Source: Author elaborator.

Figure 3.
Location of the case study in Spain. Source: Author elaborator.

Figure 4.
Incidence of nodes by risk category.

Figure 5.
Incidence of nodes by actor category.

Figure 6.
Structure of the network of risks associated with actors.

Figure 7.
(a) Graphic representation of the primary nodes by output centrality; (b) graphic representation of the primary nodes by input centrality.
Figure 7.
(a) Graphic representation of the primary nodes by output centrality; (b) graphic representation of the primary nodes by input centrality.

Table 2.
Description of parameters used for the analysis of results.
| Parameter | Description |
|---|---|
| Density of the network | Density is defined as the proportion of ties existing in the social network to all probable ties [75]. The density of the network varies between 0 and 1. The higher the density, the more links there are in the network and the greater the complexity. For the calculation of this parameter the information of the matrix must be dichotomized, converting the valued data into binary data [69]. Cells with a value equal to or greater than one will be assigned a value of 1, while for the remaining cells a value of 0 will be set. |
| Node degree | It is the number of vertices adjacent to a given vertex in a symmetric graph is the degree of that vertex [76]. Two nodes are said to be adjacent when they are directly connected by a link. The degree of nodes is not proportional to the centrality of the node. As for density, this parameter is calculated from a binary matrix. |
| Degree centrality | The number of vertices adjacent to a given vertex in a symmetric graph is the degree of that vertex, that is, the index at which a single node dominates a network. There are input and output centralization indices: the input index refers to the sum of the magnitude of each of the links that a node receives; the output index is the sum of the magnitude of each of the links that a node sends to the other nodes [70]. This indicator exclusively depends on the magnitude of the sum of links associated with each node, so for this case the analysis is performed directly with the valued data given by the actors. |
| Betweenness centrality | It is measured based on the frequency with which a node is located between the (shorter) geodetic paths connecting pairs of other nodes in the network [76]. A node or link with a high value of betweenness centrality has a high level of control over the magnitude that crosses it. Since the magnitude of the sum of the links affecting the nodes varies according to their incidence, it is calculated from the valued data. |
| Closeness centrality | Defines the ability of a node to reach all other members of the network independently [76]. One can measure a node closeness centrality by summing the shortest paths (geodesic) lengths to all other nodes [77]. The higher its value, the closer it is to the other nodes on the network |
Table 3.
Classification of actors by type of risk.
| ID Risk | Risk | Risk Category | Associated Actors |
|---|---|---|---|
| R1 | Pressure from some actors | Social | S6, S7 |
| R2 | Lack of interest | Social | S6, S7 |
| R3 | Language and terminology | Social | S6, S7 |
| R4 | Changes in the project scope | Technical | S1, S3, S11 |
| R5 | Inadequate analysis of the project complexity | Technical | S5, S6, S7 |
| R6 | Inaccurate estimates of the project costs | Technical | S1, S9 |
| R7 | Non-compliance with specified quality standards | Technical | S1, S2, S3, S4, S5, S7, S8, S13 |
| R8 | Change in design and engineering | Technical | S6, S7, S11 |
| R9 | Lack of support from top management | Technical | S1, S2 |
| R10 | Lack of experience in sustainable design and project management | Technical | S6, S7 |
| R11 | Loss of one measure of sustainability to attain another one | Technical | S4 |
| R12 | Unsuitable, untested, or unreliable materials, products, or sustainable systems | Technical | S1, S11 |
| R13 | Uncertainty in the performance of sustainable materials and equipment | Technical | S6, S7 |
| R14 | Project timeout | Time | S1, S2, S3, S4, S7, S9, S13, S14 |
| R15 | Change in government financing policy | Economic | S1 |
| R16 | Tax changes | Economic | S6, S7, S12 |
| R17 | Changes in the price of materials, energy and/or water | Economic | S6, S7, S10, S12 |
| R18 | The sustainability measure costs too much, and, in some cases, the investor would not finance | Economic | S2, S6, S7 |
| R19 | Additional costs and/or lack of access to funds | Economic | S1, S2, S3, S4, S6, S7, S8, S13 |
| R20 | Lack of approval of environmental licenses and permits | Environmental | S12 |
| R21 | Change in government financing policy | Political | S2 |
| R22 | Opposition or lack of political support | Political | S2, S6, S7 |
| R23 | Government discontinuity | Political | S6, S7 |
| R24 | Delay in obtaining consent/approval of permits | Political | S11 |
| R25 | Legislative/regulatory changes | Political | S6, S7, S12, S10 |
| R26 | Land expropriations | Political | S6, S7 |
Table 4.
Classification of risks by type of actor.
| ID Actor | Actor | Actor Category | Associated Risks |
|---|---|---|---|
| S1 | Project coordination | Project developers | R4, R6, R7, R9, R12, R14, R15, R19 |
| S2 | Energy efficiency group | Project developers | R7, R9, R14, R18, R19, R21, R22 |
| S3 | Water efficiency group | Project developers | R4, R7, R14, R19 |
| S4 | Leon field coordinators | Rural coordinators | R7, R11, R14, R19 |
| S5 | Research groups- Universities | Researchers | R5, R7 |
| S6 | Community of irrigators Virgen del Aviso | Irrigation communities | R1, R2, R3, R5, R8, R10, R13, R16, R17, R18, R19, R22, R23, R25, R26 |
| S7 | Community of irrigators Toro-Zamora | Irrigation communities | R1, R2, R3, R5, R7, R8, R10, R13, R14, R16, R17, R18, R19, R22, R23, R25, R26 |
| S8 | State society of agrarian infrastructure | Government | R7, R19 |
| S9 | Energy purchase and sale group | Project developers | R6, R14 |
| S10 | Power Providers | Builders and suppliers | R17, R25 |
| S11 | Builders and suppliers | Builders and suppliers | R4, R8, R12, R24 |
| S12 | Government | Government | R16, R17, R20, R25 |
| S13 | Field technicians | Rural coordinators | R7, R14, R19 |
| S14 | Renewable energy group | Project developers | R14 |
Table 5.
Centrality results by output index.
| Node | Actor Category | Risk Category | Output Index | Node Degree |
|---|---|---|---|---|
| S1R4 | Project developers | Technical | 30 | 6 |
| S6R18 | Irrigation communities | Economic | 29 | 2 |
| S7R18 | Irrigation communities | Economic | 29 | 2 |
| S4R11 | Rural coordinators | Technical | 25 | 1 |
| S9R6 | Project developers | Technical | 25 | 1 |
| S3R4 | Project developers | Technical | 16 | 2 |
| S6R17 | Irrigation communities | Economic | 16 | 3 |
| S6R25 | Irrigation communities | Political | 16 | 2 |
| S7R17 | Irrigation communities | Economic | 16 | 3 |
| S7R25 | Irrigation communities | Political | 16 | 2 |
Table 6.
Centrality results by input index.
| Node | Actor Category | Risk Category | Input Index | Node Degree |
|---|---|---|---|---|
| S3R19 | Project developers | Economic | 107 | 21 |
| S3R14 | Project developers | Time | 73 | 16 |
| S2R7 | Project developers | Technical | 70 | 12 |
| S1R19 | Project developers | Economic | 33 | 2 |
| S1R7 | Project developers | Technical | 25 | 1 |
| S1R14 | Project developers | Time | 16 | 5 |
| S2R14 | Project developers | Time | 14 | 7 |
| S4R7 | Rural coordinators | Technical | 12 | 1 |
| S4R14 | Rural coordinators | Time | 12 | 1 |
| S7R7 | Irrigation communities | Technical | 12 | 2 |
Table 7.
Risks and critical interactions according to betweenness centrality.
| Position | ID Node | Node Betweenness Centrality | ID Link | Link Betweenness Centrality |
|---|---|---|---|---|
| 1 | S3R14 | 15.5 | S3R14–S1R14 | 16.5 |
| 2 | S2R14 | 6.5 | S2R14–S1R14 | 7.5 |
| 3 | S2R19 | 2 | S2R19–S3R19 | 3 |
Publisher’s Note: MDPI stays neutral with regard to jurisdictional claims in published maps and institutional affiliations. |
© 2021 by the authors. Licensee MDPI, Basel, Switzerland. This article is an open access article distributed under the terms and conditions of the Creative Commons Attribution (CC BY) license (https://creativecommons.org/licenses/by/4.0/).
Share and Cite
MDPI and ACS Style
Suárez, D.; Díaz-Puente, J.M.; Bettoni, M. Risks Identification and Management Related to Rural Innovation Projects through Social Networks Analysis: A Case Study in Spain. Land 2021, 10, 613. https://doi.org/10.3390/land10060613
AMA Style
Suárez D, Díaz-Puente JM, Bettoni M. Risks Identification and Management Related to Rural Innovation Projects through Social Networks Analysis: A Case Study in Spain. Land. 2021; 10(6):613. https://doi.org/10.3390/land10060613
Chicago/Turabian StyleSuárez, Diego, José M. Díaz-Puente, and Maddalena Bettoni. 2021. "Risks Identification and Management Related to Rural Innovation Projects through Social Networks Analysis: A Case Study in Spain" Land 10, no. 6: 613. https://doi.org/10.3390/land10060613
Note that from the first issue of 2016, this journal uses article numbers instead of page numbers. See further details here.