
Soil Quality Assessment after 25 Years of Sewage Sludge vs. Mineral Fertilization in a Calcareous Soil


1
Departamento Ciencias, IS-FOOD, Universidad Pública de Navarra, 31006 Pamplona, Spain
2
Departament de Medi Ambient i Ciències del Sòl, ETSEA, Universitat de Lleida, 25198 Lleida, Spain
3
Área de Innovación, Sección de Sistemas Sostenibles, Instituto Navarro de Tecnologías e Infraestructuras Agroalimentarias, 31610 Villava, Spain
*
Author to whom correspondence should be addressed.
Land 2021, 10(7), 727; https://doi.org/10.3390/land10070727
Submission received: 15 June 2021
/
Revised: 5 July 2021
/
Accepted: 8 July 2021
/
Published: 10 July 2021
(This article belongs to the Special Issue Soil Improving Cropping Systems for Sustainable and Profitable Farming in Europe)
Abstract
:The aim of this work was to identify the most sensitive soil quality indicators and assess soil quality after long-term application of sewage sludge (SS) and conventional mineral fertilization for rainfed cereal production in a sub-humid Mediterranean calcareous soil. The treatments included six combinations of SS at different doses (40 t ha−1 and 80 ha−1) and frequencies (every 1, 2 and 4 years), plus a control with mineral fertilization, and a baseline control without fertilization. Twenty-five years after the onset of the experiment, 37 pre-selected physical, chemical and biological soil parameters were measured, and a minimum data set was determined. Among these indicators, those significantly affected by treatment and depth were selected as sensitive. A principal component analysis (PCA) was then performed for each studied depth. At 0–15 cm, PCA identified three factors (F1, F2 and F3), and at 15–30 cm, two factors (F4 and F5) that explained 71.5% and 67.4% of the variation, respectively, in the soil parameters. The most sensitive indicators (those with the highest correlation within each factor) were related to nutrients (P and N), organic matter, and trace metals (F1 and F4), microporosity (F2), earthworm activity (F3), and exchangeable cations (F5). Only F3 correlated significantly (and negatively) with yield. From these results, we concluded that soil quality can be affected in opposite directions by SS application, and that a holistic approach is needed to better assess soil functioning under SS fertilization in this type of agrosystem.
1. Introduction
In the framework of circular economy and the European Green Deal goals, land application of sewage sludge (SS) is suggested as one of the most economical and ecological sludge disposal methods [1,2]. When properly managed, it is seen as way to prevent environmental pollution [3], recycle nutrients, and decrease the need for commercial fertilizers [4,5]. Sewage sludge, in general, has a high content of organic carbon, nutrients (particularly N and P) [6], and trace elements (S, Mg, Ca), and can promote the proliferation and activity of soil micro and mesofauna [2]. As a consequence, amending soils with SS can improve some soil properties, such as organic matter and nutrient content, soil porosity, bulk density, aggregate stability, or available water holding capacity [2,3,7,8,9].
However, SS can also contain trace metals and persistent organic pollutants, which present a harmful risk to the environment and can be transferred to crops [10]. Indeed, larger studies on the effect of different organic amendments on soil quality [11] observed that the overall effect can be positive, although some aspects, such as soil contamination or grain quality, may be compromised, depending on the type of amendment used. In particular, the consequences of SS application on soil chemical properties and the accumulation of contaminants have been extensively studied [5,12,13] and different strategies to minimize the risk associated with SS application have been developed [14].
In this framework, the European Commission implemented the EU Directive 86/278/EEC with regulatory guidelines on SS application and the concentration of toxic elements [15]. Other regulations exist at the national and regional level worldwide. Nonetheless, the consequences of the continuous application of SS on other soil quality indicators, particularly the interaction between indicators and their relation to soil functions, have received less attention [11]. These consequences are dependent not only on the composition and frequency of SS application, but also on the pedoclimatic and agronomic characteristics of each site [2,16,17]. The importance of considering all dimensions and properties of soil (in terms of its physical, chemical, biological, and organic matter properties) is intrinsic to any such study [17,18,19].
In the last decades, the literature on the study of soil quality has grown substantially, with an increasing emphasis on the inclusion of this concept associated with agriculture and other land uses, which should consider the many relationships between soil functions and the ecosystem services they provide [20,21]. Within the diversity of the approaches developed, there is an agreement on the existence of a series of basic steps in the evaluation of soil quality, among which the selection of appropriate indicators stands out for its special relevance [22]. Global reviews of these indicators [22,23,24] point out the most frequently proposed ones as those related to the organic fraction and soil reaction, together with those referring to the status of some nutrients, porosity (density), and water retention.
In any case, the selection of soil quality indicators needs to be made by simultaneously considering the soil functions and/or the services associated with them that are to be evaluated, and the local conditions imposed by the soil-climatic characteristics at the site under consideration. Some examples of the use of this approach in Navarre, Spain [25,26] for the evaluation of soil quality in agrosystems managed according to conservation agriculture criteria showed that the most appropriate indicators can vary in a relatively short lapse of time with a change of context, such as the transformation from rainfed to irrigated. The identification of these indicators, therefore, must also consider the management context.
In the particular context of farmlands in semiarid and sub-humid Mediterranean regions, which are usually depleted in organic matter [27], and therefore especially sensitive to soil degradation, SS addition to croplands has been seen as a promising practice, due to its high content in organic matter and nutrients [28]. Still, physical degradation of the soil may occur depending on the quality of SS, the doses and frequency of application, and the pedo-environmental conditions [29]. An adequate assessment of soil quality in this context needs, therefore, to be holistic (comprise chemical, physical and biological soil indicators of relevance in this type of agroecosystem [30]). In addition, adequate soil quality indicators have ben conceptually defined not only as sensitive to changes in soil condition, but also as precocious in their reaction as possible, easy to measure, and, if possible, available in common soil datasets [17,31]. Ideally, soil quality indicators should also comprise information measured at the field level (in addition to laboratory analysis), and be easily understandable by famers and policy-makers [32].
Regional studies after long-term applications, and with extreme rates of application, seem useful to better understand the actual effect of SS application on soil quality in these conditions [23]. In this context, this study aimed to identify the most sensitive soil quality indicators and, by studying their correlations, to understand the effect of the long-term application of SS on the overall soil quality of a cultivated calcareous soil after 25 years of SS application at different rates and doses by comparing it with conventional mineral fertilization in a controlled experimental field in Mediterranean sub-humid conditions. We hypothesized that the amount and frequency of SS used might induce differences in the chemical, physical and biological condition of this soil that might be interrelated and explained by the selected soil quality indicators.
2. Materials and Methods
2.1. Site and Experimental Design
The long-term experimental field site in Arazuri, Navarra, NE Spain (42°48′ N, 1°43′ W, 396 m a.s.l.) was established in 1992 to assess the effect of the continuous application of SS on agricultural soil quality and productivity. The climate in the area is temperate Mediterranean, with a humid water regime, according to Papadakis [33]. Mean annual precipitation is 750 mm year−1, and mean annual Thornthwaite’s evapotranspiration, 687 mm year−1 [34]. The soil in this field is calcareous (approx. 20% of calcium carbonate in the tilled layer) with a clay-loam texture in the topsoil (31% clay, 30% silt, 39% sand) [35], is well-drained and has no salinity problems. It has been classified as a Calcaric Cambisol [36]. The soil’s main physical–chemical characteristics in the tilled layer (0–30 cm) at the control plots are summarized in Table 1.
The experimental design consists of a random factorial block design with eight treatments with three replicates (n = 3), each plot with an area of 35 m2 (10 m × 3.5 m). The treatments included six combinations of SS at different doses (40 t ha−1 and 80 ha−1) and frequencies (every 1, 2 and 4 years), plus a control with the usual mineral fertilization in the area (46% urea and ammonium sulphate), and a baseline control without SS or mineral fertilization. Sewage sludge treatments were denoted after the dose and frequency (40-1, 40-2, 40-4, 80-1, 80-2, and 80-4). Mineral-fertilized and baseline controls were noted as MF and C, respectively. Both doses and frequency of SS were chosen according to the common practices in the area, and to get the highest possible rates in the plots with high doses and frequencies.
The crops used corresponded to the most frequent rainfed rotation of 3 years in the area (cereal–cereal–no cereal), managed with annual tillage with a 30 cm deep moldboard plow, and application of phytosanitary products according to the crops’ needs each year. The most common cereal crops used were wheat (Triticum aestivum L.) and barley (Hordeum vulgare L.), with sunflower (Helianthus annuus L.) as the non-cereal crop in the rotation. Sewage sludge was produced in the urban wastewater treatment plant from the city of Pamplona (population 330,000), with primary and secondary treatments, stabilized through anaerobic digestion and mechanical dewatering. Sewage sludge characteristics, as described by [10], are summarized in Table 2. The SS was applied each campaign in September, 3 to 4 weeks before sowing, using a 3.5 m wide spreader trailer, followed by moldboard plowing down to 30 cm. Mineral fertilization with a commercial fertilizer purchased from a local provider was carried out before sowing. Wheat sampling was carried out in June in the year of study, at harvest. Each field replicate was harvested with a plot-scale combine, and grain yields were recorded. Grain weights were taken directly from the combine, and grain samples were collected to analyze their water content, to obtain yield data on a dry-mass basis.
2.2. Soil Sampling and Analysis
Soil sampling was carried out 25 years after the onset of the experiment, in September, at each treatment and replicate at two depths (0–15 cm and 15–30 cm) after the crop cycle was completed, and at the furthest moment in time from previous soil alterations, except for samples for the physical properties, which were sampled in June before harvesting to avoid the possible effect of harvesting machinery. Disturbed and undisturbed samples were collected for the various analyses. Disturbed soil samples were collected for the 0–15 cm and 15–30 cm depths using an Edelman-type auger (Ø = 5 cm) or a shovel. Three subsamples were collected per plot for each depth increment and combined to obtain a composite sample. Immediately after sampling, a portion of the composite soil was stored at 4 °C for further biological analyses. Part of the sample was gently pushed through a 6 mm sieve. These aggregates were air dried and used for aggregate stability determinations. The remainder of the soil was air-dried and ground to pass through a 2 mm sieve. Undisturbed core samples were collected in triplicate using bevel-edged steel rings (Ø = 5 cm, total volume = 100 cm3) for the 0–15 cm and 15–30 cm depth increments to determine soil bulk density (ρb), permeability, and water retention characteristics. Undisturbed soil samples were also collected using Kubiena boxes for thin section analysis. For earthworm population assessment, two 20 × 20 × 30 cm soil blocks were extracted from each treatment in all replicates.
2.2.1. Soil Physical Properties
The soil’s physical condition was assessed using properties related to compaction and porosity, aggregation, and water flow and storage. Bulk density and penetration resistance (PR) were measured to assess compaction and porosity. As explained above, the core method was used to determine ρb [37]. Penetration resistance was measured at 9 points per field replicate to a depth of 60 cm using a field penetrometer (Rimik CP20, Agridy Rimik Pty Ltd., Toowoomba, Qld, Australia). Measurements were made after a rainy period to avoid differences in water content between treatments. Measurements were recorded every 15 mm, and PR for 0–15 and 15–30 cm were calculated as weighted depth averages.
Dry aggregate stability was determined by placing 100 g of dry aggregates (<6 mm) in the top of a column of sieves of 4, 2, 1, 0.5, and 0.25 mm openings, and shaking in a rotary movement at 60 strokes/min for 60 s in a Retsch VS 100 device (Retsch GmbH & Co., Haan, Germany). For wet aggregate stability, a constant shower-like flux (6 L/min) of distilled water was applied from the top of the same set of sieves while sieving (60 strokes/min, 60 s). We used a mechanical sample divisor (Retsch GmbH & Co., Haan, Germany) to ensure that the initial distribution of aggregates was similar among replicates. Aggregate size distribution and stability were expressed as the mean weight diameter (MWD) after dry and wet sieving [38]. The stability of the aggregates was also evaluated using the mass proportion of water-stable aggregates (WSA) > 0.25 mm [39]. Soil saturated permeability (Ks) was measured on undisturbed soil cores after saturation with deionized water under a vacuum using a laboratory permeameter (Eijkelkamp Soil & Water, Giesbeek, The Netherlands).
Soil water retention at −33 kPa, −50 kPa, and −90 kPa was determined on intact soil cores, and sieved (<2 mm) soil samples were used for water retention assessment at −1500 kPa. Samples were placed on pressure plate extractors (Soil Moisture Equipment Corp., Santa Barbara, CA, USA). Volumetric water was calculated using ρb. Available water-holding capacity (AWHC) was calculated as the difference between volumetric water content at field capacity (−33 kPa) and wilting point (−1500 kPa). From these data, as described in [40,41], the model proposed by [42] was used to estimate the equivalent pore diameter corresponding to each of the water potentials. According to this model, the equivalent pore diameter was 9 µm for −33 kPa, and 0.2 µm for −1500 kPa. This allowed us to obtain the equivalent size ranges of micropores in each sample, expressed as the proportion of each pore range (<0.2 µm, 0.2–9 µm, and >9 µm), as well as the proportion of pores able to retain water (0.2–9 µm) over those able to store water available for plants (>0.2 µm). These were denoted as PØ < 0.2, PØ 0.2–9, PØ > 9 and PØ 0.2–9 (>0.2), respectively.
Soil thin sections were prepared from undisturbed soil samples as described in [43]. Image analysis was used in these sections to determine parameters related to macroporosity. For this, a scanned image was obtained per thin section under two light conditions: parallel polarizers and crossed polarizers. They were processed using Image J [44] to obtain digital binary images. From each binarized thin section, five random images (10 × 10 mm) were selected using an adaptation of the method used by [45], where a grid of 27 squares (1 cm2 each) was placed in each scanned section from which the eligible squares were chosen using a random number generator. From these, pore-size distribution analysis was carried out based on an open mathematical algorithm: the Quantim4 library [46]. The area occupied by pores was divided into five intervals according to the pore’s apparent diameter: 100–400 µm; 400–1000 µm; 1000–2000 µm; >2000 µm. The proportion of the area (equivalent to volume proportion over total soil volume) occupied by pores with diameters between 400–1000 µm was selected for this study because of their special relevance when describing structure (size of planar voids or fissures), and also because these pores can result from the activity of mesofauna [47].
2.2.2. Soil Chemical Properties
All chemical analyses were performed on air-dried sieved (<2 mm) samples. Total N was analyzed using the Kjeldahl digestion method. Available P was determined as described by [48]. Exchangeable K and Na were quantified using atomic absorbance after extraction with NH4OAc 1N [49]. The soil electrical conductivity (EC) and soil pH were measured in distilled water (1:2.5). Soil pH was determined with a Crison GLP22 pH meter (Crison Instruments, S.A., Barcelona, Spain). Conductivity was read with a Crison GLP32 conductivity meter (Crison Instruments, S.A., Barcelona, Spain).
Carbonate concentration was measured in a modified Bernard’s calcimeter [50] by quantifying the CO2 produced after treating a soil sample with HCl. Available trace metals (Cu, Mn, Ni, Zn, Cd and Pb) at the 0–15 cm depth were analyzed as DTPA(C14H23N3O10)-extractable concentrations from air-dried soil samples, using the extraction procedure described in the international standard ISO 14870:2001 [51], as described in [10]. In short, an extraction solution was prepared by mixing, first, 0.735 g of CaCl22H2O, 0.984 g of DTPA and 7.46 g of triethanolamine (C6H15NO3), diluted with 800 mL of deionized water, and the pH was adjusted to 7.3 with HCl. Subsequently, in a 100 mL wide-mouth polypropylene container, 20 g of soil and 40 mL of the solution were mixed and stirred for 2 h at 20 °C on a reciprocating shaker at 30 rpm. Then, a fraction of the extract was decanted and centrifuged for 10 min at 6000 rpm. The supernatant was filtered with a membrane filter with a pore size of 0.45 μm and collected for analysis. The extracts were analyzed earlier than 48 h from their preparation, by ICP-MS in a 7700x analyzer (Agilent Technologies, Santa Clara, CA, USA), following the UNE-EN 17053 standard [52].
2.2.3. Soil Organic Matter and Biological Properties
Soil organic C (SOC) was determined by wet oxidation on air-dried sieved (<2 mm) samples [53]. The fraction of soil organic matter defined as particulate organic matter (POM) based on its size (>53 μm) [54] was isolated by dispersion and sieving of 10 g of air-dried soil [55]. Organic C in the form of POM (POM-C) was determined by wet oxidation.
Earthworms were collected crumbling the 20 × 20 × 30 cm soil blocks by hand, placing the worms in a glass jar, and weighing to obtain a fresh weight for each field replicate [56]. This allowed us to determine the total biomass (g per m−2), the abundance (number of individuals per m−2), and the average size (g per individual).
Microbial biomass carbon (MBC) was measured by comparing extractable C from non-fumigated and chloroform (CHCl3)-fumigated soil [57]. Carbon concentration in the extract (chromic acid dissolution) was analyzed by sulfuric digestion and subsequent spectrophotometry. The functional diversity of the soil microbial population was studied through the analysis of the community-level physiological profiles (CCPLs) in fresh samples by studying the C source utilization patterns observed using a Biolog EcoplatesTM microplating system (Biolog, Hayward, CA, USA), as described in [58]. EcoplatesTM were designed for determining CLPPs of terrestrial communities and comprise 31 C substrates that are major ecologically relevant compounds. One g equivalent dry weight of soil was mixed with 9 mL of autoclaved Mili-Q ultra-pure water and shaken in an orbital shaker at 125 rev min−1 for 1 h. After shaking, samples were left to settle and then a 1:100 dilution was inoculated onto Biolog Ecoplates™. The plates were incubated at 30 °C and color development was read twice a day at 595 nm using a microplate reader (Thermo Scientific Multiskan® EX Waltham, Massachusetts, USA). Average well color development (AWCD) was determined by calculating the mean of every well’s absorbance value at each reading time. The number of substrates used by the soil microbial community (NSU), equivalent to species richness [59], was quantified as the number of wells showing corrected absorbance values >0.25 at the onset of the exponential microbial growth in the Biolog EcoplateTM microplates (59 h).
2.3. Statistical Analysis
The selection of the most sensitive soil quality indicators, and the assessment of the effect of SS application on soil quality, was conducted in a two-step procedure, as in [26,60]. First, a multivariate analysis of variance (MANOVA) was performed to test whether there was a significant effect of the categorical independent variables (fertilization and depth) on at least one of the physical, chemical, or biological variables studied. For this study, the eight fertilization treatments (SS application, MF and C) were considered as a factor, because, despite some treatments receiving equivalent cumulative amounts of added SS, for some soil properties, the effect of SS or mineral fertilization might be different depending on the frequency, whereas some others might be affected by the accumulation of SS applications with time.
Then, a univariate analysis of variance (ANOVA) for the different soil variables was performed to examine for significant influences of fertilization treatment and depth. Only the variables for which the F statistic for SS application or fertilization treatments was significant (p < 0.05) were retained for further analysis. In a second step, factor analysis was used to group the retained variables into statistical factors based on their correlation structure. Principal component analysis (PCA) was used as the method for factor extraction. To eliminate the effect of different units of variables, factor analysis was performed using the correlation matrix on the standardized values of the measured soil properties; each variable had mean = 0 and variance = 1 (total variance = number of variables [61]). We used the determinant of the correlation matrix as an indicator to identify the existence of correlations among variables. As in Imaz et al. (2010) [25] and Apesteguía et al. (2017) [26], using the correlation matrix, principal components (factors) with eigenvalues > 1.5 were retained and subjected to varimax rotation with Kaiser to estimate the proportion of the variance of each attribute explained by each selected factor (loadings), and by all factors (communalities). A high communality for a soil attribute indicates that a high proportion of its variance is explained by the factors. In contrast, a low communality for a soil attribute indicates that much of that attribute’s variance remains unexplained. Less importance should be ascribed to soil attributes with low communalities when interpreting the factors [62].
To evaluate the effects of the studied SS application or mineral fertilization treatments on the extracted factors, factor scores for each sample point were calculated and ANOVA was performed on the new score variables. Homogeneous groups among treatments were detected using Duncan’s test (p < 0.05, unless otherwise indicated). Only factors that differed among treatments were retained for further consideration. Soil attributes were then assigned to the factor for which their loading was the highest [61]. For each retained factor, highly weighted attributes were selected as possible soil quality indicators. We considered as highly weighted those within 10% of the highest factor loading, as in [63].
Finally, a correlation analysis was conducted for wheat yields against the scores of the extracted factors with PCA. For all analysis, the significance level was set at p < 0.05 unless otherwise indicated. All statistical treatments were performed using IBM SPSS Statistics 27.0 [64].
3. Results
3.1. Identification of Indicators
The different treatments and sampling depth significantly affected the physical, chemical, and biological properties evaluated. The analysis of variance for each individual parameter studied showed some significant differences for the different treatments and depths, and for some parameters, a significant interaction of both (Table 3). As the goal of this study was to identify the most sensitive soil quality indicators and to assess overall soil quality from PCA, and not to assess each individual parameter, only the significance of the analysis is provided for each parameter. As depth had a significant effect in some of the parameters studied, the factor analysis performed to select soil quality indicators was performed separately for the two sampling depths. Soil parameters that were not significantly affected by treatment per studied depth were not considered for the following analysis.
At the 0–15 cm depth, these were Ks, water retention at −33 kPa and −90 kPa, AWHC, PØ < 0.2, PØ 400–1000 in equivalent diameter, carbonates, available Mn, available Pb, the POM-C/SOC ratio, MBC, diversity indexes (AWCD and NSU), and earthworm abundance (individuals m−2). At the 15–30 cm, among those studied at that depth, the parameters excluded for PCA were all physical parameters, except for PØ < 0.2, the POM-C/SOC ratio, and the microbial functional diversity indexes (AWCD and NSU).
3.1.1. 0–15 cm Depth
The correlation matrix for the 21 selected indicators (determinant < 0.0001) showed several significant correlations on 101 pairs out of 210 (Table S1). The highest positive and significant correlations were found between available P vs. available Zn, available Cu, and available Ni (p < 0.001), and also between SOC vs. available Zn and available Ni (p < 0.001).
The PCA identified three factors (F1, F2 and F3) with eigenvalues > 1.5 for the 0–15 cm depth, which together explained 70.2% of the variance of the 21 selected indicators (Table 4).
The soil properties with high loadings for these factors were considered potential good soil quality indicators (Table 5). F1 showed high loadings (within 10% of the one with the highest loading, or close) for available P, EC, available Zn, available Cu, available Ni, available Cd, available Pb, and SOC. F1 can therefore be associated to organic matter and chemical parameters. F2 showed high loadings for water retention at −50, the total proportion of pores 0.2–0.9 μm (PØ 0.2–0.9), and the proportion of pores 0.2–0.9 μm over total pores > 0.2 μm (PØ 0.2–9(>0.2)). F2 can therefore be associated with water retention in the soil. Finally, F3 grouped earthworms’ biomass (g m−2) and earthworm average size (g i−1) as the properties with the highest loading. F3 would represent the behavior of earthworm populations as affected by treatments in this field.
3.1.2. 15–30 cm Depth
Using the nine selected indicators for this depth, a correlation matrix was developed for the 15–30 cm depth (determinant < 0.0001), which showed significant correlations on 17 pairs out of 36 (Table S2). The most significant correlations (p < 0.001) were observed between available P vs. SOC and POM-C, EC vs. SOC and POM-C, and finally SOC vs. POM-C.
The PCA extracted two factors (F4 and F5) with eigenvalues > 1.5, explaining 68.5% of the variance between indicators at this depth (Table 4). For F4, the highest loadings corresponded to EC, available P, and SOC. Like F1 at 0–15 cm, F4 can be associated to organic matter and chemical parameters. Regarding F5, exchangeable K and Na were the properties with the highest loadings. F5 would therefore represent exchangeable cations (Table 6).
3.2. Sensitivity of PCA Factors to Treatment
All factor scores were sensitive to treatments (Table 7). The scores for F1 were significantly different in C and MF than in all treatments with different doses of SS. The scores for F2 differed significantly in C, MF, 40-4, 80-1, and 80-2 from 40-1, 40-2, and 80-4. The scores for F3 were significantly different in C than in MF, 80-2, and 40-2, with the rest of treatments showing intermediate values.
Factor scores for both F4 and F5 were sensitive to treatment (Table 7). For F4, scores were significantly different for C and MF than for all treatments receiving SS. Among them, 80-1 had the highest load, and all other treatments with SS displayed intermediate values. Finally, F5 scores were different for 40-1 than for 80-2, 80-4, and MF, with the other treatments showing intermediate values.
3.3. Yield
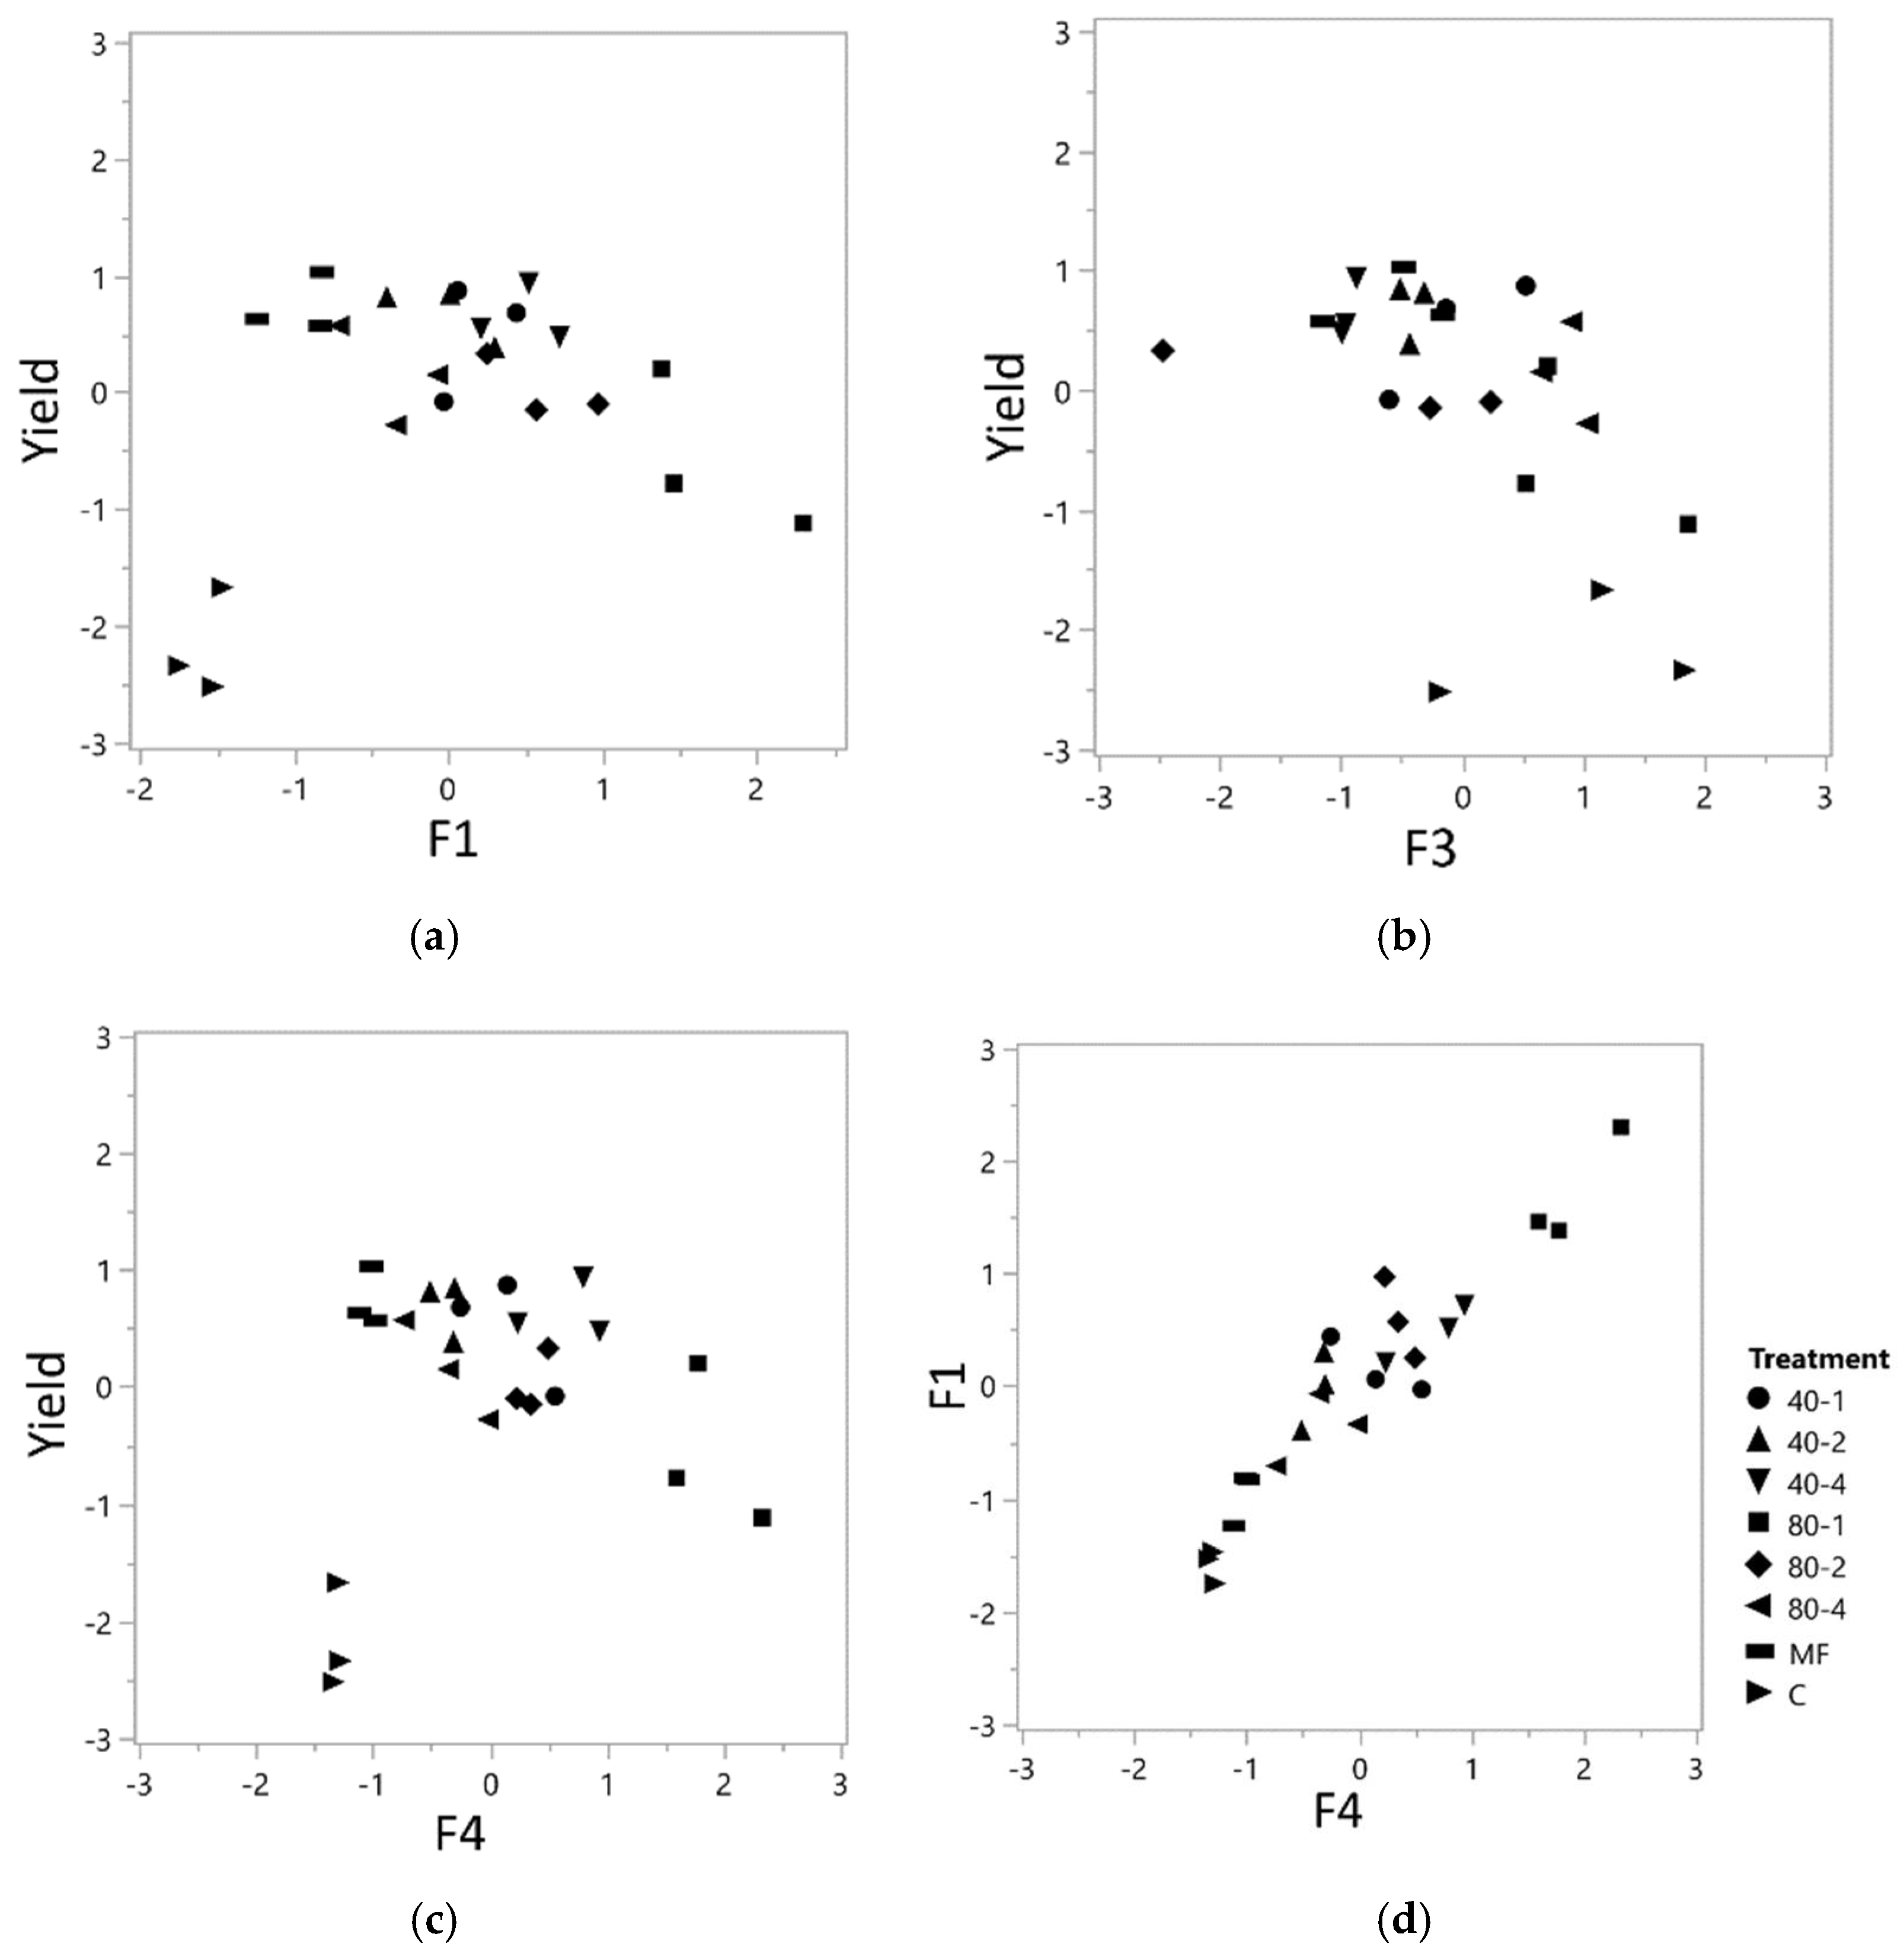
Average wheat yield was statistically different among treatments (p < 0.001, Table 8). MF treatment had the highest values, followed by 40-1, 40-2 and 40-4. The treatment with the highest rate of sludge, 80-1, showed the lowest yield apart from the baseline control treatment (C), for which yield was less than half compared with the MF and 40-1 treatments. No significant correlations were observed for the factor scores and yield, except for F3 (Pearson’s correlation coefficient = −0.638, p < 0.05).
The interaction between yield and F1, F3, and F4 scores, as well as the interaction between F1 and F4 grouped by treatment are represented through scatter plot graphics in Figure 1.
4. Discussion
4.1. Selection of Soil Quality Indicators
4.1.1. Sensitivity to Management
The results of the preliminary ANOVA (Table 3) indicated that some of the pre-selected soil properties were indeed sensitive to SS application and fertilization management in the experimental field used in this study. This response was also different for the two studied depths. At 015 cm, most of the physical and chemical indicators originally considered were shown to be sensitive to treatments, as well as organic matter indicators and earthworms, whereas indicators related to the soil microbial community seemed to be less sensitive. The sensitivity of those preselected was, however, lower in the 15–30 cm depth, despite all treatments receiving annual inversion tillage at 0–30 cm, which suggests a depth stratification in the response to treatments. The relevance of the stratification of the response of soil properties to management [39] and the relatively low sensitivity of SOC stratification have been largely discussed [65,66].
Regarding the selection of the most sensitive indicators, at 0–15 cm, sensitive indicators included water retention at −50, microporosity (PØ > 0.2–9, PØ > 9 and PØ > 0.2–9(>0.2)), PR, aggregate stability (WSA, MWDd, MWDw), available P, total N, EC, pH, extractable Na, available trace metals except for Mn and Pb, SOC, POM-C, earthworms’ biomass, and average size. At 15–30 cm, they were PØ < 0.2, available P, total N, EC, pH, exchangeable Na, and K, SOC, POM-C, and MBC. The most sensitive indicators in the physical indicator group were therefore those related to water retention, microporosity, or aggregate stability. These soil properties are well known to be sensitive to changes in soil when SS or other organic amendments are used [3,67], as they represent the changes induced in soil structure as a response to increased inputs of organic matter [68].
On the contrary, non-sensitive indicators included ρb, Ks, AWHC, and PØ 400–1000. This can be explained, at least partially, by the fact that all treatments receive the same mechanical management, comprising annual moldboard tillage, seedbed conditioning, and seeding, as well as mechanical harvesting. In terms of ρb and Ks, the effect of these operations can counteract that of the addition of organic matter with SS, or from crop residues. Other studies have also shown that ρb can be less sensitive to changes in the soil’s physical condition associated to changes in organic matter than other physical indicators, such as those related to aggregate stability. For instance, [69] found no differences in ρb between a conventional tillage treatment and long-term no-tillage inducing gains in SOC on a silt loam soil, while differences were found among tillage treatments concerning WSA and MWD.
These results can also be understood as some changes in the soil’s physical condition being more noticeable than total porosity or AWHC. In this sense, there is evidence that some soil pore-size ranges can be more affected by changes in SOC gains than others. Indeed, Kirchmann et al. (2002) [70] reported microporosity (1–5 μm) as more sensitive to management than macropores in an Inceptisol amended with different exogenous organic matter, which they related to changes in SOC concentration. This coincides with our observation of a greater sensitivity of micro porosity indicators, especially in the 0–15 cm depth, than PØ 400–1000 in size, which may indicate that this porosity interval is more related to management (planar voids, fissures due to tillage), equal to all treatments, than to the activity of mesofauna.
Among chemical indicators, those related to nutrients (N and P), EC, and pH, as well as trace metals, proved to be the most sensitive ones at 0–15 cm. The response of these indicators to SS addition and/or mineral fertilization was expected, and has been reported in many previous studies on the use of SS in agriculture [12,71,72]. In particular, the accumulation of trace metals with SS addition has been already reported and studied in this soil [10,73]. Changes in pH and EC have also been systematically reported in soils amended with SS, in contrast with MF or non-amended soils [12,74,75] and related to the content in soluble salts in SS (Table 1).
Carbonate content was included in the original collection of indicators because it has been observed that the repeated addition of SS and other sources of organic matter can result in changes in the amount and typology of soil carbonates [76,77]. The content in carbonates of the studied soil (Table 1) seems, however, elevated enough not to be sensitive to these changes, although the observed sensitivity of pH (Table 3) suggests that some changes could be expected in the future if the repeated addition of SS results in some sort of acidification in this soil. In fact, changes in pH after SS application can occur due to proton release due to nitrification process, as observed by Tamir et al. (2013) [78] and Huang & Chen (2009) [79] after application of animal manure or sewage sludge compost, respectively, which causes CaCO3 dissolution. For instance, Eid et al. (2021) [80] have recently reported a significant decrease in soil pH (from 8.5 to 7.7) in a short-term pot experiment when the soil was incubated with SS at doses > 30 g kg−1 soil.
At 15–30 cm (no data on trace metals were available), exchangeable K and Na were also observed to be sensitive. A positive correlation was found between Ex Na and pH (Table S2). Other studies confirm this correlation [9,81] between exchangeable cations and pH, related to the increase in the amount of exchangeable cations, Na and K in this case, resulting from the leaching process, contributing to the pH acidification. As in most of the studies conducted on SS application [8,12,82], SOC and POM-C were seen to be highly sensitive to treatments at both depths [83]. In our study, however, an important observation was that while both SOC and POM-C revealed to be sensitive to the treatment, the proportion of POM-C over SOC was not. This suggests that the differences in SOC and POM-C between treatments would correspond to the amount of both, and not to differences in the quality of organic matter, or at least, to the proportion of labile C. Other studies using SS have also observed that the long-term addition of SS results in changes mostly in the stock of SOC, rather than in differences in its composition [84], which they attributed to crop residues being the most relevant source of SOC compared to SS.
Finally, in relation to biological indicators, several studies have reported changes in the soil microbial biomass or diversity with SS application [75,85,86], since the microbial community is triggered by the increase of labile C [87], which was indeed sensitive to treatments in our experimental field (Table 3). However, other studies, such as Urra et al. (2019) [73], conducted in the same experimental field, or Picariello et al. (2020) [88] in an incubation experiment, did not find a significant response of soil microbial biomass to the treatments studied, as was the case in our study at 0–15 cm. This might be due to the changes observed within soil chemical parameters. For instance, Lloret et al. (2016) [89] showed that changes in EC can hinder microbial activity in a calcareous soil. Similar to our results, Roig et al. (2012) [7] found no correlation between basal respiration, a known indicator of soil biological activity, and the use of SS in the same experimental field 10 years before our collection of samples. In this sense, it has been reported that the soil microbial community can be more sensitive to tillage practices than to soil organic matter management [90,91]. Earthworm indicators were, however, clearly sensitive to treatments in our study. Their response to soil and organic management has been widely studied, and reported in the sub-humid and semi-arid areas of the region [55,92,93]. In contrast, at the 15–30 cm depth, MBC was found to be significantly sensitive to treatments (Table 3). This suggests some stratification of microbial biomass, as observed for other indicators such as ρb and PR, also showing significant differences with depth. As stated above, microbial biomass can respond better to tillage and changes in the soil physical–chemical condition than to changes in organic matter, as can be seen by the lack of significant correlations between MBC and the organic matter parameters at this depth (Table S2). In fact, as in the study by [89], significant correlations were found between MBC, EC, and pH at this depth (Table S2).
In summary, those indicators showing the highest sensitivity to management included some of the originally selected ones, but not all. Among those with the highest sensitivity, physical, chemical, biological, and organic-matter related indicators were included, which supports the idea of a holistic approach being needed to understand changes in soil when SS is tested as an agricultural amendment.
4.1.2. Grouping and Selection of Indicators
The most significant correlations were observed for P and SOC with trace metal availability at 0–15 cm, and for P and EC with SOC in the 15–30 cm depth. These correlations suggest that the addition of SS, which overall implied the addition of different accumulated doses of organic compounds, also implied an enrichment in P, trace metals, and, very likely, soluble compounds. Zoghlami et al. (2020) [12] reported a concomitant change in SOC, P, and exchangeable Na with higher doses of SS application. A correlation between organic matter accumulation and an increase in EC has been also observed in similar studies [12,75]. These observations again put in evidence the relevance of paying attention to all consequences of the addition of SS when assessing their effects in soil, as well as the interaction among soil properties. The correlations observed at both depths were reflected in the results of the PCA. At the depth of 0–15 cm, the selected indicators had different loadings in the three factors retained (F1, F2 and F3), so that F1 received high loadings from organic matter and chemical parameters, while F2 was mostly associated to water retention, and F3 to earthworm populations (Table 5). These results suggest that that the responses of soil water retention and earthworms were not directly correlated to that observed for organic matter, P, and trace metals. This can be explained by different means.
First, although the soil’s physical condition and porosity are known to interact with soil organic matter in most soils, the observed discrimination of water retention indicators (F2) from those related to SOC and nutrients (F1) can be related to the particular mineral composition of this soil, which contained 16% carbonates in the studied depth (Table 1). Carbonates are known to interfere with the soil physical stability [94], and can be a factor of stabilization of soil structure in calcareous soils, making it less dependent on SOC than in other soil types [95,96]. In addition, the observed correlation between SOC and EC at both depths and exchangeable Na (at 15–30 cm) suggests that those treatments displaying SOC gains would also result in an increase in soluble salts, which are a known factor of soil structure destabilization [68]. Second, the lack of correlation between earthworm indicators (F3) and those related to SOC and nutrients (F1) and water retention (F2) indicated that their presence and abundance did not directly respond in this soil to the amount of organic C stored in each treatment, nor to physical indicators related to water retention. This suggests that their activity in the studied soil would be dependent on other factors such as toxicity or compaction.
In this framework, following the criterion for selecting the soil attributes with the highest sum of correlation coefficients (Table 5) as the most appropriate soil quality indicators [25,63], our results showed that SOC, available P and trace metals, microporosity and water retention at low water potential (−50 kPa), and earthworms would be those selected at the 0–15 cm depth. Available P would also be selected at 15–30 cm, together with SOC and EC, and exchangeable monovalent cations (Na and K). It must be noted that EC was also a secondary driving factor at 0–15 cm for F1. The relevance of SOC as an indicator of changes in soil resulting from exogenous organic inputs is logical and has been demonstrated in many cases [3,12,84,97]. Indeed, in a recent study conducted at a regional level, the addition of exogenous C has been proven to be the most efficient strategy to increase SOC stocks in the region of study [98]. SOC is also known to correlate well with other fertility indicators, such as the cation exchange capacity, in soils where clay mineralogy is rather stable, like the one used in this study. The linear relation between applying SS to the soil and the enhance of P, trace metals, and soluble salts, as stated above, is also well documented [12,81,99]. The calcareous nature of this soil can explain, at least partially, the accumulation of both P and trace metals [100], resulting in these indicators displaying a high correlation with the addition of SS. Their value as indicators for this type of soils seems relevant, as both are related to environmental risks. At the same time, the selection of earthworms as the most sensitive biological indicator supports their increasingly recognized role as universal soil biological indicators [22,101,102].
Finally, it can be noted in relation to the selection of indicators that, although the pre-selection of indicators was performed based on expertise, the approach used in this study was statistical. This approach has been seen to sometimes result in unexpected or contradictory selection of indicators [11]. Nevertheless, in our study, the most sensitive indicators were in harmony with most soil quality assessments [22], and seemed adequate if the aim of soil quality studies is to provide practical information, with low cost analysis and with influence on the ecosystem services provided by the soil in the particular conditions of calcareous soils under SS application.
4.2. Soil Quality Assessment
A soil quality assessment can be performed based on the scores of the factors selected, and on the link between these factors and the soil functions under study, and the ecosystem services provided by these functions [19,22]. In this case, the goal being to test the effect of SS and MF on an agricultural soil, the main function to be assessed would be biomass production (yield).
Our results showed that amending the studied soil with SS can result in similar yields as with mineral fertilizers, as reported by Jaber et al. (2005) [103] and Obriot et al. (2016) [11] on the use of municipal solid waste (MSW). When compared to the control, yields were high and like MF in the SS treatments with intermediate doses (40-1; 40-2; 40-4; 80-2; 80-4), but the treatment with the highest dose (80-1) implied a decrease in yield (Table 7). The same was previously documented by Mantovi et al. (2005) [72], who reported lower yields on the highest doses on a on a winter wheat–maize–sugar beet rotation fertilized, due to excess of N and wheat lodging. Differently, Cherif et al. (2009) [104] observed that a high dose of municipal solid waste compost (80 t ha−1) enhanced wheat yield by 239%.
In relation to the relationship between factors issued from PCA and yield, for F1, PCA discriminated the treatments with intermediate doses (40-1; 40-2; 40-4; 80-2; 80-4) from treatment 80-1 with the highest accumulated SS dose (Table 7). In addition, both MF and C were differentiated from the SS treatments for this factor. In the 15–30 cm depth analysis, F4, which, as F1, was associated with nutrient dynamics, trace metals, and organic matter, also displayed a clear discrimination of MF and C from the treatments receiving SS, and treatment 80-1 from the other treatments with SS (Table 8). A significant correlation was indeed found between F1 and F4 (Figure 1), indicating that the effects of the treatments tested in this group of soil properties were similar in the two studied depths. This suggests that the continuous application of SS as an organic amendment to the agricultural soil of this study had a different impact on the soil chemical indicators and organic matter than mineral fertilization, or even no fertilization, and that, within those treatments with SS, the dose would also have different effects in this sense.
However, although F1 and F4 correlated with nutrient dynamics, organic matter, and trace metals, no significant correlation was found between these factors and yield. This can be explained because the few indicators selected by our analysis of F1 and F4 (available P, total N, EC, trace metals, and SOC) are known to have implications on yield, which act in opposite directions [105]. Indeed, as can be seen in Figure 1a, the only treatment not following a correlation between F1 scores and yields was the one without any type of fertilization (treatment C). Among the other treatments, the correlation was negative, suggesting that the increasing use of SS (cumulative dose) would result in an overall negative effect on the scores in F1 and F4 [72]. From another point of view, and concerning trace metals, their high loadings in F1 indicate that the assessment of their bioavailability can be of use to assess changes in soil (which may affect yield) in the conditions of the study. The studies [10,73] have recently explained the link between SS application and trace metal accumulation in the soil and crops of this experimental field.
In relation to soil physical indicators, under the site environmental conditions, F2 appeared as a relevant factor to assess soil functions related to structure and water storage. However, the scores of F2 did not show a clear trend among treatments or different fertilization management practices and were not either correlated to yield. Still, the high loadings for microporosity and water storage parameters suggest that they might be of relevance when assessing soil quality in the field under study.
Finally, on the biological condition of this soil, factor F3 (obtaining the highest loadings from earthworm indicators) was the only factor that significantly correlated with yield. The analysis of this factor separated the C treatment from those fertilized (MF and all treatments with some amount of SS), supporting its potential as an indicator for changes induced in the soil by mineral or organic fertilization. The correlation with yield was negative, suggesting that the changes induced by mineral and organic fertilization in this soil, which would result in increased yield, might be detrimental for earthworm populations. Indeed, reports on the effect this type of fertilization has on the earthworm population are contradictory [106]. A better understanding on the relationship between earthworms and soil management in calcareous soils like the one studied here is needed. In the region, it has been observed that earthworms can be positively affected by the reduction of tillage, and the concomitant gains in SOC in long-term trials [55,92,107]. Our results suggest that, when conventional tillage is used, fertilization may become a major driver of earthworm abundance in this type of soil.
Overall, the soil quality assessment on a crop field with 25 years of SS application revealed several implications regarding this type of fertilization. Sewage sludge had a direct effect on nutrient and organic matter input, as well as on trace metals. Yield results indicated that the soil amended with SS was capable of accomplish similar yields as with MF.
5. Conclusions
The goal of this study was to identify the most sensitive soil indicators to assess changes in soil quality after long-term application of SS and MF on a cultivated calcareous soil, and to understand these changes in a controlled experimental field in Mediterranean sub-humid conditions.
A selection of physical, chemical, and biological indicators, as conducted using PCA in this study, was possible, resulting in SOC, available P, total N, EC, trace metals, and earthworms as the most sensitive indicators of changes in the calcareous soil of study. These showed up, therefore, as the most reliable indicators in the long-term monitoring of the effect of SS application in the conditions of the study. These indicators have been frequently identified in other studies on the response of agricultural soils to management and are, in general, commonly reported and easy to monitor.
The study also showed that the overall response of soil quality to the managements tested (SS application and MF) was not linear or straightforward. As hypothesized, the amount and frequency of SS used induced differences in the soil’s chemical, physical, and biological condition. However, the overall effect of SS application was more evident on organic matter, nutrients, and trace metals than on the soil’s physical condition or earthworms. However, physical indicators and earthworms were highly sensitive to management, and therefore seem useful for assessing changes in soil, not necessarily related to yield. Indeed, the response of the factors issuing from PCA to the treatments tested, and their correlation with yield (which was not always positive or significant) showed that soil quality can be affected in opposite directions by the type of fertilization (mineral vs. organic), or even by the use or not of fertilizers. This supports the idea that a holistic approach, including soil chemical, physical, and biological indicators, is needed to assess soil functioning in this type of agrosystems, while using yield as the only indicator of soil performance may lead to incomplete diagnosis.
Supplementary Materials
The following are available online at https://www.mdpi.com/article/10.3390/land10070727/s1. Table S1: Correlation among measured soil attributes considered for FA in the 0–15 cm depth across all management treatments.; Table S2: Correlation among measured soil attributes considered for FA in the 15–30 cm depth across all management treatments. Earthworm total biomass (EW g m−2), abundance (EW I m−2), and average size (EW g i−1).
Author Contributions
Conceptualization, A.S.-M., R.M.P., A.E., L.O. and I.V.; methodology, A.S.-M., R.M.P., A.E., L.O. and I.V.; Validation, A.S.-M., R.M.P. and I.V.; formal analysis, A.S.-M., R.M.P. and I.V.; investigation, A.S.-M., R.M.P. and I.V.; resources, A.S.-M., R.M.P., A.E., L.O. and I.V. data curation, A.S.-M., R.M.P. and I.V.; writing—original draft preparation, A.S.-M., R.M.P. and I.V.; writing—review and editing, A.S.-M., R.M.P., A.E. and I.V.; project administration L.O.; funding acquisition, I.V. and L.O. All authors have read and agreed to the published version of the manuscript.
Funding
This project has received funding from the National Institute for Agricultural and Food Research and Technology (INIA) through the RTA2017-00088-C03-01 project and from the European Union’s H2020 research and innovation programme under Marie Sklodowska-Curie grant agreement No. 801586.
Institutional Review Board Statement
Ethical review and approval were waived for this study, as no humans or animals were used in the study.
Informed Consent Statement
Not applicable.
Data Availability Statement
The data presented in this study are available on request from the corresponding author. The data are not publicly available due to their belonging to a multi stake- holder project.
Acknowledgments
We are grateful for the services and disposition of the Commonwealth of Pamplona, which contributed the experimental plot and the sludge from the Arazuri treatment plant. We also thank C. Gonzaléz from the Soil Science Laboratory of the Public University of Navarra, and A. Zaragüeta and R. Antón for their assistance in sampling and some analysis.
Conflicts of Interest
The authors declare no conflict of interest.
References
- Metcalf, E. Wastewater Engineering—Treatment, Disposal and Reuse, 3rd ed.; McGraw Hill: New York, NY, USA, 2003. [Google Scholar]
- Singh, R.P.; Agrawal, M. Potential benefits and risks of land application of sewage sludge. Waste Manag. 2008, 28, 347–358. [Google Scholar] [CrossRef]
- Annabi, M.; Le Bissonnais, Y.; Le Villio-Poitrenaud, M.; Houot, S. Improvement of soil aggregate stability by repeated applications of organic amendments to a cultivated silty loam soil. Agric. Ecosyst. Environ. 2011, 144, 382–389. [Google Scholar] [CrossRef]
- Sommers, L.E. Chemical composition of sewage sludges and analysis of their potential use as fertilizers. J. Environ. Qual. 1977, 225–232. [Google Scholar] [CrossRef]
- Siebielec, G.; Siebielec, S.; Lipski, D. Long-term impact of sewage sludge, digestate and mineral fertilizers on plant yield and soil biological activity. J. Clean. Prod. 2018, 187, 372–379. [Google Scholar] [CrossRef]
- Fytili, D.; Zabaniotou, A. Utilization of sewage sludge in EU application of old and new methods-A review. Renew. Sustain. Energy Rev. 2008, 12, 116–140. [Google Scholar] [CrossRef]
- Roig, N.; Sierra, J.; Martí, E.; Nadal, M.; Schuhmacher, M.; Domingo, J.L. Long-term amendment of Spanish soils with sewage sludge: Effects on soil functioning. Agric. Ecosyst. Environ. 2012, 158, 41–48. [Google Scholar] [CrossRef]
- Soria, R.; Ortega, R.; Bastida, F.; Miralles, I. Role of organic amendment application on soil quality, functionality and greenhouse emission in a limestone quarry from semiarid ecosystems. Appl. Soil Ecol. 2021, 164, 103925. [Google Scholar] [CrossRef]
- Skowrońska, M.; Bielińska, E.J.; Szymański, K.; Futa, B.; Antonkiewicz, J.; Kołodziej, B. An integrated assessment of the long-term impact of municipal sewage sludge on the chemical and biological properties of soil. Catena 2020, 189, 104484. [Google Scholar] [CrossRef]
- Zaragüeta, A.; Enrique, A.; Virto, I.; Antón, R.; Urmeneta, H.; Orcaray, L. Effect of the long-term application of sewage sludge to a calcareous soil on its total and bioavailable content in trace elements, and their transfer to the crop. Minerals 2021, 11, 356. [Google Scholar] [CrossRef]
- Obriot, F.; Stauffer, M.; Goubard, Y.; Cheviron, N.; Peres, G.; Eden, M.; Revallier, A.; Vieublé-Gonod, L.; Houot, S. Multi-criteria indices to evaluate the effects of repeated organic amendment applications on soil and crop quality. Agric. Ecosyst. Environ. 2016, 232, 165–178. [Google Scholar] [CrossRef]
- Zoghlami, R.I.; Hamdi, H.; Mokni-Tlili, S.; Hechmi, S.; Khelil, M.N.; Ben Aissa, N.; Moussa, M.; Bousnina, H.; Benzarti, S.; Jedidi, N. Monitoring the variation of soil quality with sewage sludge application rates in absence of rhizosphere effect. Int. Soil Water Conserv. Res. 2020, 8, 245–252. [Google Scholar] [CrossRef]
- Abreu-Junior, C.H.; de Lima Brossi, M.J.; Monteiro, R.T.; Cardoso, P.H.S.; da Silva Mandu, T.; Nogueira, T.A.R.; Ganga, A.; Filzmoser, P.; de Oliveira, F.C.; Firme, L.P.; et al. Effects of sewage sludge application on unfertile tropical soils evaluated by multiple approaches: A field experiment in a commercial Eucalyptus plantation. Sci. Total Environ. 2019, 655, 1457–1467. [Google Scholar] [CrossRef] [PubMed]
- Collivignarelli, M.C.; Abbà, A.; Frattarola, A.; Miino, M.C.; Padovani, S.; Katsoyiannis, I.; Torretta, V. Legislation for the reuse of biosolids on agricultural land in Europe: Overview. Sustainability 2019, 11, 6015. [Google Scholar] [CrossRef] [Green Version]
- Directive Council. European Comission Council Directive of 1 2 June 1986 on the Protection of the Environment, and in Particular of the Soil, when Sewage Sludge is Used in Agriculture. Off. J. Eur. Communities 1986, 181, 6–12. [Google Scholar]
- Guo, Z.; Zhang, Z.; Zhou, H.; Wang, D.; Peng, X. The effect of 34-year continuous fertilization on the SOC physical fractions and its chemical composition in a Vertisol. Sci. Rep. 2019, 9, 1–10. [Google Scholar] [CrossRef] [PubMed] [Green Version]
- Doran, J.W.; Parkin, T.B. Defining and Assessing Soil Quality. In Defining Soil Quality for a Sustainable Environment; Soil Science Society of America, Inc.: Madison, WI, USA, 1994. [Google Scholar]
- Andrews, S.S.; Karlen, D.L.; Cambardella, C.A. The Soil Management Assessment Framework. Soil Sci. Soc. Am. J. 2004, 68, 1945–1962. [Google Scholar] [CrossRef]
- Adhikari, K.; Hartemink, A.E. Linking soils to ecosystem services—A global review. Geoderma 2016, 262, 101–111. [Google Scholar] [CrossRef]
- Dominati, E.; Patterson, M.; Mackay, A. A framework for classifying and quantifying the natural capital and ecosystem services of soils. Ecol. Econ. 2010, 69, 1858–1868. [Google Scholar] [CrossRef]
- Drobnik, T.; Greiner, L.; Keller, A.; Grêt-Regamey, A. Soil quality indicators—From soil functions to ecosystem services. Ecol. Indic. 2018, 94, 151–169. [Google Scholar] [CrossRef]
- Bünemann, E.K.; Bongiorno, G.; Bai, Z.; Creamer, R.E.; de Deyn, G.; de Goede, R.; Fleskens, L.; Geissen, V.; Kuyper, T.W.; Mäder, P.; et al. Soil quality—A critical review. Soil Biol. Biochem. 2018, 120, 105–125. [Google Scholar] [CrossRef]
- Bai, Z.; Caspari, T.; Gonzalez, M.R.; Batjes, N.H.; Mäder, P.; Bünemann, E.K.; de Goede, R.; Brussaard, L.; Xu, M.; Ferreira, C.S.S.; et al. Effects of agricultural management practices on soil quality: A review of long-term experiments for Europe and China. Agric. Ecosyst. Environ. 2018, 265, 1–7. [Google Scholar] [CrossRef]
- Karlen, D.L.; Obrycki, J.F. Measuring rotation and manure effects in an iowa farm soil health assessment. Agron. J. 2019, 111, 63–73. [Google Scholar] [CrossRef] [Green Version]
- Imaz, M.J.; Virto, I.; Bescansa, P.; Enrique, A.; Fernandez-Ugalde, O.; Karlen, D.L. Soil quality indicator response to tillage and residue management on semi-arid Mediterranean cropland. Soil Tillage Res. 2010, 107, 17–25. [Google Scholar] [CrossRef]
- Apesteguía, M.; Virto, I.; Orcaray, L.; Bescans, P.; Enrique, A.; Imaz, M.J.; Karlen, D.L. Tillage effects on soil quality after three years of irrigation in Northern Spain. Sustainability 2017, 9, 1476. [Google Scholar] [CrossRef] [Green Version]
- Lesschen, J.P.; Stoorvogel, J.J.; Smaling, E.M.A.; Heuvelink, G.B.M.; Veldkamp, A. A spatially explicit methodology to quantify soil nutrient balances and their uncertainties at the national level. Nutr. Cycl. Agroecosystems 2007, 78, 111–131. [Google Scholar] [CrossRef] [Green Version]
- Marschner, P.; Kandeler, E.; Marschner, B. Structure and function of the soil microbial community in a long-term fertilizer experiment. Soil Biol. Biochem. 2003, 35, 453–461. [Google Scholar] [CrossRef]
- Hamdi, H.; Benzarti, S.; Manusadžianas, L.; Aoyama, I.; Jedidi, N. Solid-phase bioassays and soil microbial activities to evaluate PAH-spiked soil ecotoxicity after a long-term bioremediation process simulating landfarming. Chemosphere 2007, 70, 135–143. [Google Scholar] [CrossRef]
- Salomé, C.; Coll, P.; Lardo, E.; Metay, A.; Villenave, C.; Marsden, C.; Blanchart, E.; Hinsinger, P.; Le Cadre, E. The soil quality concept as a framework to assess management practices in vulnerable agroecosystems: A case study in Mediterranean vineyards. Ecol. Indic. 2016, 61, 456–465. [Google Scholar] [CrossRef]
- Andrews, S.S.; Carroll, C.R. Designing a Soil Quality Assessment Tool for Sustainable. Ecol. Soc. Am. 2001, 11, 1573–1585. [Google Scholar]
- Karlen, D.L.; Ditzler, C.A.; Andrews, S.S. Soil quality: Why and how? Geoderma 2003, 114, 145–156. [Google Scholar] [CrossRef]
- Papadakis, J. Climatic Tables for the World. Soil Sci. 1961, 93, 76. [Google Scholar] [CrossRef]
- Gobierno de Navarra Meteorología y Climatología de Navarra. Available online: http://meteo.navarra.es/ (accessed on 25 May 2021).
- Gee, G.W.; Bauder, J.W. Particle-size Analysis. In Methods of Soil Analysis: Part 1 Physical and Mineralogical Methods, 5.1, 2nd ed.; Klute, A., Ed.; American Society of Agronomy, Inc.: Madison, WI, USA; Soil Science Society of America, Inc.: Madison, WI, USA, 1986. [Google Scholar]
- FAO. International Soil Classification System for Naming Soils and Creating Legends for Soil Maps; FAO: Rome, Italy, 2014. [Google Scholar]
- Carter, M.R. Soil Sampling and Methods of Analysis; Lewis Publishers: Boca Raton, FL, USA, 1993. [Google Scholar]
- Bosch-Serra, D.; Yagüe, M.R.; Poch, R.M.; Molner, M.; Junyent, B.; Boixadera, J. Aggregate strength in calcareous soil fertilized with pig slurries. Eur. J. Soil Sci. 2017, 68, 449–461. [Google Scholar] [CrossRef] [Green Version]
- Franzluebbers, A.J. Water infiltration and soil structure related to organic matter and its stratification with depth. Soil Tillage Res. 2002, 66, 197–205. [Google Scholar] [CrossRef]
- Bescansa, P.; Imaz, M.J.; Virto, I.; Enrique, A.; Hoogmoed, W.B. Soil water retention as affected by tillage and residue management in semiarid Spain. Soil Tillage Res. 2006, 87, 19–27. [Google Scholar] [CrossRef]
- Fernández-Ugalde, O.; Virto, I.; Bescansa, P.; Imaz, M.J.; Enrique, A.; Karlen, D.L. No-tillage improvement of soil physical quality in calcareous, degradation-prone, semiarid soils. Soil Tillage Res. 2009, 106, 29–35. [Google Scholar] [CrossRef]
- Rose, C.W. Agricultural Physics; Pergamon: New York, NY, USA, 1966. [Google Scholar]
- Benyarku, C.A.; Stoops, G. Guidelines for Preparation of Rock and Soil Thin Sections and Polished Sections; Departament de Medi Ambient i Ciències del Soòl, Universitat de Lleida: Lleida, Spain, 2005. [Google Scholar]
- Rasband, W. ImageJ, 1.40; Toronto Western Research Institute: Toronto, ON, Canada, 2015. [Google Scholar]
- Virto, I.; Fernández-Ugalde, O.; Barré, P.; Imaz, M.J.; Enrique, A.; Bescansa, P.; Poch, R.M. Análise micromorfológica da influencia da composição mineral do solo na agregação a curto prazo em solos semiáridos de clima mediterrânico. Spanish J. Soil Sci. 2013, 3, 116–129. [Google Scholar] [CrossRef]
- Vogel, H.J. Quantim4 C/C++ Library for Scientific Image Processing. Available online: https://www.ufz.eu/index.php?en=39198 (accessed on 25 May 2021).
- FAO. State of Knowledge of Soil Biodiversity–Status, Challenges and Potentialities; FAO: Rome, Italy, 2020; ISBN 9789251335826. [Google Scholar]
- Olsen, S.R.; Sommers, L.E. Phosphorus. In Methods of Soil Analysis. Part 2; American Society of Agronomy: Madison, WI, USA, 1982; pp. 403–430. [Google Scholar]
- Knudsen, D.; Peterson, G.A.; Pratt, P.F. Lithium, sodium, potassium. In Methods of Soil Analysis; Page, A.L., Miller, R.H., Keeney, D.R., Eds.; Soil Science Society of America: Madison, WI, USA, 1982; pp. 225–246. [Google Scholar]
- Sherrod, L.A.; Dunn, G.; Peterson, G.A.; Kolberg, R.L. Inorganic Carbon Analysis by Modified Pressure-Calcimeter Method. Soil Sci. Soc. Am. J. 2002, 66, 299–305. [Google Scholar] [CrossRef]
- ISO. Soil Quality—Extraction ofTrace Elements by Buffered DTPA Solution; ISO: Geneva, Switzerland, 2001. [Google Scholar]
- AENOR. Alimentos para Animales. Métodos de Muestreo y Análisis. Determinación de Elementos Traza, Metales Pesados y Otros Elementos en los Alimentos Para Animales por ICP-MS (UNE-EN 17053); AENOR: Madrid, Spain, 2008. [Google Scholar]
- Nelson, D.W.; Sommers, L.E. Total carbon, organic carbon and organic matter. In Methods of Soil Analysis; Page, A.L., Miller, R.H., Keeney, D.R., Eds.; Soil Science Society of America and Agronomy Society of America: Madison, WI, USA, 1982; pp. 539–579. [Google Scholar]
- Cambardella, C.A.; Elliott, E.T. Particulate Soil Organic-Matter Changes across a Grassland Cultivation Sequence. Soil Sci. Soc. Am. J. 1992, 56, 777–783. [Google Scholar] [CrossRef]
- Virto, I.; Imaz, M.J.; Enrique, A.; Hoogmoed, W.; Bescansa, P. Burning crop residues under no-till in semi-arid land, Northern Spain—Effects on soil organic matter, aggregation, and earthworm populations. Aust. J. Soil Res. 2007, 45, 414–421. [Google Scholar] [CrossRef]
- Baker, G.H.; Lee, K.E. Earthworms. In Soil Sampling and Methods of Analysis; Carter, M.R., Ed.; Canadian Society of Soil Science and Lewis Publishers: Boca Raton, FL, USA, 1993; pp. 359–371. [Google Scholar]
- Vance, E.D.; Brookes, P.C.; Jenkinson, D.S. An extraction method for measuring soil microbial biomass C. Soil Eiol. Biochem. 1987, 19, 703–707. [Google Scholar] [CrossRef]
- Mijangos, I.; Becerril, J.M.; Albizu, I.; Epelde, L.; Garbisu, C. Effects of glyphosate on rhizosphere soil microbial communities under two different plant compositions by cultivation-dependent and -independent methodologies. Soil Biol. Biochem. 2009, 41, 505–513. [Google Scholar] [CrossRef]
- Zak, J.C.; Willig, M.R.; Moorhead, D.L.; Wildman, H.G. Functional diversity of microbial communities: A quantitative approach. Soil Biol. Biochem. 1994, 26, 1101–1108. [Google Scholar] [CrossRef]
- Govaerts, B.; Sayre, K.D.; Deckers, J. A minimum data set for soil quality assessment of wheat and maize cropping in the highlands of Mexico. Soil Tillage Res. 2006, 87, 163–174. [Google Scholar] [CrossRef]
- Shukla, M.K.; Lal, R.; Ebinger, M. Determining soil quality indicators by factor analysis. Soil Tillage Res. 2006, 87, 194–204. [Google Scholar] [CrossRef]
- Brejda, J.J.; Karlen, D.L.; Smith, J.L.; Allan, D.L. Identification of Regional Soil Quality Factors and Indicators. Soil Sci. Soc. Am. J. 2000, 64, 2125. [Google Scholar] [CrossRef] [Green Version]
- Andrews, S.S.; Karlen, D.L.; Mitchell, J.P. A comparison of soil quality indexing methods for vegetable production systems in Northern California. Agric. Ecosyst. Environ. 2002, 90, 25–45. [Google Scholar] [CrossRef]
- SPSS Inc. Statistical Software, SPSS 27.0.; SPSS: Chicago, IL, USA, 2021. [Google Scholar]
- Stockfisch, N.; Forstreuter, T.; Ehlers, W. Ploughing effects on soil organic matter after twenty years of conservation tillage in Lower Saxony, Germany. Soil Tillage Res. 1999, 52, 91–101. [Google Scholar] [CrossRef]
- Dimassi, B.; Cohan, J.P.; Labreuche, J.; Mary, B. Changes in soil carbon and nitrogen following tillage conversion in a long-term experiment in Northern France. Agric. Ecosyst. Environ. 2013, 169, 12–20. [Google Scholar] [CrossRef]
- Zuo, W.; Gu, C.; Zhang, W.; Xu, K.; Wang, Y.; Bai, Y.; Shan, Y.; Dai, Q. Sewage sludge amendment improved soil properties and sweet sorghum yield and quality in a newly reclaimed mudflat land. Sci. Total Environ. 2019, 654, 541–549. [Google Scholar] [CrossRef]
- Rabot, E.; Wiesmeier, M.; Schlüter, S.; Vogel, H.J. Soil structure as an indicator of soil functions: A review. Geoderma 2018, 314, 122–137. [Google Scholar] [CrossRef]
- Sekaran, U.; Sagar, K.L.; Kumar, S. Soil aggregates, aggregate-associated carbon and nitrogen, and water retention as influenced by short and long-term no-till systems. Soil Tillage Res. 2021, 208, 104885. [Google Scholar] [CrossRef]
- Kirchmann, H.; Gerzabek, M.H. Pore size changes in a long-term field experiment with organic amendments. Dev. Soil Sci. 2002, 28, 419–423. [Google Scholar] [CrossRef]
- Alvarenga, P.; Farto, M.; Mourinha, C.; Palma, P. Beneficial Use of Dewatered and Composted Sewage Sludge as Soil Amendments: Behaviour of Metals in Soils and Their Uptake by Plants. Waste Biomass Valorization 2016, 7, 1189–1201. [Google Scholar] [CrossRef]
- Mantovi, P.; Baldoni, G.; Toderi, G. Reuse of liquid, dewatered, and composted sewage sludge on agricultural land: Effects of long-term application on soil and crop. Water Res. 2005, 39, 289–296. [Google Scholar] [CrossRef] [PubMed]
- Urra, J.; Alkorta, I.; Mijangos, I.; Epelde, L.; Garbisu, C. Application of sewage sludge to agricultural soil increases the abundance of antibiotic resistance genes without altering the composition of prokaryotic communities. Sci. Total Environ. 2019, 647, 1410–1420. [Google Scholar] [CrossRef]
- Paz-Ferreiro, J.; Gascó, G.; Gutiérrez, B.; Méndez, A. Soil biochemical activities and the geometric mean of enzyme activities after application of sewage sludge and sewage sludge biochar to soil. Biol. Fertil. Soils 2012, 48, 511–517. [Google Scholar] [CrossRef]
- Vafa, H.J.; Raiesi, F.; Hosseinpur, A. Sewage sludge application strongly modifies earthworm impact on microbial and biochemical attributes in a semi-arid calcareous soil from Iran. Appl. Soil Ecol. 2016, 100, 45–56. [Google Scholar] [CrossRef]
- Sainju, U.M.; Caesar-TonThat, T.; Lenssen, A.W.; Evans, R.G.; Kolberg, R. Long-Term Tillage and Cropping Sequence Effects on Dryland Residue and Soil Carbon Fractions. Soil Sci. Soc. Am. J. 2007, 71, 1730–1739. [Google Scholar] [CrossRef]
- Bughio, M.A.; Wang, P.; Meng, F.; Qing, C.; Kuzyakov, Y.; Wang, X.; Junejo, S.A. Neoformation of pedogenic carbonates by irrigation and fertilization and their contribution to carbon sequestration in soil. Geoderma 2016, 262, 12–19. [Google Scholar] [CrossRef]
- Tamir, G.; Shenker, M.; Heller, H.; Bloom, P.R.; Fine, P.; Bar-Tal, A. Organic N mineralization and transformations in soils treated with animal waste in relation to carbonate dissolution and precipitation. Geoderma 2013, 209–210, 50–56. [Google Scholar] [CrossRef]
- Huang, C.; Chen, Z.-S. Carbon and nitrogen mineralization of sewage sludge compost in soils with a different initial pH. Soil Sci. Plant Nutr. 2009, 55, 715–724. [Google Scholar] [CrossRef]
- Eid, E.M.; Shaltout, K.H.; Alamri, S.A.M.; Alrumman, S.A.; Hussain, A.A.; Sewelam, N.; Ragab, G.A. Monitored Sewage Sludge Application Improves Soil Quality, Enhances Plant Growth, and Provides Evidence for Metal Remediation by Sorghum bicolor L. J. Soil Sci. Plant Nutr. 2021. [Google Scholar] [CrossRef]
- Hamdi, H.; Hechmi, S.; Khelil, M.N.; Zoghlami, I.R.; Benzarti, S.; Mokni-Tlili, S.; Hassen, A.; Jedidi, N. Repetitive land application of urban sewage sludge: Effect of amendment rates and soil texture on fertility and degradation parameters. Catena 2019, 172, 11–20. [Google Scholar] [CrossRef]
- Soriano-Disla, J.M.; Navarro-Pedreño, J.; Gómez, I. Contribution of a sewage sludge application to the short-term carbon sequestration across a wide range of agricultural soils. Environ. Earth Sci. 2010, 61, 1613–1619. [Google Scholar] [CrossRef]
- Lorenz, K.; Lal, R.; Ehlers, K. Soil organic carbon stock as an indicator for monitoring land and soil degradation in relation to United Nations’ Sustainable Development Goals. L. Degrad. Dev. 2019, 30, 824–838. [Google Scholar] [CrossRef]
- Paetsch, L.; Mueller, C.W.; Rumpel, C.; Houot, S.; Kögel-Knabner, I. Urban waste composts enhance OC and N stocks after long-term amendment but do not alter organic matter composition. Agric. Ecosyst. Environ. 2016, 223, 211–222. [Google Scholar] [CrossRef]
- Antolín, M.C.; Pascual, I.; García, C.; Polo, A.; Sánchez-Díaz, M. Growth, yield and solute content of barley in soils treated with sewage sludge under semiarid Mediterranean conditions. F. Crop. Res. 2005, 94, 224–237. [Google Scholar] [CrossRef]
- Xue, D.; Huang, X. The impact of sewage sludge compost on tree peony growth and soil microbiological, and biochemical properties. Chemosphere 2013, 93, 583–589. [Google Scholar] [CrossRef]
- Odlare, M.; Arthurson, V.; Pell, M.; Svensson, K.; Nehrenheim, E.; Abubaker, J. Land application of organic waste—Effects on the soil ecosystem. Appl. Energy 2011, 88, 2210–2218. [Google Scholar] [CrossRef]
- Picariello, E.; Pucci, L.; Carotenuto, M.; Libralato, G.; Lofrano, G.; Baldantoni, D. Compost and sewage sludge for the improvement of soil chemical and biological quality of mediterranean agroecosystems. Sustainability 2021, 13, 26. [Google Scholar] [CrossRef]
- Lloret, E.; Pascual, J.A.; Brodie, E.L.; Bouskill, N.J.; Insam, H.; Juárez, M.F.D.; Goberna, M. Sewage sludge addition modifies soil microbial communities and plant performance depending on the sludge stabilization process. Appl. Soil Ecol. 2016, 101, 37–46. [Google Scholar] [CrossRef] [Green Version]
- Carter, M.R. The influence of tillage on the proportion of organic carbon and nitrogen in the microbial biomass of medium-textured soils in a humid climate. Biol. Fertil. Soils 1991, 11, 135–139. [Google Scholar] [CrossRef]
- Kabiri, V.; Raiesi, F.; Ghazavi, M.A. Tillage effects on soil microbial biomass, SOM mineralization and enzyme activity in a semi-arid Calcixerepts. Agric. Ecosyst. Environ. 2016, 232, 73–84. [Google Scholar] [CrossRef]
- Bescansa, P.; Virto, I.; Fernández-Ugalde, O.; Imaz, M.J.; Enrique, A. Casting Activity of Scherotheca gigas in No-Till Mediterranean Soils: Role in Organic Matter Incorporation and Influence of Aridity. Appl. Environ. Soil Sci. 2010, 2010, 1–6. [Google Scholar] [CrossRef] [Green Version]
- Valdez, A.S.A.S.; Bosch-Serra, À.D.À.D.; Yagüe, M.R.; Poch, R.M.R.M.; Puigpinós, E. Earthworm community and soil microstructure changes with long-term organic fertilization. Arch. Agron. Soil Sci. 2020, 66, 957–970. [Google Scholar] [CrossRef]
- Rasmussen, C.; Heckman, K.; Wieder, W.R.; Keiluweit, M.; Lawrence, C.R.; Berhe, A.A.; Blankinship, J.C.; Crow, S.E.; Druhan, J.L.; Hicks Pries, C.E.; et al. Beyond clay: Towards an improved set of variables for predicting soil organic matter content. Biogeochemistry 2018, 137, 297–306. [Google Scholar] [CrossRef]
- Fernández-Ugalde, O.; Virto, I.; Barré, P.; Gartzia-Bengoetxea, N.; Enrique, A.; Imaz, M.J.; Bescansa, P. Effect of carbonates on the hierarchical model of aggregation in calcareous semi-arid Mediterranean soils. Geoderma 2011, 164, 203–214. [Google Scholar] [CrossRef]
- Rowley, M.C.; Grand, S.; Verrecchia, É.P. Calcium-mediated stabilisation of soil organic carbon. Biogeochemistry 2018, 137, 27–49. [Google Scholar] [CrossRef] [Green Version]
- Domingo-Olivé, F.; Bosch-Serra, À.D.; Yagüe, M.R.; Poch, R.M.; Boixadera, J. Long term application of dairy cattle manure and pig slurry to winter cereals improves soil quality. Nutr. Cycl. Agroecosyst. 2016, 104, 39–51. [Google Scholar] [CrossRef] [Green Version]
- Antón, R.; Arricibita, F.J.; Ruiz-Sagaseta, A.; Enrique, A.; De Soto, I.; Orcaray, L.; Zaragüeta, A.; Virto, I. Soil organic carbon monitoring to assess agricultural climate change adaptation practices in Navarre, Spain. Reg. Environ. Chang. 2021, 21, 1–15. [Google Scholar] [CrossRef]
- Nicolás, C.; Kennedy, J.N.; Hernández, T.; García, C.; Six, J. Soil aggregation in a semiarid soil amended with composted and non-composted sewage sludge-A field experiment. Geoderma 2014, 219, 24–31. [Google Scholar] [CrossRef]
- Jordán, M.M.; Almendro-Candel, M.B.; Navarro-Pedreño, J.; Pardo, F.; García-Sánchez, E.; Bech, J. Bioavailability, mobility and leaching of phosphorus in a Mediterranean agricultural soil (ne Spain) amended with different doses of biosolids. Environ. Geochem. Health 2020, 3. [Google Scholar] [CrossRef] [PubMed]
- Phillips, H.R.P.; Guerra, C.A.; Bartz, M.L.C.; Briones, M.J.I.; Brown, G.; Crowther, T.W.; Ferlian, O.; Gongalsky, K.B.; van den Hoogen, J.; Krebs, J.; et al. Global distribution of earthworm diversity. Science 2019, 366, 480–485. [Google Scholar] [CrossRef] [Green Version]
- Van Groenigen, J.W.; Lubbers, I.M.; Vos, H.M.J.; Brown, G.G.; de Deyn, G.B.; van Groenigen, K.J. Earthworms increase plant production: A meta-analysis. Sci. Rep. 2014, 4, 1–7. [Google Scholar] [CrossRef] [PubMed] [Green Version]
- Jaber, F.H.; Shukla, S.; Stoffella, P.J.; Obreza, T.A.; Hanlon, E.A. Impact of organic amendments on groundwater nitrogen concentrations for sandy and calcareous soils. Compost Sci. Util. 2005, 13, 194–202. [Google Scholar] [CrossRef]
- Cherif, H.; Ayari, F.; Ouzari, H.; Marzorati, M.; Brusetti, L.; Jedidi, N.; Hassen, A.; Daffonchio, D. Effects of municipal solid waste compost, farmyard manure and chemical fertilizers on wheat growth, soil composition and soil bacterial characteristics under Tunisian arid climate. Eur. J. Soil Biol. 2009, 45, 138–145. [Google Scholar] [CrossRef]
- Rorat, A.; Kacprzak, M.; Vandenbulcke, F.; Plytycz, B. Soil amendment with municipal sewage sludge affects the immune system of earthworms Dendrobaena veneta. Appl. Soil Ecol. 2013, 64, 237–244. [Google Scholar] [CrossRef]
- Barrera, I.; Andrés, P.; Alcañiz, J.M. Sewage sludge application on soil: Effects on two earthworm species. Water. Air Soil Pollut. 2001, 129, 319–332. [Google Scholar] [CrossRef]
- Postma-Blaauw, M.B.; de Goede, R.G.M.; Bloem, J.; Faber, J.H.; Brussaard, L. Soil biota community structure and abundance under agricultural intensification and extensification. Ecology 2010, 91, 460–473. [Google Scholar] [CrossRef]
Figure 1.
Relationship between soil quality assessment factors selected through PCA and yield. Treatments (n = 3). (a) Yield × F1; (b) yield × F3; (c) yield × F4; (d) F1 × F4.
Figure 1.
Relationship between soil quality assessment factors selected through PCA and yield. Treatments (n = 3). (a) Yield × F1; (b) yield × F3; (c) yield × F4; (d) F1 × F4.


Table 1.
Physical and chemical properties of the soil tilled layer (0–30 cm) for the control plots. Values are given as the mean ± standard deviation (n = 3).
Table 1.
Physical and chemical properties of the soil tilled layer (0–30 cm) for the control plots. Values are given as the mean ± standard deviation (n = 3).
| Soil Physical and Chemical Properties | |
|---|---|
| pH (water 1:2:5) | 8.67 ± 0.03 |
| Electrical Conductivity (µs cm−3 at 25 °C) (soil:water extract 1:2.5) | 169 ± 10 |
| Bulk density (g cm−3) | 1.59 ± 0.08 |
| Carbonates (%) | 16.0 ± 2.1 |
| Clay (%) | 27.72 ± 1.03 |
| Organic Carbon (%) (Walkley–Black) | 1.35 ± 0.02 |
Table 2.
Physical and chemical properties of the sewage sludge. Values are given as the mean ± standard deviation (n = 3).
Table 2.
Physical and chemical properties of the sewage sludge. Values are given as the mean ± standard deviation (n = 3).
| Sewage Sludge Physical and Chemical Properties | |
|---|---|
| pH | 8.16 ± 0.03 |
| Electric Conductivity (µs cm−3) | 1795 ± 28 |
| Dry material (%) | 18.1 ± 0.4 |
| Volatile matter (% of dry substance) | 62.8 ± 1.9 |
| C/N | 5.35 ± 0.08 |
| Total N (%) | 5.85 ± 0.13 |
| Ammonium-N (%) | 0.75 ± 0.02 |
| Phosphorus (P2O5) (%) | 5.59 ± 0.22 |
| Potassium (K2O) (%) | 0.62 ± 0.05 |
| Iron (Fe) (%) | 1.68 ± 0.04 |
| Calcium (CaO) (%) | 7.98 ± 0.29 |
Table 3.
Results of the analysis of variance (ANOVA) for all soil properties.
| Soil Quality Indicators | Depths Studied | R2 | Treatment (T) | Depth (D) | T × D |
|---|---|---|---|---|---|
| Physical | ANOVA (p-value) | ||||
| Bulk density | 2 | 0.517 | 0.058 | 0.001 | 0.709 |
| PR | 2 | 0.948 | 0.144 | 0.000 | 0.992 |
| Ks | 2 | 0.310 | 0.543 | 0.150 | 0.538 |
| Water −33 | 2 | 0.376 | 0.124 | 0.815 | 0.479 |
| Water −50 | 2 | 0.730 | 0.000 | 0.001 | 0.000 |
| Water −90 | 2 | 0.261 | 0.741 | 0.163 | 0.660 |
| AWHC | 2 | 0.338 | 0.230 | 0.317 | 0.622 |
| PØ < 0.2 | 2 | 0.613 | 0.018 | 0.000 | 0.397 |
| PØ > 0.2–9 | 2 | 0.335 | 0.444 | 0.682 | 0.297 |
| PØ > 9 | 2 | 0.687 | 0.010 | 0.000 | 0.029 |
| PØ 0.2–9(>0.2) | 2 | 0.429 | 0.407 | 0.015 | 0.235 |
| PØ 400–1000 | 1 | 0.223 | 0.704 | NA | NA |
| MWD dry | 1 | 0.708 | 0.002 | NA | NA |
| MWD wet | 1 | 0.567 | 0.033 | NA | NA |
| WSA | 1 | 0.648 | 0.008 | NA | NA |
| Chemical | |||||
| Available P | 2 | 0.910 | 0.000 | 0.149 | 1.000 |
| Total N | 1 | 0.701 | 0.000 | NA | NA |
| Electrical conductivity | 2 | 0.827 | 0.000 | 0.543 | 0.208 |
| pH | 2 | 0.831 | 0.000 | 0.000 | 0.973 |
| Exchangeable K | 2 | 0.529 | 0.102 | 0.001 | 0.433 |
| Exchangeable Na | 2 | 0.720 | 0.000 | 0.361 | 0.573 |
| Carbonates (CaCO3) | 1 | 0.032 | 0.999 | NA | NA |
| Available Mn | 1 | 0.531 | 0.055 | NA | NA |
| Available Zn | 1 | 0.908 | 0.000 | NA | NA |
| Available Cu | 1 | 0.870 | 0.000 | NA | NA |
| Available Ni | 1 | 0.888 | 0.000 | NA | NA |
| Available Cd | 1 | 0.696 | 0.003 | NA | NA |
| Available Pb | 1 | 0.703 | 0.003 | NA | NA |
| Organic matter and biological | |||||
| SOC | 2 | 0.878 | 0.000 | 0.000 | 0.290 |
| POM-C | 2 | 0.702 | 0.001 | 0.000 | 0.123 |
| POM-C/SOC | 2 | 0.510 | 0.361 | 0.001 | 0.105 |
| AWCD | 2 | 0.449 | 0.909 | 0.000 | 0.199 |
| NSU | 2 | 0.571 | 0.335 | 0.000 | 0.173 |
| MBC | 2 | 0.612 | 0.046 | 0.000 | 0.507 |
| Earthworms’ biomass (g m−2) | 1 | 0.587 | 0.024 | NA | NA |
| Earthworms’ abundance (ind/m−2) | 1 | 0.465 | 0.121 | NA | NA |
| Earthworms’ average size (g/ind) | 1 | 0.725 | 0.001 | NA | NA |
Table 4.
Eigenvalue, percentage, and cumulative variance explained by factor analysis using the correlation matrix of the standardized data of soil parameters at 0–15 cm (F1, F2 and F3) and at 15–30 cm (F4 and F5) depths.
Table 4.
Eigenvalue, percentage, and cumulative variance explained by factor analysis using the correlation matrix of the standardized data of soil parameters at 0–15 cm (F1, F2 and F3) and at 15–30 cm (F4 and F5) depths.
| Depth | Factors | Eigenvalue 1 | Percentage (%) | Cumulative (%) |
|---|---|---|---|---|
| 0–15 cm | F1 | 9.562 | 43.463 | 43.463 |
| F2 | 4.533 | 20.603 | 64.067 | |
| F3 | 1.654 | 6.089 | 70.156 | |
| 15–30 cm | F4 | 5.005 | 50.046 | 50.046 |
| F5 | 1.848 | 18.477 | 68.523 |
1 Only factors with eigenvalues > 1.5 are shown.
Table 5.
Proportion of variance explained using varimax rotation for each of the retained factors and communalities for the selected soil properties for the 0–15 cm depth.
Table 5.
Proportion of variance explained using varimax rotation for each of the retained factors and communalities for the selected soil properties for the 0–15 cm depth.
| Soil Indicators | F1 | F2 | F3 | Communalities |
|---|---|---|---|---|
| PR | 0.954 | 0.175 | −0.125 | 0.612 |
| Water −50 | 0.852 | −0.014 | −0.207 | 0.922 |
| PØ 0.2–9 | 0.800 | 0.163 | −0.099 | 0.700 |
| PØ > 9 | −0.765 | 0.212 | −0.108 | 0.862 |
| PØ 0.2–9(>0.2) | 0.111 | 0.000 | −0.097 | 0.955 |
| WSA | 0.980 | 0.053 | −0.116 | 0.595 |
| MWD dry | 0.962 | 0.005 | −0.133 | 0.500 |
| MWD wet | 0.949 | 0.104 | −0.112 | 0.603 |
| Av P | 0.837 | −0.166 | −0.170 | 0.963 |
| Total N | 0.059 | 0.949 | −0.022 | 0.768 |
| EC | 0.079 | 0.797 | 0.138 | 0.831 |
| pH | 0.010 | −0.910 | 0.152 | 0.647 |
| Ext Na | 0.047 | 0.975 | −0.053 | 0.900 |
| Av Zn | −0.535 | 0.362 | 0.306 | 0.982 |
| Av Cu | 0.041 | 0.359 | −0.092 | 0.972 |
| Av Ni | 0.087 | −0.629 | 0.183 | 0.947 |
| Av Cd | −0.659 | −0.319 | 0.256 | 0.912 |
| SOC | 0.933 | −0.004 | −0.097 | 0.948 |
| POM-C | 0.553 | −0.125 | −0.272 | 0.783 |
| Earthworms g/m2 | −0.304 | −0.004 | 0.851 | 0.846 |
| Earthworms g/i | −0.196 | −0.214 | 0.866 | 0.863 |
Table 6.
Proportion of variance explained using varimax rotation for each of the retained factors and communalities for the selected soil properties for the 15–30 cm depth.
Table 6.
Proportion of variance explained using varimax rotation for each of the retained factors and communalities for the selected soil properties for the 15–30 cm depth.
| Soil Indicators | F4 | F5 | Communalities |
|---|---|---|---|
| PØ > 0.2 | 0.955 | 0.032 | 0.925 |
| Av P | 0.891 | 0.082 | 0.836 |
| Total N | 0.954 | −0.008 | 0.934 |
| EC | −0.865 | −0.360 | 0.881 |
| pH | 0.173 | 0.825 | 0.728 |
| Ext K | −0.114 | 0.859 | 0.753 |
| Ext Na | 0.031 | −0.008 | 0.888 |
| SOC | 0.898 | 0.033 | 0.836 |
| POM-C | 0.684 | −0.005 | 0.468 |
| MBC | 0.318 | 0.522 | 0.708 |
Table 7.
Effect of treatment on factor scores from PCA (p < 0.05).
| Mean Scores | |||||
|---|---|---|---|---|---|
| Treatment | F1 | F2 | F3 | F4 | F5 |
| 40-1 | 0.310 b | −1.321 a | 0.828 bc | −0.139 b | 1.485 c |
| 40-2 | −0.244 b | −1.247 a | −0.939 a | −0.637 ab | 0.564 bc |
| 40-4 | 0.257 b | 0.818 b | −0.205 ab | 0.377 c | 0.757 bc |
| 80-1 | 1.896 c | 0.546 b | 0.064 ab | 1.963 d | −0.169 ab |
| 80-2 | 0.367 b | 0.842 b | −0.490 a | 0.792 c | −0.781 a |
| 80-4 | −0.215 b | −0.996 a | −0.011 ab | −0.323 b | −0.795 a |
| MF | −1.162 a | 0.794 b | −0.907 a | −0.909 a | −1.075 a |
| C | −1.121 a | 0.564 b | 1.660 c | −1.123 a | 0.015 ab |
| Treatment (p-value) | < 0.001 | < 0.001 | 0.002 | 0.000 | 0.002 |
In each column, different letters denote different Duncan’s homogeneous groups.
Table 8.
Crop yield results (kg ha−1) treatments with the same letters are not statistically different (p < 0.001). Values are given as the mean ± standard deviation (n = 3).
Table 8.
Crop yield results (kg ha−1) treatments with the same letters are not statistically different (p < 0.001). Values are given as the mean ± standard deviation (n = 3).
| Treatment | Yield (kg ha−1) |
|---|---|
| 40-1 | 8408 ± 921 c |
| 40-2 | 8752 ± 473 c |
| 40-4 | 8722 ± 460 c |
| 80-1 | 6470 ± 1265 b |
| 80-2 | 7558 ± 480 bc |
| 80-4 | 7783 ± 782 bc |
| MF | 8877 ± 462 c |
| C | 3505 ± 824 a |
Different letters denote different Duncan’s homogeneous groups.
Publisher’s Note: MDPI stays neutral with regard to jurisdictional claims in published maps and institutional affiliations. |
© 2021 by the authors. Licensee MDPI, Basel, Switzerland. This article is an open access article distributed under the terms and conditions of the Creative Commons Attribution (CC BY) license (https://creativecommons.org/licenses/by/4.0/).
Share and Cite
MDPI and ACS Style
Simoes-Mota, A.; Poch, R.M.; Enrique, A.; Orcaray, L.; Virto, I. Soil Quality Assessment after 25 Years of Sewage Sludge vs. Mineral Fertilization in a Calcareous Soil. Land 2021, 10, 727. https://doi.org/10.3390/land10070727
AMA Style
Simoes-Mota A, Poch RM, Enrique A, Orcaray L, Virto I. Soil Quality Assessment after 25 Years of Sewage Sludge vs. Mineral Fertilization in a Calcareous Soil. Land. 2021; 10(7):727. https://doi.org/10.3390/land10070727
Chicago/Turabian StyleSimoes-Mota, Ana, Rosa Maria Poch, Alberto Enrique, Luis Orcaray, and Iñigo Virto. 2021. "Soil Quality Assessment after 25 Years of Sewage Sludge vs. Mineral Fertilization in a Calcareous Soil" Land 10, no. 7: 727. https://doi.org/10.3390/land10070727
Note that from the first issue of 2016, this journal uses article numbers instead of page numbers. See further details here.