Article

Effect of Gypsum on the Early Hydration of Cubic and Na-Doped Orthorhombic Tricalcium Aluminate

by
Ana Paula Kirchheim
1,*,
Erich D. Rodríguez
1,2,
Rupert J. Myers
3,
Luciano A. Gobbo
4,
Paulo J. M. Monteiro
5,
Denise C. C. Dal Molin
1,
Rui B. De Souza
6 and
Maria Alba Cincotto
6
1
Department of Civil Engineering of Federal, University of Rio Grande do Sul (UFRGS), Porto Alegre 90035-190, Brazil
2
Department of Structures and Civil Construction, Federal University of Santa Maria (UFSM), Santa Maria 971015-900, Brazil
3
School of Engineering, University of Edinburgh, King’s Buildings, Sanderson Building, Edinburgh EH9 3BF, UK
4
Malvern PANalytical, 117 Flanders Rd # 120, Westborough, MA 01581, USA
5
Department of Civil and Environmental Engineering, University of California, Berkeley, CA 1792, USA
6
Polytechnic School of the University of São Paulo—POLI/USP, São Paulo 05508-010, Brazil
*
Author to whom correspondence should be addressed.
Materials 2018, 11(4), 568; https://doi.org/10.3390/ma11040568
Submission received: 5 March 2018 / Revised: 30 March 2018 / Accepted: 2 April 2018 / Published: 7 April 2018
(This article belongs to the Section Advanced Materials Characterization)

Abstract

:
The tricalcium aluminate (C3A) and sulfate content in cement influence the hydration chemistry, setting time and rheology of cement paste, mortar and concrete. Here, in situ experiments are performed to better understand the effect of gypsum on the early hydration of cubic (cub-)C3A and Na-doped orthorhombic (orth-)C3A. The isothermal calorimetry data show that the solid-phase assemblage produced by the hydration of C3A is greatly modified as a function of its crystal structure type and gypsum content, the latter of which induces non-linear changes in the heat release rate. These data are consistent with the in situ X-ray diffraction results, which show that a higher gypsum content accelerates the consumption of orth-C3A and the subsequent precipitation of ettringite, which is contrary to the cub-C3A system where gypsum retarded the hydration rate. These in situ results provide new insight into the relationship between the chemistry and early-age properties of cub- and orth-C3A hydration and corroborate the reported ex situ findings of these systems.

1. Introduction

Tricalcium aluminate (Ca3Al2O6 or also known in cement chemistry notation as C3A)—the most reactive phase in Portland cement (PC)—begins reacting essentially instantaneously once in contact with water to produce a hydroxy-AFm-type meta-stable product, which is subsequently converted to katoite (Ca3Al2(OH)12 or C3AH6) and heat. Flash setting can occur if this reaction proceeds unhindered [1,2,3], which is undesirable because it reduces the workability and final strength of the cement paste and, consequently, the mortar and concrete. Other calcium aluminate hydrates (4CaO·Al2O3·nH2O or hydroxyl-AFm), e.g., C2AH7.5 and C4AHx, are also produced from the hydration of PC clinker in the absence of added calcium sulfate. Calcium sulfate (typically ~5 wt %) is normally milled with PC clinker to retard the C3A hydration rate [4], which leads to longer setting times [5,6,7] and a longer time window in which acceptable workability is achieved. The most common type of calcium sulfate added to PC clinker is gypsum, but anhydrite and hemihydrate can also be used.
Previous research regarding the C3A-CaSO4·H2O system showed that the C3A hydration rate is related to its crystal structure and specific surface area, the temperature, water/solid ratio [8], type and amount of CaSO4 (gypsum, hemihydrate, anhydrite) [6,9,10,11,12,13,14], the presence of other mineral or chemical admixtures [15,16,17,18,19], and the solution chemistry [20,21].
Minor chemical constituents such as MgO, K2O, Na2O, or SO3 that are present in the raw materials or fuels used in clinker production can significantly modify the types and amounts of the clinker phases produced [1]. Na2O is typically incorporated into the C3A phase, which modifies its crystal structure from a cubic (cub) to an orthorhombic (orth) type through a Ca for Na substitution [22,23,24,25,26,27]. Although the hydration of cub-C3A has been extensively studied over the past several decades [2,3,5,6,8,10,12], research regarding the hydration of orth-C3A is much scarcer [28,29,30,31,32,33] with additional work needed to more reliably understand the chemistry of this latter system. It is, however, known that C3A hydration is significantly influenced by the presence of Na in its C3A structure and thus its crystal polymorph type [29]. Recently, it was reported that the dissolution of Al6O1818− ring structures is strongly dependent on the C3A crystal structure. The Ca/Al[aq] ratio measured by inductively coupled plasma optical emission spectroscopy (ICP-OES) during the first few hours of the reaction showed a lower solubility of cub-C3A within a calcium sulfate solution when compared to the orth-C3A-based systems. This relatively low solubility plays an important role in the formation of an Al-rich layer at the partially dissolved cub-C3A solution interphase and therefore affects the dissolution rate [34].
To consolidate the understanding of the effects that gypsum has on the hydration of cub- and orth-C3A, this paper presents an integrated in situ assessment of the chemistry of the (cub- and orth-) C3A-CaSO4-H2O system using isothermal conduction calorimetry (IC) and in situ X-ray diffraction (XRD) over a range of CaSO4 concentrations relevant to hydrated PC.

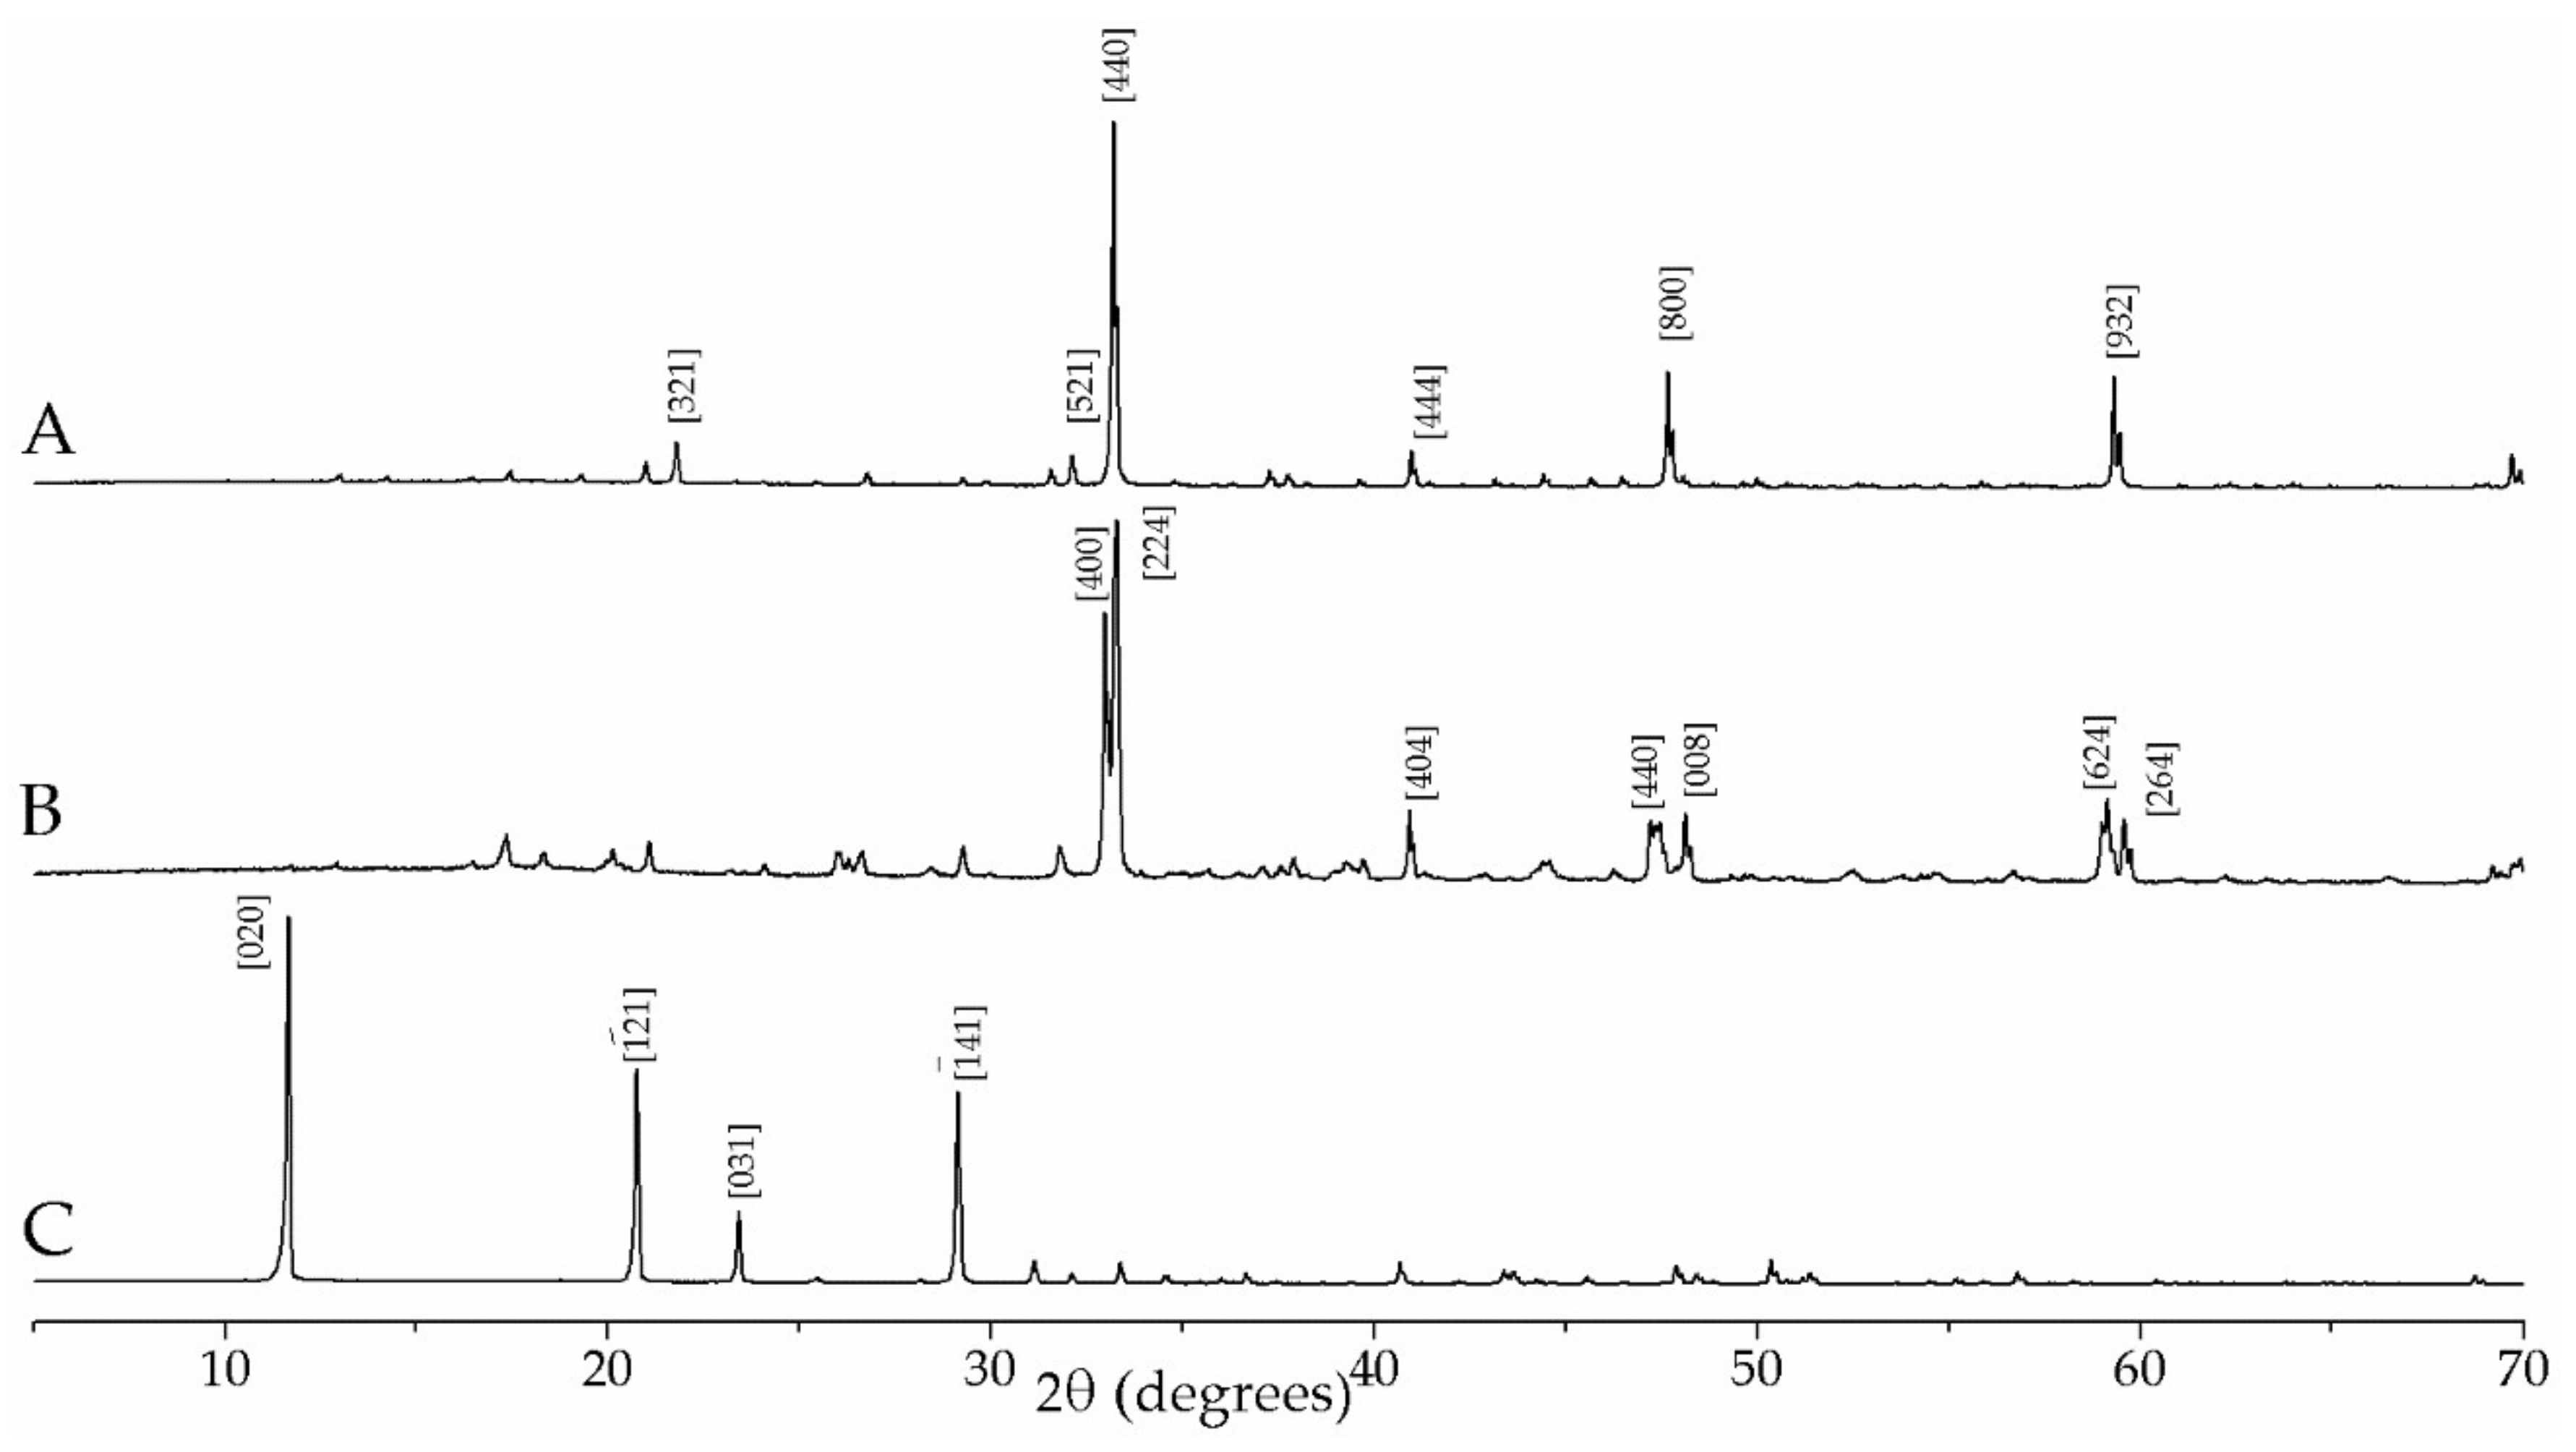
2. Materials and Methods

Powder samples of cub- and orth-C3A were obtained from CTL, Inc., Skokie, IL, USA. Both compounds were synthesized in a laboratory by heating a stoichiometric blend of reagent grade CaCO3 and alumina (Al2O3). Orth-C3A was prepared from reagent grade CaCO3, Al2O3, and Na2CO3 in stoichiometric proportions, similar to the process reported by Regourd et al. [35]. The blends were fired at 1400 °C for 1 h and then quenched using forced air convection. The powders were then produced by ball milling to obtain particle size distributions with d90 < 30 μ m and mean particle sizes of 11.0 μ m and 14.0 μ m for orth- and cub-C3A, respectively. Pure gypsum (CaSO4·2H2O) was used in this study (Fisher Scientific, Hampton, NH, USA), which had a particle size distribution with d90 < 39 μ m and a mean particle size of 19.0 μ m.
The crystal structures of the samples were verified by XRD using a PANalytical X’Pert Pro (PANalytical, Almelo, The Netherlands) (Cu Kα radiation with a step size of 0.02° 2θ). The major diffraction signals of orthorhombic C3A International Crystal Structure Database (ICSD) code # 1880 at d-spacings of 2.692 Å and 2.714 Å were clearly identified in the diffractogram of the orth-C3A powder, as is shown in Figure 1. The single major reflection of cubic C3A (ICSD# 1841) at 2.6987 Å was observed in the diffractogram of the cubic-C3A powder. Rietveld analyses using HighScore Plus™ software (Version 4.6, PANalytical, Almelo, The Netherlands) (estimated uncertainty = ±5 wt %) showed that the cub-C3A powder contained ≥99 wt % cubic C3A (ICSD# 1841) and ~1 wt % C3AH6 (ICSD# 202316), whereas the orth-C3A powder contained ≥92 wt % orthorhombic C3A (ICSD# 1880), ~7 wt % C3AH6 (ICSD# 202316) and ~1 wt % monohydrocalcite (ICSD# 100846, CaCO3 · 2H2O).
Samples were produced from mixtures of gypsum and cub- or orth-C3A at respective mass ratios of 0, 0.20, 0.60, and 1.90. The gypsum/C3A ratio of 1.90 corresponds to the stoichiometry of ettringite formation at a 100% reaction of C3A. A water/solid (w/s) mass ratio of 1.2 was used.
In situ XRD: Samples were analyzed using a PANalytical Empyrean diffractometer equipped with an RTMS (real-time multiple strip) detector (X’Celerator) (PANalytical, Almelo, The Netherlands). Materials were weighed and hand mixed inside a plastic bag for 1 min before filling the sample holder, and then immediately covered with a Kapton film to avoid water evaporation and minimize superficial carbonation. A semi-quantitative analysis of the X-ray diffractograms was performed using the reference intensity ratio (RIR) method based on the multi peaks approach as implemented in the High Score Plus™ software. The method involves comparing the intensity of one or more peaks of a phase with the intensity of a peak of a standard material to yield an approximation of the solid phase assemblage in a sample as was discussed by [36]. It was used as an alternative method to get information and a brief comparison based in overall peak intensities from the multiple identified phases. Some of the solid phases produced have a preferred orientation, e.g., ettringite, which can modify the relative intensities of the diffraction signals and the quantitative results. The displacements in the X-ray diffractogram peaks caused by the changing sample volume, a result of the hydration reaction, were corrected by assigning the major ettringite peak to 9.1° 2θ from the observed 2θ value and by shifting the other phases by the same amount using HighScore Plus™ software.
Isothermal calorimetry (IC): The hydration of both cub- and orth-C3A was followed using a high-sensitivity (20 μW) isothermal calorimeter (TA Instruments, New Castle, DE, USA) with an integrated stirrer for internal mixing. Samples (3–6 g) of the dry material (gypsum and C3A) were first introduced into the cell. Water was added when thermal equilibrium was achieved, and the sample was stirred for 2 min. The evolution of the heat flow produced from the hydration reaction proceeded for 24 h, which began when water was introduced into the cell. The results were normalized to the total mass of solids added.

3. Results and Discussion

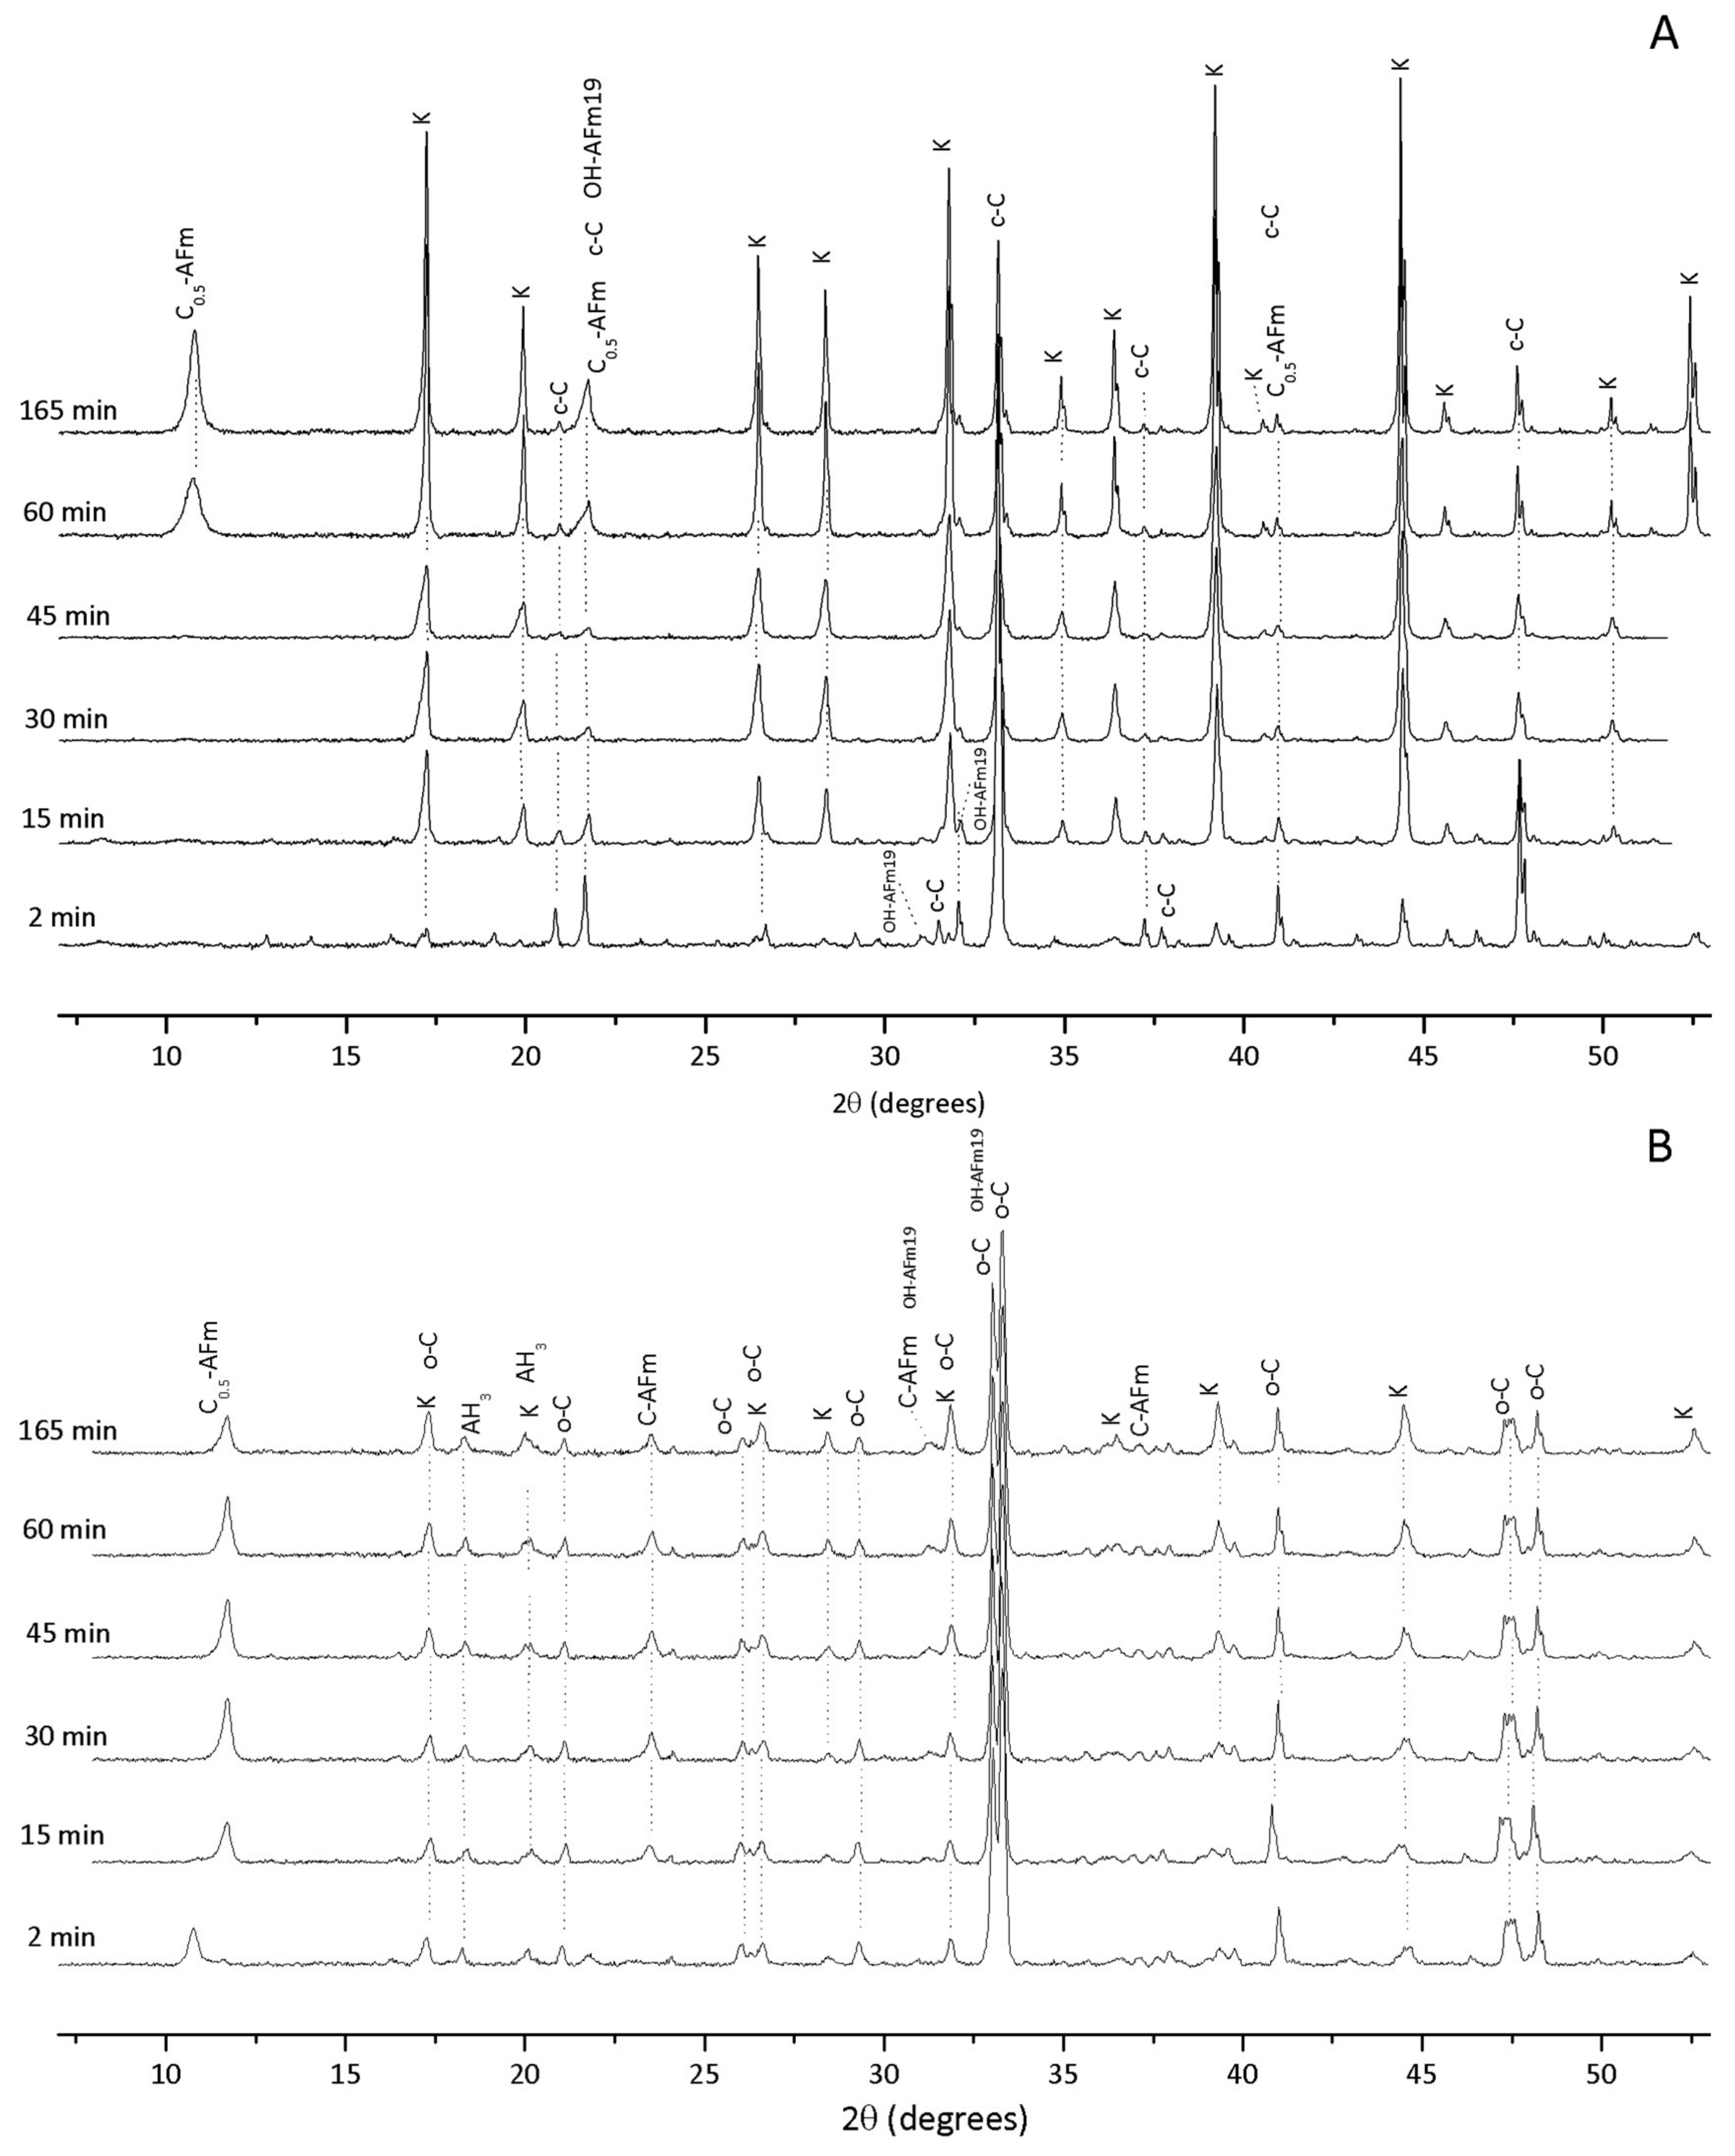
3.1. Hydration of C3A without Gypsum—In Situ XRD

Figure 2 shows the crystalline hydration products formed between 2 min and 165 min after initiating hydration for cub- and orth-C3A without gypsum. The main solid phases produced in both samples are C4AH19 (OH-AFm19; Ca4Al2O7 · 19H2O; powder diffraction file (PDF#) 00-014-0628), calcium hemicarboaluminate hydrate (C0.5-AFm; Ca4Al2O6(CO3)0.5 · 11.5H2O; PDF# 00-041-0221), calcium monocarboaluminate hydrate ( C ¯ -AFm, 3CaO·Al2O3·CaCO3·11H2O; PDF#01-087-0493), gibbsite (AH3; PDF#01-070-2038) and katoite (k; C3AH6; PDF# 00-024-0217). Cubic C3A (c-C; PDF# 00-038-1429) and orthorhombic C3A (o-C; PDF# 00-026-0958) were also identified in the samples.
The peaks related to C3AH6 exhibited high intensities and appeared prior to two minutes of the reaction, which are attributed to the precipitation of this phase as a major hydration product in both cub- and orth-C3A systems (Figure 2A,B). The diffraction signals for C0.5-AFm occur after 60 min of hydration in the cub-C3A system and after two minutes in the orth-C3A system. This phase is formed through superficial carbonation of the calcium aluminum hydrate (such as C4AH19). The presence of calcium monocarboaluminate hydrate ( C ¯ -AFm, 3CaO·Al2O3·CaCO3·11H2O) and the earlier formation of hemicarboaluminate in the orth-C3A system is consistent with the results reported by Dubina et al. [37], showing that orth-C3A exhibits a higher susceptibility to superficial carbonation. The results are consistent with previous reports [10], although OH-AFm19 is sometimes identified as a major solid hydration product [10,38], but the intensity of the peaks related to its presence were lower.

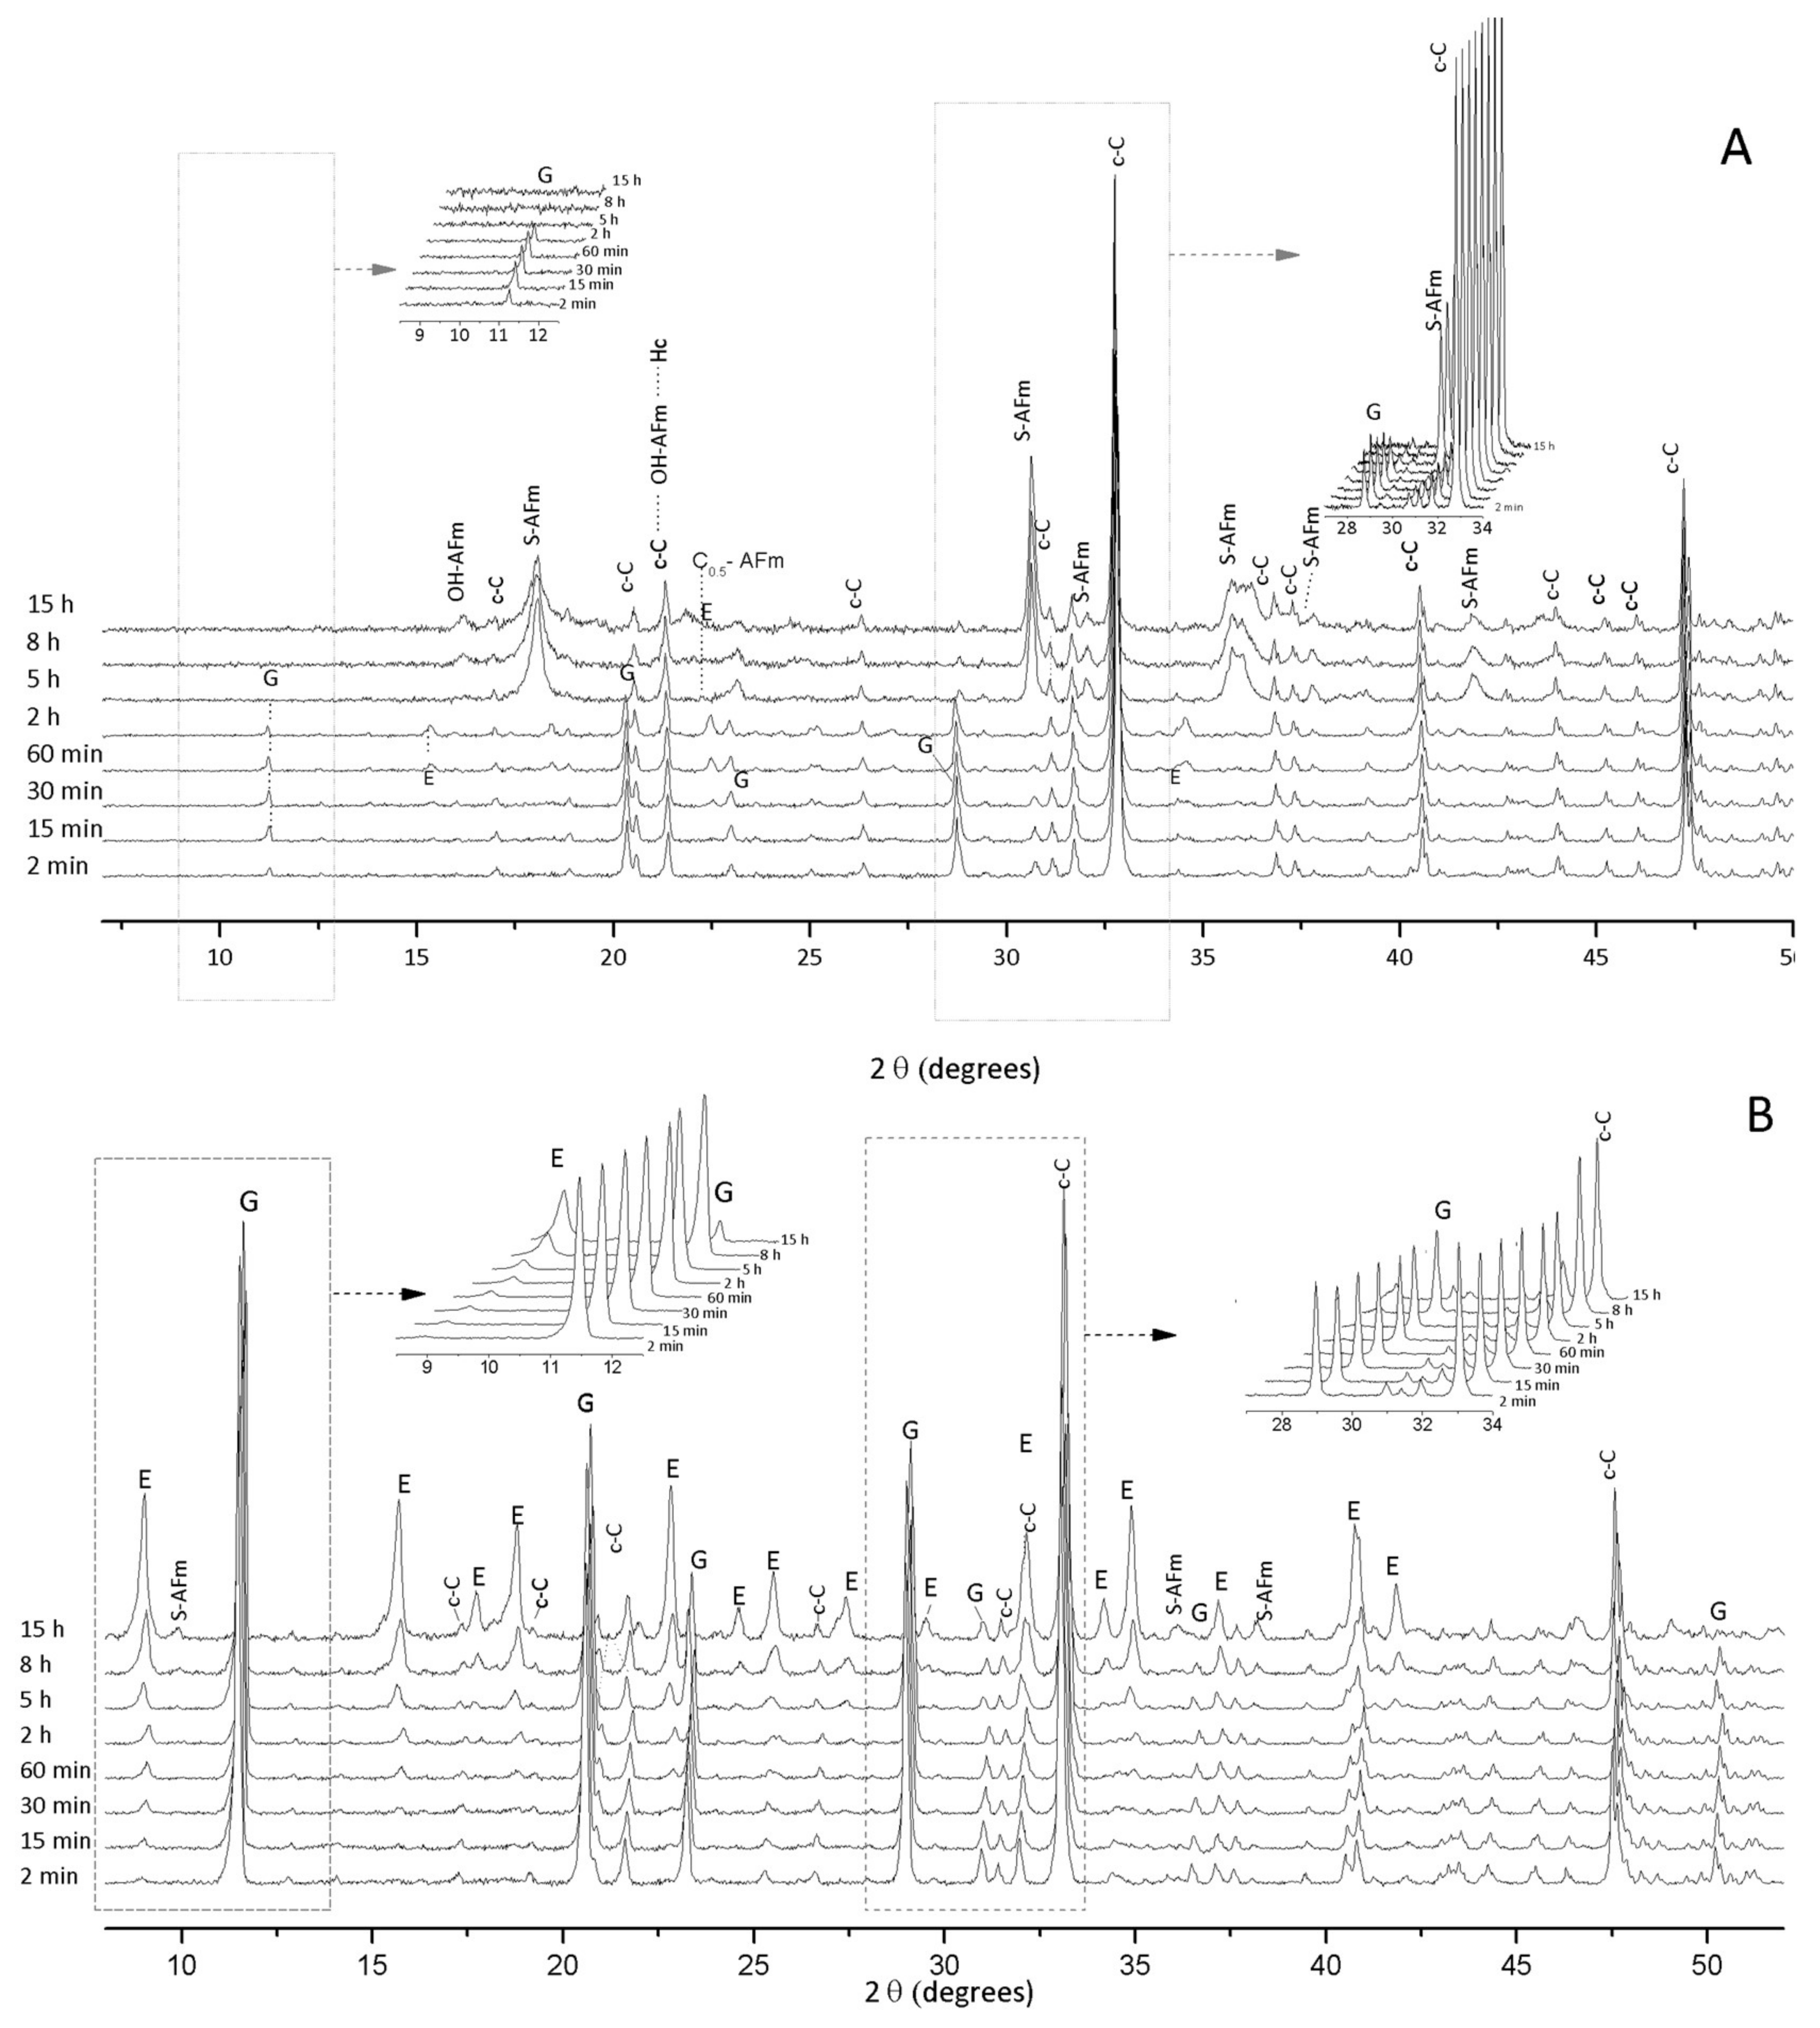
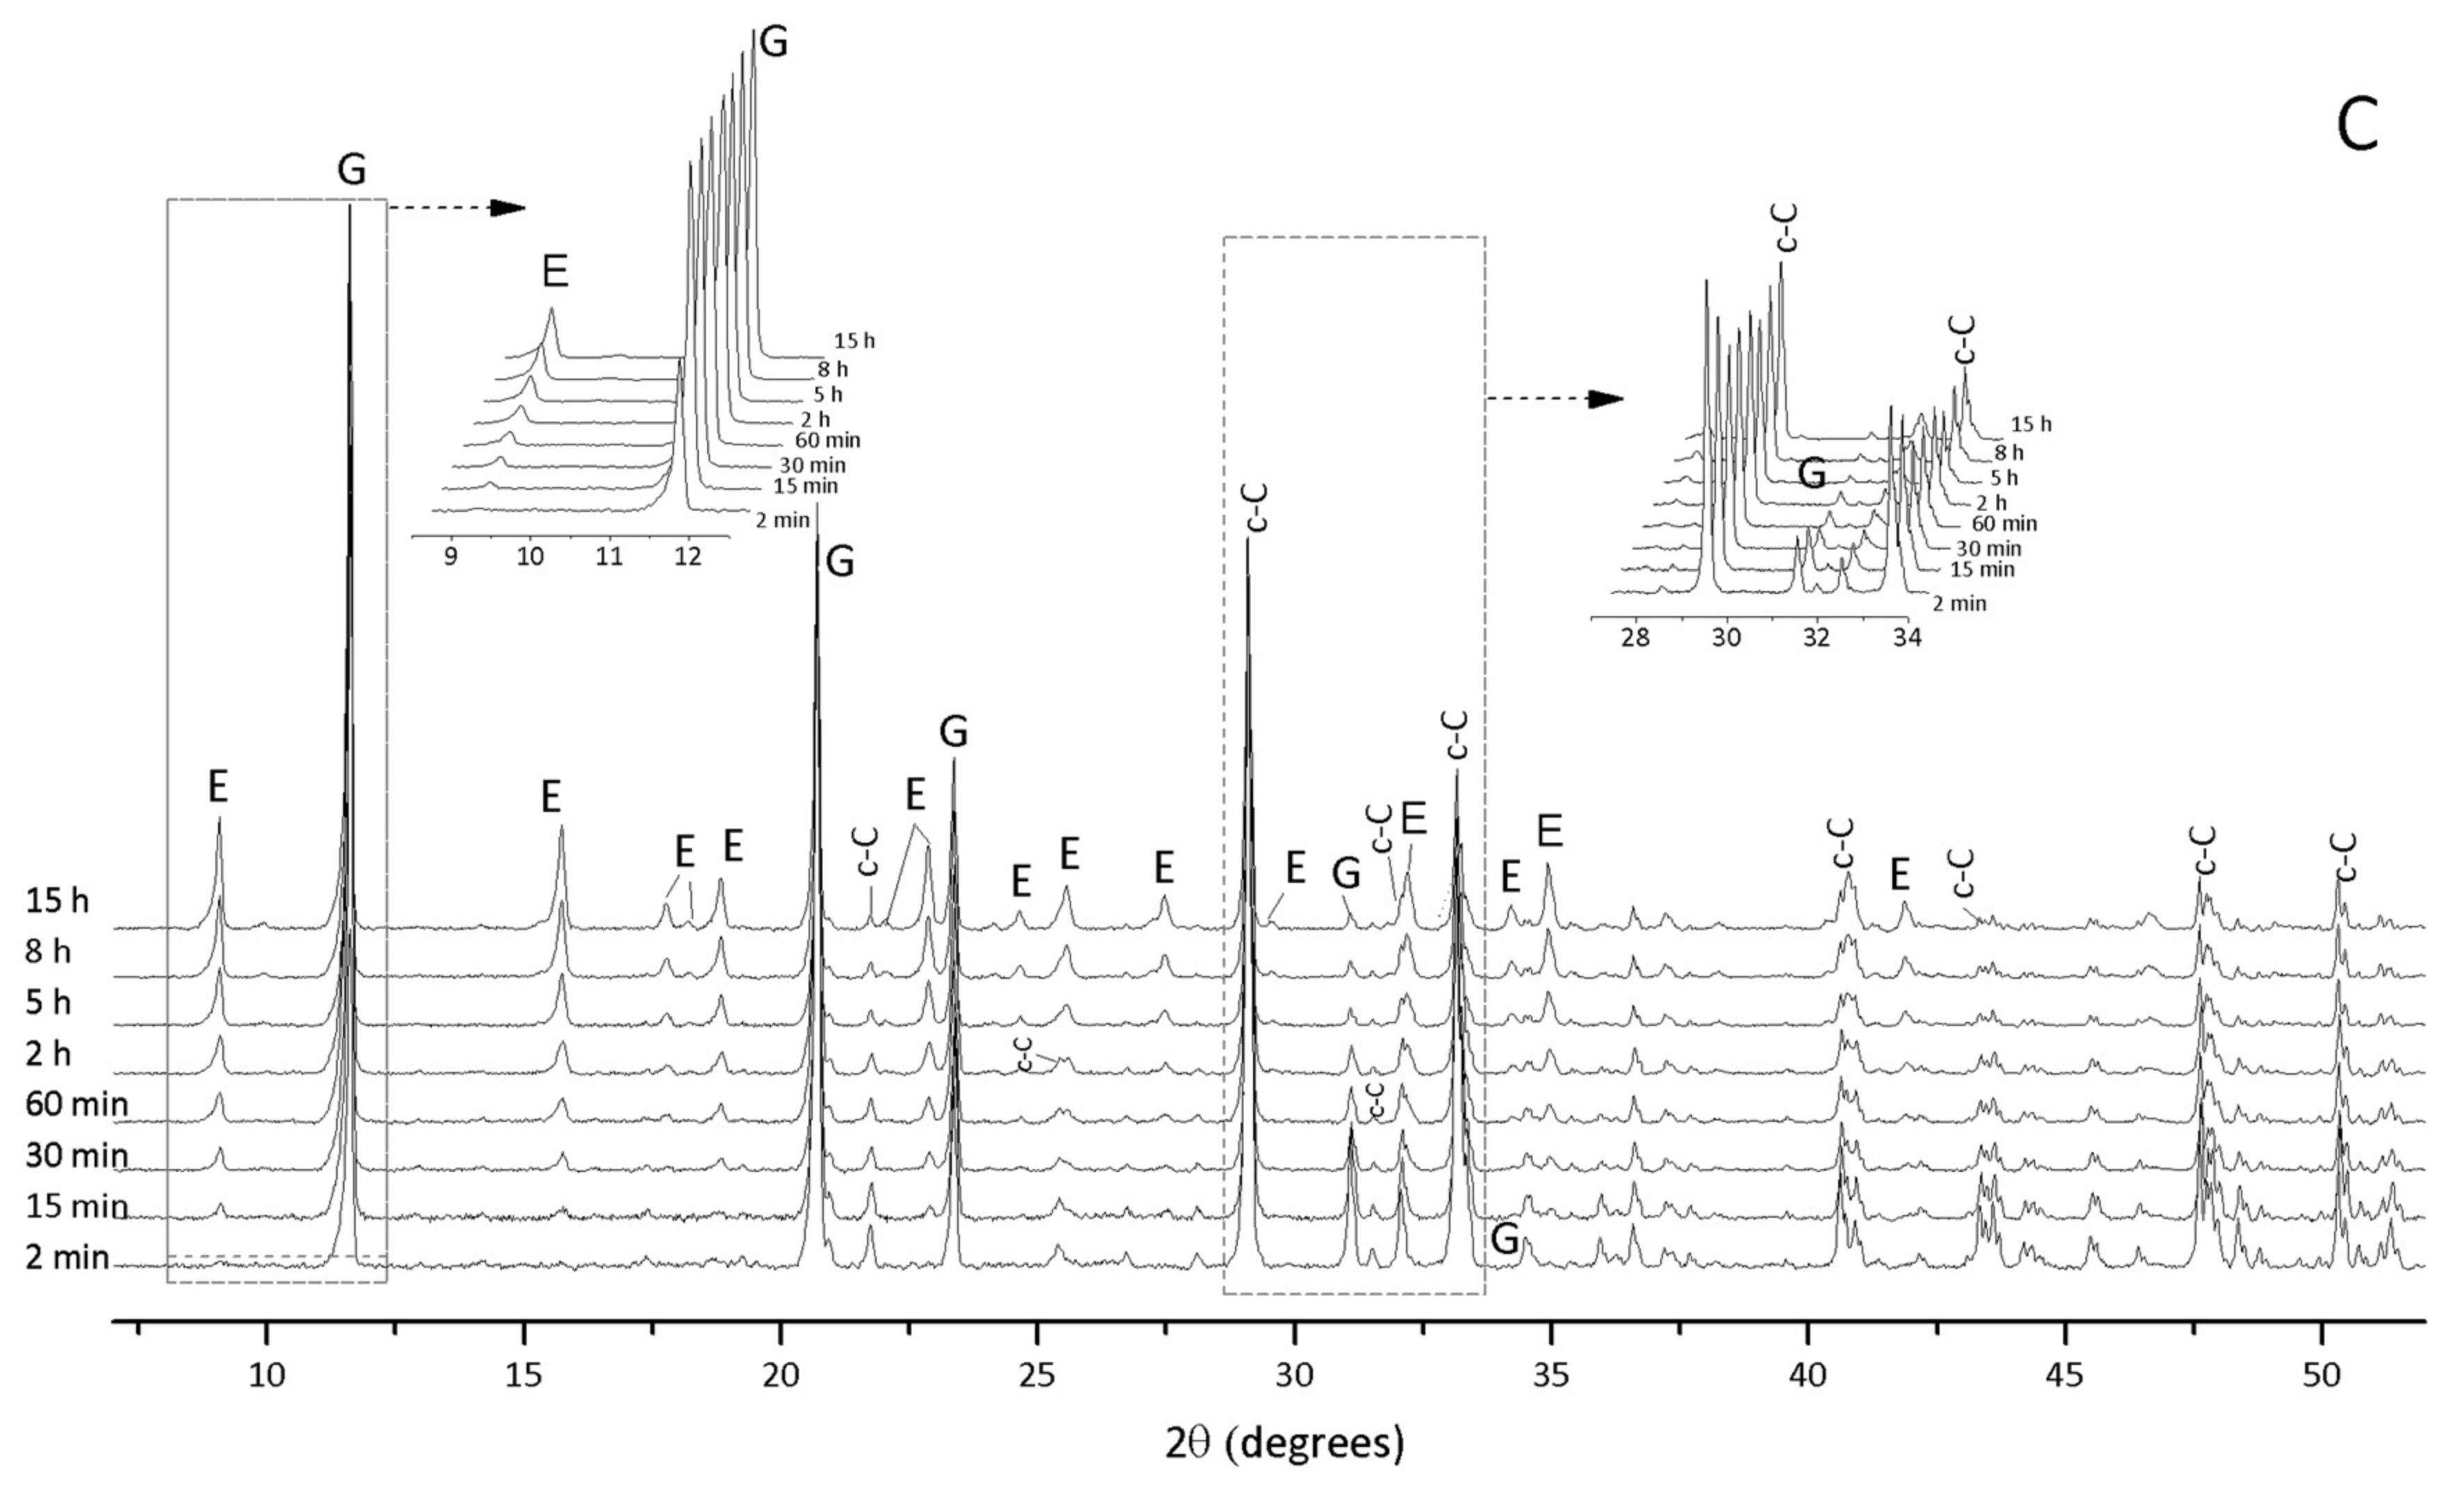
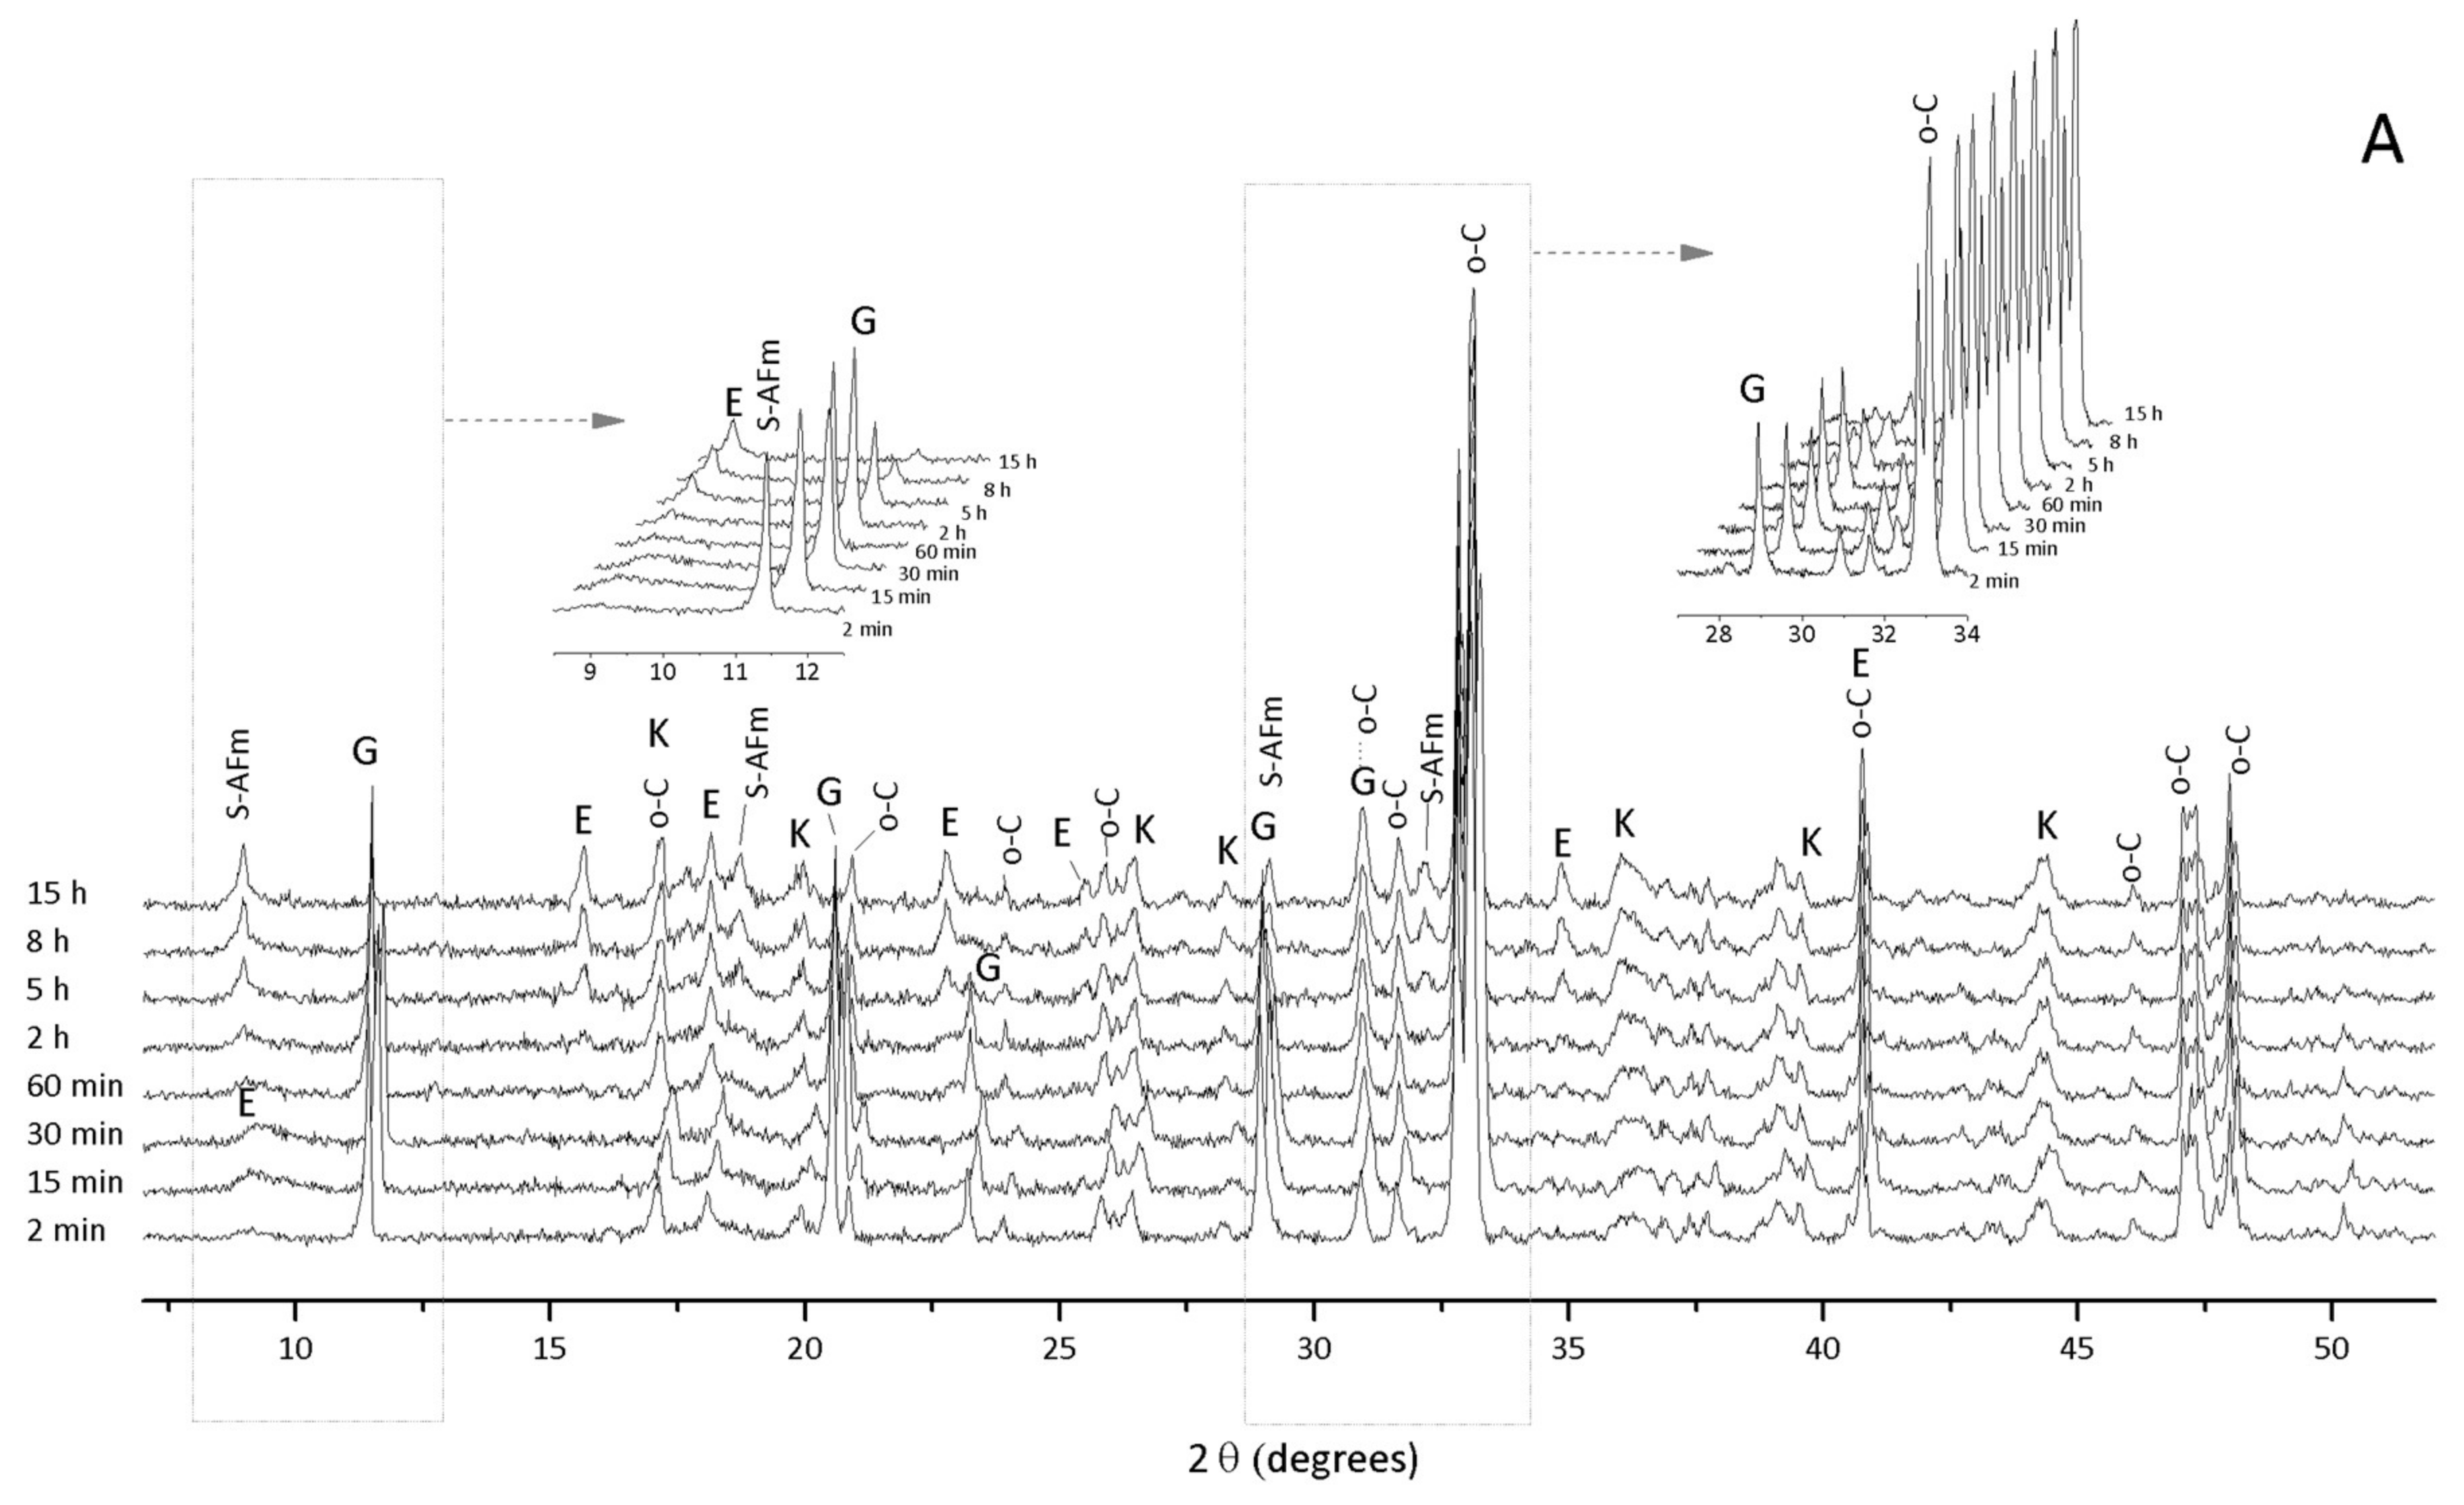
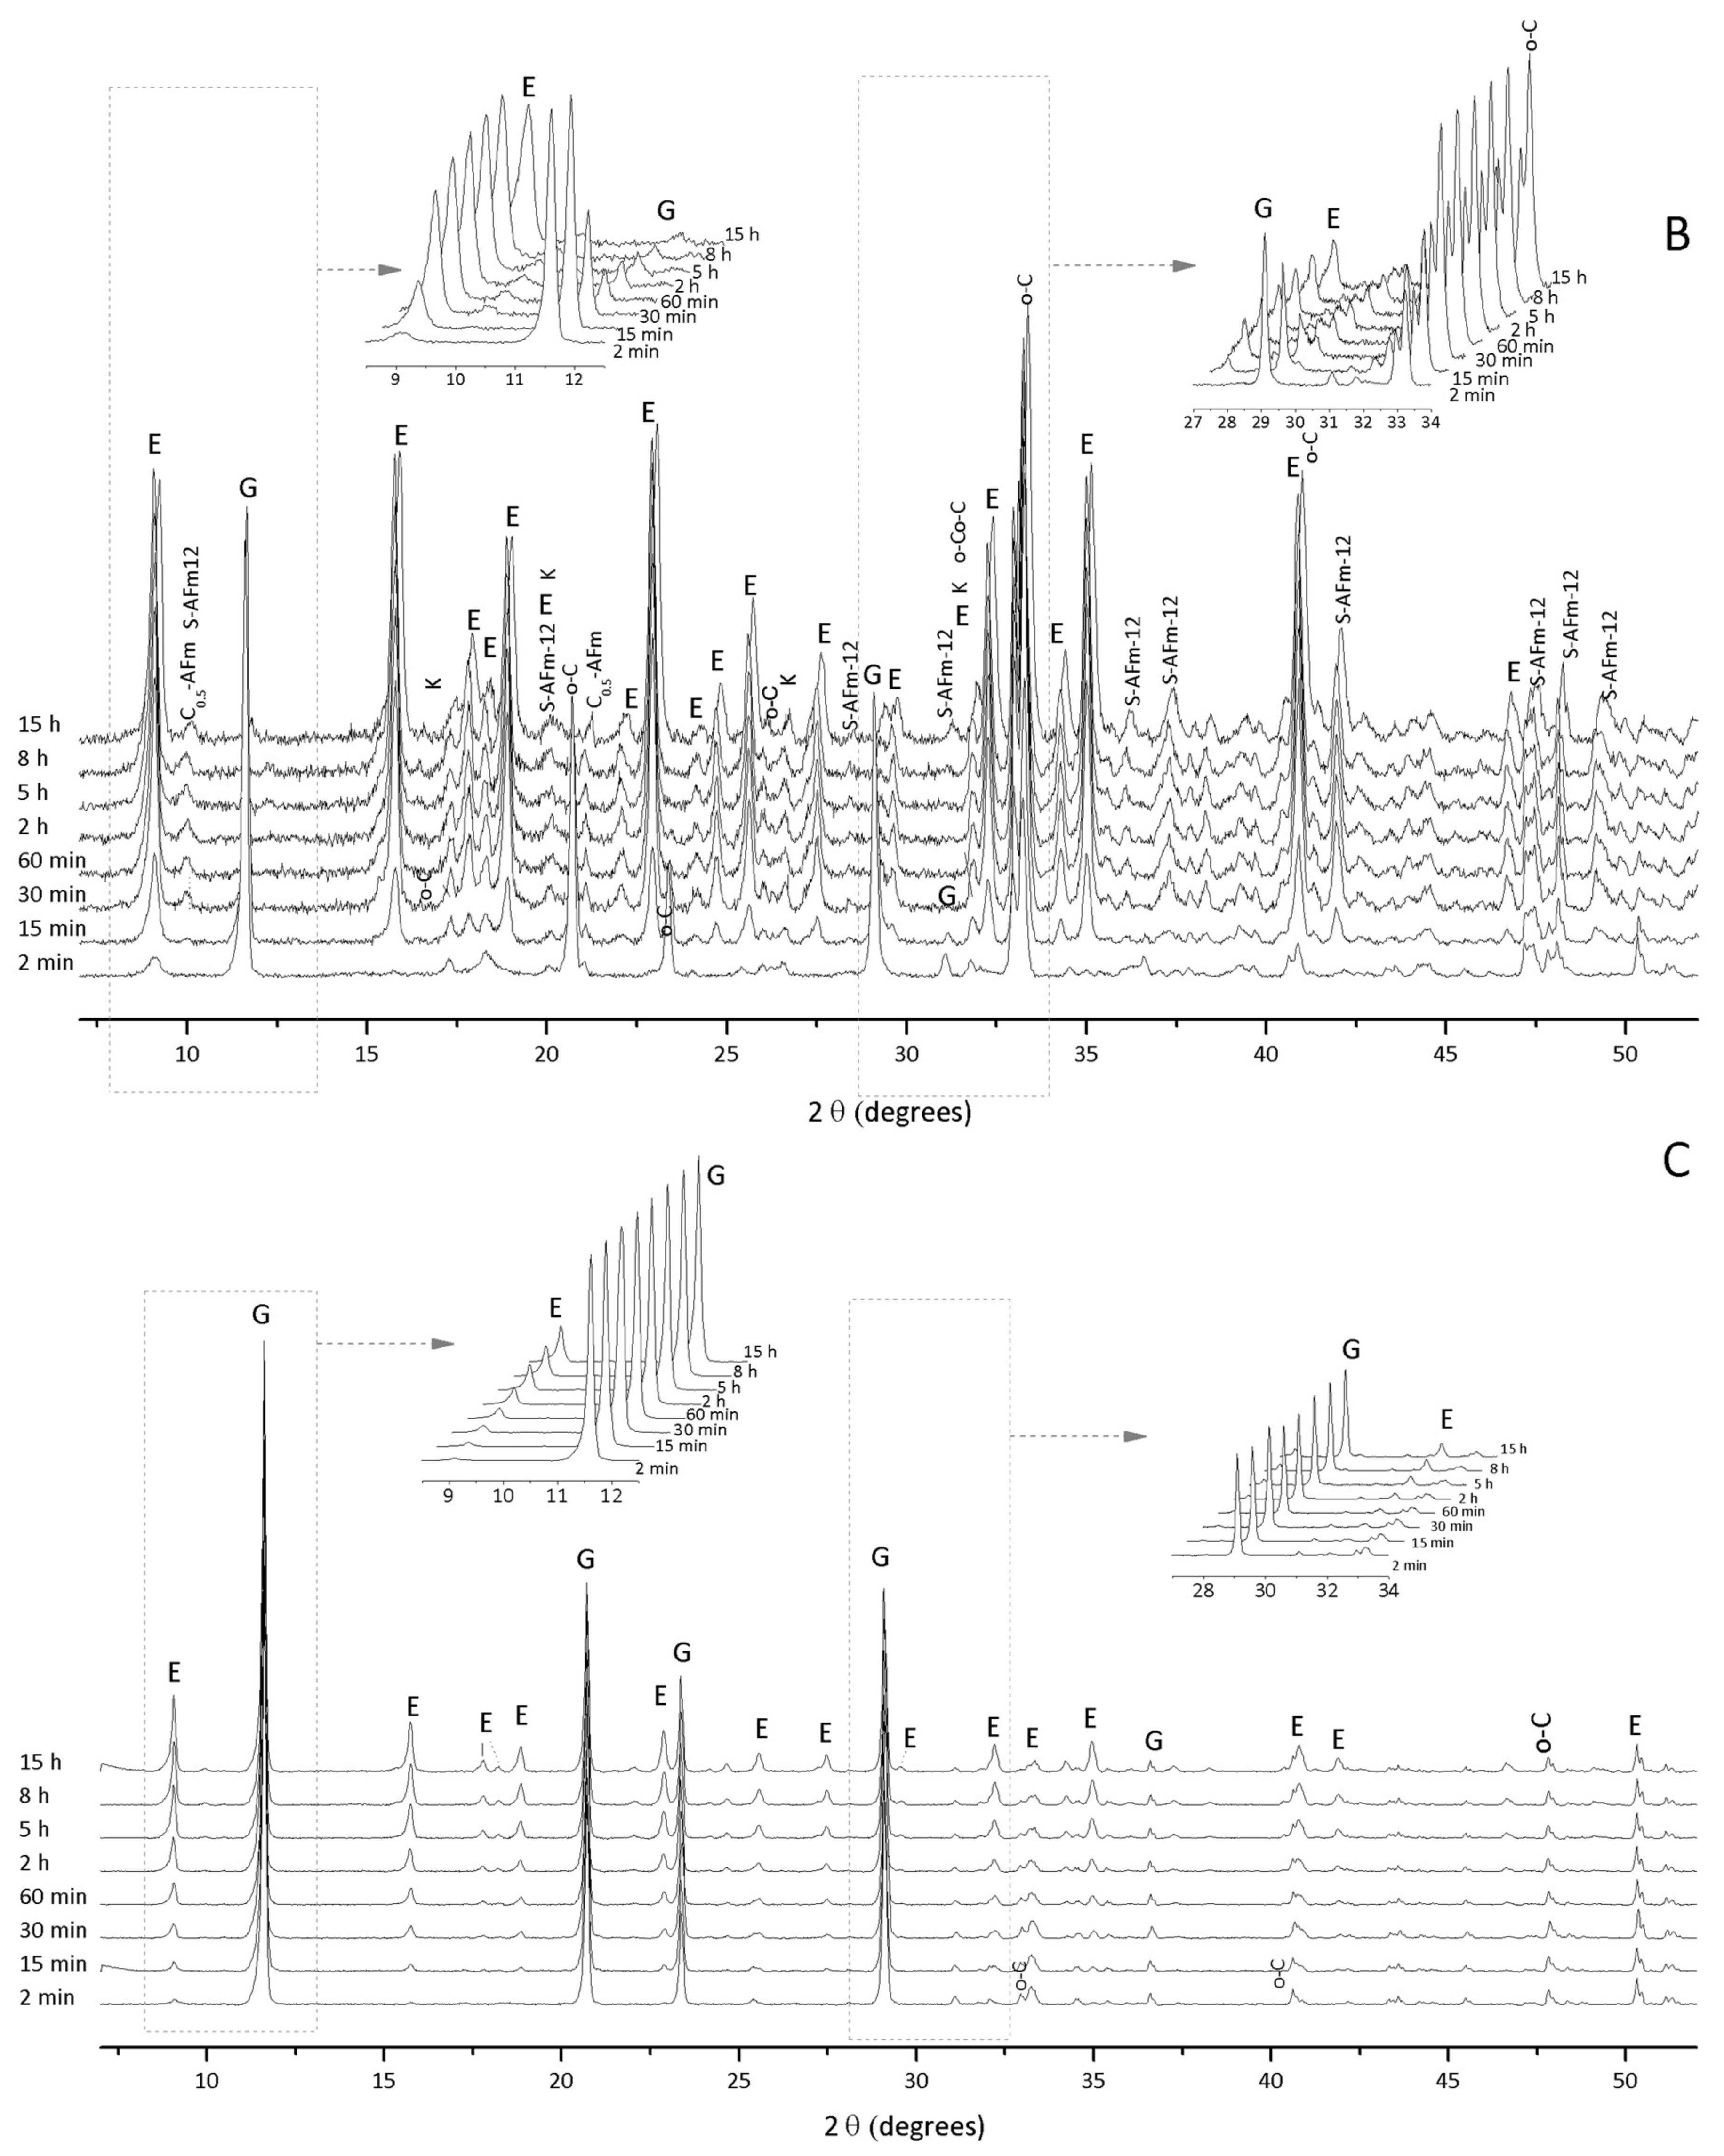
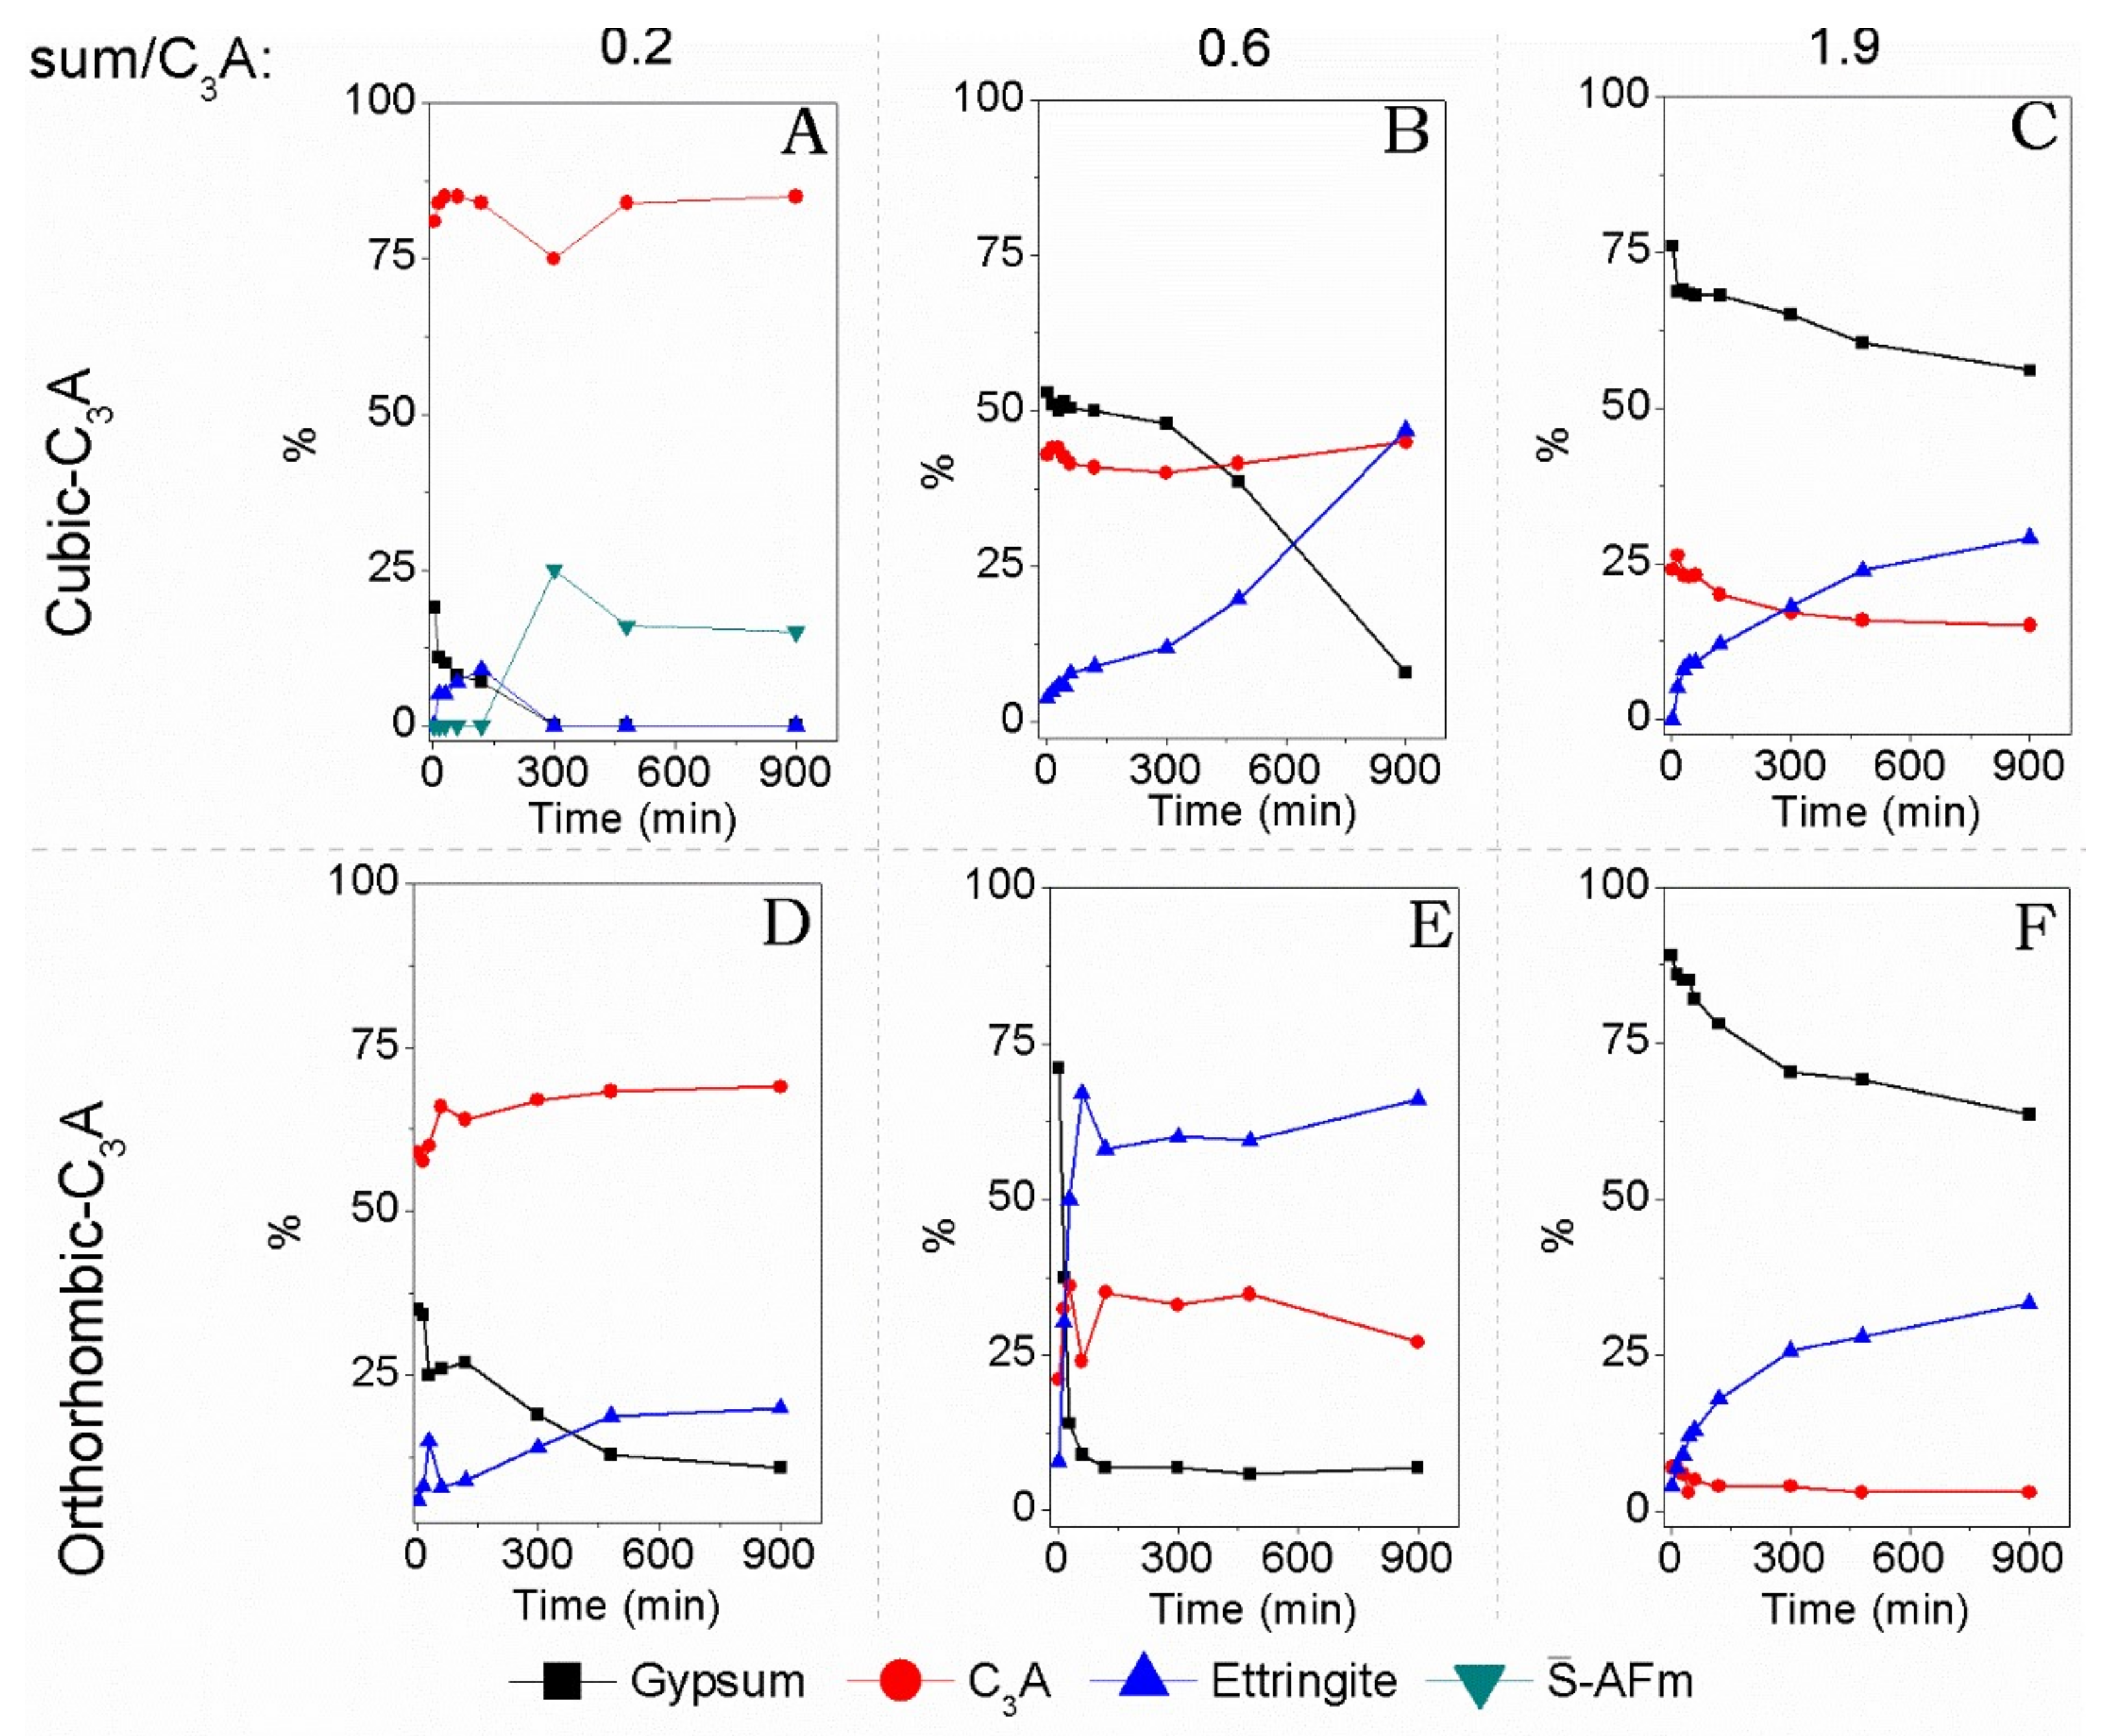
3.2. Hydration of C3A with Gypsum—In Situ XRD

Figure 3 presents the in situ XRD results of cub-C3A and gypsum hydration at gypsum/cub-C3A ratios of 0.20, 0.60, and 1.90. A fast depletion of gypsum was identified for the cub-C3A system with 20% of gypsum after approximately two hours (Figure 3A), and after five hours some unreacted cub-C3A remained. The total consumption of gypsum for this sample led to the formation of calcium monosulfoaluminate hydrate ( S ¯ -AFm, Ca4Al2O6(SO4) · 14H2O; PDF# 00-042-0062) at the expense of ettringite (E, Ca6Al2(SO4)3(OH)12 · 26H2O, C6A S ¯ 3H32; PDF# 00-041-1451)), as expected. Peaks attributed to ettringite exhibited high intensities for the cub-C3A systems with higher contents of gypsum (CaSO4 · H2O; G; PDF# 00-033-0311). S ¯ -AFm was identified mainly for gypsum/cub-C3A ratios of 0.20, which is consistent with previous reports [5], where the dissolution of ettringite and the remnant cub-C3A formed monosulfoaluminate and/or hydroxy-AFm phases. This reaction occurs after the depletion of gypsum, which is also coherent with the heat released, as is shown below. After eight hours of hydration time, OH-AFm19 was detected. Cub-C3A was not fully consumed even after 15 h of hydration regardless of the gypsum content.
For the systems, gypsum/cub-C3A = 0.60 and 1.9, ettringite is the first crystalline phase identified after two minutes of hydration. Unhydrated gypsum and cub-C3A are still present at the end of the measurements (15 h) but exhibit peaks with smaller intensities in the gypsum/cub-C3A = 0.6 sample. For the system gypsum/cub-C3A = 0.6, the precipitation of S ¯ -AFm began after eight hours.
Similar results are found for the orth-C3A and gypsum hydration systems (Figure 4) with ettringite formed over the full range of gypsum/orth-C3A ratios and S ¯ -AFm precipitation favored at lower gypsum content. The consumption of the C3A during the hydration is higher for the orthorhombic-type structure regardless the gypsum content (except for the sample with no gypsum added), and the intensities of their characteristic peaks are lower compared to the corresponding systems based on cub-C3A. Furthermore, S ¯ -AFm is more stable in the orth-C3A system, as it is also identified at a gypsum/orth-C3A ratio = 0.20 and 0.60. This phase is again produced as the gypsum peaks decrease from major to minor intensities, which occurs after five hours in the gypsum/orth-C3A = 0.20 sample and after 30 min in the gypsum/orth-C3A = 0.60 sample. The gypsum/orth-C3A = 0.60 system (Figure 4B) exhibits the highest reactivity degree due to a more pronounced decrease in the gypsum peaks. Unhydrated C3A appears before 20 min of hydration with almost complete hydration after roughly eight hours, and a higher and progressive formation of ettringite is clearly identified. Total gypsum consumption was not observed in the gypsum/orth-C3A = 1.90 sample, and this was the only sample in which the orth-C3A fully reacted within the first few minutes of hydration. In the presence of sulfates, the reactivity of C3A increases at a higher content of Na+ in its structure, and therefore, the orthorhombic phase is a more reactive polymorph when dissolved sulfate ions are present. The diffraction peaks for ettringite appear after two minutes of hydration in the orth-C3A samples at gypsum/orth-C3A ratios of 0.20, 0.60, and 1.90. The ettringite peaks in the gypsum/orth-C3A = 0.60 and 1.90 samples are more prominent than in the X-ray diffractograms for the cub-C3A samples. Unlike the sample, gypsum promotes the accelerated consumption of orth-C3A during the reaction due to the higher solubility of their Al6O1818− ring structures in the presence of a sulfate source compared to that of the cub-C3A samples [34]. This finding is also corroborated with the slower cub-C3A consumption regardless of the smaller gypsum content during 15 h of analysis.
Figure 5 presented the RIR analysis using the major diffraction peaks for gypsum, orth-C3A, cub-C3A, ettringite, and S ¯ -AFm. Figure 5A shows coherence between the minimum value for C3A and maximum of monosulfate, in 300 min (five hours), its formation was favored by the very low gypsum content. The levels of C3A and monosulfate remain constant, with no increasing in the reaction. There is also consistency in the increase and then decrease in the ettringite content, and a steady decrease in the gypsum content. This can be correlated to the cumulative heat of this sample (Figure 6A) in the IC test, where the image shows an abrupt change in the amount of the cumulative heat after five hours. Figure 5E indicates that the hydration of orth-C3A is fastest in the gypsum/orth-C3A = 0.60 system. The diffraction peaks for orth-C3A are not identified after 15 min of hydration in the gypsum/orth-C3A = 1.9 sample (Figure 5F), indicating that it is consumed faster than cub-C3A in its counterpart system at the same gypsum content (Figure 5C). The presence of amorphous calcium aluminate hydrates and some AFm-type structures cannot be reliably quantified by conventional XRD due their short-range ordering and is identified only through the deviation in the baseline between 15 and 25 degrees.
In summary, the XRD measurements showed that gypsum accelerates the consumption of orth-C3A more than cub-C3A during hydration. Stephan and Wistuba [11] studied the hydration behaviour of C3A solid solutions with MgO, SiO2, Fe2O3, Na2O and K2O. The authors found out that the hydration of these materials in the presence of CaSO4 was accelerated when C3A was doped with K2O or Na2O, whereas Fe2O3 strongly retarded the hydration.

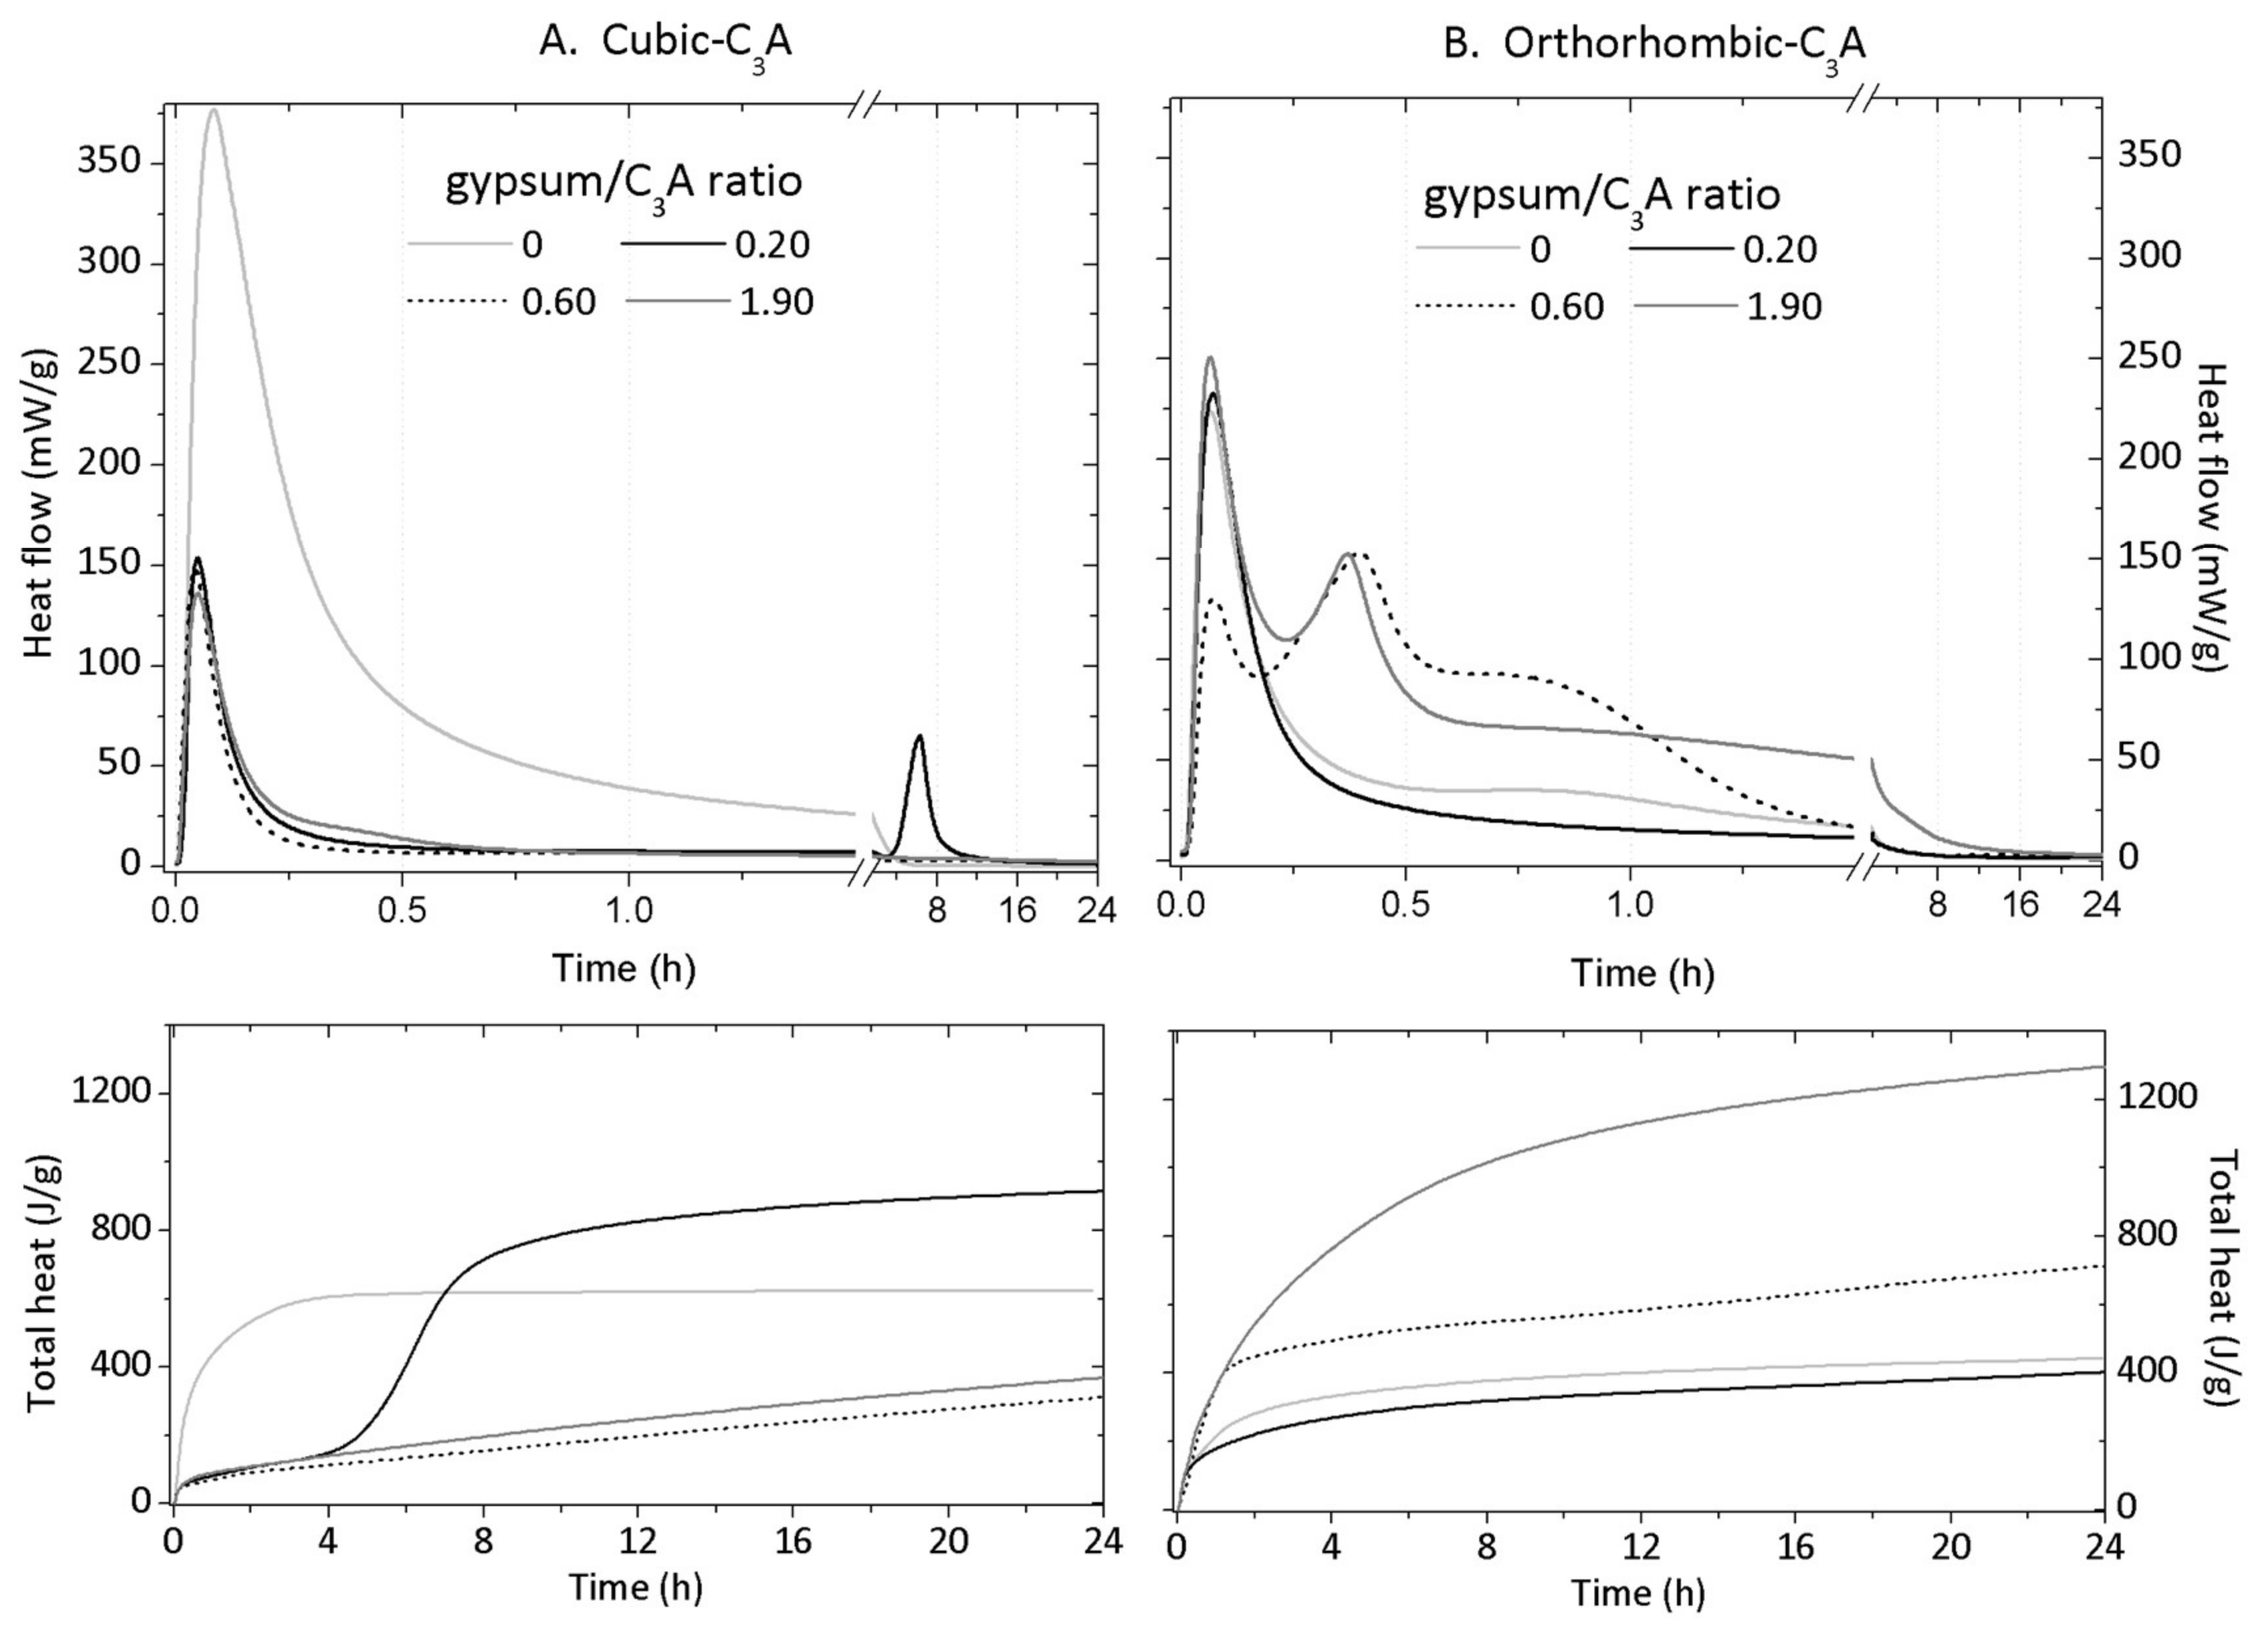
3.3. Isothermal Conduction Calorimetry

The rate of heat evolution measured by IC depends greatly on the C3A crystal structure and gypsum content (Figure 6) with up to three exothermic peaks identified in each curve. For both cub- and orth-C3A samples, the first peak with maximum at roughly five minutes corresponds to the initial wetting and dissolution including the precipitation of OH-AFm and C3AH6 (at gypsum/C3A content of 0 and 0.20) and ettringite (at gypsum/C3A content of 0.60 and 1.9). The formation of these solid phases have been reported for the more dilute cub-C3A samples (w/s = 4, 10, and 25) [5,6,28,32] and pastes (w/s = 1) [8] and agrees with the previous results.
The addition of gypsum to the cub-C3A sample decreases the intensity of the main heat evolution peak (376.8 mW/g) to an approximately constant peak value (135.9 mW/g), irrespective of the gypsum content. This result is consistent with previous research [5], where the time of the highest heat release identified is unaffected by the gypsum content once present. However, the occurrence of the secondary peak, attributed to S ¯ -AFm formation and consumption of initially precipitated ettringite, depends on the gypsum content. This peak occurs in the results for the gypsum/cub-C3A = 0.20 sample only at roughly six hours of hydration (Figure 6). This peak originates from the renewed hydration of cub-C3A that occurs once gypsum has completely dissolved. Recent research suggests that this renewed hydration of cub-C3A coincides with the desorption or consumption of Ca-S complexes, which adsorb onto the cub-C3A surface and inhibit the dissolution of this phase at earlier hydration times [39]. In the XRD result for the gypsum/cub-C3A = 0.60 sample (Figure 3B), peaks with very low intensities attributed to S ¯ -AFm can be seen after 15 h. The low intensity of the S ¯ -AFm peaks in the XRD results for this sample suggest the presence of a very low content, and the quantity of this phase formed (at this time) is quite low, and insufficient heat is measured by the equipment. In contrast to the cub-C3A system, adding gypsum to the orth-C3A hydration does not decrease the intensity of the initial exothermic peak (~220–250 mW/g), except for the gypsum/orth-C3A = 0.60 sample. The intensity of the initial heat release peak for the gypsum free orth-C3A sample is ~40% lower than that identified for the corresponding cub-C3A sample, indicating that orth-C3A is less reactive than cub-C3A in water, which agrees with [11,40] and the XRD results.
The addition of gypsum to the orth-C3A system does not greatly change the heat evolution rate at a gypsum/orth-C3A ratio = 0.20 with its main exothermic peak ~51% higher than that of the corresponding cub-C3A system. A prominent second exothermic peak is identified at ~23 min in the orth-C3A samples synthesized at gypsum/orth-C3A ratios of 0.60 and 1.90. This second peak coincides with the consumption of gypsum and precipitation of ettringite in the gypsum/orth-C3A = 0.60 sample. However, in the gypsum/orth-C3A = 1.90 sample, the amount of gypsum stabilized after the first few minutes of the reaction; therefore, this second peak can be attributed to the consumption of orth-C3A and the precipitation of ettringite. The higher heat released before 8 h in the gypsum/orth-C3A = 0.60 sample (Figure 5B) can be assigned to S ¯ -AFm formation and mainly to the continuous formation of ettringite at the expense of gypsum; as is shown in the XRD results in Figure 3B. This result indicates that the hydration of orth-C3A occurs faster than cub-C3A in the presence of gypsum, which is consistent with existing research on the cub- and orth-C3A pastes in the presence and absence of lime [28,30,32].

4. Conclusions

This paper presented IC and in situ XRD analyses to follow the hydration of cub- and orth-C3A hydration in the absence and presence of gypsum. The results showed that orth-C3A reacts faster than cub-C3A in the presence of gypsum with early ettringite formation and gypsum and C3A consumption occurring in the former system. However, the hydration rates of cub- and orth-C3A still depend on the gypsum content. According to the XRD results, gypsum is consumed faster in the orth-C3A systems, mainly for an orth-C3A/gypsum ratio of 0.60. In the absence of gypsum, cub-C3A was found to dissolve faster than orth-C3A, releasing higher quantities of heat and producing calcium aluminate hydrate phases earlier. The different effects of gypsum on the hydration of both cub- and orth-C3A have important practical implications, indicating that the crystal structure type and quantity are key parameters to consider in optimizing calcium sulfate addition to PC clinker to ensure good workability throughout placement.

Acknowledgments

The financial support for this work by CNPq (Conselho Nacional de Desenvolvimento Científico e Tecnológico—Brazil) is gratefully acknowledged. This work was also funded by the Republic of Singapore’s National Research Foundation through a grant to the Berkeley Education Alliance for Research in Singapore (BEARS) for the Singapore-Berkeley Building Efficiency and Sustainability in the Tropics (SinBerBEST) Program. The authors also thank the laboratories of the Polytechnic School of the University of São Paulo, Laboratory of Ceramics (LACER) of Federal University of Rio Grande do Sul and PANalytical. The careful review and comments of Vanessa Rheinheimer are acknowledged.

Author Contributions

Ana Paula Kirchheim analyzed the data, conceived and designed the experiments and wrote the paper; Erich D. Rodríguez and Rupert J. Myers contributed in the data analysis and paper writing; Rui B. de Souza performed the IC and TGA experiments; Luciano A. Gobbo performed the XRD and contributed in the data analysis; Paulo J. M. Monteiro supervised the research, conceived and designed the experiments and contributed materials; Denise C. C. Dal Molin supervised the research and contributed in the data analysis; Maria Alba Cincotto supervised the research, contributed in the data analysis and paper writing.

Conflicts of Interest

The authors declare no conflict of interest.

Appendix A. Cement Chemistry Notation

  • C: CaO
  • S: SiO2
  • Al: Al2O3
  • H: H2O
  • C ¯ : CaCO3
  • S ¯ : SO3
  • OH-AFm19: C4AH(7+x) (or OH-AFm(7+x))
  • C0.5-AFm: Ca4Al2O6(CO3)0.5·11.5H2O
  • S ¯ -AFm: Ca4Al2O6(SO4)·14H2O
  • C ¯ -AFm: 3CaO·Al2O3·CaCO3·11H2O

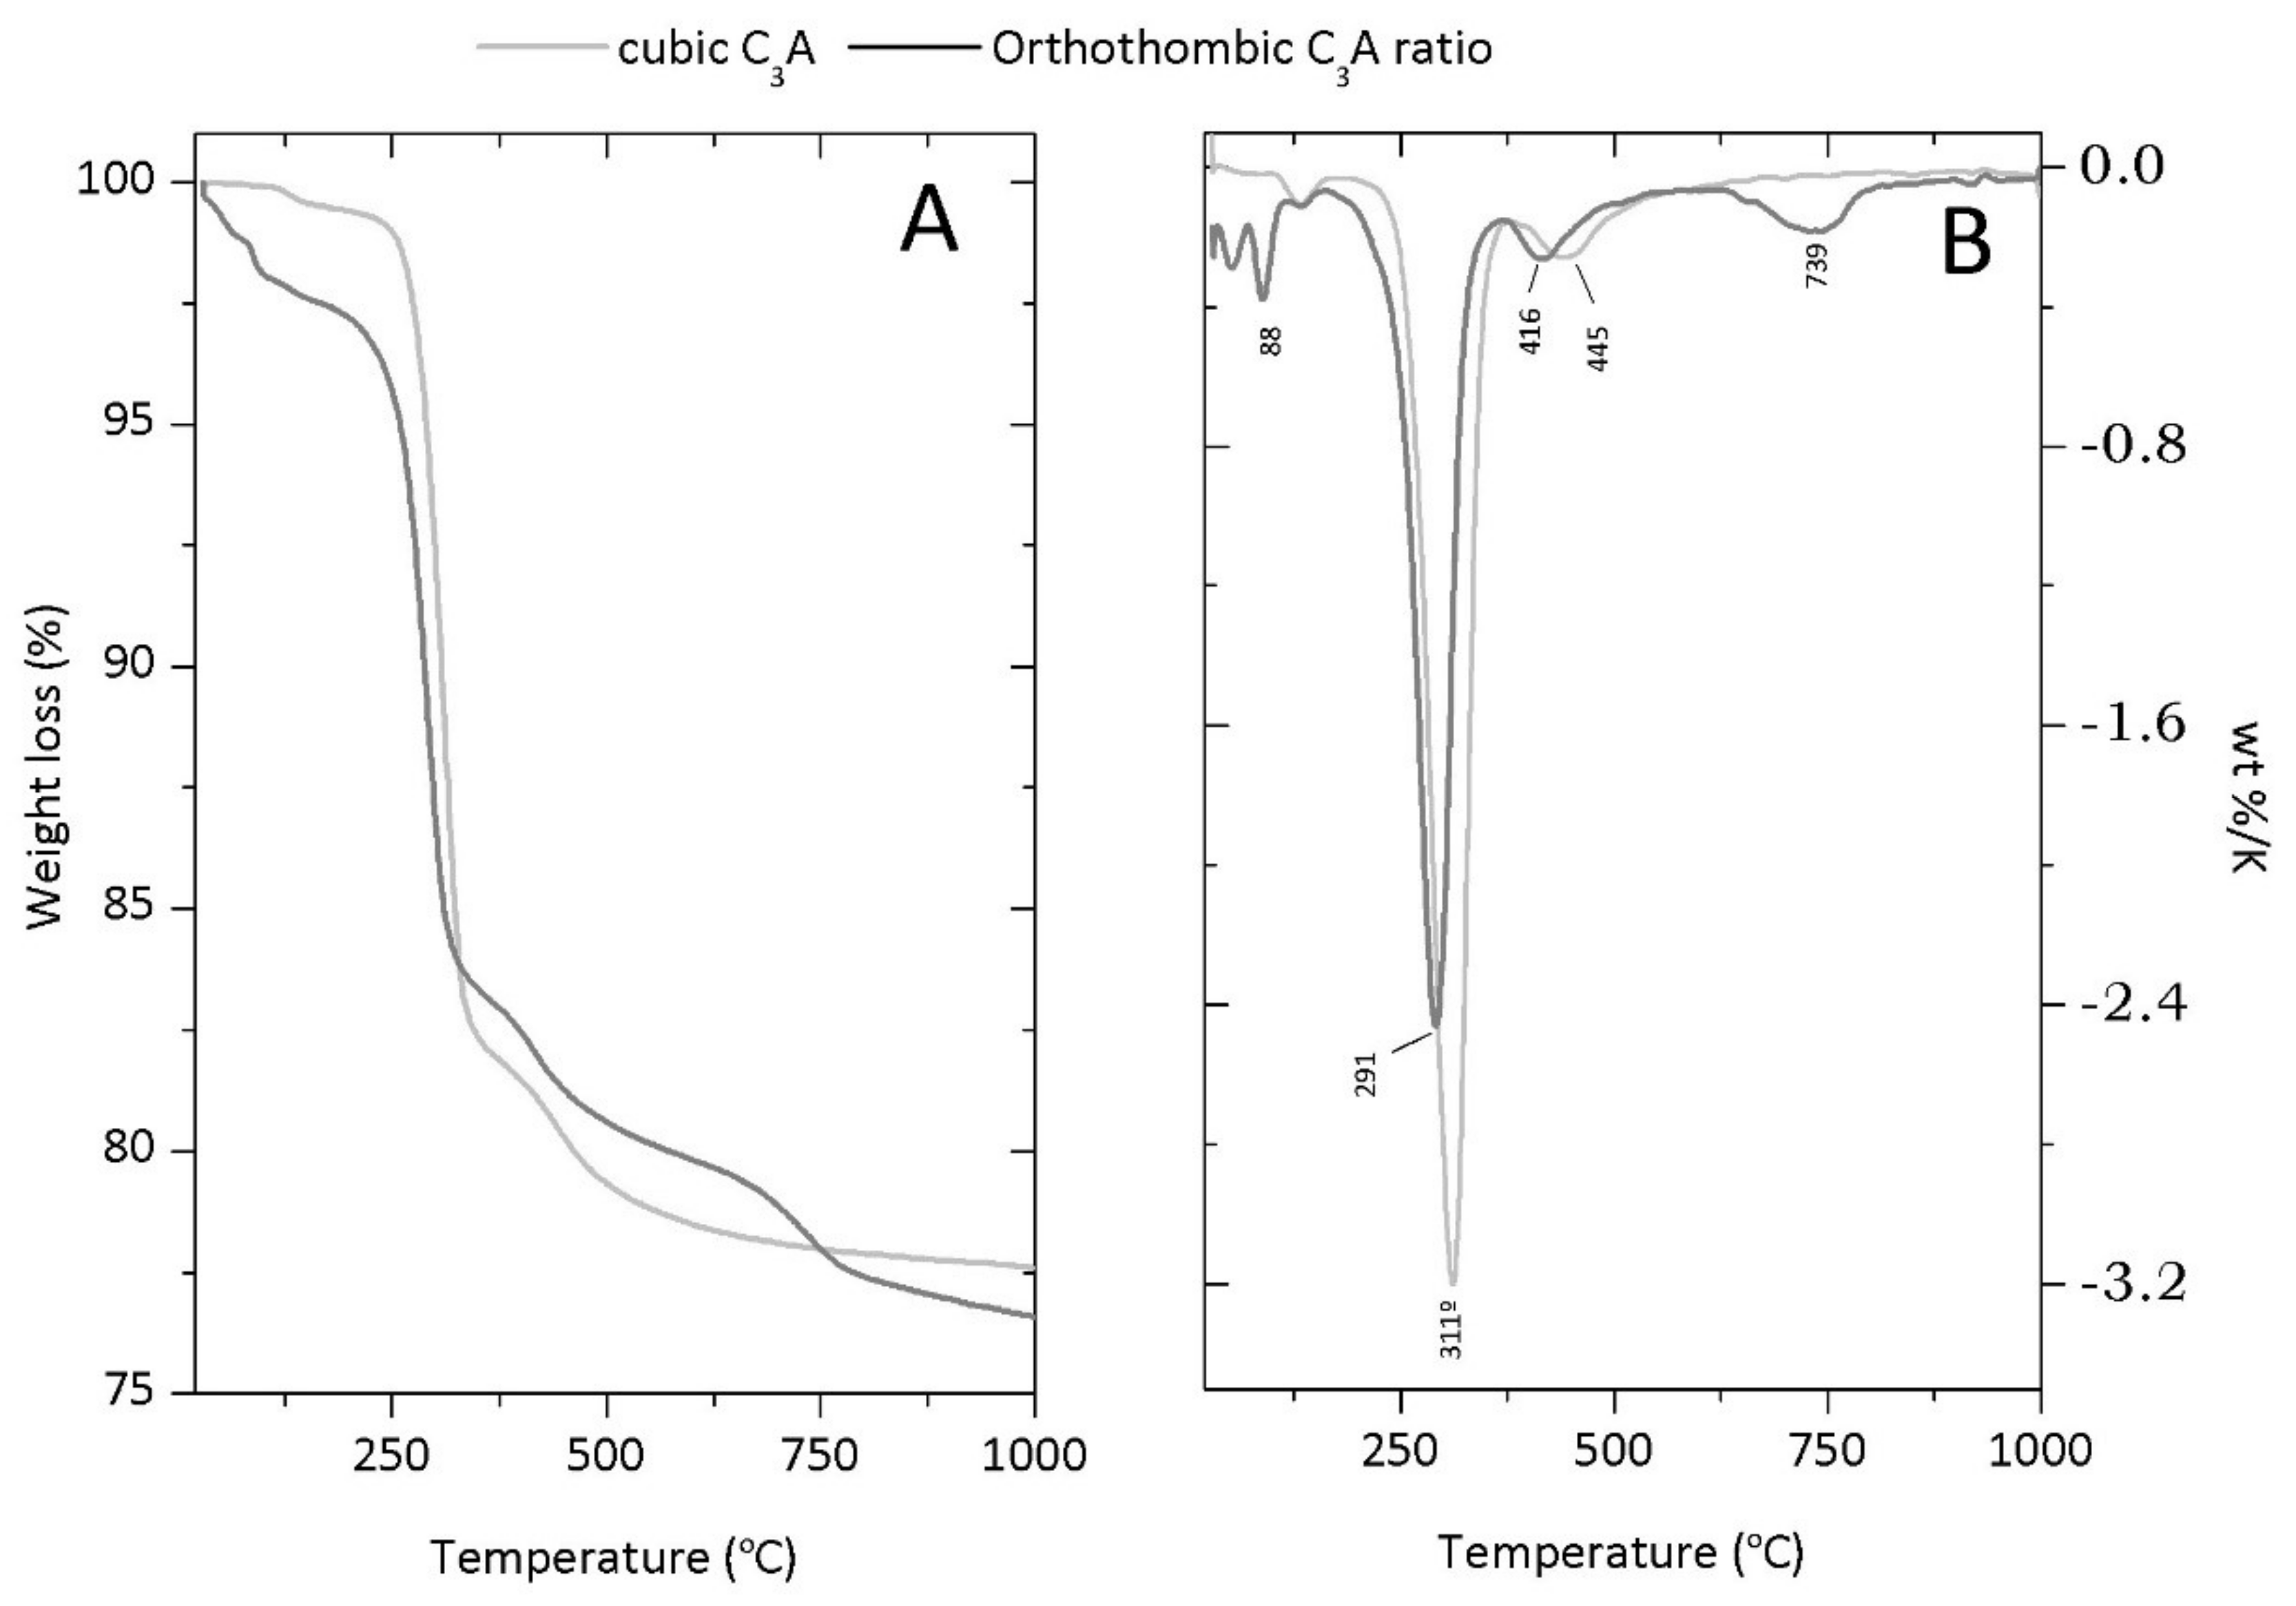
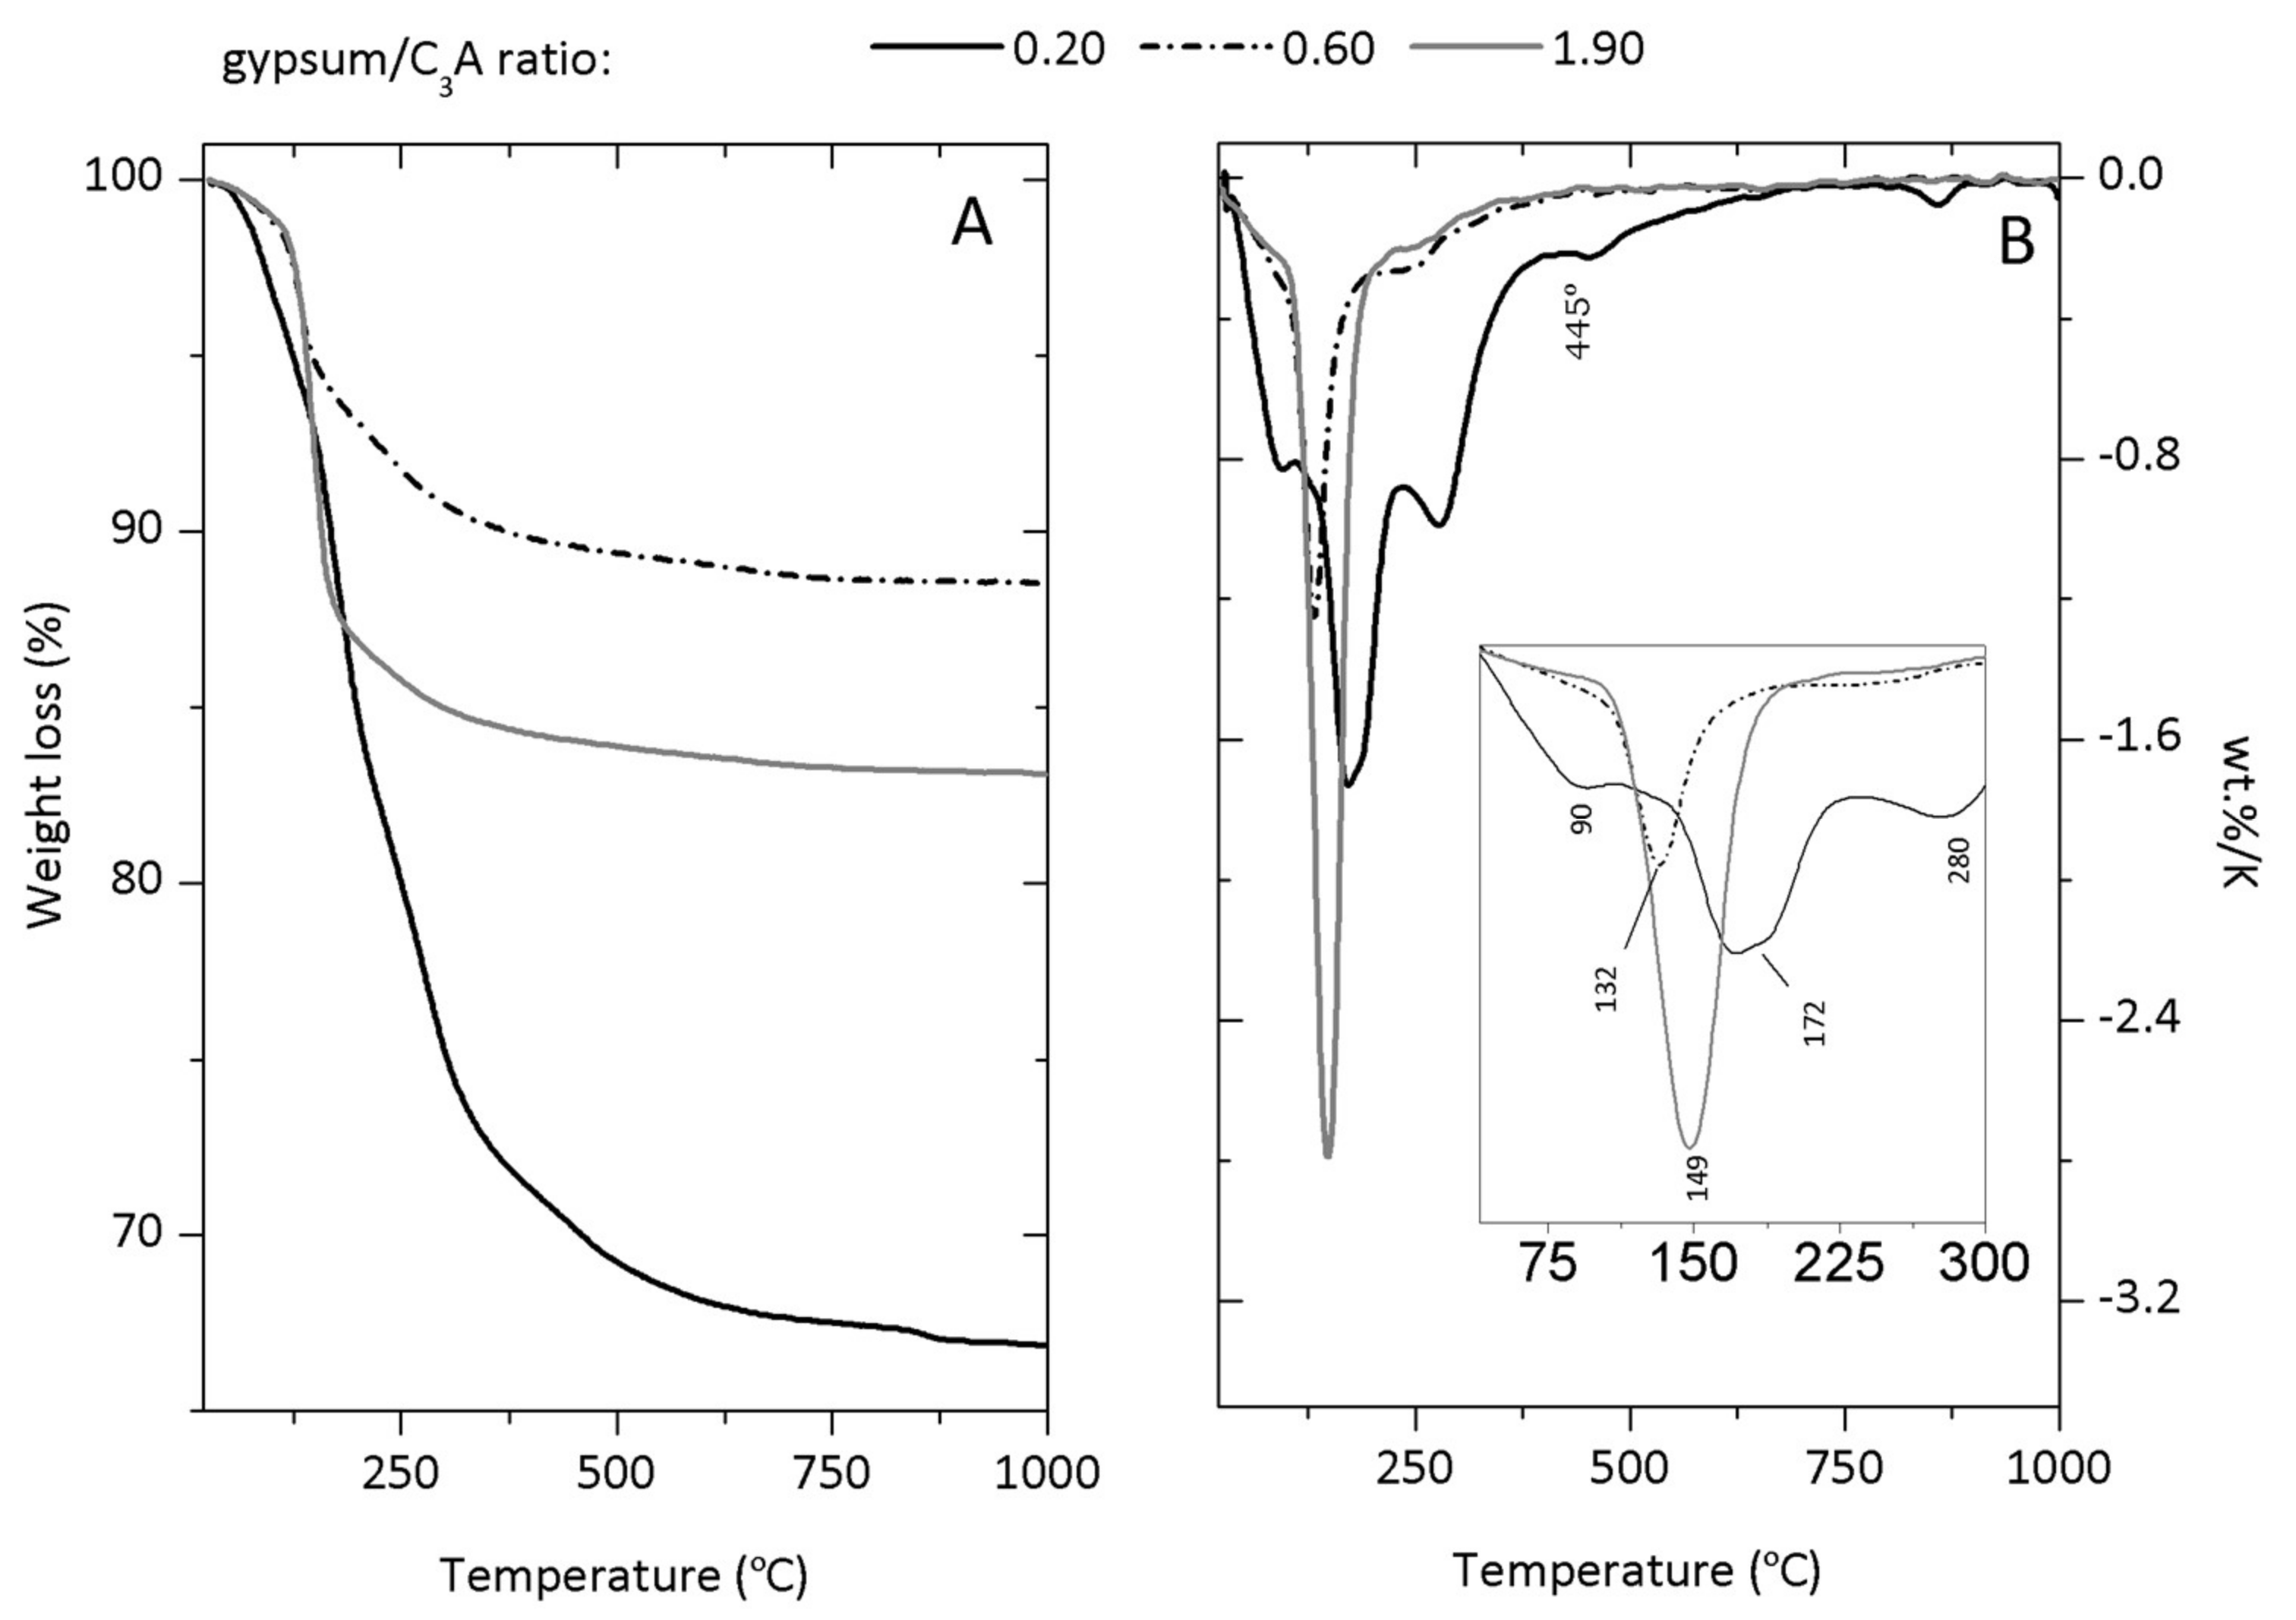
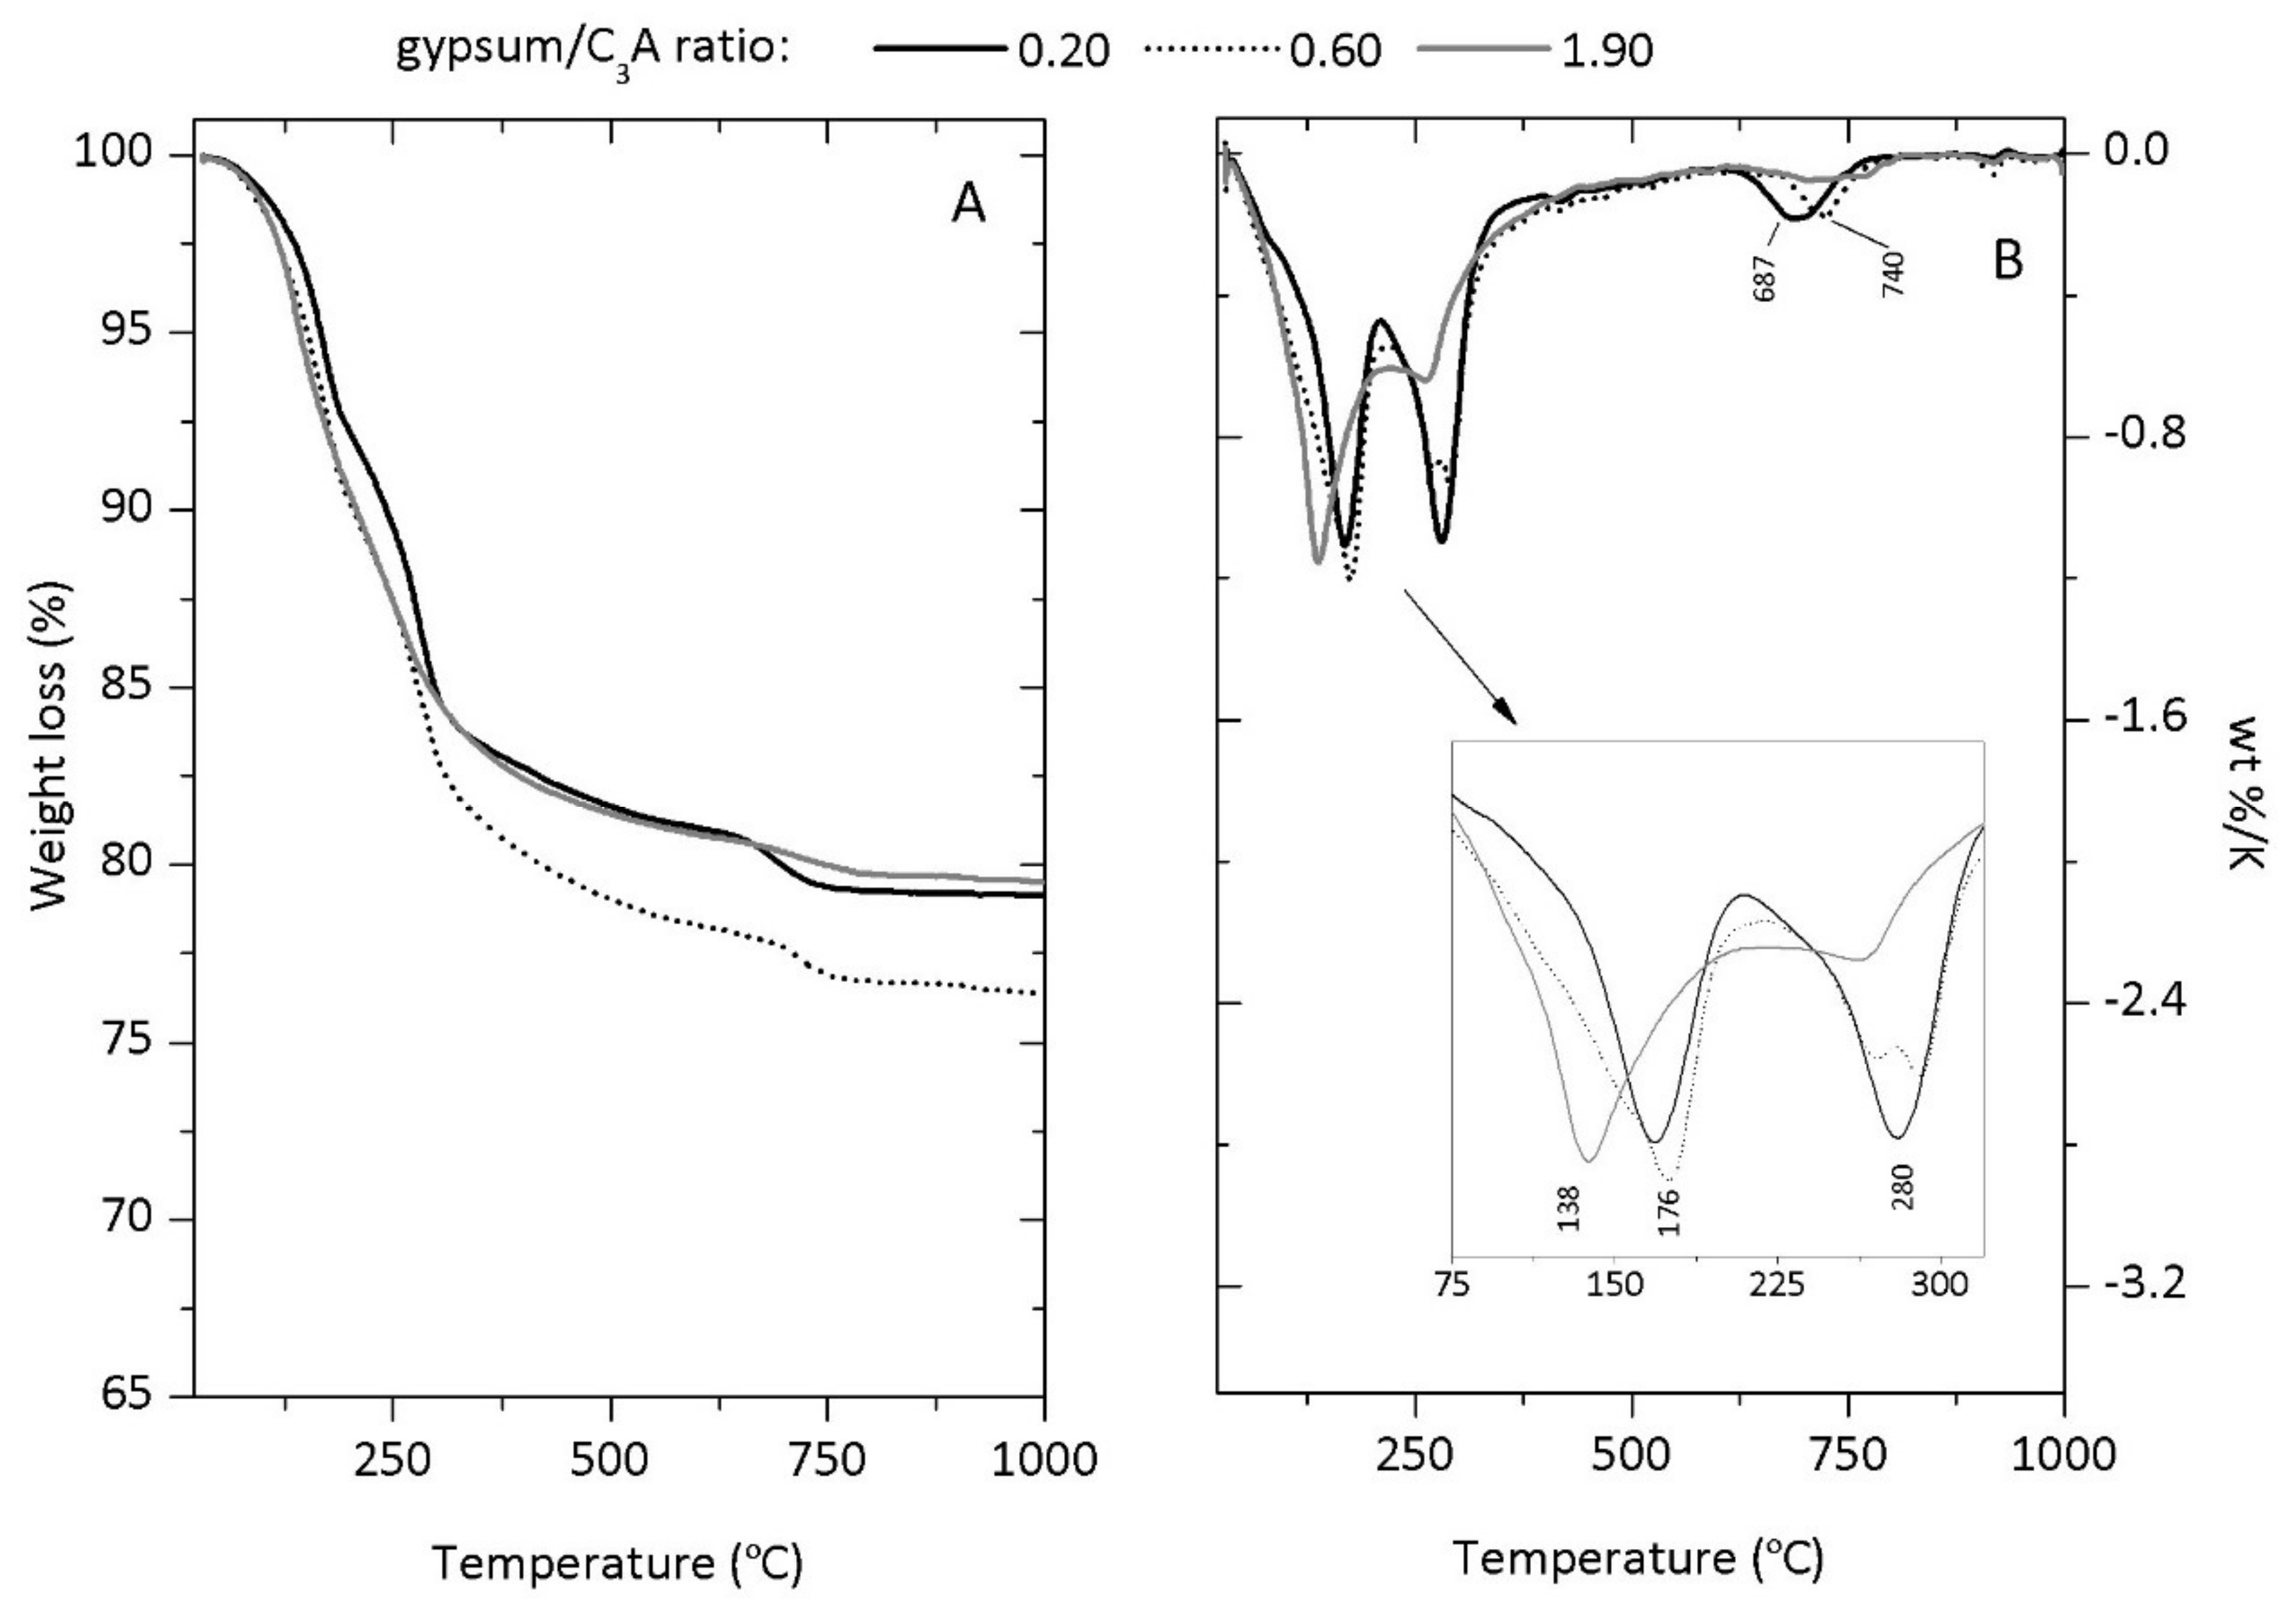
Appendix B. Thermogravimetric Analysis (TGA)

An analytical thermobalance model STA 409 PG (NETZSCH, Selb, Germany) under a flow rate of 60 mL/min of nitrogen and a heating rate of 10 °C/min up to 1000 °C was used. The unreacted C3A samples (cubic and orthorhombic) were assessed, which showed 1 wt % and 8 wt % mass loss on firing between 250 °C and 300 °C (aluminates hydrate) [41] and 650 °C (carbonates) by Thermogravimetric Analysis (TGA), consistent with the Rietveld analysis results.
To support the IC tests, the same hydrated C3A pastes samples assessed in the IC experiments were frozen at −196 °C with liquid nitrogen after being in the calorimeter for three days, kept in a freezer at −27 °C for 24 h, lyophilized for 16 h, and stored in a desiccator until analysis.
The TGA results (Figure A1) show a slight difference in the total weight loss (roughly one percent) between the cubic system and the orthorhombic system in absence of gypsum; where the hydration rate after three days of hydration can be comparable. Similar results are reported in Boikova et al. [40]. The free water evaporation is responsible for the presence of small peaks at temperatures below 100 °C. The derivative thermogravimetric analysis (DTG) results for both pastes show a strong peak between 291 °C and 311 °C due to the dehydroxylation of aluminate hydrated-type products, including OH-AFm19, C3AH6, and AH3 (at temperatures between 300 °C and 360 °C) [42,43]. The greater mass loss at approximately 300 °C for the cubic C3A sample (which exhibited a peak in the DTG with higher intensity) than for orthorhombic C3A indicates greater amount of aluminate hydrated-type products in the cubic C3A (Figure A1). These results obtained from DTG are consistent with the results previously presented for other analytical techniques (mainly the total heat released in calorimetry) where the cubic C3A in absence of gypsum exhibits a higher reactivity degree. Therefore, the DTG and XRD results for cub-C3A hydration in the absence of gypsum exhibit a higher dissolution rate and reaction than the analogous orth-C3A system. The orth-C3A paste shows a peak located at 739 °C, corresponding to decomposition of carboaluminate-type products (C0.5-AFm as was previously identified by XRD at early ages).
Figure A1. Weight loss curve profiles determined by (A) TGA and (B) DTG of hydrated pastes of Cubic and Orthorhombic samples without gypsum after three days.
Materials 11 00568 g0a1
At lower gypsum contents (0.20), the profile of the DTG curve presents three peaks between 90 °C and 280 °C. The first peak occurs at ~90 °C, which is associated with free evaporable water, the second peak at ~170 °C, along with the other peaks at 90 °C and 280 °C can be attributed to S ¯ -AFm [44]. Rheinheimer et al. [33] assessed scanning transmission X-ray microscopy (STXM) images and near edge X-ray absorption fine structure (NEXAFS) spectra of the gypsum/cub-C3A blends at a ratio of 0.20 after three days of curing, showing that this system stabilizes S ¯ -AFm as the dominate precipitate, with only a small amounts of ettringite formed.
The inclusion of gypsum modifies the kinetic of reaction (as was shown in IC), as well as the type of products formed (Figure A2). The gypsum/cub-C3A ratios of 0.20 paste showed the highest total mass loss (33.2%) for cubic C3A systems. Higher contents of gypsum (gypsum/cub-C3A ratios of 0.60 and gypsum/cub-C3A ratios of 1.90) reduce the total mass of weight by a factor of roughly two compared to its corresponding system based only with cubic-C3A (gypsum/cub-C3A ratios of 0.0), which elucidates a clear retarding effect and lower content of hydrated products formed due to the presence of gypsum. This retarding effect was also identified through the reduction of total of heat released by these systems. DTG results for cubic C3A in the presence of gypsum show one mass loss peak between 100 °C and 270 °C with a maximum intensity between 100 °C and 220 °C which correspond to the loss of hydrated water of ettringite (~140 °C) and mainly gypsum (~150–190 °C) [45,46]. The intensity of this peak is clearly related with the gypsum content where gypsum/cub-C3A ratios of 1.90 shows a mass loss of 12.6% followed by gypsum/cub-C3A ratios of 0.60 which reported a value of 6.3%. DTG results for samples with higher amount of gypsum show strong mass loss peaks at 132 °C and 149 °C, which correspond to the loss of hydrated water in ettringite [45,46], and gypsum decomposition in the system with higher content of sulfates (1.90). The characteristic double peak of gypsum corresponding to the decomposition from dihydrate to unhydrate (at temperatures between ~150–160 °C and ~190–200 °C) is not observed and might be overlapped by the dehydration of the other products.
Figure A2. Weight loss curve profiles determined by (A) TGA and (B) DTG of the effect of different gypsum contents on cubic C3A pastes.
Materials 11 00568 g0a2
The orthorhombic systems with gypsum (Figure A3) exhibited a different behavior. The differences of total mass of weight loss between the orthorhombic pastes are not higher than 15%. DTG curves for orthorhombic-C3A show three peaks whose features depend on the gypsum content. Systems with lower gypsum content (0.20) showed a combined formation of S ¯ -AFm due to the presence of two peaks located at ~175 °C and ~280 °C [44]. Considering the same authors, the peak located at 138 °C for the gypsum/orth-C3A = 0.60 and 1.90 can be attributed to ettringite. The orth-C3A samples, regardless of gypsum content, show a set of peaks between 650 °C and 780 °C, which reveals a higher susceptibility to carbonation. The XRD results are aligned with the results identified in TGA, where low contents of gypsum AFm-type phases are identified (peaks in the DTG at temperatures around ~180 °C and 280 °C). As the content of gypsum is higher regardless the type of C3A (orthorhombic or cubic) the ettringite is identified as a main hydrated product (intense peak around ~140 °C).
Figure A3. Weight loss curve profiles determined by (A) TGA and (B) DTG of different gypsum contents on orth-C3A pastes.
Materials 11 00568 g0a3

References

  1. Taylor, H.F.W. Cement Chemistry; Thomas Telford Publishing: London, UK, 1997. [Google Scholar]
  2. Scrivener, K.L.; Nonat, A. Hydration of cementitious materials, present and future. Cem. Concr. Res. 2011, 41, 651–665. [Google Scholar] [CrossRef]
  3. Bullard, J.W.; Jennings, H.M.; Livingston, R.A.; Nonat, A.; Scherer, G.W.; Schweitzer, J.S.; Scrivener, K.L.; Thomas, J.J. Mechanisms of cement hydration. Cem. Concr. Res. 2011, 41, 1208–1223. [Google Scholar] [CrossRef]
  4. Mehta, K.; Monteiro, P.J.M. Concrete. Microstructure, Properties and Materials; Metha, P.K., Monteiro, P.J.M., Eds.; McGraw-Hill: New York, NY, USA, 2005; ISBN 9788578110796. [Google Scholar]
  5. Minard, H.; Garrault, S.; Regnaud, L.; Nonat, A. Mechanisms and parameters controlling the tricalcium aluminate reactivity in the presence of gypsum. Cem. Concr. Res. 2007, 37, 1418–1426. [Google Scholar] [CrossRef]
  6. Pourchet, S.; Regnaud, L.; Perez, J.P.; Nonat, A. Early C3A hydration in the presence of different kinds of calcium sulfate. Cem. Concr. Res. 2009, 39, 989–996. [Google Scholar] [CrossRef]
  7. Samet, B.; Sarkar, L. The influence of calcium sulfate form on the initial hydration of clinkers containing different Alkali combinations. Cem. Concr. Compos. 1997, 27, 369–380. [Google Scholar] [CrossRef]
  8. Quennoz, A.; Scrivener, K.L. Hydration of C3A–gypsum systems. Cem. Concr. Res. 2012, 42, 1032–1041. [Google Scholar] [CrossRef]
  9. Uchikawa, H.; Uchida, S.; Ogawa, K.; Hanehara, S. Influence of on the initial hydration of clinker having different burning degree. Cem. Concr. Res. 1984, 14, 645–656. [Google Scholar] [CrossRef]
  10. Black, L.; Breen, C.; Yarwood, J.; Deng, C.-S.; Phipps, J.; Maitland, G. Hydration of tricalcium aluminate (C3A) in the presence and absence of gypsum—Studied by Raman spectroscopy and X-ray diffraction. J. Mater. Chem. 2006, 16, 1263. [Google Scholar] [CrossRef]
  11. Stephan, D.; Wistuba, S. Crystal structure refinement and hydration behaviour of doped tricalcium aluminate. Cem. Concr. Res. 2006, 36, 2011–2020. [Google Scholar] [CrossRef]
  12. Merlini, M.; Artioli, G.; Cerulli, T.; Cella, F.; Bravo, A. Tricalcium aluminate hydration in additivated systems. A crystallographic study by SR-XRPD. Cem. Concr. Res. 2008, 38, 477–486. [Google Scholar] [CrossRef]
  13. Lagosz, A.; Malolepszy, J.; Garrault, S. Hydration of tricalcium aluminate in the presence of various amounts of calcium sulphite hemihydrate: Conductivity tests. Cem. Concr. Res. 2006, 36, 1016–1022. [Google Scholar] [CrossRef]
  14. Meredith, P.; Donald, A.M.; Meller, N.; Hall, C. Tricalcium aluminate hydration: Microstructural observations by in-situ electron microscopy. J. Mater. Sci. 2004, 39, 997–1005. [Google Scholar] [CrossRef]
  15. Pauri, M.; Collepardi, M. Combined effect of lignosulfonate and carbonate on pure Portland clinker compounds hydration. IV. Hydration of tricalcium aluminate-sodiu oxide solid solution. Cem. Concr. Res. 1983, 13, 61–68. [Google Scholar] [CrossRef]
  16. Collepardi, M.; Baldini, G.; Pauri, M.; Corradi, M. Tricalcium aluminate hydration in the presence of lime, gypsum or sodium sulfate. Cem. Concr. Res. 1978, 8, 571–580. [Google Scholar] [CrossRef]
  17. Pauri, M.; Baldini, G.; Collepardi, M. Combined effect of lignosulfonate and carbonate on pure Portland clinker compounds hydration. II. Tricalcium aluminate hydration. Cem. Concr. Res. 1982, 12, 271–277. [Google Scholar] [CrossRef]
  18. Pourchez, J.; Grosseau, P.; Ruot, B. Current understanding of cellulose ethers impact on the hydration of C3A and C3A-sulphate systems. Cem. Concr. Res. 2009, 39, 664–669. [Google Scholar] [CrossRef] [Green Version]
  19. Dalas, F.; Pourchet, S.; Rinaldi, D.; Nonat, A.; Sabio, S.; Mosquet, M. Modification of the rate of formation and surface area of ettringite by polycarboxylate ether superplasticizers during early C3A–CaSO4 hydration. Cem. Concr. Res. 2015, 69, 105–113. [Google Scholar] [CrossRef]
  20. Brown, P.W.; Liberman, L.O.; Frohnsdorff, G. Kinetics of the Early Hydration of Tricalcium Aluminate in Solutions Containing Calcium Sulfate. J. Am. Ceram. Soc. 1984, 67, 793–795. [Google Scholar] [CrossRef]
  21. Spierging, G.A.C.M.; Stein, H.N. The influence of Na2O on the hydration of C3A. II. Suspension hydration. Cem. Concr. Res. 1976, 6, 487–496. [Google Scholar]
  22. Regourd, M.; Guinier, A. Cristallochimie des constituants du clinker de ciment Portland. Rev. Des. Mater. Constr. 1975, 201–221. [Google Scholar]
  23. Manzano, H.; Dolado, J.S.; Ayuela, A. Structural, Mechanical, and Reactivity Properties of Tricalcium Aluminate Using First-Principles Calculations. J. Am. Ceram. Soc. 2009, 92, 897–902. [Google Scholar] [CrossRef]
  24. Fukuda, K.; Inoue, S.; Yoshida, H. Cationic substitution in tricalcium aluminate. Cem. Concr. Res. 2003, 33, 1771–1775. [Google Scholar] [CrossRef]
  25. Shin, G.Y.; Glasser, F.P. Interdependence of sodium and potassium substitution in tricalcium aluminate. Cem. Concr. Res. 1983, 13, 135–140. [Google Scholar] [CrossRef]
  26. Goetz-neunhoeffer, F.; Neubauer, J. Crystal Structure refinement of Na-substituted C3A by Rietveld analysis and quantification in OPC. In Proceedings of the 10th International Congress on the Chemistry of Cement, Gothenburg, Sweden, 2–6 June 1997; Volume 1. [Google Scholar]
  27. Gobbo, L.; Sant’Agostino, L.; Garcez, L. C3A polymorphs related to industrial clinker alkalies content. Cem. Concr. Res. 2004, 34, 657–664. [Google Scholar] [CrossRef]
  28. Kirchheim, A.P.; Dal Molin, D.C.; Fischer, P.; Emwas, A.-H.; Provis, J.L.; Monteiro, P.J.M. Real-time high-resolution X-ray imaging and nuclear magnetic resonance study of the hydration of pure and Na-doped C3A in the presence of sulfates. Inorg. Chem. 2011, 50, 1203–1212. [Google Scholar] [CrossRef] [PubMed]
  29. Glasser, F.P.; Marinho, M.B. Early stages of the hydration of tricalcium aluminate and its sodium-containing solid solution. Proc. Br. Ceram. Soc. 1984, 35, 221–236. [Google Scholar]
  30. Kirchheim, A.P.; Fernàndez-Altable, V.; Monteiro, P.J.M.; Dal Molin, D.C.C.; Casanova, I. Analysis of cubic and orthorhombic C3A hydration in presence of gypsum and lime. J. Mater. Sci. 2009, 44, 2038–2045. [Google Scholar] [CrossRef]
  31. Stephan, D.; Wistuba, S. Crystal structure refinement and hydration behaviour of 3CaO·SiO2 solid solutions with MgO, Al2O3 and Fe2O3. J. Eur. Ceram. Soc. 2006, 26, 141–148. [Google Scholar] [CrossRef]
  32. Alonso, M.M.; Puertas, F. Adsorption of PCE and PNS superplasticisers on cubic and orthorhombic C3A. Effect of sulfate. Constr. Build. Mater. 2015, 78, 324–332. [Google Scholar] [CrossRef]
  33. Rheinheimer, V.; Chae, S.; Geng, G.; Monteiro, P.; Kirchheim, A.; Rodríguez, E. A Scanning Transmission X-ray Microscopy Study of Cubic and Orthorhombic C3A and Their Hydration Products in the Presence of Gypsum. Materials 2016, 9, 745. [Google Scholar] [CrossRef] [PubMed]
  34. Myers, R.J.; Geng, G.; Rodriguez, E.D.; da Rosa, P.; Kirchheim, A.P.; Monteiro, P.J.M. Solution chemistry of cubic and orthorhombic tricalcium aluminate hydration. Cem. Concr. Res. 2017, 100, 176–185. [Google Scholar] [CrossRef]
  35. Regourd, M.; Hornain, H. Hydratation de C3A dans des mélanges synthétiques et dans des ciments portland industriels. In Proceedings of the 7th International Congress on the Chemistry of Cement (ICCC), Paris, France, 30 June–5 July 1980; pp. 477–482. [Google Scholar]
  36. Chipera, S.J.; Bish, D.L. Fitting Full X-Ray Diffraction Patterns for Quantitative Analysis: A Method for Readily Quantifying Crystalline and Disordered Phases. Adv. Mater. Phys. Chem. 2013, 3, 47–53. [Google Scholar] [CrossRef]
  37. Dubina, E.; Plank, J.; Black, L. Impact of water vapour and carbon dioxide on surface composition of C3A polymorphs studied by X-ray photoelectron spectroscopy. Cem. Concr. Res. 2015, 73, 36–41. [Google Scholar] [CrossRef]
  38. Christensen, A.N.; Jensen, T.R.; Scarlett, N.V.Y.; Madsen, I.C.; Hanson, J.C. Hydrolysis of Pure and Sodium Substituted Calcium Aluminates and Cement Clinker Components Investigated by in Situ Synchrotron X-ray Powder Diffraction. J. Am. Ceram. Soc. 2004, 87, 1488–1493. [Google Scholar] [CrossRef]
  39. Myers, R.J.; Geng, G.; Li, J.; Rodríguez, E.D.; Ha, J.; Kidkhunthod, P.; Sposito, G.; Lammers, L.N.; Kirchheim, A.P.; Monteiro, P.J.M. Role of Adsorption Phenomena in Cubic Tricalcium Aluminate Dissolution. Langmuir 2016. [Google Scholar] [CrossRef] [PubMed]
  40. Boikova, A.I.; Domansky, A.I.; Paramonova, V.A.; Stavitskaja, G.P.; Nikushchenko, V.M. The influence of Na2O on the structure and properties of 3CaO·Al2O3. Cem. Concr. Res. 1977, 7, 483–492. [Google Scholar] [CrossRef]
  41. Ramachandran, V.S.; Beaudoin, J.J. Handbook of Analytical Techniques in Concrete Science and Technology, 1st ed.; William Andrew: New York, NY, USA, 2000; ISBN 0815514379. [Google Scholar]
  42. Radwan, M.M.; Heikal, M. Hydration characteristics of tricalcium aluminate phase in mixes containing β-hemihydate and phosphogypsum. Cem. Concr. Res. 2005, 35, 1601–1608. [Google Scholar] [CrossRef]
  43. Lothenbach, B.; Durdziński, P.; De Weerdt, K. Chapter 5: Thermogravimetric analysis. In A Practical Guide to Microstructural Analysis of Cementitious Materials; Scrivener, K., Snellings, R., Lothenbach, B., Eds.; CRC Press; Taylor & Francis Group: Boca Raton, FL, USA, 2015; pp. 178–208. ISBN 978-1-4987-3867-5. [Google Scholar]
  44. Scrivener, K.; Snellings, R.; Lothenbach, B. A Practical Guide to Microstructural Analysis of Cementitious Materials; RC Press: Boca Raton, FL, USA, 2016; ISBN 9781498738675. [Google Scholar]
  45. Möschner, G.; Lothenbach, B.; Winnefeld, F.; Ulrich, A.; Figi, R.; Kretzschmar, R. Solid solution between Al-ettringite and Fe-ettringite (Ca6[Al1−xFex(OH)6]2(SO4)3·26H2O). Cem. Concr. Res. 2009, 39, 482–489. [Google Scholar] [CrossRef]
  46. Borrachero, M.V.; Payá, J.; Bonilla, M.; Monzó, J. The use of thermogravimetric analysis technique for the characterization of construction materials. J. Therm. Anal. Calorim. 2008, 91, 503–509. [Google Scholar] [CrossRef]
Figure 1. X-ray diffractograms for the un-reacted materials. (A) Cub-C3A; (B) Orth-C3A; and (C) Gypsum.
Materials 11 00568 g001
Figure 2. In situ X-ray diffraction (XRD) results for (A) cub-C3A and (B) orth-C3A hydration without gypsum. OH-AFm19 = C4AH19; C0.5-AFm = calcium hemicarboaluminate hydrate; AH3 = gibbsite; k = katoite (C3AH6); c-C = cub-C3A; and o-C = orth-C3A.
Materials 11 00568 g002
Figure 3. In situ XRD results of cub-C3A and gypsum hydration at gypsum/cub-C3A ratios of (A) 0.20; (B) 0.60; and (C) 1.90. c-C = cub-C3A, E = ettringite, G = gypsum, OH-AFm = C4AH19; C0.5-AFm = hemicarboaluminate; S ¯ -AFm = monosulfoaluminate.
Materials 11 00568 g003aMaterials 11 00568 g003b
Figure 4. In situ XRD results of orth-C3A and gypsum hydration at gypsum/orth-C3A ratios of (A) 0.20; (B) 0.60; and (C) 1.90. o-C = orth-C3A, E = ettringite, G = gypsum, OH-AFm = C4AH19; k = katoite (C3AH6), C0.5-AFm = calcium hemicarboaluminate hydrate; S ¯ -AFm = monosulfoaluminate.
Materials 11 00568 g004aMaterials 11 00568 g004b
Figure 5. Reference intensity ratio (RIR) analysis of cub-C3A hydration with gypsum/C3A ratios of (A) 0.20; (B) 0.60; and (C) 1.9, and orth-C3A hydration with gypsum/C3A ratios of (D) 0.20; (E) 0.60; and (F) 1.9.
Materials 11 00568 g005
Figure 6. Rates of heat evolution (top) and cumulative heat (bottom) for (A) cub- and (B) orth-C3A hydration in the presence and absence of gypsum.
Materials 11 00568 g006

