Article

Study of PtOx/TiO2 Photocatalysts in the Photocatalytic Reforming of Glycerol: The Role of Co-Catalyst Formation

1
Institute of Materials and Environmental Chemistry, Research Centre for Natural Sciences, Hungarian Academy of Sciences, Magyar tudósok körútja 2, H-1117 Budapest, Hungary
2
NMR Research Group, Research Centre for Natural Sciences, Hungarian Academy of Sciences, Magyar tudósok körútja 2, H-1117 Budapest, Hungary
3
National Council of Research—CNR-ITAE, “Nicola Giordano”, Via S. Lucia 5, 98126 Messina, Italy
*
Author to whom correspondence should be addressed.
Materials 2018, 11(10), 1927; https://doi.org/10.3390/ma11101927
Submission received: 17 August 2018 / Revised: 21 September 2018 / Accepted: 2 October 2018 / Published: 10 October 2018
(This article belongs to the Special Issue Supported Materials for Catalytic Application)

Abstract

:
In this study, relationships between preparation conditions, structure, and activity of Pt-containing TiO2 photocatalysts in photoinduced reforming of glycerol for H2 production were explored. Commercial Aerolyst® TiO2 (P25) and homemade TiO2 prepared by precipitation-aging method were used as semiconductors. Pt co-catalysts were prepared by incipient wetness impregnation from aqueous solution of Pt(NH3)4(NO3)2 and activated by calcination, high temperature hydrogen, or nitrogen treatments. The chemico-physical and structural properties were evaluated by XRD, 1H MAS NMR, ESR, XPS, TG-MS and TEM. The highest H2 evolution rate was observed over P25 based samples and the H2 treatment resulted in more active samples than the other co-catalyst formation methods. In all calcined samples, reduction of Pt occurred during the photocatalytic reaction. Platinum was more easily reducible in all of the P25 supported samples compared to those obtained from the more water-retentive homemade TiO2. This result was related to the negative effect of the adsorbed water content of the homemade TiO2 on Pt reduction and on particle growth during co-catalyst formation.

1. Introduction

Hydrogen is an important secondary energy source of the future [1,2,3] because it can be used in an environmentally friendly manner [4,5,6] and its chemical energy can be transformed to electricity very effectively by means of fuel cells. Photocatalytic hydrogen production is a promising approach for transforming solar energy into chemical energy for storage [7]. Recent efforts indicate that photo-induced reforming of alcohols on semiconducting oxides in the presence of water may be an efficient way of solar energy based hydrogen generation [8,9]. If the alcohol is obtained from biomass, a nearly closed carbon loop is possible as CO2 formed during the reforming reaction may be consumed for the source biomass growth. Since the photo-induced reforming is not restricted to simple alcohols, and considering that the increasing production of bio-diesel is accompanied with increasing production of glycerol by-product, the use of glycerol as feedstock of photocatalytical reforming reaction would be an exciting possibility [10] (1):
C 3 H 8 O 3 + 3 H 2 O Photocatalyst UV - Vis   irradiation 3 CO 2 + 7 H 2  
Upon using aqueous solutions of glycerol at ambient conditions in the presence of Pt/TiO2 photocatalysts and a solar light-simulating source, it has been concluded that glycerol photoreforming may provide an efficient and low cost method for the production of renewable hydrogen [11]. While the conversion of the glycerol in the photocatalytic reforming reaction is of one or two-orders of magnitude less than that of other glycerol reforming systems at this moment, above reaction is widely studied and used as a model reaction to compare photocatalysts [12,13].
In any hydrogen-producing photocatalytic reaction, regardless of whether photocatalytic reforming of alcohols or overall water splitting is involved, significant activity can only be achieved if a proper co-catalyst is present on the semiconductor [14]. Consequently, the activity determining factors for these photocatalysts are the nature of the semiconductor, the co-catalyst, and the interaction between them.
Regarding the photocatalysts, TiO2-based materials are among the most frequently used ones because of their good stability and efficiency [15,16,17,18]. Different types of methods (sol-gel [19], precipitation [20], flame spray pyrolysis [21,22], etc.) are widely applied for preparation of TiO2. However, TiO2 samples from different sources show very different photocatalytic activities [23] as specific surface area [24], morphology [25], size of nanoparticles [26,27], rutile/anatase/brookite ratio [24,28], vacancy structure [29], type and amount of surface OH groups [30], etc. are different and are all able to influence the photocatalytic behavior.
Regarding the co-catalyst, the activity of TiO2 in a photoinduced reforming reaction can be increased with at least an order of magnitude in its presence [12,31,32,33]. The advantages of the co-catalysts can be attributed to the reduced charge recombination as a result of promoted charge separation and transport driven by junctions/interfaces [12,34]. Another important role of the co-catalyst is to provide reaction sites for elementary reaction steps subsequent to light absorption, such as the formation of molecular hydrogen and its desorption from the surface [12,34]. Metal nanoparticles, especially those containing Pt, are very effective co-catalysts for H2 production [12,31,35].
In order to load metal nanoparticles on the surface of the semiconductors, several different methods are available. Commonly used techniques include in situ photodeposition [36,37] and deposition of pre-prepared metal colloids [38,39]. A traditional way for preparing supported metal nanoparticles is impregnation with the appropriate metal precursor followed by high temperature heat treatment in hydrogen [40]. Calcination of the metal precursor loaded on semiconductors by incipient wetness impregnation has also resulted in effective co-catalysts for H2 production in the methanol photocatalytic reforming reaction [29,41]. In case of co-catalyst formation by calcination, in situ reduction of platinum has been found during the photoinduced H2 production from methanol-water reaction mixture [29,42]. Processes such as the effect of the irradiation, reduction by the reactant (methanol) and/or by the reaction product (in situ formed hydrogen) were considered as possible reasons of the reduction of the calcined photocatalysts under the reaction conditions [29].
The most frequently applied commercially available platinum precursors are chloroplatinic acid hexahydrate (H2PtCl6·6H2O) [43,44,45], tetraammineplatinum(II) chloride hydrate (Pt(NH3)4Cl2·H2O) [46,47], platinum acetylacetonate (Pt(C5H7O2)2) [44,48], and tetraammineplatinum(II) nitrate (Pt(NH3)4(NO3)2 [49,50,51,52]. Nowadays, the latter is increasingly used because of its high solubility in water and because it allows the formation of small platinum nanoparticles on the support; furthermore, all ligands can be removed from it upon heating the Pt(NH3)4(NO3)2 impregnated sample. Accordingly, Pt(NH3)4(NO3)2 is the metal precursor used for synthesis of heterogeneous catalytic systems active in reforming n-hexane [53], ethylene glycol [54], methane [55], hydrodeoxygenation of 5-hydroxymethylfurfural [56], deoxygenation of fatty acids and their esters [49], reverse water gas shift reaction [57], Fischer-Tropsch synthesis [51], hydrogenolysis of glycerol [52], etc.
However, in order to obtain supported metal particles with suitable size for a catalytic reaction, an appropriate decomposition procedure of the metal precursor is necessary. Specifically, thermal decomposition of Pt(NH3)4(NO3)2 was studied from the early times [58] and decomposition of the [Pt(NH3)4]2+ ion introduced into zeolites by ion exchange or impregnation was also studied in detail [59,60,61,62,63,64,65,66]. In case of zeolites, water has been found to play a decisive role in the decomposition of the metal precursor. Based on UV spectroscopic studies, possible formation of [Pt(NH3)(H2O)x]2+ has been suggested in the first step of oxidative decomposition of [Pt(NH3)4]2+ in HZSM-5 [62]. Based on temperature programmed reduction (TPR) and re-oxidation results, it has been concluded that Pt2+ ions after losing their NH3 ligands react with H2O leading to PtO microcrystallites in NaY [60]. It has also been found that small Pt particle size and narrow particle size distribution is obtained in zeolites only by the use of very slow (e.g., 0.1–0.2 °C/min) heating rates during the calcination before the final hydrogen treatment. When [Pt(NH3)4]2+ was loaded on a mesoporous support, the Pt dispersion was less sensitive to the calcination heating rate [66] due to the higher desorption rate of ammonia and water from it compared to that from the zeolite microporous structure. Literature studies report that, upon using inert atmosphere during the decomposition of [Pt(NH3)4]2+ in zeolites, auto-reduction of platinum occurs [59,62] and the Brønsted acid sites can react with the liberated ammonia [62,63].
In case of the Al2O3 support, it has been found that ammonia ligands adsorb on the acid sites of the surface after breaking of the Pt2+-N coordinative bonds and they remain there until the temperature is high enough to allow desorption from the strongly acid sites [67]. Based on mass spectrometry data, it has been suggested that ammine complex disruption, ammonia evolution, and Pt2+ reduction are three separate processes that do not take place simultaneously. It has been also found that the direct reduction of [Pt(NH3)4]2+ on alumina at 350 °C yields the biggest metal particles (35 Å), while calcination before reduction produces a much higher dispersion (metal particle diameter 10 Å) [67].
When Pt/silica catalysts are prepared by adsorption of [Pt(NH3)4]2+ from strongly basic impregnation solutions, hydroxyl groups of silica are deprotonated, and platinum containing cations are readily deposited on the support, via strong electrostatic adsorption (SEA) [68]. It has been found that the pH not only determines the amount of adsorbed Pt, but also influences the particle size of the reduced catalyst. The highest dispersion is obtained at lower Pt loading and drying in air at 100 °C, followed by reduction in H2 at 250 °C [68]. While the SEA approach seems to be more effective method for the preparation of highly dispersed silica supported platinum than the incipient wetness method, the latter is also successful at low metal loads (0.5–1%) [68]. By means of combination of HRTEM, mass spectrometry, and Quick EXAFS, Oudenhuijzen and coworkers have explored the reactions taking place under Pt(NH3)4(NO3)2 decomposition in different gas flows such as H2, O2 and Ar/He [69]. They have reported that autoreduction of silica supported Pt(NH3)4(NO3)2 in inert atmosphere results in metal-particle size smaller than that obtained by hydrogen reduction or by hydrogen reduction after calcination [69]. They described that the key to making the smallest particles with the narrowest particle-size distribution is to avoid the formation of mobile species able to precipitate as metal clusters [69].
During the preparation of high-surface-area carbon black supported platinum electrocatalysts with 60% Pt content, the use of Pt(NH3)2(NO3)2 resulted in larger particle size than H2PtCl6 [70]. At the same time, a strong exothermic effect has been observed during the decomposition of Pt(NH3)2(NO3)2 [70], which probably was not obvious at low metal load [69].
The aim of this work was to explore the main relationships between the structural properties of PtOx/TiO2 photocatalysts and their photocatalytic behavior in the glycerol photocatalytic reforming reaction. Several different PtOx/TiO2 photocatalysts were prepared using Pt(NH3)2(NO3)2 precursor by exploiting different co-catalyst formation methods such as reduction by high temperature hydrogen treatment, autoreduction in inert atmosphere (nitrogen), and calcination in air. Two different types of TiO2 were used as support.
In analyzing the results, the attention was focused on the platinum chemical state in the co-catalyst as well as on the co-catalyst-TiO2 interaction. In order to obtain more information about the real working catalyst, chemico-physical characterization results of fresh and recovered samples were compared.

2. Materials and Methods

2.1. Materials

Titanium-isopropoxide (≥97.0%, Sigma-Aldrich Inc., St. Louis, MO, USA) was used for the synthesis of homemade TiO2. Aerolyst® TiO2 (P25, Evonik, Essen, Germany) was also used as semiconductor. The Pt(NH3)4(NO3)2 platinum precursor was supplied by Sigma-Aldrich Inc. (St. Louis, MO, USA). Glycerol (99%), 2-propanol and HNO3 (65%) were products of Molar Chemicals Ltd. (Budapest, Hungary. Hydrofluoric acid (38%) and boric acid were products of Reanal (Budapest, Hungary). Absolute ethanol was purchased from VWR International (Fontenay-sous-Bois, France). Double distilled water (18 MΩ) was used for the synthesis of photocatalysts and for preparation of glycerol solution. The gases (H2, N2, Ar) used in this work were products of Linde Gáz Magyarország Zrt. (Budapest, Hungary) with 5.0 purity. Special mixture of 5% H2 in N2 for calibration of GC was bought from Messer Hungarogáz Ltd. (Budapest, Hungary).

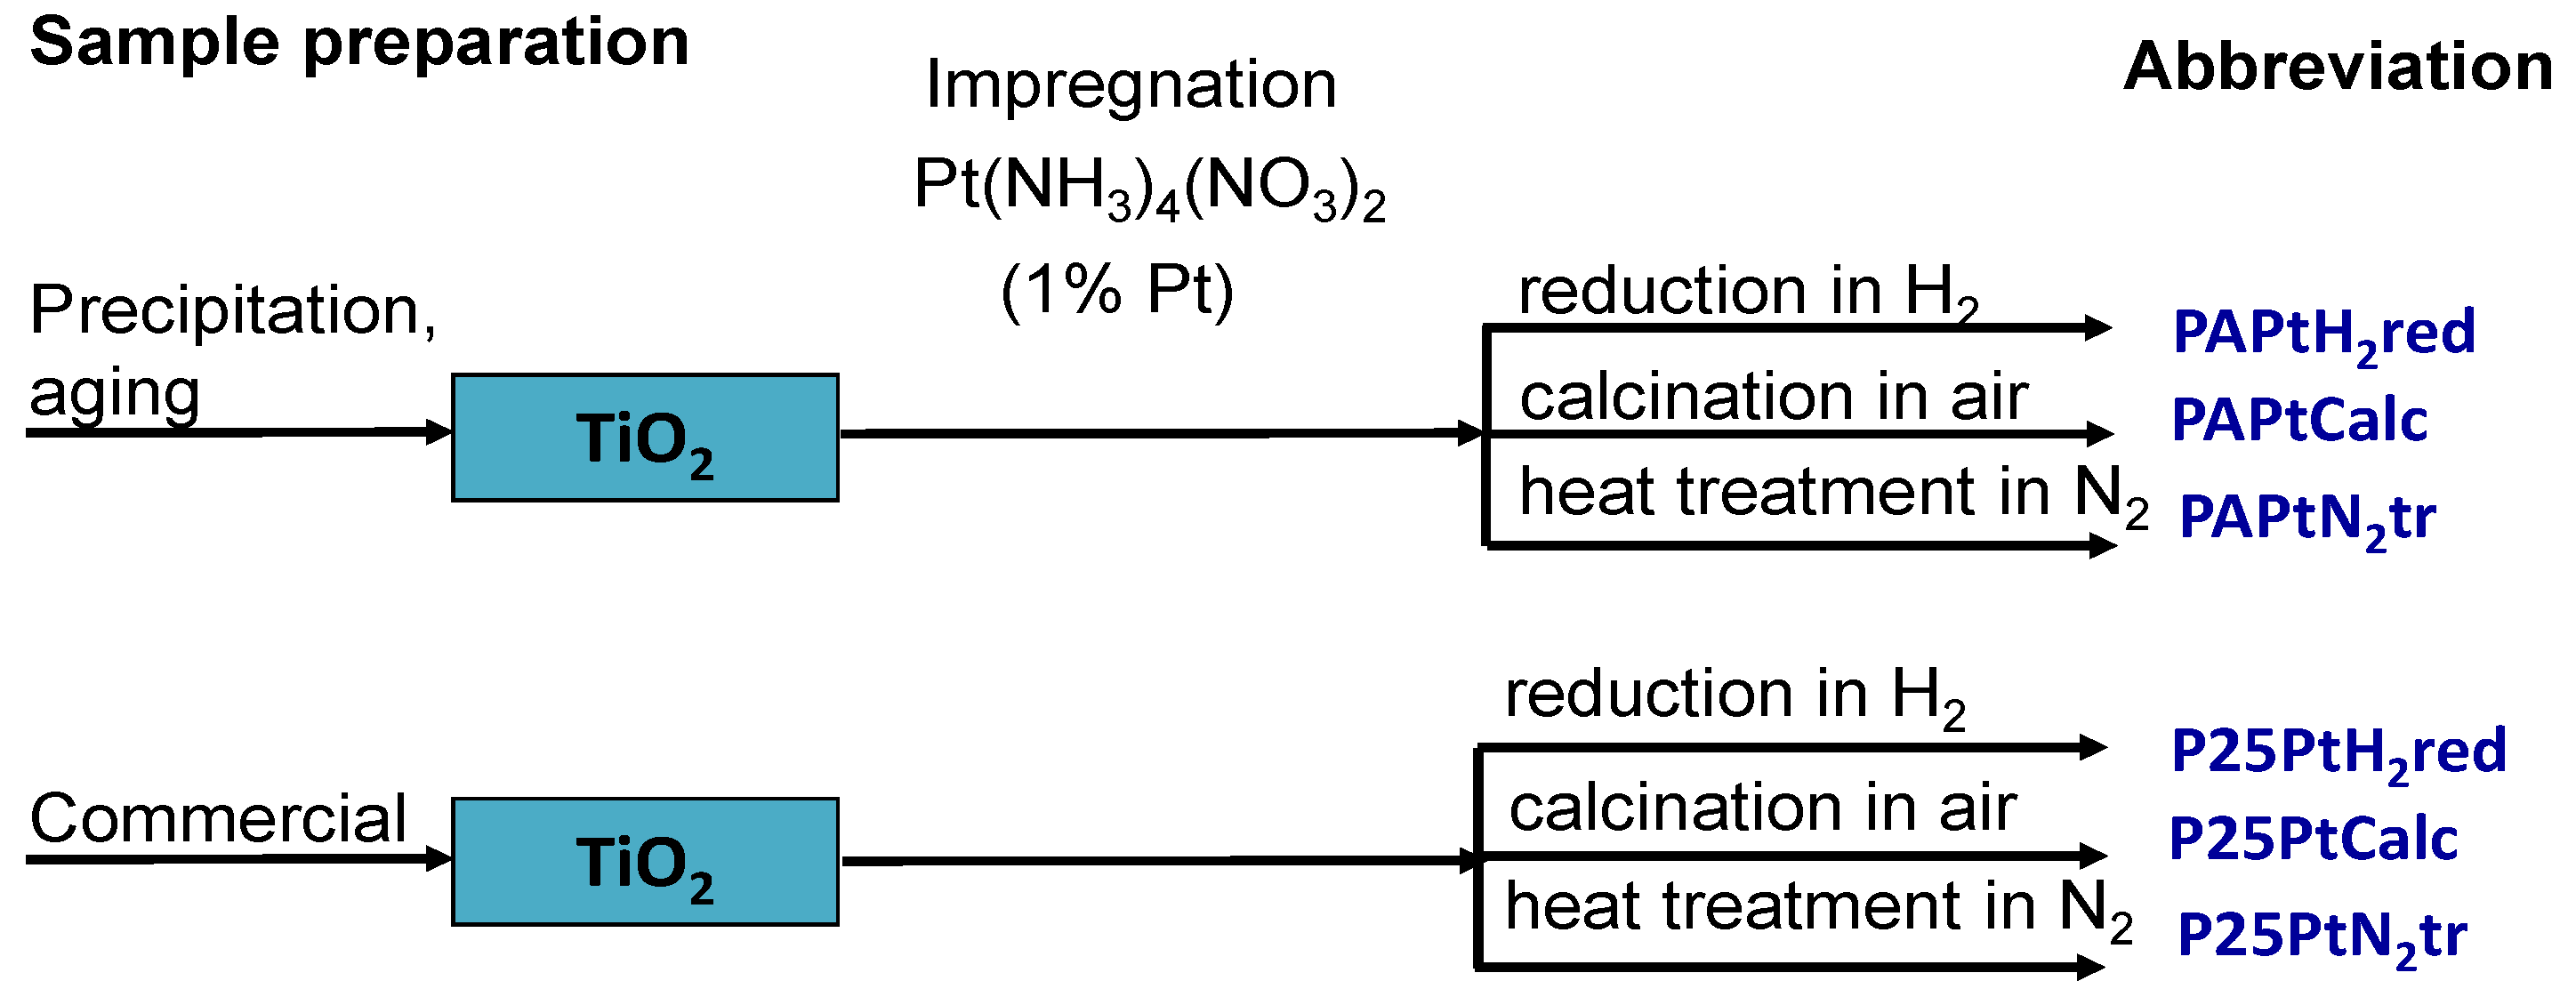
2.2. Synthesis of Photocatalysts

The homemade TiO2 was prepared by the precipitation-aging method during which typically 3.5 cm3 titanium-isopropoxide was added dropwise to 95 cm3 aqueous solution of HNO3 (3.5%) with continuous agitation to obtain transparent TiO2 sol. The synthesis mixture was stirred for 4 days, then it was heated up to 65 °C in order to evaporate the solvent under continuous stirring. Finally, the powder was dried in an oven overnight at 80 °C followed by calcination at 400 °C. The abbreviated name of this TiO2 was PA. The P25 TiO2 was used for impregnation without further treatment.
Platinum was introduced from aqueous solution of Pt(NH3)4(NO3)2 by incipient wetness impregnation. The nominal platinum load was 1 wt %. The treatments of dried samples were: (i) Calcination for 1 h at 300 °C in air after heating up to 300 °C with 1 °C/min heating rate (PtCalc samples); (ii) reduction for 1 h at 400 °C in H2 flow by using a heating rate of 5 °C/min after heating up in N2 to 150 °C with β = 5 °C/min (PtH2red samples); and (iii) treatment for 1 h at 400 °C in N2 flow with β = 5 °C/min (PtN2tr samples). The lineage of the various PtOx/TiO2 catalysts is depicted in Figure 1.
The real Pt content of the photocatalysts measured by ICP-OES technique after microwave assisted dissolution in 1:8 mixture of concentrated nitric acid (65%) and hydrofluoric acid (38%) were 0.97 and 0.80 wt % Pt for PAPt and P25Pt samples, respectively. The Pt content of the recovered samples did not decrease.

2.3. Photocatalytic Hydrogen Generation

The photocatalytic reaction was carried out in a reactor system of 10 quartz glass units equipped with magnetic stirrers, gas inputs and outputs as described before [29]. The size of the cylindrical quartz glass units were 140 mm in height and 60 mm in diameter. Nitrogen gas with 20 cm3/min flow rate was continuously bubbled through all reactor units in parallel. According to blank experiments, all reactor units were equivalent in terms of the catalytic activity. In case of kinetic measurements, one channel mode was used. The initial concentration of glycerol was 6 v/v% in distilled water. The reaction was carried out at room temperature. The amount of catalyst and the reaction volume in every unit was 0.100 g and 260 cm3, respectively. Osram HQL de luxe 125 W lamps were used as light sources operated in the UV-visible region. A GC (Agilent 7820A, Agilent Technologies, Santa Clara, CA, USA) equipped with SUPELCO Carboxen 1010 column (Supelco Analytical, Bellefonte, PA, USA) and TCD detector was used to follow the H2 production. The internal standard of the GC analysis was argon gas added to the vapor-gas mixture before the GC sampling valve. The H2 production was expressed as H2 production rate (mmol/h). The reaction was monitored for 270 min. After the photocatalytic reaction, the samples were recovered from the aqueous glycerol solution by centrifuging and washed with 3 × 50 cm3 absolute ethanol followed by drying under N2 flow.

2.4. Chemico-Physical Characterization of Photocatalysts

Nitrogen physisorption measurements were carried out at −196 °C using Thermo Scientific Surfer automatic volumetric adsorption analyzer (Thermo Fischer Scientific, Berlin, Germany). The specific surface area was calculated by the BET method in the range of relative pressures from 0.05 to 0.30. The pore-size distributions were calculated from desorption isotherms by the BJH method. Before the analysis, TiO2 samples were outgassed under vacuum for 2 h at 250 °C.
Temperature programmed desorption (NH3-TPD) experiments were performed using Autochem 2920 (Micromeritics, Norcross, GA, USA) equipment with QMS (Thermostar, Pfeiffer Vacuum, Asslar, Germany) analysis. The samples were pretreated at 150 °C in helium flow for 1 h, followed by NH3 adsorption to saturation and helium purge at 50 °C for 1 h. Desorption was performed by a temperature ramp in helium between 50 and 600 °C at the heating rate of 5 °C/min.
Diffuse reflectance UV-visible spectra of the samples were registered using a Jasco V-570 UV-Vis (Jasco, Tokyo, Japan) spectrophotometer equipped with a NV-470 type integrating sphere. The data were collected between 300 and 800 nm wavelength intervals with 100 nm/min speed.
X-ray powder diffraction (XRD) patterns were obtained in a Philips model PW 3710 based PW 1050 Bragg-Brentano parafocusing goniometer (Philips, Eindhoven, The Netherlands) using CuKα radiation (λ = 0.15418 nm), graphite monochromator, and proportional counter. Silicon powder (NIST SRM 640) was used as an internal standard and the scans were evaluated with profile fitting methods. Reference cards from the ICDD PDF-2 (1998) database were used. Crystallite sizes were calculated from reflection line broadening using the Scherrer-equation.
A Philips CM12 (Philips, Eindhoven, The Netherlands) instrument equipped with a high-resolution camera was used to acquire and elaborate the TEM images. Powdered samples were dispersed in 2-propanol under ultrasound irradiation and the resulting suspension; dropwise was deposited on a holey carbon-coated support grid.
The ESR experiments were performed with a Bruker Elexsys E500 X-band spectrometer (Bruker, Rheinstetten, Germany). A typical microwave power of 1 mW and 1 G magnetic field modulation at ambient temperature were used. The magnetic field was calibrated with an NMR field meter. Signal intensity, linewidth, and g-factor (spectroscopic splitting factor) values were used to characterize the samples. The knowledge of the g-factor can give information about a paramagnetic center’s electronic structure.
The simultaneous thermogravimetric and mass spectrometric evolved gas analyses (TG-MS) were recorded on a Setaram LabsysEvo (Setaram, Lyon, France) thermal analyzer, in high purity (99.9999%) helium atmosphere, with a flow rate of 80 cm3/min. The measurements were done with a heating rate of 20 °C/min, in the temperature range of 20–600 °C. The obtained results were baseline-corrected, and then evaluated with the thermal analyzer’s processing software (AKTS Calisto Processing, ver. 1.43). Parallel with the thermogravimetric measurements, the analysis of the evolved water was carried out on a Pfeiffer Vacuum OmniStar™ (Pfeiffer Vacuum, Asslar, Germany) gas analysis system coupled to the above-described TGA. The gas splitter and transfer line to the mass spectrometer was preheated to 260 °C. Three masses were scanned (the molecular ion of water, m/z—18, the OH ion, m/z—17 and the atomic oxygen ion, m/z—16), with a scan speed of 100 ms/mass. The mass spectrometer was operated in an electron impact mode.
X-ray photoelectron spectroscopy (XPS) measurements were carried out using an EA125 electron spectrometer manufactured by OMICRON Nanotechnology GmbH (Taunusstein, Germany). The photoelectrons were excited by non-monochromic MgKα (1253.6 eV) radiation. Spectra were recorded in the Constant Analyzer Energy mode of the energy analyzer with 30 eV pass energy resulting in a spectral resolution around 1 eV. For XPS experiments, the samples in the form of fine powder were suspended in isopropanol. Drops of this suspension were placed on standard OMICRON sample plates; after evaporation of the solvent, catalyst coatings with sufficient adhesion and electric conductivity were obtained. Effects of possible electric charging were compensated by adjusting the binding energy of the Ti 2p3/2 peak to 458.8 eV (literature value for TiO2). By this choice the O 1s binding energies coincided with the range expected for TiO2, and the leading component of the C 1s spectra arising from hydrocarbon contamination appeared around 284.6–284.8 eV, confirming the reliability of the calibration. Chemical states of the elements were deduced from high-resolution spectra using XPS databases [71,72]. Quantification was performed using combination of CasaXPS [73] and XPSMultiQuant [74,75].

3. Results

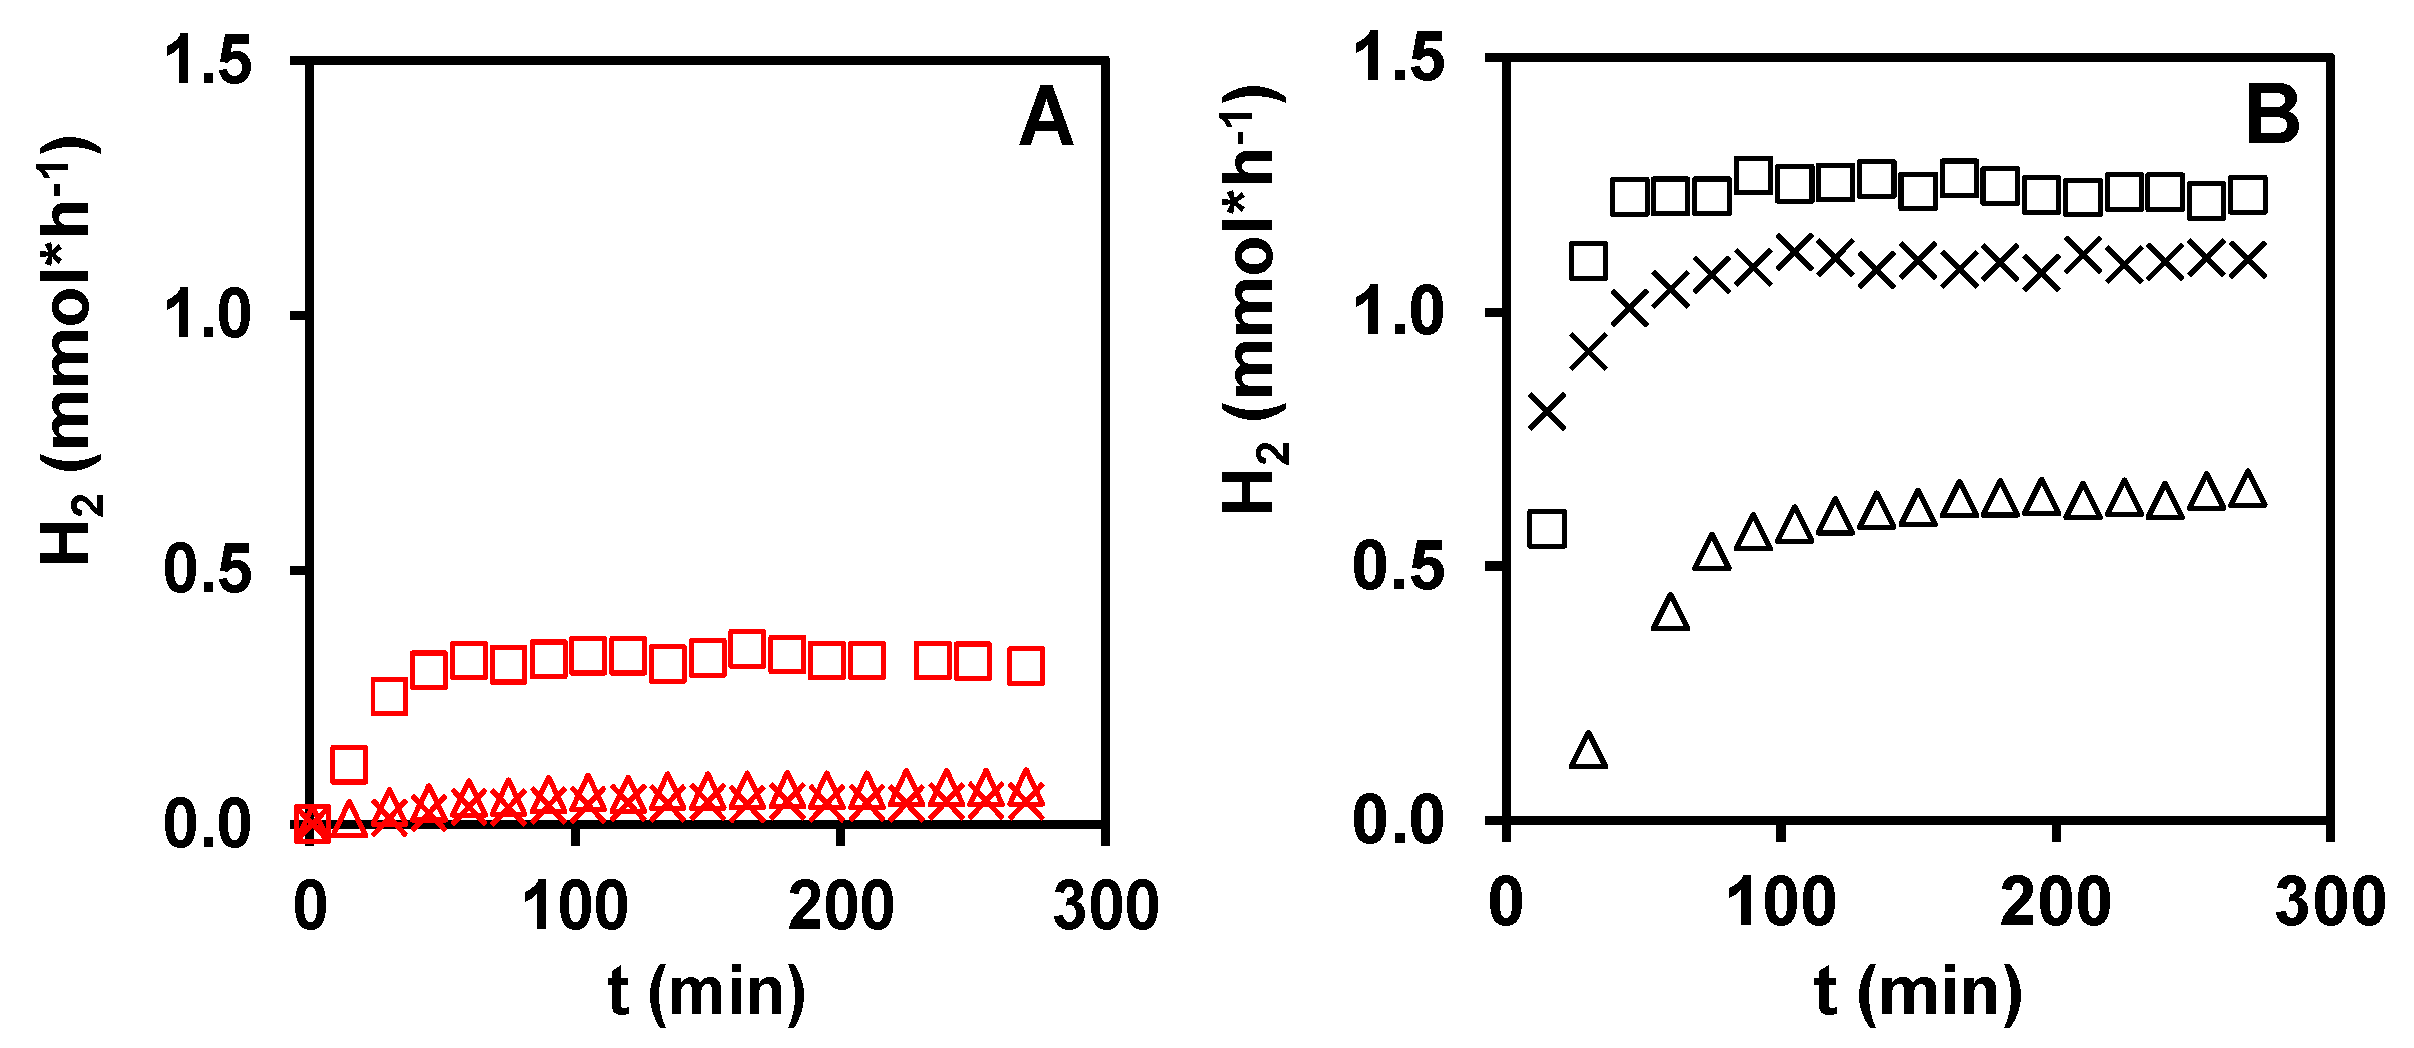
3.1. Photocatalytic Hydrogen Production from Glycerol over PtOx/TiO2 Catalyst Systems

The results of the photoinduced reforming reaction of glycerol over different types of PtOx/TiO2 photocatalysts are shown in Figure 2.
In the absence of irradiation, no H2 production was observed. The H2 formation rate trend is characterized by an initial progressive increase followed by a plateau. The gradual increase in the hydrogen production rate in the initial period can be explained by considering two factors: (i) the achievement of glycerol liquid phase/nitrogen equilibrium; and (ii) the in situ progressive formation of catalytically active sites. For example, the in situ appearance of Pt0 observed in case of the co-catalyst formation by calcination was favorable for the hydrogen production in the photocatalytic reaction of methanol [29,42]. Regarding the recyclability of these catalysts, it can be said that the activity of the recovered P25PtH2 red sample did not decrease while that of P25PtCalc decreased with ~15% in the second cycle. However, in case of fresh P25PtCalc, a very slow increase of reaction rate can be observed even after four h reaction time. When we doubled the reaction time from 270 min to 540 min using fresh P25PtCalc in a new experiment the reaction rate further increased (from 0.64 mmol/h to 0.69 mmol/h).
From the results shown in Figure 2, it can be seen that the activity of photocatalysts based on P25 TiO2 is much higher than that of the PA based ones, regardless to the type of the co-catalyst formation treatment. One of the tasks of this work is to explain this behavior. The obvious answer is in the different structural quality of the P25 based TiO2 compared to that of the homemade one. However, the ratios of the H2 evolution rates of the P25-PA pairs were 2.5; 5.5; 14.9 for PtH2red, PtCalc, PtN2tr samples respectively, at 270 min. This result suggests that other physico-chemical properties than the structural features of the parent semiconductor should also be considered to justify such behavior. For example, the characteristics of the platinum co-catalysts in terms of oxidation state and particle size, which can change during the co-catalyst formation and during the photocatalytic reaction, could play a relevant role. In addition, by considering previous results, which showed in situ reduction of platinum during the photocatalytic reforming of methanol on the samples formed by calcination [29], it is important to understand if the in situ reduction of platinum occurs during the photocatalytic reforming of glycerol and to what extent.
In an attempt to answer these questions, a comparison of the characterization results obtained by XPS and TEM techniques of fresh and recovered sample pairs was carried out and the results are reported below. Moreover, since the literature data indicate a key role of the water for the decomposition of Pt(NH3)4(NO3)2 in the zeolites-based systems, the effect of residual water during the co-catalyst formation in the case of the different TiO2 semiconductors was evaluated and discussed too.

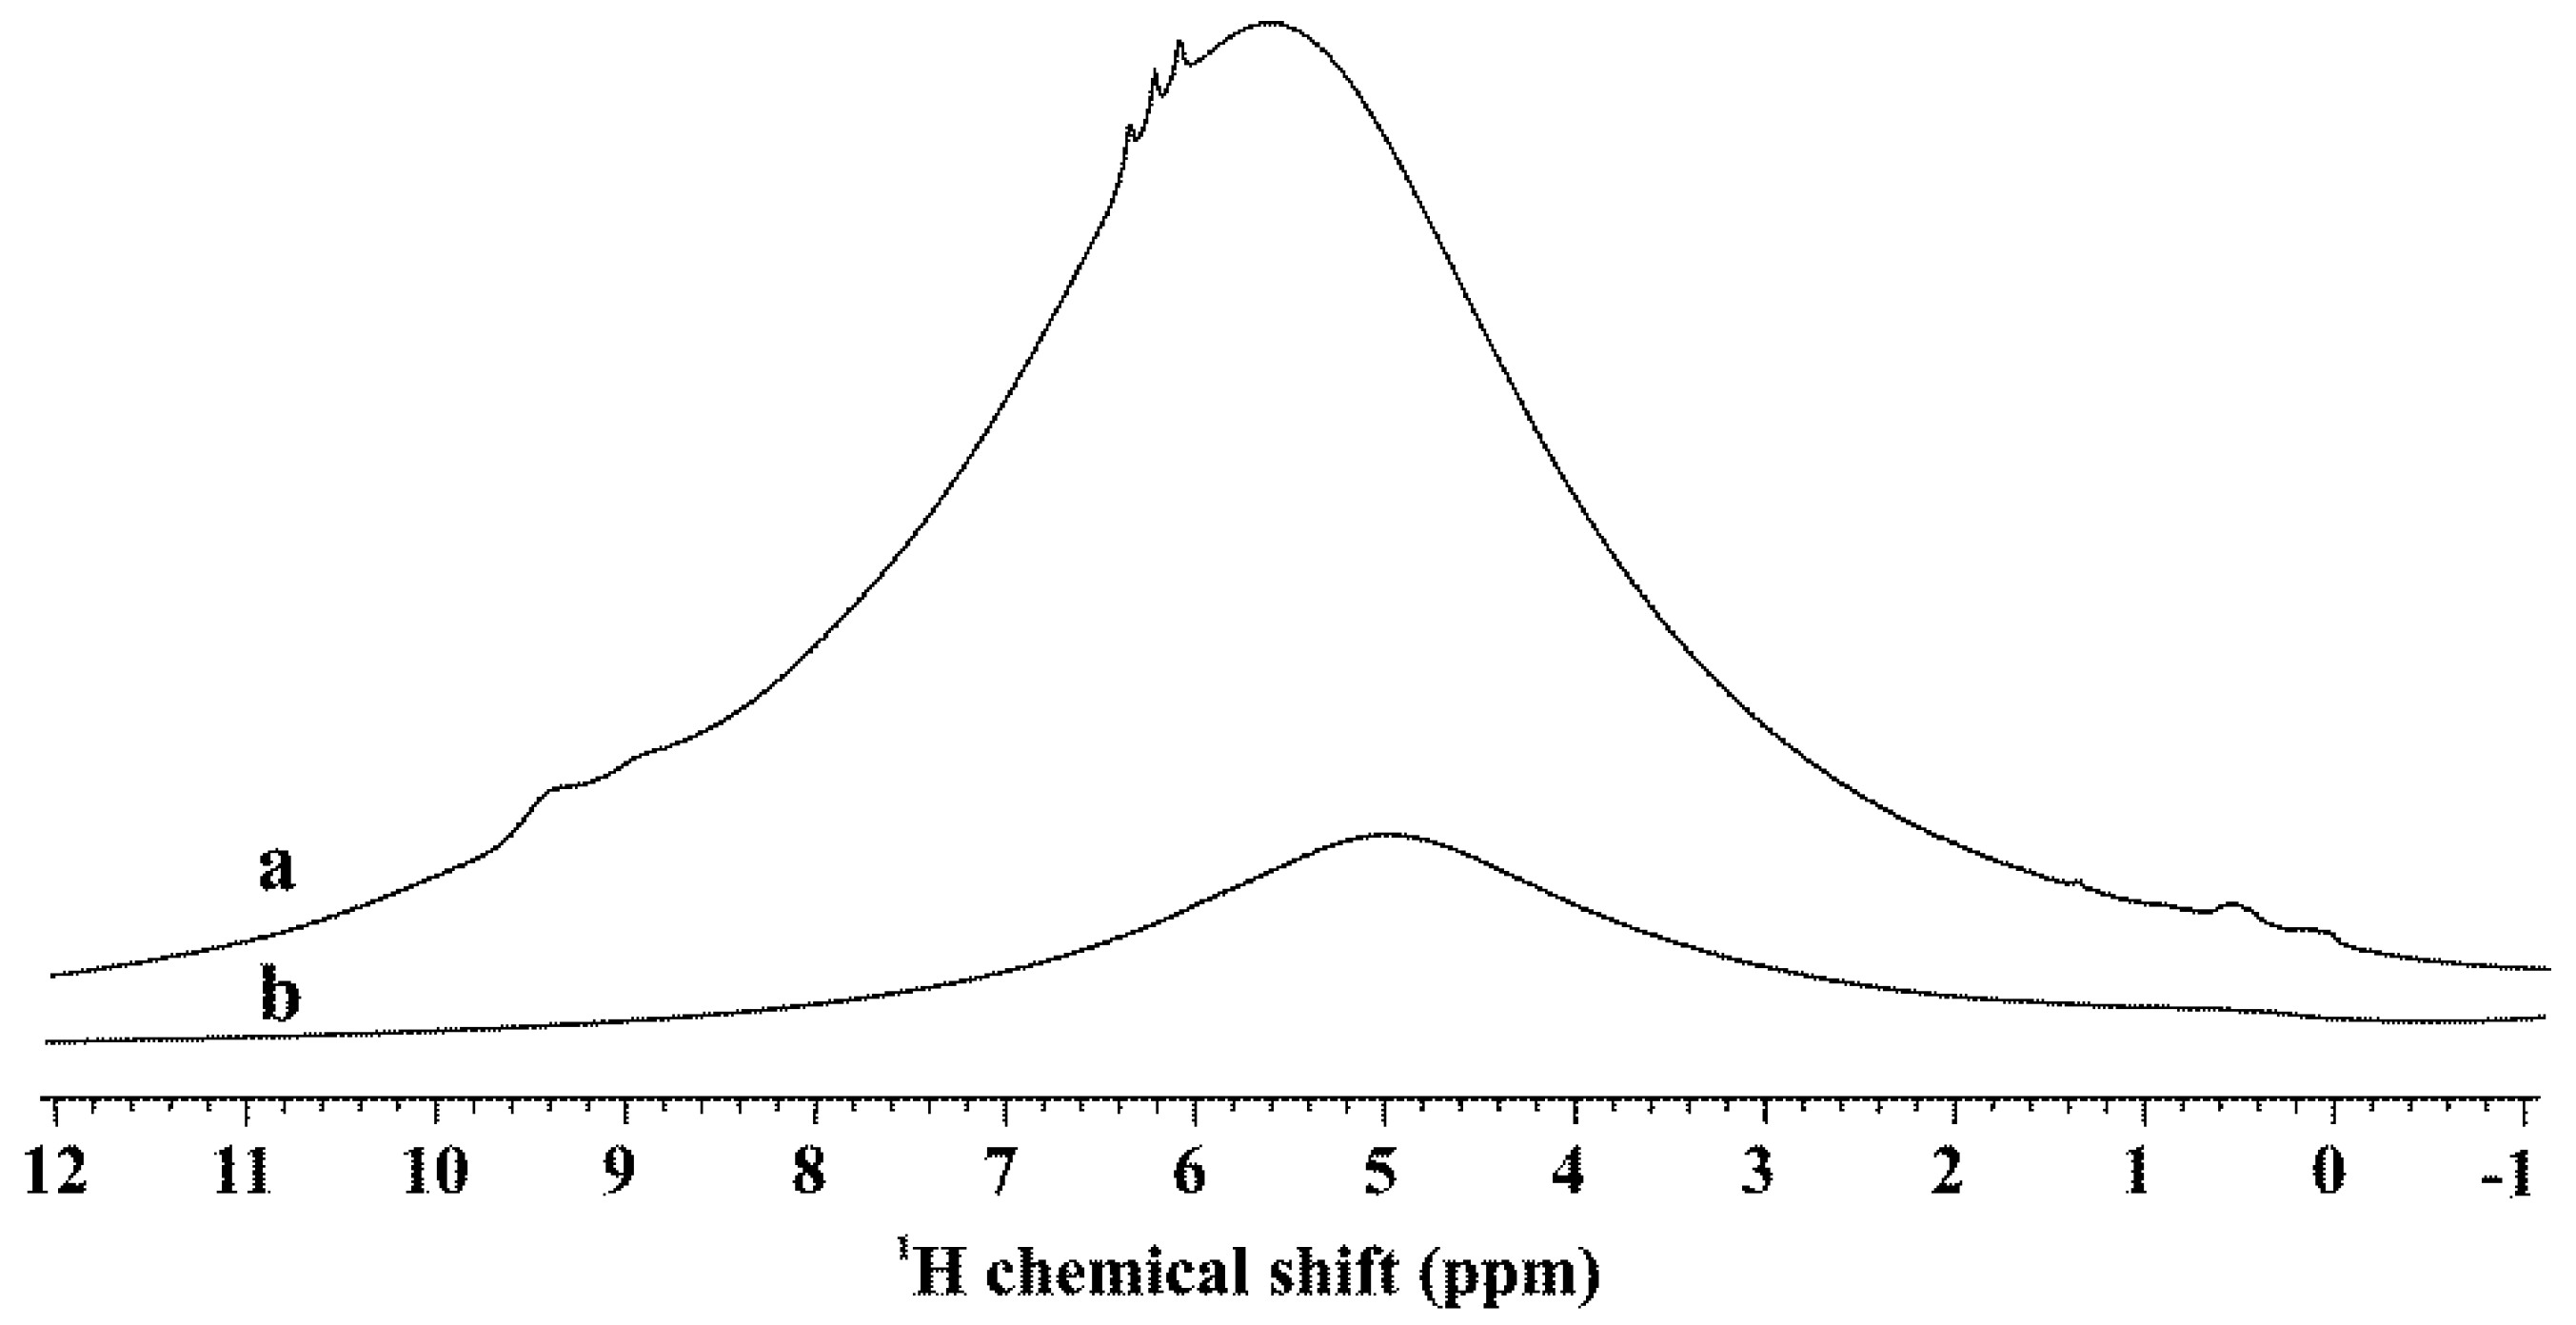
3.2. Characterization of Bare TiO2

In order to explore the effects of the structure of the semiconductor, the co-catalyst and the interplay between them on the hydrogen formation rate, first the data obtained by structure-sensitive techniques on the bare TiO2 supports are presented. Main structural properties, in terms of specific surface area (SSA), pore volume, maximum pore diameter, average particle size, and crystalline phases of the studied TiO2 are summarized in Table 1.
One of the most striking differences between the two TiO2 materials appeared in the SSA values being much higher for the homemade sample, while pore volume and maximum pore diameter of that was significantly smaller. Another important difference between the two TiO2 samples was the phase composition: while P25 mainly contains anatase, PA mainly consists of the rutile phase along with brookite in comparable amounts to anatase. In accordance with the literature [15], the crystallite size of anatase or brookite is smaller than that of rutile.
The ESR spectra of the two bare TiO2 samples, shown in Figure 3, reveal that the samples are characterized by similar defect structure. However, the very intense, sharp signal at about 3500 G (g = 2.003) observed in the ESR spectra of TiO2 prepared by sol-gel method [29] and attributed to electrons trapped in oxygen vacancy was absent in the semiconductors studied in this work.
Anyhow, as already described in our previous work, these latter vacancies were unfavorable for photocatalytic reaction [29].
The 1H MAS NMR spectra of PA is characterized by an intense band that overlaps with other different peaks (Figure 4), resulting in a more complex profile than that of P25. While the main contribution was given by bridged –OH and H2O [29] in both samples, the intensity of that signal was much higher in PA than in P25.
Taking into account that the SSA value of PA is 2.3 times larger than that of P25, detection of larger amounts of adsorbed water was obvious [76], but such a great difference was not expected. This observation suggested that air exposed PA contains more H2O (and bridged –OH) per surface unit than P25. Furthermore, this signal appeared at somewhat higher chemical shifts in PA than in P25 suggesting stronger H-bonded structure of H2O molecules. Besides the main peak at 5.69 ppm, small intensity sharp (6.13, 6.27, 6.4 ppm) and broader (8.98 and 9.45 ppm) peaks can be observed. These additional signals indicate strong H-bonded sites in this sample. These results suggest a more acidic character for PA in comparison to P25. For the sake of completeness, it should be mentioned that certain amounts of H at low chemical shifts of 0.13 and 0.60 ppm, i.e., in the region of relative basic type of terminal OH groups also appeared in both samples.
According to the results of NH3-TPD measurements, the amount of desorbed ammonia was four times larger from PA than from P25. The SSA normalized values still showed noticeable differences. These observations are in accordance with the NMR results.
Diffuse reflectance UV-Vis spectra of the two TiO2 samples also differ somewhat; the adsorption edges were at about 400 nm (Figure 5), but the homemade TiO2 showed somewhat higher absorbance in the near UV range. The Tauc plots suggested an indirect band gap with 3.00 eV width for P25, while a direct gap of 3.17 eV was found for PA.
The described properties of P25 are in line with those reported in literature [77]. It is known that P25 is a TiO2 material with high purity (99.5%) and narrow pore size distribution; its favorable properties are derived from its high temperature manufacturing process [78].
The above results obtained from different characterization methods clearly indicate that the increased specific surface area of the PA homemade TiO2 is accompanied by a more complex structure and more pronounced water retention ability compared to P25. The consistently lower photocatalytc activities found in glycerol reforming indicate that this complexity negatively influences the photocatalytic properties in both direct and indirect ways. Analyzing the activity on both bare TiO2 supports would help to interpret the differences in the behavior of the PtOx/TiO2 samples. However, in the absence of a metal co-catalyst, the H2 production of the bare supports is well below the detection limit in our system.

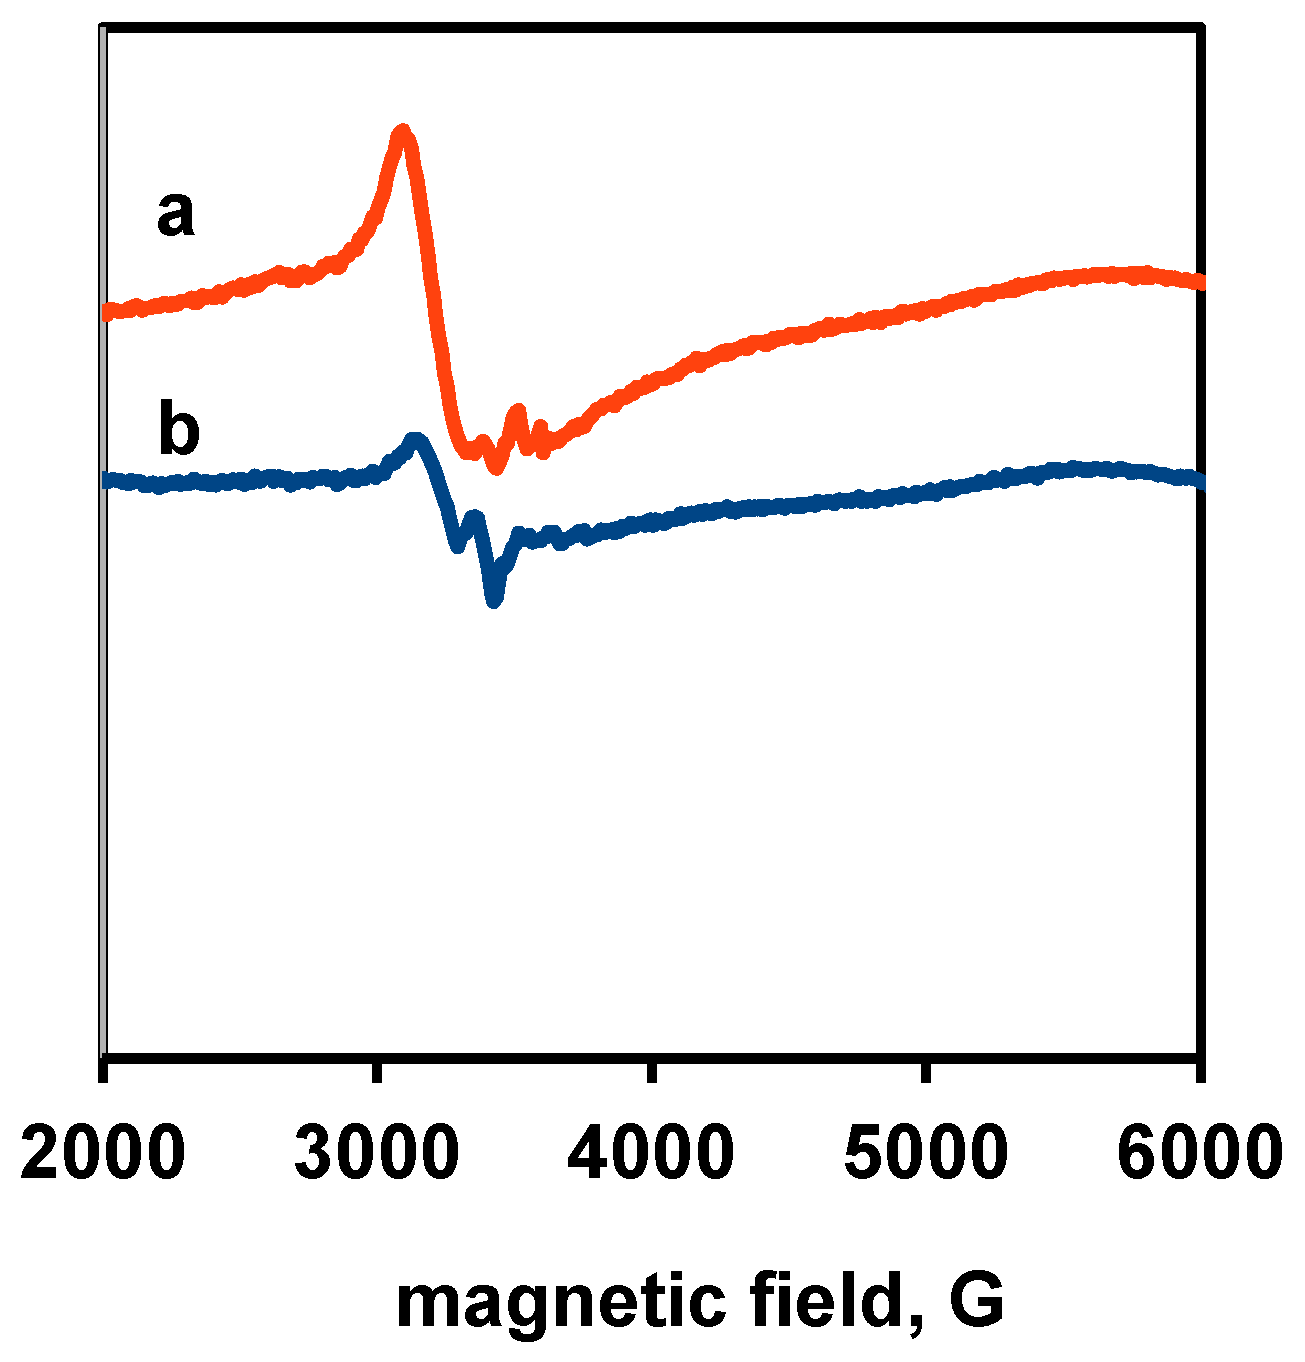
3.3. Physico-Chemical and Structural Characterization of Platinum Co-Catalysts

It should be mentioned that the introduction of Pt, followed by high temperature co-catalyst formation, only slightly changed the crystalline phase composition of the support. The evaluation of XRD patterns (not shown) of the homemade PA based PtOx/TiO2 samples revealed that the ratio of the rutile phase increased somewhat after the co-catalyst formation, while the ratio of brookite and anatase decreased slightly. For example, in the PAPtCalc sample, the percentages of rutile, brookite, and anatase phases changed from 54% to 63.6%, from 23% to 16.4% and from 23% to 20.0%, respectively. The extent of the co-catalyst formation induced phase transformation was very similar in the other two cases. Such results are in accordance with literature evidences obtained over P25 based samples [79], where a slight increase of the contribution from the rutile phase in both oxidation-treated and reduced P25 based Pt/TiO2 was observed in comparison to that of the parent P25. That change was ascribed to the dehydroxylation effect favored by the presence of Pt, which promotes rutile phase formation [79].
The platinum co-catalysts have been investigated in details by X-ray photoelectron spectroscopy. In order to get insight into the processes occurring during the photocatalytic reaction, data were collected on both the fresh catalysts and on those recovered after the photocatalytic experiment. The focus was on comparing the amount and the state of platinum in fresh and recovered samples. The Pt 4f profiles were first corrected for the charge-transfer satellite of the Ti 3s peak (which exactly overlaps with the Pt 4f region and appears shifted towards higher binding energies by 13.3 eV from the parent Ti 3s peak). Then, the spectra were fitted with a combination of two or three contributions: (i) spin-orbit doublet of metallic Pt with an asymmetric line shape derived from that of a reduced 40 wt % Pt/C catalyst with leading component (Pt 4f7/2) around or below 71 eV; (ii) spin-orbit doublet of Pt2+ (PtO or Pt(OH)2 with the Pt 4f7/2 component around 72–72.5 eV and (iii) spin-orbit doublet of Pt4+ (PtO2) with the Pt 4f7/2 component at 74.5–75 eV, if needed [72,80].
It should be mentioned that, exclusively, the presence of Ti4+ was observed in all investigated samples.
In Figure 6, Pt 4f spectra of the PAPt and the P25Pt fresh and used samples formed by high temperature hydrogen treatment are shown.
In both samples, the presence of Pt0 and Pt2+ is detectable. The binding energy of the metallic Pt 4f7/2 component is unusually low (around 70.6 eV), which can be attributed to charge transfer from the TiO2 towards the metal particle. Even if one expects that the high temperature hydrogen treatment reduces Pt to the metallic state, the presence of Pt2+ is not surprising taking into account the air exposure of sample during storage and transferring to the XPS chamber. According to XPS results, spectra of fresh and recovered P25PtH2red as well as fresh and recovered PAPtH2red did not significantly differ from each other, although a more reduced state after the photocatalytic experiment is evident in both cases and the Pt seems to be somewhat more oxidized in the PA TiO2 supported sample (Pt2+, 54% in fresh and 23% in used samples respectively) than in its P25 TiO2 supported counterpart (Pt2+, 39% in fresh and 12% in used samples, respectively).
The Pt/Ti ratio in the fresh samples was smaller in PAPtH2red (0.004) than in P25PtH2red (0.010). Then, it slightly decreased in the recovered in P25PtH2red (0.008), while it did not change in the recovered PAPtH2 red, as compared to the fresh ones. In terms of % weight, the Pt content of the PA supported sample was around 1.1%, while in the P25 supported sample, it was approximately 2.0% in the initial state.
In case of co-catalyst formation by calcination, the fresh PAPtCalc (pattern “initial state” in Figure 7A) sample contained only Pt2+ (66%) and Pt4+ (34%), while in the fresh P25PtCalc sample (pattern “initial state” in Figure 7B) more Pt2+ species (85%) and a smaller amount of Pt4+ (15%) were found. After the photocatalytic measurement, the Pt 4f profile of the two samples remained qualitatively similar: In both cases a significant reduction to the metallic state occurred but a notable amount of Pt2+ was still detected. However, the higher stability of Pt2+ on the PA sample is again observable; the Pt2+ content of the recovered PAPtCalc (line “used” in Figure 7A) is clearly higher than that of the P25PtCalc (line “used” in Figure 7B).
The Pt/Ti atomic ratio in the fresh PAPtCalc sample was about 0.008, which did not change during the photocatalytic reaction. However, the Pt/Ti atomic ratio in the fresh P25PtCalc sample was significantly higher (0.012) with respect to the fresh PAPtCalc sample.
In terms of % weight, the Pt content of the PA supported sample was around 1.5%, while in the P25 supported sample, it was approximately 2.5%. The Pt content higher than the nominal value is related to the surface location and probably good dispersion of Pt. The Pt/Ti atomic ratio in the recovered P25PtCalc sample decreased somewhat to 0.009, which was likely due to a slight decrease in Pt dispersion.
Figure 8 summarizes the XPS results obtained on the chemical state of platinum in case of high temperature N2 treatment. It can be seen that the amount of the oxidized and metallic forms of Pt is completely different in fresh PAPtN2tr and in fresh P25PtN2tr (cf. patterns “initial state” in Figure 8A,B): Metallic Pt is absent from the former, but accounts for almost 50% of the Pt content of the latter. This observation means that autoreduction, i.e., reduction of Pt by NH3 species released from the precursor during annealing in inert gas is effective only for the P25-based sample. Regarding the effect of the photocatalytic reforming reaction on the co-catalyst, the Pt was almost completely in metallic state in the recovered P25PtN2tr sample (86%), while there was a mixture of metallic (44%) and Pt2+ (56%) forms in nearly equal ratio in the recovered PAPtN2tr. Beside this, the Pt/Ti ratio was slightly smaller in PAPtN2tr (0.008) than in P25PtN2tr (0.010), as already seen in case of the calcined samples. In terms of % weight, the PA supported sample contained 1.4% Pt, while in the P25 supported sample, this value was approximately 1.6% in the initial state. During the photocatalytic reforming of glycerol, the Pt/Ti ratio of the P25 TiO2 sample slightly decreased while no changes were seen in the PA supported sample.
In summarizing the XPS results, it could be said that in situ reduction of Pt occurs not only in photocatalytic methanol reforming [29], but also under the conditions of photocatalytic glycerol reforming. In addition, the general behavior of the PA and the P25 supported samples was similar, however, two clear differences between the supports were repeatedly observed: (i) Slightly higher amount of Pt was present in the P25 supported samples than in the PA supported ones; and (ii) Pt was more oxidized both in the fresh and the recovered PA supported samples, than in the P25 supported samples.
In Figure 9 and Figure 10, a comparison among TEM images of fresh and used photocatalysts is reported. It is quite clear that the low metal loading (1 wt %) favors the Pt dispersion and that the detection of particles is possible only at high magnification. By starting from the fresh PAPtH2 red sample, (Figure 9A), it can be seen that the catalyst is composed of well-aggregated TiO2 particles of 15–10 nm in size.
Even at high magnification, it was not easy to observe Pt particles in a well-defined shape. After the photocatalytic test (see Figure 9B), the morphology of TiO2 remains very similar to that observed in the fresh sample, while the Pt particles become visible at high magnification even if they are very small (<0.5 nm). The PAPtCal catalyst is more compact than the reduced one and at high magnifications it is possible to observe the Pt particles even if they are present in the oxidized state. On the contrary, during the reaction, the Pt is reduced and the particles are clearly visible with variable dimensions in the 2–4 nm range. Therefore, calcination seems to favor the enlargement of the Pt particles that tend to aggregate. Regarding the treatment in N2, no significant difference was noticed with respect to the calcined catalyst, neither in terms of morphology, nor in the size of the Pt particles, which remain very small even after the reaction.
The samples prepared by impregnation of the commercial TiO2 (samples P25Pt) differ from the PAPt samples (Figure 10).
In particular, the TiO2 particles are larger (20–100 nm) and less porous. On the fresh P25PtH2 red sample (Figure 10A), the Pt particles are too small and are not clearly visible even at high magnification. However, after the reaction, the metal particles were easily detected (1–2 nm in size) and resulted to be well distributed (Figure 10B). Most likely during the reaction, a slight sintering occurred, or the particles segregated on the surface so they appear more visible. Neither the morphology of the TiO2, nor the size of the particles of Pt that varies in the range 1–3 nm both on the fresh or the used samples seem to be significantly modified in case of the calcined samples (Figure 10C,D). The same behavior is observed on the sample treated in N2 (Figure 10E,F), and also, in this case, the Pt particles do not change in distribution and size (2–3 nm), both on the fresh and the used sample.

3.4. Effect of Water on the Autoreduction of Pt(NH3)4(NO3)2

As already discussed in the introduction overview and as confirmed by the XPS results, the heat treatment of Pt(NH3)4(NO3)2 could lead to autoreduction of platinum in certain cases. In spite of the same drying procedure, the photocatalysts obtained after decomposition of Pt(NH3)4(NO3)2 in N2 atmosphere on the two supports exhibited clearly different appearance. The color of the P25PtN2tr sample was grayish, while that of PAPtN2tr was brownish yellow. The diffuse reflectance UV-vis spectra of the N2 treated samples well demonstrate this difference (Figure 11), which can be explained by the presence of metallic Pt in the P25 supported case. The XPS measurements already indicated that the ratio of Pt0 is much higher in the fresh P25PtN2tr than in fresh PAPtN2tr (cf. patterns “initial state” in Figure 8A,B).
Since, according to the literature data, during the thermal breakdown the water could significantly influence the formation of the platinum nanoparticles [60], such difference could be ascribed to different water retention of the two parent TiO2s. 1H MAS NMR results also had indicated significant difference in the distribution of surface -OH groups (and adsorbed water) on the two bare TiO2 materials (Section 3.3). Thus, to study the water adsorption capability of TiO2 samples, “blank” impregnated samples were prepared (using incipient wetness with pure water then followed by the same drying procedure which was used for Pt loading) and their thermal behavior was evaluated by TG-MS technique. According to the results shown in Figure 12 and in close correspondence to the behavior described in the literature [81], the water removal from both TiO2 materials occurred in two main steps: Molecularly adsorbed species were released up to 150 °C, while mass loss between 150 and 400 °C can be ascribed to the desorption of chemisorbed species (i.e., OH groups).
In case of PA a mass loss (Δm) of 3.1% was observed in the desorption range of molecular water; the chemisorbed species desorbed in a broad, continuous range between 150 and 400 °C (Δm 7.8%), which gave a total mass loss of 10.9%. On the contrary, the total mass loss was 1.2% from the “blank” impregnated P25 sample. Data on Figure 12 therefore confirm that the homemade PA TiO2 retained much more water than P25 after the same drying procedure. While homemade PA had smaller pore volume than P25 (see Table 1), the maximum pore diameter measured on PA was almost one order of magnitude less than that measured on P25 (3.7 nm vs. 31.5 nm), which could explain the higher water retention of PA type TiO2 during the introduction of the platinum precursor, in addition to its higher SSA value.
In order to force the water removal from PA based samples during the formation of the co-catalyst, the heating rate of the N2 treatment was decreased to one fifth (1 °C/min), as strongly reduced heating rate was found to be helpful in the case of zeolites [69]. In another approach, the impregnated sample was kept in a vacuum oven at 160 °C for 6 h before heating it up to 400 °C in N2 flow. The photocatalytic behavior of these samples was studied and the results are shown in Figure 13.
It can be seen that the effect of the reduced heating rate on H2 production was only marginal, whereas the vacuum pre-treatment significantly contributed to the increase of the hydrogen production.
The Pt 4f XPS profiles of the vacuum-dried PAPtN2tr sample in the fresh and recovered states are shown in Figure 14.
The data reveal a very different situation from that observed for the non-vacuum-dried case (Figure 8A). Vacuum drying prior to the autoreductive treatment resulted in almost complete reduction of Pt, even in the fresh sample (cf. patterns “initial state” in Figure 8A and Figure 14). At the same time, no ionic Pt was found in the recovered sample (cf. patterns “used” in Figure 8A and Figure 14). This increase in the metallic nature of the co-catalyst should be the reason of the increase in the rate of hydrogen evolution. The low but stable Pt/Ti ratio (0.003) indicated a similar structure for Pt as it was in the case of PAPtH2 red, with the suggestion being supported by the TEM image of vacuum-dried PAPtN2tr sample (cf. Figure 9A and Figure 15).

4. Discussion

In this work, two different TiO2 supports were used to prepare photocatalysts for H2 production reaction by glycerol reforming. These semiconductors differed from each other in SSA values, pore volumes, maximum pore diameters, phase composition, and accordingly in surface and defect site structure. Thus, it is not surprising that photocatalysts prepared after Pt deposition showed widely differing properties both in their structure and activity. In this section, we attempt to identify some of the key features explaining these differences.
One of the most obvious differences between the PA and P25-supported samples was the apparently different Pt/Ti ratio measured by XPS, even if the real Pt content was almost the same as confirmed by the ICP-OES data. Considering that the TEM measurements confirmed very high dispersion of Pt in both cases, it could not explain the different Pt/Ti ratios. A more probable interpretation is related to the structural model behind the evaluation of the XPS data. Namely, in this work, a homogeneous depth distribution model for Pt and TiO2 was assumed. This approach naturally overestimates the Pt content if well-dispersed Pt particles decorate the surface of much larger TiO2 particles. Such a situation occurs in the case of the P25 supported photocatalysts. However, if the size of the Pt and the TiO2 particles are more comparable, the homogeneous model becomes more valid and the compositional results are closer to the real values, as observed for the PA supported photocatalysts. Therefore, the observed composition difference between the two supports could not reflect a real difference in the structure of Pt, rather it is related to a geometrical effect. A difference in encapsulation by TiO2 [82] could also be taken into account, but this process is generally relevant in the reduced cases and at temperatures much higher than those used in this study.
Regarding the polymorphs of titania, usually anatase is considered to be the “best” catalyst in the general photocatalysis literature [83]. At the same time, the flame-synthesized P25 TiO2 containing anatase, rutile, and some amorphous phase is regarded as “the standard photocatalyst” due to its relatively high activity in a multitude of reactions [84]. It is generally believed that the exceptional properties of the P25 titania can be connected to a beneficial interaction between its anatase and rutile content. However, there exist reports attributing higher activity to certain rutile-based TiO2 formulations than to their anatase-based counterparts in photocatalytic methanol reforming [23,85]. In the latter work, a comparison between methanol dehydrogenation on Pt-loaded P25 and rutile or anatase separated from P25 challenged the idea of beneficial inter-polymorph charge transfer as an explanation for the outstanding properties of the P25 support.
These ambiguities suggest that the bulk phase composition may not be the only decisive factor determining the photocatalytic properties of a given TiO2 formulation. It is plausible since heterogeneous photocatalysis is predominantly a surface chemical reaction for which a strong reductant/oxidant is available in the form of the photoexcited charge carriers, which were created and transferred to the reaction site by bulk processes. In other words, the surface state of the photocatalyst (order-disorder, defect structure, and bonding, chemical state and structure of the co-catalyst) should also be considered.
In fact, one may assume that the higher SSA of the PA should result in better overall photocatalytic performance. It is also believed that the smaller primary TiO2 particle size gives better photocatalytic activity [86]. Considering these properties, a performance at least comparable to that of the P25-supported catalysts could be expected in the case of the PA support.
Since the hydrogen generation over the bare supports was below the detection limit of our experimental setup, direct comparison of the catalytic properties of the bare titania materials was not feasible in this study. Nevertheless, comparison of the activity of the hydrogen treated PA and P25 supported sample pair still allows, to some extent, the assessment of the effect of the properties of the support on the catalytic performance. It is well established that in the photocatalytic reforming reactions over Pt/TiO2 catalysts, the metallic state of platinum is the most active because metallic Pt is a better catalyst for proton reduction and H2 formation then partially oxidized Pt [87]. As, according to our TEM and XPS experiments, the state of Pt was comparable for the PAPtH2red–P25PtH2red pair, the difference in the H2 production activity could be related mostly to the differences in the TiO2 semiconductor.
In our experiments, consistently inferior hydrogen production data were obtained for the PA-supported catalysts, involving the hydrogen treated pair. This observation indicates that certain microscopic features counterbalanced the effects of the larger SSA or the smaller primary particle size in the case of the PA support.
One of these features is certainly the pore distribution. In the case of the PA support, a significant surface area arises from the inner walls of the quite small pores, which are water saturated in the as synthesized state, so neither Pt deposition during co-catalyst preparation nor penetration of reactants under the reaction conditions is easy, thus these areas may remain inactive during the photocatalytic reaction.
Another important factor is the defect structure of the semiconductors. ESR indeed indicated clearly higher amounts of defects for the bare PA support compared to the P25 support. TEM images suggested higher levels of structural disorder for the PA support (smaller, more irregular, often partially sintered primary particles). At least a certain fraction of the defects observed by ESR should arise from these disordered regions at which formation of deep electron traps/recombination centers is expected, so the more defective structure of the PA support obviously interferes with its catalytic properties.
At the same time, surface defects act as nucleation sites for Pt particles. The higher amount of defects in case of the PA support may result in higher Pt dispersion. Indeed, TEM data obtained on the fresh P25PtCalc and the PAPtCalc sample pair activated by calcination suggested smaller Pt particle size on the PA support (≤1 nm in PAPtCalc and about 1–3 nm in P25PtCalc). A similar situation could be observed in case of the sample pair obtained by the high temperature nitrogen treatment; while after treatments in hydrogen, both on PA and on P25, particularly highly dispersed state of Pt was found.
XPS investigations carried out on the calcined sample pair revealed a completely oxidized state (Pt2+–4+ mixture) for Pt in the fresh catalysts, while a certain extent of in situ reduction to the metallic state was observed during the photocatalytic process. This in situ reduction is analogous to the reduction of ionic Pt during photodeposition [37], but there is an important difference in the initial state of Pt: In photodeposition, adsorbed Pt ions are reduced while in our case reduction of oxidized Pt nanoparticles occurs, thus the extent of the in situ reduction depends on the structure and stability of the nanoparticles. The fact that, in spite of the in situ reduction, the calcined one gave the smallest hydrogen yield among all P25 supported samples, while hydrogen evolution on the calcined PA supported photocatalyst was almost negligible confirms that oxidized Pt is not beneficial in glycerol photocatalytic reforming.
Comparison of the performance and properties of the nitrogen-treated sample pair (PAPtN2tr and P25PtN2tr) with those of their calcined and hydrogen-treated counterparts reveals another important aspect of the co-catalyst formation. Namely, our XPS experiments with the calcined and the nitrogen treated samples consistently indicated that Pt is more oxidized on the PA support than on P25, both in the as prepared and the recovered state. Even if some uncertainty in the oxidation state of the metal is unavoidably present as existence of Pt in rather dispersed form always involves the possibility of re-oxidation during the sample handling, the data suggest that reduction of Pt on the PA support is hindered in comparison to the P25 support. For example, when the co-catalysts were formed by N2 treatment, the state of the Pt in the two fresh catalysts was completely different (completely oxidized (Pt2+) for PAPtN2tr and partially metallic for P25PtN2tr) from each other. The state of Pt in the fresh PAPtN2tr therefore resembled that of the fresh PAPtCalc. In line with this, the difference between the activities of samples PAPtCalc and PAPtN2tr was negligible, which can also be related to the similarity in their Pt0 content after recovery (40% vs. 44%; essentially equal within the error limits of the XPS measurement). On the contrary, there was a big difference between the activity of samples P25PtCalc and P25PtN2tr in favor of the latter. This observation was consistent with the fact that the nitrogen annealing resulted in significant Pt0 content even in the fresh P25PtN2tr (47%), which increased up to 86% in the recovered sample as a result of the in situ reduction, while the P25PtCalc turned out to be more resistant towards the in situ reduction (only 55% Pt0 in the recovered sample).
In fact, the activity of the P25PtN2tr sample was close to that of the reduced P25PtH2red case, which indicates that autoreduction (reduction by NH3 species released from the Pt precursor during annealing in inert atmosphere [69]) may be as effective as reduction by H2 in achieving good performance. The question is why autoreduction of the platinum precursor was successful for the P25-based sample and why it did not work for the PA-based sample during the high temperature N2 treatment. Our experiments pointed out that the answer should be the high water retention capacity of the PA TiO2, as proven by the TG-MS measurement: We found that after an additional vacuum treatment at 160 °C before the high temperature N2 treatment, the photocatalytic activity on PAPtN2tr (0.28 mmol × h−1) was similar to that on the PAPtH2red sample (0.31 mmol × h−1). This observation confirmed the importance of the water removal for the success of the autoreduction after the impregnation with Pt(NH3)4(NO3)2 solution, which is not needed for the P25 support with much lower water retention.
According to our knowledge, the literature has reported the negative impact of the excess water only in the case of zeolite support when [Pt(NH3)3(H2O)]2+, [Pt(H2O)x]2+, and bare Pt2+ was formed step by step during the temperature programmed pretreatment with oxygen if the sample was not dried [62]. In related studies, it has been pointed out that interaction between the metal precursor, the supporting oxide and ambient gas is markedly different for neutral supports and acidic HY zeolites [60]. During the calcination of [Pt(NH3)4]2+ in zeolites, Pt2+ ions after losing their NH3 ligands, can either by oxidized with O2 to Pt4+ (in HY) or react with H2O resulting in formation of PtO microcrystallites (in NaY) [60]. The above literary results may suggest that the higher amount of acidic OH groups on PA TiO2 can lead to the increased Pt4+ content on the PA-based samples after co-catalyst formation by calcination.
Based on these observations, the water retention capacity of the bare TiO2 should be considered as a key factor considering that the decomposition of Pt(NH3)4(NO3)2 platinum precursor is strongly influenced by the presence of water. We believe that the more stable Pt-oxide species found on the PA support form, at least partly, because of the initial interaction of the Pt precursor with the abundantly available water during the co-catalyst formation treatment.
To summarize the discussion, our studies confirmed that the behavior of a photocatalyst cannot be predicted only by knowing the phase composition/SSA/grain size of the semiconductor. Instead, the interplay between the photoelectric properties of the semiconductor, its surface properties, and its interactions with the co-catalyst, all influenced by the semiconductor preparation and co-catalyst deposition and activation methods should be considered.

5. Conclusions

In this study, 1 wt % Pt/TiO2 photocatalysts were prepared for photocatalytic reforming of glycerol on two very different supports, on P25, and on home-made high surface area TiO2 (PA). Three different methods (reduction in H2, calcination in air and heat treatment in N2) were used for activation of the Pt co-catalyst. The activity of photocatalysts based on P25 TiO2 was much higher than that of the PA based ones in all cases. The difference strongly depended on the nature of the co-catalyst nanoparticles, which was influenced by both the method of the co-catalyst formation and by the semiconductor.
Regarding the three co-catalyst formation methods, the reduction of the Pt(NH3)4(NO3)2 as platinum precursor in the H2 atmosphere at elevated temperature was more favorable than the other co-catalyst formation methods. Co-catalyst formation by calcination gave the worst activities. The extent of in situ reduction of the platinum co-catalyst, formed by calcination, was different in case of the different TiO2 supports; a higher amount of metallic Pt was observed in the more active P25-supported sample. Oxidized Pt does not seem to be a good co-catalyst in photocatalytic glycerol reforming.
In order to get well dispersed Pt0 nanoparticles from Pt(NH3)4(NO3)2 by means of autoreduction in nitrogen, the impregnated titania must be carefully dried because water plays a decisive role in the decomposition of this platinum compound, not only in the case of zeolites, but in the case of TiO2 supports, too.

Author Contributions

Conceptualization, E.T.; Investigation of photocatalytic reaction, K.M.; Investigation by XPS, Z.P.; Investigation by ESR, L.K.; Investigation by TG-MS, L.T.; Investigation by NMR, A.D., Investigation by TEM, G.B., F.F., C.C.; Writing—Original Draft Preparation, E.T., Z.P.; Writing—Review & Editing, C.C., Supervision, A.T., F.F.

Funding

This research was funded by the bilateral program between Hungarian Academy of Sciences and Italian National Council of Research grant number NKM-68/2016 and it was supported by the European Union and the State of Hungary, co-financed by the European Regional Development Fund within project No. VEKOP-2.3.2-16-2017-00013.

Acknowledgments

The authors thank Ádám Vass, Gábor P. Szijjártó, Ildikó Turi, and Eszter Gyetvai for the technical assistance. Zoltán May and Andrea Beck are acknowledged for ICP-OES and NH3-TPD measurements.

Conflicts of Interest

The authors declare no conflict of interest.

References

  1. Mazloomi, K.; Gomes, C. Hydrogen as an energy carrier: Prospects and challenges. Renew. Sustain. Energy Rev. 2012, 16, 3024–3033. [Google Scholar] [CrossRef]
  2. Cipriani, G.; Di Dio, V.; Genduso, F.; Cascia, D.; Liga, R.; Miceli, R.; Galluzzo, G.R. Perspective on hydrogen energy carrier and its automotive applications. Int. J. Hydrogen Energy 2014, 39, 8482–8494. [Google Scholar] [CrossRef]
  3. Sharma, S.; Ghoshal, S.K. Hydrogen the future transportation fuel: From production to applications. Renew. Sustain. Energy Rev. 2015, 43, 1151–1158. [Google Scholar] [CrossRef]
  4. Hwang, J.J. Review on development and demonstration of hydrogen fuel cell scooters. Renew. Sustain. Energy Rev. 2012, 16, 3803–3815. [Google Scholar] [CrossRef]
  5. Gurz, M.; Baltacioglu, E.; Hames, Y.; Kaya, K. The meeting of hydrogen and automotive: A review. Int. J. Hydrogen Energy 2017, 42, 23334–23346. [Google Scholar] [CrossRef]
  6. Behling, N.; Williams, M.C.; Manag, S. Fuel cells and the hydrogen revolution: Analysis of a strategic plan in Japan. Econ. Anal. Policy 2015, 48, 204–221. [Google Scholar] [CrossRef]
  7. Colón, G. Towards the hydrogen production by photocatalysis. Appl. Catal. A 2016, 518, 48–59. [Google Scholar] [CrossRef]
  8. Montini, T.; Monai, M.; Beltram, A.; Romero-Ocaña, I.; Fornasiero, P. H2 production by photocatalytic reforming of oxygenated compounds using TiO2-based materials. Mater. Sci. Semicond. Process. 2016, 42, 122–130. [Google Scholar] [CrossRef]
  9. Puga, A.V. Photocatalytic production of hydrogen from biomass-derived feedstocks. Coord. Chem. Rev. 2016, 315, 1–66. [Google Scholar] [CrossRef]
  10. Tran, N.H.; Kannangara, G.S.K. Conversion of glycerol to hydrogen rich gas. Chem. Soc. Rev. 2013, 42, 9454–9479. [Google Scholar] [CrossRef] [PubMed]
  11. Daskalaki, V.M.; Kondarides, D.I. Efficient production of hydrogen by photo-induced reforming of glycerol at ambient conditions. Catal. Today 2009, 144, 75–80. [Google Scholar] [CrossRef]
  12. Melián, E.P.; López, C.R.; Santiago, D.E.; Quesada-Cabrera, R.; Méndez, J.A.O.; Rodríguez, J.M.D.; Díaz, O.G. Study of the photocatalytic activity of Pt-modified commercial TiO2 for hydrogen production in the presence of common organic sacrificial agents. Appl. Catal. A 2016, 518, 189–197. [Google Scholar] [CrossRef]
  13. Gu, Q.; Long, J.; Fan, L.; Chen, L.; Zhao, L.; Lin, H.; Wang, X. Single-site Sn-grafted Ru/TiO2 photocatalysts for biomass reforming: Synergistic effect of dual co-catalysts and molecular mechanism. J. Catal. 2013, 303, 141–155. [Google Scholar] [CrossRef]
  14. Yang, J.; Wang, D.; Han, H.; Li, C. Roles of cocatalysts in photocatalysis and photoelectrocatalysis. Acc. Chem. Res. 2013, 46, 1900–1909. [Google Scholar] [CrossRef] [PubMed]
  15. Chen, T.X.; Mao, S.S. Titanium dioxide nanomaterials:  Synthesis, properties, modifications, and applications. Chem. Rev. 2007, 107, 2891–2959. [Google Scholar] [CrossRef] [PubMed]
  16. Ni, M.; Leung, M.K.H.; Leung, D.Y.C.; Sumathy, K. A review and recent developments in photocatalytic water-splitting using TiO2 for hydrogen production. Renew. Sustain. Energy Rev. 2007, 11, 401–425. [Google Scholar] [CrossRef]
  17. Fujishima, A.; Zhang, X.; Tryk, D.A. TiO2 photocatalysis and related surface phenomena. Surf. Sci. Rep. 2008, 36, 515–582. [Google Scholar] [CrossRef]
  18. Singh, R.; Dutta, S. A review on H2 production through photocatalytic reactions using TiO2/TiO2-assisted catalysts. Fuel 2018, 220, 607–620. [Google Scholar] [CrossRef]
  19. Akpan, U.G.; Hameed, B.H. The advancements in sol–gel method of doped-TiO2 photocatalysts. Appl. Catal. A 2010, 375, 1–11. [Google Scholar] [CrossRef]
  20. Wang, H.; Liu, P.; Cheng, X.; Shui, A.; Zeng, L. Effect of surfactants on synthesis of TiO2 nano-particles by homogeneous precipitation method. Powder Technol. 2008, 188, 52–54. [Google Scholar] [CrossRef]
  21. Chiarello, G.L.; Selli, E.; Forni, L. Photocatalytic hydrogen production over flame spray pyrolysis-synthesised TiO2 and Au/TiO2. Appl. Catal. B 2008, 84, 332–339. [Google Scholar] [CrossRef]
  22. Jiang, Y.; Scott, J.; Amal, R. Exploring the relationship between surface structure and photocatalytic activity of flame-made TiO2-based catalysts. Appl. Catal. B 2012, 126, 290–297. [Google Scholar] [CrossRef]
  23. Montes-Navajas, P.; Serra, M.; Corma, A.; Garcia, H. Contrasting photocatalytic activity of commercial TiO2 samples for hydrogen generation. Catal. Today 2014, 225, 52–54. [Google Scholar] [CrossRef]
  24. Chen, W.T.; Chan, A.; Al-Azri, Z.H.N.; Dosado, A.G.; Nadeem, M.A.; Sun-Waterhouse, D.; Idriss, H.; Waterhouse, G.I.N. Effect of TiO2 polymorph and alcohol sacrificial agent on the activity of Au/TiO2 photocatalysts for H2 production in alcohol–water mixtures. J. Catal. 2015, 329, 499–513. [Google Scholar] [CrossRef]
  25. Aprile, C.; Corma, A.; Garcia, H. Enhancement of the photocatalytic activity of TiO2 through spatial structuring and particle size control: From subnanometric to submillimetric length scale. Phys. Chem. Chem. Phys. 2008, 10, 769–783. [Google Scholar] [CrossRef] [PubMed]
  26. Pap, Z.; Karácsonyi, É.; Baia, L.; Pop, L.C.; Danciu, V.; Hernádi, K.; Mogyorósi, K.; Dombi, A. TiO2/WO3/Au/MWCNT composite materials for photocatalytic hydrogen production: Advantages and draw-backs. Phys. Status Solidi B 2012, 249, 2592–2595. [Google Scholar] [CrossRef]
  27. Sun, W.; Zhang, S.; Liu, Z.; Wang, C.; Mao, Z. Studies on the enhanced photocatalytic hydrogen evolution over Pt/PEG-modified TiO2 photocatalysts. Int. J. Hydrogen Energy 2008, 33, 1112–1117. [Google Scholar] [CrossRef]
  28. Beltram, A.; Romero-Ocaña, I.; Jaen, J.J.D.; Montini, T.; Fornasiero, P. Photocatalytic valorization of ethanol and glycerol over TiO2 polymorphs for sustainable hydrogen production. Appl. Catal. A 2016, 518, 167–175. [Google Scholar] [CrossRef]
  29. Tálas, E.; Pászti, Z.; Korecz, L.; Domján, A.; Németh, P.; Szijjártó, G.P.; Mihály, J.; Tompos, A. PtOx-SnOx-TiO2 catalyst system for methanol photocatalytic reforming: Influence of cocatalysts on the hydrogen production. Catal. Today 2018, 306, 71–80. [Google Scholar] [CrossRef]
  30. Ding, Z.; Lu, G.Q.; Greenfield, P.F. Role of the crystallite phase of TiO2 in heterogeneous photocatalysis for phenol oxidation in water. J. Phys. Chem. B 2000, 104, 4815–4820. [Google Scholar] [CrossRef]
  31. Al-Mazroai, L.S.; Bowker, M.; Davies, P.; Dickinson, A.; Greaves, J.; James, D.; Millard, L. The photocatalytic reforming of methanol. Catal. Today 2007, 122, 46–50. [Google Scholar] [CrossRef]
  32. Cui, W.; Feng, L.; Xu, C.; Lü, S.; Qiu, F. Hydrogen production by photocatalytic decomposition of methanol gas on Pt/TiO2 nano-film. Catal. Commun. 2004, 5, 533–536. [Google Scholar] [CrossRef]
  33. Lin, W.C.; Yang, W.D.; Huang, I.L.; Wu, T.S.; Chung, Z.J. Hydrogen production from methanol/water photocatalytic decomposition using Pt/TiO2−xNx catalyst. Energy Fuels 2009, 23, 2192–2196. [Google Scholar] [CrossRef]
  34. Linsebigler, A.L.; Lu, G.; Yates, J.T., Jr. Photocatalysis on TiO2 surfaces: Principles, mechanisms, and selected results. Chem. Rev. 1995, 95, 735–758. [Google Scholar] [CrossRef]
  35. Halasi, G.; Schubert, G.; Solymosi, F. Comparative study on the photocatalytic decomposition of methanol on TiO2 modified by N and promoted by metals. J. Catal. 2012, 294, 199–206. [Google Scholar] [CrossRef]
  36. Kraeutler, B.; Bard, A.J. Heterogeneous photocatalytic preparation of supported catalysts. Photodeposition of platinum on titanium dioxide powder and other substrates. J. Am. Chem. Soc. 1978, 100, 4317–4318. [Google Scholar] [CrossRef]
  37. Wenderich, K.; Mul, G. Methods, mechanism, and applications of photodeposition in photocatalysis: A review. Chem. Rev. 2016, 116, 14587–14619. [Google Scholar] [CrossRef] [PubMed]
  38. Jiang, Z.; Shangguan, W. Rational removal of stabilizer-ligands from platinum nanoparticles supported on photocatalysts by self-photocatalysis degradation. Catal. Today 2015, 242, 372–380. [Google Scholar] [CrossRef]
  39. Schafer, S.; Wyrzgol, S.A.; Caterino, R.; Jentys, A.; Schoell, S.J.; Havecker, M.; Knop-Gericke, A.; Lercher, J.A.; Sharp, I.D.; Stutzmann, M. Platinum nanoparticles on gallium nitride surfaces: Effect of semiconductor doping on nanoparticle reactivity. J. Am. Chem. Soc. 2012, 134, 12528–12535. [Google Scholar] [CrossRef] [PubMed]
  40. Che, M.; Clause, O.; Marcilly, C. 4.1 Deposition of active component. In Preparation of Solid Catalysts; Ertl, G., Knözinger, H., Weitkamp, J., Eds.; Wiley-VCH: Weinheim, Germany, 1999; pp. 315–371. ISBN 9783527298266. [Google Scholar]
  41. Maeda, K.; Teramura, K.; Saito, N.; Inoue, Y.; Domen, K. Improvement of photocatalytic activity of (Ga1xZnx)(N1xOx) solid solution for overall water splitting by co-loading Cr and another transition metal. J. Catal. 2006, 243, 303–308. [Google Scholar] [CrossRef]
  42. Vass, Á.; Pászti, Z.; Bálint, S.; Németh, P.; Szijjártó, G.P.; Tompos, A.; Tálas, E. Structural evolution in Pt/Ga-Zn-oxynitride catalysts for photocatalytic reforming of methanol. Mater. Res. Bull. 2016, 83, 65–76. [Google Scholar] [CrossRef] [Green Version]
  43. Margitfalvi, J.; Kern-Tálas, E.; Szedlacsek, P. Contradictions in the interpretation of experimental results obtained upon high-temperature hydrogen treatment of supported platinum catalysts. J. Catal. 1985, 92, 193–195. [Google Scholar] [CrossRef]
  44. Reyes, P.; Oportus, M.; Pecchi, G.; Fréty, R.; Moraweck, B. Influence of the nature of the platinum precursor on the surface properties and catalytic activity of alumina-supported catalysts. Catal. Lett. 1996, 37, 193–197. [Google Scholar] [CrossRef]
  45. Mondloch, J.E.; Yan, X.; Finke, R.G. Monitoring supported-nanocluster heterogeneous catalyst formation: Product and kinetic evidence for a 2-step, nucleation and autocatalytic growth mechanism of Pt(0)n formation from H2PtCl6 on Al2O3 or TiO2. J. Am. Chem. Soc. 2009, 131, 6389–6396. [Google Scholar] [CrossRef] [PubMed]
  46. Westerberg, B.; Fridell, E. A transient FTIR study of species formed during NOx storage in the Pt/BaO/Al2O3 system. J. Mol. Catal. A 2001, 165, 249–263. [Google Scholar] [CrossRef]
  47. Meng, F.; Li, J.; Hong, Z.; Zhi, M.; Sakla, A.; Xiang, C.; Wu, N. Photocatalytic generation of hydrogen with visible-light nitrogen-doped lanthanum titanium oxides. Catal. Today 2013, 199, 48–52. [Google Scholar] [CrossRef]
  48. Fiddy, S.G.; Newton, M.A.; Dent, A.J.; Salvini, G.; Corker, J.M.; Turin, S.; Campbell, T.; Evans, J. In situ energy dispersive EXAFS (EDE) of low loaded Pt(acac)2/HI SiO2 catalyst precursors on a timescale of seconds and below. Chem. Commun. 1999, 851–852. [Google Scholar] [CrossRef]
  49. Janampelli, S.; Darbha, S. Selective and reusable Pt-WOx/Al2O3 catalyst for deoxygenation of fatty acids and their esters to diesel-range hydrocarbons. Catal. Today 2018, 309, 219–226. [Google Scholar] [CrossRef]
  50. Pereda-Ayo, B.; De La Torre, U.; González-Marcos, M.P.; González-Velasco, J.R. Influence of ceria loading on the NOx storage and reduction performance of model Pt–Ba/Al2O3 NSR catalyst. Catal. Today 2015, 241, 133–142. [Google Scholar] [CrossRef]
  51. Pendyala, V.R.R.; Jacobs, G.; Ma, W.; Shafer, W.D.; Sparks, D.E.; MacLennan, A.; Hu, Y.; Davis, B.H. Fischer-Tropsch synthesis: Effect of carbonyl sulfide poison over a Pt promoted Co/alumina catalyst. Catal. Today 2018, 299, 14–19. [Google Scholar] [CrossRef]
  52. García-Fernández, S.; Gandarias, I.; Requies, J.; Soulimani, F.; Arias, P.L.; Weckhuysen, B.M. The role of tungsten oxide in the selective hydrogenolysis of glycerol to 1,3-propanediol over Pt/WOx/Al2O3. Appl. Catal. B 2017, 204, 260–272. [Google Scholar] [CrossRef]
  53. Jentoft, R.E.; Tsapatsis, M.; Davis, M.E.; Gates, B.C. Platinum clusters supported in zeolite LTL: Influence of catalyst morphology on performance in n-hexane reforming. J. Catal. 1998, 179, 565–580. [Google Scholar] [CrossRef]
  54. Jeon, S.; Park, Y.M.; Saravanan, K.; Han, G.H.; Kim, B.W.; Lee, J.B.; Bae, J.W. Aqueous phase reforming of ethylene glycol over bimetallic platinum-cobalt on ceria-zirconia mixed oxide. Int. J. Hydrogen Energy 2017, 42, 9892–9902. [Google Scholar] [CrossRef]
  55. Özkara-Aydınoğlu, Ş.; Özensoy, E.; Aksoylu, E. The effect of impregnation strategy on methane dry reforming activity of Ce promoted Pt/ZrO2. Int. J. Hydrogen Energy 2009, 34, 9711–9722. [Google Scholar] [CrossRef] [Green Version]
  56. Luo, J.; Arroyo-Ramírez, L.; Wei, J.; Yun, H.; Murray, C.B.; Gorte, R.J. Comparison of HMF hydrodeoxygenation over different metalcatalysts in a continuous flow reactor. Appl. Catal. A 2015, 50, 86–93. [Google Scholar] [CrossRef]
  57. Liang, B.; Duan, H.; Su, X.; Chen, X.; Huang, Y.; Chen, X.; Delgado, J.J.; Zhang, T. Promoting role of potassium in the reverse water gas shift reaction on Pt/mullite catalyst. Catal. Today 2017, 281, 319–326. [Google Scholar] [CrossRef]
  58. Hernandez, J.O.; Choren, E.A. Thermal stability of some platinum complexes. Thermochim. Acta 1983, 71, 265–272. [Google Scholar] [CrossRef]
  59. Reagan, W.J.; Chester, A.W.; Kerr, G.T. Studies of the thermal decomposition and catalytic properties of some platinum and palladium ammine zeolites. J. Catal. 1981, 69, 89–100. [Google Scholar] [CrossRef]
  60. Park, S.H.; Tzou, M.S.; Sachtler, I.M.H. Temperature programmed reduction and re-oxidation of platinum in Y-zeolites. Appl. Catal. 1986, 24, 85–98. [Google Scholar] [CrossRef]
  61. Keegan, M.B.T.; Dent, A.J.; Blake, A.B.; Conyers, L.; Moyes, R.B.; Wells, P.B.; Whan, D.A. An in situ energy dispersive EXAFS study of the calcination and reduction of a PtZSM-5 catalyst precursor. Catal. Today 1991, 9, 183–188. [Google Scholar] [CrossRef]
  62. Van den Broek, A.C.M.; van Grondelle, J.; van Santen, R.A. Preparation of highly dispersed platinum particles in HZSM-5 Zeolite: A study of the pretreatment process of [Pt(NH3)4]2+. J. Catal. 1997, 167, 417–424. [Google Scholar] [CrossRef]
  63. Exner, D.; Jaeger, N.; Möller, K.; Schulz-Ekloff, G. Thermal analysis of the decomposition mechanism of platinum and palladium tetrammine faujasite X. J. Chem. Soc. Faraday Trans. 1 1982, 78, 3537–3544. [Google Scholar] [CrossRef]
  64. Homeyer, S.T.; Sachtler, W.M.H. Elementary steps in the formation of highly dispersed palladium in NaY I. Pd ion coordination and migration. J. Catal. 1989, 117, 91–101. [Google Scholar] [CrossRef]
  65. Sauvage, A.; Massiani, P.; Briend, M.; Barthomeuf, D.; Bozon-Verduraz, F. Comparison of Pd(NH3)42+ decomposition and Pd2+reduction in zeolites NaY, NaX and CsX. J. Chem. Soc. Faraday Trans. 1 1995, 91, 3291–3297. [Google Scholar] [CrossRef]
  66. De Graaf, J.; van Dillen, A.J.; de Jong, K.P.; Koningsberger, D.C. Preparation of highly dispersed Pt particles in zeolite Y with a narrow particle size distribution: Characterization by hydrogen chemisorption, TEM, EXAFS spectroscopy, and particle modeling. J. Catal. 2001, 203, 307–321. [Google Scholar] [CrossRef]
  67. Muñoz-Páez, A.; Koningsberger, D.C. Decomposition of the precursor [Pt(NH3)4](OH)2, genesis and structure of the metal-support interface of alumina supported platinum particles: A structural study using TPR, MS, and XAFS spectroscopy. J. Phys. Chem. 1995, 99, 4193–4204. [Google Scholar] [CrossRef]
  68. Miller, J.T.; Schreier, M.; Kropf, J.A.; Regalbuto, J.R. A fundamental study of platinum tetraammine impregnation of silica 2. The effect of method of preparation, loading, and calcination temperature on (reduced) particle size. J. Catal. 2004, 225, 190–202. [Google Scholar] [CrossRef]
  69. Oudenhuijzen, M.K.; Kooyman, P.J.; Tappel, B.; van Bokhoven, J.A.; Koningsberger, D.C. Understanding the influence of the pretreatment procedure on platinum particle size and particle-size distribution for SiO2 impregnated with [Pt2+(NH3)4](NO3)2: A combination of HRTEM, Mass Spectrometry, and Quick EXAFS. J. Catal. 2002, 205, 135–146. [Google Scholar] [CrossRef]
  70. Kaluža, L.; Larsen, M.J.; Zdražil, M.; Gulková, D.; Víta, Z.; Šolcová, O.; Soukup, K.; Koštejn, M.; Bonde, J.L.; Maixnerová, L.; et al. Highly loaded carbon black supported Pt catalysts for fuel cells. Catal. Today 2015, 256, 375–383. [Google Scholar] [CrossRef]
  71. Moulder, J.F.; Stickle, W.F.; Sobol, P.E.; Bomben, K.D. Handbook of X-ray Photoelectron Spectroscopy; Perkin-Elmer Corp.: Eden Prairie, MN, USA, 1992. [Google Scholar]
  72. Naumkin, A.V.; Kraut-Vass, A.; Gaarenstroom, S.W.; Powell, C.J. NIST X-ray Photoelectron Spectroscopy Database, Version 4.1, National Institute of Standards and Technology, Gaithersburg, MD, USA. 2012. Available online: http://srdata.nist.gov/xps/ (accessed on 8 October 2018).
  73. Fairley, N. CasaXPS: Processing Software for XPS, AES, SIMS and More. Available online: www.casaxps.com/ (accessed on 8 October 2018).
  74. Mohai, M. XPS MultiQuant: Multimodel XPS quantification software. Surf. Interface Anal. 2004, 36, 828–832. [Google Scholar] [CrossRef]
  75. Mohai, M. “XPS MultiQuant: Multi-Model X-ray Photoelectron Spectroscopy Quantification Program. Version 7.00.92. 2011. Available online: http://www.chemres.hu/aki/XMQpages/XMQhome.htm/ (accessed on 8 October 2018).
  76. Nosaka, A.Y.; Fujiwara, T.; Yagi, H.; Akutsu, H.; Nosaka, Y. Characteristics of water adsorbed on TiO2 photocatalytic systems with increasing temperature as studied by solid-state 1H NMR spectroscopy. J. Phys. Chem. B 2004, 108, 9121–9125. [Google Scholar] [CrossRef]
  77. Ray, K.J.A.; Wiswanathan, B. Effect of surface area, pore volume and particle size of P25 titania on the phase transformation of anatase to rutile. Indian J. Chem. 2009, 48A, 1378–1382. [Google Scholar]
  78. Mills, A.; Le Hunte, S. An overview of semiconductor photocatalysis. J. Photochem. Photobiol. A 1997, 108, 1–35. [Google Scholar] [CrossRef]
  79. Huang, B.S.; Chang, F.Y.; Wey, M.Y. Photocatalytic properties of redox-treated Pt/TiO2 photocatalysts for H2 production from an aqueous methanol solution. Int. J. Hydrogen Energy 2010, 35, 7699–7705. [Google Scholar] [CrossRef]
  80. Hilaire, L.; Guerrero, G.D.; Légaré, P.; Maire, G.; Krill, G. A photoemission study of the oxidation of platinum in Pt-based alloys: Pt-Pd, Pt-Ru, Pt-Ir. Surf. Sci. 1984, 146, 569–582. [Google Scholar] [CrossRef]
  81. Mueller, R.; Kammler, H.K.; Wegner, K.; Pratsinis, S.E. OH Surface density of SiO2 and TiO2 by thermogravimetric analysis. Langmuir 2003, 19, 160–165. [Google Scholar] [CrossRef]
  82. Shalvoy, R.B.; Reucrofty, P.J. Quantitative analysis of ESCA signal intensifies from coprecipitated nickel on alumina catalysts. J. Electron. Spectrosc. Relat. Phenom. 1977, 12, 351–356. [Google Scholar] [CrossRef]
  83. Luttrel, T.; Halpegamage, S.; Tao, J.; Kramer, A.; Sutter, E.; Batzill, M. Why is anatase a better photocatalyst than rutile? Model studies on epitaxial TiO2 films. Sci. Rep. 2014. [Google Scholar] [CrossRef] [PubMed]
  84. Ohtani, B.; Prieto-Mahaney, O.O.; Li, D.; Abe, R. What is Degussa (Evonik) P25? Crystalline composition analysis, reconstruction from isolated pure particles and photocatalytic activity test. J. Photochem. Photobiol. A 2010, 216, 179–182. [Google Scholar] [CrossRef] [Green Version]
  85. Wang, K.; Wei, Z.S.; Ohtani, B.; Kowalska, E. Interparticle electron transfer in methanol dehydrogenation on platinum loaded titania particles prepared from P25. Catal. Today 2018, 303, 327–333. [Google Scholar] [CrossRef]
  86. Rivera, A.P.; Tanaka, K.; Hisanaga, T. Photocatalytic degradation of pollutant over TiO2 in different crystal structures. Appl. Cata. B 1993, 3, 37–44. [Google Scholar] [CrossRef]
  87. Jiang, X.; Fu, X.; Zhang, L.; Meng, S.; Chen, S. Photocatalytic reforming of glycerol for H2 evolution on Pt/TiO2: Fundamental understanding the effect of co-catalyst Pt and the Pt deposition route. J. Mater. Chem. A 2015, 3, 2271–2282. [Google Scholar] [CrossRef]
Figure 1. Denomination of the various PtOx/TiO2 catalysts.
Materials 11 01927 g001
Figure 2. H2 production from glycerol over PtOx/TiO2 catalyst systems: (A) PA; (B) P25. □—co-catalyst formation by high temperature H2 treatment (PtH2red); ×—co-catalyst formation in N2 treatment under conditions of autoreduction (PtN2tr); and Δ—co-catalyst formation by calcination (PtCalc).
Materials 11 01927 g002
Figure 3. ESR spectra of the bare TiO2 samples: line (a) PA; and line (b) P25.
Materials 11 01927 g003
Figure 4. 1H MAS NMR spectra of the bare TiO2 samples: line (a) PA; and (b) P25 (a: 0.055 g; b: 0.056 g); external reference: PDMS (0.085 ppm).
Materials 11 01927 g004
Figure 5. Diffuse reflectance UV-Vis spectra of the bare TiO2 samples: Solid line—PA; dashed line—P25.
Materials 11 01927 g005
Figure 6. XPS study of fresh and recovered sample pairs in case of co-catalyst formation by H2 treatment at 400 °C: (A) PA; and (B) P25.
Materials 11 01927 g006
Figure 7. XPS study of fresh and recovered sample pairs in case of co-catalyst formation by calcination: (A) PA; and (B) P25.
Materials 11 01927 g007
Figure 8. XPS study of fresh and recovered sample pairs in case of co-catalyst formation in high temperature nitrogen flow: (A) PA; and (B) P25.
Materials 11 01927 g008
Figure 9. TEM images of fresh and recovered PAPt photocatalysts: (A,B) PAPtH2red; (C,D) PAPtCalc; and (E,F) PAPtN2tr. Pt containing nanoparticles are indicated by arrows.
Materials 11 01927 g009
Figure 10. TEM images of fresh and recovered P25Pt photocatalysts: (A,B) P25PtH2red; (C,D) P25PtCalc; and (E,F) P25PtN2tr. Pt containing nanoparticles are indicated by arrows.
Materials 11 01927 g010
Figure 11. Diffuse reflectance UV-Vis spectra of the PtOx-TiO2 samples obtained by heat treatment in N2 flow (autoreduction). Solid line: PA; dashed line: P25.
Materials 11 01927 g011
Figure 12. TG-MS trace of “blank“ impregnated TiO2 samples: (A) PA; and (B) P25.
Materials 11 01927 g012
Figure 13. Dependence of the photocatalytic H2 production over PAPtN2tr samples on the water removal after the impregnation step. Reaction time: 270 min.
Materials 11 01927 g013
Figure 14. XPS study of the vacuum-dried PAPtN2tr sample.
Materials 11 01927 g014
Figure 15. TEM image of recovered vacuum-dried PAPtN2tr sample. Pt containing nanoparticles are indicated by arrows.
Materials 11 01927 g015
Table 1. Main structural properties of the studied TiO2.
Type of TiO2SSA 1, m2 g−1Maximum Pore Diameter, nmPore Volume, cm3 g−1Crystalline Phases 2, %Average Particle Size, nm
A 3B 4R 5A 3B 4R 5
PA133.83.710.10642323546 27 219 2
P2552.531.550.367482-1824 2-45 2
1 Specific surface area (SSA) calculated from BET measurements; 2 Calculated from the XRD measurements; 3 A: anatase; 4 B: brookite; 5 R: rutile.

