Article

An Integrated Approach of GRA Coupled with Principal Component Analysis for Multi-Optimization of Shielded Metal Arc Welding (SMAW) Process

by
Mohsin Iqbal Qazi
1,
Rehman Akhtar
2,
Muhammad Abas
2,
Qazi Salman Khalid
2,
Abdur Rehman Babar
2 and
Catalin Iulian Pruncu
3,4,*
1
Department of Industrial Engineering, Jalozai Campus, University of Engineering and Technology Peshawar, Nowshera 24240, Pakistan
2
Department of Industrial Engineering, University of Engineering and Technology Peshawar, Peshawar 25120, Pakistan
3
Department of Mechanical Engineering, Imperial College London, London SW7 2AZ, UK
4
Department of Mechanical Engineering, School of Engineering, University of Birmingham, Birmingham B15 2TT, UK
*
Author to whom correspondence should be addressed.
Materials 2020, 13(16), 3457; https://doi.org/10.3390/ma13163457
Submission received: 3 July 2020 / Revised: 24 July 2020 / Accepted: 3 August 2020 / Published: 5 August 2020
(This article belongs to the Section Manufacturing Processes and Systems)

Abstract

:
Welding distortion is a critical issue as it leads to severe deterioration of structural integrity of welded work piece and dimensional precision. This study aims at studying the effects of shielded metal arc welding (SMAW) parameters on the evolution of mechanical properties, including tensile strength, impact toughness, and hardness, along with angular distortion on a welded joint from SA 516 grade 70. Such parameters are analyzed and optimized by employing the Taguchi method and Grey relational analysis. SA 516 grade 70 is commercially used for fabrication of storage tanks, boilers and pressure vessels. SMAW is investigated with three levels of root gap, groove angle, electrode diameter, and pre-heat temperature, which were varied on a butt joint in flat (1 G) position to determine their effects on response variables at room temperature. Nine experiments were designed using a Taguchi L9 orthogonal array, welded according to American Society of Mechanical Engineers (ASME) section IX, and samples were prepared and tested as per ASTM A 370. The Taguchi method and Grey relational analysis were employed to observe the most significant parameters and optimal levels that synergically yield improved responses. Results are validated by conducting confirmatory experiments that show good agreement with optimum results.

1. Introduction

In small to heavy industries, steel is utmost important material for fabrication, structural components, weapons and machines due to low cost, high tensile strength and considerable toughness [1,2]. Shielded metal arc welding (SMAW) is oldest, most rapid, convenient, and commonly used joining process for the fabrication of variety of products such as pressure vessels, gears, machines, ship hulls, mining equipment, boilers, etc. SMAW results in good quality when employed for construction, pressure vessels, military armors, and vehicles [3]. Commercially, due to the low cost and ready availability, SMAW involves a simple setup, versatile source of heat in practice, and is widely used in the welding of steel sections [4]. SMAW is a multi-objective process involving multiple parameters, such as welding speed, electrode diameter, root gap, welding current, groove angle, and polarity, the judicious and precise setting of which results in targeted weld quality [5]. Weld quality is characterized by weld chemistry, as well as the mechanical and metallurgical properties of fusion zone, heat affected zone (HAZ), and bead geometry features. Welding is economical, efficient, and sound when the deposition rate is maximum [6].
Manufacturing of steel structures involves welding as an important phase and fundamental relevance will be assumed in the manufacturing of these technologies. Submerged components, especially in the oil and gas sector impair their proper functionality due to welding discontinuities and defects that are primarily root cause of crack initiation and propagation [7]. Owing to the excellent mechanical properties of SA 516 grade 70 prove it the essential and primary material for the boiler at high working temperatures and good weld-ability. In this regard, these steels got widespread applications in steam generating plants, super heater tubes, and piping. Analytical and experimental design techniques have been widely used for establishing relationships among quality characteristics and process parameters so the desired quality can be fetched efficiently [8]. The microstructure of weld sturdily affects the productivity, integrity, strength, hardness, toughness, and formation of weldment defects.
Ahire et al., applied a genetic algorithm (GA) for optimization of manual metal arc welding (MMAW) process parameters on a dissimilar joint of low carbon steel and stainless-steel SS 304. The experiments were designed by response surface methodology (RSM) to optimize the effect of root gap, welding speed, welding current, and electrode angle on deposition rate and weld strength. They reported that GA significantly improved the process [9]. Ali et al. developed a mathematical model for the SMAW process by employing an artificial neural network, and underlined the effect of preheating, cryo-treatment on weld joint characteristics such as grain growth and refinement, HAZ depth, and weld interface. Authors concluded from literature that heat input directly effects HAZ and penetration which is a function of polarity, travel speed, and current [10]. Bhaduri et al. optimized the tensile strength by investigating the effect of post-weld heat treatment (PWHT) procedures and heat inputs on two microstructures of stainless steel 17-4PH. They concluded that optimum hardness distribution was obtained by using 3.15 mm electrodes that have an intermediate heat input [11]. Osayi et al., attempted to optimize the ultimate tensile strength UTS of the weld joint by employing the Taguchi method fabricated by the MMAW process on low carbon steel AISI 1020. In their investigation welding current was found to be the most significant factor followed by welding speed and root gap respectively [12]. Mirza et al. developed mathematical models and optimized the weld joint properties of various materials such as high strength low alloy (HSLA) steel and AA6061-T6 welded by plasma arc and friction stir welding respectively. They explored that the microstructure of weld joint effects the mechanical properties quite significantly [13]. Numerous researches claimed that induced welding stresses adversely affect the product quality in operational life. Further, these stresses deteriorate mechanical properties and cause distortions in joints. In addition, different combinations of welding parameters, such as preheating, electrode diameter, weld sequence, groove angle, number of passes, heat input, job thickness etc. are investigated by experimentation to explore their individual and joint effect on welding distortions and joint properties [14,15]. In addition, it is claimed that welding distortions are unavoidable and its consequences cannot be ignored. Attempts are made to formulize a mathematical relationship to predict angular distortion in the steel structure. Further, welding distortion cause assembly problems, that requires rectification, thereby increasing manufacturing and assembly costs significantly [16]. Amir et al. attempted Taguchi method to optimize angular distortion of SMAW on low carbon steel joints. The effect of root gap, welding current and grove types was investigated. Welding current was found to be significant factor. However, information of electrode diameter used is missing [17]. It is assumed in TGRA, that all quality characteristics are independent and assigned equal weights. However, in real cases, this deviation may occur and to triumph over these issues, Hotelling and Pearson developed principal component analysis (PCA), which calculates prioritized weights for each quality responses. Kumar et al. applied PCA in TGRA to optimize mechanical properties of silica fly ash composites [18]. PCA has been vastly applied in fields of EDM [19], weaving [20], welding [21,22], etc.
The local industry is facing the problem of identification and control of input process parameters to obtain a weld quality joint with desired specifications. Currently, the welding parameter setting was determined by traditional procedures that encompass an experimental trial and error method: which is a time-consuming and error-based development method. This paper is framed at identifying, evaluating, and optimizing the influence of SMAW parameters on response variables for alloy steel SA 516 Grade 70 by employing Grey relational analysis (GRA) coupled with principal component analysis (PCA). Nine experimental runs were performed based on an L9 Taguchi orthogonal array to access best parameters combination for response variables namely tensile strength (TS), impact energy (IE), hardness, and angular distortion (AD). With reference to the available literature and best knowledge of the author, the optimization of the SMAW process with selected parameters for desired responses by employing GRA coupled with PCA has not been reported yet. Therefore, this paper constitutes a definite and worthwhile contribution to novelty in the related literature.
This research presents firstly the material and process parameters selection followed by the Taguchi experimental design. Then, the analysis of experimental results by Taguchi S/N ratios and GRA coupled with PCA was discussed. Validation of experimental results through confirmatory experiments is carried out in the last section.

2. Materials and Methods

2.1. Work Piece Material

In this study, samples of 16 mm thick carbon steel plates of SA 516 Grade 70 were used in welding experiments with dimensions 220 mm length and 110 mm width. SA 516 grade 70 is Carbon-Manganese steel most extensively used as major structural component in the fabrication of pressure vessels, boilers and petroleum tanks due to its sound weld ability and adequate mechanical properties at high temperatures [23]. Table 1 depicts chemical composition of SA 516 grade 70 [24].

2.2. Parameters and Response Variables

SMAW process involves large number of parameters that affect joint performance. In this study, four process parameters were selected after an extensive literature review and trial experimentation.

2.2.1. Tensile Strength

Specimens for tensile strength test as per A 370 standard were prepared. Tests were performed at room temperature on hydraulic Universal testing machine 50 ton capacity. The tensile test specimen is shown in Figure 1.

2.2.2. Impact Energy

To measure impact energy, the Charpy test was performed at an ambient temperature of 28–32 °C. Notch position was determined by macro-etching of samples in 2% Nital solution. The dimension of specimen was 55 mm × 10 mm × 10 mm. The Charpy impact test specimens for different experimental runs as expressed in Table 2 are shown in Figure 2.

2.2.3. Hardness

Hardness was measured using portable Brinell hardness tester (EQUOTIP®, Schwerzenbach, Switzerland) as per ASTM A 370 standard [25]. The surface of work piece was polished and etched for ease in distinguish among weld zones.

2.2.4. Angular Distortion (AD)

Angular distortion is the upward buckling of workpieces during welding due to the non-uniform rapid heating and cooling cycles during welding process induces residual stress in welded part. These residual stresses induce numerous types of distortions, adversely affects the performance of steel structures. Numerous problems such as dimensional inaccuracy, bending, decreased joint strength, buckling, and misalignments etc. Numerous techniques have been developed to overwhelm the adverse effects, however, techniques require tedious efforts and resource consumption [26]. AD of weld joint depends upon preheating, root gap, bead geometry groove angle, number of passes, plate thickness, heat input etc. [14]. AD decreases significantly by preheating the specimen, that lowers the joint residual stresses [15]. A dial gauge was used to measure angular distortion at different points of specimen [16]. Figure 3a,b depicts the angular distortion and its measurement respectively.
Using Figure 3b, the trigonometric relationship employed for determination of angular distortion in degrees, is expressed in Equation (1) [27].
θ = tan 1 Q P  

3. Experimental Design

Taguchi orthogonal array become a valuable method for designing experiments to analyze quality characteristics and useful tool for obtaining highly reliable results, especially when the objective is the reduction of material cost and time [18,
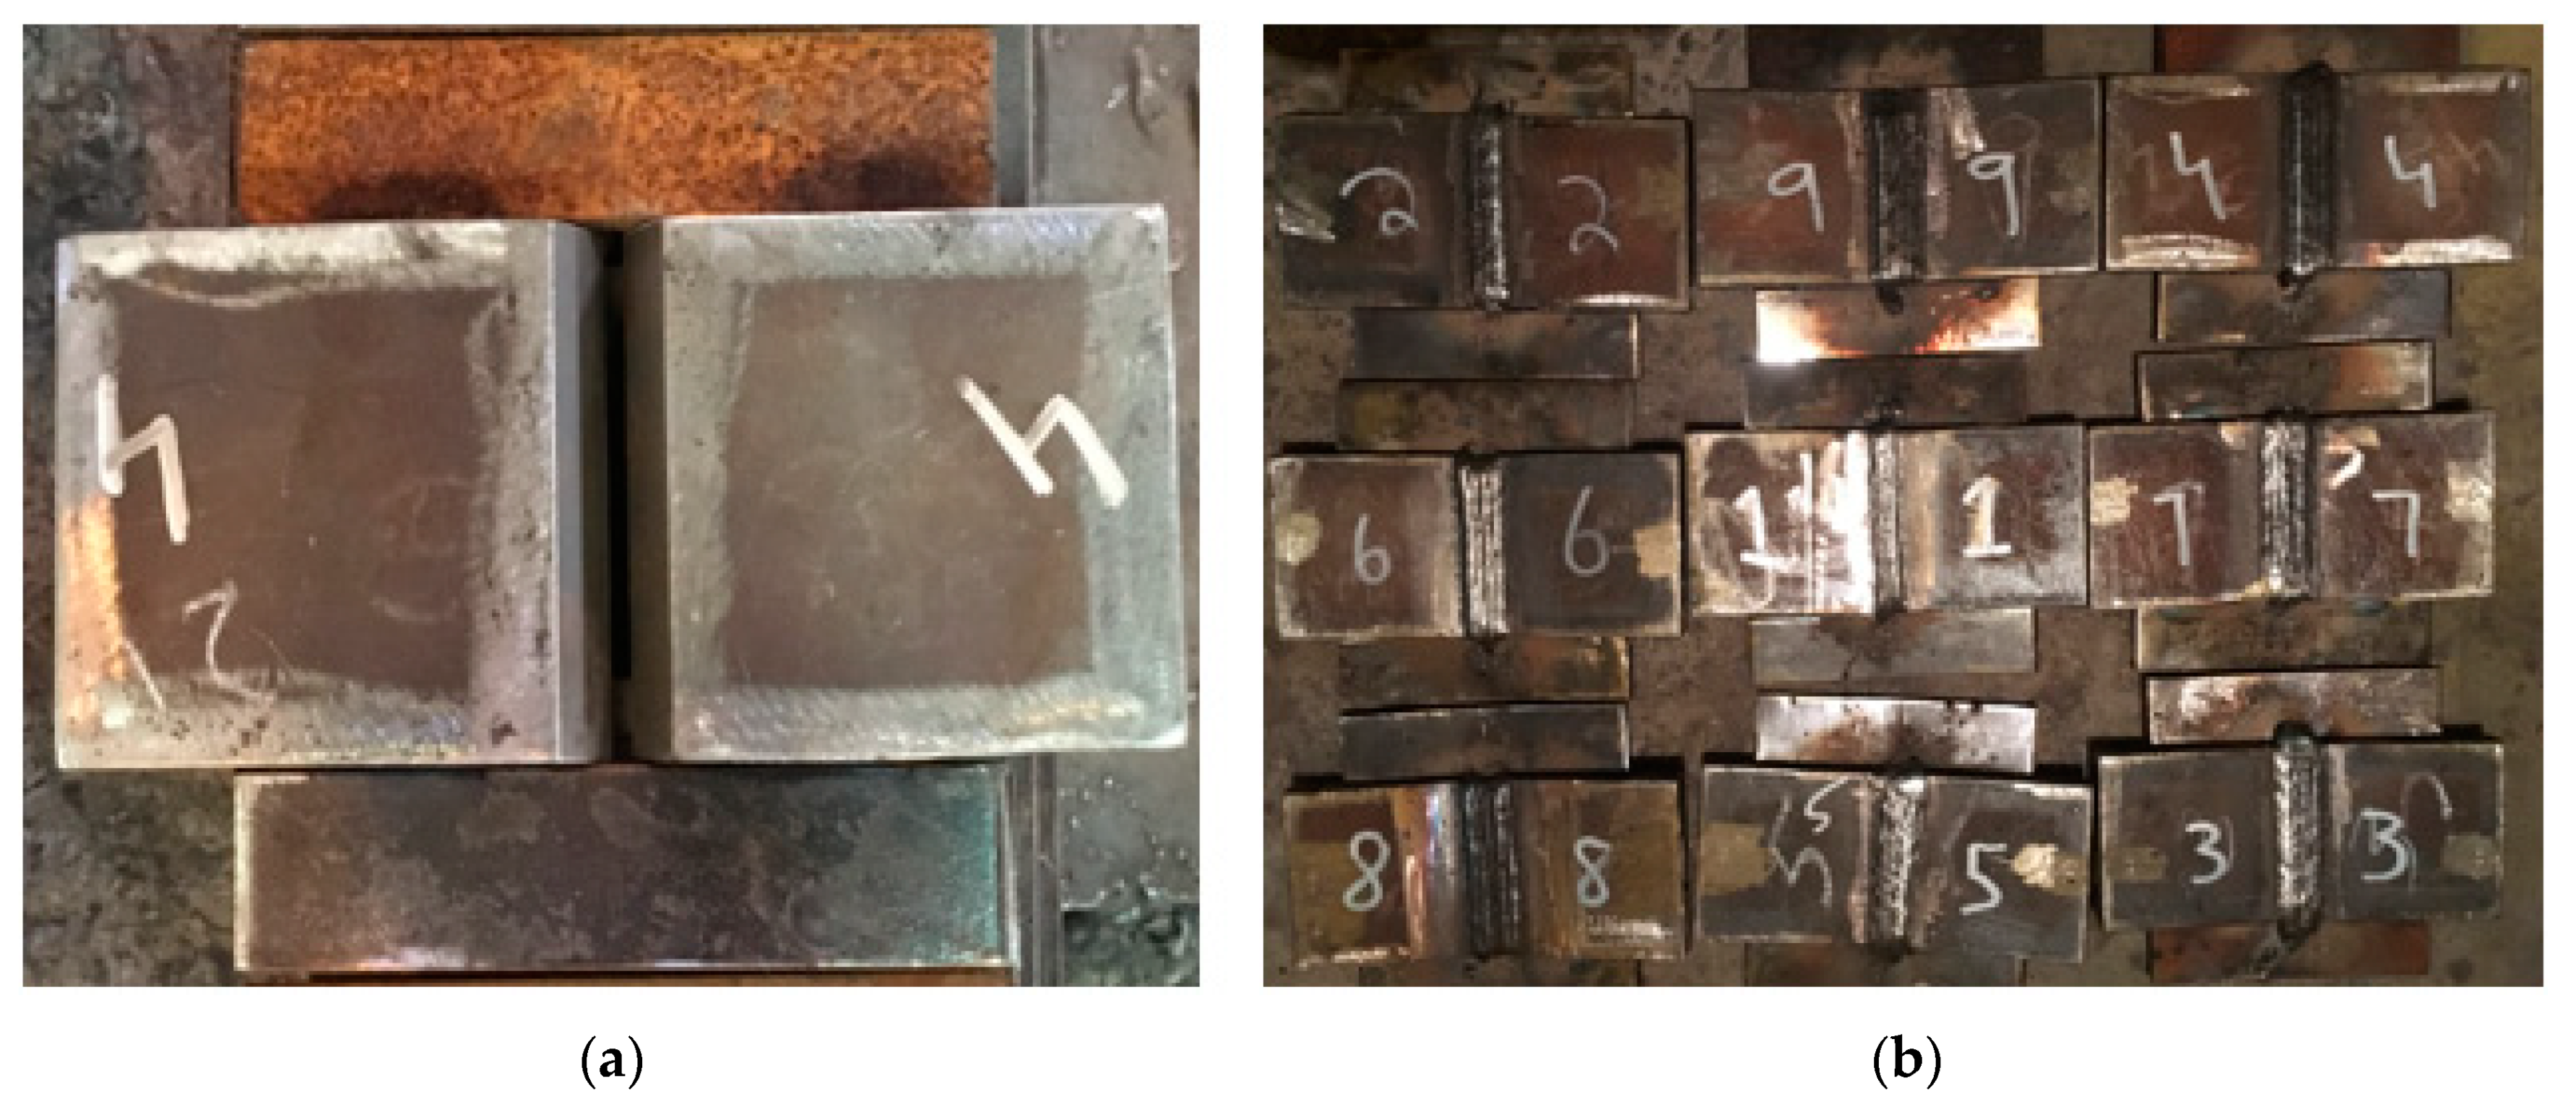
28]. Butt weld joints with single-V, square joint, double-V groove types are frequently adopted when the goal is a smooth surface. V type groove geometry is selected as it provides the best results for mechanical properties [29]. Tacked and welded samples are shown in Figure 4a,b.
The operating ranges of welding parameters chosen based on screening experiments and from American Welding Society (WPS) handbook and equally divided in three levels. Selected parameters and levels are depicted in Table 3.
The selected parameters are briefly defined in following sections

3.1. Groove Angle

Groove angle is a channel between two joining members that provides space for deposition of weld metal. It is the included angle between work pieces to be joined. Proper selection of groove angle significantly improves joint penetration, joint strength, and minimizes welding distortions.

3.2. Preheating

Preheating is the process of heating work pieces to a predetermined temperature before commencement of welding operation. It is a form of heat treatment that plays a significant role governing joint properties. It is performed to retard the drastic cooling of HAZ and WM thereby greatly improves joint ductility and reduces the weld hardness. The profound effects of preheating are increase in grain size and depth of HAZ [10]. It also allows for diffusing absorbed hydrogen from WM and thereby helps in reducing the susceptibility of hydrogen induce cracking [30]. The dominant advantages of preheating are lowering residual stresses, moisture removal from joint, uniform expansion and contraction, and the improvement of fusion properties. In contrast, excessive preheating should be avoided as it induces thermal distortions.

3.3. Electrode Diameter

Electrode diameter significantly affects penetration depth and weld bead shape. At a specified current level, a smaller diameter electrode has a higher current density that results in high deposition. In contrast, electrodes of a larger diameter carry more amperage than a smaller one, and thus a larger diameter electrode deposits metals at higher rates.

3.4. Root Gap

Root gap is one of the initial geometrical features in welding of large steel structures that offers access to welding electrode and improves weld penetration to joining members. In order to obtain sound welding quality, the effect of root gap is necessity to be taken into account [31]. One of the emerging techniques for increasing productivity is narrow gap welding that significantly reduces number of passes. Root gap significantly effects welding distortion [31].
In this study, single V-Groove of three different angles was prepared by machining on the joining side of plates. Before welding, surfaces were grinded and cleaned to remove dirt and oxide scales. To provide same obstruction against angular distortion, ST-37 (low carbon steel) plates of dimensions 150 mm × 40 mm × 6 mm were tacked as fixture on both sides of plates. A butt joint was applied for welding in Flat (1 G) position by following the welding standards as per ASME IX [32]. The joint strength and economy was achieved by depositing root pass was using gas tungsten arc welding (GTAW), whereas hard, filling, and capping passes were performed by shielded metal arc welding (SMAW) [33].
The temper-bead-welding (TBW) technique is adopted for weld metal deposition as it significantly reduces residual stresses, hardness, deterioration of toughness properties. The travelling time for bead deposition in each layer was recorded. During experimentation, inter-pass temperature, polarity, electrode type, and welding speed were kept at 150 °C, direct current with positive polarity (DCEP), low hydrogen electrode E-7018, and 14–16 cm/min, respectively. To minimize spatter and undercut, the welding current and arc length were selected in accordance with requirements of electrode diameters for filling and capping passes.
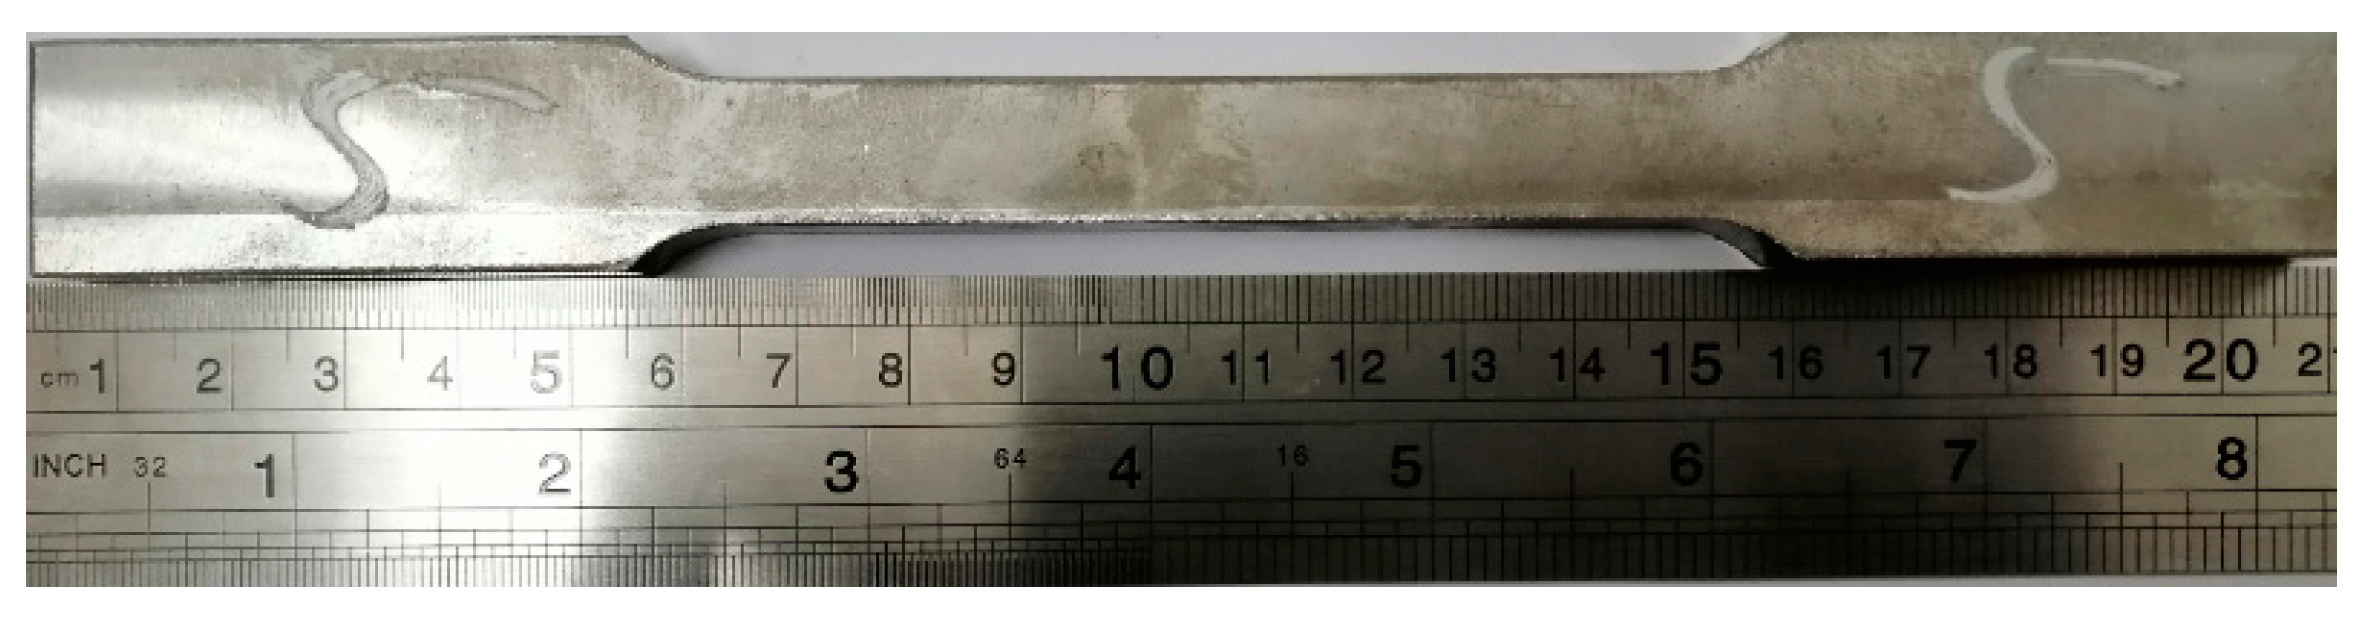
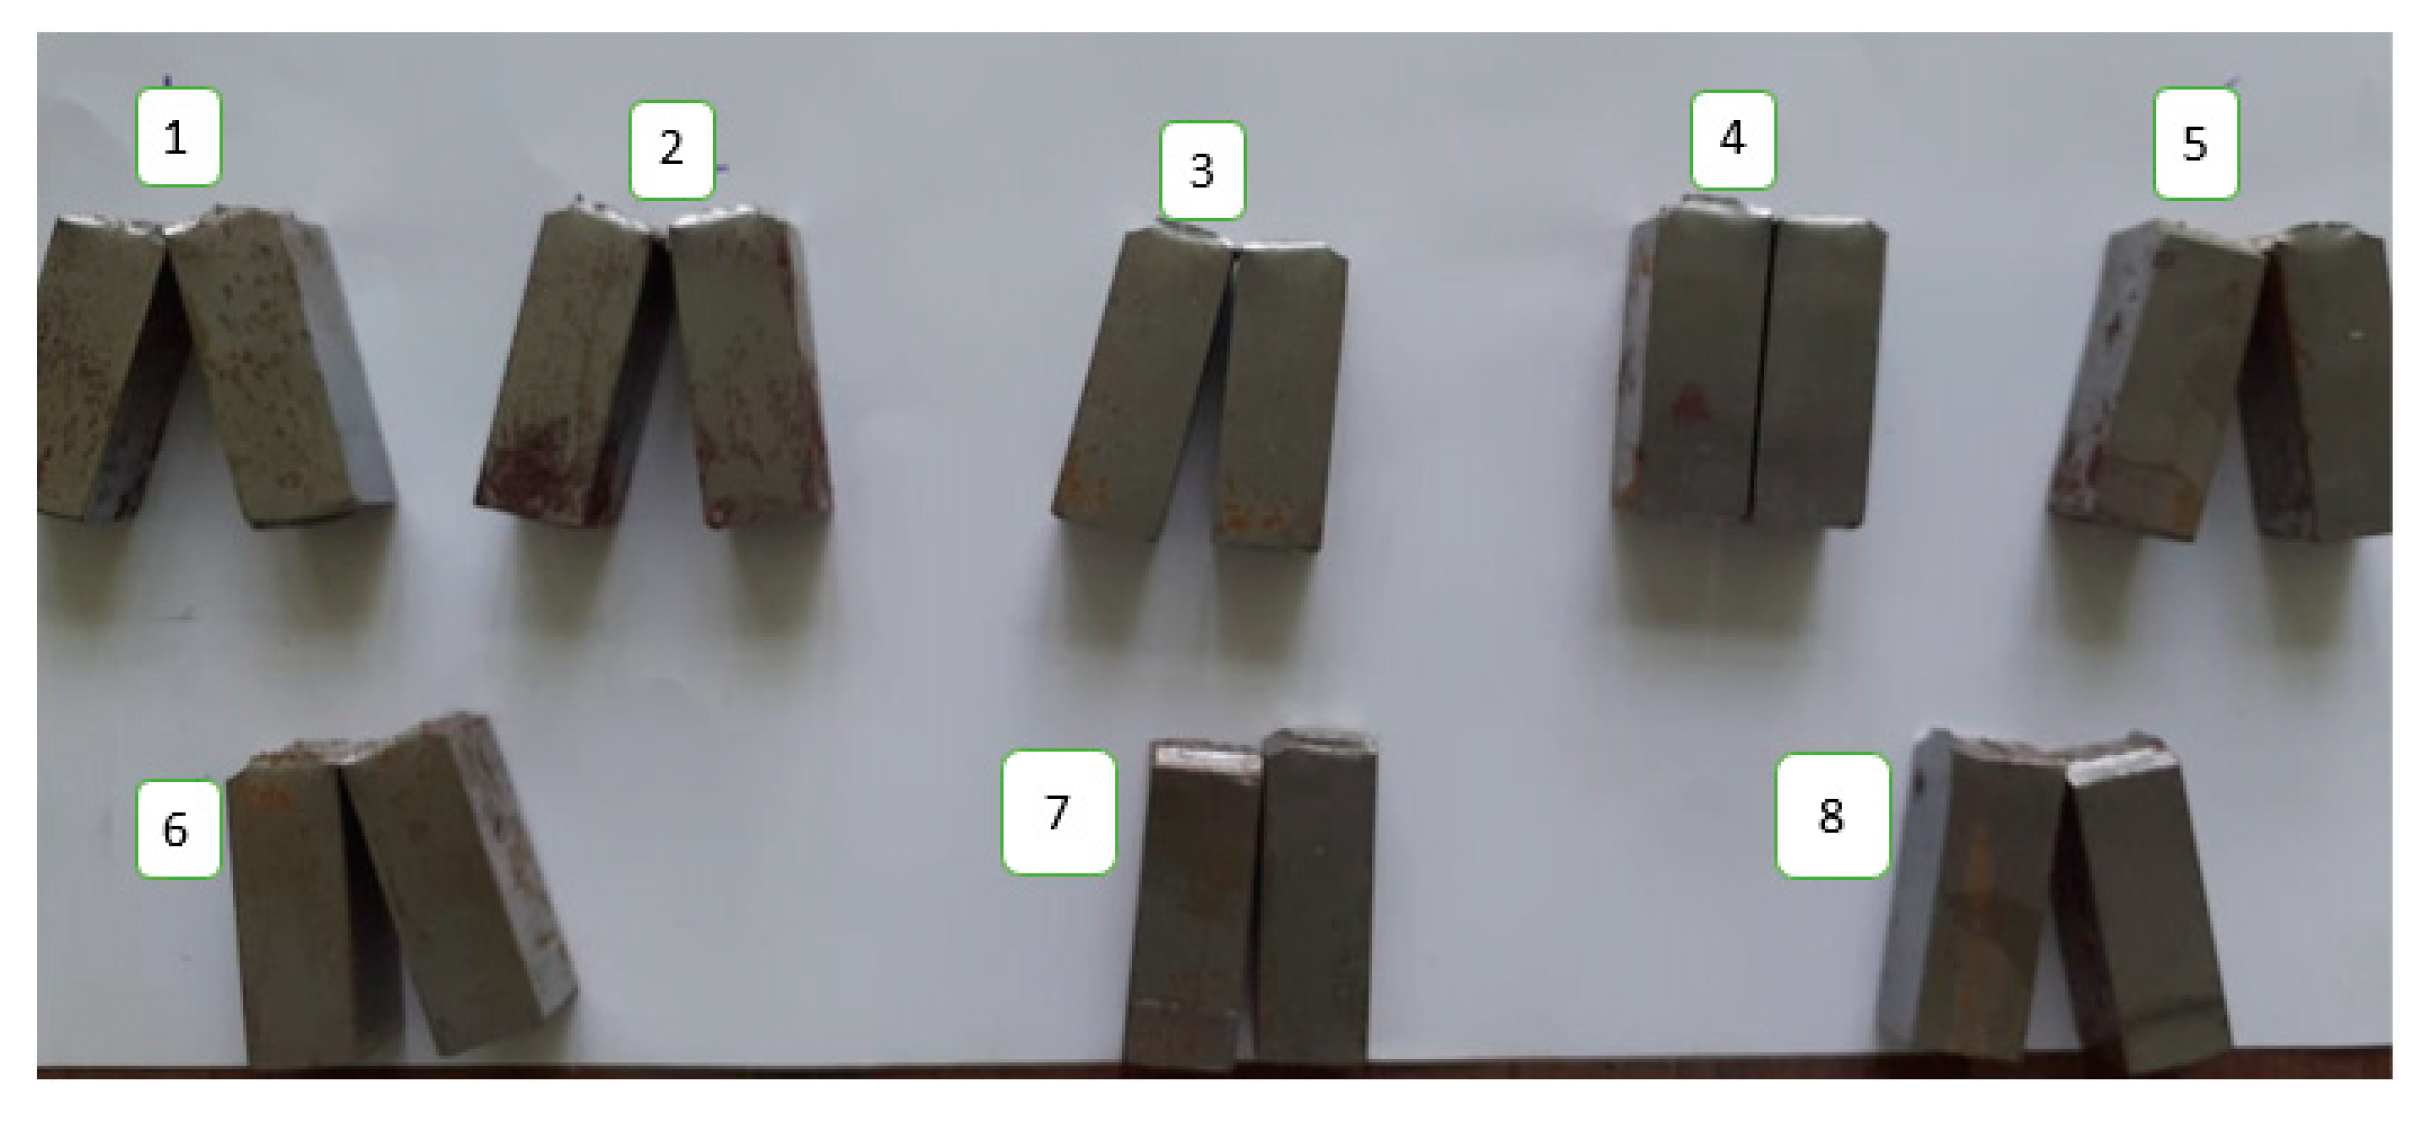
Experimentation focused on changing in mechanical properties fusion zone and angular distortion of fabricated sample. Tensile, impact, and hardness tests were performed as per ASTM standard A 370 [34]. The test samples were sectioned across the welding direction in such a way that weld metal (WM) was in center of test coupons so that fractured encountered only in weld zone [35,36]. As three levels were set for each welding parameters, so the minimum of nine experimental runs were scheduled based on Taguchi orthogonal array L9 design, in order conserve resources and cost of experimentation. Table 2 depicts the Taguchi orthogonal array L9 design based on coded matrix, un-coded matrix, and experimental data.

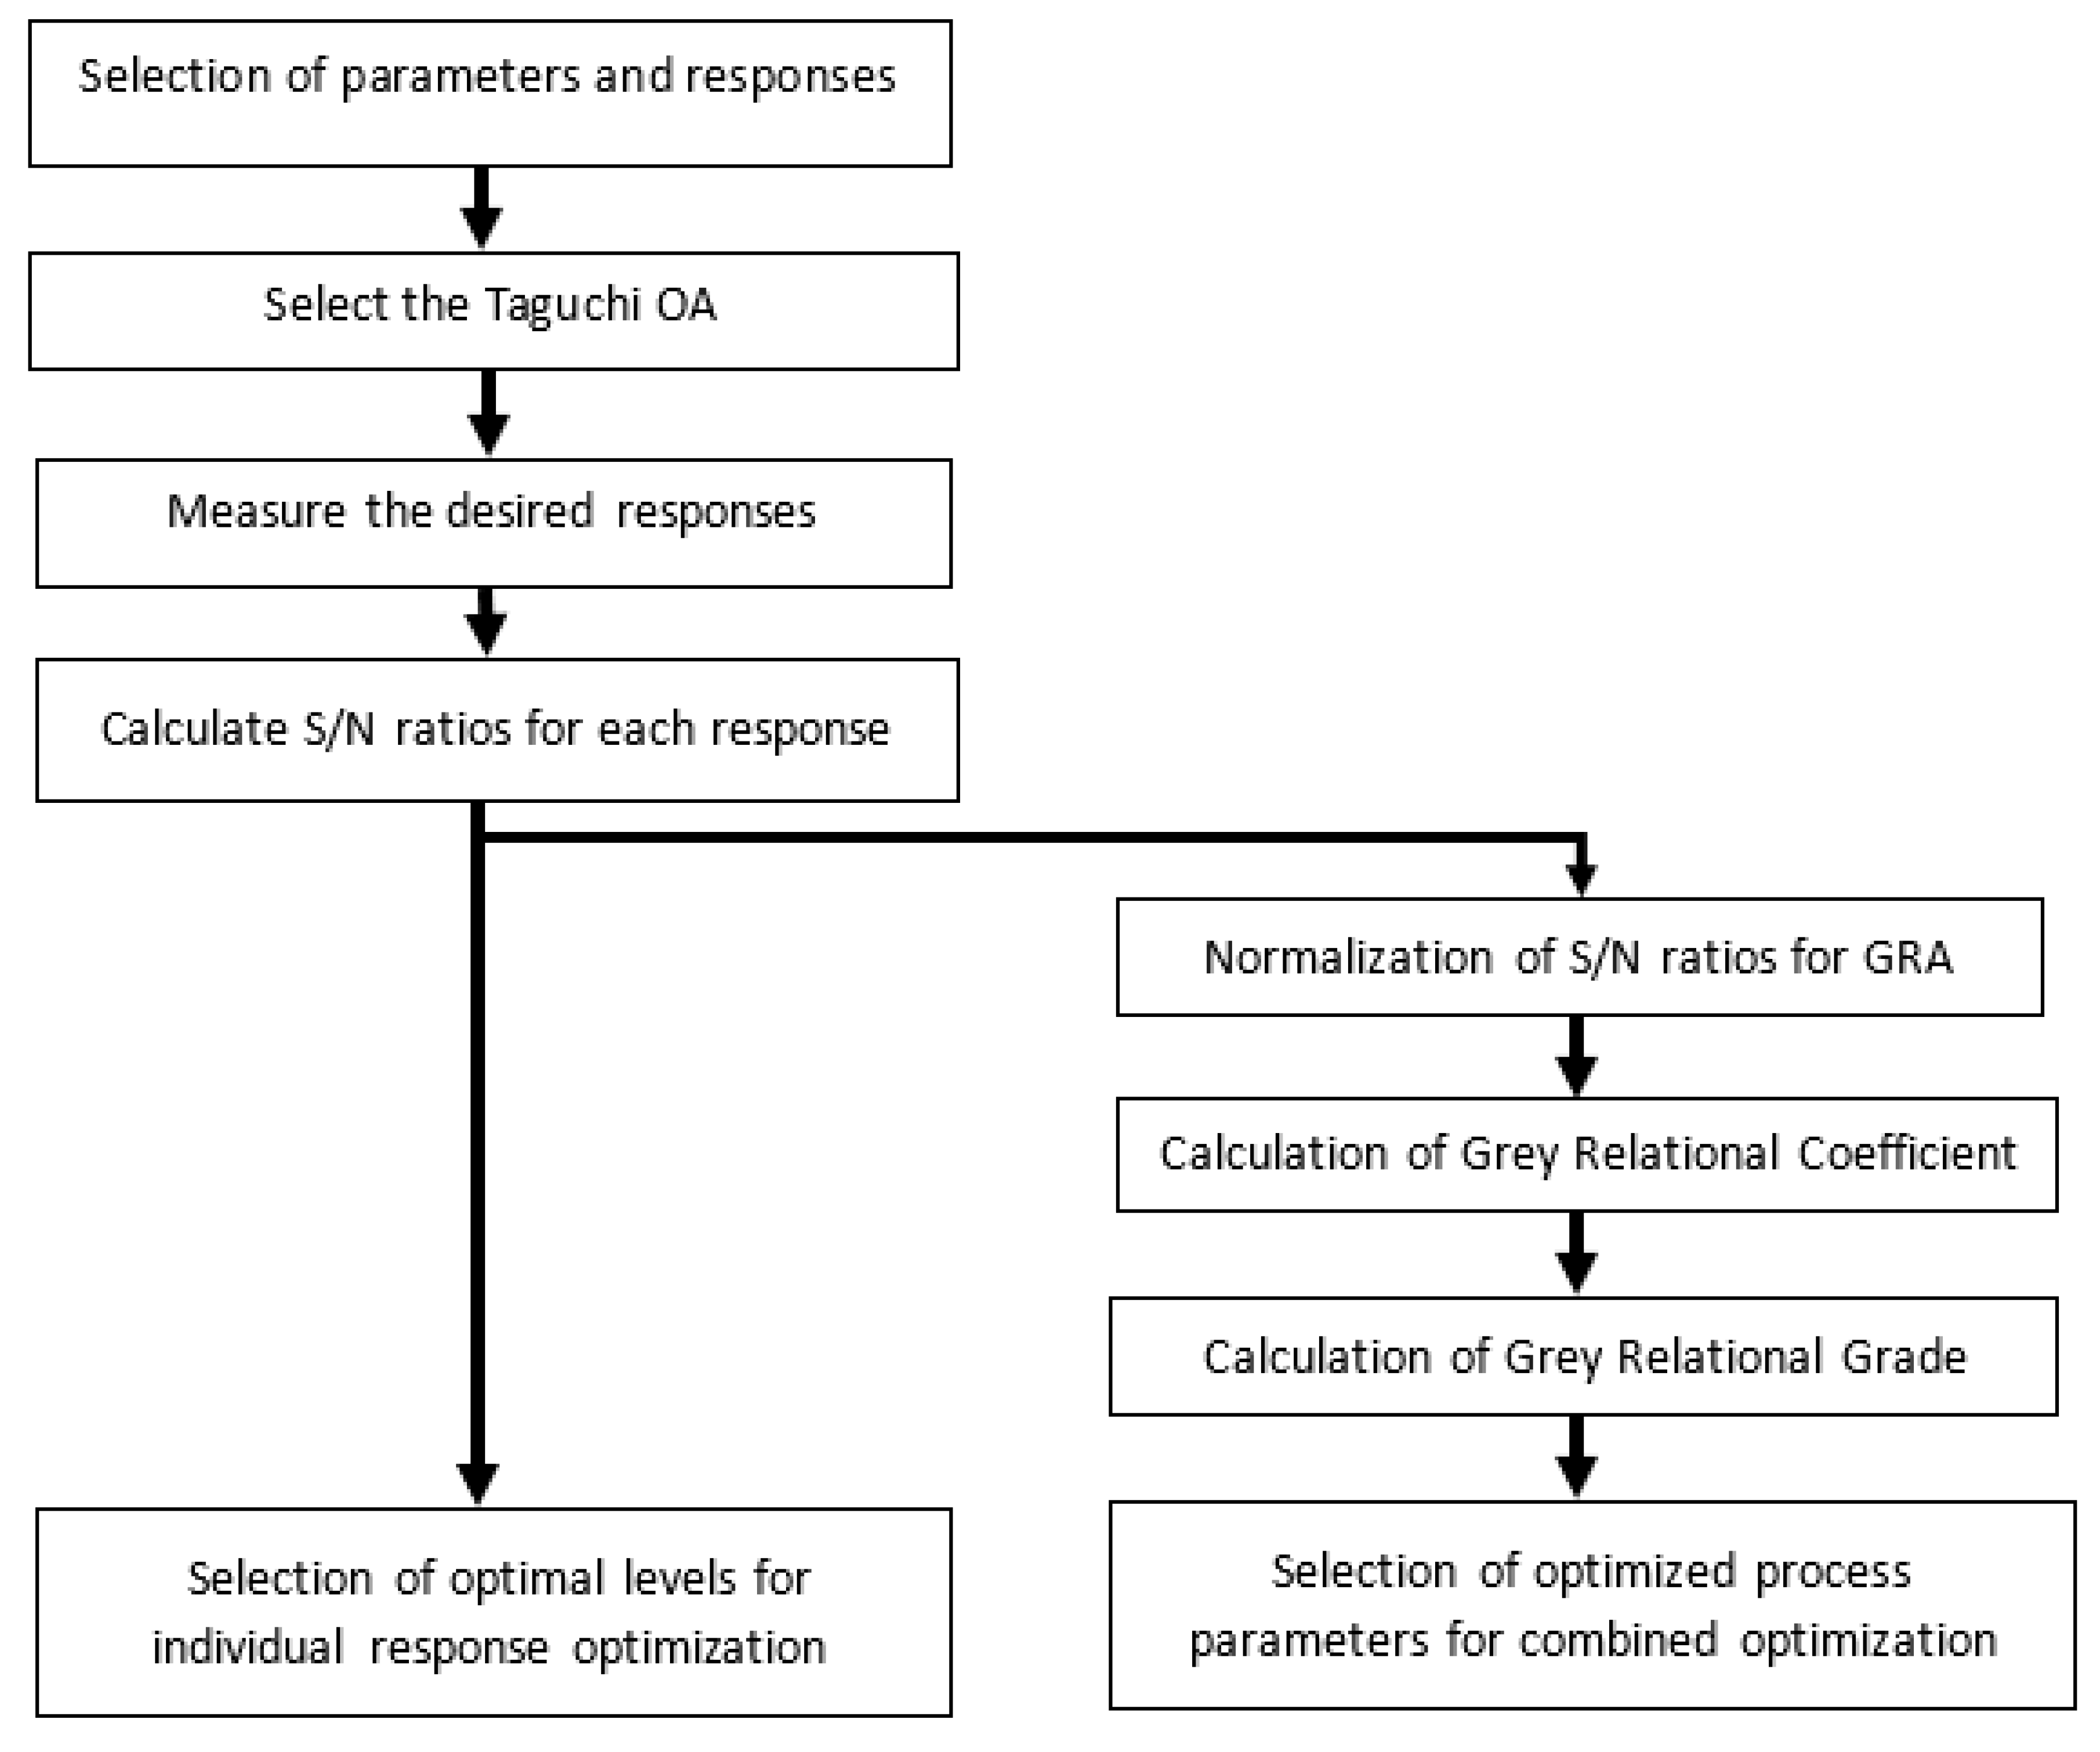
4. Optimization Methodology

In this research work, Taguchi orthogonal arrays was employed for obtaining design matrix involving limited number of experiments that covers whole parametric space. Experiments are performed according to Taguchi orthogonal array design. The Taguchi method is popular commonly applied for optimizing of engineering problems; however, it is mono-optimization process [37,38,39], whereas several processes involve multiple response optimizations. Hence, the Taguchi method can’t tackle the optimization of multiple responses efficiently [40].
The larger, the better S/N ratio as computed from Equation (2):
S / N   r a t i o = ( 10 ) × log 10 ( 1 x ) i = 1 x 1 y i j 2
The smaller, the better S/N ratio as computed by Equation (3):
S / N   r a t i o = ( 10 ) × log 10 ( 1 x ) i = 1 x y i j 2
where x is number of replications and y i j is measured observation.
Welding process has multiple responses and welding quality sturdily depends upon optimizing all responses simultaneously. Therefore, researchers frequently employ GRA coupled with PCA for optimization of multiple responses simultaneously. These techniques are entirely different to traditional single response optimization. These are effective statistical methods and offer quite successful results in obtaining a combination of parameters for multiple response optimizations [41]. Figure 5 depicts the concept of PCA-GRA.
In 1982, Deng proposed GRA method that is principally employed for analyzing the effect of process parameters on multiple responses where information is deficient, and system is ambiguous. GRA initiates with Grey relational generation [42], which involves the linear normalization of experimentally collected data (reference sequence) in a range between 0 and 1 (comparable sequence).
Depending upon the objective of this paper, the maximization of tensile strength and impact energy is of interest. Therefore, larger-the-better criterion is selected for these quality characteristics and normalized results can be expressed as Equation (4)
y j * ( q ) = y j ( q ) m i n   y j ( q ) m a x   y j   ( q ) m i n   y j ( q )
Further, hardness and angular distortion need to be minimized, thus the smaller-the-better is used, as expressed in Equation (5)
y j * ( q )   m a x   y j   ( q ) y j ( q ) m a x   y j   ( q ) m i n   y j ( q )
where y j * (p) are the generated grey relational values, while max y i ( q ) and min y i ( q ) are the largest and smallest values of y j (q) for qth observation, respectively. q = 4 is the number of response variables. The nine observations of the experiments are comparability sequence y i ( q ) ,   j = 1 , 2 , , 9 , . The best normalized results should be equal to 1, therefore; for achieving better performance, larger value of normalized results is expected.
Data normalization is followed by calculation of grey relational coefficients (GRC) that displays the relationship between desirable and real experimental normalized results. Expression of GRC ξ j ( q )   is determined, as follows in Equation (6)
ξ ( y j * ( q ) , y 0 * ( q ) ) = Δ m i n ( q ) + ζ   Δ m a x   ( q ) Δ 0 j   ( q ) + Δ m a x   ( q )
where Δ 0 i ( q ) = | y 0 * ( q ) y ( q ) | is deviation sequence, defined as absolute of difference between reference sequence y 0 *   ( q ) and comparability sequence y j *   ( q ) . The identification or distinguishing coefficient (𝜁), takes value as 𝜁 𝜖 [0, 1], which is generally and in this paper were set as 0.5 [43]. Grey relational grade (GRG) provides information about correlation strength between the experimental runs, which is computed by weighted mean of respective GRC’s for all experimental. GRG value lies between 0 and 1, γ 𝜖 [0, 1]. Usually, an experimental run with larger GRG is considered the ideal case, which indicates the strength of correlation between corresponding experiments and the ideally normalized value. When equal weights are opted for all quality responses, Equation (7) is used for GRG calculation.
γ j ( y 0 * , y j * ) = 1 n   q = 1 n ξ ( y j * ( q ) , y 0 * ( q ) )
In some applied applications, weights of quality characteristics are different likewise weights obtained from PCA. In such cases, Equation (7) is modified as Equation (8) [44]:
γ j ( y 0 * , y j * ) = 1 n   q = 1 n w q   ξ   ( y j * ( q ) , y 0 * ( q ) )
where γ j ( y 0 * , y j * ) is GRG for j t h experimental run, n is number of quality response, w q is weight of q t h quality response and q = 1 n w q = 1 .

Principal Component Analysis (PCA)

PCA is a powerful multivariate statistical technique for multi-objective optimization [20] that reduces the complexity, correlation, vagueness, and dimensions of information by simplifying and combining numerous allied arrays into few uncorrelated arrays and principal component. PCA employs linear permutation for conserving unique information to maximum extent [45]. Thus, it converts multi-response optimization to single response optimization without compromising original information [46]. It begins by setting a structure of linear combinations arrays of multi-responses. The GRC’s computed for response variables is employed to form a matrix, presented as Equation (9)
y = [ y 1 ( 1 ) y 1 ( 2 ) y 1 ( k ) y 2 ( 1 ) y 2 ( 2 ) y 2 ( k ) y j   ( 1 ) y j ( 2 ) y j ( k ) ]
where y p ( q ) is GRC of each quality responses, p = 1, 2,…j, experiments and q = 1,2, … k, quality responses. In this research, j = 9 and k = 4. Thereafter, the coefficient correlation matrix can be generated by the following expression:
R j l = ( C o v   ( y p ( q ) , y p ( l ) ) σ y p ( q )   * σ y p ( l ) )   q = 1 , 2 , k ;   l = 1 , 2 , , k
where C o v ( y p ( q ) , y p ( l ) is the covariance of sequences y p ( q ) and y p ( l ) . σ y p ( q ) is standard deviation of sequence y p ( q ) and σ y p ( l ) is standard deviation of sequence y p ( l ) . The eigen values and eigen vectors are computed from R j l array as per Equation (11)
( R λ k I j )   V p k = 0
Thereafter, eigenvalues ( λ k ) and eigenvectors ( V p k ) of square matrix R are used to determine the uncorrelated principal components (PC’s) by using Equation (12)
Z j k = i = 1 n Y j ( p ) × V p k
where Z j k corresponds to kth principal component. Eigenvalues and principal components are arranged in descending order with respect to explained variance, therefore, first eigenvalue associated with first PC accounts for largest variance contribution. Eigenvalues corresponding to eigenvectors are presented in Table 4.

5. Results and Discussion

5.1. Probability Plots

Probability plots measures the distribution of experimental data, as tabulated in Table 2. The Anderson Darling (ADT) test, a powerful statistical tool generally employed for outlier detection from normality, is employed for validation of normality assumption [47]. Figure 6 shows that the experimental data for all responses falls near the fitted line, and the Anderson Darling (ADT) statics values are relatively low and p-value of the test are greater than 0.05 so it is assumed that the data follows normal distribution. Therefore, further analysis and optimization can be performed on the data.

5.2. ANOVA and Main Effect Plots of Means for Individual Responses

The analysis of variance (ANOVA) is performed at 95% confidence interval to study the main effect of input parameters on individual response. The ANOVA results for tensile strength, impact energy, hardness and angular distortion are expressed in Table 5. p-value less than 0.05 shows significance of parameter.
In the case of tensile strength, the most influencing parameter is electrode diameter (ED) with % contribution of 55.18%, followed by preheat temperature (PHT), i.e., 23.38%, groove angle (GA), i.e., 16.55%, while root gap (RG) is found to be insignificant, having the least % contribution of 2.11% and p-value greater than 0.05. Figure 7a shows the main effect plot of means for tensile strength. It shows that tensile strength increases with increase in groove angle, preheat temperature, and electrode diameter from low level to high level, i.e., 50–70°, 75–125 °C, and 2.6–4.0 mm, however decreases with increase in root gap from low level to high level, i.e., 2–4 mm. The results are in line with the studies [48,49,50]. In all trails of tensile tests, samples were fractured from base metal, this indicates high joint strength that may be due to presence of acicular ferrite in WM which imparts high strength [51]. An overall increase in WM tensile strength was noticed. Main effects plots of tensile strength are shown in Figure 7a.
For impact toughness GA is significant with % contribution of 61.03% followed by ED (18.32%), RG (11.30%) and PHT (6.31%). From Figure 7b, it is evident that impact energy increases dramatically with increase in groove angle from low level to high level. Similarly, it increases steadily with an increase in PHT and ED from low level to high level. In contrast, impact energy drops linearly with increase in root gap from low level to high level. These results are in line with findings of literature [52,53]. Main effects plots of impact energy are shown in Figure 7b.
For hardness, the order of significance is RG (49.35%), PHT (23.47%), ED (12.37%), and GA (12%). It is evident from Figure 7c that hardness decreases sharply with an increase in PHT and ED, Further, hardness increases with an increase in GA and RG. Hardness noted at WM zone was nearly 7% percent higher than base metal and fluctuation among measured values also witnessed. This high hardness and scattering could be attributed to smaller grain size, metallurgical changes, difference in carbon content and rapid cooling rates as reported [54]. Highest hardness in observed in WM, followed by HAZ and BM. The higher value of hardness in WM zone can be attributed to presence Widmanstatten ferrite. The hardness of samples varied from 161–195 HB. In contrast with WM hardness, lower HAZ hardness is may be due to preheating. The results are in line with findings of the literature [34]. Main effects plots of hardness are shown in Figure 7c.
Finally, for angular distortion the most contributing factor is PHT (43.38%), followed by RG (25.26%), GA (14.64%), and ED (13.86%). From Figure 7d, it is evident that angular distortion increases sharply with an increase in GA and RG, Further, AD decreases with increase in PHT and ED. The results are in line with work of [17,55]. Main effects plots of angular distortion are shown in Figure 7d. Table 4 depicts the ANOVA results for quality responses.
The effect of selected welding parameters on response variables are expressed in Section 5.2.1, Section 5.2.2, Section 5.2.3 and Section 5.2.4

5.2.1. Groove Angle

A sharp increase in impact strength with increase in included angle, this is due to increase in volume of deposited weld metal. In this research hardness value raised with the increment in groove angle, this is due to increase in volume requirements of filler metal to fill groove [56]. Secondly, increase in surface area of molten metal weld pool causes rise in cooling rate that reduces grain growth time and rapid development of fine grains that increase hardness [57]. Larger included weld groove angles have greater volume. Hence, larger filler metal deposition is required to fill them. This greater deposition involves more expansion and contraction cycles resulting in generation of greater induced residual stresses. The magnitude of angular distortion become very large and effects structural integrity.

5.2.2. Preheating

Preheating of work piece limits the cooling rate that directly influence tensile strength, impact toughness and harness of weld joint. As a result, weld metal got more time to fuse evenly with base metal thereby improves joint integrity. Increase in preheat temperature changes the mode of fracture in weld joints from brittle to ductile. The increase in preheat temperature promotes formation of pearlite and ferrite that Low preheat temperature shortens the cooling time which leads to intensive hardening, cold cracking and joint embrittlement [58]. The preheating significantly mitigates residual stresses and bend up angular distortion induced by the cumulative plastic strain. The two main effects of preheating are: firstly, the minimization of angular distortion through reduction in temperature gradient in workpiece that allows for the homogenous contraction of material on cooling. Secondly, it slows down cooling rates that limits volumetric fraction of martensite and promotes bainite fraction. Since the bainite volume is greater than martensite volume [59], this lowers the induced tensile stresses, leads to small distortion amplitude, and hence promotes high quality welds. The results are in line with authors [60].

5.2.3. Electrode Diameter

It is observed that smaller diameter electrodes increase heat input that leads to coarsening of grains results brittleness of joint. The higher heat input also produces significant variation in microstructure of WM and HAZ, thus coarsening of grains take place that lead to deterioration of tensile and impact strength and increase in hardness [61]. Therefore, it is crucial to restrict the heat input of welding to limited range. With the increase in electrode diameter from 2.6 mm to 4 mm, the angular distortion decreases significantly, and this is due to reduction in number of welding passes and heat input requirement for complete penetration. Further, for same heat input and groove angle, increase in number of passes due to smaller electrode diameter leads to significantly higher angular distortions. Further, TWI considers magnitude of angular distortion approximately proportion to number of welding passes [62].

5.2.4. Root Gap

An increase in root gap causes higher heat input. This increases tendency of grain growth to have adverse effects on the tensile strength of WM [63]. The higher root gap results in higher heat input that cause enlargement of HAZ which adversely effects impact energy of weld specimen [64]. Increase in root gap greatly increases depth of weld penetration that increases hardness of weld joint [63]. It is observed that increase in root gap involve as many weld passes, the heating and cooling cycles during each weld pass induces higher bend stress and different final stresses. This extends the distribution of weld residual stresses over wide range. In specimens with a 4 mm root gap, lifting of the specimen from both sides is greater than specimens with 2 mm and 3 mm root gaps [64]. Larger root gaps significantly increase lateral shrinkages, thus resulting in axial displacements and buckling of jobs [65]. Contrary, smaller root gaps minimize weld deposition volume, which reduces number of welding passes leading to less heat input and results in less shrinkages and distortions [66]. Further, samples fabricated with root gap of 3 mm and 4 mm are encountered with sagging defect which indicates that welding heat input is slightly higher than required. Full penetration is obtained at all three root gaps. In a root gap of 2 mm, a good surface is obtained on capping and root surfaces.

5.3. Single Objective Optimization

Individual responses are optimized based on signal to noise (S/N) ratios. In present study we have conflicting objective functions of individual responses, i.e., maximization for tensile strength and impact energy and minimization for hardness and angular distortion. Therefore, the larger-the- better-quality characteristic is applied to tensile strength and impact energy using Equation (1), while the smaller-the-better quality characteristic is applied to hardness and angular distortion using Equation (2). Optimal levels are obtained by computing the average values of S/N ratios for each response at each level as shown in Figure 8. Higher values of S/N ratios show good quality characteristics. Table 6 shows that higher S/N ratio of 56.16 and -43.58 are obtained for tensile strength and hardness at experimental run 5 having groove angle and preheat temperature at level 2, electrode diameter at level 3, and root gap at level 1. For impact energy, the higher S/N ratio observed is 39.87 at experiment 9 having a groove angle and preheat temperature at level 2, electrode diameter at level 2, and root gap at level 1. For angular distortion the higher S/N ratio computed is −11.39 at experimental run 3 having groove angle at level 1 while preheat temperature, electrode diameter, and root gap at level 3 respectively. Figure 8a,b shows the optimal levels for tensile strength and hardness, which are groove angle at level 3, preheat temperature at level 3, electrode diameter at level 3, and root gap at level 1. Figure 8c,d shows optimal levels for impact energy and angular distortion which are groove angle and root gap at level 1, preheat temperature and electrode diameter at level 3.
It is evident from Table 5 that huge inconsistency lies among the optimal setting for all responses. Therefore, the need of multi objective optimization arises.

5.4. Multi Response Optimization based on GRA and PCA

In GRA, all response variables are assigned equal weights, which may cause uncertainty in decision making. Therefore, PCA is employed to determine relative weights of quality responses [67]. In this research work, it is attempted to compare multi objective optimization performed by GRA and PCA and to validate results by confirmatory experiments.
The steps are discussed in detail in the optimization methodology section. First, the S/N ratios depicted in Table 2 are normalized using Equations (4) and (5). The Grey relational coefficient of individual responses is computed using Equation (6). Un-weighted grey relational grade is calculated using Equation (7) and presented in Table 7.
For PCA, the Eigen values and Eigen vectors are calculated by Equation (11) and PC components from Equation (12), presented in Table 4. The relative weights of quality responses are obtained by squaring the Eigen vectors of first PC. Using the calculated weights from PCA and GRCs tabulated in Table 6, W-GRGs are computed for nine experiments using Equation (8). The W-GRGs are ranked and presented in Table 6.
In Table 6, highest GRG and W-GRG value is obtained at sample no. 8. Further, in Table 8, means of GRG and W-GRG depicts identical optimal conditions. From Table 4, it is evident that first PC accounts as high as 61.4% variance contribution for four quality characteristics. Table 9 presents the squares of eigenvectors of the first PC that are chosen as weights of quality responses that are found to be equal to 0.2777, 0.1672, 0.2714, and 0.284 for tensile strength, impact energy, hardness, and angular distortion, respectively. Table 10 explains comparison of W-GRA (GRG: 0.7645) with initial conditions and found W-GRG value improved by 41.12%. Thus, the desirable multi objective optimization can be achieved with respect to single GRG. Thus, based on GRG and W-GRGs, the optimum set of input parameters levels for quality responses is A3B1C3D3, namely groove angle 70° (level 3), preheat temperature 75 °C (level 1), electrode diameter 4 mm (level 3), and root gap 4 mm (level 3).

6. Confirmation Experiment

Confirmation experiment was conducted on optimal levels of welding parameters identified by GRA and W-GRA to evaluate and verify the improvement in quality response of SMA weld joint on SA 516 grade 70. The predicted value of GRG, namely γ p r e d i c t e d , at optimal levels of parameters is calculated by following the expression as shown in Equation (13) [18]:
γ p r e d i c t e d = γ m + i = 1 n ( γ i γ m )
where γ m is mean GRG, γ i is mean GRG at optimal level of i t h welding parameter, and n are the welding parameters that significantly affect quality responses. It is obvious from confirmatory results that highest values of tensile strength and impact strength, whereas the lowest values of hardness and angular distortion are achieved.
The predicted W-GRG from Equation (13) is 0.7543. Thereafter, confirmatory experiments are performed at the optimal settings predicted by GRA and W-GRA to validate the results of both techniques and the experimental value obtained is 0.7645. Since, the GRG value improved by 0.2228 (41.12%), it is obvious that there is a good agreement between predicted and experimental values. Based upon GRA and W-GRG results, a significant improvement in tensile strength by 23.80%, improvement in impact energy by 64.38%, reduction in hardness by 3.01%, and reduction in angular distortion by 7.14% have been found. Hence, GRA and PCA based GRA are found to be useful approaches for multi-objective optimization problems. The confirmation results of tensile strength, impact energy, hardness and angular distortion are depicted in Table 10.
Results of confirmatory experiments are quite satisfactory and pronounce improvements in quality responses was observed. Process settings of GRA and W-GRA are mostly similar.

7. Microstructure

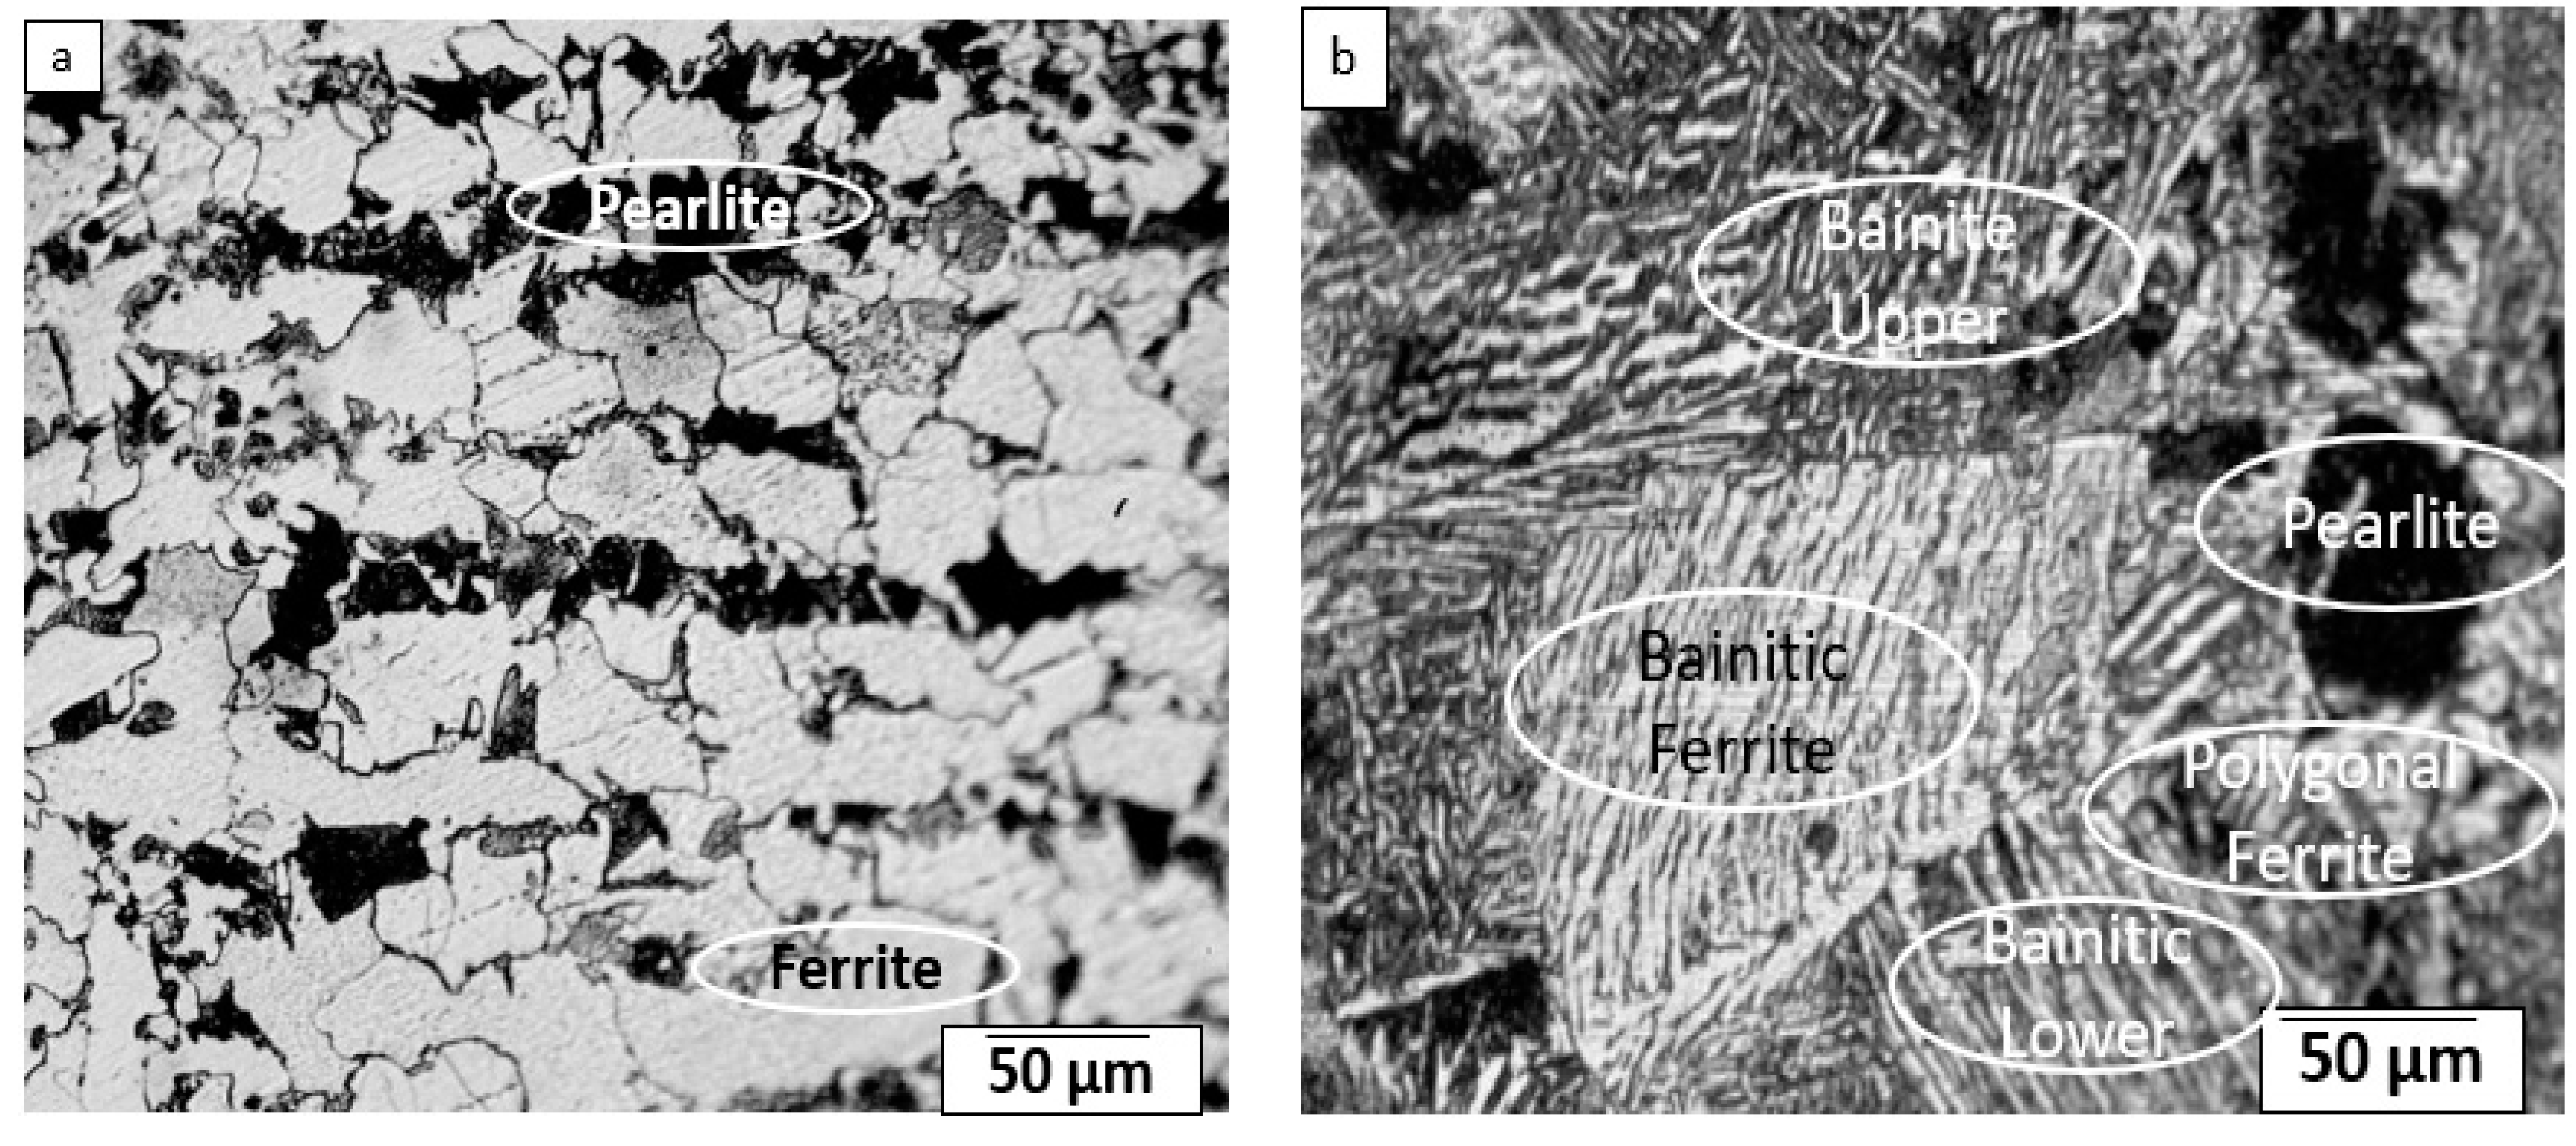
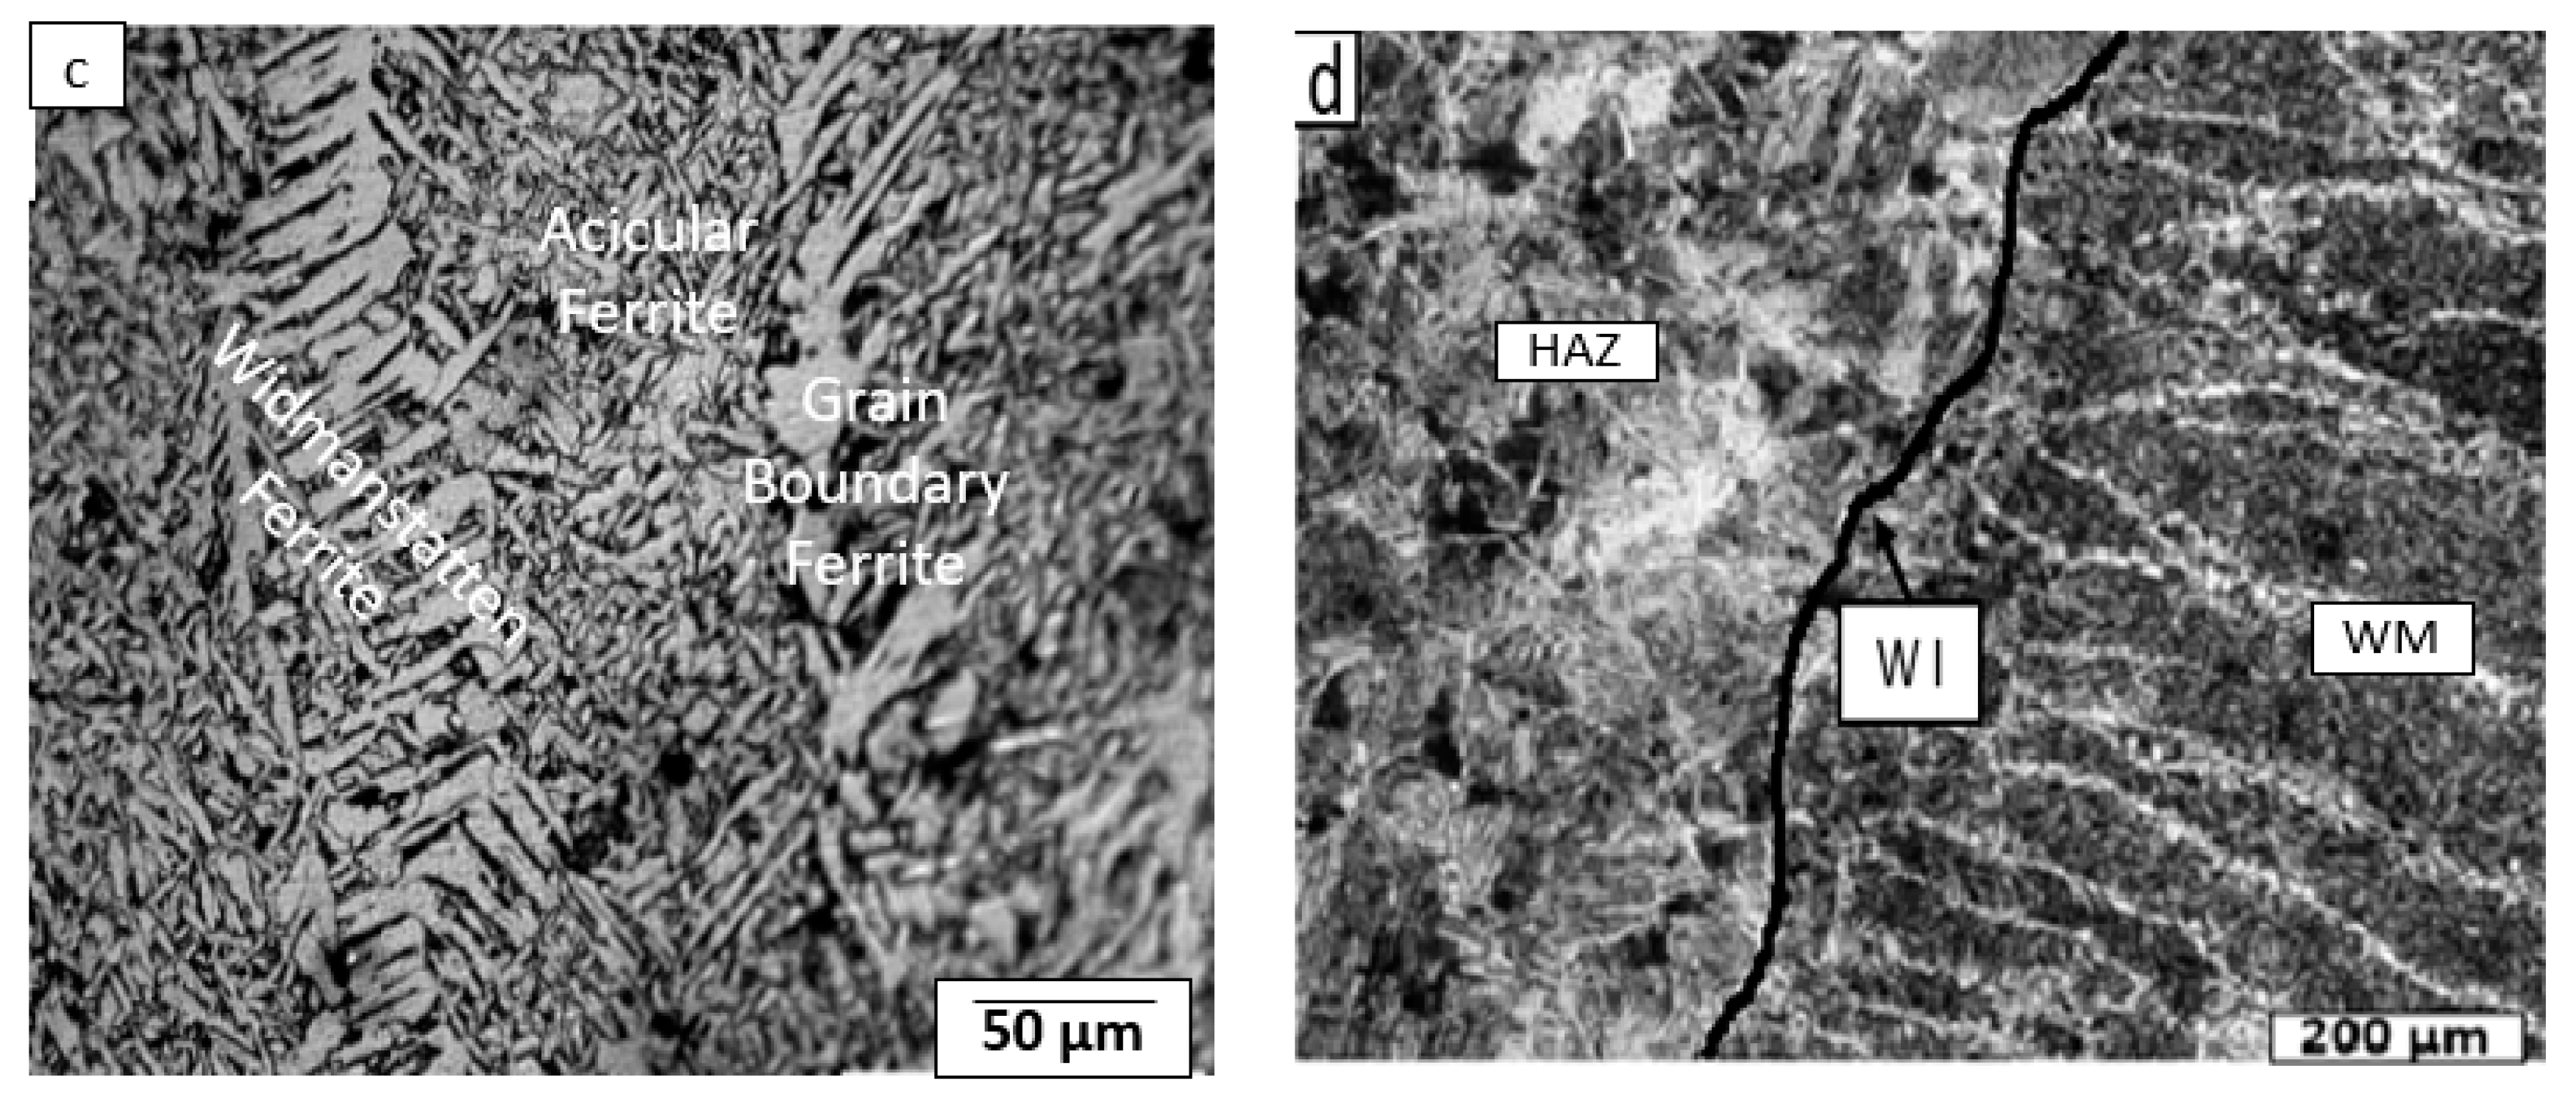
Microstructure examination was performed at base metal (BM), weld metal (WM), heat effected zone (HAZ) and WM/HAZ interface using optical microscope. Standard procedure for preparation of metallographic samples is followed, that includes mechanical grinding by silicon carbide emery paper of grit sizes (80, 160), polishing, and etching with 4% Nital solution. Required size of BM, WM, HAZ, and WM/HAZ interface was sectioned and mounted. It is observed that parent metal consists of ferrite content 70% and pearlite content 30%. WM or FZ microstructure reveals presence of acicular ferrite (AF), grain boundary ferrite (GF) and some proportion of Widmanstätten ferrite (WF). WF is formed by nucleation of ferrite side plate at boundaries of austenite/ferrite into austenite. The presence of AF in WM contributes to high toughness and strength [34,68]. Further, the tenacity of weld joint is attributed to the presence of AF in WM, that also ensures gain in mechanical properties [34]. In HAZ, formation of bainite, pearlite and fine ferrite was found. Pearlite surrounded by ferrite where carbon percentage was 0.45%. Mechanical properties as well as microstructure primarily depend upon heat input, chemical composition of base metal, cooling rate, initial grain size, phases, and electrode composition [69]. Present study results are similar and agree to reported by Pritesh [70]. The microstructure of BM, WM, HAZ, and WM/HAZ are presented in Figure 9.

8. Conclusions

This investigation attempts to solve multiple quality-response parametric optimization of SMAW. Initially, nine experiments were designed and conducted as per Taguchi L9 OA, followed by application of GRA-integrated-PCA approach for extracting optimal solution of complicated multi objective optimization problem. PCA was utilized to extract weightages for quality responses that influence GRGs. Eventually, confirmatory experiments were conducted to cross check the optimal setting. Obtained critic metrics from present research are
  • To achieve multiple objective optimization of SMAW process for pressure vessel steel SA 516 grade 70, the optimal combination of parameters is GA3PHT1ED3RG3.
  • The percentage contributions of each quality response for principal component in decreasing order are angular distortion (28.40%), tensile strength (27.79%), hardness (27.14%), and impact energy (16.72%) respectively.
  • The analysis of the average of GRG revealed that groove angle has the maximum influence, followed by electrode diameter, root gap, and preheat temperature, respectively.
  • The analysis of the average of W-GRG revealed that groove angle has maximum influence, followed by root gap, preheat temperature, and electrode diameter, respectively.
  • GRA and W-GRG identified identical optimal combination of input parameters as: groove angle 70°; preheat temperature 75 °C; electrode diameter 4 mm; and root gap 4 mm.
  • Significant improvement in GRG from initial condition to optimal setting is found as 0.2898 as is achieved by GRA approach.
  • Finally, a confirmatory experiment on GRG/W-GRA based optimal settings showed an improvement of 23.80% in tensile strength, 64.38% in impact energy, 3.01% in hardness, and 7.14% in angular distortion.
The results of GRA and W-GRA methods are compared and found same optimal settings for both techniques. Research work findings can be used as guidelines and standards for SMAW of pressure vessels in practical applications. Moreover, future work of research lies in exploring effects of quantitative and qualitative inputs on other outputs, such as bead height, bead reinforcement, penetration, residual stresses etc. Finally, W-GRA is found to be an easy, simple, effective, and efficient algorithm for stake holders of the welding world. Future work on this may concentrate on finite element analysis, with a focus on other parameters, tests, and statistical techniques.

Author Contributions

In this article, all the authors have contributed to their capacity. Conceptualization, of the research was provided by M.I.Q. and R.A.; methodology was established by, M.I.Q. and Q.S.K.; software and validation of results were carried out by, R.A., M.A., and Q.S.K.; formal analysis, A.R.B.; investigation, M.A. and C.I.P.; resources, C.I.P.; data curation, M.I.Q. and A.R.B.; writing—original draft preparation, M.I.Q and Q.S.K.; writing—review and editing, R.A and A.R.B.; supervision, C.I.P; project administration, R.A. and C.I.P.; funding acquisition, C.I.P. All authors have read and agreed to the published version of the manuscript.

Funding

This research received no external funding.

Acknowledgments

Authors are thankful to UET Peshawar for their support and guidance during the research.

Conflicts of Interest

The authors declare no conflict of interest.

References

  1. Mahajan, S.; Chhibber, R. Investigations on dissimilar welding of P91/SS304L using Nickel-based electrodes. Mater. Manuf. Process. 2020, 35, 1–14. [Google Scholar] [CrossRef]
  2. Khamari, B.K.; Dash, S.S.; Karak, S.K.; Biswal, B.B. Effect of welding parameters on mechanical and microstructural properties of GMAW and SMAW mild steel joints. Ironmak. Steelmak. 2019, 1–8. [Google Scholar] [CrossRef]
  3. Saxena, A.; Kumaraswamy, A.; Reddy, G.M.; Madhu, V. Influence of welding consumables on tensile and impact properties of multi-pass SMAW Armox 500T steel joints vis-a-vis base metal. Def. Technol. 2018, 14, 188–195. [Google Scholar] [CrossRef]
  4. Ahmed, S.R.; Agarwal, L.A.; Daniel, B. Effect of different post weld heat treatments on the mechanical properties of Cr-Mo boiler steel welded with SMAW process. Mater. Today Proc. 2015, 2, 1059–1066. [Google Scholar] [CrossRef]
  5. Chandel, R.; Seow, H.; Cheong, F. Effect of increasing deposition rate on the bead geometry of submerged arc welds. J. Mater. Process. Technol. 1997, 72, 124–128. [Google Scholar] [CrossRef]
  6. Sharma, A.; Arora, N.; Mishra, B.K. A practical approach towards mathematical modeling of deposition rate during twin-wire submerged arc welding. Int. J. Adv. Manuf. Technol. 2008, 36, 463–474. [Google Scholar] [CrossRef]
  7. Dong, Q.; Shen, L.; Cao, F.; Jia, Y.; Liao, K.; Wang, M. Effect of thermomechanical processing on the microstructure and properties of a Cu-Fe-P alloy. J. Mater. Eng. Perform. 2015, 24, 1531–1539. [Google Scholar] [CrossRef]
  8. Richardson, R.; Gutow, D.; Anderson, R.; Farson, D. Coaxial arc weld pool viewing for process monitoring and control. Weld. J. 1984, 63, 43–50. [Google Scholar]
  9. Ahire, P.; Patil, U.; Kadam, M. Genetic algorithm based optimization of the process parameters for manual metal arc welding of dissimilar metal joint. Proc. Manuf. 2018, 20, 106–112. [Google Scholar] [CrossRef]
  10. Ali, M.; Rao, C.; Rao, D. Study the effect of shielded metal arc welding process parameters, cryo-treatment and preheating on welding characteristics and modelling by an artificial neural network. Aust. J. Mech. Eng. 2014, 12, 195–207. [Google Scholar] [CrossRef]
  11. Bhaduri, A.; Gill, T.; Srinivasan, G.; Sujith, S. Optimised post-weld heat treatment procedures and heat input for welding 17–4PH stainless steel. Sci. Technol. Weld. Join. 1999, 4, 295–301. [Google Scholar] [CrossRef]
  12. Osayi, A.; Egbe, E.; Lawal, S. Optimization of process parameters of manual arc welding of mild steel using taguchi method. Am. J. Mech. Eng. 2015, 3, 93–97. [Google Scholar]
  13. Safeen, W.; Hussain, S.; Wasim, A.; Jahanzaib, M.; Aziz, H.; Abdalla, H. Predicting the tensile strength, impact toughness, and hardness of friction stir-welded AA6061-T6 using response surface methodology. Int. J. Adv. Manuf. Technol. 2016, 87, 1765–1781. [Google Scholar] [CrossRef]
  14. Seong, W.-J. Prediction and characteristics of angular distortion in multi-layer butt welding. Materials 2019, 12, 1435. [Google Scholar] [CrossRef] [PubMed] [Green Version]
  15. Armentani, E.; Esposito, R.; Sepe, R. The influence of thermal properties and preheating on residual stresses in welding. Int. J. Comput. Mater. Sci. Surf. Eng. 2007, 1, 146–162. [Google Scholar] [CrossRef]
  16. Ramasamy, N.; Jeyasimman, D.; Kathiravan, R.; Raju, N. Influence of Welding Sequence on Residual Stresses Induced in As-Welded Plug Weld of Low-Carbon Steel Plate. Trans. Indian Inst. Met. 2019, 72, 1361–1369. [Google Scholar] [CrossRef]
  17. Arifin, A.; Gunawan, A.M.; Yani, I.; Pratiwi, D.K.; Yanis, M.; Sani, K.A. Optimization of Angular Distortion on Weld Joints Using Taguchi Approach. J. Kejuruter. 2019, 31, 19–23. [Google Scholar]
  18. Kumar, P.N.; Rajadurai, A.; Muthuramalingam, T. Multi-response optimization on mechanical properties of silica fly ash filled polyester composites using taguchi-grey relational analysis. Silicon 2018, 10, 1723–1729. [Google Scholar] [CrossRef]
  19. Paul, T.; Saha, A.; Majumder, H.; Dey, V.; Dutta, P. Multi-objective optimization of some correlated process parameters in EDM of Inconel 800 using a hybrid approach. J. Braz. Soc. Mech. Sci. Eng. 2019, 41, 300. [Google Scholar] [CrossRef]
  20. Umair, M.; Shaker, K.; Ahmad, N.; Hussain, M.; Jabbar, M.; Nawab, Y. Simultaneous optimization of woven fabric properties using principal component analysis. J. Nat. Fibers 2017, 14, 846–857. [Google Scholar] [CrossRef]
  21. Saha, A.; Mondal, S.C. Multi-objective optimization of manual metal arc welding process parameters for nano-structured hardfacing material using hybrid approach. Measurement 2017, 102, 80–89. [Google Scholar] [CrossRef]
  22. Adalarasan, R.; Sundaram, A.S. Parameter design in friction welding of Al/SiC/Al 2 O 3 composite using grey theory based principal component analysis (GT-PCA). J. Braz. Soc. Mech. Sci. Eng. 2015, 37, 1515–1528. [Google Scholar] [CrossRef]
  23. Salah, A.N.; Kaddami, M. Effect of Filler Metal Diameter on Weld Joint of Carbon Steel SA516 Gr 70 and Filler Metal SFA 5.17 in Submerged Arc Welding SAW. Int. J. Mater. Metall. Eng. 2019, 13, 114–117. [Google Scholar]
  24. ASTM A 526/516 M—90. Standard Specification for Pressure Vessel Plates, Carbon Steel, for Moderate and Lower Temperature Services; ASTM International: West Conshohocken, PA, USA, 1996. [Google Scholar]
  25. ASTM A 370. Standard Test Methods and Definitions for Mechanical for Mechanical Testing of Steel Products; ASTM International: West Conshohocken, PA, USA, 2016. [Google Scholar]
  26. Long, H.; Gery, D.; Carlier, A.; Maropoulos, P. Prediction of welding distortion in butt joint of thin plates. Mater. Des. 2009, 30, 4126–4135. [Google Scholar] [CrossRef]
  27. Huang, H.-Y. Effects of activating flux on the welded joint characteristics in gas metal arc welding. Mater. Des. (1980–2015) 2010, 31, 2488–2495. [Google Scholar] [CrossRef]
  28. Canel, T.; Zeren, M.; Sınmazçelik, T. Laser parameters optimization of surface treating of Al 6082-T6 with Taguchi method. Opt. Laser Technol. 2019, 120, 105714. [Google Scholar] [CrossRef]
  29. İpek, N.E.; Elaldi, F. Analysis of welding groove angle and geometry on strength of armor steel. Mater. Manuf. Process. 2012, 27, 1437–1441. [Google Scholar] [CrossRef]
  30. Ghosh, P.; Singh, U. Influence of pre-and post-weld heating on weldability of modified 9Cr–1Mo (V–Nb) steel pipe under shielded metal arc and tungsten inert gas welding processes. Sci. Technol. Weld. Join. 2004, 9, 229–236. [Google Scholar] [CrossRef]
  31. Deng, D.; Murakawa, H.; Liang, W. Numerical simulation of welding distortion in large structures. Comp. Methods Appl. Mech. Eng. 2007, 196, 4613–4627. [Google Scholar] [CrossRef]
  32. AWS. Welding Handbook: Welding Processes; American Welding Society: Miami, FL, USA, 1992; Volume 2. [Google Scholar]
  33. Butt, M.T.Z.; Ahmed, S.; Rasool, S.; Ali, U.; Rehman, S. Effect of Welding Techniques (GTAW & SMAW) on the Microstructure & Mechanical Properties of Mild Steel SA 516 Gr. 70. Electr. Eng. 2009, 6, 35–40. [Google Scholar]
  34. Jorge, L.D.; Cândido, V.S.; da Silva, A.C.R.; Filho, F.D.G.; Pereira, A.C.; da Luz, F.S.; Monteiro, S.N. Mechanical properties and microstructure of SMAW welded and thermically treated HSLA-80 steel. J. Mater. Res. Technol. 2018, 7, 598–605. [Google Scholar] [CrossRef]
  35. Oyyaravelu, R.; Kuppan, P.; Arivazhagan, N. Metallurgical and mechanical properties of laser welded high strength low alloy steel. J. Adv. Res. 2016, 7, 463–472. [Google Scholar] [CrossRef] [PubMed] [Green Version]
  36. Lan, L.; Kong, X.; Qiu, C.; Zhao, D. Influence of microstructural aspects on impact toughness of multi-pass submerged arc welded HSLA steel joints. Mater. Des. 2016, 90, 488–498. [Google Scholar] [CrossRef]
  37. Kurt, H.I.; Oduncuoglu, M.; Yilmaz, N.F.; Ergul, E.; Asmatulu, R. A comparative study on the effect of welding parameters of austenitic stainless steels using artificial neural network and Taguchi approaches with ANOVA analysis. Metals 2018, 8, 326. [Google Scholar] [CrossRef] [Green Version]
  38. Nandagopal, K.; Kailasanathan, C. Analysis of mechanical properties and optimization of gas tungsten Arc welding (GTAW) parameters on dissimilar metal titanium (6Al4V) and aluminium 7075 by Taguchi and ANOVA techniques. J. Alloys Compd. 2016, 682, 503–516. [Google Scholar] [CrossRef]
  39. Pandiarajan, S.; Kumaran, S.S.; Kumaraswamidhas, L.; Saravanan, R. Interfacial microstructure and optimization of friction welding by Taguchi and ANOVA method on SA 213 tube to SA 387 tube plate without backing block using an external tool. J. Alloys Compd. 2016, 654, 534–545. [Google Scholar] [CrossRef]
  40. Satheesh, M.; Dhas, J. Multi Objective Optimization of Weld Parameters of Boiler Steel Using Fuzzy Based Desirability Function. J. Eng. Sci. Technol. Rev. 2014, 7, 29–36. [Google Scholar] [CrossRef]
  41. Panda, S.; Mishra, D.; Biswal, B.B. Determination of optimum parameters with multi-performance characteristics in laser drilling—A grey relational analysis approach. Int. J. Adv. Manuf. Technol. 2011, 54, 957–967. [Google Scholar] [CrossRef]
  42. Kuo, C.-F.J.; Su, T.-L. Optimization of multiple quality characteristics for polyether ether ketone injection molding process. Fibers Polym. 2006, 7, 404–413. [Google Scholar] [CrossRef]
  43. Sarıkaya, M.; Güllü, A. Multi-response optimization of minimum quantity lubrication parameters using Taguchi-based grey relational analysis in turning of difficult-to-cut alloy Haynes 25. J. Clean. Prod. 2015, 91, 347–357. [Google Scholar] [CrossRef]
  44. Palanikumar, K.; Latha, B.; Senthilkumar, V.; Davim, J.P. Analysis on drilling of glass fiber–reinforced polymer (GFRP) composites using grey relational analysis. Mater. Manuf. Process. 2012, 27, 297–305. [Google Scholar] [CrossRef]
  45. Sonawane, S.A.; Kulkarni, M. Optimization of machining parameters of WEDM for Nimonic-75 alloy using principal component analysis integrated with Taguchi method. J. King Saud Univ. Eng. Sci. 2018, 30, 250–258. [Google Scholar] [CrossRef]
  46. Lee, W.J.; Mendis, G.P.; Triebe, M.J.; Sutherland, J.W. Monitoring of a machining process using kernel principal component analysis and kernel density estimation. J. Intell. Manuf. 2019, 31, 1–15. [Google Scholar] [CrossRef]
  47. Stephens, M.A. EDF statistics for goodness of fit and some comparisons. J. Am. Stat. Assoc. 1974, 69, 730–737. [Google Scholar] [CrossRef]
  48. Purwaningrum, Y.; Kusuma, P.L.T.; Darmawan, D. An Experimental Study on Effect of T-Joint’s Root Gap on Welding Properties. Appl. Mech. Mater. 2017, 863, 323–327. [Google Scholar] [CrossRef]
  49. Weerasekralage, L.S.K.; Karunarathne, M.; Pathirana, S. Optimization of Shielded Metal Arc Welding (SMAW) process for mild steel. IJSRST 2018, 4, 1536–1543. [Google Scholar]
  50. Kumar, S.; Singh, R. Investigation of tensile properties of shielded metal arc weldments of AISI 1018 mild steel with preheating process. Mater. Today Proc. 2019, 26, 209–222. [Google Scholar] [CrossRef]
  51. Lee, C.; Bhadeshia, H.; Lee, H.-C. Effect of plastic deformation on the formation of acicular ferrite. Mater. Sci. Eng. A 2003, 360, 249–257. [Google Scholar] [CrossRef]
  52. Bodude, M.; Momohjimoh, I. Studies on effects of welding parameters on the mechanical properties of welded low-carbon steel. J. Miner. Mater. Charact. Eng. 2015, 3, 142. [Google Scholar] [CrossRef] [Green Version]
  53. Talabi, S.; Owolabi, O.; Adebisi, J.; Yahaya, T. Effect of welding variables on mechanical properties of low carbon steel welded joint. Adv. Prod. Eng. Manag. 2014, 9, 181–186. [Google Scholar] [CrossRef] [Green Version]
  54. Saha, D.; Westerbaan, D.; Nayak, S.; Biro, E.; Gerlich, A.; Zhou, Y. Microstructure-properties correlation in fiber laser welding of dual-phase and HSLA steels. Mater. Sci. Eng. A 2014, 607, 445–453. [Google Scholar] [CrossRef]
  55. Akellaa, S.; Kumarb, B.R. Distortion control in TIG welding process with Taguchi approach. Adv. Mater. Manuf. Charact. 2013, 3, 99–206. [Google Scholar]
  56. Singh, T.; Singh, A.; Saini, S. Effect of Groove Design on the Mechanical Properties of Shielded Metal Arc Welded Joints. Indian J. Sci. Technol. 2019, 12, 1–9. [Google Scholar]
  57. Pathak, D.; Singh, R.P.; Gaur, S.; Balu, V. Influence of groove angle on hardness and reinforcement height of shielded metal arc welded joints for low carbon AISI 1016 steel plates. Mater. Today Proc. 2020. [Google Scholar] [CrossRef]
  58. Hu, L.; Huang, J.; Li, Z.; Wu, Y. Effects of preheating temperature on cold cracks, microstructures and properties of high power laser hybrid welded 10Ni3CrMoV steel. Mater. Des. 2011, 32, 1931–1939. [Google Scholar] [CrossRef]
  59. Deng, D.; Murakawa, H. Prediction of welding residual stress in multi-pass butt-welded modified 9Cr–1Mo steel pipe considering phase transformation effects. Comput. Mater. Sci. 2006, 37, 209–219. [Google Scholar] [CrossRef]
  60. Schenk, T.; Richardson, I.; Kraska, M.; Ohnimus, S. A study on the influence of clamping on welding distortion. Comput. Mater. Sci. 2009, 45, 999–1005. [Google Scholar] [CrossRef]
  61. Qinglei, J.; Yajiang, L.; Juan, W.; Lei, Z. Characterization on strength and toughness of welded joint for Q550 steel. Bull. Mater. Sci. 2011, 34, 161–167. [Google Scholar] [CrossRef]
  62. Adamczuk, P.C.; Machado, I.G.; Mazzaferro, J.A.E. Methodology for predicting the angular distortion in multi-pass butt-joint welding. J. Mater. Process. Technol. 2017, 240, 305–313. [Google Scholar] [CrossRef]
  63. Hashemi, M.; Halvaee, A. Effect of GTAW Parameters on Structure and Mechanical Properties of C86300 Weld Joint. Trans. Indian Inst. Met. 2014, 67, 741–752. [Google Scholar] [CrossRef]
  64. Jang, G.; Kim, H.; Kang, S. The effects of root opening on mechanical properties, deformation and residual stress of weldments. Weld. Res. Suppl. 2001, 80, 80–89. [Google Scholar]
  65. Abid, M.; Siddique, M. Numerical simulation to study the effect of tack welds and root gap on welding deformations and residual stresses of a pipe-flange joint. Int. J. Press. Vessels Pip. 2005, 82, 860–871. [Google Scholar] [CrossRef]
  66. Biswas, P.; Mandal, N.; Vasu, P.; Padasalag, S.B. Analysis of welding distortion due to narrow-gap welding of upper port plug. Fusion Eng. Des. 2010, 85, 780–788. [Google Scholar] [CrossRef]
  67. Chate, G.R.; Patel, G.M.; Kulkarni, R.M.; Vernekar, P.; Deshpande, A.S.; Parappagoudar, M.B. Study of the effect of nano-silica particles on resin-bonded moulding sand properties and quality of casting. Silicon 2018, 10, 1921–1936. [Google Scholar] [CrossRef]
  68. Amanie, J.; Oguocha, I.; Yannacopoulos, S. Effect of submerged arc welding parameters on microstructure of SA516 steel weld metal. Can. Metall. Q. 2012, 51, 48–57. [Google Scholar] [CrossRef]
  69. Dorschu, K. Factors affecting weld metal properties in carbon and low alloy pressure vessel steels. Weld. Res. Counc. Bull. 1977, 231, 1–64. [Google Scholar]
  70. Prajapati, P.J.; Badheka, V.J. Investigation on three different weldments on performance of SA516 Gr70 steel material. Alex. Eng. J. 2019, 58, 637–646. [Google Scholar] [CrossRef]
Figure 1. Tensile Test Specimen.
Materials 13 03457 g001
Figure 2. Charpy Impact Test Samples for: (1) Experiment 1; (2) Experiment 2; (3) Experiment 3; (4) Experiment 4; (5) Experiment 5; (6) Experiment 6; (7) Experiment 7; (8) Experiment 8.
Materials 13 03457 g002
Figure 3. (a) Angular distortion; (b) Angular distortion measurement.
Materials 13 03457 g003
Figure 4. (a) Tacked Sample; (b) Welded Samples.
Materials 13 03457 g004
Figure 5. Concept behind PCA-GRA.
Materials 13 03457 g005
Figure 6. Normal probability plots of responses.
Materials 13 03457 g006
Figure 7. Main effect plot of means for (a) tensile strength; (b) impact energy; (c) hardness; (d) angular distortion.
Materials 13 03457 g007
Figure 8. Main effect plot of SN ratios for (a) tensile strength; (b) impact energy; (c) hardness; (d) angular distortion.
Materials 13 03457 g008
Figure 9. SA 516 Grade 70 Microstructure of (a) BM; (b) WM; (c) HAZ; (d) WM/HAZ interface.
Materials 13 03457 g009aMaterials 13 03457 g009b
Table 1. Chemical composition of ASME SA 516 Grade 70.
ElementCAlVCrPMnSiSnNAsSCu
% by weight0.220.0390.0020.030.0180.990.180.0020.0050.0020.0080.02
Table 2. Design Matrix and Experimental Results.
Exp.
No.
Coded MatrixUn-Coded MatrixExperimental Result
ABCDGAPHTEDRGTS (MPa)IE (J)H (HB)AD (θ)
1111150752.6244562.881584.01
21222501003.2351866.591563.91
31333501254.0460572.281563.71
4212360753.2450370.771654.4
52231601004.0264385.101513.72
62312601252.6353871.801583.95
7313270754.0359988.841634.2
83213701002.6453576.561694.3
93321701253.2262098.481523.81
Table 3. Welding parameters and levels.
ParametersSymbolUnitsLevel 1Level 2Level 3
Groove AngleAΘ506070
Pre-Heat TemperatureB°C75100125
Electrode DiameterCmm2.63.24
Root GapDmm234
Table 4. Principal component analysis.
ComponentPC 1PC 2PC 3PC 4
Eigen Value2.45491.10140.28040.1634
Variation (%)0.6140.2750.0700.041
Cumulative (%)0.6140.8890.9591.000
Eigen Vector−0.5270.390−0.705−0.272
−0.4090.6620.5920.207
0.5210.461−0.3710.615
0.5330.4440.121−0.710
Table 5. ANOVA for individual responses.
SourceDoFAdj SSAdj MSF-Valuep-Value% Contribution
Tensile strengthGroove angle15504.65504.623.980.00816.55
Preheat temperature17776777633.880.00423.38
Electrode diameter118351.418351.479.970.00155.18
Root gap1704.2704.23.070.1552.11
Error4918229.5 2.76
Total833253.6 100
Impact energyGroove angle1648.99648.9980.680.00161.03
Preheat temperature167.1367.138.350.0456.31
Electrode diameter1194.79194.7924.210.00818.32
Root gap1120.154120.15414.940.01811.3
Error432.18 3.02
Total81063.24 100
HardnessGroove angle134.10534.10517.240.01412
Preheat temperature166.66766.66733.70.00423.47
Electrode diameter135.14935.14917.770.01412.37
Root gap1140.167140.16770.860.00149.35
Error47.9131.978 2.78
Total8284 100
Angular distortionGroove angle10.07310.073120.570.01114.64
Preheat temperature10.21660.216660.950.00143.38
Electrode diameter10.069230.0692319.480.01213.86
Root gap10.126150.1261535.50.00425.26
Error40.014210.00355 2.84
Total80.49929 100
Table 6. Experimental design and results using L9 OA.
Exp.
No.
S/N Ratios of Responses
Tensile StrengthImpact EnergyHardnessAngular Distortion
152.9735.97−43.97−12.06
254.2936.47−43.86−11.84
355.6437.18−43.86−11.39 *
454.0337.00−44.35−12.87
556.16 *38.60−43.58 *−11.41
654.6237.12−43.97−11.93
755.5538.97−44.24−12.46
854.5737.68−44.56−12.67
955.8539.87 *−43.64−11.62
OptimumA2B2C3D1A3B3C2D1A2B2C3D1A1B3C3D3
* optimized setting for individual responses.
Table 7. Calculated Normalized, GRC and GRG for 9 experiments.
Exp
No.
NormalizationGrey Relational CoefficientGRGRankW-GRGRank
TSIEHADTSIEHAD
10.000.000.400.460.330.330.460.480.40090.4089
20.410.130.290.310.460.360.410.420.41480.4198
30.830.310.290.000.750.420.410.330.47960.4856
40.330.260.791.000.430.400.701.000.63340.6613
51.000.670.000.021.000.610.330.340.56950.5655
60.520.300.400.370.510.420.460.440.45570.4597
70.810.770.680.730.720.690.610.650.66520.6642
80.500.441.000.870.500.471.000.790.68910.7121
90.901.000.060.160.831.000.350.370.63830.5984
Table 8. Response table for average GRG and W-GRG.
ParametersAverage of GRGAverage of W-GRG
LevelsDeltaRankLevelsDeltaRank
123123
GA0.4310.5520.664 *0.233410.4370.5610.658 *0.2201
PHT0.566 *0.5570.5240.042340.577 *0.5660.5140.0633
ED0.5150.5620.571 *0.056430.5260.5600.571 *0.0634
RG0.5350.5110.601 *0.089320.5240.5140.619 *0.1052
* optimized setting for individual responses.
Table 9. Variance contribution of response variables for first PC.
Response VariableContribution
Tensile Strength0.2777
Impact Energy0.1672
Hardness0.2714
Angular Distortion0.2840
Table 10. Comparison Summary of confirmatory experiments.
Initial Condition
A2B2C3D2
Confirmatory Experiment ResultsImprovement from Initial Condition (%)
GRG/W-GRAGRG/W-GRA
Tensile Strength (MPa)545.6675.523.80
Impact Energy (J)60.7699.8864.38
Hardness (HB)1661613.01
Angular Distortion (θ)4.23.97.14
Optimal Condition-A3B1C3D3
Grey Relational Grade0.54170.7645

