
Molecular Dynamics Simulation for Evaluating Fracture Entropy of a Polymer Material under Various Combined Stress States


1
Department of Materials Science and Technology, Graduate School of Tokyo University of Science, 6-3-1 Niijuku, Katsushika-ku, Tokyo 125-8585, Japan
2
Department of Materials Science and Technology, University of Science, 6-3-1 Niijuku, Katsushika-ku, Tokyo 125-8585, Japan
3
Itochu Techno-Solutions Corporation, Art Village Osaki Central Tower, 1-2-2, Osaki, Shinagawa-ku, Tokyo 141-8522, Japan
4
Department of Mechanical Engineering, Saitama University, Shimo-Okubo, Sakura-ku, Saitama 338-8570, Japan
*
Author to whom correspondence should be addressed.
Materials 2021, 14(8), 1884; https://doi.org/10.3390/ma14081884
Submission received: 19 February 2021
/
Revised: 7 April 2021
/
Accepted: 8 April 2021
/
Published: 10 April 2021
(This article belongs to the Section Materials Simulation and Design)
Abstract
:Herein, the stress-state dependence of fracture entropy for a polyamide 6 material is investigated through molecular dynamics simulations. Although previous research suggests that a constant entropy increase can be universally applied for the definition of material fracture, the dependence of stress triaxiality has not yet been discussed. In this study, entropy values are evaluated by molecular dynamics simulations with varied combined stress states. The calculation is implemented using the 570,000 all-atom model. Similar entropy values are obtained independently of stress triaxiality. This study also reveals the relationship between material damage, which is correlated with void size, and the entropy value.
1. Introduction
Carbon fiber reinforced polymers (CFRPs) are used not only in the aerospace field but also in an increasing number of products such as automobiles [1]. However, prediction of the lifetime of CFRPs is difficult, thereby limiting their application [2]. This difficulty arises because the damage to CFRPs is more complex than that to metallic materials as it is caused by microscopic damage, such as carbon fiber breakage [1,3], microcracks in the resin [4,5], and delamination of the interface between the carbon fiber and resin [6,7]. Thus, it is difficult to quantitatively measure the lifetime of CFRP-based materials. In addition, the time dependence of damage is known to exist in polymeric materials [8,9,10]. Therefore, mechanisms of the damage occurring at the molecular level must be considered for the lifetime prediction of materials. In this study, we propose that the lifetime of materials can be measured by entropy. The entropy is determined by the dissipated energy over the absolute temperature, and the dissipated energy is determined by the stress–strain history [11]. Thus, the entropy is a mechanical value obtained from a mechanophysical quantity. Previous studies have utilized the increase in entropy of metallic materials as a criterion of lifetime prediction for nickel [12,13], aluminum [14,15,16], and steel [17,18]; however, no such study has been conducted on polymeric materials. If entropy can be used as a lifetime criterion, we propose that it can be applied to multiscale analysis, combining molecular dynamics and finite element methods in the future. By incorporating both material parameters and lifetime entropy obtained by molecular dynamics into the finite element method, we believe that structural analysis can be performed by considering the molecular structure of the material.
Furthermore, external loads cause damage to the materials, which increases the entropy inside the material. When a constant entropy increase is reached, the material fails [11]. The entropy at which the material fails is defined as the “fracture entropy”; thus, it is possible to use the fracture entropy to predict the lifetime of a material under various loads. According to these theories, the material is expected to fail with fracture entropy under any load. In addition, the resin near the fiber interface in CFRPs is subjected to a combined stress state [6]. Thus, it is important to confirm that the resin will fail at a constant entropy increase under stress from any direction.
Therefore, the purpose of this study is to compare the entropy increase at failure with different combined stress states and to investigate whether or not the material fails at a constant entropy increase in all simulations. In addition to reproducing the damage mechanism at the molecular level, molecular simulations allow us to consider thermodynamic parameters, such as internal energy [19,20], which are difficult to obtain experimentally, in addition to temperature [21,22], interface energy [23,24], and mechanical properties [25,26,27]. At the same time, we propose a method for calculating entropy, which has recently been used in a discussion of molecular dynamics simulations [28,29,30,31,32,33]. In particular, the entropy calculation method proposed in this study can also be applied to mechanical experiments of materials.
2. Method
2.1. Polymer System
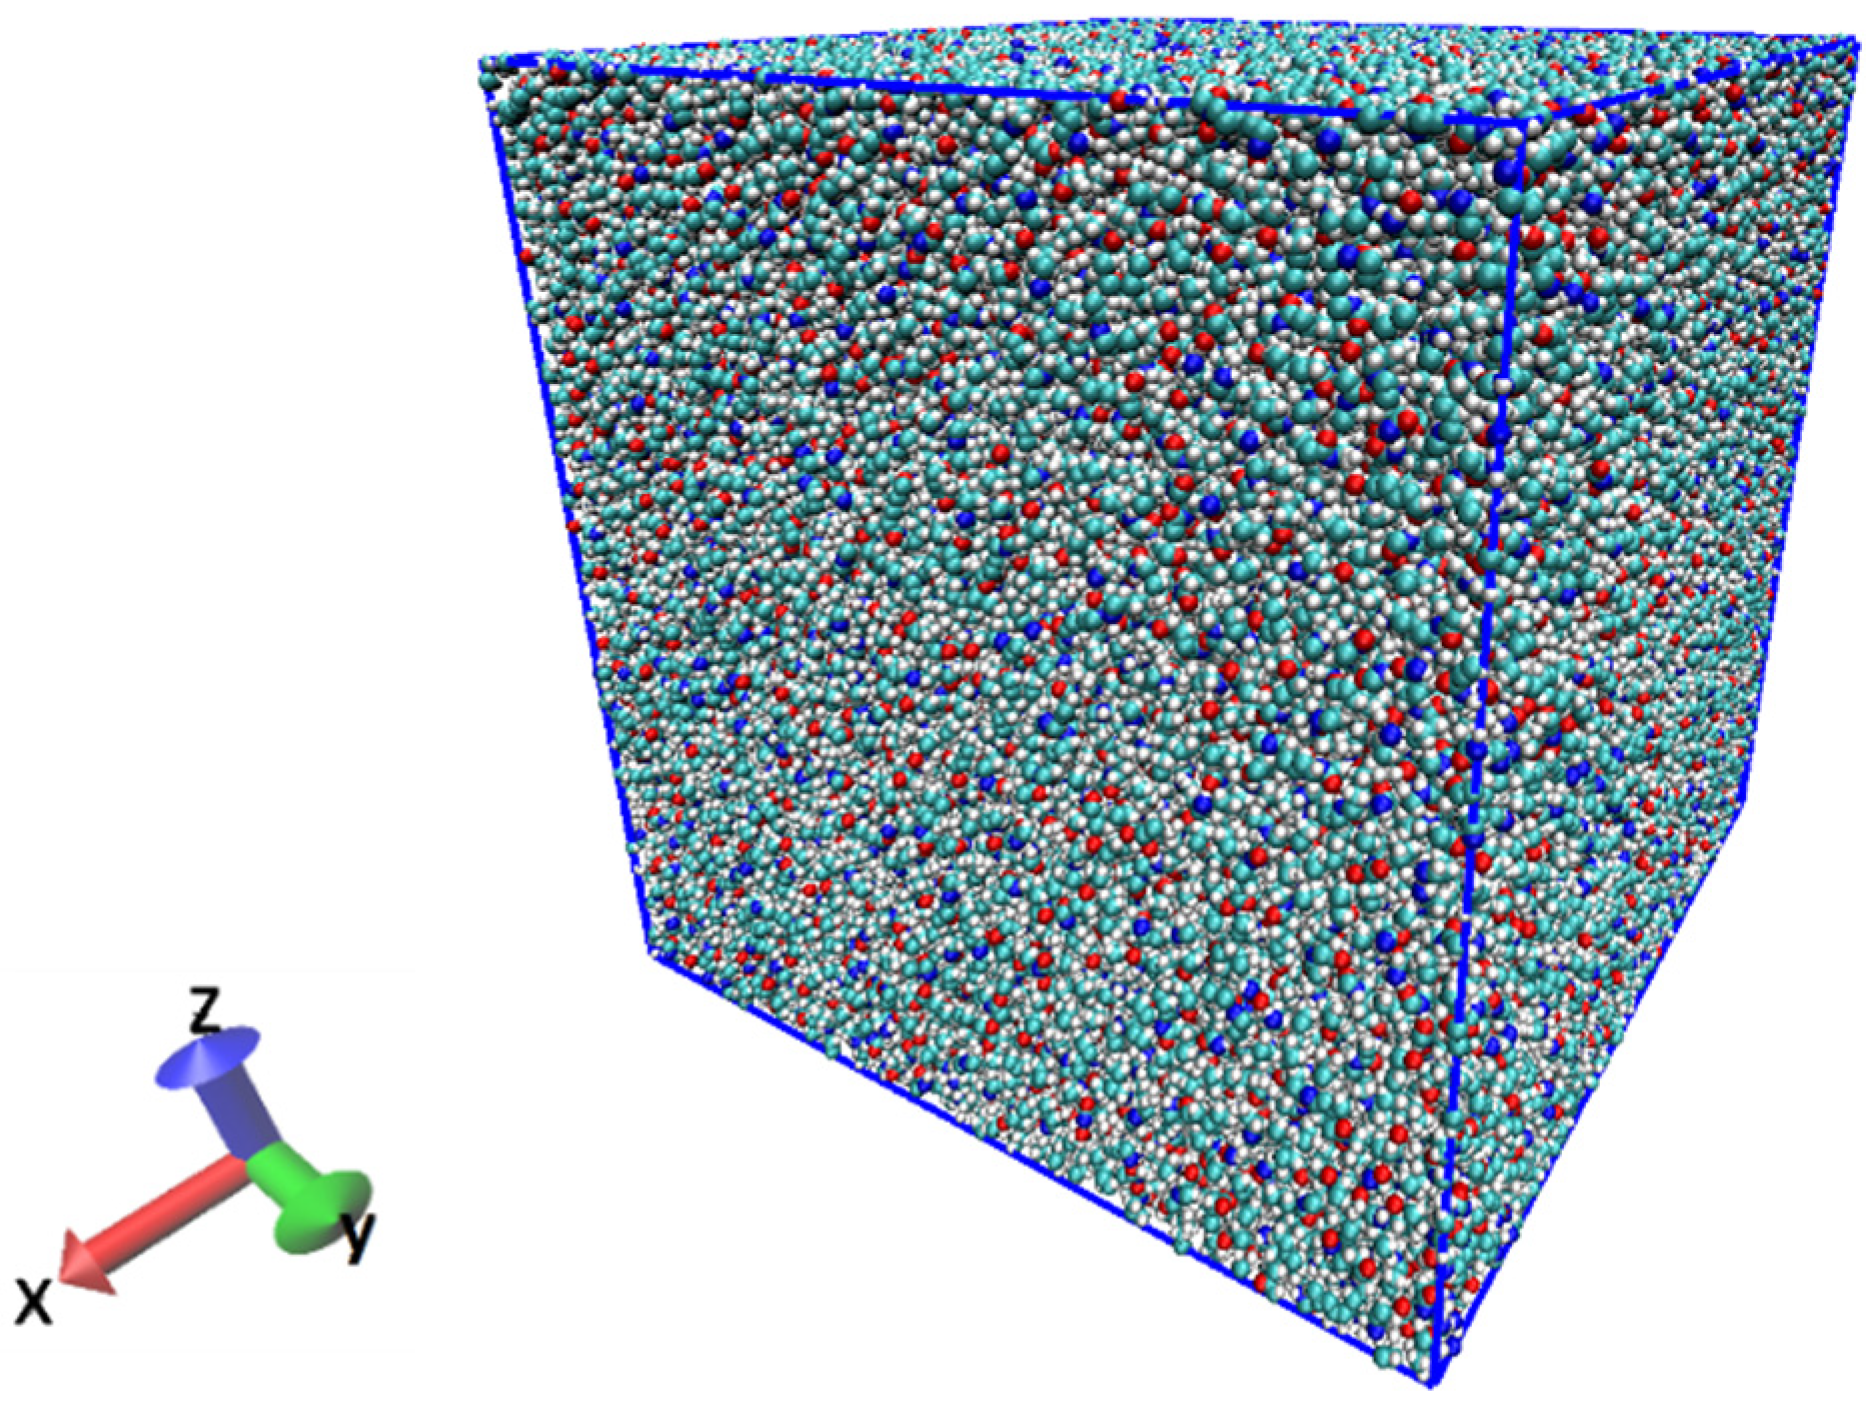
In this study, fracture simulations were performed on a single polyamide 6 (PA6) resin under different conditions. The all-atom model of PA6 was used, the degree of polymerization was set to 30, and the number of atoms was 570,000. After randomly arranging the molecular chains in the cell, the system was set to 650 K, which is above the melting point of PA6. Next, annealing was performed at 1 atm with isothermal–isobaric ensemble (NPT). In annealing, the volume of the resin decreases. The NPT ensemble was used to reduce the volume of the system and to keep the pressure at 1 atm to make the system stable. The system was annealed at a cooling rate of 70 K/ns to an ambient temperature of 300 K. We conducted the relaxation in NPT ensemble (1 atm, 300 K) for 10 ns and ensured that the system density was 1.1 g/cm3 and the total energy was stable. The Nose–Hoover method [34] was used for temperature control. The system used periodic boundaries to avoid wall effects. The system created from the above process is shown in Figure 1. The cell size is a cube of 17.4 nm per side.
2.2. Fracture Simulation
Fracture simulations were performed using the microcanonical (NVE) and isoenthalpic-isobaric (NPH) ensembles. To calculate the entropy, it is necessary to obtain the temperature increase of the system due to pulling. Entropy is one of the energy-related values. In order to make this discussion simple, the energy flow between inside and outside simulation cell has to be zero during fracture simulation. Therefore, we used the NPH and NVE ensembles. The ensemble was changed only to manipulate the stress triaxiality in fracture simulation; there is no difference between the NPH and NVE ensembles except for the stress state in the fracture phenomena. In the NPH ensemble, the pressure in the x and y directions was maintained by the Parrinello–Rahman method [35]. In the NVE ensemble, the cell size in the x and y directions was fixed for triaxial pulling. Four different tensile simulations with different stress triaxialities were performed to determine the difference in damage. The stress triaxiality is a parameter that represents the state of loading. For example, η = 0 indicates shear tension, and η = 1/3 indicates uniaxial tension. The equation for stress triaxiality is shown in Equation (1).
where
and
where η is the stress triaxiality; is the von Mises stress; is the hydrostatic stress; , , and are the principal stresses; and , , and are the axial stresses.
The conditions for each experiment are listed in Table 1. Compression and tension are produced by deforming the cell. Owing to the constraints of the simulation, the tension in the z-direction was set to a constant strain rate of 108/s (engineering strain). However, the strain rate in the simulation was much higher than the experimental strain rate. The pressure in the XY direction is set to achieve the optimum stress triaxiality by repeating the simulation with different values of pressure. GROMACS 2018.3 [36] was used for the molecular dynamics simulations. The force field was all-atom optimized potentials for liquid simulations (OPLS-AA) [37], and the parameters were created using PolyPerGen [38]. The functional functions and basis functions for structure optimization were performed using B3LYP/6-31 G*. Based on the optimized structure, the functional functions and basis functions of the electric charge calculation were performed utilizing MP2/ 6-31 G*. The long-range interactions were calculated using the particle mesh Ewald method [39] with a grid size of 0.12 nm. The intermolecular interaction cutoff was set to 1.0 nm. The initial temperature of the system was set to 300 K. The LINCS algorithm [40] was used to implement the MD simulations for time increments of 2 fs. The calculations were implemented using a cloud-based computer provided by Exabyte.io and GPU P100 supplied by Azure [41].
2.3. Fracture Entropy Calculation Method
Two methods were used to calculate entropy in the molecular simulation: thermodynamic and mechanical. The entropy calculation equation by the thermodynamic method is shown in Equation (4), which is based on the second law of thermodynamics. The external force work is calculated from the stress and displacement in each XYZ plane. In addition, temperature T is the temperature of the system at each time.
where
where S is the entropy, Q is the heat, T1 is the temperature at fracture, T0 is the initial temperature, P is the pressure, V is the volume, and U is the internal energy. The internal energy in Equation (4) is obtained by summing the kinetic energy and potential energy of the atom. The potential energy is the sum of the Coulomb potential, the Lennard-Jones potential, and the intramolecular potential defined by OPLS-AA [37].
The equation for calculating entropy using the mechanical method is shown in Equation (6) [11]. The inelastic strain energy was obtained by dividing the elastic strain energy by the total strain energy. It was also calculated for each of the XYZ planes, and the total value was used as the inelastic strain energy of the entire system. It should be noted that this equation can be used not only for molecular simulations but also for experiments.
where
and
where γf is the fracture entropy, t is the elapsed time from the start of pulling, tf is the time to fracture defined as the time from the commencement of tension until yielding and the value of stress reaches zero, T is the temperature, W is the strain energy, Wp is the inelastic strain energy, We is the elastic strain energy, and ε is the strain. The elastic strain energy should be considered for the value of entropy before the failure. However, the elastic strain energy has no effect on the fracture entropy because the stress reaches zero when failure occurs. In this study, the elastic strain energy is ignored.
2.4. Measurement of Void
To detect the voids, our own software was used in combination with Visual Molecular Dynamics (VMD) 1.9.3 [42]. First, VMD was used to obtain the lattice data representing the vacant spaces in the system. The lattice spacing was set to 0.1 nm, and a vacant space was defined as the absence of atoms within a radius of 0.3 nm from the lattice point. The lattice points of neighboring vacant spaces were grouped using our software, and the groups were defined as voids. The center of the voids and volume of each void were calculated and displayed on the VMD.
3. Results and Discussion
3.1. Progress of Fracture
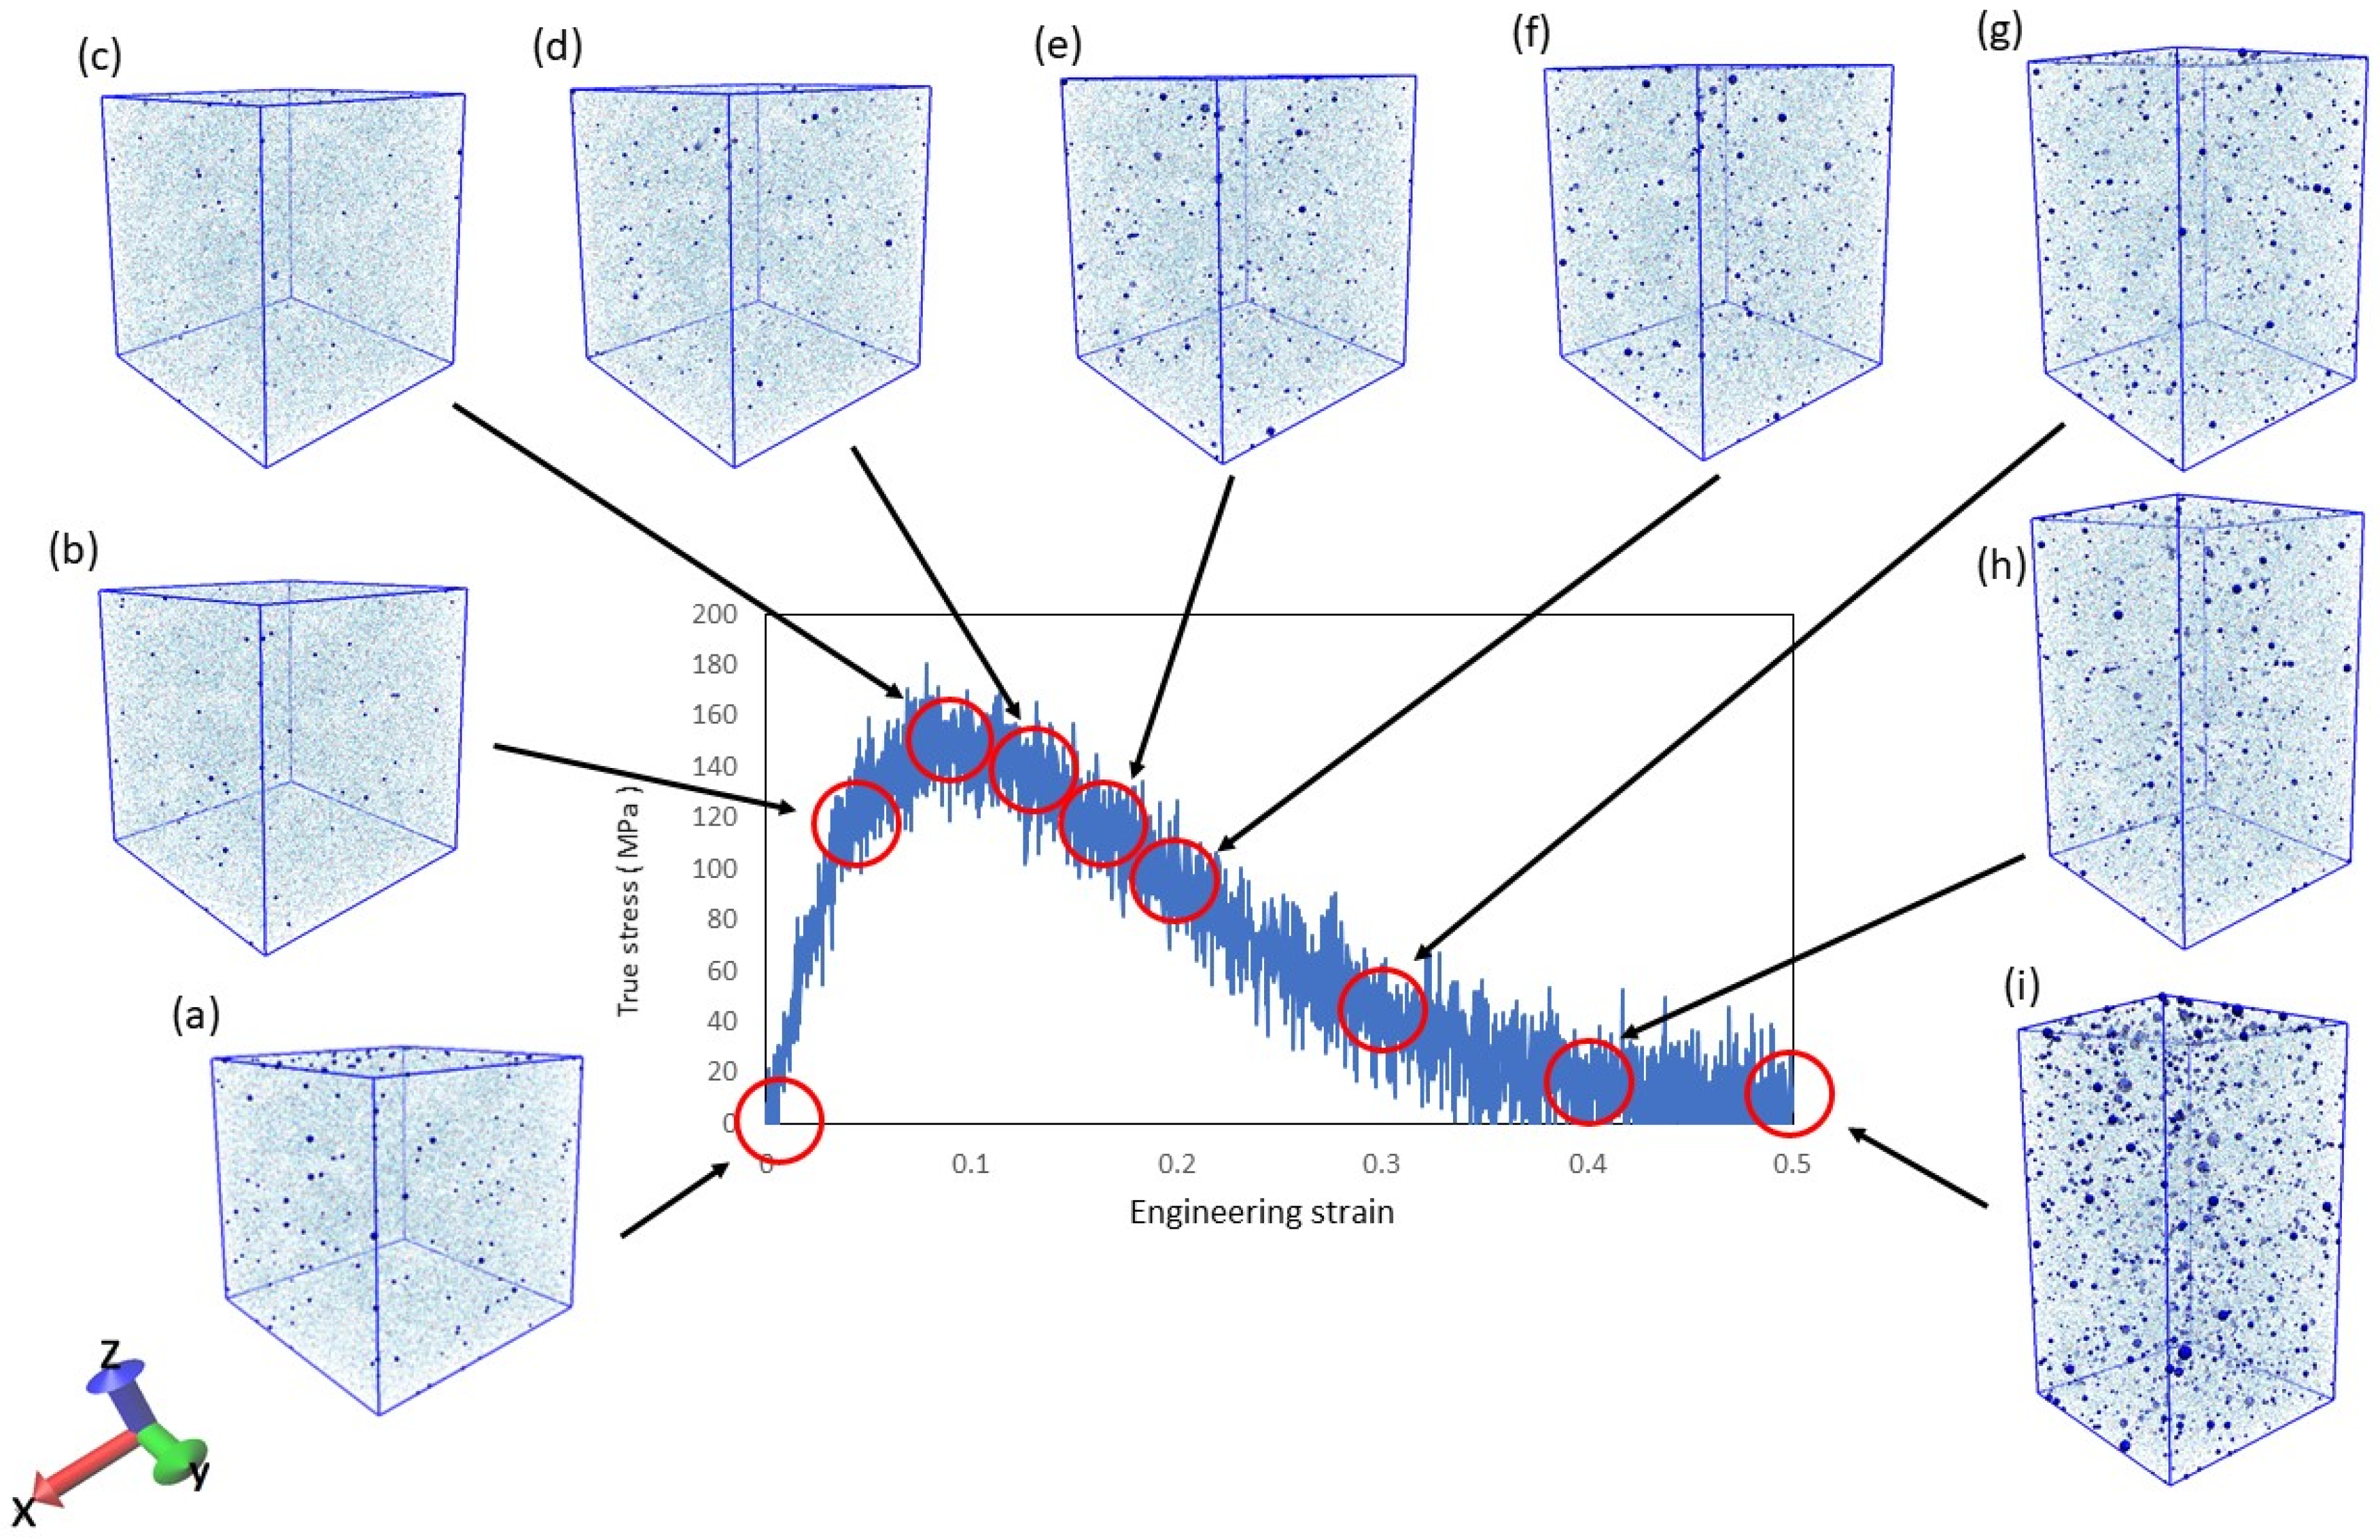
In the tensile simulations, we considered whether damage occurred to the resin. It is known that resin damage corresponds to the generation and growth of voids on the microscale [43]. Therefore, it can be seen in Figure 2 and Figure 3 that increasing the strain of the resin in the simulation increases the number of voids. In Figure 2, (a–i) corresponds to the illustration of the voids in Figure 3. The system used to verify the voids is the uniaxial tension condition shown in Table 1.
The blue dots indicate voids, and the number and size of voids increase with increasing strain. This indicates that damage was generated by the simulation. Furthermore, entropy increases with increasing void volume, as shown in Figure 4.
The results show entropy increasing with the increase in voids. However, an exception is seen when the strain increases from 0.0 to 0.04; the void volume decreases with respect to the entropy increase. Additionally, at strain 0.5, the entropy increase is slower than the rapid increase in the void volume. These results will be discussed and compared with experimental results in the future.
Next, we conduct a regression analysis and suggest the following equation to explain entropy and void volume in Equations (9) and (10).
where S is entropy, ε is strain, R2 is the coefficient of determination, V is void volume, and a, b are empirical coefficients. The coefficient of determination is closer to 1, which means that the regression curve is more suitable for the data. Both R2 values are close to 1 and that these equations are suitable to explain entropy and void volume. Furthermore, we suggest the equation relating entropy to void volume from Equations (9) and (10) in Equation (11).
where α is empirical coefficient. This equation determines the entropy from the void volume for a material whose loading history is unknown. It can be used to measure the lifetime of materials whose loading history is unknown. However, it is unclear whether this equation is suitable for explaining entropy and void volume. Further discussion of this equation is needed.
3.2. Difference of Stress Triaxiality
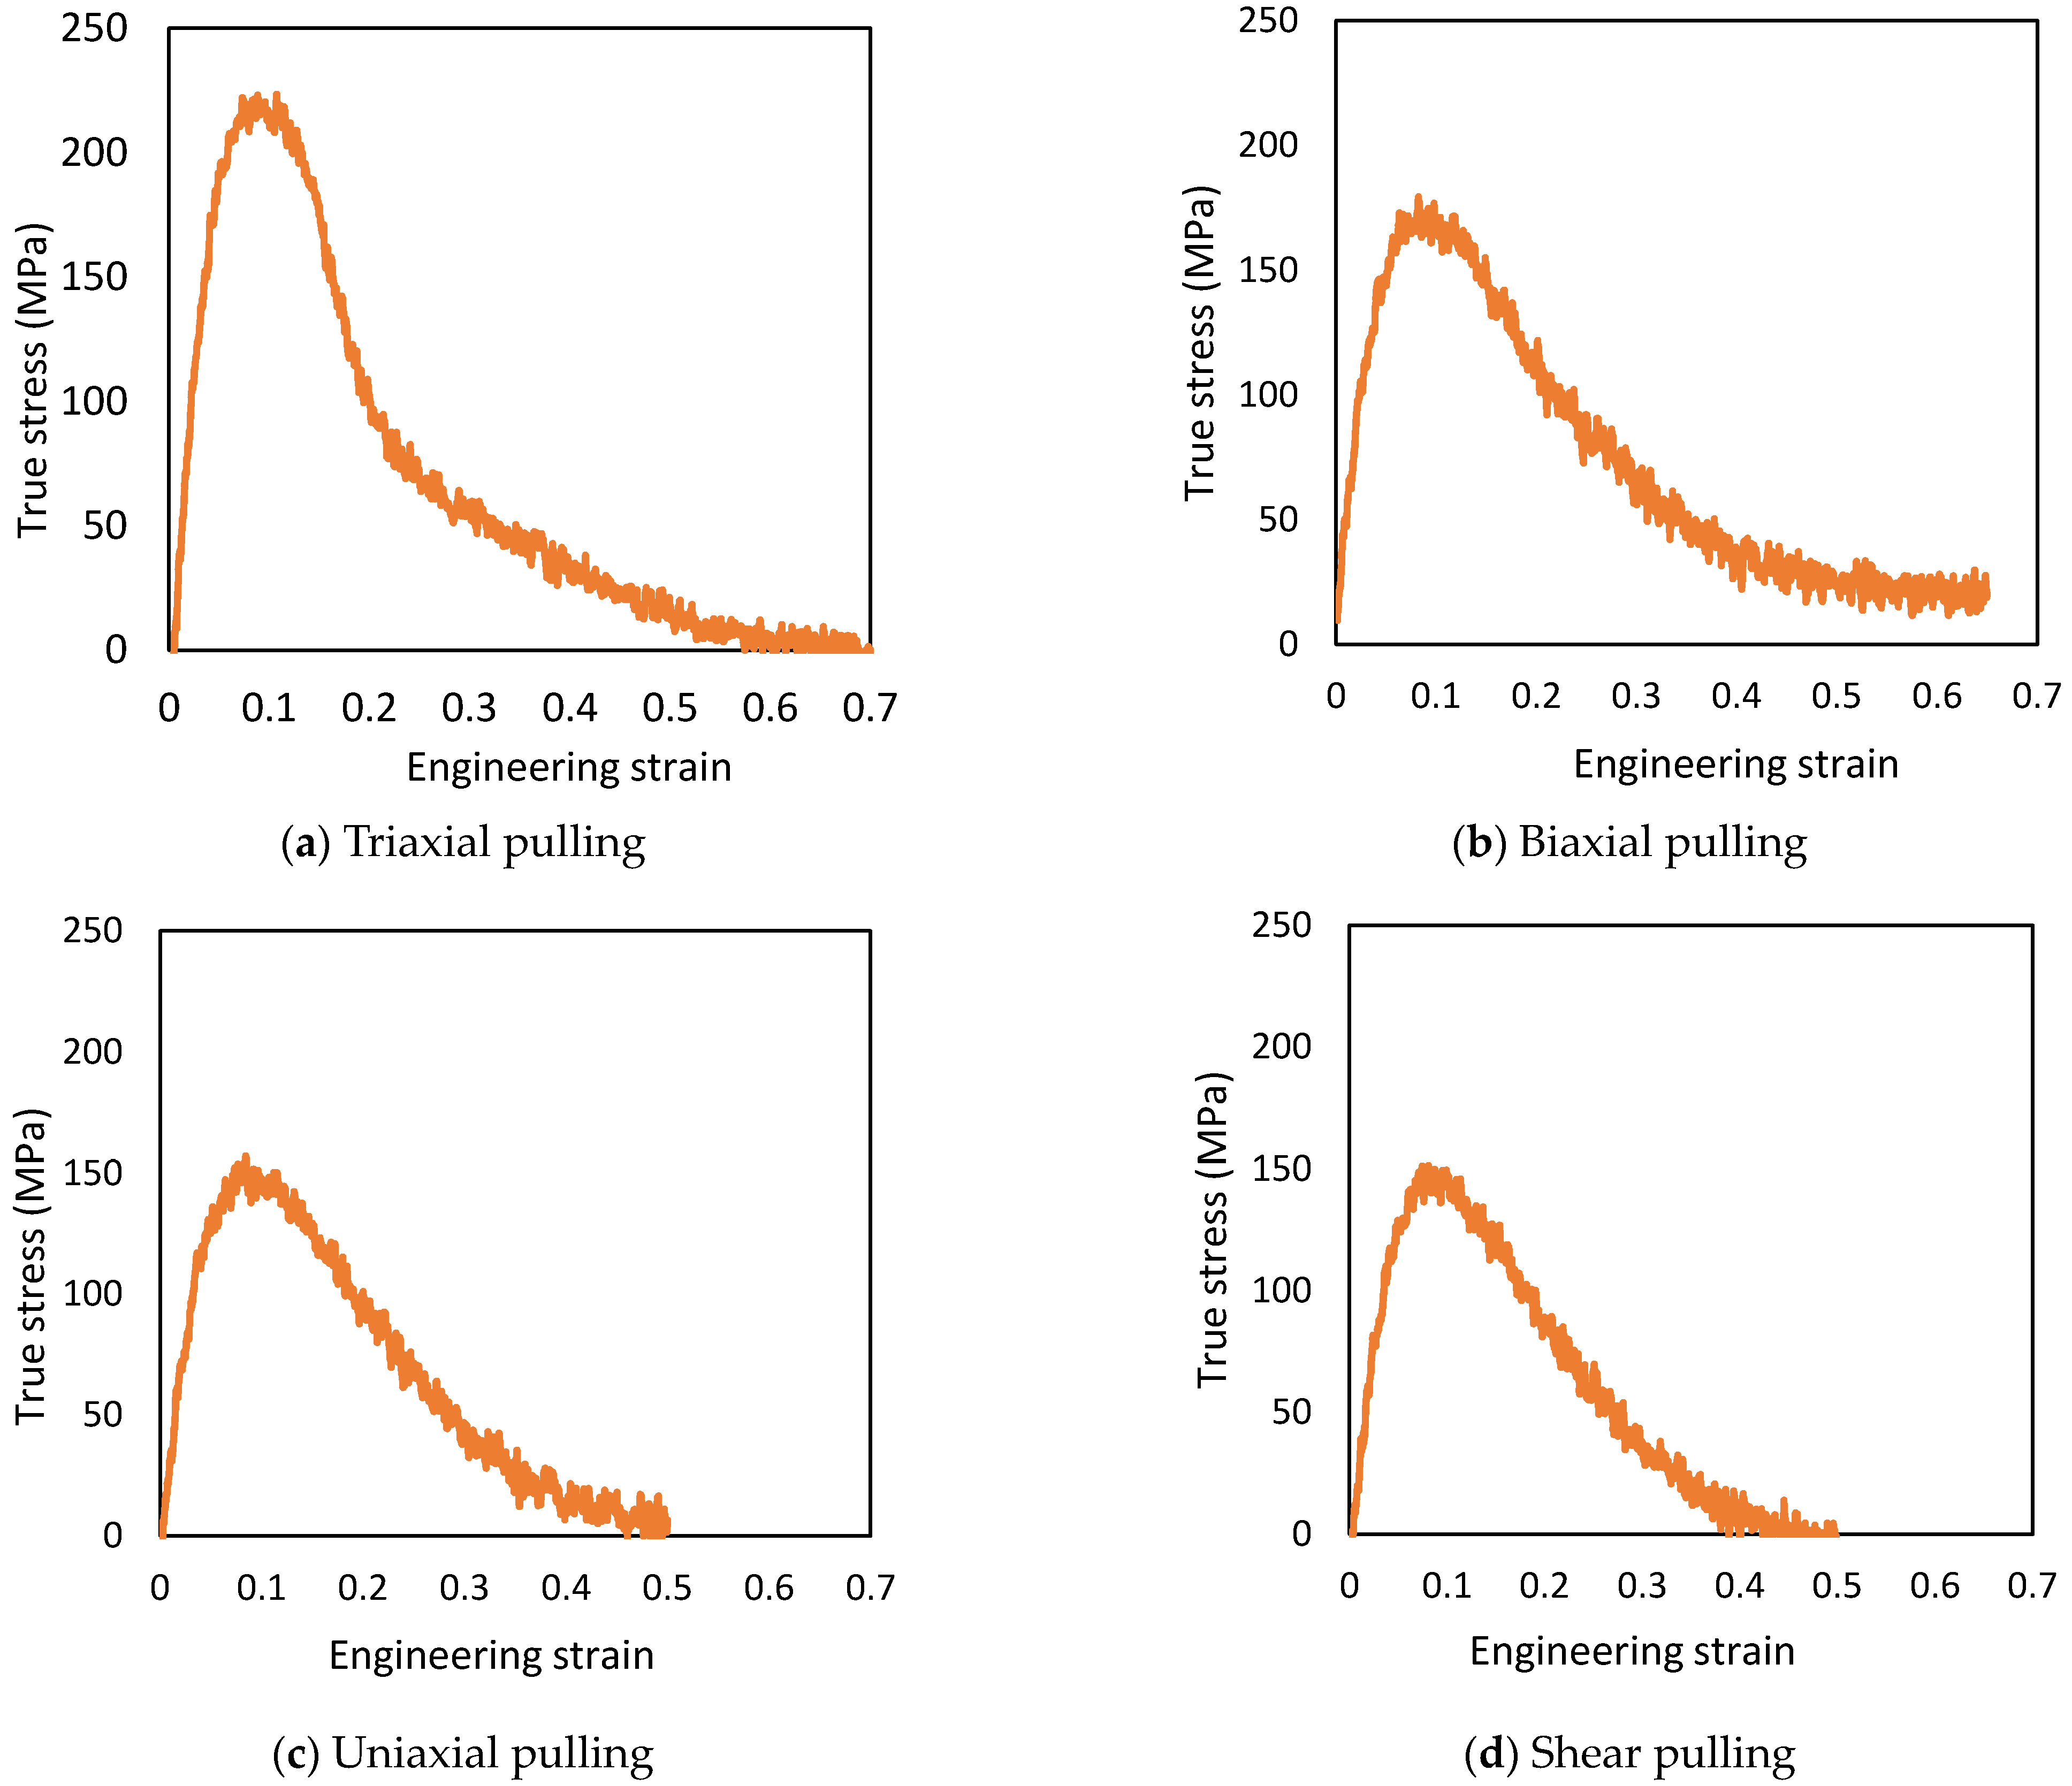
The true stress is defined as from the pressure tensor, with the simulation running until the stress value reaches 0 MPa after yielding. The strength and stress triaxiality results are listed in Table 2, and the stress–strain curves are shown in Figure 5. The strength of triaxial pulling was 220 MPa at ε = 0.11, biaxial pulling was 176 MPa at ε = 0.10, uniaxial pulling was 156 MPa at ε = 0.08, and shear pulling was 149 MPa at ε = 0.09. The strain at break was ε = 0.70 for triaxial pulling and ε = 0.50 for uniaxial pulling and ε = 0.50 for shear pulling, where ε is strain. In the case of biaxial pulling, the simulation error prevented pulling until the time of fracture, but the strain at break was estimated to have fractured at a strain of ε = 0.65, at which the change in stress was almost constant.
3.3. Fracture Entropy Calculation
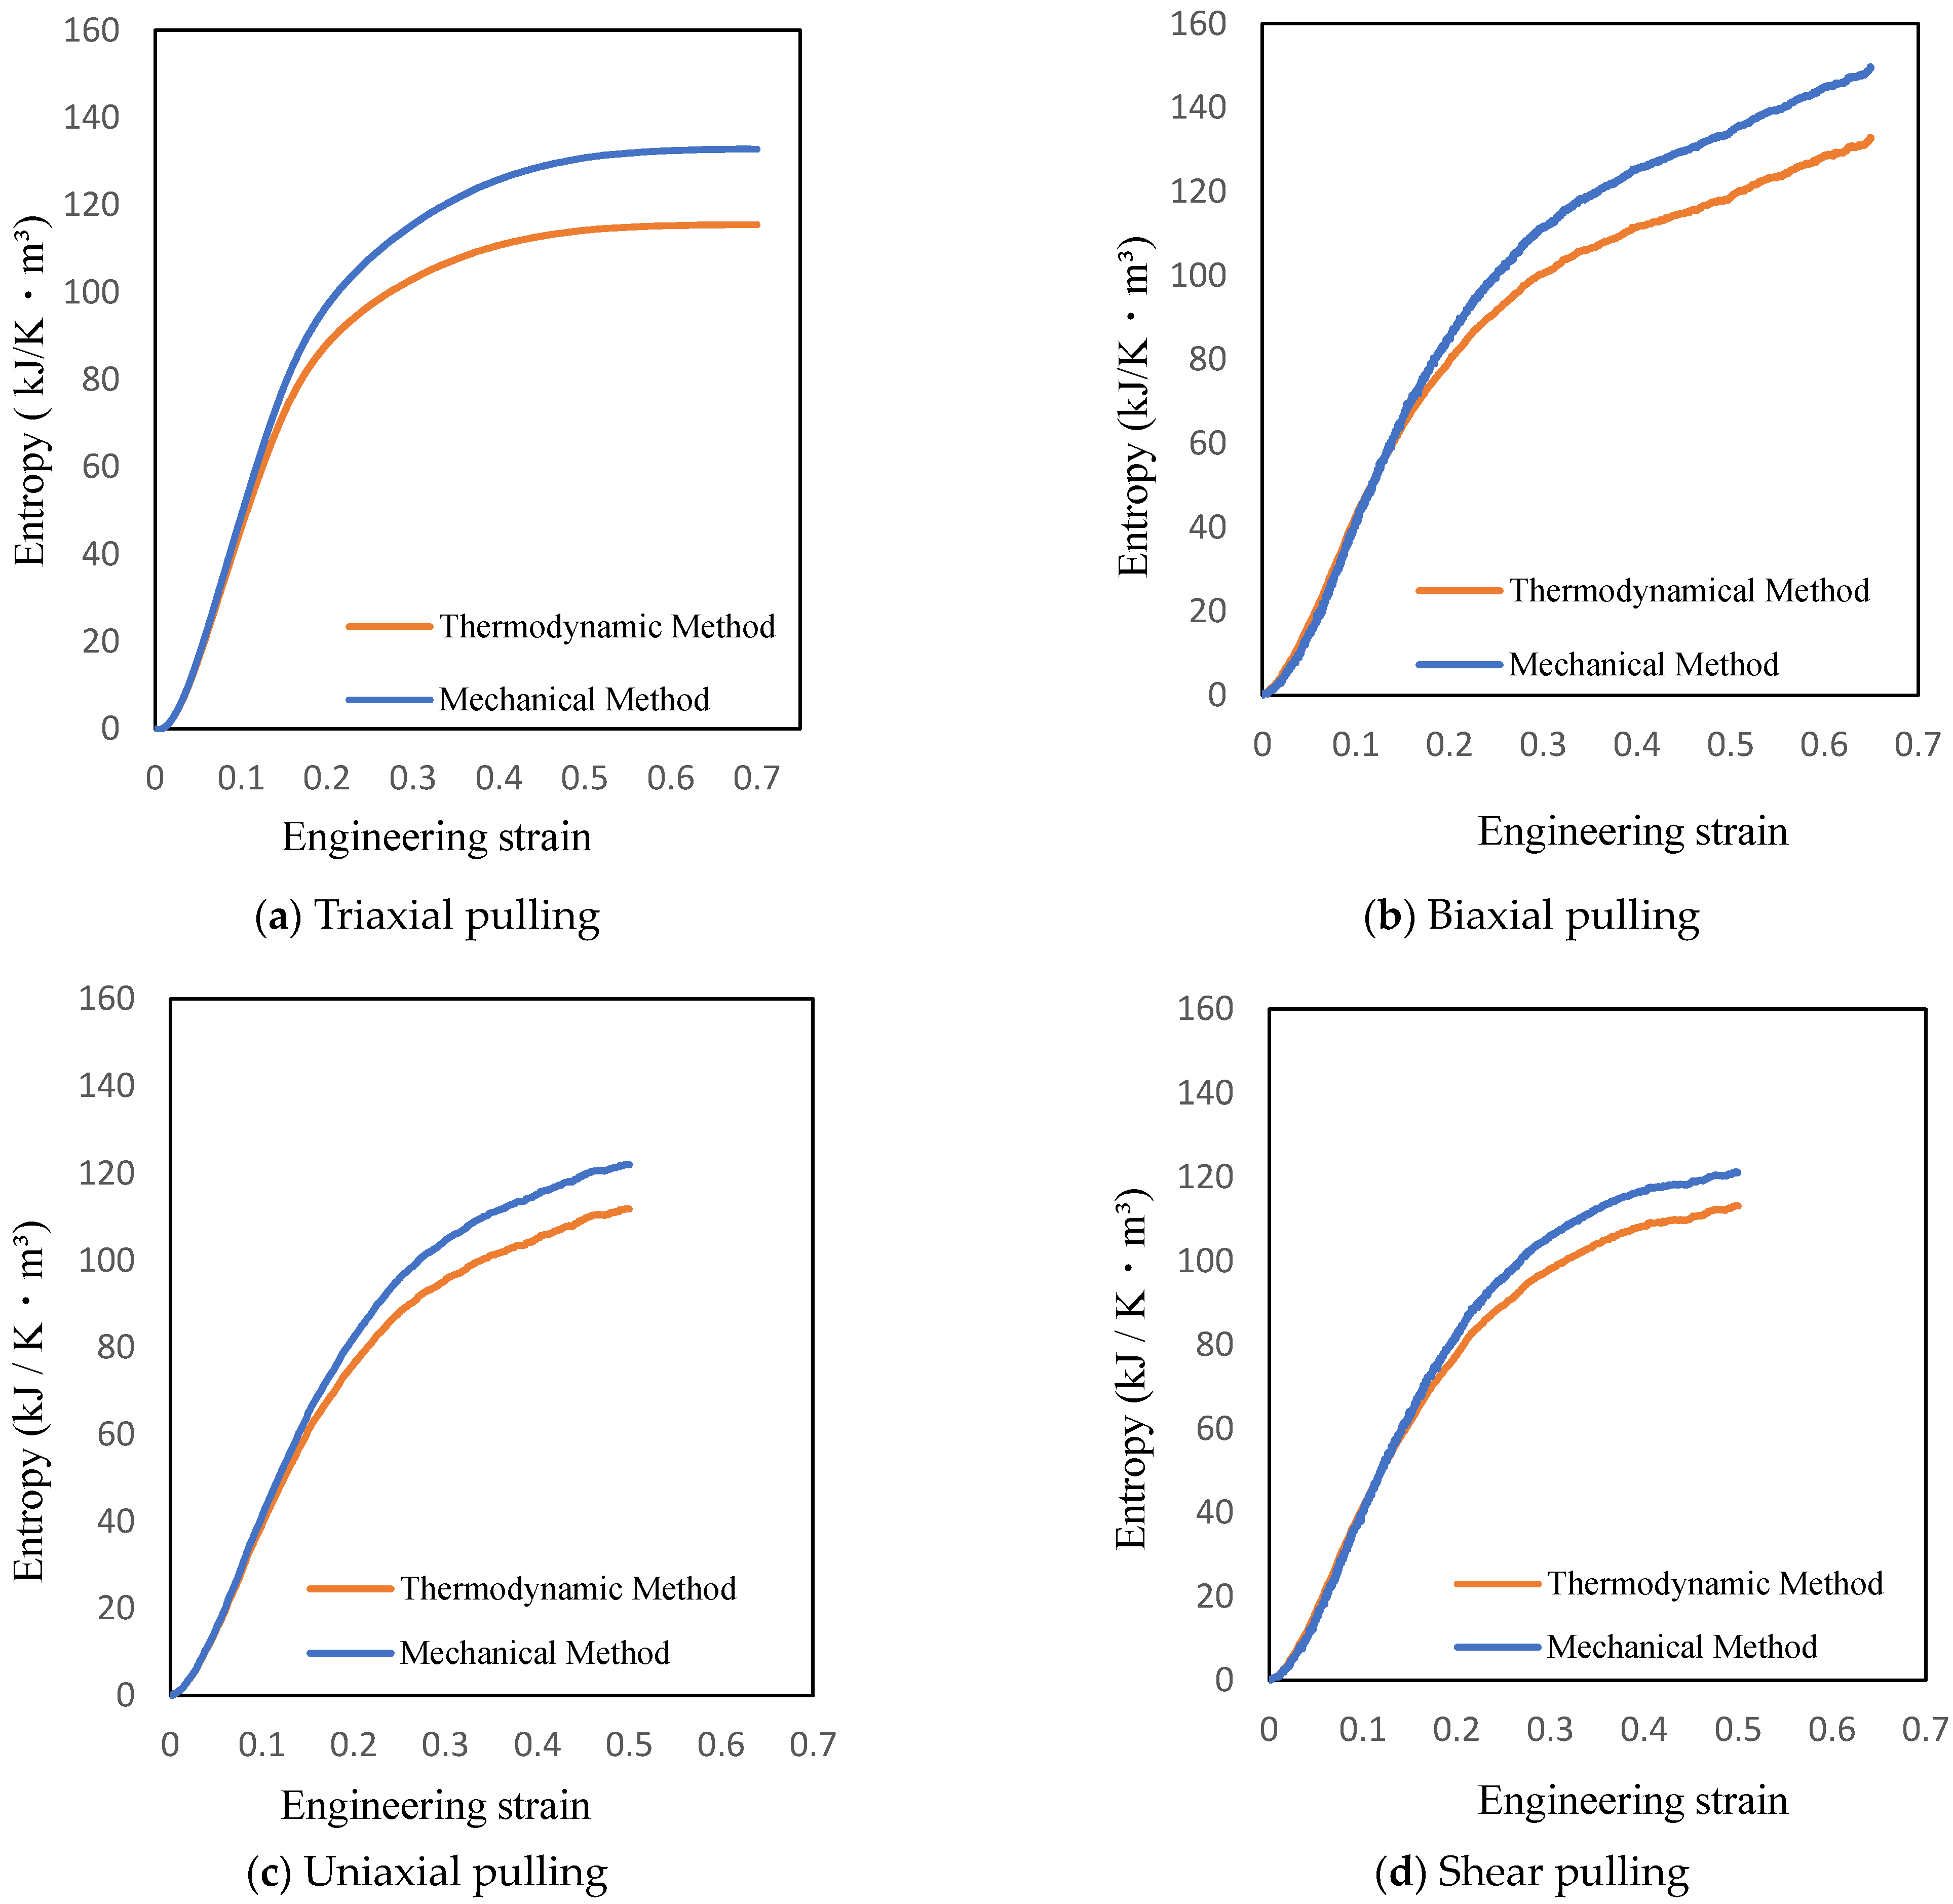
The entropy equations by the thermodynamic and mechanical methods are shown in Figure 6, exhibiting the increase in fracture entropy.
Equation (4) from the thermodynamic method and Equation (6) from the mechanical method both can be utilized for determining entropy. Therefore, it is assumed that the entropy values given by the two equations are equal. However, the results in Figure 6 show that the entropy increases differently for the two methods. This difference is attributed to the accumulation of large errors in the stress values determined by the virial equation [23] in mechanical method. Thus, it is possible to calculate the increase in entropy, a thermodynamic physical quantity, using the stress and strain values determined by the mechanical method, allowing entropy damage of the actual structure to be tracked.
The initial resin before tension is expected to have a homogeneous density. The entropy is expected to be low because the polymer chains are entangled and stuck together. If the resin is pulled, the entire density of the resin is expected to decrease, and voids are generated. In this process, the degree of freedom of the molecules increases due to the untangling of the polymers. We believe that this increase in the degree of freedom causes an increase in entropy. In addition, voids are regarded as damage. From the above, we believe that an increase in entropy causes an increase in voids.
Based on the thermodynamic method shown in Equation (4), entropy is a physical quantity corresponding to specific heat. Additionally, damage can be caused by tensile or compressive stress; however, on the micro scale, it is thought to be caused by the movement of molecules and the untangling of molecular chains. This increase in the degree of freedom of the molecular chain, in turn, increases its heat capacity. Thus, it can be said that damage is an increase in the degree of freedom of the molecular chain, which can be regarded as an increase in entropy, a physical quantity corresponding to heat capacity.
4. Conclusions
The stress-state dependence of fracture entropy for a polyamide 6 material is investigated through molecular dynamics simulations. To achieve this, entropy values are evaluated by molecular dynamics simulations with varied combined stress states. Similar entropy values are obtained independently of stress triaxiality. This study also reveals the relationship between material damage, which is correlated with void size, and the entropy value. We believe the increase in the degree of freedom in the molecular chain caused by material damage increases the entropy value.
Author Contributions
Conceptualization, J.K.; software, N.T. and K.M.; formal analysis, T.S.; investigation, N.T. and T.S.; resources, J.K.; data curation, N.T.; writing—original draft preparation, N.T.; visualization, N.T. and K.M.; project administration, J.K.; funding acquisition, J.K. All authors have read and agreed to the published version of the manuscript.
Funding
This research was funded by JST MIRAI grant number 19215408 and JKA Foundation.
Institutional Review Board Statement
Not applicable.
Informed Consent Statement
Not applicable.
Data Availability Statement
This study did not report any data.
Acknowledgments
This work was supported by grants from JST MIRAI grant number 19215408 and JKA (promotion funds from KEIRIN RACE) Foundation.
Conflicts of Interest
The authors declare no conflict of interest.
References
- Lee, M.S.; Seo, H.Y.; Kang, C.G. Comparative study on mechanical properties of CR340/CFRP composites through three point bending test by using theoretical and experimental methods. Int. J. Precis. Eng. Manuf. Green Technol. 2016, 3, 359–365. [Google Scholar] [CrossRef]
- Sato, M.; Hasegawa, K.; Koyanagi, J.; Higuchi, R.; Ishida, Y. Residual strength prediction for unidirectional CFRP using a nonlinear viscoelastic constitutive equation considering entropy damage. Compos. Part A Appl. Sci. Manuf. 2021, 141, 106178. [Google Scholar] [CrossRef]
- Sawamura, Y.; Yamazaki, Y.; Yoneyama, S.; Koyanagi, J. Multi-scale numerical simulation of impact failure for cylindrical CFRP. Adv. Compos. Mater. 2021, 30 (Suppl. 1), 19–38. [Google Scholar] [CrossRef]
- Li, Y.; Wang, Q.; Wang, S. A review on enhancement of mechanical and tribological properties of polymer composites reinforced by carbon nanotubes and graphene sheet: Molecular dynamics simulations. Compos. Part B Eng. 2019, 160, 348–361. [Google Scholar] [CrossRef]
- Reuter, C.; Tröster, T. Crashworthiness and numerical simulation of hybrid aluminium-CFRP tubes under axial impact. Thin-Walled Struct. 2017, 117, 1–9. [Google Scholar] [CrossRef]
- Koyanagi, J.; Itano, N.; Yamamoto, M.; Mori, K.; Ishida, Y.; Bazhirov, T. Evaluation of the mechanical properties of carbon fiber/polymer resin interfaces by molecular simulation. Adv. Compos. Mater. 2019, 28, 639–652. [Google Scholar] [CrossRef]
- Kolanu, N.R.; Raju, G.; Ramji, M. A unified numerical approach for the simulation of intra and inter laminar damage evolution in stiffened CFRP panels under compression. Compos. Part B Eng. 2020, 190, 107931. [Google Scholar] [CrossRef]
- Sato, M.; Koyanagi, J.; Lu, X.; Kubota, Y.; Ishida, Y.; Tay, T.E. Temperature dependence of interfacial strength of carbon-fiber-reinforced temperature-resistant polymer composites. Compos. Struct. 2018, 202, 283–289. [Google Scholar] [CrossRef]
- Machado, J.J.M.; Marques, E.A.S.; Campilho, R.D.S.G.; da Silva, L.F.M. Mode I fracture toughness of CFRP as a function of temperature and strain rate. J. Compos. Mater. 2017, 51, 3315–3326. [Google Scholar] [CrossRef]
- Lin, F.; Xiang, Y.; Shen, H.S. Temperature dependent mechanical properties of graphene reinforced polymer nanocomposites—A molecular dynamics simulation. Compos. Part B Eng. 2017, 111, 261–269. [Google Scholar] [CrossRef]
- Basaran, C.; Nie, S. An irreversible thermodynamics theory for damage mechanics of solids. Int. J. Damage Mech. 2004, 13, 205–223. [Google Scholar] [CrossRef]
- Young, C.; Subbarayan, G. Maximum entropy models for fatigue damage in metals with application to low-cycle fatigue of aluminum 2024-T351. Entropy 2019, 21, 967. [Google Scholar] [CrossRef] [Green Version]
- Imanian, A.; Modarres, M. A thermodynamic entropy approach to reliability assessment with applications to corrosion fatigue. Entropy 2015, 17, 6995–7020. [Google Scholar] [CrossRef] [Green Version]
- Zhang, M.H.; Shen, X.H.; He, L.; Zhang, K.S. Application of differential entropy in characterizing the deformation inhomogeneity and life prediction of low-cycle fatigue of metals. Materials 2018, 11, 1917. [Google Scholar] [CrossRef] [Green Version]
- Ontiveros, V.; Amiri, M.; Kahirdeh, A.; Modarres, M. Thermodynamic entropy generation in the course of the fatigue crack initiation. Fatigue Fract. Eng. Mater. Struct. 2017, 40, 423–434. [Google Scholar] [CrossRef]
- Yun, H.; Modarres, M. Measures of Entropy to Characterize Fatigue Damage in Metallic Materials. Entropy 2019, 21, 804. [Google Scholar] [CrossRef] [Green Version]
- Sosnovskiy, L.A.; Sherbakov, S.S. Mechanothermodynamic entropy and analysis of damage state of complex systems. Entropy 2016, 18, 268. [Google Scholar] [CrossRef] [Green Version]
- Liakat, M.; Khonsari, M.M. Entropic characterization of metal fatigue with stress concentration. Int. J. Fatigue 2015, 70, 223–234. [Google Scholar] [CrossRef]
- Fujimoto, K.; Tang, Z.; Shinoda, W.; Okazaki, S. All-atom molecular dynamics study of impact fracture of glassy polymers. I: Molecular mechanism of brittleness of PMMA and ductility of PC. Polymer 2019, 178, 121570. [Google Scholar] [CrossRef]
- Cho, S.; Jeong, S.; Kim, J.M.; Baig, C. Molecular dynamics for linear polymer melts in bulk and confined systems under shear flow. Sci. Rep. 2017, 7, 9004. [Google Scholar] [CrossRef] [Green Version]
- Fu, Y.; Michopoulos, J.G.; Song, J.H. On Investigating the Thermomechanical Properties of Cross-linked Epoxy via Molecular Dynamics Analysis. Nanoscale Microscale Thermophys. Eng. 2017, 21, 8–25. [Google Scholar] [CrossRef]
- Koo, B.; Subramanian, N.; Chattopadhyay, A. Molecular dynamics study of brittle fracture in epoxy-based thermoset polymer. Compos. Part B Eng. 2016, 95, 433–439. [Google Scholar] [CrossRef] [Green Version]
- Kasahara, S.; Koyanagi, J.; Mori, K.; Yabe, M. Evaluation of interface properties of carbon fiber/resin using the full atomistic model considering the electric charge state. Adv. Compos. Mater. 2020, 30, 1–12. [Google Scholar] [CrossRef]
- Zhao, J.; Yu, P.; Dong, S. The influence of crosslink density on the failure behavior in amorphous polymers by molecular dynamics simulations. Materials 2016, 9, 234. [Google Scholar] [CrossRef] [PubMed] [Green Version]
- Pisani, W.A.; Radue, M.S.; Chinkanjanarot, S.; Bednarcyk, B.A.; Pineda, E.J.; Waters, K.; Pandey, R.; King, J.A.; Odegard, G.M. Multiscale modeling of PEEK using reactive molecular dynamics modeling and micromechanics. Polymer 2019, 163, 96–105. [Google Scholar] [CrossRef] [Green Version]
- Nazarychev, V.M.; Lyulin, A.V.; Larin, S.V.; Gurtovenko, A.A.; Kenny, J.M.; Lyulin, S.V. Molecular dynamics simulations of uniaxial deformation of thermoplastic polyimides. Soft Matter 2016, 12, 3972–3981. [Google Scholar] [CrossRef] [Green Version]
- Koyanagi, J.; Takase, N.; Mori, K.; Sakai, T. Molecular dynamics simulation for the quantitative prediction of experimental tensile strength of a polymer material. Compos. Part C Open Access 2020, 2, 100041. [Google Scholar] [CrossRef]
- Gusev, A.A.; Schwarz, F. Molecular Dynamics Validation and Applications of the Maximum Entropy Homogenization Procedure for Predicting the Elastic Properties of Gaussian Polymer Networks. Macromolecules 2019, 52, 9445–9455. [Google Scholar] [CrossRef]
- Wessels, M.G.; Jayaraman, A. Molecular dynamics simulation study of linear, bottlebrush, and star-like amphiphilic block polymer assembly in solution. Soft Matter 2019, 15, 3987–3998. [Google Scholar] [CrossRef] [PubMed]
- Xu, W.S.; Douglas, J.F.; Xu, X. Molecular dynamics study of glass formation in polymer melts with varying chain stiffness. Macromolecules 2020, 53, 4796–4809. [Google Scholar] [CrossRef]
- Cao, X.Z.; Merlitz, H.; Wu, C.X.; Ungar, G.; Sommer, J.U. A theoretical study of dispersion-to-aggregation of nanoparticles in adsorbing polymers using molecular dynamics simulations. Nanoscale 2016, 8, 6964–6968. [Google Scholar] [CrossRef] [PubMed] [Green Version]
- Rondina, G.G.; Böhm, M.C.; Müller-Plathe, F. Predicting the Mobility Increase of Coarse-Grained Polymer Models from Excess Entropy Differences. J. Chem. Theory Comput. 2020, 16, 1431–1447. [Google Scholar] [CrossRef] [PubMed]
- Tito, N.B.; Creton, C.; Storm, C.; Ellenbroek, W.G. Harnessing entropy to enhance toughness in reversibly crosslinked polymer networks. Soft Matter 2019, 15, 2190–2203. [Google Scholar] [CrossRef] [PubMed] [Green Version]
- Evans, D.J.; Holian, B.L. The nose–hoover thermostat. J Chem. Phys. 1985, 83, 4069–4074. [Google Scholar] [CrossRef]
- Parrinello, M.; Rahman, A. Polymorphic transitions in single crystals: A new molecular dynamics method. J. Appl. Phys. 1981, 52, 7182–7190. [Google Scholar] [CrossRef]
- Berendsen, H.J.C.; van der Spoel, D.; van Drunen, R. GROMACS: A message-passing parallel molecular dynamics implementation. Comput. Phys. Commun. 1995, 91, 43–56. [Google Scholar] [CrossRef]
- Jorgensen, W.L.; Maxwell, D.S.; Tirado-Rives, J. Development and testing of the OPLS all-atom force field on conformational energetics and properties of organic liquids. J. Am. Chem. Soc. 1996, 118, 11225–11236. [Google Scholar] [CrossRef]
- Yabe, M.; Mori, K.; Ueda, K.; Takeda, M. Development of PolyParGen Software to Facilitate the Determination of Molecular Dynamics Simulation Parameters for Polymers. J. Comput. Chem. Jpn. Int. Ed. 2019, 5, 2018-0034. [Google Scholar] [CrossRef] [Green Version]
- Essmann, U.; Perera, L.; Berkowitz, M.L.; Darden, T.; Lee, H.; Pedersen, L.G. A smooth particle mesh Ewald method. J. Chem. Phys. 1995, 103, 8577–8593. [Google Scholar] [CrossRef] [Green Version]
- Hess, B.; Bekker, H.; Berendsen, H.J.C.; Fraaije, J.G.E.M. LINCS: A Linear Constraint Solver for molecular simulations. J. Comput. Chem. 1997, 18, 1463–1472. [Google Scholar] [CrossRef]
- Li, J.; Humphrey, M.; Agarwal, D.; Jackson, K.; van Ingen, C.; Ryu, Y. EScience in the cloud: A MODIS satellite data reprojection and reduction pipeline in the Windows Azure platform. In Proceedings of the 2010 IEEE International Symposium on Parallel & Distributed Processing (IPDPS), Atlanta, GA, USA, 19–23 April 2010; pp. 1–15. [Google Scholar]
- Humphrey, W.; Dalke, A.; Schulten, K. VMD: Visual Molecular Dynamics. J. Mol. Graph. 1996, 14, 33–38. [Google Scholar] [CrossRef]
- Kawai, T.; Soeno, S.; Kuroda, S.i.; Koido, S.; Nemoto, T.; Tamada, M. Deformation induced void formation and growth in β nucleated isotactic polypropylene. Polymer 2019, 178, 121523. [Google Scholar] [CrossRef]
Figure 1.
Illustration of the initial system of PA6 consisting of 1000 molecules.

Figure 2.
Stress–strain relationship with void increase due to fracture progression. (a–i) corresponds to the illustration of the voids in Figure 3.
Figure 2.
Stress–strain relationship with void increase due to fracture progression. (a–i) corresponds to the illustration of the voids in Figure 3.

Figure 3.
The generation and growth of voids inside the resin at each strain.

Figure 4.
Relationship of entropy and void volume with strain.

Figure 5.
Stress–strain curves with different combined stress states (z-axis).

Figure 6.
Entropy increase with different combined stress states using two different methods.


Table 1.
Simulation conditions for fracture simulation.
| Stress State | Ensemble | Stress Triaxiality | Setting Pressure | Setting Pressure | Strain at Fracture |
|---|---|---|---|---|---|
| (X-axis) (MPa) | (Y-axis) (MPa) | ||||
| Triaxial pulling | NVE | 1.81 | - | - | 0.70 |
| Biaxial pulling | NPH | 0.68 | −200 | −200 | 0.65 |
| Uniaxial pulling | NPH | 0.26 | 1 | 1 | 0.50 |
| Shear pulling | NPH | 0.08 | −100 | −100 | 0.50 |
Table 2.
Simulation results: relationship between stress triaxiality, maximum stresses, strain at fracture, and fracture entropy.
Table 2.
Simulation results: relationship between stress triaxiality, maximum stresses, strain at fracture, and fracture entropy.
| Stress State | Ensemble | Stress Triaxiality | Maximum Stress (Z-axis) (MPa) | Strain at Fracture | Fracture Entropy |
|---|---|---|---|---|---|
| (Thermodynamical Methods) (kJ/Km³) | |||||
| Triaxial pulling | NVE | 1.81 | 220 | 0.70 | 115 |
| Biaxial pulling | NPH | 0.68 | 176 | 0.65 | 131 |
| Uniaxial pulling | NPH | 0.26 | 156 | 0.50 | 111 |
| Shear pulling | NPH | 0.08 | 149 | 0.50 | 114 |
Publisher’s Note: MDPI stays neutral with regard to jurisdictional claims in published maps and institutional affiliations. |
© 2021 by the authors. Licensee MDPI, Basel, Switzerland. This article is an open access article distributed under the terms and conditions of the Creative Commons Attribution (CC BY) license (https://creativecommons.org/licenses/by/4.0/).
Share and Cite
MDPI and ACS Style
Takase, N.; Koyanagi, J.; Mori, K.; Sakai, T. Molecular Dynamics Simulation for Evaluating Fracture Entropy of a Polymer Material under Various Combined Stress States. Materials 2021, 14, 1884. https://doi.org/10.3390/ma14081884
AMA Style
Takase N, Koyanagi J, Mori K, Sakai T. Molecular Dynamics Simulation for Evaluating Fracture Entropy of a Polymer Material under Various Combined Stress States. Materials. 2021; 14(8):1884. https://doi.org/10.3390/ma14081884
Chicago/Turabian StyleTakase, Naohiro, Jun Koyanagi, Kazuki Mori, and Takenobu Sakai. 2021. "Molecular Dynamics Simulation for Evaluating Fracture Entropy of a Polymer Material under Various Combined Stress States" Materials 14, no. 8: 1884. https://doi.org/10.3390/ma14081884
Note that from the first issue of 2016, this journal uses article numbers instead of page numbers. See further details here.