Location of Multiple Damage Types in a Truss-Type Structure Using Multiple Signal Classification Method and Vibration Signals

 , , , ,
Abstract
:1. Introduction
2. Theoretical Background
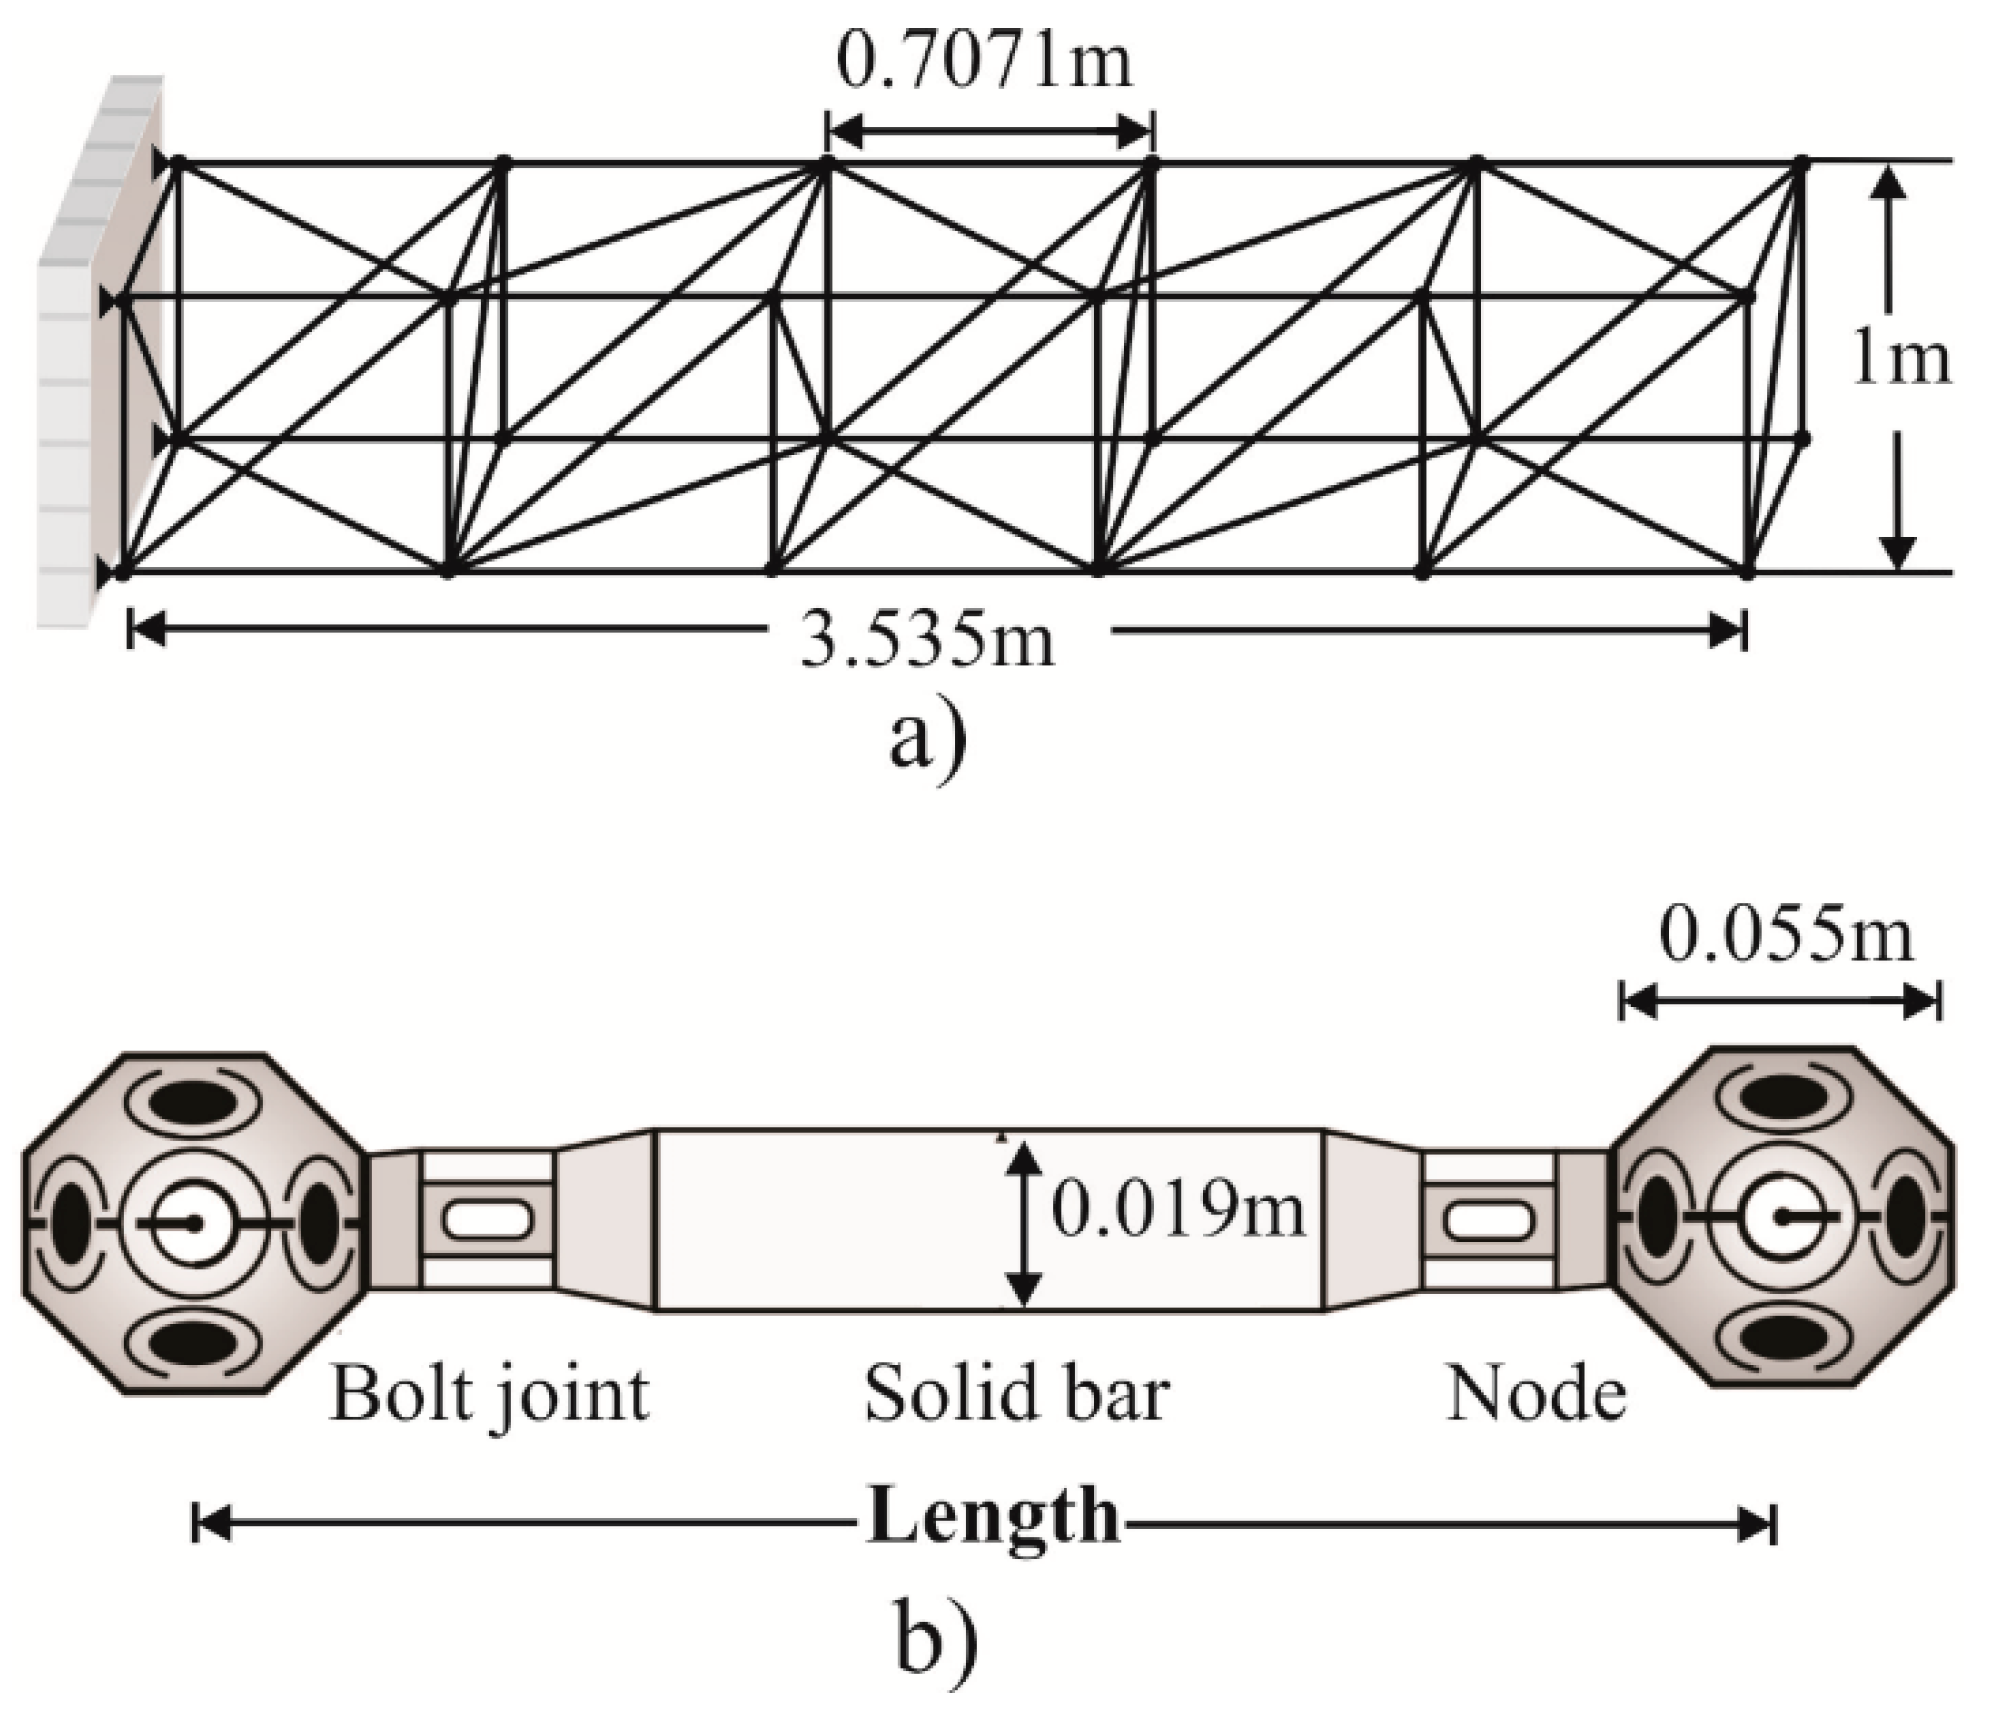
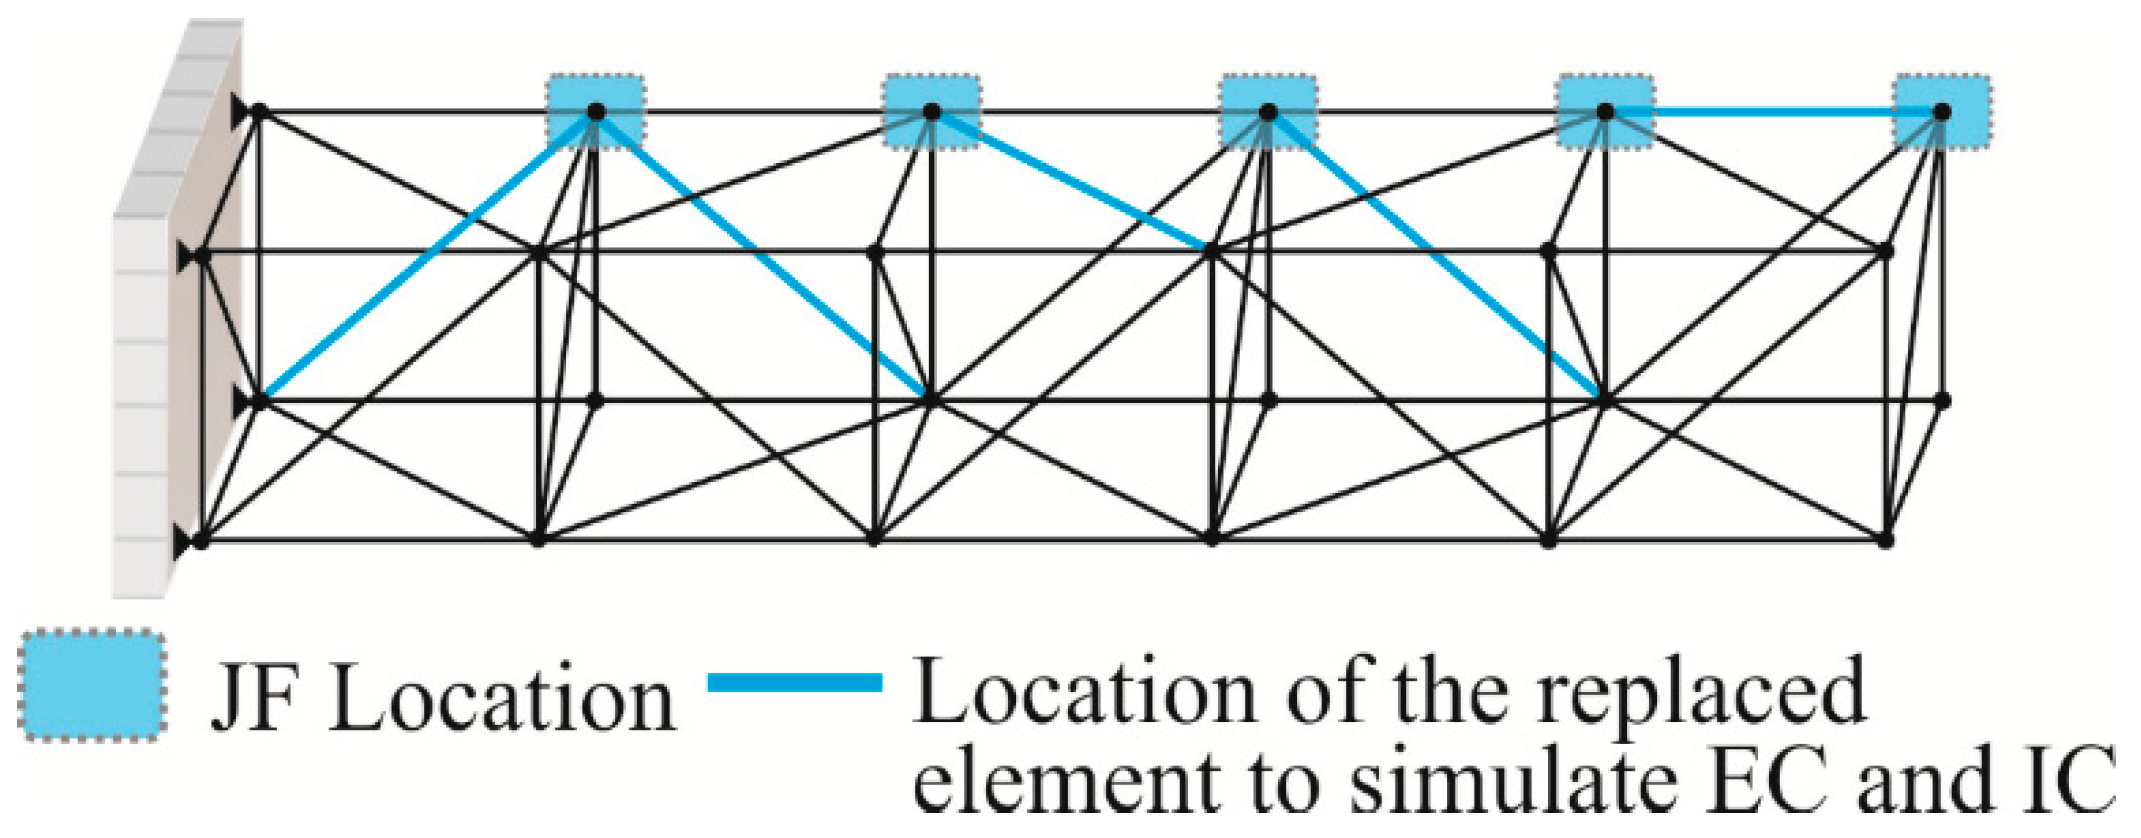
2.1. Truss-Type Structure
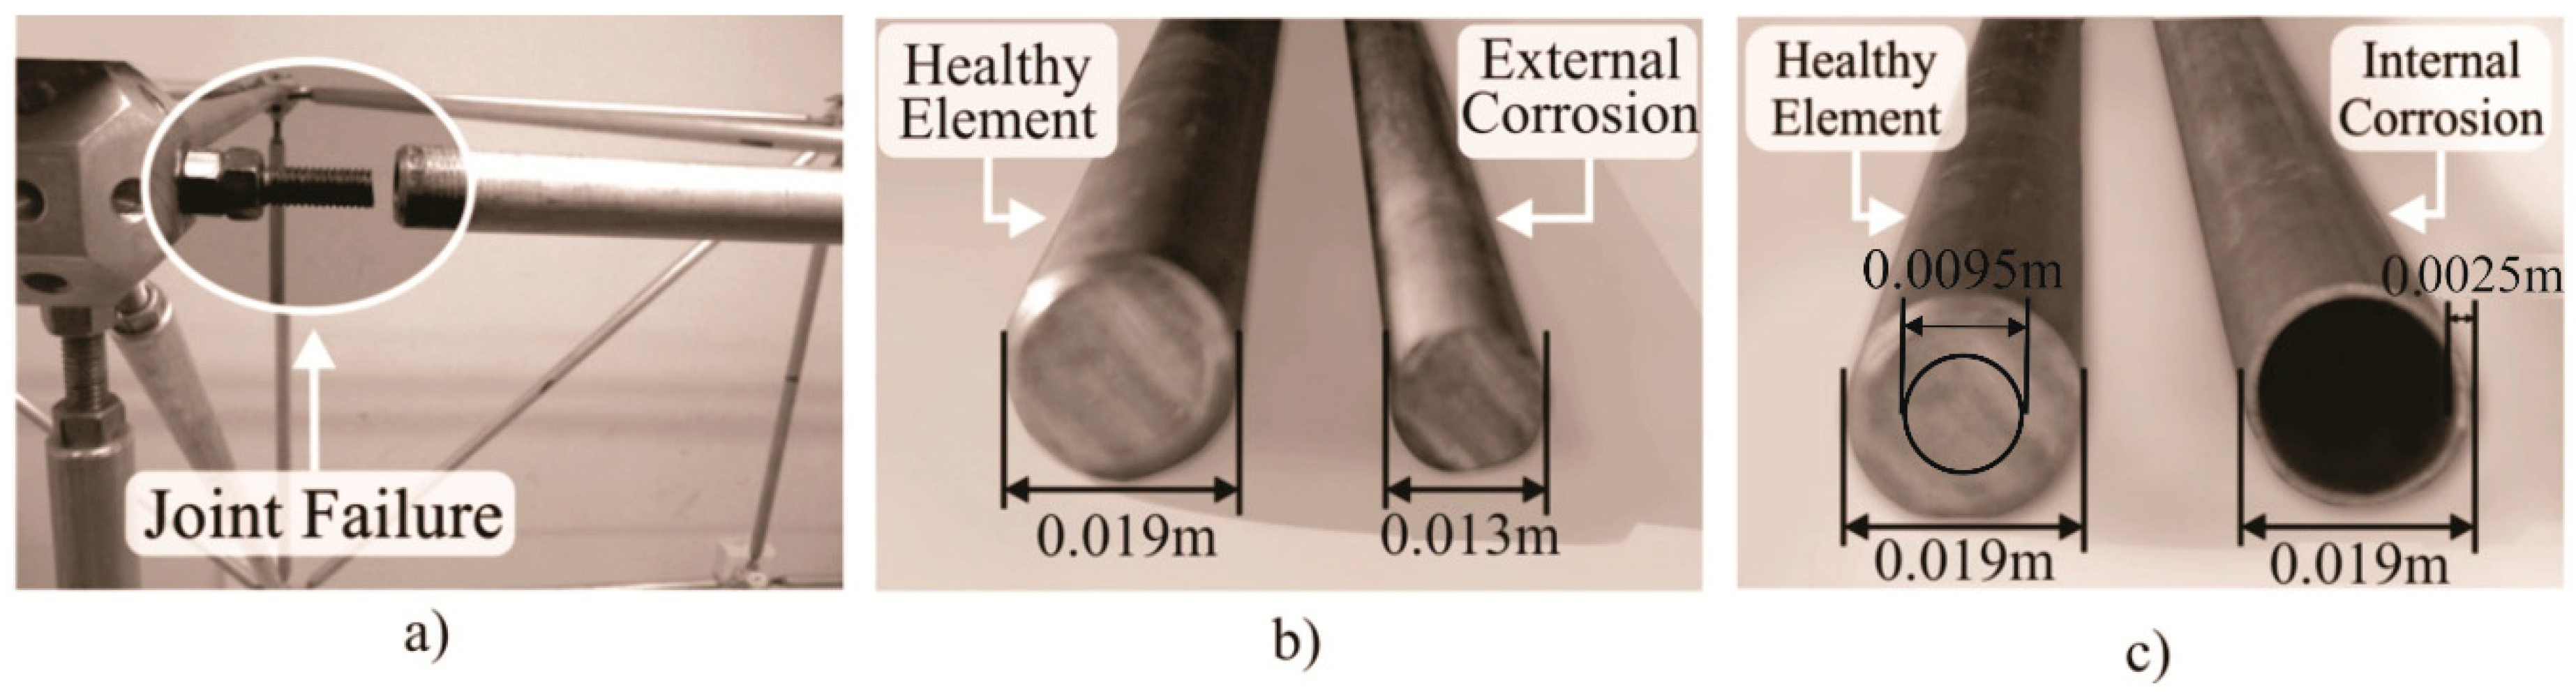
2.1.1. Joint Failure
2.1.2. External and Internal Corrosion
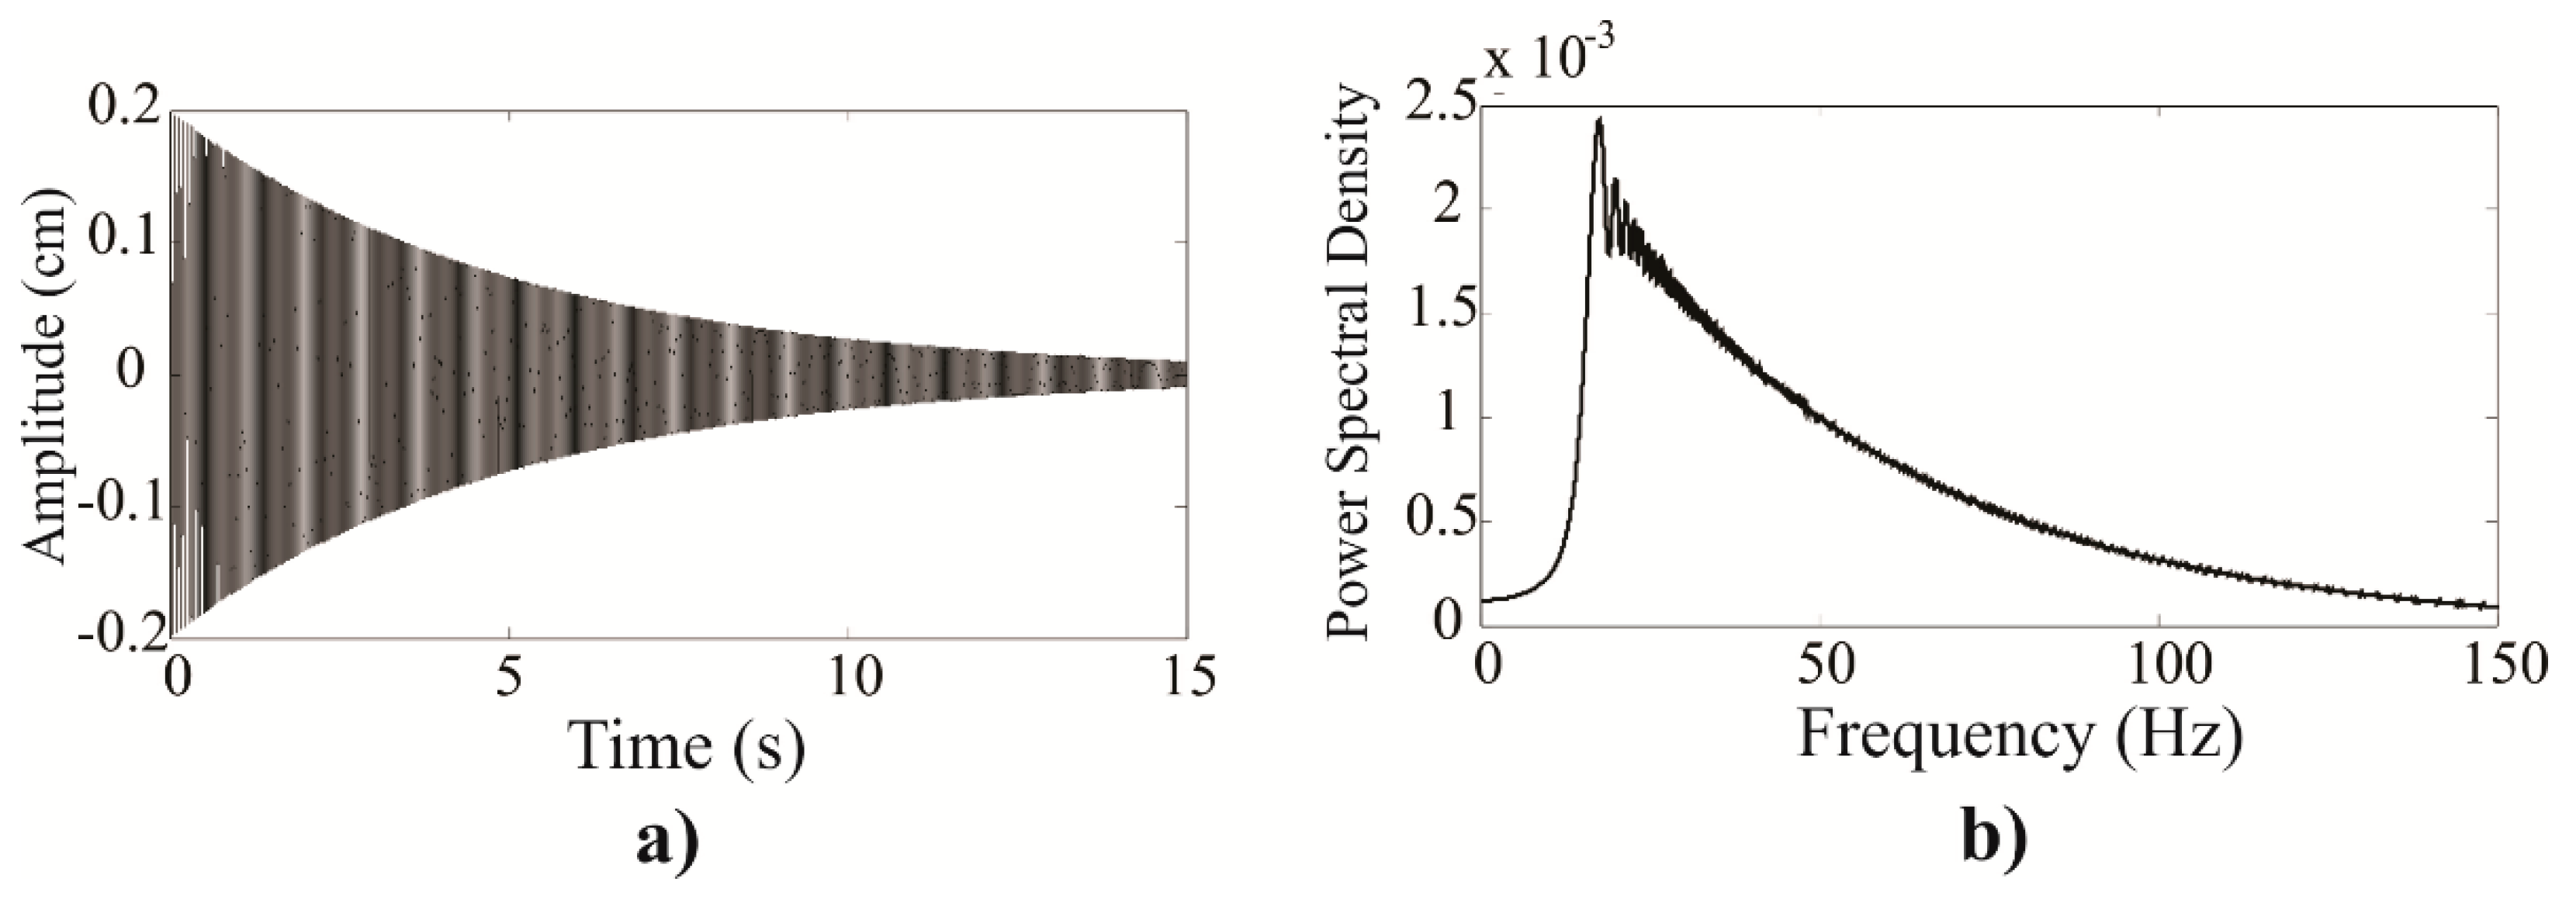
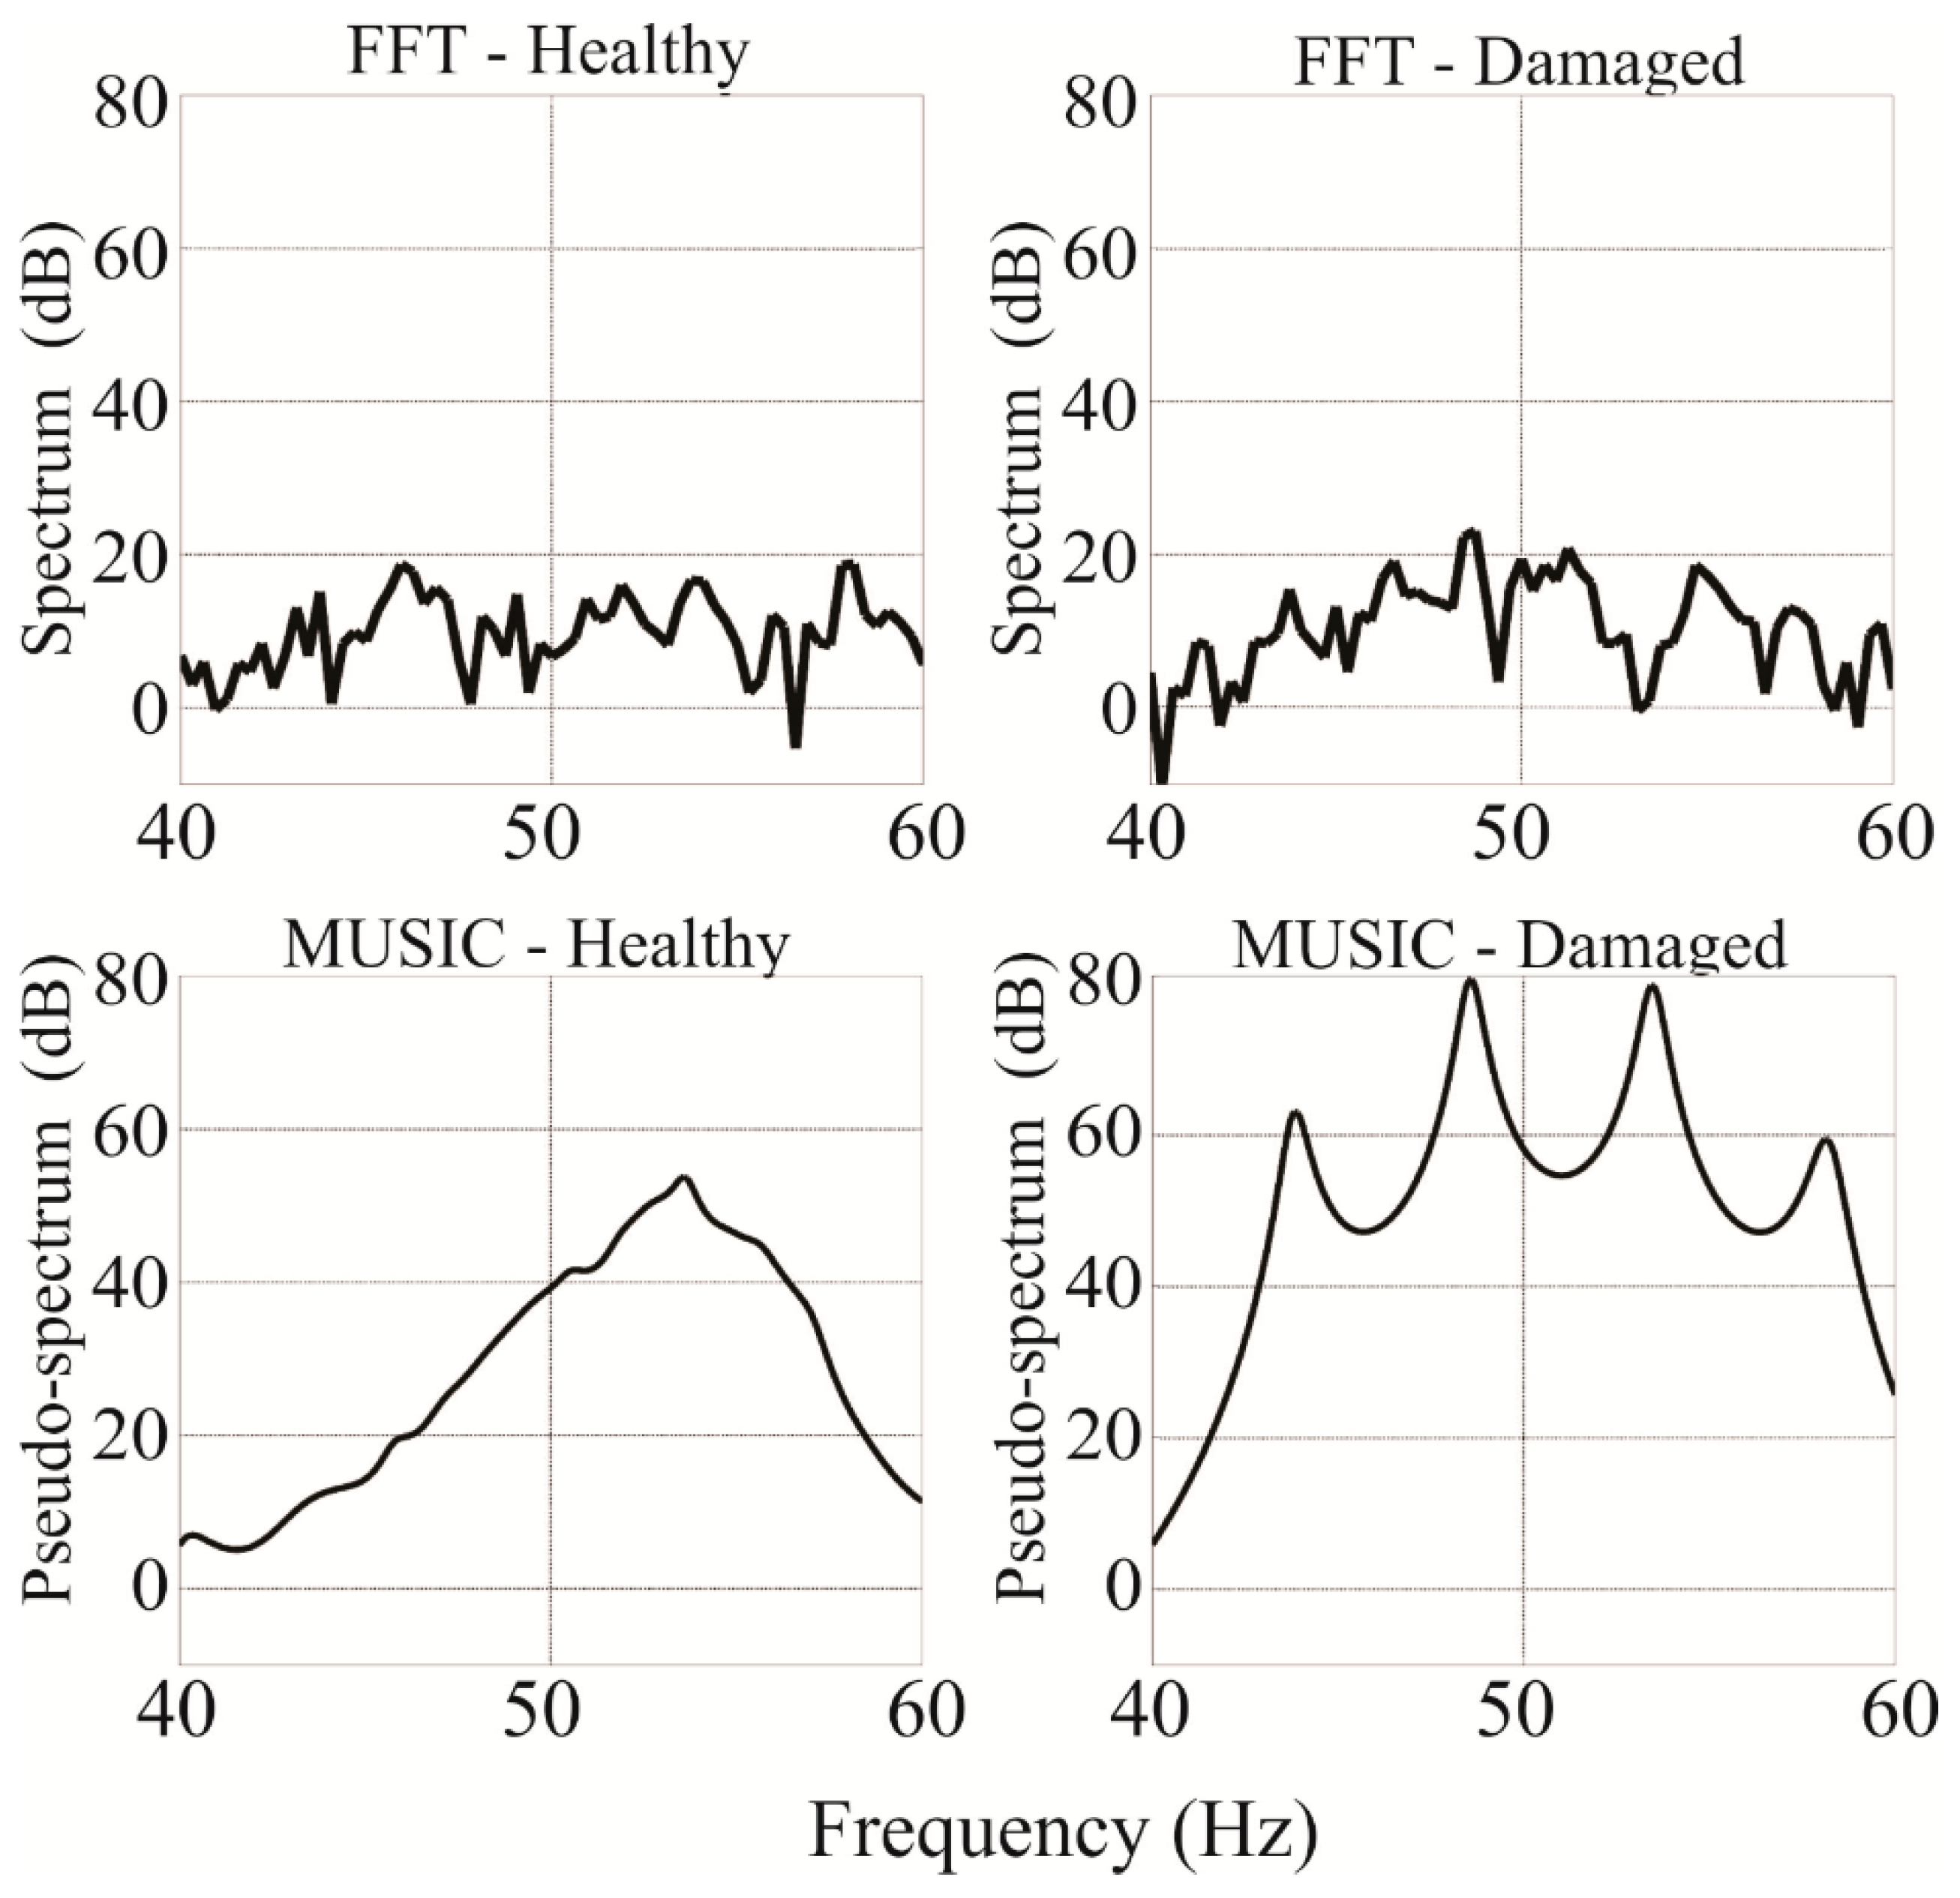
2.2. Multiple Signal Classification (MUSIC) Algorithm
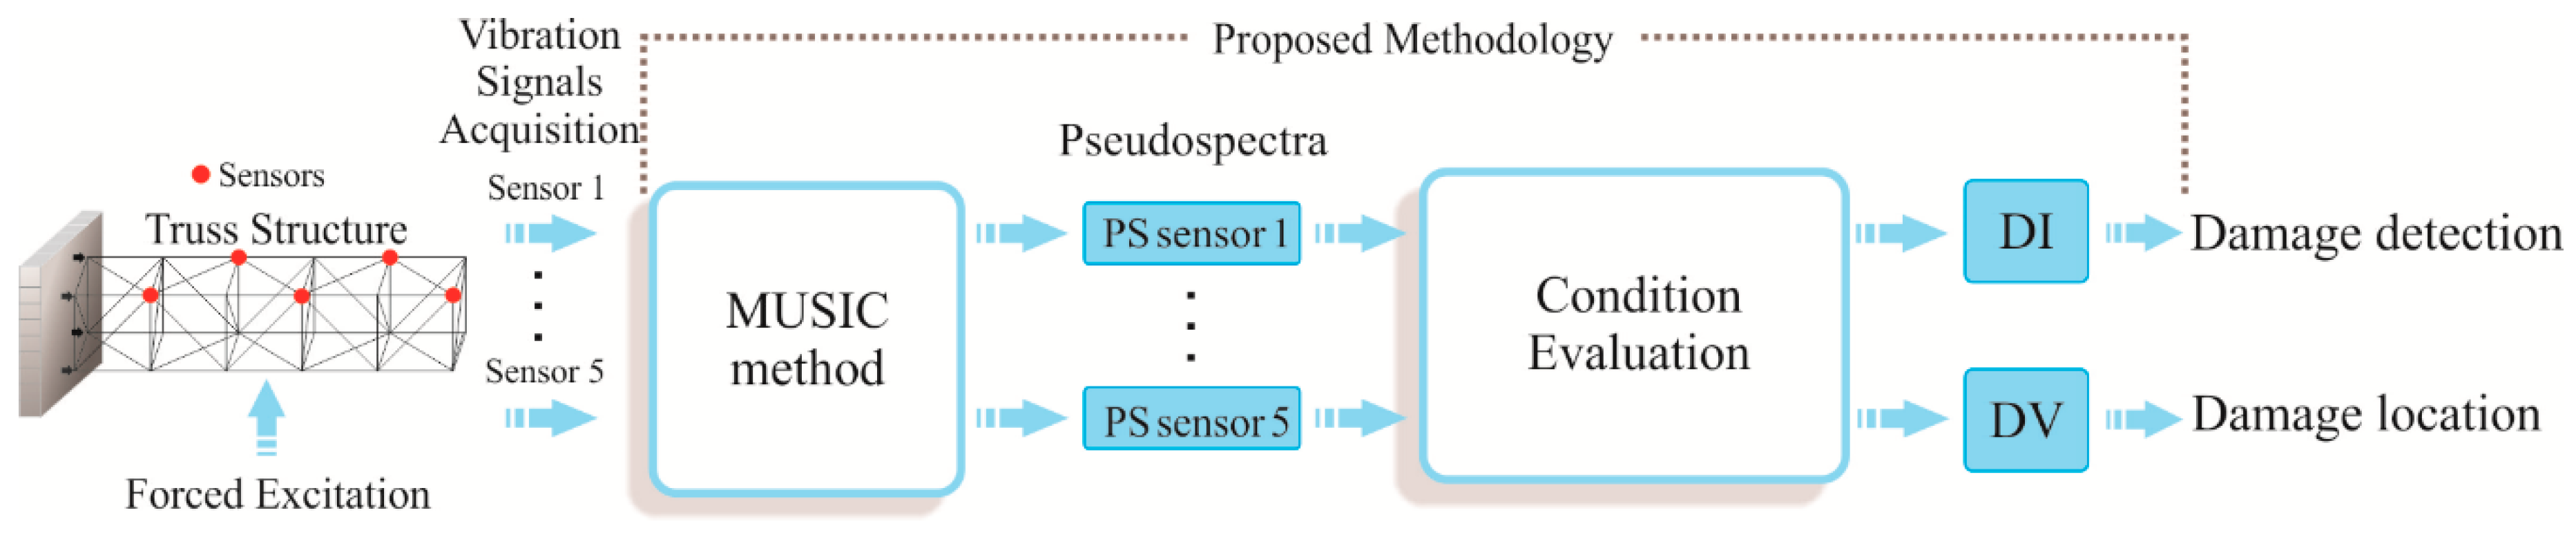
3. Proposed Methodology
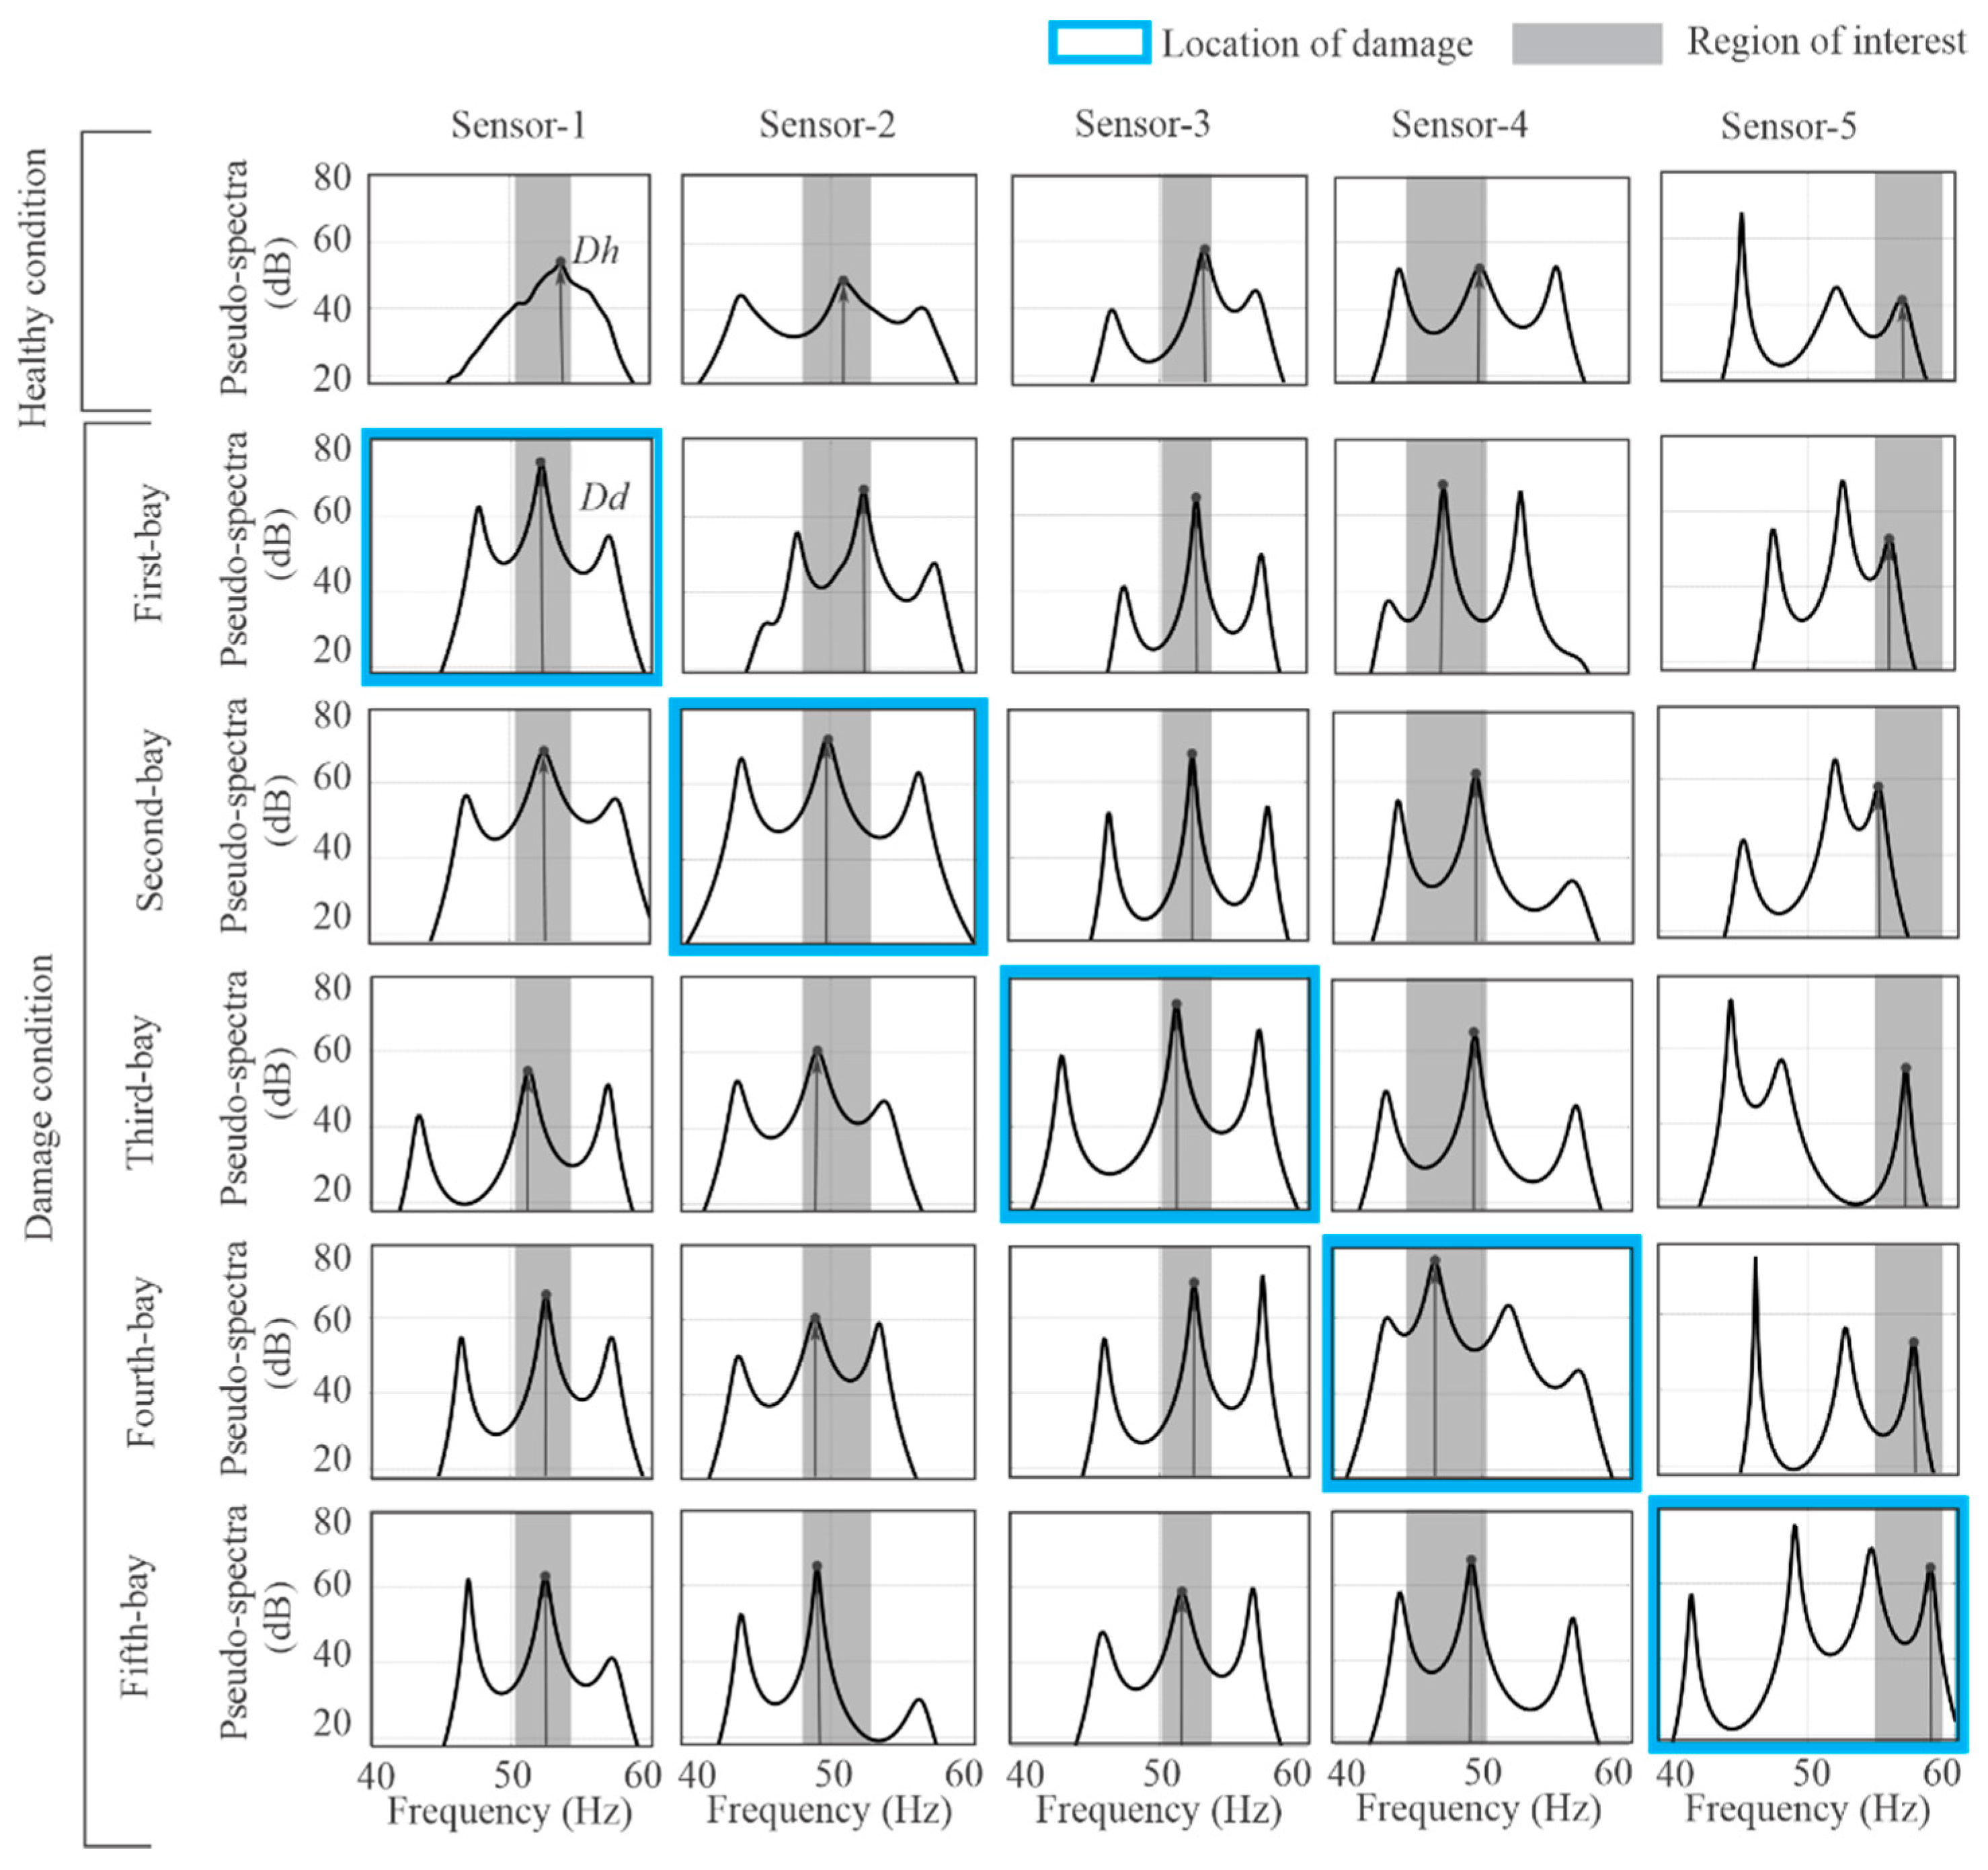
- Vibration signal acquisition: firstly, the vibrational responses of the truss-type structure for each condition, healthy and damaged (JF, EC, and IC), are measured through five sensors located in each bay of the structure. It is important to mention that each damage type was introduced to the structure in an independent manner (one by one). In addition, when damage is introduced in the first bay, the others are healthy, and vice versa;
- MUSIC method: then, the measured vibrational signatures for each condition and bay of the truss structure are analyzed by means of the MUSIC method in order to estimate their pseudo-spectra (PS), which will be associated with the structure condition and taken as references;
- Condition evaluation: finally, the obtained pseudo-spectra are used for (1) determining the structure condition through a damage index (DI) and (2) locating the damaged zone according to a detectability value (DV), which will be explained in the following sub-sections.
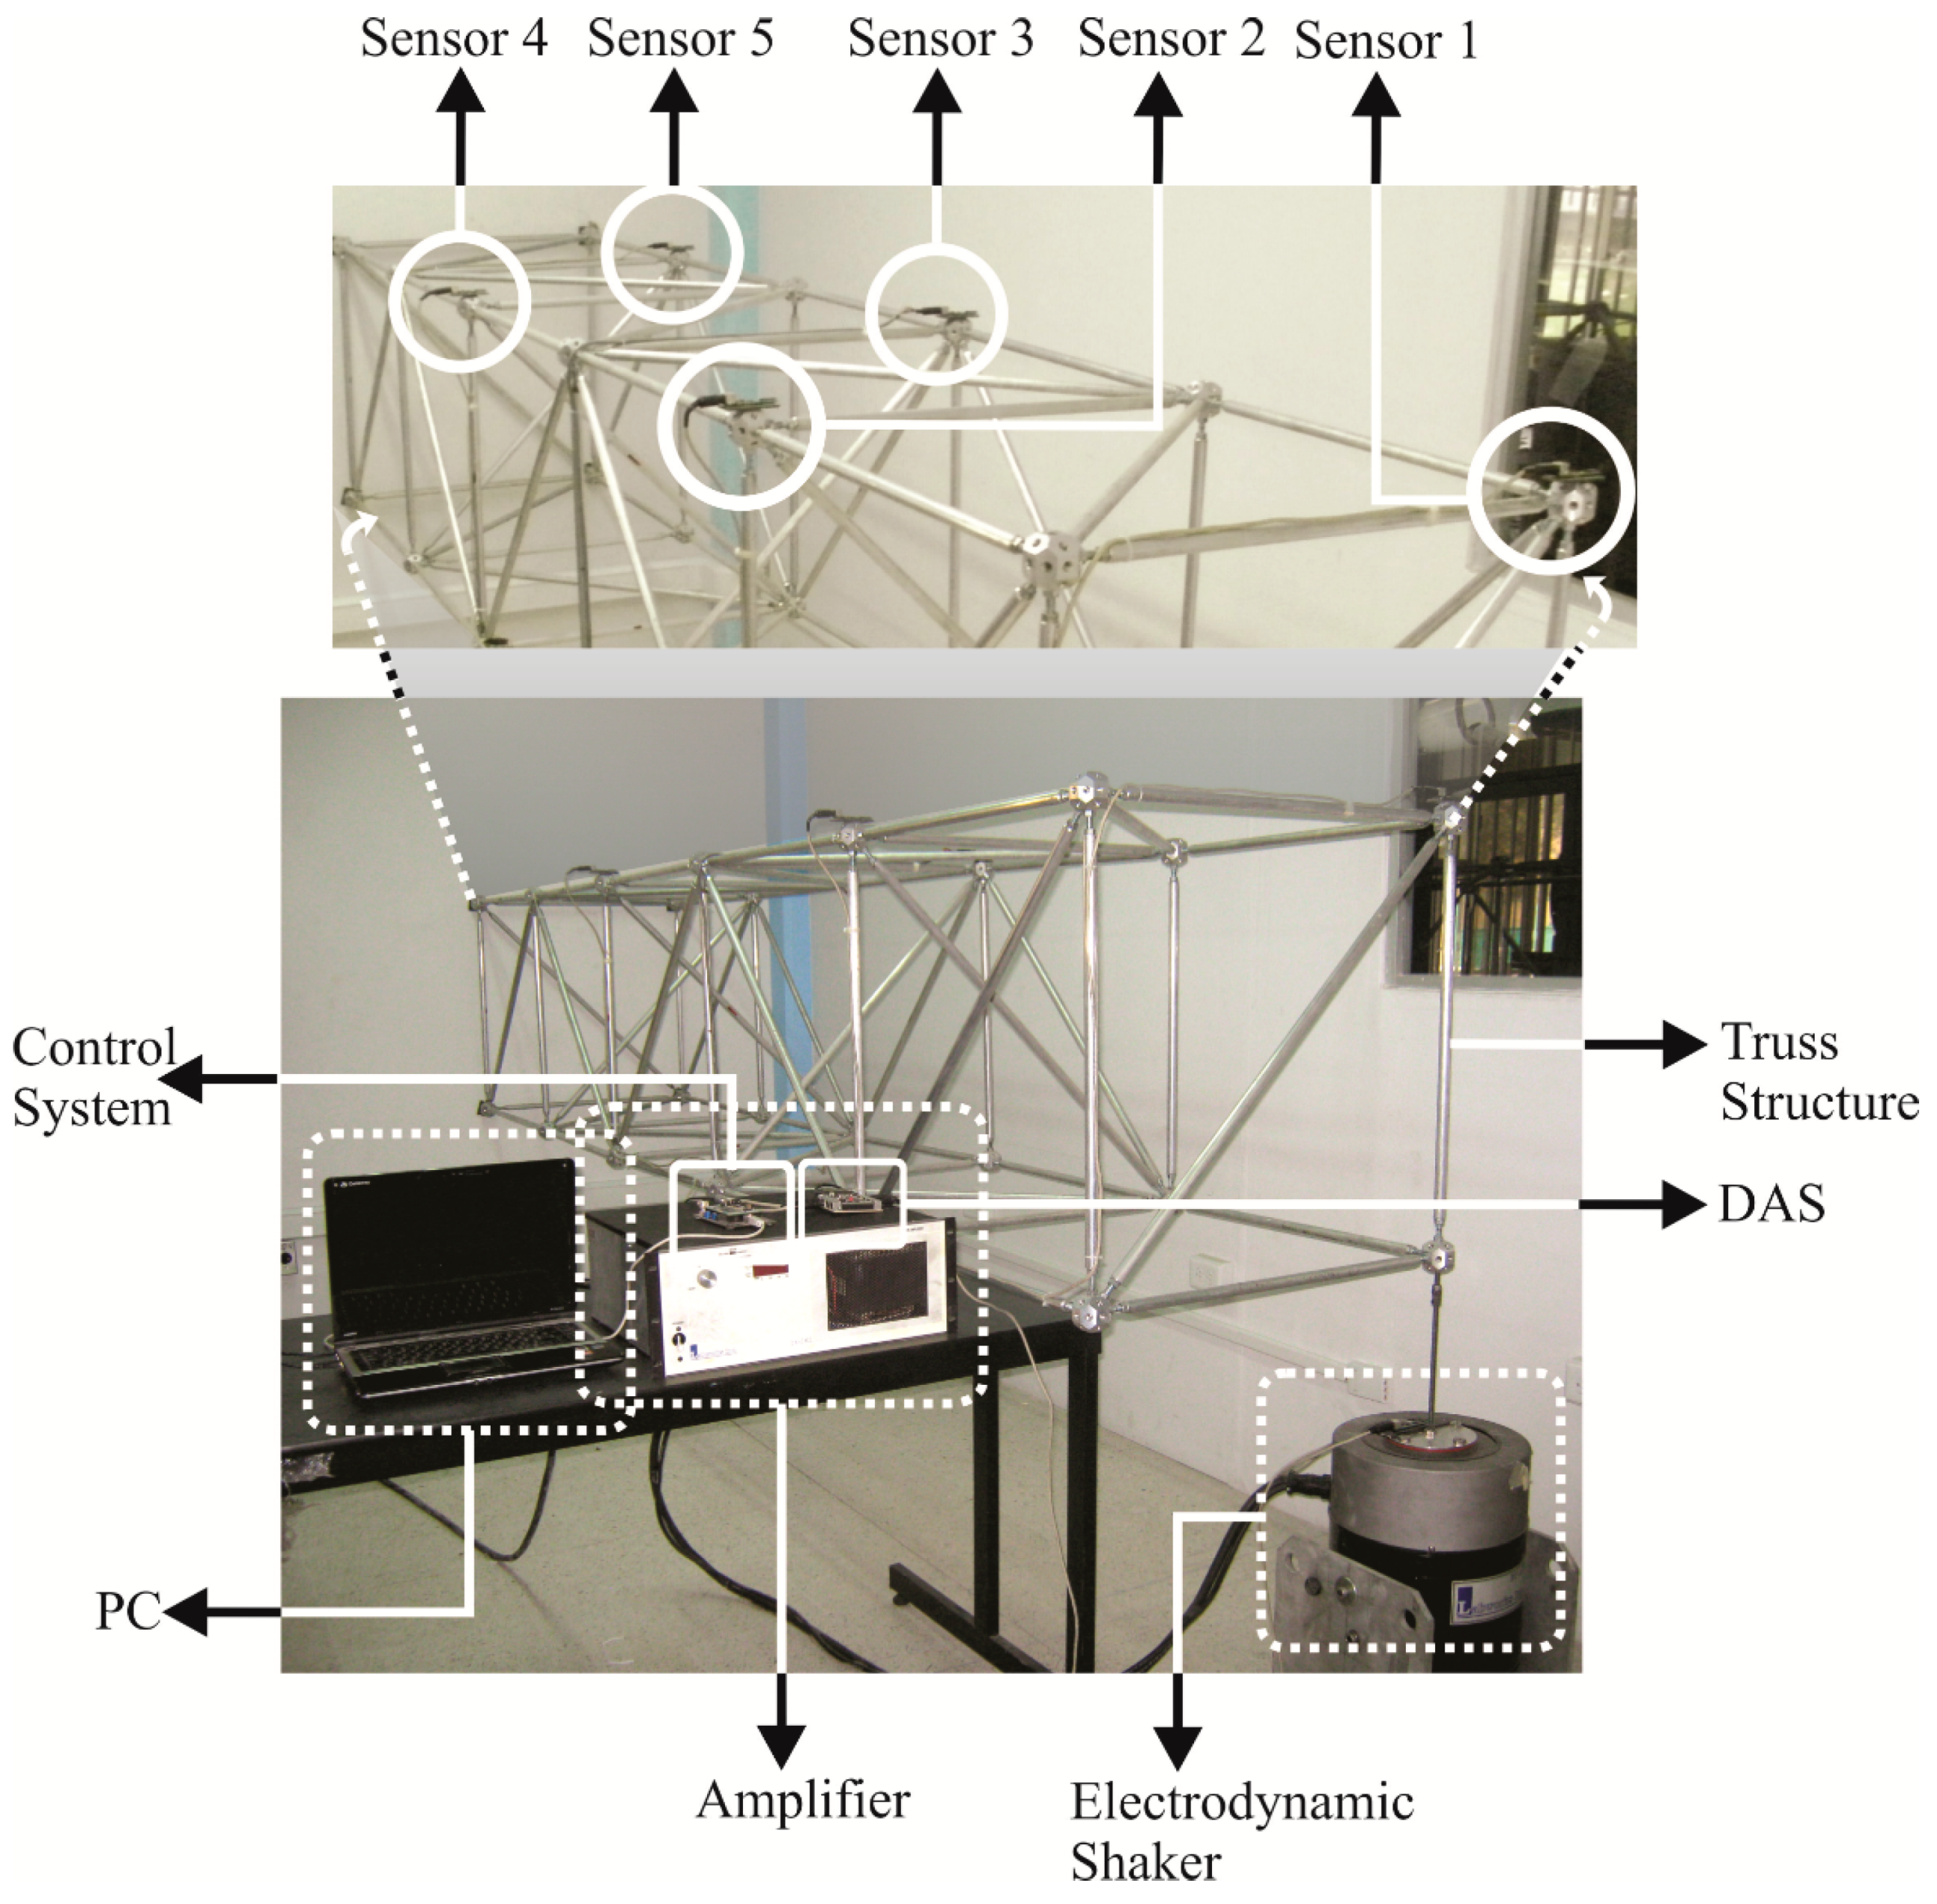
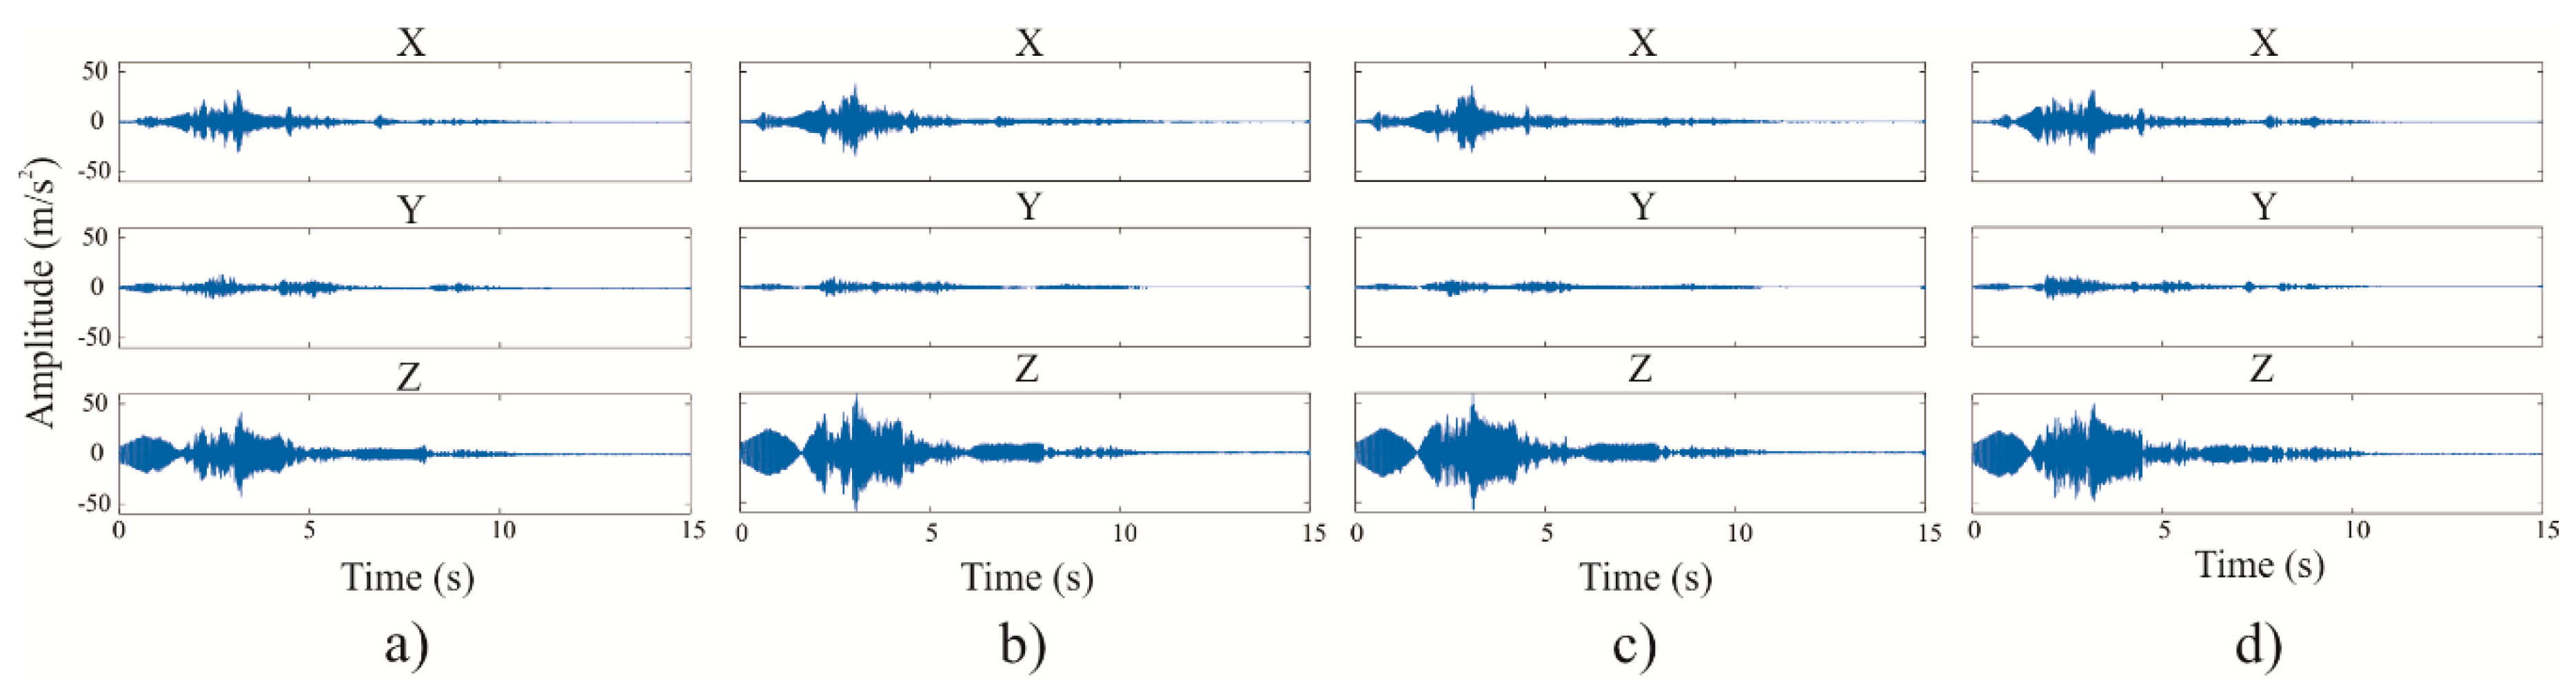
3.1. Experimental Setup
3.2. Vibration Signature Analysis
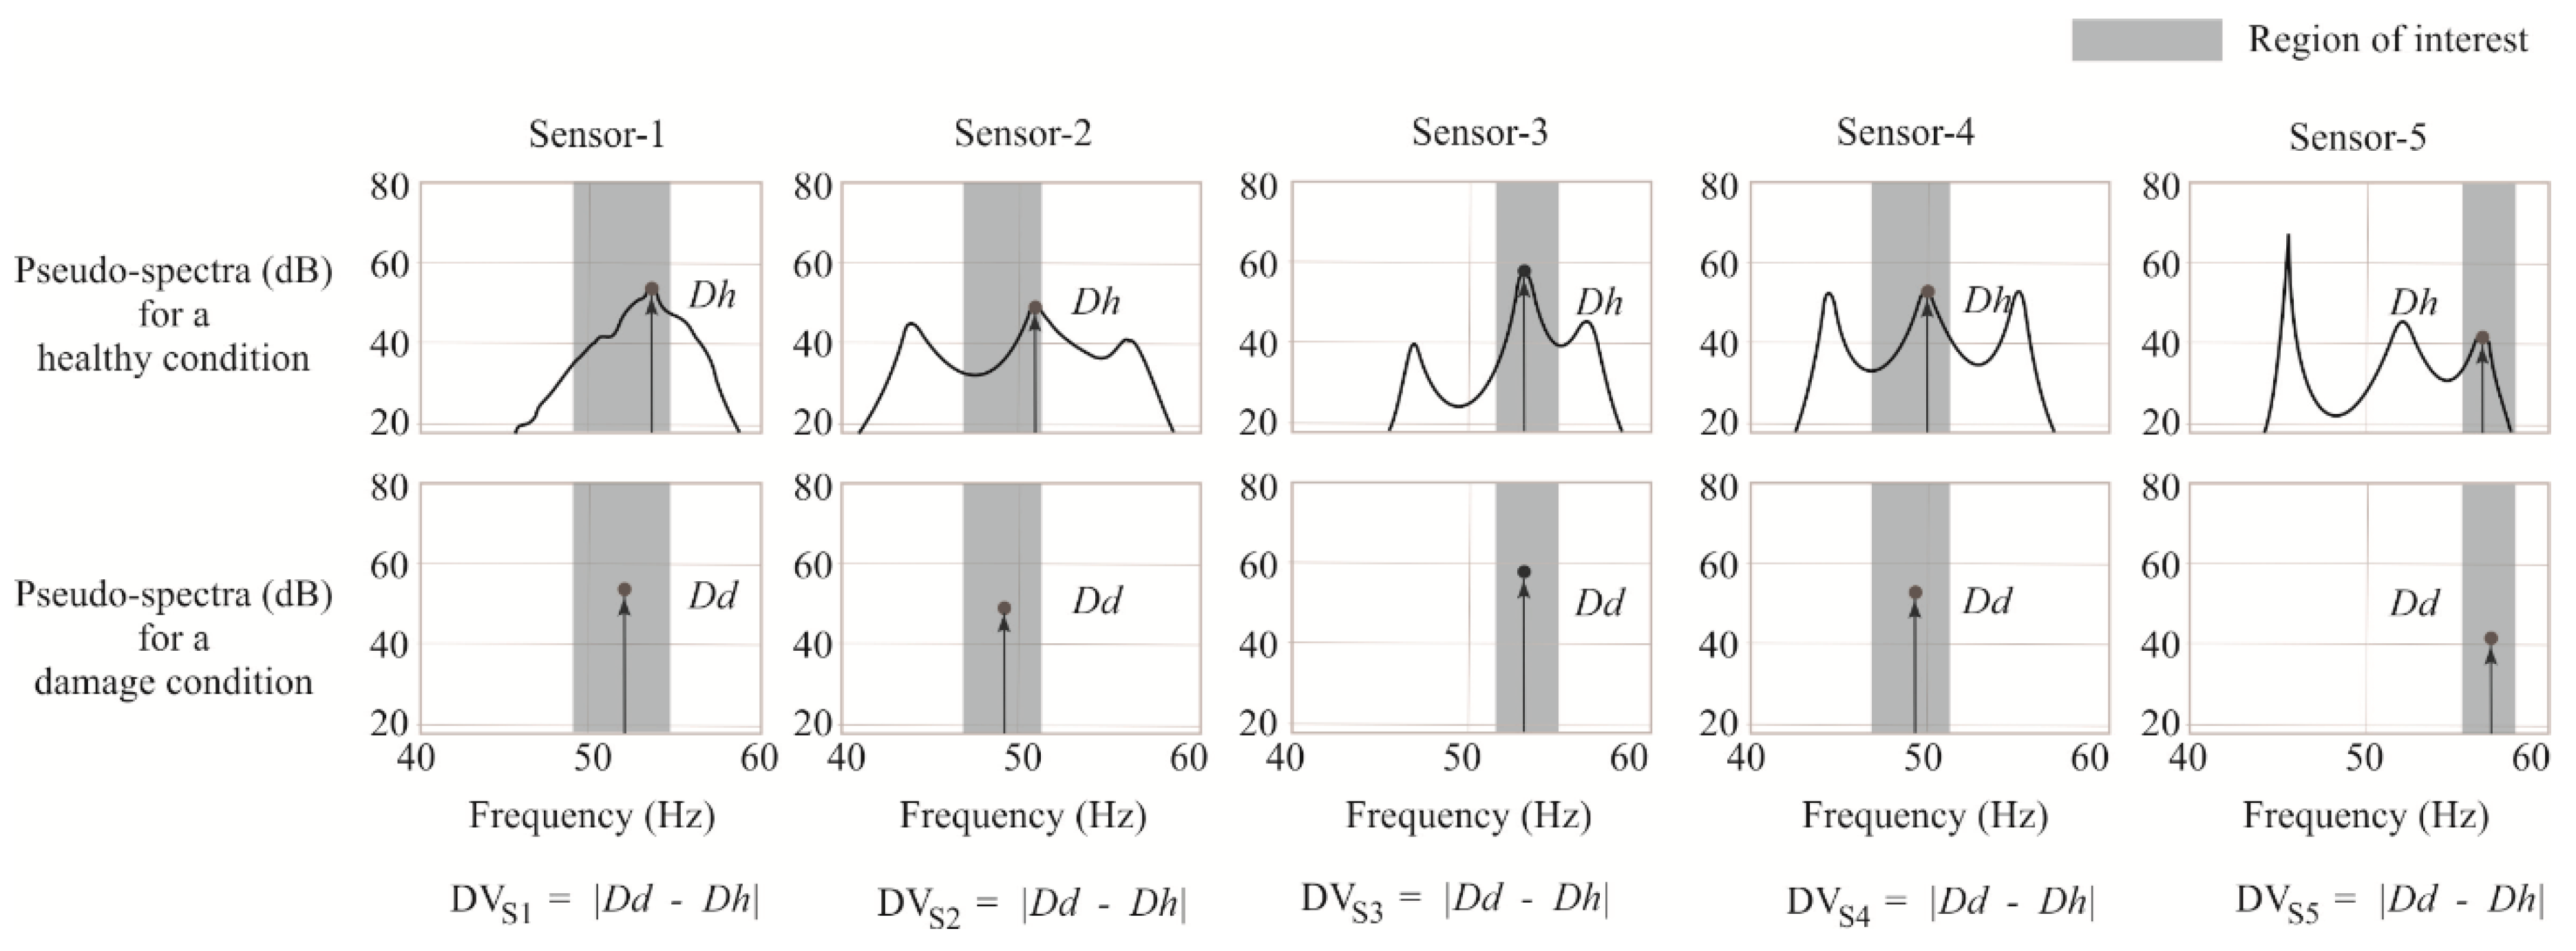
3.3. Damage Detection
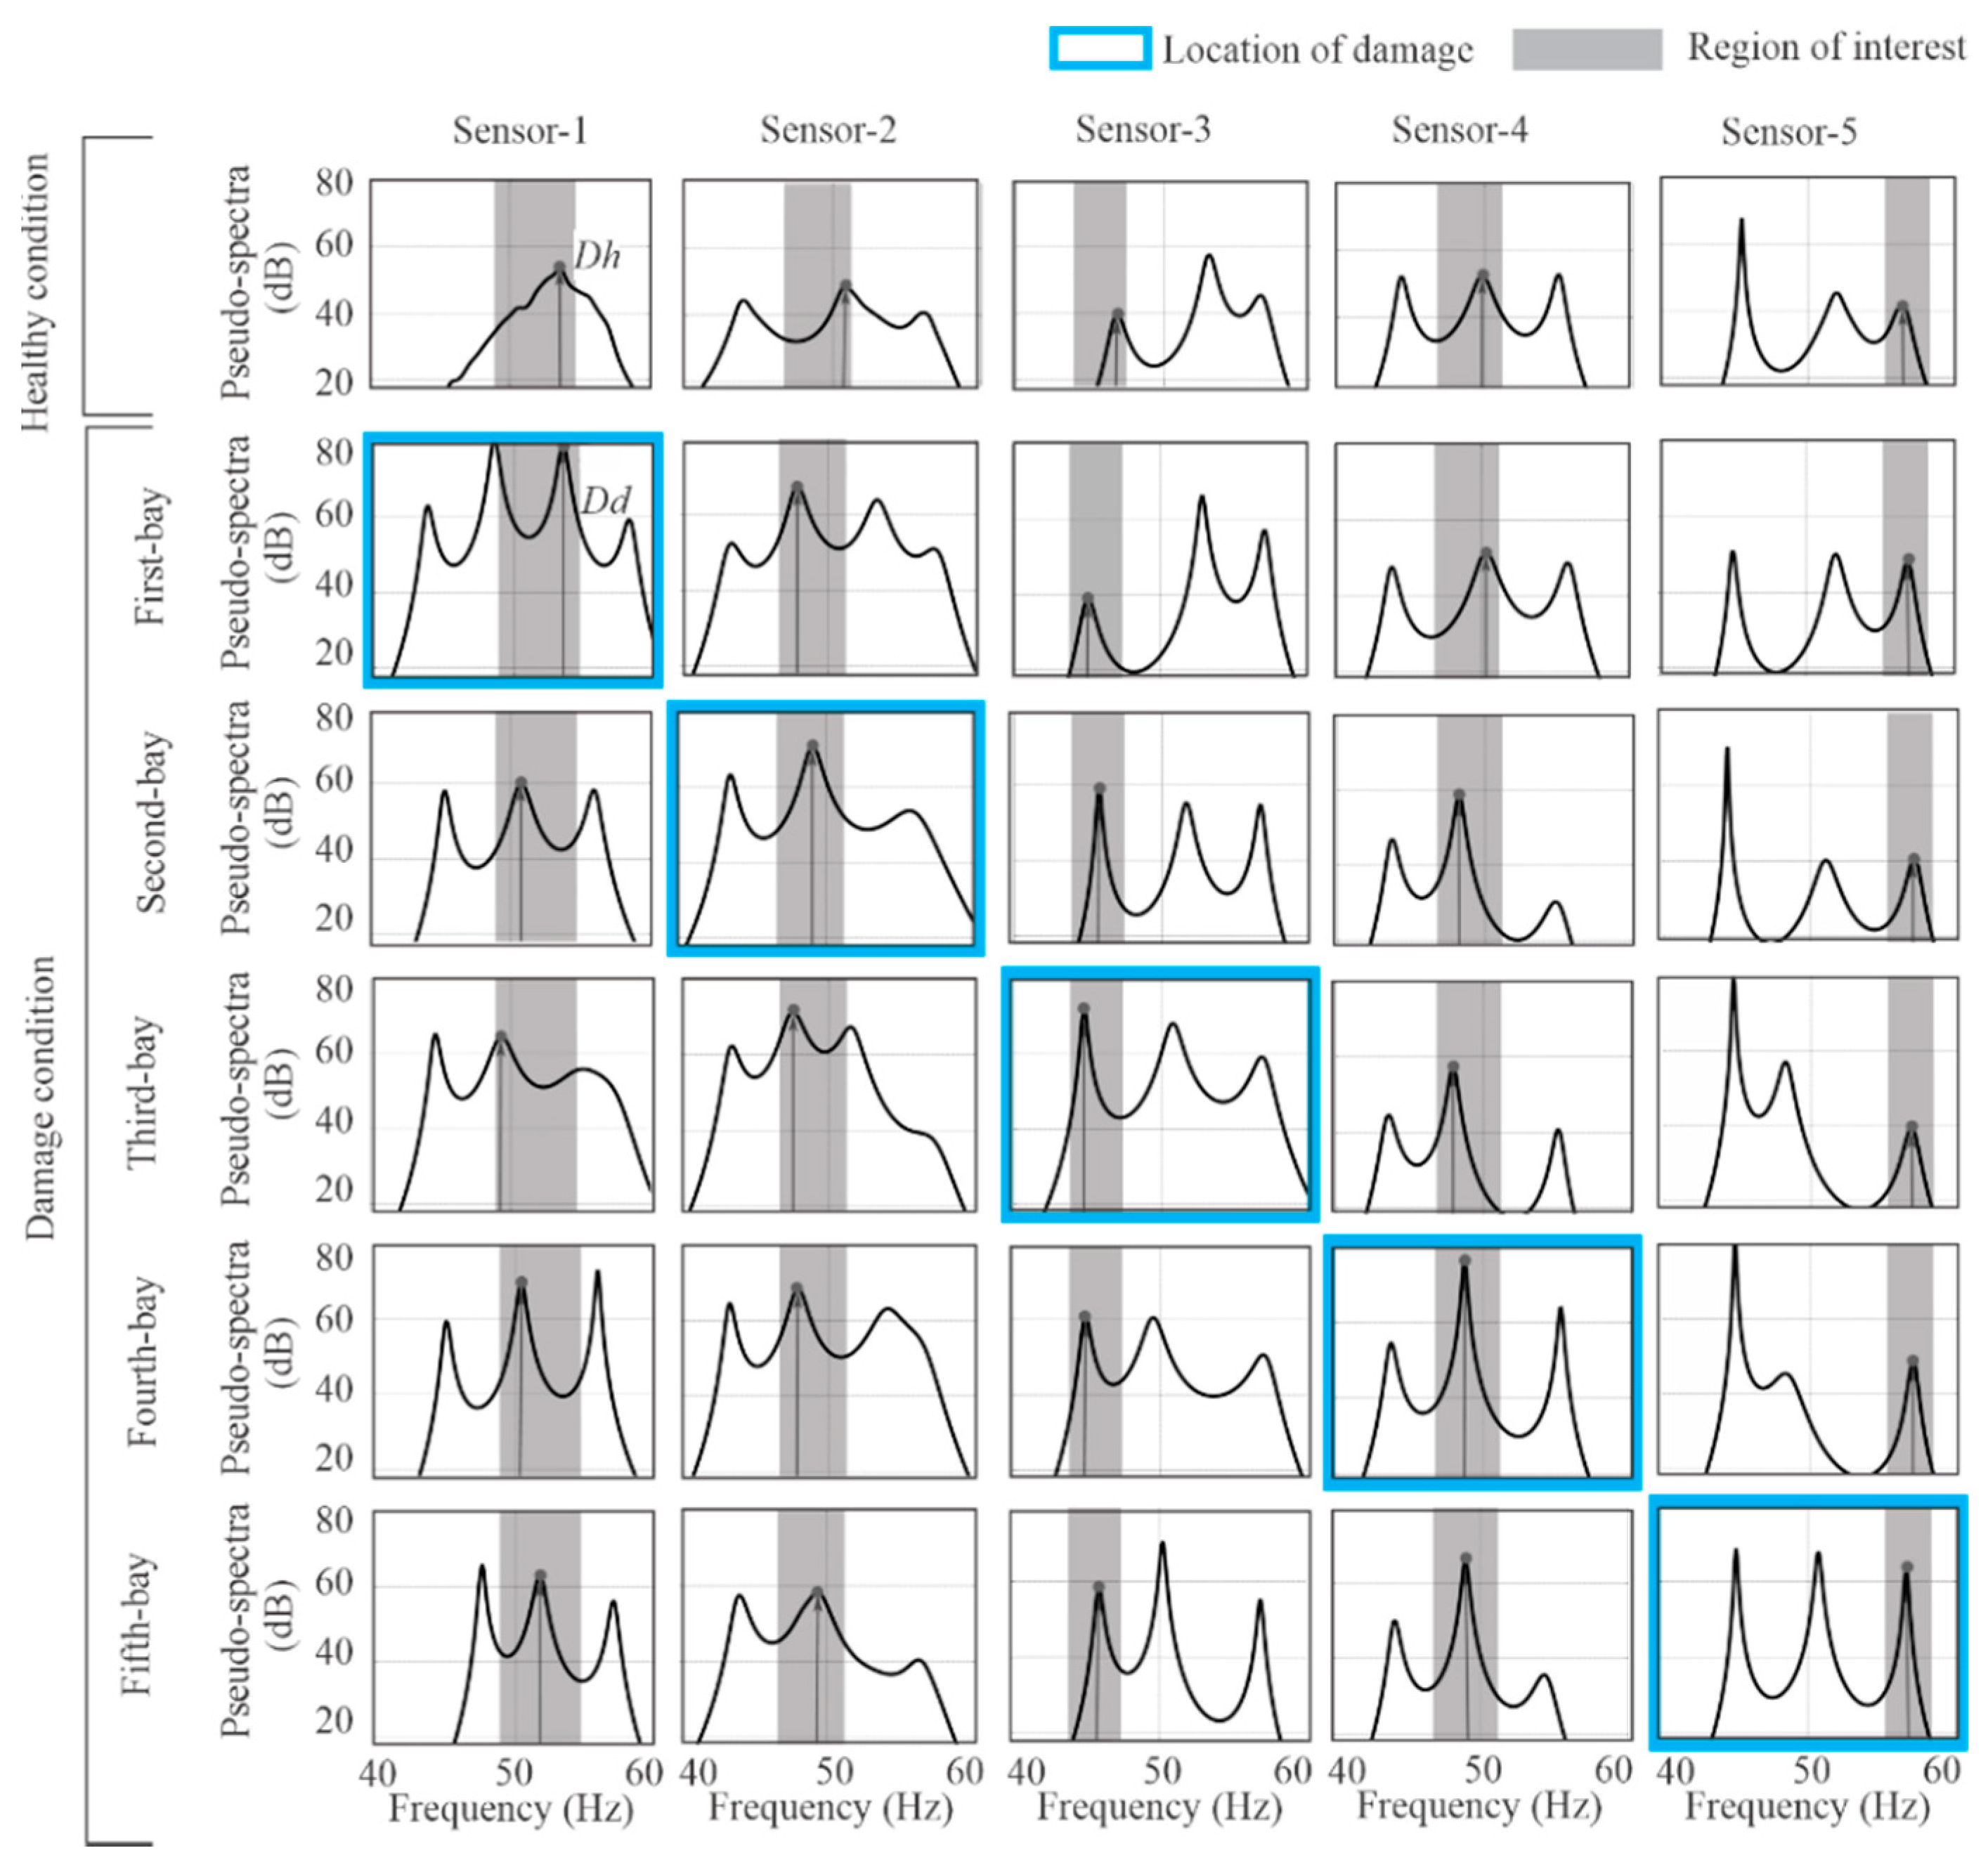
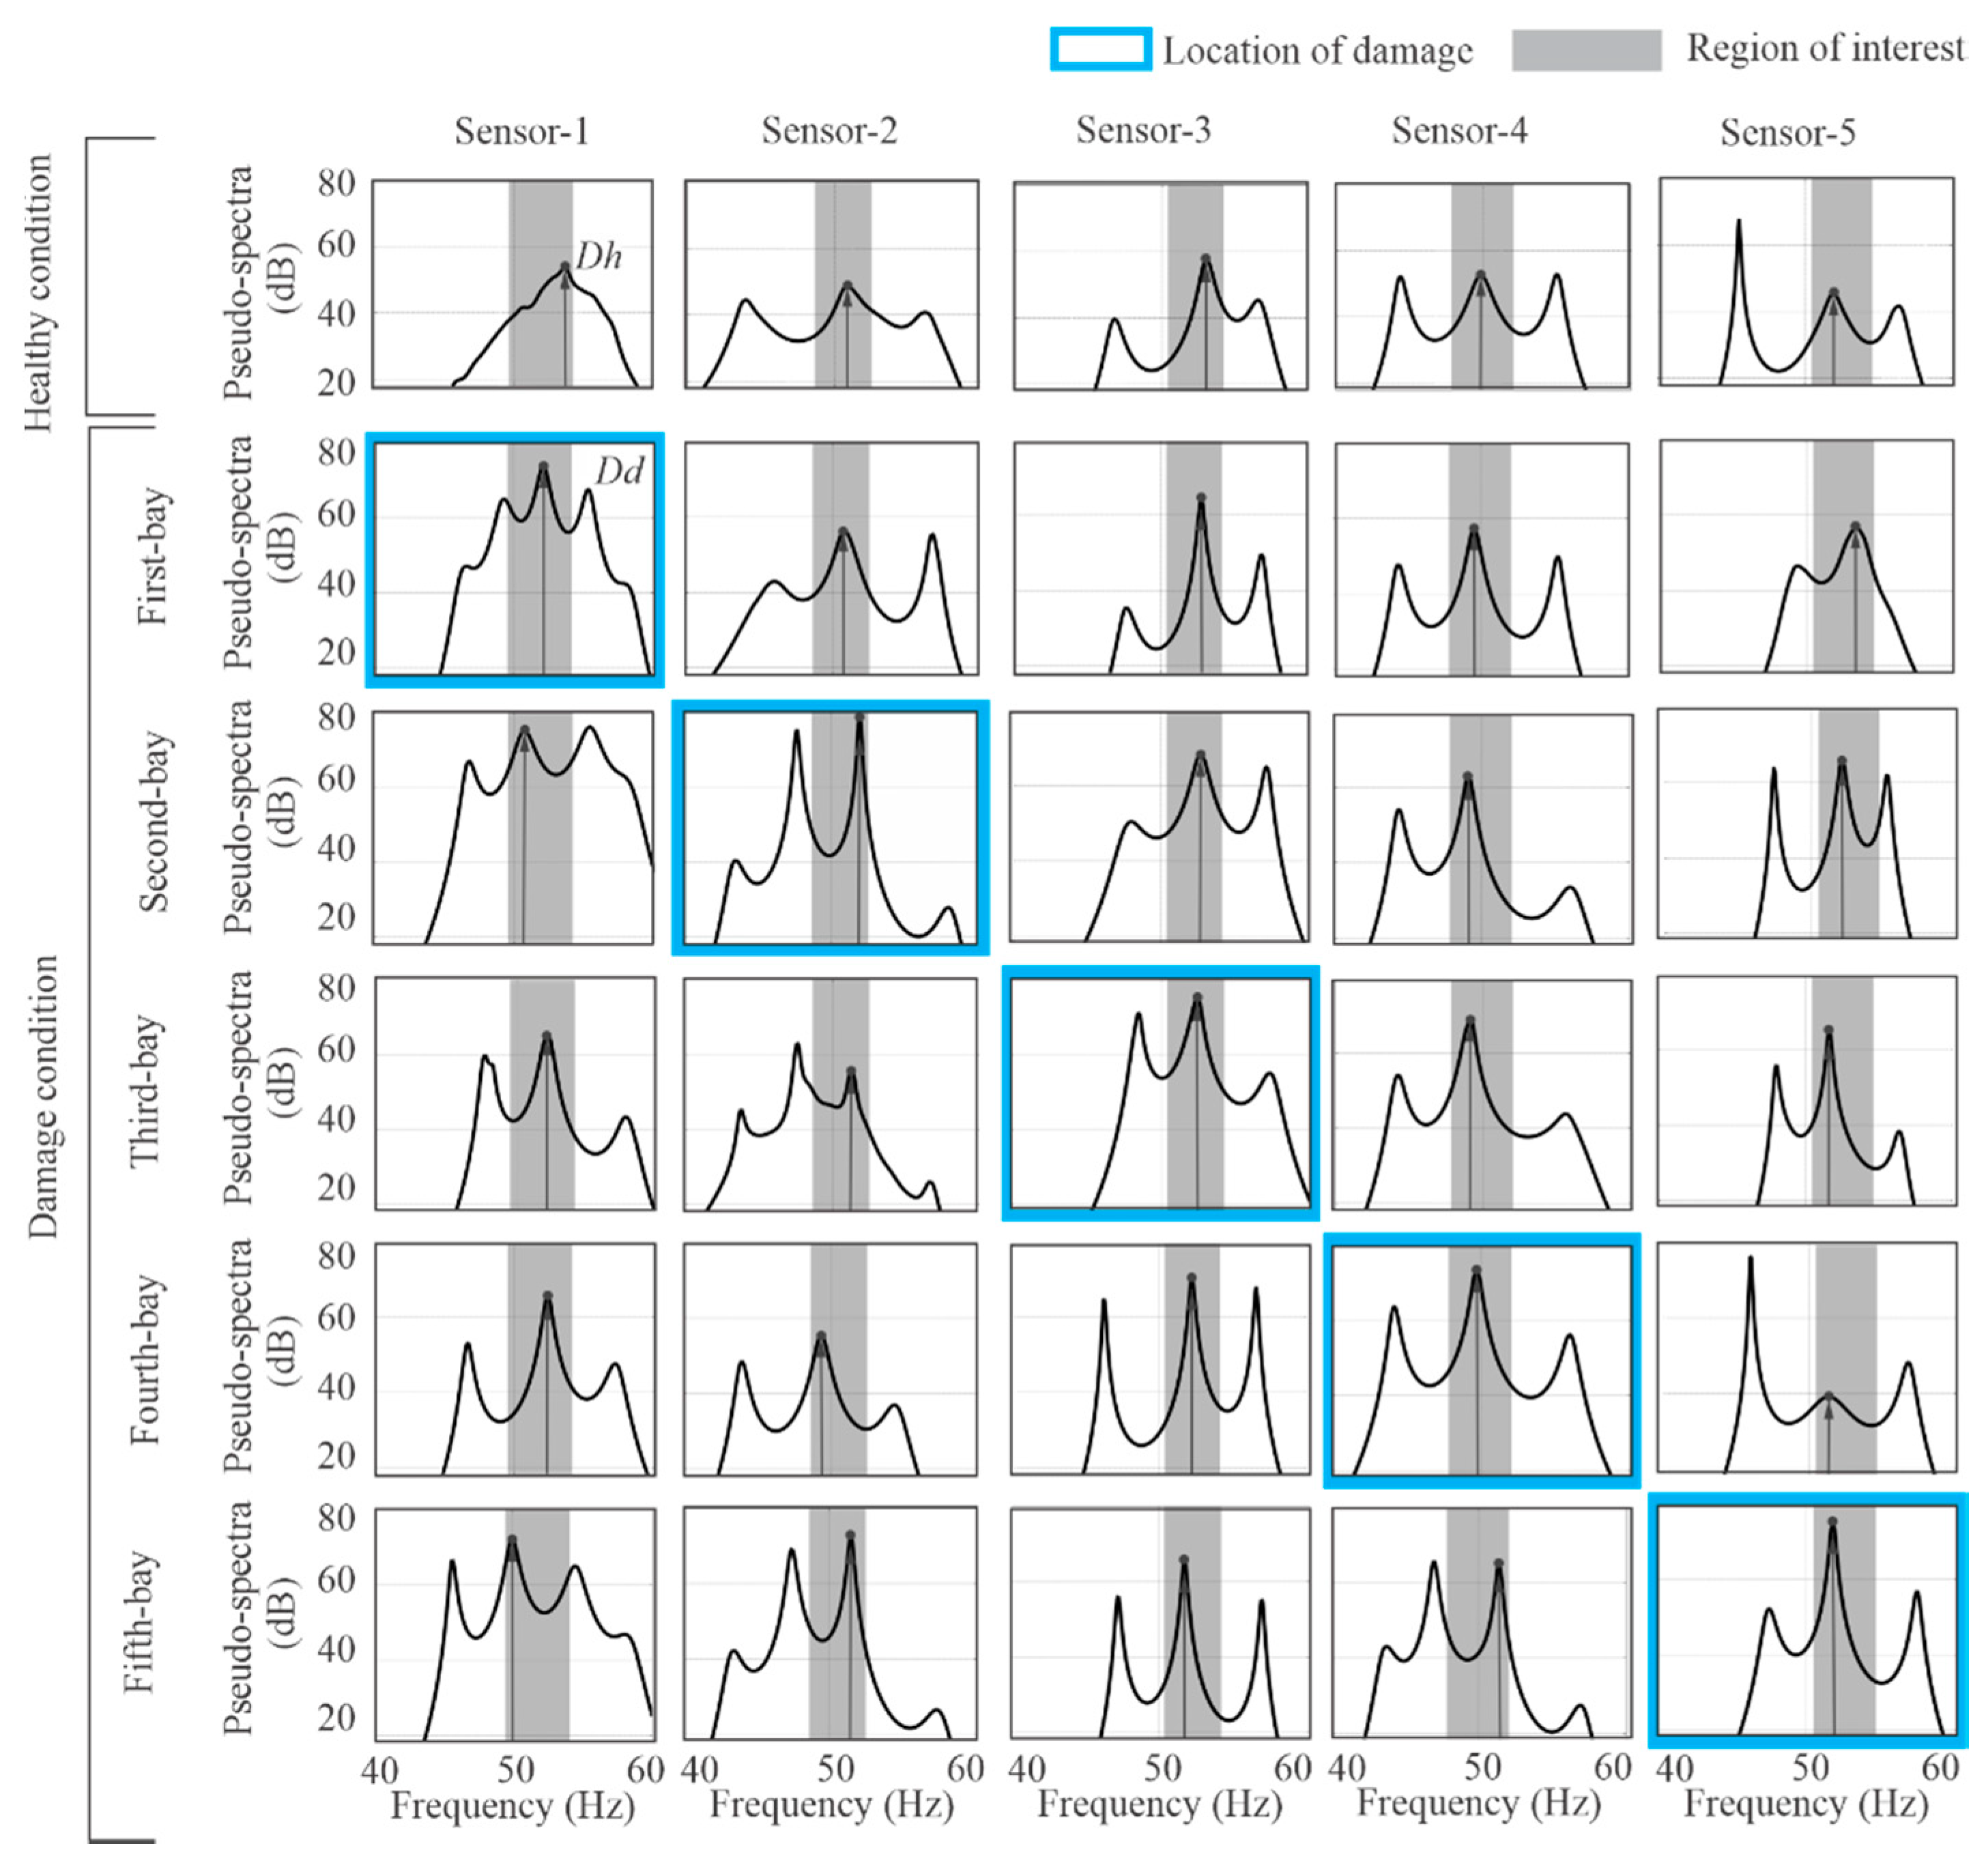
3.4. Damage Location
4. Obtained Results
5. Conclusions
Author Contributions
Funding
Conflicts of Interest
References
- Park, H.S.; Lee, H.M.; Adeli, H.; Li, I. A new approach for health monitoring of structures: Terrestrial laser scanning. Compt. Aided Civ. Infras. Eng. 2007, 22, 19–30. [Google Scholar] [CrossRef]
- Kralovec, C.; Schagerl, M. Review of Structural Health Monitoring Methods Regarding a Multi-Sensor Approach for Damage Assessment of Metal and Composite Structures. Sensors 2020, 20, 826. [Google Scholar] [CrossRef] [PubMed] [Green Version]
- De, S.; Gupta, K.; Stanley, R.J.; Ghasr, M.T.; Zoughi, R.; Doering, K.; Van Aken, D.C.; Steffes, G.; O’Keefe, M.; Palmer, D.D. A comprehensive multi-modal data fusion approach for failure assessment in aircraft lap-joint mimics. IEEE Trans. Instrum. Meas. 2013, 62, 814–827. [Google Scholar] [CrossRef]
- Das, S.; Dutta, S.; Putcha, C.; Majumdar, S.; Adak, D. A Data-Driven Physics-Informed Method for Prognosis of Infrastructure Systems: Theory and Application to Crack Prediction. ASCE-ASME J. Risk Uncer. Eng. Sys. 2020, 6, 04020013. [Google Scholar] [CrossRef]
- Poulsen, P.N.; Olesen, J.F.; Baandrup, M. Truss optimization applying finite element limit analysis including global and local stability. Struct. Multidiscip. Opt. 2020. [Google Scholar] [CrossRef]
- Jiang, S.; Zhu, S.; Guo, X.; Li, Z. Full-scale fire tests on steel roof truss structures. J. Construct. Steel Res. 2020, 169, 106025. [Google Scholar] [CrossRef]
- Sousa, H.; Rozsas, A.; Slobbe, A.; Courage, W. A novel pro-active approach towards SHM-based bridge management supported by FE analysis and Bayesian methods. Struct. Infras. Eng. 2020, 16, 233–246. [Google Scholar] [CrossRef]
- Sony, S.; Laventure, S.; Sadhu, A. A literature review of next-generation smart sensing technology in structural health monitoring. Struct. Control Health Mon. 2019, 26, e2321. [Google Scholar] [CrossRef]
- Mishra, M.; Barman, S.K.; Maity, D.; Maiti, D.K. Performance Studies of 10 Metaheuristic Techniques in Determination of Damages for Large-Scale Spatial Trusses from Changes in Vibration Responses. J. Compt. Civ. Eng. 2020, 34, 04019052. [Google Scholar] [CrossRef]
- Riasat Azim, M.; Gül, M. Damage Detection of Steel-Truss Railway Bridges Using Operational Vibration Data. J. Struct. Eng. 2020, 146, 04020008. [Google Scholar] [CrossRef]
- Mousavi, A.A.; Zhang, C.; Masri, S.F.; Gholipour, G. Structural Damage Localization and Quantification Based on a CEEMDAN Hilbert Transform Neural Network Approach: A Model Steel Truss Bridge Case Study. Sensors 2020, 20, 1271. [Google Scholar] [CrossRef] [PubMed] [Green Version]
- Aloisio, A.; Di Battista, L.; Alaggio, R.; Fragiacomo, M. Sensitivity analysis of subspace-based damage indicators under changes in ambient excitation covariance, severity and location of damage. Eng. Struct. 2020, 208, 110235. [Google Scholar] [CrossRef]
- Shahsavari, V.; Mehrkash, M.; Santini-Bell, E. Damage Detection and Decreased Load-Carrying Capacity Assessment of a Vertical-Lift Steel Truss Bridge. J. Perform. Construct. Facil. 2020, 34, 04019123. [Google Scholar] [CrossRef]
- Han, Y.; Li, K.; Cai, C.S.; Wang, L.; Xu, G. Fatigue Reliability Assessment of Long-Span Steel-Truss Suspension Bridges under the Combined Action of Random Traffic and Wind Loads. J. Bridge Eng. 2020, 25, 04020003. [Google Scholar] [CrossRef]
- Long, L.; Döhler, M.; Thöns, S. Determination of structural and damage detection system influencing parameters on the value of information. Struct. Health Mon. 2020. [Google Scholar] [CrossRef] [Green Version]
- Fan, G.; Li, J.; Hao, H. Vibration Signal Denoising for Structural Health Monitoring by Residual Convolutional Neural Networks. Measurement 2020, 157, 107651. [Google Scholar] [CrossRef]
- Zonzini, F.; Malatesta, M.M.; Bogomolov, D.; Testoni, N. Vibration-based SHM with up-scalable and low-cost Sensor Networks. IEEE Trans. Instrum. Meas. 2020. [Google Scholar] [CrossRef]
- Agis, D.; Tibaduiza, D.A.; Pozo, F. Vibration-based detection and classification of structural changes using principal component analysis and -distributed stochastic neighbor embedding. Struct. Control Health Mon. 2020, 27, e2533. [Google Scholar] [CrossRef] [Green Version]
- Chang, M.; Yuan, S.; Guo, F. Corrosion Monitoring Using a New Compressed Sensing-based Tomographic Method. Ultrasonics 2019, 101, 105988. [Google Scholar] [CrossRef]
- Moosavi, R.; Grunwald, M.; Redmer, B. Crack detection in reinforced concrete. NDT E Int. 2020, 109, 102190. [Google Scholar] [CrossRef]
- Li, J.; Xie, B.; Zhao, X. A Method of Interstory Drift Monitoring Using a Smartphone and a Laser Device. Sensors 2020, 20, 1777. [Google Scholar] [CrossRef] [Green Version]
- Ma, G.; Du, Q. Structural health evaluation of the prestressed concrete using advanced acoustic emission (AE) parameters. Construct. Build. Mat. 2020, 250, 118860. [Google Scholar] [CrossRef]
- Yu, J.; Meng, X.; Yan, B.; Xu, B.; Fan, Q.; Xie, Y. Global Navigation Satellite System-based positioning technology for structural health monitoring: a review. Struct. Control Health Mon. 2020, 27, e2467. [Google Scholar] [CrossRef] [Green Version]
- Li, G.; Liu, Q.; Zhao, S.; Qiao, W.; Ren, X. Automatic crack recognition for concrete bridges by fully convolutional neural network and Naive Bayes data fusion based on visual detection system. Meas. Sci. Tech. 2020. [Google Scholar] [CrossRef]
- Amezquita-Sanchez, J.P.; Adeli, H. Signal Processing Techniques for Vibration-Based Health Monitoring of Smart Structures. Arch. Compt. Meth. Eng. 2016, 23, 1–15. [Google Scholar] [CrossRef]
- Huang, C.S.; Le, Q.T.; Su, W.C.; Chen, C.H. Wavelet-based approach of time series model for modal identification of a bridge with incomplete input. Compt. Aided Civil Infras. Eng. 2020. [Google Scholar] [CrossRef]
- Azimi, M.; Pekcan, G. Structural health monitoring using extremely compressed data through deep learning. Compt. Aided Civ. Infras. Eng. 2019. [Google Scholar] [CrossRef]
- Bao, Y.; Guo, Y.; Li, H. A machine learning–based approach for adaptive sparse time–frequency analysis used in structural health monitoring. Struct. Health Mon. 2020. [Google Scholar] [CrossRef]
- Park, H.S.; Oh, B.K. Damage detection of building structures under ambient excitation through the analysis of the relationship between the modal participation ratio and story stiffness. J. Sound Vib. 2018, 418, 122–143. [Google Scholar] [CrossRef]
- Sivori, D.; Lepidi, M.; Cattari, S. Ambient vibration tools to validate the rigid diaphragm assumption in the seismic assessment of buildings. Earthq. Eng. Struct. Dyn. 2020, 49, 194–211. [Google Scholar] [CrossRef]
- Huynh, T.-C.; Park, J.-H.; Kim, J.-T. Structural identification of cable-stayed bridge under back-to-back typhoons by wireless vibration monitoring. Measurement 2016, 88, 385–401. [Google Scholar] [CrossRef]
- Wickramasinghe, W.R.; Thambiratnam, D.P.; Chan, T.H.T. Damage Detection in a Suspension Bridge Using Modal Flexibility Method. Eng. Fail. Anal. 2020, 107, 104194. [Google Scholar] [CrossRef]
- Zhang, C.; Gao, Y.-W.; Huang, J.-P.; Huang, J.-Z.; Song, G.-Q. Damage identification in bridge structures subject to moving vehicle based on extended Kalman filter with l1-norm regularization. Inv. Probl. Sci. Eng. 2020, 28, 144–174. [Google Scholar] [CrossRef]
- Delgadillo, R.M.; Casas, J.R. Non-modal vibration-based methods for bridge damage identification. Struct. Infras. Eng. 2020, 16, 676–697. [Google Scholar] [CrossRef]
- Celik, O.; Dong, C.-Z.; Catbas, F.N. Investigation of Structural Response under Human-Induced Excitations Using Noise-Assisted and Adaptively Transformed Multivariate Empirical Mode Decomposition. J. Struct. Eng. 2020, 146, 04020019. [Google Scholar] [CrossRef]
- Moreno-Gomez, A.; Amezquita-Sanchez, J.P.; Valtierra-Rodriguez, M.; Perez-Ramirez, C.A.; Dominguez-Gonzalez, A.; Chavez-Alegria, O. EMD-Shannon Entropy-Based Methodology to Detect Incipient Damages in a Truss Structure. Appl. Sci. 2018, 8, 2068. [Google Scholar] [CrossRef] [Green Version]
- Gharehbaghi, V.R.; Nguyen, A.; Noroozinejad Farsangi, E.; Yang, T.Y. Supervised damage and deterioration detection in building structures using an enhanced autoregressive time-series approach. J. Build. Eng. 2020, 30, 101292. [Google Scholar] [CrossRef]
- Zhu, H.; Yu, H.; Gao, F.; Weng, S.; Sun, Y.; Hu, Q. Damage identification using time series analysis and sparse regularization. Struct. Health Mon. 2020. [Google Scholar] [CrossRef]
- García-Macías, E.; Ubertini, F. MOVA/MOSS: Two integrated software solutions for comprehensive Structural Health Monitoring of structures. Mech. Sys. Signal Proc. 2020, 143, 106830. [Google Scholar] [CrossRef]
- Yazdanpanah, O.; Mohebi, B.; Yakhchalian, M. Seismic damage assessment using improved wavelet-based damage-sensitive features. J. Build. Eng. 2020. [Google Scholar] [CrossRef]
- Yazdanpanah, O.; Mohebi, B.; Yakhchalian, M. Selection of optimal wavelet-based damage-sensitive feature for seismic damage diagnosis. Measurement 2020, 154, 107447. [Google Scholar] [CrossRef]
- Gordan, M.; Ismail, Z.; Abdul Razak, H.; Ghaedi, K.; Zhi, Z.; Haider, X.; Ghayeb, H. Data mining-based damage identification of a slab-on-girder bridge using inverse analysis. Measurement 2020, 151, 107175. [Google Scholar] [CrossRef]
- Tan, Z.; Thambiratnam, D.; Chan, T.; Gordan, M.; Abdul Razak, H. Damage detection in steel-concrete composite bridge using vibration characteristics and artificial neural network. Struct. Infrastruct. Eng. 2019. In Press. [Google Scholar] [CrossRef]
- Gordan, M.; Abdul Razak, H.; Ismail, Z.; Ghaedi, K. A hybrid ANN-based imperial competitive algorithm methodology for structural damage identification of slab-on-girder bridge using data mining. Appl. Soft Compt. 2020, 88, 106013. [Google Scholar] [CrossRef]
- Murali Krishna, B.; Guru Prathap Reddy, V.; Shafee, M.; Tadepalli, T. Condition assessment of RC beams using artificial neural networks. Structures 2020, 23, 1–12. [Google Scholar] [CrossRef]
- Kullaa, J. Robust damage detection in the time domain using Bayesian virtual sensing with noise reduction and environmental effect elimination capabilities. J. Sound Vib. 2020, 473, 115232. [Google Scholar] [CrossRef]
- Chen, Z.; Zhang, R.; Zheng, J.; Sun, H. Sparse Bayesian learning for structural damage identification. Mech. Syst. Sig. Proc. 2020, 140, 106689. [Google Scholar] [CrossRef]
- Bhowmik, B.; Tripura, T.; Hazra, B.; Pakrashi, V. Real time structural modal identification using recursive canonical correlation analysis and application towards online structural damage detection. J. Sound Vib. 2020, 468, 115101. [Google Scholar] [CrossRef]
- Cancelli, A.; Laflamme, S.; Alipour, A.; Sritharan, S.; Ubertini, F. Vibration-based damage localization and quantification in a pretensioned concrete girder using stochastic subspace identification and particle swarm model updating. Struct. Health Mon. 2020, 19, 587–605. [Google Scholar] [CrossRef]
- Yapar, O.; Basu, P.K.; Volgyesi, P.; Ledeczi, A. Structural health monitoring of bridges with piezoelectric AE sensors. Eng. Failure Anal. 2015, 56, 150–169. [Google Scholar] [CrossRef] [Green Version]
- Dai, H.; Zhang, H.; Wang, W. A Multiwavelet Neural Network-Based Response Surface Method for Structural Reliability Analysis. Compt. Aided Civ. Infras. Eng. 2015, 30, 151–162. [Google Scholar] [CrossRef]
- Jiang, X.; Mahadevan, S. Bayesian wavelet methodology for structural damage detection. Struct. Control Health Mon. 2008, 15, 974–991. [Google Scholar] [CrossRef]
- Turkan, Y.; Hong, J.; Laflamme, S.; Puri, N. Adaptive wavelet neural network for terrestrial laser scanner-based crack detection. Auto. Construct. 2018, 94, 191–202. [Google Scholar] [CrossRef] [Green Version]
- Lee, K.; Byun, N.; Shin, D.H. A Damage Localization Approach for Rahmen Bridge Based on Convolutional Neural Network. KSCE J. Civ. Eng. 2020, 24, 1–9. [Google Scholar] [CrossRef]
- Li, S.; Sun, L. Detectability of Bridge-Structural Damage Based on Fiber-Optic Sensing through Deep-Convolutional Neural Networks. J. Bridge Eng. 2020, 25, 04020012. [Google Scholar] [CrossRef]
- Truong, T.T.; Dinh-Cong, D.; Lee, J.; Nguyen-Thoi, T. An effective deep feedforward neural networks (DFNN) method for damage identification of truss structures using noisy incomplete model data. J. Build. Eng. 2020, 30, 101244. [Google Scholar] [CrossRef]
- Ma, X.; Lin, Y.; Nie, Z.; Ma, H. Structural damage identification based on unsupervised feature-extraction via Variational Auto-encoder. Measurement 2020, 160, 107811. [Google Scholar] [CrossRef]
- Amezquita-Sanchez, J.P.; Adeli, H. A new music-empirical wavelet transform methodology for time–frequency analysis of noisy nonlinear and non-stationary signals. Digit. Signal Proc. 2015, 45, 55–68. [Google Scholar] [CrossRef]
- Gkoktsi, K.; Giaralis, A. A compressive MUSIC spectral approach for identification of closely-spaced structural natural frequencies and post-earthquake damage detection. Prob. Eng. Mech. 2020, 60, 103030. [Google Scholar] [CrossRef]
- Jiang, X.; Adeli, H. Pseudospectra, MUSIC, and dynamic wavelet neural network for damage detection of highrise buildings. Int. J. Numer. Meth. Eng. 2007, 71, 606–629. [Google Scholar] [CrossRef]
- Vaez, S.R.H.; Mehanpur, H.; Fathali, M.A. Reliability assessment of truss structures with natural frequency constraints using metaheuristic algorithms. J. Build. Eng. 2020, 28, 101065. [Google Scholar] [CrossRef]
- Schumacher, A.; Nussbaumer, A. Experimental study on the fatigue behaviour of welded tubular K-joints for bridges. Eng. Struct. 2006, 28, 745–755. [Google Scholar] [CrossRef] [Green Version]
- An, Y.; Li, B.; Ou, J. An algorithm for damage localization in steel truss structures: Numerical simulation and experimental validation. J. Int. Mat. Sys. Struct. 2013, 24, 1683–1698. [Google Scholar] [CrossRef]
- Fisher, J.W.; Yen, B.T.; Wang, D. Corrosion and its influence on strength of steel bridge members. Transportation Research Record (No. 1290, p. 1). In Proceedings of the 3rd Bridge Engineering Conference, Denver, CO, USA, 10–13 March 1991. [Google Scholar]
- Zamudio Ramirez, I.; Ramirez-Nunez, J.A.; Antonino-Daviu, J.A.; Osornio-Rios, R.; Lopez, A.Q.; Razik, H.; Romero-Troncoso, R.J. Automatic diagnosis of electromechanical faults in induction motors based on the transient analysis of the stray flux via MUSIC methods. IEEE Trans. Ind. Appl. 2020. [Google Scholar] [CrossRef]
- Entezami, A.; Shariatmadar, H. An unsupervised learning approach by novel damage indices in structural health monitoring for damage localization and quantification. Struct. Health Mon. 2017, 17, 325–345. [Google Scholar] [CrossRef]
- Salawu, O.S. Detection of structural damage through changes in frequency: A review. Eng. Struct. 1997, 19, 718–723. [Google Scholar] [CrossRef]


| Condition | Frequency (Hz) | ||||
|---|---|---|---|---|---|
| Sensor 1 | Sensor 2 | Sensor 3 | Sensor 4 | Sensor 5 | |
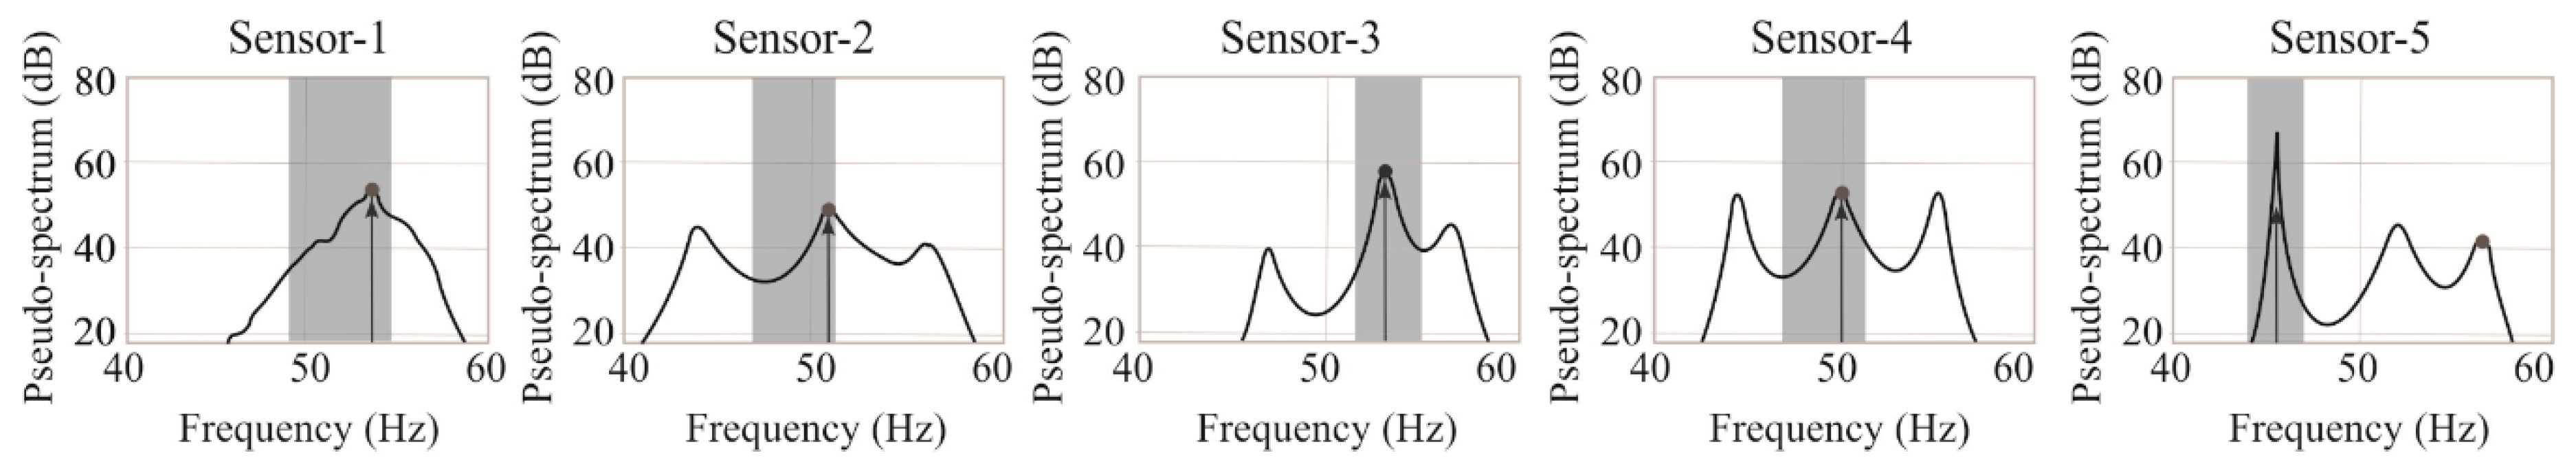
| JF (see Figure 11) | 53 | 51 | 47 | 50 | 56 |
| EC (see Figure 12) | 53 | 51 | 53 | 50 | 53 |
| IC (see Figure 13) | 53 | 51 | 53 | 50 | 56 |
| Damage Location | Sensor 1 | Sensor 2 | Sensor 3 | Sensor 4 | Sensor 5 |
|---|---|---|---|---|---|
| Bay 1 | 25 | 18.5 | 0.5 | 1.5 | 6.8 |
| Bay 2 | 6 | 22 | 20.5 | 6 | 0.7 |
| Bay 3 | 10.5 | 22.5 | 33 | 5 | 2.7 |
| Bay 4 | 16 | 19.5 | 21.5 | 23 | 2.7 |
| Bay 5 | 9.5 | 9 | 19 | 13.5 | 22.3 |
| Damage Location | Sensor 1 | Sensor 2 | Sensor 3 | Sensor 4 | Sensor 5 |
|---|---|---|---|---|---|
| Bay 1 | 20 | 7.5 | 6.5 | 4 | 11.5 |
| Bay 2 | 20.5 | 26.5 | 10.5 | 10 | 20.5 |
| Bay 3 | 11 | 14 | 33 | 16 | 20 |
| Bay 4 | 12 | 6.5 | 12.5 | 23 | 6.5 |
| Bay 5 | 18 | 20.5 | 8 | 12 | 30 |
| Damage Location | Sensor 1 | Sensor 2 | Sensor 3 | Sensor 4 | Sensor 5 |
|---|---|---|---|---|---|
| Bay 1 | 20 | 18.5 | 7 | 15 | 11.3 |
| Bay 2 | 14 | 23 | 9 | 9 | 16.3 |
| Bay 3 | 1 | 11.5 | 14.5 | 11.5 | 12.3 |
| Bay 4 | 12 | 11.5 | 11 | 22 | 10.8 |
| Bay 5 | 8.5 | 16 | 1 | 13.5 | 22.3 |
© 2020 by the authors. Licensee MDPI, Basel, Switzerland. This article is an open access article distributed under the terms and conditions of the Creative Commons Attribution (CC BY) license (http://creativecommons.org/licenses/by/4.0/).
Share and Cite
Perez-Ramirez, C.A.; Machorro-Lopez, J.M.; Valtierra-Rodriguez, M.; Amezquita-Sanchez, J.P.; Garcia-Perez, A.; Camarena-Martinez, D.; Romero-Troncoso, R.d.J. Location of Multiple Damage Types in a Truss-Type Structure Using Multiple Signal Classification Method and Vibration Signals. Mathematics 2020, 8, 932. https://doi.org/10.3390/math8060932
Perez-Ramirez CA, Machorro-Lopez JM, Valtierra-Rodriguez M, Amezquita-Sanchez JP, Garcia-Perez A, Camarena-Martinez D, Romero-Troncoso RdJ. Location of Multiple Damage Types in a Truss-Type Structure Using Multiple Signal Classification Method and Vibration Signals. Mathematics. 2020; 8(6):932. https://doi.org/10.3390/math8060932
Chicago/Turabian StylePerez-Ramirez, Carlos A., Jose M. Machorro-Lopez, Martin Valtierra-Rodriguez, Juan P. Amezquita-Sanchez, Arturo Garcia-Perez, David Camarena-Martinez, and Rene de J. Romero-Troncoso. 2020. "Location of Multiple Damage Types in a Truss-Type Structure Using Multiple Signal Classification Method and Vibration Signals" Mathematics 8, no. 6: 932. https://doi.org/10.3390/math8060932