Relationship Stability and Supply Chain Performance for SMEs: From Internal, Supplier, and Customer Integration Perspectives


1
Department of Industrial Engineering and Management, National Quemoy University, Kinmen 892, Taiwan
2
Department of Business Administration, National Changhua University of Education, Changhua 500, Taiwan
3
Institute of Technology Management, National Chung Hsing University, Taichung 402, Taiwan
*
Authors to whom correspondence should be addressed.
Mathematics 2020, 8(11), 1902; https://doi.org/10.3390/math8111902
Submission received: 19 September 2020
/
Revised: 18 October 2020
/
Accepted: 19 October 2020
/
Published: 31 October 2020
(This article belongs to the Special Issue Mathematical Methods and Analysis for the Industrial Management and Business)
Abstract
:This study examined the relationship between supply integration and relationship stability and the relationship between relationship stability and performance; furthermore, the moderation effect of environmental uncertainty on supply chain integration and relationship stability was analyzed. The subjects are typical small and medium-sized enterprises (SMEs) in developing countries that focus on niche markets to compete with large-scale manufacturers. Questionnaires were distributed to manufacturers to collect empirical data; in total, 566 valid samples were gathered. The results indicate that supply chain integration has positive effects on relational stability and that relational stability has positive effects on supply chain performance. Relational stability is a mediator between supply chain integration and supply chain performance. The contingency effects of environmental uncertainty on the relationships between internal integration and relational stability were determined in this research. This research framework extended past research on supply chain management; part of the research explored the relationship between supply chain integration and different measures of supply chain performance, as well as whether uncertainty affects supply chain integration and supply chain performance.
1. Introduction
Due to the rapid changes in the business environment and customer needs, coupled with global competition, the product division of labor, and advances in information technology, companies are no longer facing simple company-to-company competition but instead competition between value chains [1,2], as well as competition between supply chain systems [3,4]. The performance of individual manufacturers is affected by the supply chain network to which they belong. Therefore, manufacturers at the center of the supply chain must manage multiple partnerships. In other words, competition between companies is now in fact competition between value chains and supply chains [5]. Therefore, within this group competition, the success of individual manufacturers depends on the group’s overall competitive advantage [6]. Building, strengthening, and stabilizing buyer–supplier relationships is becoming much more critical for individual companies.
Small and medium-sized enterprises (SMEs) are an especially important component of the global economy [7]. Although they might be more flexible, quick to respond, and focused on specific strengths due to their structural simplicity, SMEs still lack technology, human and financial resources, and purchasing power compared to large companies [8]. Facing a rapidly changing environment, they need to look for ways to survive, grow, and be competitive [9]. Thus, they are beginning to cooperate with external partners and depend on their partners to respond to strong competition and customer demands [10,11,12].
In Taiwan, SMEs are also the leading contributor to the country’s economic growth. They not only account for 97% of all enterprises but include over 75% of the working population. Among all SMEs, SMEs in the manufacturing sector make up the largest proportion of companies and are the most important engine for economy growth [2]. However, in recent years, threats and competition from emerging countries in Southeast Asia have led Taiwan’s SMEs to better manage their supply chain.
To cooperate and coordinate with supply chain partners, supply chain integration is one of the most important factors that enables collaborative buyer–supplier relationships. However, the majority of recent literature findings have been based on data from large companies and, as such, might not be applicable to SMEs. Therefore, more research about how SMEs should best approach supply chain integration to obtain a stable relationship with supply chain partners is needed.
Supply chain integration (SCI) refers to a strategic cooperation between an organization and its supply chain partners and effective management within and between organizations, delivering efficiency in terms of product, service, information, finance and decision-making processes with the objective of maximizing customer value [13]. According to previous research [14,15,16], supply chain integration can be divided into internal integration, supplier integration, and customer integration. Internal integration involves internal information sharing between departments and cross-departmental coordination on strategy, such as concurrent engineering and lean manufacturing. External integration can be divided into customer integration and supplier integration.
For manufacturers in the supply chain, the relationship stability (RS) of the supply chain requires a willingness to make short-term sacrifices in order to maintain relationships. Stable relationships give companies peace of mind and a sense of trust, enabling them to pursue long-term benefits [17]. Stable supply chain relationships mean that supply chain partners will be willing to invest in relationships and will be more willing to share information or technology with their suppliers or buyers so that they can benefit more from their relationships [18]. In order to survive in an uncertain environment of shorter product life cycles and rapid changes in customer demand, suppliers and buyers in the supply chain tend to prefer mutual reliance and coordination. Therefore, many companies are able to grow primarily through effective coordination and cooperation with supply chain partners [17,19]. Given that information flows more quickly between supply chain partners with effective communication and cooperation, this imperceptibly increases mutual dependence in the relationship, contributing to a stable relationship. A stable relationship can reduce supply and demand uncertainty, creating a more beneficial environment for business operations, further reducing the costs of controlling the environment, enhancing coordination and cooperation among supply chain partners, and providing benefits and competitive advantages from the relationship, thus enhancing the performance of the supply chain partners [18].
There is a close interaction between the external environment and the organizational environment. Enterprise organizations must inevitably interact with the external environment and cannot survive independent of other organizations. Therefore, the external environment is one of the most important factors in the operations of organizations [20]. In the economics, manufacturing, and supply chain literature, environmental uncertainty (EU) has been considered to be one of the factors that effects supply chain integration. For instance, transaction cost theory argues that a high degree of business uncertainty tends to lead company policy towards vertical integration [21]. In the manufacturing strategy literature, environmental uncertainty has been shown to affect company performance, such as in terms of quality, reliability, and cost, and it is recommended that flexibility should be increased in response to a high degree of environmental uncertainty [22]. The supply chain management literature argues that, when there is a high level of business uncertainty or a lack of information about supply or demand, there is closer coordination or integration between supply chains [23].
Therefore, the present study examined the relationship between supply integration and relationship stability and the relationship between relationship stability and performance; furthermore, the question of whether environmental uncertainty has a moderating effect on supply chain integration and relationship stability was also explored. It is hoped that we can develop a deeper understanding of the relationship between supply chain integration and relationship stability as well as the influence of relationship stability on performance. The purposes of the present study were to explore the relationship between three levels of supply chain integration and relationship stability, to explore the relationship between supply chain relationship stability and manufacturer performance, to explore the moderating effect of environmental uncertainty in the relationship between supply chain integration and relationship stability, and to provide a reference for senior management when carrying out supply chain integration.
Therefore, this paper provides theory-driven and empirically proven explanations for managers to differentiate the effects of internal and external integration efforts on various operational performance outcomes under different environmental conditions. Integration efforts involve costs and risks, and it is therefore important to inform managers of precisely which SCI efforts are effective under specific environmental conditions.
The reminding of the paper is as follows. Section 2 presents related literature and builds hypotheses. Section 3 introduces the questionnaire design and sampling method. Section 4 demonstrates the analysis results. Then, the analysis results are discussed. Finally, academic contributions and managerial implications are provided.
2. Literature Review
In recent years, research on supply chain integration has been receiving increasing attention from scholars. In this section, we collected and discussed literature based on our research questions and research objectives. This section will be divided into six parts: the first part considers supply chain integration, including supplier integration, customer integration and internal integration; the second part considers relationship stability; the third part considers environmental uncertainty; the fourth part considers performance; the fifth part develops hypotheses; and the sixth part presents the research model.
2.1. Supply Chain Integration
Scholars such as Choy et al. [23], Towill [24], Simon et al. [25], and Hult et al. [26] defined the supply chain as an industrial network comprising activities such as order processing, product ideas, market forecasts, product design, material procurement, manufacturing, product distribution, and service and maintenance which directly or indirectly meet customer needs. A large number of studies have established that supplier integration, internal integration, and customer integration are the three main categories of supply chain integration. Therefore, in this section, we carry out a literature review based on these three categories.
Supplier integration (SI) refers to a focus on strategic cooperation between manufacturers and suppliers in the management of intercompany business processes, including information sharing, strategic partnerships, project cooperation, and joint product development [27,28]. Tracey and Vonderembse [29] argued that the participation of suppliers and manufacturers in the supply chain in decision-making can create a competitive advantage, primarily because the participation of individuals related to the supply chain in decision-making can enhance the quality of decision-making, distribute assets and market risk, and enhance the response capabilities of enterprises, thereby increasing the efficiency of decision-making, improving the quality of services or products, as well as customer satisfaction, and establishing a good reputation in the market.
Customer integration (CI) is a process under which an organization cooperates and interacts with its customers with the objective of ensuring the efficiency of the supply process. In order to achieve a high level of customer integration, companies must penetrate the organizations of their customers, learning their products, culture, and markets, so that they can quickly respond to customer needs [30]. Fisher et al. [31] pointed out that customer integration, including the strategic sharing of information and cooperation between focus manufacturers and their customers, acts as a basis for improving customer demand plans. In other words, a higher level of customer information indicates greater information sharing. Manufacturers can obtain more information about their customer demands, helping them to more accurately predict the market situation and providing significant help for senior managers when making long-term operational decisions.
Internal integration refers to the practice, procedures, and behavior developed by manufacturers within an organization that involve processes featuring collaboration, consistency, and management, thereby meeting customer requirements [32,33]. The main approach is to integrate data and information systems, including tools such as enterprise resource planning (ERP) and the real-time searching of inventories, achieving the integration of the activities of different functional departments [34]. Therefore, Kahn and Mentzer [35] argued that internal integration involves interaction and cooperation between departments, with the aim of allowing an enterprise to become a cohesive organization. When the information systems used by different departments in an organization are mutually connected and each department can access accurate, real-time information from other departments, then the organization can be considered to have a high degree of integration as well as efficient interdepartmental communication [36,37].
2.2. Relationship Stability
Lai et al. [38] argued that relationship stability is the stability of the buyer–supplier relationship and a commitment by both sides to maintaining a positive long-term relationship. Celly et al. [39] argued that, in the global supply chain relationships between buyers and suppliers, from the perspective of buyers, relationship stability includes two aspects: relationship length and relational attitude. Relationship length is the length of the relationship between manufacturers and suppliers, calculated in years. Relational attitude is the attitude of suppliers toward continued investment in changing relationships with particular suppliers. Here, the relational attitude only considers the attitude of suppliers without considering the attitude of buyers. Liu et al. [40] brought together the views of Lai et al. [38] and Celly et al. [39], arguing that relationship stability contains two dimensions: relationship length and dyadic solidarity. The definition of dyadic solidarity is that supply chain partners consistently believe that their relationships are indispensable.
2.3. Environmental Uncertainty
In the context of the supply chain, environmental uncertainty is frequently the result of an insufficient understanding from manufacturers of environmental information, meaning that they are unable to effectively predict the outcome of events or make effective decisions. In the supply chain, environmental uncertainty has long been a problem for supply chain partners. In particular, during the interaction between companies, product flow and information flows require communication across multiple channels [41], making it more difficult to predict the causal relationship between events. Davis [42] proposed that environmental uncertainty in the supply chain has three different sources: demand uncertainty, supply uncertainty, and technical uncertainty. This view has been accepted by a large majority of scholars in related research fields, including Fynes et al. [43] and Wong and Boon-itt [44]. Therefore, the present study discusses the moderating effect of environmental uncertainty in using demand, supply, and technical uncertainty.
Demand uncertainty (DU) refers to unknown and unpredictable changes in the amount and the time point of demand in the supply chain, typically causing errors in demand forecasts (i.e., the actual demand and forecasted demand are not the same). Supply uncertainty (SU), as with demand uncertainty, means that the amount and time point of supply in the supply chain are unknown and cannot be predicted. Technical uncertainty (TU) is defined as complex and unpredictable change in product and process technology and is also referred to as the rate of technological change.
2.4. Supply Chain Performance
Performance measures business operations over a period of time and is an important tool for the evaluation of operating results [45]. There are many ways to measure performance, and selecting the appropriate measure of supply chain performance is a major challenge, because supply chains have complex and dependent characteristics. Chang [46] argued that appropriate performance metrics can help build an efficient supply chain management system. Neely et al. [47] divided enterprise performance evaluation systems into four categories: quality, time, flexibility, and cost. On the other hand, Beamon [48] used cost, activity time, customer response, and flexibility as performance measures.
According to recent studies by scholars of supply chains, supply chain integration-related performance measures can largely be divided into operation performance and business performance. For example, Flynn et al. [49] used a contingency approach and structure configuration approach, finding a positive relationship between supply chain integration and operation performance (including the rapid modification of products, responses to changing market demand, delivery time, the meeting of order lead times, and customer service) and business performance (including sales growth, earnings growth, market share, and return on investment).
Therefore, the present study used operation performance, including the rapid modification of products to meet customer demands, the rapid introduction of new products into the market, rapid responses to changing market demands, timely delivery records for major customers, the meeting of order lead times, and the serving of major customers at a high standard, to research the effect of relationship stability in supply chains on supply chain operation performance.
2.5. Research Hypotheses
Internal integration helps cross-department teams to improve both products and processes, helping to lower production costs [50] and to improve product quality [51]. Lower-cost and better-quality products help to make manufacturers more competitive in the market, attracting more buyers to purchase their products. Therefore, buyers with better supplier bargaining power, together with good internal integration, indicate that focus manufacturers have good management knowledge and ability, and so buyers and suppliers will be willing to share knowledge and information or exchange technology with these focused manufacturers. On this basis, we propose the following hypothesis:
Hypothesis 1 (H1).
Internal integration has a positive effect on relationship stability.
External integration can be divided into supplier integration and customer integration. Flynn and Flynn [52] and Narasimhan and Jayaram [53] argued that external integration can facilitate cross-company coordination and communication, helping to share ideas and information and increasing mutual understanding between supply chain partners. When problems occur, rapid task coordination can take place, reducing wasted effort from repeating the same task [54]. More importantly, the integration of customers and suppliers helps to resolve the conflict of objectives and further enhance the ability of supplier partners to reduce costs and inventory, improve quality, and develop new products, thereby improving time-based performance such as shipping, production flexibility [51,55], and product quality [27,55]. On this basis, we propose the following hypotheses:
Hypothesis 2 (H2).
Supplier integration has a positive effect on relationship stability.
Hypothesis 3 (H3).
Customer integration has a positive effect on relationship stability.
Many scholars have found that a closer supply chain buyer–supplier relationship will help to improve performance. For example, Lamming [56] found that closer working relationships and transparent information flows within supply chains enable buyers to obtain good quality products at appropriate prices. In addition, Fynes et al. [43] found that the quality of supply chain relationships is positively associated with supply chain performance. From the results of these studies, we find that stronger relationships between buyers and suppliers in the supply chain help to improve performance. On this basis, we propose the following hypothesis:
Hypothesis 4 (H4).
Relationship stability has a positive effect on supply chain performance.
Supply uncertainty is the level of unreliability or unpredictability of information, design, quality, and the delivery performance of suppliers, while demand uncertainty is the level of unreliability or unpredictability of customer needs, information, or demands [30]. Therefore, lower supply uncertainty means that suppliers are able to provide reliable information, design, quality, and delivery performance. In a situation of information uncertainty, raw material shortages or price changes may arise, increasing costs. By the same logic, lower supply uncertainty means that customers provide reliable information and demands. In a situation of demand uncertainty, the supply chain partners may face a situation of overproduction or depleted stock, increasing the difficulty of forecasting. To improve this situation, supply chain partners tend to integrate with suppliers and customers and maintain good long-term relations using information sharing between the two parties to get more useful information to help make the right decisions. Fynes et al. [43] showed that, compared to strong supply and demand uncertainty, the relationship between the quality of supply chain relations and supply chain performance is strong. Therefore, under a situation of environmental uncertainty, manufacturers tend to maintain good supply chain relations in order to achieve better overall relations. On this basis, we propose the following hypotheses:
Hypothesis 5 (H5).
Under higher environmental uncertainty, supplier integration has a stronger relationship with relationship stability than under lower environmental uncertainty.
Hypothesis 6 (H6).
Under higher environmental uncertainty, customer integration has a stronger relationship with relationship stability than under lower environmental uncertainty.
Hypothesis 7 (H7).
Under higher environmental uncertainty, internal integration has a stronger relationship with relationship stability than under lower environmental uncertainty.
3. Research Methods
3.1. Measures and Questionnaire Design
Data collection was performed by distributing a questionnaire. We developed the survey questionnaire based on a literature review and the results of our interviews during site visits. All measures of our key variables were adapted from the literature. There were six variables in the questionnaire: internal integration, supplier integration, customer integration, supply chain performance, relationship stability, and environmental uncertainty. These questionnaire items were based on Narasimhan and Kim [22], Wong and Boon-itt [30], Frohlich and Westbrook [37], Lai et al. [38], Celly et al. [39], Liu et al. [40], Fynes et al. [43], Wong et al. [44], Beamon [48], Flynn et al. [49], and Stank et al. [57]. The measures are demonstrated in Table 1.
The first part of the questionnaire regarded demographic information, including the respondent’s demographic information and company information. The second to seventh parts covered the six scales, in order, of internal integration, supplier integration, customer integration, supply chain performance, relationship stability, and environmental uncertainty. A five-point Likert scale was used for all the six variables, where a higher value indicated a higher level of integration and uncertainty or better performance.
The questionnaire included a covering letter asking that the questionnaire be completed by appropriate respondents [8]. We conducted a field pretest of the questionnaire with 20 Executive Master of Business Administration (EMBA) students working in supply chain integration roles to identify any deficiencies in questionnaire design or question wording [5] and to assess how the survey instrument would work under realistic conditions [58]. Some of the wording of the questionnaire was modified. The revised questionnaires were then distributed to informants.
3.2. Data Collection
SMEs in the manufacturing sector formed the population of this study. The sampling frame of this study represented small and medium-sized enterprises in the Taiwan Industrial Zone, including 5352 SMEs in manufacturing sectors in Taiwan. We randomly selected a sample of SMEs from the Taiwan Industrial Zone Manufacturers Directory. The data were collected from December 2017 to April 2018.
The research team of this study called target firms to explain the purpose of this study. Then the team collected the name and email addresses of the respondents who agreed to participate. A link to the online survey was sent to the respondents. Each survey included a cover letter explaining the research and the meaning of research variables.
Questionnaire respondents were primarily owners and department managers responsible for the implementation of supply chain integration within companies. It was assumed that this group of respondents has the best knowledge related to external integration, internal integration, and relationship quality with their supply chain partners. Respondents were asked to base their questionnaire responses on their main suppliers and customers. Initially, the questionnaire was sent via email; however, due to the low response rate, a paper version of the questionnaire was delivered to the respondents.
A total of 1560 questionnaires were distributed and 612 questionnaires were collected. After discarding the responses with excessive missing data, 566 responses (36.28%) were used in the analyses (Table 2).
3.3. Tests of Non-Response Bias and Common Method Bias
Non-response bias might be a potential threat to the credibility in this study. To test the potential non-response bias, we compared responses from early respondents to those who responded in the later stage. We employed t-tests to compare the mean values of all items between the early and late respondents. There is no significant differences at the p > 0.05 significance level. Therefore, non-response bias should not be a concern in this study [4].
Because we based our study on a single key informant approach, common method bias might represent a threat to the validity in this study. We therefore conducted Harman’s single-factor test to ensure that no one general factor accounted for the majority of covariance between the variables and items. This revealed that neither a single factor nor a general factor caused most of the variance, suggesting that there was no common method bias problem [44].
4. Research Results
In this section, we show the empirical results and the findings based on the conceptual hypotheses’ test results.
4.1. Reliability and Validity
In this study, we used Cronbach’s α to test the consistency and stability of questionnaire items and test the reliability of the research tools to determine whether there was value in continuing the analysis. Based on the recommendations of Nunnally [59] and Flynn et al. [60], the Cronbach’s α value should be greater than the 0.6 threshold. Each of the observed variables in the study had a Cronbach’s α of greater than 0.7, and the Cronbach’s α of the overall questionnaire was 0.93. Therefore, the data were suitable for continued analysis. The results of the reliability analysis are shown in Table 3.
After checking the reliability, the Kaiser–Meyer–Olkin (KMO) values of individual items for different variables on each dimension were calculated and are shown in Table 3. A higher KMO value indicates that the measured variables can be more evenly grouped to form a dimension. A KMO lower than 0.6, however, indicates that factor analysis is not appropriate. In the present study, the KMO values for each dimension were greater than 0.6; therefore, the sampling was adequate and sufficient. We also conducted Bartlett’s test. According to the Bartlett’s test results (Table 3), which measures the multivariate normality of the sample data, the p-values were less than 0.05, meaning that the sample data were approximately multivariate normal and acceptable for further analysis. Therefore, we conducted factor analysis, and the results are shown in Table 3. The factor loadings of each item corresponding to variables are greater than 0.5, demonstrating that the questionnaire had sufficient convergent and discriminant validity.
4.2. Regression Analysis
In order to understand the influence of the independent variables on the dependent variable, we used hierarchical multiple regression for the empirical analysis of the sample data. In addition to the possible effect of the research variables on supply chain performance, other factors may also have had an effect. Past research has shown that the larger the size of the company, the more resources are available for supply chain activities; these companies can achieve better performance than small companies. Therefore, in order to establish the possible effects of other exogenous variables and ensure that the research results more closely reflect the actual situation, the present study also included two control variables: the first is the number of company employees, and the second is the company capital.
4.2.1. Internal Integration, Supplier Integration, and Relationship Stability with Suppliers
Table 4 shows the standardized regression coefficients of internal integration and supplier integration on relationship stability. Additionally, we tested whether a moderating effect of environmental uncertainty was present. The results show that internal integration had a significant effect in model 1 (β = 0.28; p < 0.01) as well as in model 2 (β = 0.30; p < 0.01). In addition, supplier integration was significant in model 1 (β = 0.27; p < 0.01) as well as in model 3 (β = 0.26; p < 0.01). Therefore, Hypothesis 2 is supported: there is a positive relationship between supplier integration and relationship stability with suppliers.
4.2.2. Internal Integration, Customer Integration, and Relationship Stability with Customers
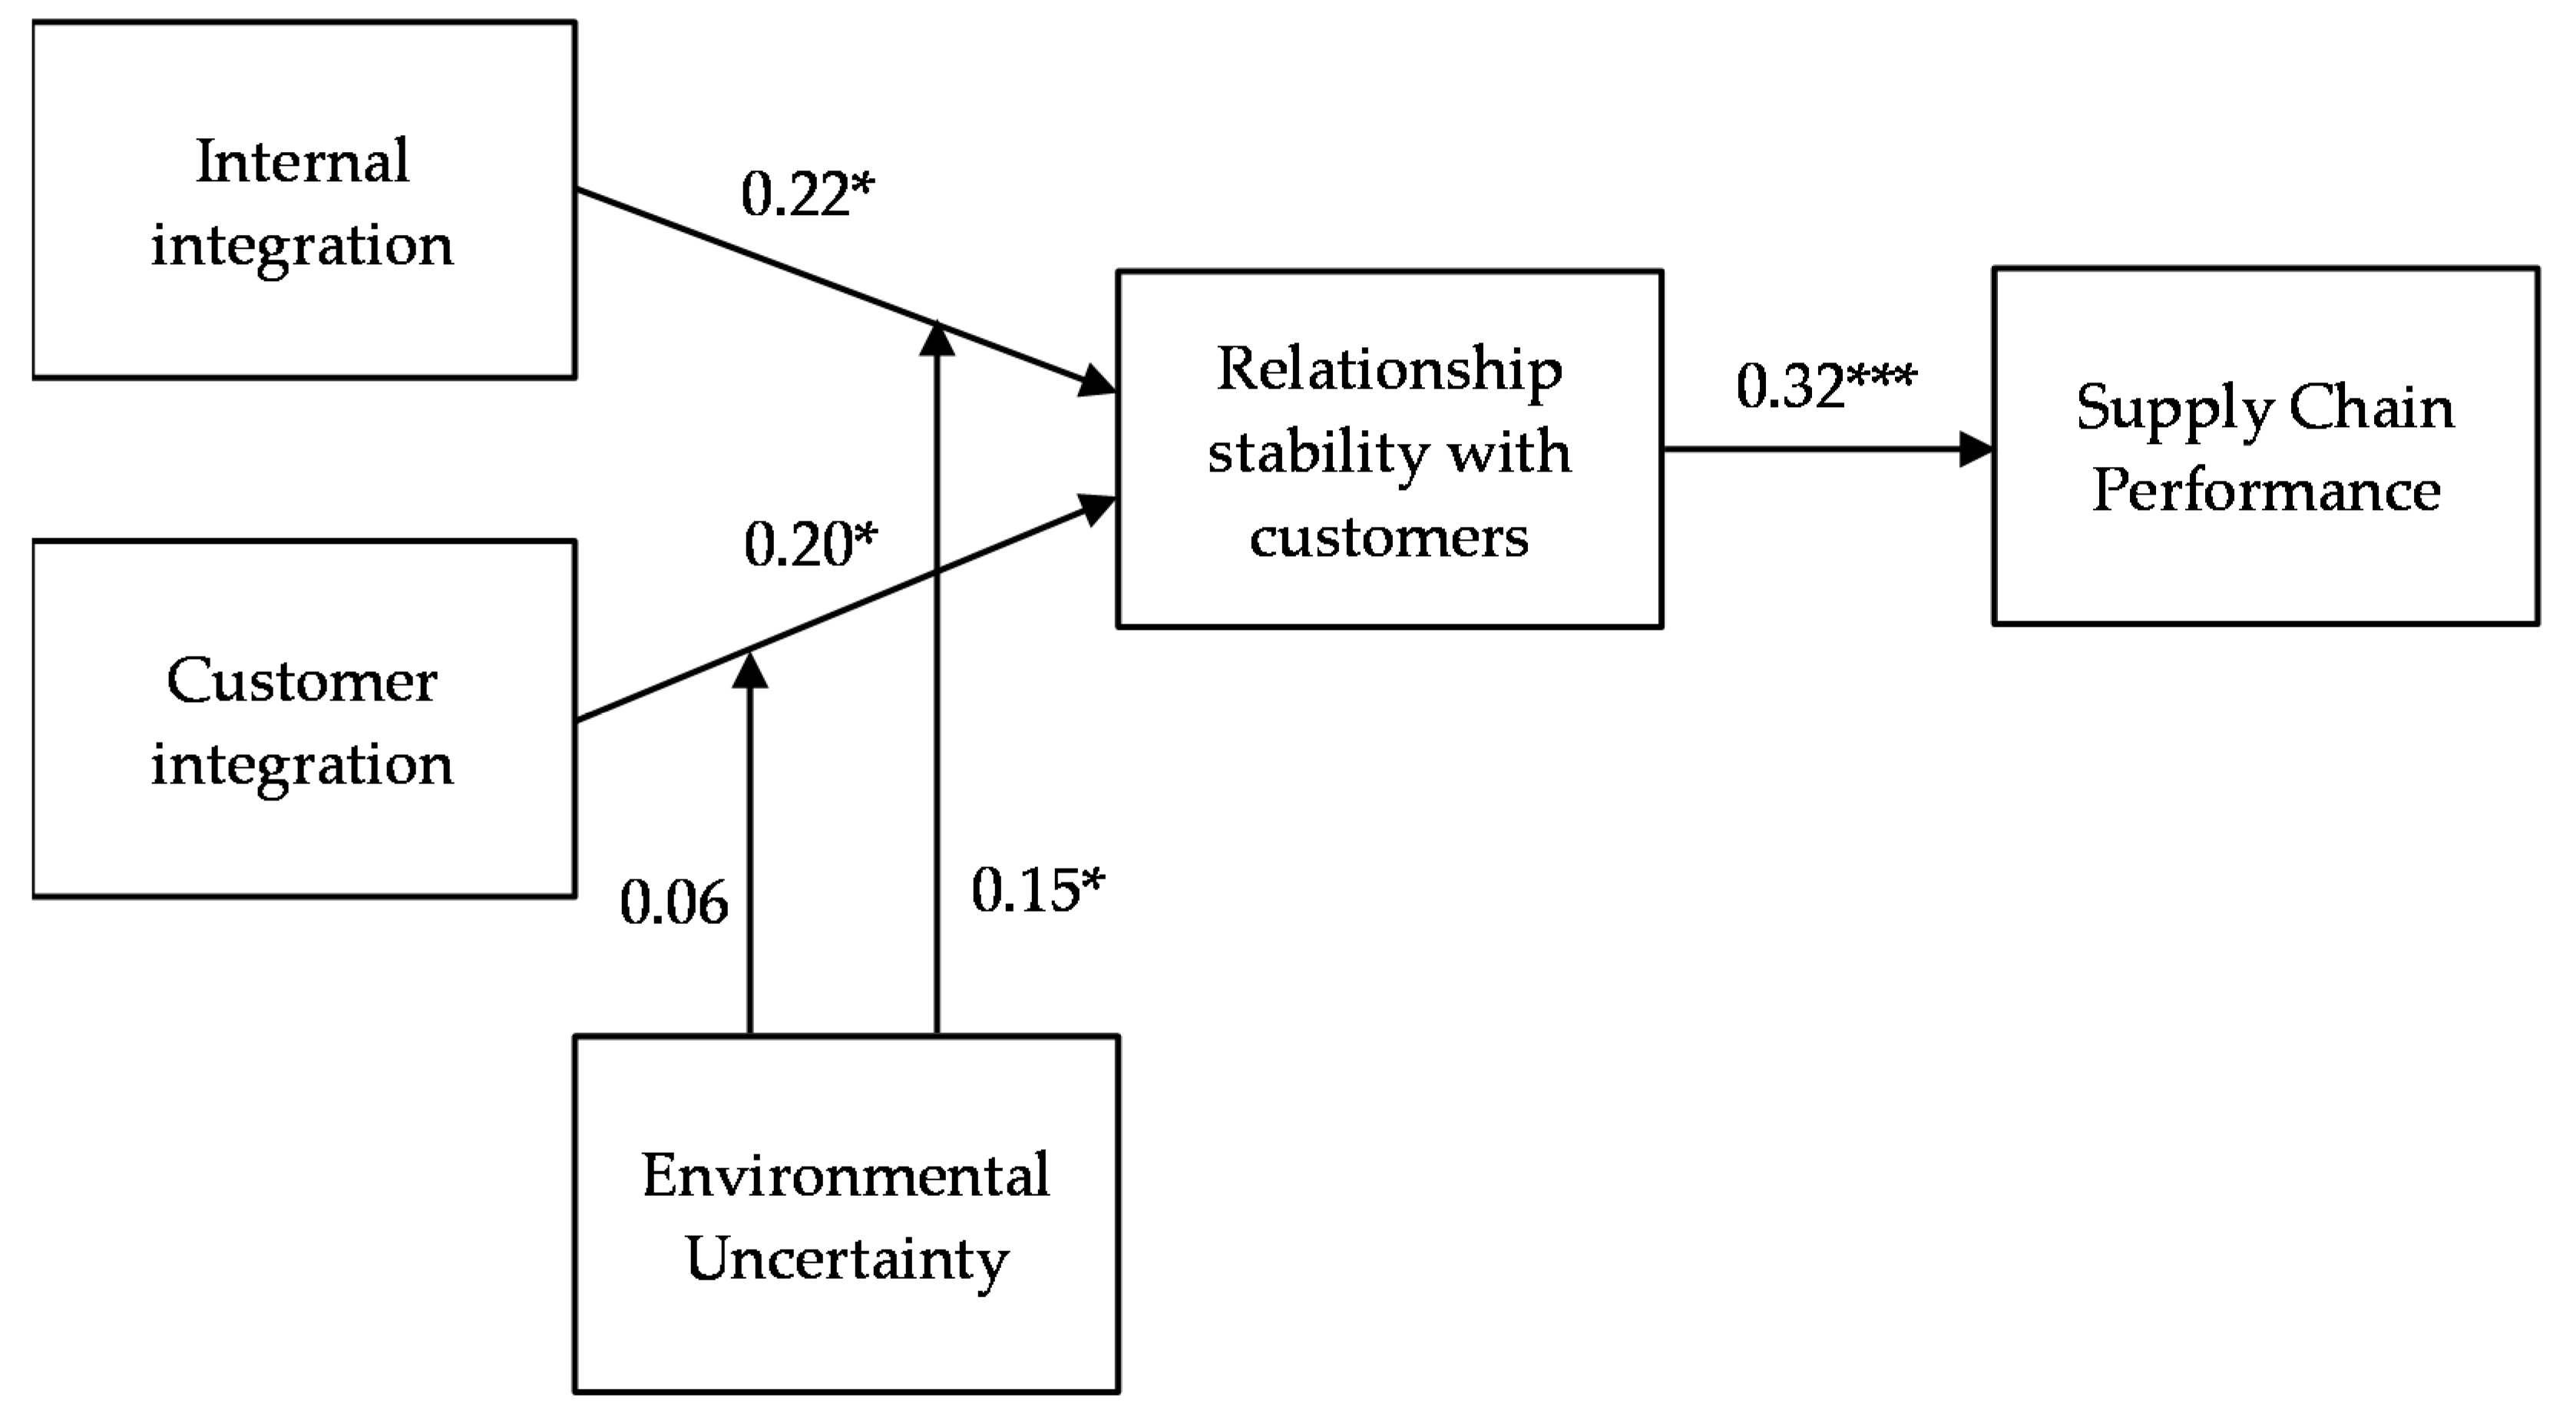
Table 5 shows the standardized regression coefficients of internal integration and customer integration on relationship stability and the moderating effect of environmental uncertainty. The results show that internal integration had a significant effect in model 1 (β = 0.25; p < 0.1) as well as in model 2 (β = 0.22; p < 0.1). Customer integration had a significant effect in model 1 (β = 0.18; p < 0.01) as well as in model 2 (β = 0.20; p < 0.1). Therefore, Hypothesis 1 and Hypothesis 3 are supported: internal integration has a positive association with relationship stability with suppliers and customers, and there is a positive relationship between customer integration and relationship stability with customers.
In model 2 in Table 4 and Table 5, we find that the interaction between internal integration and environmental uncertainty is significant, meaning that environmental uncertainty produces a moderating effect on the relationship between internal integration and relationship stability, supporting Hypothesis 7. However, supplier integration and customer integration do not have a significant interaction with environmental uncertainty, showing that environmental uncertainty does not have a moderating effect on the effect of supplier integration and customer integration on relationship stability. Therefore, Hypothesis 5 and Hypothesis 6 are not supported.
4.2.3. Mediating Effect of Relationship Stability
Regression analysis was also employed to test whether relationship stability had a mediating effect on the relationship between manufacturers’ supply chain integration and supply chain performance. The results from model 1 show that supplier integration had a significant relationship with performance (β = 0.44; p < 0.001), and internal integration also had a significant relationship with performance (β = 0.19; p < 0.1). Model 3 showed that both supplier integration and internal integration had significant effects on relationship stability and performance (p < 0.001). In addition, the results from model 2 shown in Table 6 were significant (p < 0.001). Based on the above, we find that relationship stability with suppliers has a partially mediating effect on the relationship between internal integration, supplier integration, and supply chain performance.
Table 7 shows the Sobel test results demonstrating whether relationship stability has a mediating effect on the relationship between manufacturers’ supply chain integration and supply chain performance. The result of the Sobel test was greater than 1.96, showing that there was a mediating effect. From Table 7, we find that the Sobel Z values for relationship stability with suppliers and relationship stability with customers were both larger than 1.96, showing a significant moderating effect for both relationship stability with suppliers and relationship stability with customers.
5. Discussion and Conclusions
The main purpose of this study was to investigate how the supply chain integration of SMEs influences the relationship stability of the supply chain, thereby affecting supply chain performance. Environmental uncertainty was included as a moderating variable to understand whether the strength of environmental uncertainty influences the relationship between supply chain integration and relationship stability. This section presents a comprehensive summary and explanation of the findings of Section 4 as well as conclusions and managerial implications based on the findings.
The results of this work show that supply chain integration and relationship stability have a positive relationship, and that relationship stability has a mediating effect on the relationship between supply chain integration and supply chain performance. This research framework extends past research on supply chain management. Previous research has mostly explored the relationship between supply chain integration and different measures of supply chain performance, or whether uncertainty affects supply chain integration and supply chain performance.
There are very few studies discussing the importance of relationship stability in the supply chain and its impact on supply chain performance. Therefore, the present study used empirical analysis to address this gap in research. For the relationship stability variable, we distinguished between the perspectives of customers and suppliers—an approach which is rarely found in previous studies. Suppliers and customers play different roles in the supply chain and thus may have different effects on relationship stability and supply chain performance. Discussing suppliers and customers separately increases the accuracy and reliability of the results and helps us to understand whether different roles have different effects on relationship stability or supply chain performance.
From the analysis results, internal integration, supplier integration, and customer integration can be seen to have positive effects on relationship stability. Relationship stability mediates the effects of three kinds of integration on supplier performance. Environmental uncertainty simply moderates the effect of internal integration on relationship stability.
Internal integration involves the internal operation of organizations, which can break the barriers between departments, meaning that information and resources can effectively flow between different departments, improving products and procedures, while also reducing costs and improving quality. This allows manufacturers to improve their competitiveness in the industry and have more influence over their suppliers and customers. This is because cost reduction can be reflected in a lower price which, together with improvements in product quality, makes customers more willing to cooperate with manufacturers over the long term. These long-term relationships not only involve trading in products but also potential cooperation in areas such as corporate governance, market strategy, and staff training. Therefore, the effective internal integration of companies has a significant benefit in terms of maintaining stable supply chain relations. This result is consistent with our research hypothesis H1.
Flynn and Flynn [52] and Narasimhan and Jayaram [53] indicated that external integration can facilitate cross-company coordination and communication in problem-solving routines. Therefore, good external integration enables manufacturers to effectively exchange information with suppliers or customers to help supply chain partners to better understand each other, meaning that when problems are encountered, they can effectively coordinate and arrange the division of labor for follow-up work in order to reduce waste due to duplicated effort, while also reducing waste from the delivery of information and the costs of poor communication. At the same time, this can also reduce conflicting objectives, instead leading to the establishment of common objectives, with manufacturers choosing longer-term cooperation in order to achieve these objectives. As a result, manufacturers and their supply chain partners have a greater willingness to establish long-term and stable relationships, contributing to supply chain relationship stability and supporting hypotheses H2 and H3 proposed in this study.
Long-term cooperation and interaction between supply chain partners lead to a gradual accumulation of relational capital. Relational capital can reduce monitoring costs and increase the willingness of supply chain partners to coordinate with each other [61,62]. Long-term supply chain relationship stability enables the accumulation of strong relational capital. Stable relationships can therefore make supply chain members more willing to invest in relationships. These investments can lead to cost reductions, high flexibility, and productivity, and thus improved supply chain performance, supporting hypothesis H4.
For supply chain members, environmental uncertainty refers to uncertain or unstable factors. Environmental uncertainty makes it impossible for manufacturers to predict the outcome of decisions. As a result, manufacturers have increased chances of making mistakes or suffering losses under environmental uncertainty. The results of this study show that internal integration has a stronger effect on relationship stability under high environmental uncertainty. This means that SMEs should provide better internal integration to improve efficiency and quality, together with lower costs, and build strong competitive edges in the industry. Suppliers and customers will see their effort, recognize their competency, and be more willing to build stable relationship with SMEs.
On the other hand, environmental uncertainty has no moderating effect on the relationship between supplier and customer integration and relationship stability. Irrespective of high or low uncertainty, SMEs have no ability to integrate and cooperate with their suppliers and buyers because of a lack of resources and competency. The relationship between supplier and customer integration and relationship stability will not therefore be influenced by environmental uncertainty.
Due to the rapid changes in the industrial environment and customer needs, competition is becoming increasingly fierce for SMEs. SMEs are searching for various methods to address this problem. They can improve their capabilities and strengthen overall competitive advantages. The results of this research can be used as a reference to improve supply chain integration and build supply chain relationships. In order to improve the performance of the supply chain, SMEs should commit to internal integration, including interdepartmental communication and coordination and the removal of interdepartmental barriers. On the other hand, SMEs should also improve their external integration. External integration, such as strategic cooperation with customers or suppliers, the joint planning or joint development of products, or the timely and accurate sharing of information, can enable supply chain partners to build closer and more stable relationships; thus, finally, the goal of supply chain performance improvement can be achieved.
Environmental uncertainty is also an unavoidable challenge for supply chain partners. The results of this study can enable managers to better understand how environmental uncertainty affects supply chain integration and supply chain relationship stability. When facing high uncertainty, SMEs managers should devote more efforts to the company’s own internal integration to build stable relationships with supply chain partners. Once a stable supply chain is established, the supply chain performance can be improved to meet investors’ expectations.
Author Contributions
T.-M.Y. developed the idea, motivation, and questions of the paper. F.-Y.P. outlined the manuscript and writing—original draft preparation. L.-C.W. made substantial contributions to the design of this study and contributed to the discussion. All authors have read and agreed to the published version of the manuscript.
Funding
This research received no external funding.
Acknowledgments
The authors would like to express their sincere gratitude to the editor and the anonymous reviewers for their insightful and constructive comments.
Conflicts of Interest
The authors declare no conflict of interest.
References
- Lewis, D.J. The Connected Corporation: How Leading Companies Win through Customer-Supplier Alliances; Free Press: New York, NY, USA, 1995. [Google Scholar]
- Wu, W.; Chiu, S. The impact of guanxi positioning on the quality of manufacturer–retailer channel relationships: Evidence from Taiwanese SMEs. J. Bus. Res. 2016, 69, 3398–3405. [Google Scholar] [CrossRef]
- Christopher, M.; Towill, D. An Integrated Model for the Design of Agile Supply Chains. Int. J. Phys. Distrib. Logist. Manag. 2001, 31, 235–246. [Google Scholar] [CrossRef] [Green Version]
- Zhu, Q.; Lai, K. Enhancing supply chain operations with extended corporate social responsibility practices by multinational enterprises: Social capital perspective from Chinese suppliers. Int. J. Prod. Econ. 2019, 213, 1–12. [Google Scholar] [CrossRef]
- Remenyi, D.; Williams, B.; Money, A.; Swartz, E. Doing Research in Business and Management; SAGE: London, UK, 1998. [Google Scholar]
- Dyer, H.J. Collaborative Advantage: Winning through Extended Enterprise Supplier Networks; Oxford University Press: New York, NY, USA, 2000. [Google Scholar]
- Adams, J.H.; Khoja, F.M.; Kauffman, R. An empirical study of buyer–supplier relationships within small business organizations. J. Small Bus. Manag. 2012, 50, 20–40. [Google Scholar] [CrossRef]
- Son, B.; Ha, B.; Lee, T. Small and Medium-Sized Enterprises’ Collaborative Buyer–Supplier Relationships: Boundary Spanning Individual Perspectives. J. Small Bus. Manag. 2019, 57, 966–988. [Google Scholar] [CrossRef]
- Michn, A.; Kmieciak, R.; Czerwinska-Lubszczyk, A. Dimensions of Intercompany Cooperation in the Construction Industry and their Relations to Performance of SMEs. Inz. Ekon. Eng. Econ. 2020, 31, 221–232. [Google Scholar] [CrossRef]
- Lin, F.J.; Lin, Y.H. The determinants of successful R&D consortia: Government strategy for the servitization of manufacturing. Serv. Bus. 2012, 6, 489–502. [Google Scholar]
- Lin, F.J.; Lin, Y.H. The effect of network relationship on the performance of SMEs. J. Bus. Res. 2016, 69, 1780–1784. [Google Scholar] [CrossRef]
- Rezaei, J.; Ortt, R.; Trott, P. Supply chain drivers, partnerships and performance of high-tech SMEs: An empirical study using SEM. Int. J. Prod. Perform. Manag. 2018, 67, 629–653. [Google Scholar] [CrossRef]
- Zhao, X.; Huo, B.; Flynn, B.B.; Yeung, J. The Impact of Power and Relationship Commitment on the Integration between Manufacturers and Customers in a Supply Chain. J. Oper. Manag. 2008, 26, 368–388. [Google Scholar] [CrossRef]
- Narasimhan, R.; Kim, S.W. Effect of Supply Chain Integration on the Relationship between Diversification and Performance: Evidence from Japanese and Korean Firms. J. Oper. Manag. 2002, 20, 303–323. [Google Scholar] [CrossRef]
- Droge, J.; Jayaram, J.; Vickery, S.K. The Effects of Internal Versus External Integration Practices on Time-Based Performance and Overall Firm Performance. J. Oper. Manag. 2004, 22, 557–573. [Google Scholar] [CrossRef]
- Koufteros, X.; Vonderembse, M.; Jayaram, J. Internal and external integration for product development: The Contingency Effects of Uncertainty, Equivocality, and Platform Strategy. Decis. Sci. 2005, 36, 97–133. [Google Scholar] [CrossRef]
- Yang, J.; Wang, J.; Wong, C.W.Y.; Lai, K.H. Relational Stability and Alliance Performance in Supply Chain. Omega 2008, 36, 600–608. [Google Scholar] [CrossRef]
- Shin, N.; Park, S.H.; Park, S. Partnership-Based Supply Chain Collaboration: Impact on Commitment, Innovation, and Firm Performance. Sustainability 2019, 11, 449. [Google Scholar] [CrossRef] [Green Version]
- Surachman, A.; Santoso, B.; Santoso, I. Influence of Information Sharing, Partnership, and Collaboration in Supply Chain Performance: Study on Apples Agroindustry. Adv. Syst. Sci. Appl. 2019, 3, 80–92. [Google Scholar]
- Scott, C.; Westbrook, R. New strategic tools for supply chain management. Int. J. Phys. Distrib. Logist. 1991, 21, 23–33. [Google Scholar] [CrossRef]
- Williamson, O.E. Markets and Hierarchies: Analysis and Antitrust Implications; Free Press: New York, NY, USA, 1983. [Google Scholar]
- Pagell, M.; Krause, D.R. A Multiple-method Study of Environmental Uncertainty and the Manufacturing Environment. J. Oper. Manag. 1999, 17, 307–325. [Google Scholar] [CrossRef]
- Choy, K.L.; Lee, W.B.; Lo, V. An Intelligent Supplier Relationship Management System for Selecting and Benchmarking Supplier. Int. J. Technol. Manag. 2003, 26, 717–742. [Google Scholar] [CrossRef]
- Towill, D.R. The Seamless Supply Chain: The Predator’s Strategic Advantage. Int. J. Technol. Manag. 1997, 13, 37–56. [Google Scholar] [CrossRef]
- Simon, C.; Pietro, R.; Mihalis, G. SCM: An Analytical Framework for Critical Literature Review. Eur. J. Purch. Supply Manag. 2000, 6, 67–83. [Google Scholar]
- Hult, G.T.; Ketchen, D.J.; Slater, S.F. Information Process, Knowledge Development, and Strategic Supply Chain Performance. Acad. Manag. J. 2004, 47, 241–253. [Google Scholar]
- Ettlie, J.E.; Reza, E. Organizational Integration and Process Innovation. Acad. Manag. J. 1992, 35, 795–827. [Google Scholar]
- Ragatz, G.L.; Handfield, R.B.; Peterson, K.J. Benefits associated with supplier integration into new product development under conditions of technology uncertainty. J. Bus. Res. 2002, 55, 389–400. [Google Scholar] [CrossRef]
- Tracey, M.; Vonderembse, M.A. Building Supply Chains: A Key to Enhanced Manufacturing Performance. Am. J. Bus. 2000, 15, 11–20. [Google Scholar] [CrossRef]
- Wong, C.Y.; Boon-itt, S. The Influence of institutional norms and environmental uncertainty on supply chain integration in the Thai automotive industry. Int. J. Prod. Econ. 2008, 115, 400–410. [Google Scholar] [CrossRef]
- Fisher, M.L.; Hammond, J.H.; Obermeyer, W.R.; Raman, A. Making Supply Meet Demand in an Uncertain World; Harvard Business Review: Boston, MA, USA, 1994. [Google Scholar]
- Kahn, K.B.; Mentzer, J.T. Logistics and Interdepartmental Integration. Int. J. Phys. Distrib. Logist. Manag. 1996, 26, 6–14. [Google Scholar] [CrossRef]
- Chen, I.J.; Paulraj, A. Understanding Supply Chain Management: Critical Research and a Theoretical Framework. Int. J. Prod. Res. 2004, 42, 131–163. [Google Scholar] [CrossRef]
- Zhao, X.; Huo, B.; Selen, W.; Yeung, J.H.Y. The Impact of Internal Integration and Relationship Commitment on External Integration. J. Oper. Manag. 2011, 29, 17–32. [Google Scholar] [CrossRef]
- Kahn, K.B.; Mentzer, J.T. Marketing’s Integration with Other Departments. J. Bus. Res. 1998, 42, 53–62. [Google Scholar] [CrossRef] [Green Version]
- Sabath, R. Volatile Demand Calls for Quick Response: The Integrated Supply Chain. Logist. Inf. Manag. 1995, 8, 49–52. [Google Scholar] [CrossRef]
- Frohlich, M.T.; Westbrook, R. Arcs of Integration: An International Study of Supply Chain Strategies. J. Oper. Manag. 2001, 19, 185–200. [Google Scholar] [CrossRef]
- Lai, K.H.; Cheng, T.C.E.; Yeung, A.C.L. Relationship Stability and Supplier Commitment to Quality. Int. J. Prod. Econ. 2005, 96, 397–410. [Google Scholar] [CrossRef] [Green Version]
- Celly, K.S.; Spekman, R.E.; Kamauff, J.W. Technological Uncertainty, Buyer Preferences and Supplier Assurances: An Examination of Pacific Rim Purchasing Arrangements. J. Int. Bus. Stud. 1999, 30, 297–316. [Google Scholar] [CrossRef]
- Liu, Y.; Li, Y.; Tao, L.; Wang, Y. Relationship Stability, Trust and Relational Risk in Marketing Channels: Evidence from China. Ind. Mark. Manag. 2008, 37, 432–446. [Google Scholar] [CrossRef]
- Narasimhan, R.; Kim, S.W.; Tan, K.C. An Empirical Investigation of Supply Chain Strategy Typologies and Relationships to Performance. Int. J. Prod. Res. 2008, 46, 5231–5259. [Google Scholar] [CrossRef]
- Davis, T. Effective Supply Chain Management. Sloan Manag. Rev. 1993, 34, 35–46. [Google Scholar]
- Fynes, B.; de Búrca, S.; Marshall, D. Environmental Uncertainty, Supply Chain Relationship Quality and Performance. J. Purch. Supply Manag. 2004, 10, 179–190. [Google Scholar] [CrossRef]
- Wong, C.Y.; Boon-itt, S.; Wong, C.W.Y. The contingency effects of environmental uncertainty on the relationship between supply chain integration and operational performance. J. Oper. Manag. 2011, 29, 604–615. [Google Scholar] [CrossRef]
- Chen, Y.C.; Tang, S.M.; Lee, C.J. A Study on the Relationships among the Environmental Uncertainty, Information Strategy, Organization Communication and Performance. J. Inf. Manag. 2010, 17, 47–79. [Google Scholar]
- Chang, H.H. The Influence of Continuous Improvement and Performance Factors in TQM Organizations. Total Qual. Manag. Bus. Excel. 2005, 16, 413–437. [Google Scholar] [CrossRef]
- Neely, A.; Gregory, M.; Platts, K. Performance measurement system design. Int. J. Oper. Prod. Manag. 1995, 15, 80–116. [Google Scholar] [CrossRef]
- Beamon, B.M. Measuring supply chain performance. Int. J. Oper. Prod. Manag. 1996, 19, 275–292. [Google Scholar] [CrossRef]
- Flynn, B.B.; Huo, B.; Zhao, X. The Impact of Supply Chain Integration on Performance: A Contingency and Configuration Approach. J. Oper. Manag. 2010, 28, 58–71. [Google Scholar] [CrossRef]
- Ettlie, J.E.; Stoll, H.W. Managing the Design-Manufacturing Process; McGraw-Hill: New York, NY, USA, 1990. [Google Scholar]
- Rosenzweig, E.D.; Roth, A.V.; Dean, J.W. The Influence of an Integration Strategy on Competitive Capabilities and Business Performance: An Exploratory Study of Consumer Products Manufacturers. J. Oper. Manag. 2003, 21, 437–456. [Google Scholar] [CrossRef]
- Flynn, B.B.; Flynn, J. Information-Processing Alternatives for Coping with Manufacturing Environment Complexity. Decis. Sci. 1999, 17, 249–269. [Google Scholar] [CrossRef]
- Narasimhan, R.; Jayaram, J. Causal Linkages in Supply Chain Management: An Exploratory Study of North American Manufacturing Firms. Decis. Sci. 1998, 29, 579–605. [Google Scholar] [CrossRef]
- Swink, M.; Narasimhan, R.; Wang, C. Managing beyond the Factory Walls: Effects of Four Types of Strategic Integration on Manufacturing Plant Performance. J. Oper. Manag. 2007, 25, 148–164. [Google Scholar] [CrossRef]
- Scannell, T.V.; Vickery, S.K.; Dröge, C.L. Upstream Supply Chain Management and Competitive Performance in the Automotive Supply Chain Industry. J. Bus. Logist. 2000, 21, 23–48. [Google Scholar]
- Lamming, R. Beyond Partnership—Strategies for Innovation and Lean Supply; Prentice-Hall: New York, NY, USA, 1993. [Google Scholar]
- Stank, T.P.; Keller, S.B.; Daugherty, P.J. Supply Chain Collaboration and Logistical Service Performance. J. Bus. Logist. 2001, 22, 29–48. [Google Scholar] [CrossRef]
- Fowler, F.J., Jr. Survey Research Methods; SAGE: Nashville, TN, USA, 1993. [Google Scholar]
- Nunnally, J. Psychometric Theory; McGraw-Hill: New York, NY, USA, 1978. [Google Scholar]
- Flynn, B.B.; Sakakibara, S.; Schroeder, R.G.; Bates, K.A.; Flynn, E.J. Empirical Research Methods in Operations Management. J. Oper. Manag. 1990, 9, 250–284. [Google Scholar] [CrossRef]
- Cousins, P.D.; Menguc, B. The implications of socialization and integration in supply chain management. J. Oper. Manag. 2006, 24, 604–620. [Google Scholar] [CrossRef]
- Gulati, R.; Sytch, M. Dependence asymmetry and joint dependence in interorganizational relationships: Effects of embeddedness on a manufacturer’s performance in procurement relationships. Adm. Sci. Q. 2007, 52, 32–69. [Google Scholar] [CrossRef] [Green Version]
Figure 1.
Research framework—relationship stability with suppliers. * p < 0.1; ** p < 0.05; *** p < 0.01.
Figure 1.
Research framework—relationship stability with suppliers. * p < 0.1; ** p < 0.05; *** p < 0.01.

Figure 2.
Research framework—relationship stability with customers. * p < 0.1; *** p < 0.01.


Table 1.
Variables and corresponding measures.
| Variables | Measures | References |
|---|---|---|
| Internal Integration |
| Narasimhan and Kim [22]; Flynn et al. [49]; Stank et al. [58] |
| Supplier Integration |
| Narasimhan and Kim [22]; Flynn et al. [49] |
| Customer Integration |
| Narasimhan and Kim [22]; Flynn et al. [49] |
| Relationship Stability with Suppliers |
| Lai et al. [38]; Celly et al. [39]; Liu et al. [40] |
| Relationship Stability with Customers |
| Lai et al. [38]; Celly et al. [39]; Liu et al. [40] |
| Environmental Uncertainty |
| Wong and Boon-itt [30]; Wong et al. [44] |
| Performance |
| Fynes et al. [43]; Flynn et al. [49] |
Table 2.
Demographic characteristics of respondents.
| Sample Characteristics | Number of Samples | Percentage | |
|---|---|---|---|
| Industry | Electronics | 167 | 30% |
| Plastics | 113 | 20% | |
| Trade | 96 | 17% | |
| Textiles | 57 | 10% | |
| Electrical | 40 | 7% | |
| Chemical | 32 | 6% | |
| Papermaking | 32 | 6% | |
| Other | 29 | 5% | |
| Company Capital | Less than 10 million TWD (inclusive) | 100 | 18% |
| 10 million TWD–30 million TWD | 112 | 20% | |
| 30 million TWD–50 million TWD | 124 | 22% | |
| 50 million TWD–80 million TWD | 116 | 21% | |
| 80 million TWD–100 million TWD | 94 | 17% | |
| More than 100 million TWD | 50 | 9% | |
| Length of partnership with major suppliers | Less than 5 years | 124 | 22% |
| 6–10 years | 256 | 45% | |
| 11–15 years | 95 | 17% | |
| 16–20 years | 67 | 12% | |
| 21–25 years | 16 | 3% | |
| More than 26 years | 8 | 1% | |
| Length of partnership with major customers | Less than 5 years | 144 | 25% |
| 6–10 years | 225 | 40% | |
| 11–15 years | 105 | 19% | |
| 16–20 years | 72 | 13% | |
| 21–25 years | 14 | 2% | |
| More than 26 years | 6 | 1% | |
Table 3.
Reliability and validity.
| Variables | Measure Items | Factor Loading | Cronbach’s α | KMO and Bartlett Test Results |
|---|---|---|---|---|
| Internal Integration | II1 II2 II3 II4 | 0.77 0.81 0.87 0.78 | 0.892 | KMO = 0.835 χ2 of Bartlett test = 184.08 p-value of Bartlett test = 0.000 Accumulated explained variance = 75.63% |
| Supplier Integration | SI1 SI2 SI3 SI4 SI5 | 0.56 0.83 0.79 0.68 0.79 | 0.853 | KMO = 0.768 χ2 of Bartlett test = 154.66 p-value of Bartlett test = 0.000 Accumulated explained variance = 66.16% |
| Customer Integration | CI1 CI2 CI3 CI4 CI5 | 0.73 0.59 0.73 0.70 0.72 | 0.809 | KMO = 0.826 χ2 of Bartlett test = 166.22 p-value of Bartlett test = 0.000 Accumulated explained variance = 66.78% |
| Relationship Stability with Suppliers | RS11 | 0.85 | 0.712 | KMO = 0.699 χ2 of Bartlett test = 194.72 p-value of Bartlett test = 0.000 Accumulated explained variance = 64.08% |
| RS12 | 0.84 | |||
| RS13 | 0.86 | |||
| Relationship Stability with Customers | RS21 | 0.78 | 0.735 | KMO = 0.613 χ2 of Bartlett test = 141.36 p-value of Bartlett test = 0.000 Accumulated explained variance = 59.88% |
| RS22 | 0.59 | |||
| RS23 | 0.90 | |||
| Environmental Uncertainty | EU1 EU2 EU3 EU4 EU5 EU6 EU7 EU8 | 0.87 0.74 0.68 0.89 0.83 0.72 0.65 0.70 | 0.775 | KMO = 0.768 χ2 of Bartlett test = 134.91 p-value of Bartlett test = 0.000 Accumulated explained variance = 69.77% |
| Performance | SP1 SP2 SP3 SP4 SP5 | 0.62 0.83 0.66 0.78 0.70 | 0.735 | KMO = 0.751 χ2 of Bartlett test = 151.25 p-value of Bartlett test = 0.000 Accumulated explained variance = 63.22% |
Table 4.
Supply chain integration and relationship stability with suppliers.
| Variable | Model 0 | Model 1 | Model 2 |
|---|---|---|---|
| Capital | 0.01 | −0.06 | −0.05 |
| Number of employees | −0.05 | 0.01 | 0.03 |
| Length of partnership | 0.02 | 0.03 | 0.03 |
| Internal integration | 0.28 ** | 0.30 ** | |
| Supply chain integration | 0.27 ** | 0.26 ** | |
| Internal integration × environmental uncertainty | 0.12 * | ||
| Supplier integration × environmental uncertainty | 0.07 | ||
| R2 | 0.003 | 0.24 | 0.28 |
| △R2 | 0.003 | 0.21 | 0.04 |
| F value | 0.19 *** | 11.07 *** | 8.54 *** |
* p < 0.1; ** p < 0.05; *** p < 0.01.
Table 5.
Supply chain integration and relationship stability with customers.
| Variable | Model 0 | Model 1 | Model 2 |
|---|---|---|---|
| Capital | 0.07 | 0.08 | 0.08 |
| Number of employees | −0.13 | −0.10 | −0.07 |
| Length of partnership | 0.05 | 0.04 | 0.02 |
| Internal integration | 0.25 * | 0.22 * | |
| Customer integration | 0.18 ** | 0.20 * | |
| Internal integration × environmental uncertainty | 0.15 * | ||
| Customer integration × environmental uncertainty | 0.06 | ||
| R2 | 0.06 | 0.18 | 0.22 |
| △R2 | 0.06 | 0.12 | 0.04 |
| F value | 0.79 *** | 6.77 *** | 5.62 *** |
* p < 0.1; ** p < 0.05; *** p < 0.01.
Table 6.
Mediating effect of relationship stability.
| Dependent Variable: Supply Chain Performance | ||||
|---|---|---|---|---|
| Predictor Variables | Model 1 | Model 2 | Model 3 | Model 4 |
| Supply chain integration Internal integration | 0.44 *** 0.19 * | 0.20 * | 0.36 *** 0.11 | 0.14 * |
| Customer integration | 0.42 *** | 0.34 *** | ||
| Relationship stability with suppliers | 0.30 *** | |||
| Relationship stability with customers | 0.32 *** | |||
| R2 | 0.33 | 0.32 | 0.40 | 0.40 |
| △R2 | 0.32 | 0.31 | 0.38 | 0.39 |
| F value | 35.09 *** | 34.03 *** | 31.52 *** | 32.68 *** |
* p < 0.1; *** p < 0.01.
Table 7.
Sobel analysis results.
| Variable | Sobel Z Value | Test Result |
|---|---|---|
| Mediating effect of relationship stability with suppliers | ||
| Supply chain integration | 3.53 | Significant |
| Internal integration | 3.76 | Significant |
| Mediating effect of relationship stability with customers | ||
| Customer integration | 3.36 | Significant |
| Internal integration | 3.29 | Significant |
Table 8.
Results of the testing of hypotheses.
| Hypothesis | Content | Test Result |
|---|---|---|
| H1 | Internal integration has a positive effect on relationship stability. | Supported |
| H2 | Supplier integration has a positive effect on relationship stability. | Supported |
| H3 | Customer integration has a positive effect on relationship stability. | Supported |
| H4 | Relationship stability has a positive effect on supply chain performance. | Supported |
| H5 | Under higher environmental uncertainty, supplier integration has a stronger relationship with relationship stability than under lower environmental uncertainty. | Not supported |
| H6 | Under higher environmental uncertainty, customer integration has a stronger relationship with relationship stability than under lower environmental uncertainty. | Not supported |
| H7 | Under higher environmental uncertainty, internal integration has a stronger relationship with relationship stability than under lower environmental uncertainty. | Supported |
Publisher’s Note: MDPI stays neutral with regard to jurisdictional claims in published maps and institutional affiliations. |
© 2020 by the authors. Licensee MDPI, Basel, Switzerland. This article is an open access article distributed under the terms and conditions of the Creative Commons Attribution (CC BY) license (http://creativecommons.org/licenses/by/4.0/).
Share and Cite
MDPI and ACS Style
Yeh, T.-M.; Pai, F.-Y.; Wu, L.-C. Relationship Stability and Supply Chain Performance for SMEs: From Internal, Supplier, and Customer Integration Perspectives. Mathematics 2020, 8, 1902. https://doi.org/10.3390/math8111902
AMA Style
Yeh T-M, Pai F-Y, Wu L-C. Relationship Stability and Supply Chain Performance for SMEs: From Internal, Supplier, and Customer Integration Perspectives. Mathematics. 2020; 8(11):1902. https://doi.org/10.3390/math8111902
Chicago/Turabian StyleYeh, Tsu-Ming, Fan-Yun Pai, and Liang-Chuan Wu. 2020. "Relationship Stability and Supply Chain Performance for SMEs: From Internal, Supplier, and Customer Integration Perspectives" Mathematics 8, no. 11: 1902. https://doi.org/10.3390/math8111902
Note that from the first issue of 2016, this journal uses article numbers instead of page numbers. See further details here.