Article

The Impact of Candidates’ Profile and Campaign Decisions in Electoral Results: A Data Analytics Approach

by
Camilo Campos-Valdés
1,2,
Eduardo Álvarez-Miranda
3,*,
Mauricio Morales Quiroga
4,
Jordi Pereira
5 and
Félix Liberona Durán
6
1
Doctorado en Sistemas de Ingeniería, Facultad de Ingeniería, Universidad de Talca, Curicó 3340000, Chile
2
Facultad de Ingeniería, Universidad Autónoma de Chile, 5 Poniente 1670, Talca 3460000, Chile
3
School of Economics and Business, Universidad de Talca, Talca 3460000, Chile
4
Departamento de Ciencia Política y Administración Pública, Facultad de Ciencias Jurídicas y Sociales, Universidad de Talca, Santiago 8320000, Chile
5
Faculty of Engineering and Sciences, Universidad Adolfo Ibáñez, Av. Padre Hurtado 750, Viña del Mar 2520000, Chile
6
Escuela de Postgrado, Facultad de Arquitectura y Urbanismo, Universidad de Chile, Santiago 8320000, Chile
*
Author to whom correspondence should be addressed.
Mathematics 2021, 9(8), 902; https://doi.org/10.3390/math9080902
Submission received: 7 March 2021 / Revised: 3 April 2021 / Accepted: 12 April 2021 / Published: 19 April 2021

Abstract

:
In recent years, a wide range of techniques has been developed to predict electoral results and to measure the influence of different factors in these results. In this paper, we analyze the influence of the political profile of candidates (characterized by personal and political features) and their campaign effort (characterized by electoral expenditure and by territorial deployment strategies retrieved from social networks activity) on the electoral results. This analysis is carried out by using three of the most frequent data analyitcs algorithms in the literature. For our analysis, we consider the 2017 Parliamentary elections in Chile, which are the first elections after a major reform of the electoral system, that encompassed a transition from a binomial to a proportional system, a modification of the districts’ structure, an increase in the number of seats, and the requirement of gender parity in the lists of the different coalitions. The obtained results reveal that, regardless of the political coalition, the electoral experience of candidates, in particular in the same seat they are running for (even when the corresponding district is modified), is by large the most influential factor to explain the electoral results. However, the attained results show that the influence of other features, such as campaign expenditures, depends on the political coalition. Additionally, by means of a simulation procedure, we show how different levels of territorial deployment efforts might impact on the results of candidates. This procedure could be used by parties and coalitions when planning their campaign strategies.

1. Introduction and Motivation

Electoral systems are distributive political institutions that are formed by transforming votes into seats [1]. Therefore, the natural goal of the candidates is to maximize their electoral advantage (i.e., win the number of votes that will allow them to access the presidential seat or a seat in the parliament), an interest that extends to parties and coalitions, which seek to outperform their political opposition in the number of elected representatives. To maximize these advantages, parties must make two critical decisions: (i) select the candidates with the greatest potential to be elected—usually incumbents—and (ii) design their campaign strategies, either aiming at reinforcing the allegiance of voters already aligned with the party or its candidates—called personal votes—or at seeking the support of the other part of the electoral register.
A fundamental input for these purposes is to estimate the potential impact of campaign decisions on the electoral process outcomes. Such estimations have been carried out both at individual and coalition levels. In the individual case, election outcomes have been forecast based on the political profile of a candidate and/or the profile of the voters of the respective electoral district; examples of this type of forecasting are seen in the parliamentary elections of 2010 in the USA (see [2]) or in the 2017 presidential and parliamentary elections in Chile (see [3]). In the case of coalitions, a typical feature of parliamentary systems, the goal is to predict the “share” or “quota” of votes that parties or coalitions will receive; examples such prediction analysis have been presented for recent elections in the UK (see [4]), in the USA (see [5]), and in Germany (see [6]).
In addition to rather standard personal and political features of candidates and voters, as well as standard campaigning decisions, current electoral processes seem to be strongly influenced by the social networks activity of the candidates as well of the voters. As a matter of fact, over the last decade, a large of body of literature has been devoted to the analysis and development of data analytics methods for predicting as well as understanding electoral results using the analysis of social networks activity data. Evidently, Twitter and Facebook are likely to be the most interesting sources of data, due to the large number of users and media coverage. Some interesting examples of methods devoted to predicting the share of votes of parties or coalitions can be found in [7] (where the 2009 federal elections in Germany are analyzed), in [5] (for the 2010–2012 electoral cycles in the US), in [8] (for the 2010 national elections in The Netherlands), and in [4] (where the 2015 UK general elections are studied). Additionally, several authors have further exploited the information on social networks and have developed classification methods, i.e., methods that allow predicting the class (e.g., winner or loser, or, alternatively, elected or nonelected) that a given candidate, party, or coalition, will have after the election. For instance, [2,9] developed logistic regression models using information contained in social networks to classify winners and losers in the 2010 electoral senator and governor race in the US. Despite of the positive influence of social network activity data on the prediction capacity of data analytics methods (as in the case of the previously mentioned references), recent studies, such as [10], show that the exponential increase of the number of social network users, might hinder the performance of current data analytics methods. This is not only due to the capacity of handling massive amounts of data, but rather due to the difficulties in capturing the social and political complexities of voters (see [11], and the references therein, for a discussion on these issues). Moreover, data analytics on social networks activity is not only used for analyzing elections ex-post (as most of the academic research is focused on); a new industry has emerged over the last years as the number of political data analytics companies, focused on data-driven campaigning and voter targeting, has rapidly increased over the last years (we refer the reader to [12], for a recent overview of the political data analytics industry).
Another crucial element that influences electoral results, especially in parliamentary and representative elections, is district composition. As a matter of fact, several authors have studied the Gerrymandering phenomenon, describing how the rearrangement of districts has been used by incumbents to take advantage themselves—or their coalitions—in future elections (see, e.g., [13,14,15]). Interestingly, while there may be some districts which can be gerrymandered to protect incumbents, the overall picture reveals that there is no evidence that verifies a systematic consequence of this phenomenon. One of the first efforts to elucidate the causes that cause the so-called “marginal seats” in a district is presented in [16]; that is, districts in which the winners win by a small majority, without finding significant links between redistricting and advantages for the incumbents. More recently, [17] analyze the US presidential elections for 1980, 1988 and 2000, both before and after the manipulation of district boundaries; it is empirically demonstrated, from a bipartisan perspective, that, on average, the manipulation of district boundaries had an impact no greater than a 2% advantage for incumbents, and even negatively affecting candidates of a certain party.
In this paper, we consider the situation when district redesign implies that current districts are merged into larger ones, and an increase in the total number of seats. Hence, incumbents face a territory that contains a portion of her/his personal votes (i.e., the old district), and a portion of the personal votes of the incumbent of the new part of the district; in other words, incumbents are, at some extent, partial challengers. In consequence, incumbents and challengers must decide on the best strategy between (i) trusting that the portion of personal votes will suffice, (ii) making efforts to maintain the loyalty of personal votes, or (iii) setting out to gain personal votes of other incumbents to increase the chances of being elected. To the best of our knowledge, this is one of the first efforts to analyze this situation.
Contribution and Paper outline The main goal of the present study is to analyze how candidates’ profile and campaign efforts influenced on the result of the Chilean parliamentary election in 2017, which takes place after an important reform in the electoral system: the end of the binomial system, the increase in the number of seats in the parliament, the requirement of gender parity in the lists of the different coalitions, and the redesign of electoral districts. In particular, we measure campaign efforts by campaign expenditure and by the territorial deployment (a concept coined in this paper) of individuals and/or coalitions; territorial deployment refers to the effort of a candidate (or coalition) to visit, during the campaign, the communes belonging to her/his district. This effort is characterized by different indicators, such as the contrast between individual and coalition-wise visits, the percentage of visited communes, as well as the number of visits to new communes in the district compared to visits to communes belonging to the previous district. The information required for assessing the territorial deployment of candidates is obtained, when available, from social networks. To the best of our knowledge, this is one of the first works considering, simultaneously, these dimensions in electoral performance prediction.
Our data analytics approach is based on the use of three supervised machine learning methods: (i) classification and regression trees (CART), (ii) random forest (RF) and (iii) multinomial logistic regression (mLogit). The results show a good performance of the three implemented algorithms, with an accuracy greater than 90% (comparable with other classification studies). Additionally, the influence of different levels of territorial deployment is studied by performing a sensitivity analysis using the machine learning method achieving the best performance. In this way, the study provides a tool for the design of effort strategies and the allocation of resources to maximize performance in electoral outcomes that may be of interest to campaign decision makers (e.g., candidates, coalitions, political scientists).
Considering the existing literature, and the quality of the attained results, and our contribution is threefold: (i) we introduce the concept of territorial deployment, which might encode a variety of variables associated to the way that candidates and coalitions organize their campaigning agenda with respect to the territory that they represent; (ii) we show that, regardless of the unusual situation induced by the rearrangement of districts (which turns some of the incumbents into partial challengers), incumbency remains as a key feature of candidates in the electoral process; and (iii) we present valuable insights regarding how the influence of the considered variables depends on the political coalition of candidates (in particular, when analyzing the performance of recently-established coalitions).
The paper is organized as follows. In Section 2 we first describe the institutional context of the 2017 Chilean parliamentary elections and then describe the proposed methodology; data retrieval, data curation and variable definition is presented in Section 2.2, data mining methods are introduced in  Section 2.3 and implementation details are presented Section 2.4. Results and discussion are presented in Section 3. Conclusions and final remarks are drawn in Section 4.

2. Data and Methods

This section describes the methodologies used to analyze the impact of the candidate’s profile and campaign efforts on the outcomes obtained in the 2017 Chilean parliamentary election. Based on data available from the Chilean Electoral Service [SERVEL] [18], which includes the statement of expenditures for each campaign, and information available from the candidates’ official Facebook accounts, the electoral performance of the candidates for deputies in the parliamentary elections of 19 November 2017 in Chile is analyzed. The sample includes all posts from official candidate Facebook accounts, between 20 August and 15 November 2017. This social network is used as it has the highest penetration in Chile during the campaign period [19,20].

2.1. Parliamentary Elections in Chile in 2017

The 2017 parliamentary elections in Chile occurred after the first reform since the return to democracy in 1990, whose main modifications were (i) replacing the binomial system with a more inclusive open-list proportional one, based on the D’Hondt method (see, e.g., [21,22]), (ii) increasing the representativeness of regions, (iii) decreasing the number of constituencies (in the case of Senators) and districts (in the case of Deputies), (iv) incorporating the quota law and (v) reducing barriers for independent candidates [18].
In the case of the Senators, the new constituencies coincide territorially with the 15 administrative regions of the country; therefore, no district design is necessary. On the other hand, in the case of the Deputies, the 35 districts were merged into 28 new districts, thus, some incumbents must not only seek for electors in the cities that elected them but also in the new cities that comprise the corresponding district (and these new cities might, in turn, correspond to the previous district of other candidate who faces an equivalent situation). As noted above, according to the literature reviewed, a situation of this nature has not been studied to date. Therefore, it is interesting to analyze campaign decisions from the perspective of the different types of candidates: the incumbents who trusted that personal votes would be sufficient to win the elections, the incumbents who carried out a territorial deployment around areas of the districts acting as challengers, and the challengers who campaign in large portion of the extension of each district.

2.2. Data and Variables

The models used for the previously described analysis are based on the characterization of the candidates through a set of attributes (independent variables) compared to those variables for which it is possible to predict their class (dependent variable). Given the nature of the elections, the class of a candidate is defined according to a combination of his or her political past and the outcome obtained in the elections, classified as Incumbent-Elected, Incumbent-Nonelected, Challenger-Elected and Challenger-Unelected. Likewise, and as mentioned above, the attributes are grouped into two dimensions: political profile of the candidate and campaign effort, which are described below.
Profile of the candidate Corresponds to the characterization of a candidate in three dimensions: personal information, political orientation and political experience.
  • Personal information: The gender variable is used, with the objective of detecting, on the one hand, the significant differences in access to resources by the candidates and, on the other hand, the effect of incorporating gender quotas (see [23,24], for details). Thus, if women have access to a lower campaign budget than men and this difference in resources explains the different electoral strategies, then it is likely that gender has an impact on electoral performance.
  • Political orientation: Since 1990, the party system in Chile has been built on the basis of two large coalitions [25]. Therefore, it is expected that the change to the electoral system-implemented by the center-left coalition-will favor the electivity of the most institutionalized parties. For this, the party or political conglomerate of the candidate is identified with the attribute coalition.
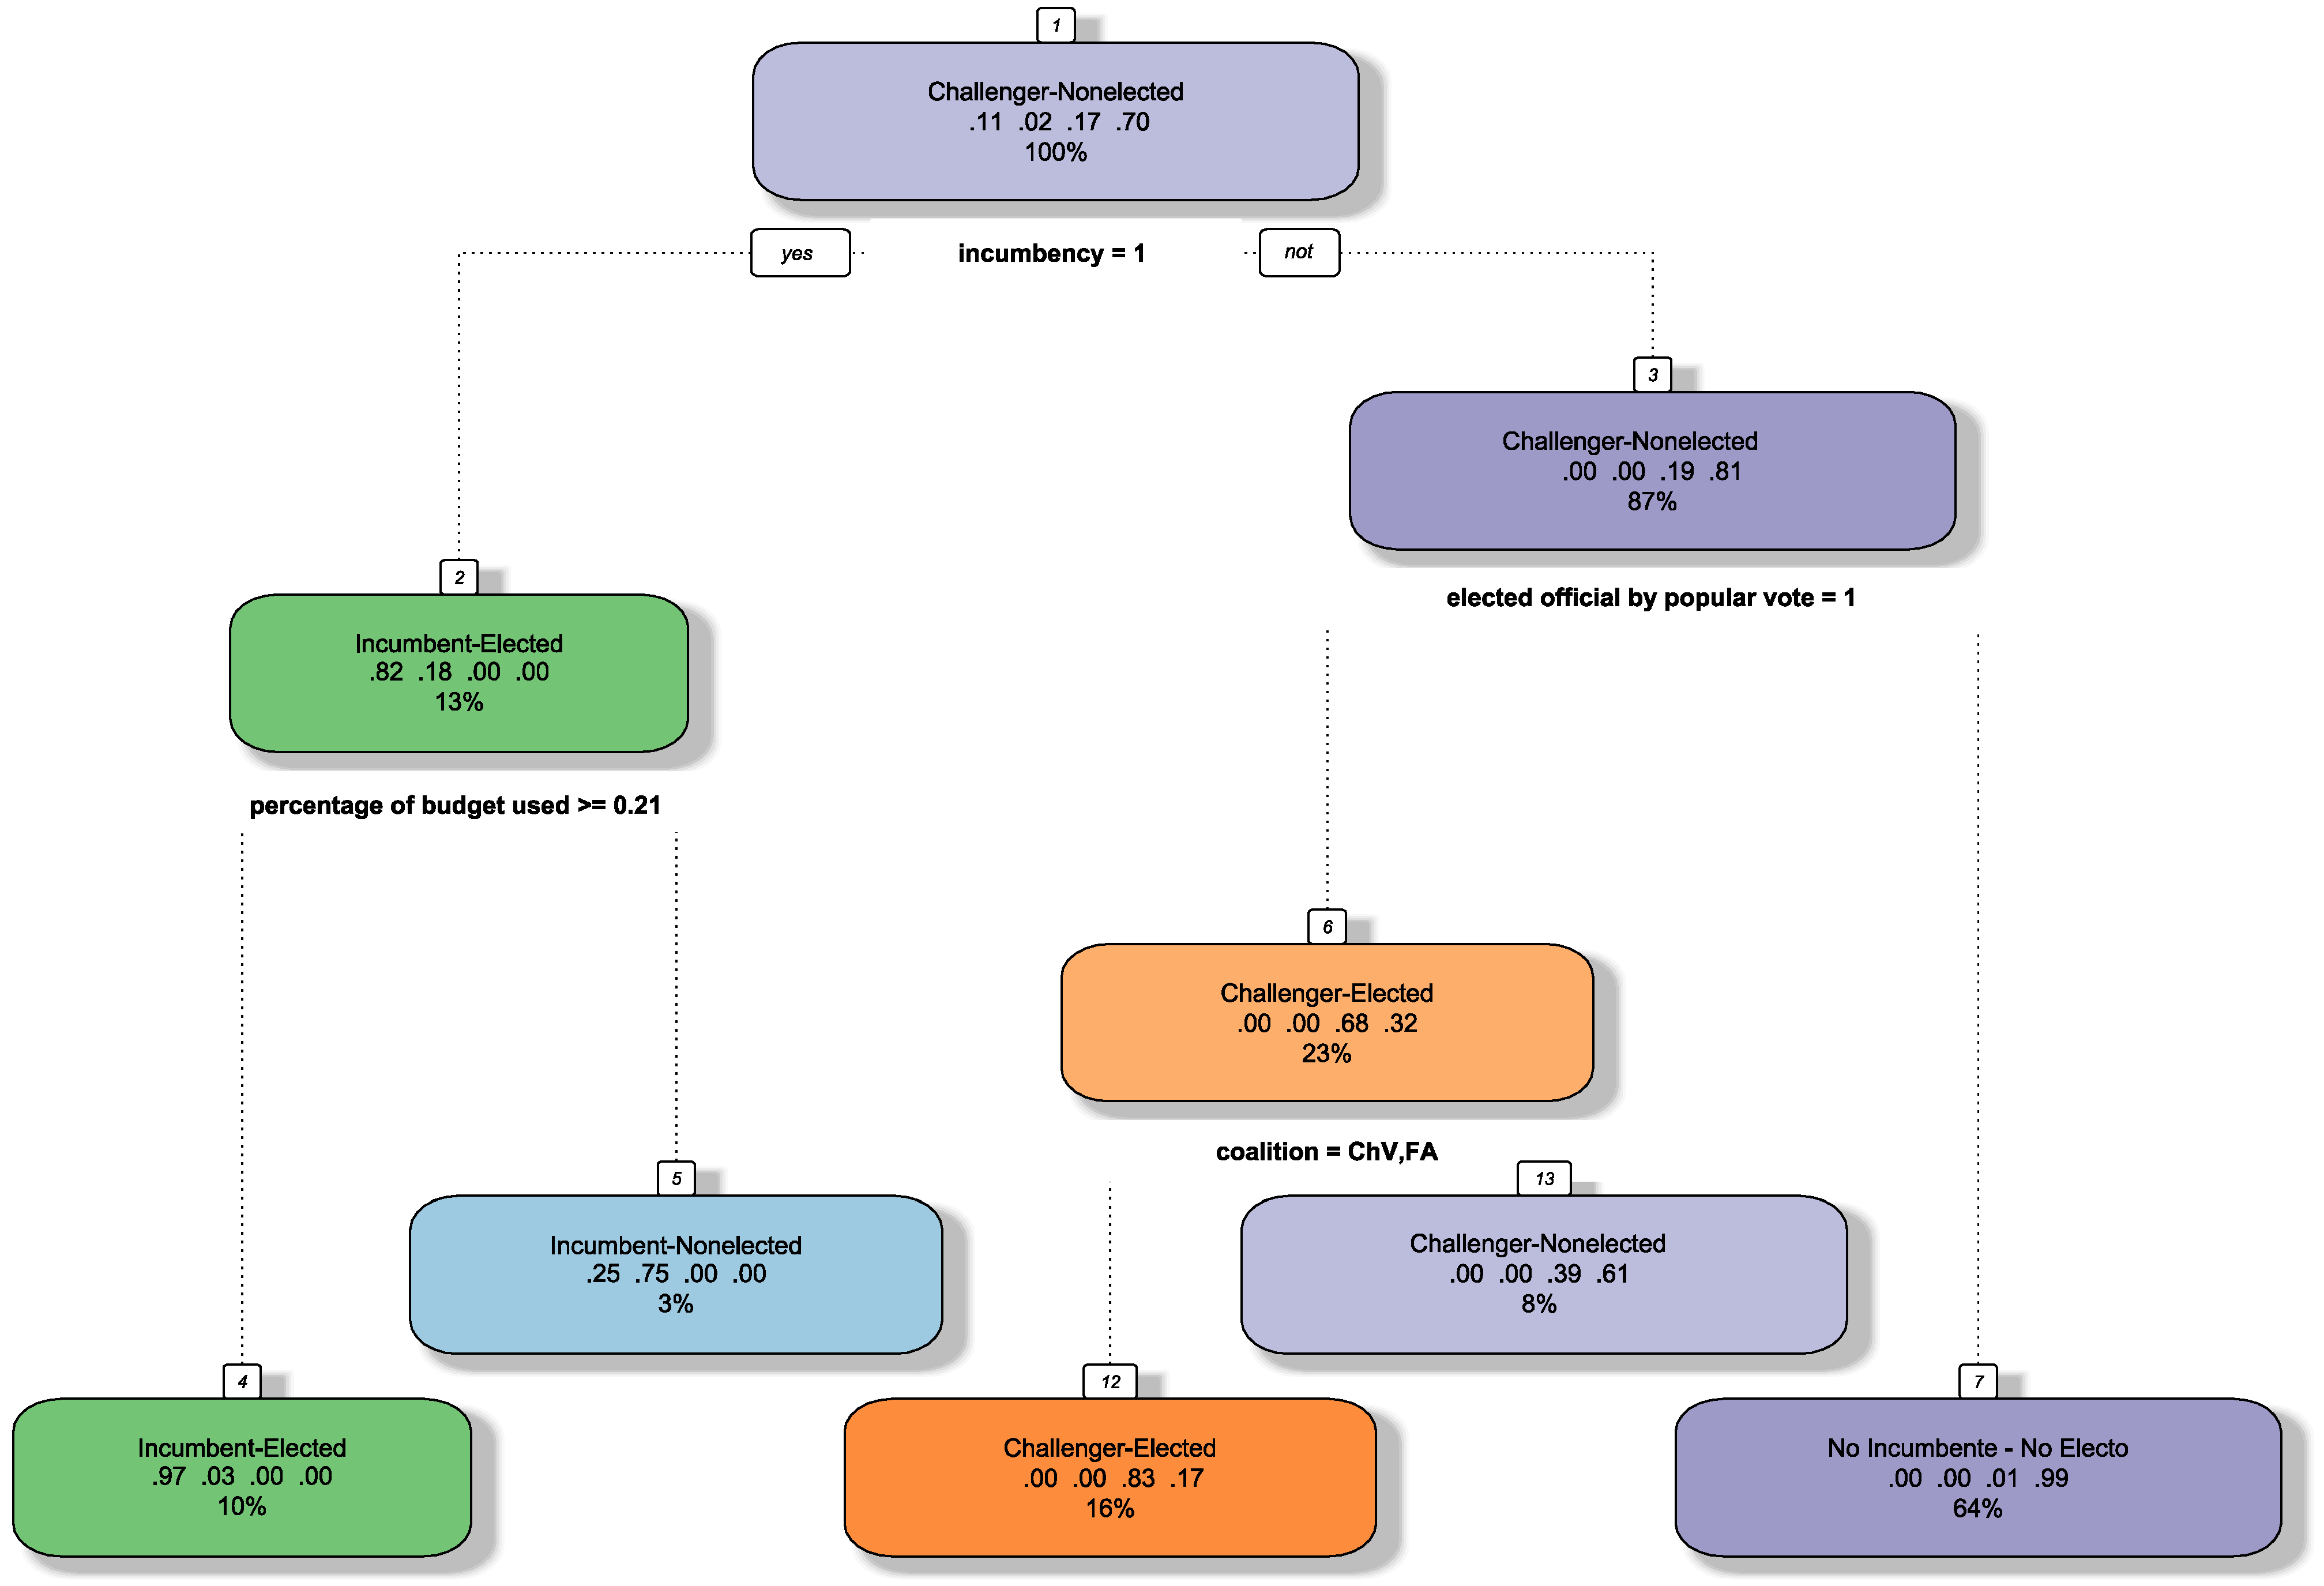
  • Political experience: The incumbency attribute is introduced to represent whether the candidate has held the same position to which he or she is running in the period prior to the elections under study, an idea that is based on his systematic superiority in electoral outcomes [26]. Additionally, the attribute of years in office is incorporated to study the impact of the time spent in the position for which he or she is running and an elected official by popular vote attribute to analyze the impact of candidates who have held positions of local representation (city councilors, mayors, governors, etc.) prior to the elections. The values of all the variables of this dimension were extracted from the Library of the National Congress of Chile [27].
Campaign effort This dimension includes different campaign decisions made by parties, which are implemented through the activities of its candidates, both through campaign spending, as through the territorial deployment made in the district in which they run [28]. Electoral spending by the candidates is a strong predictor of their electoral success [29,30,31,32], whether incumbent or challenging [26]. This attribute corresponds to the percentage of budget used, which represents the effective campaign spending by a candidate with respect to the maximum budget set by law. The values of this attribute were extracted from the candidates’ statement of expenditures available in Servel [33]. On the other hand, and given the changes in the district boundaries, it is necessary to analyze the impact of the territorial deployment strategies of candidates and coalitions. In the case of incumbents and challengers, these strategies are characterized by:
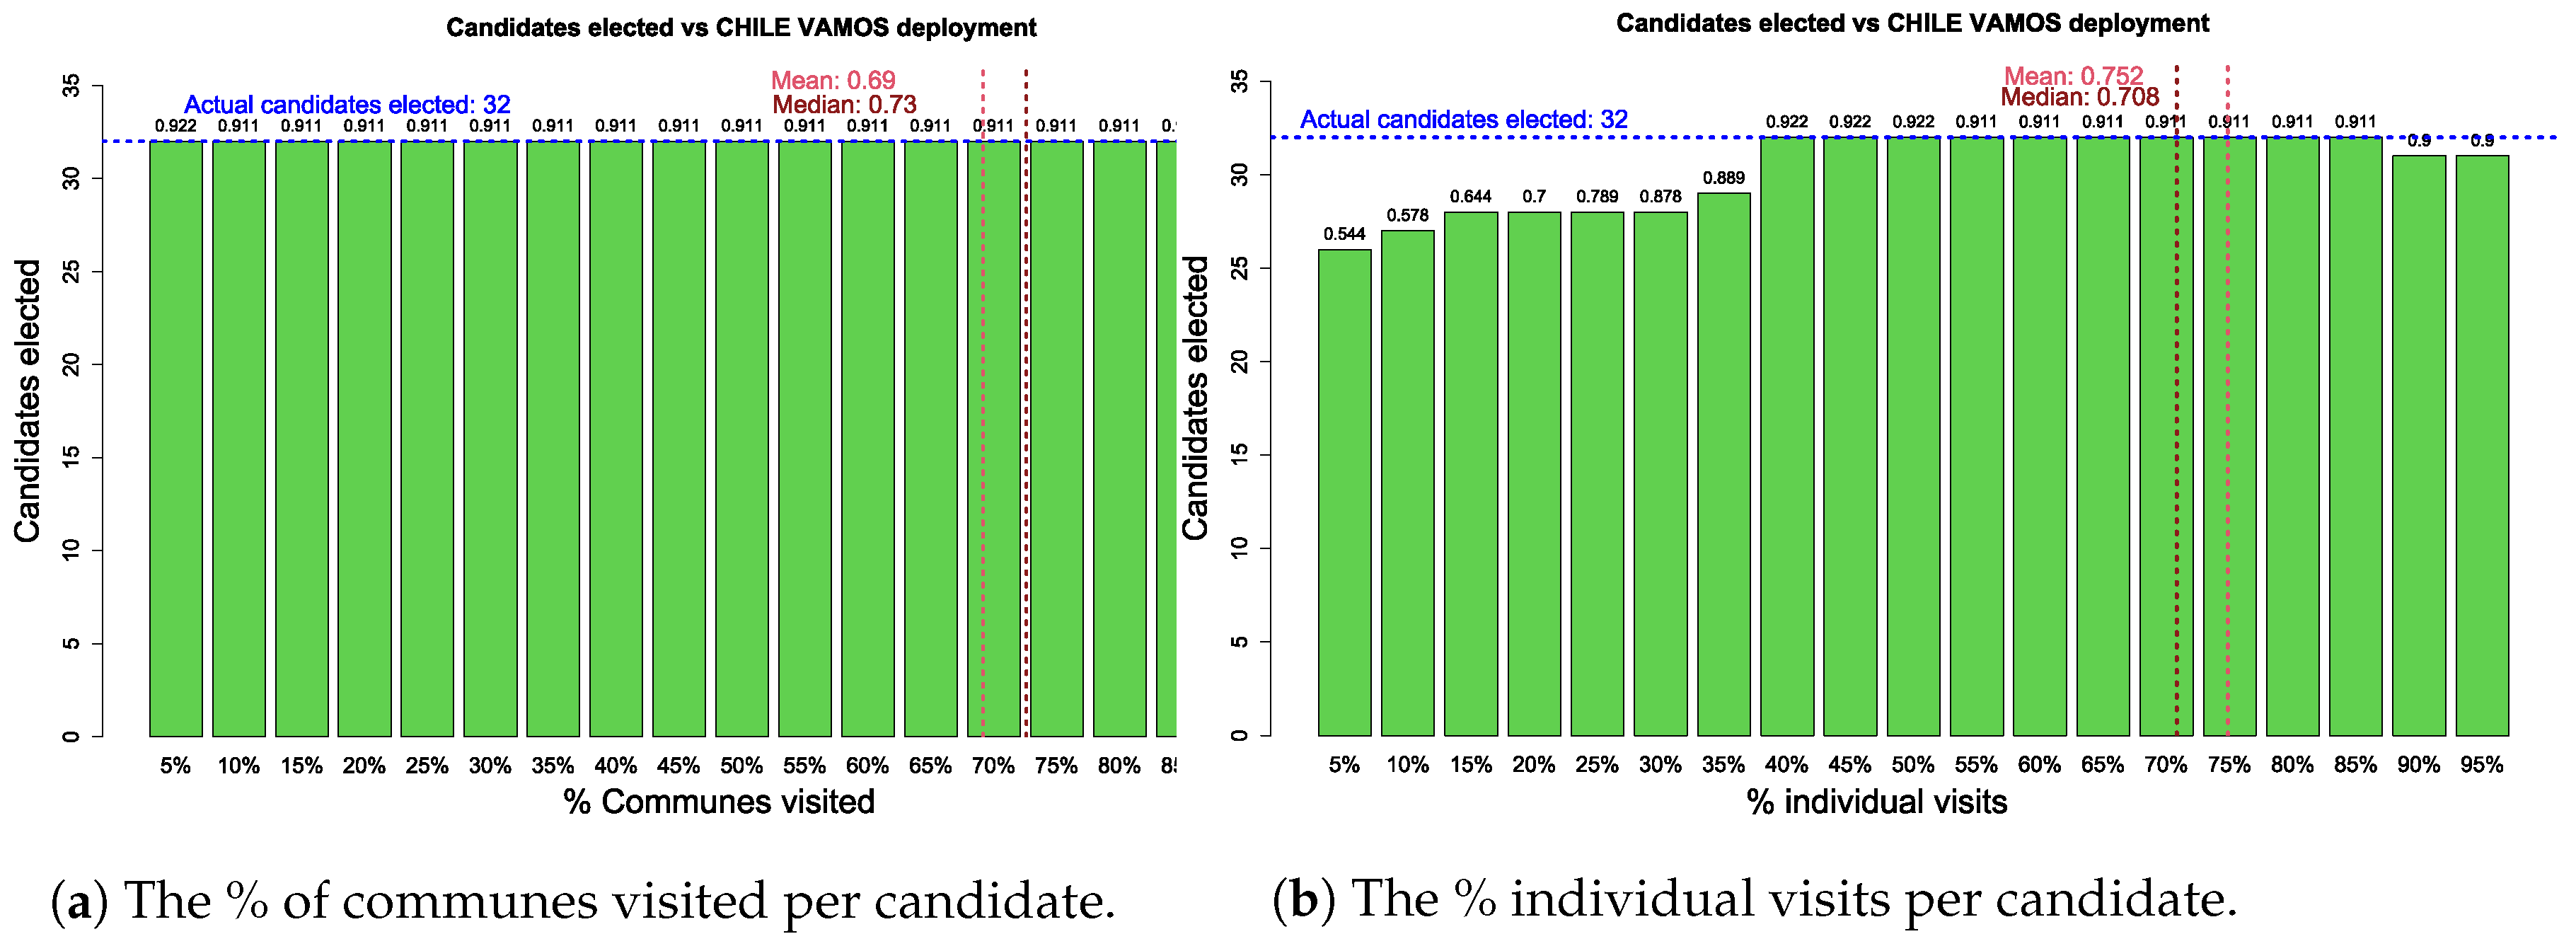
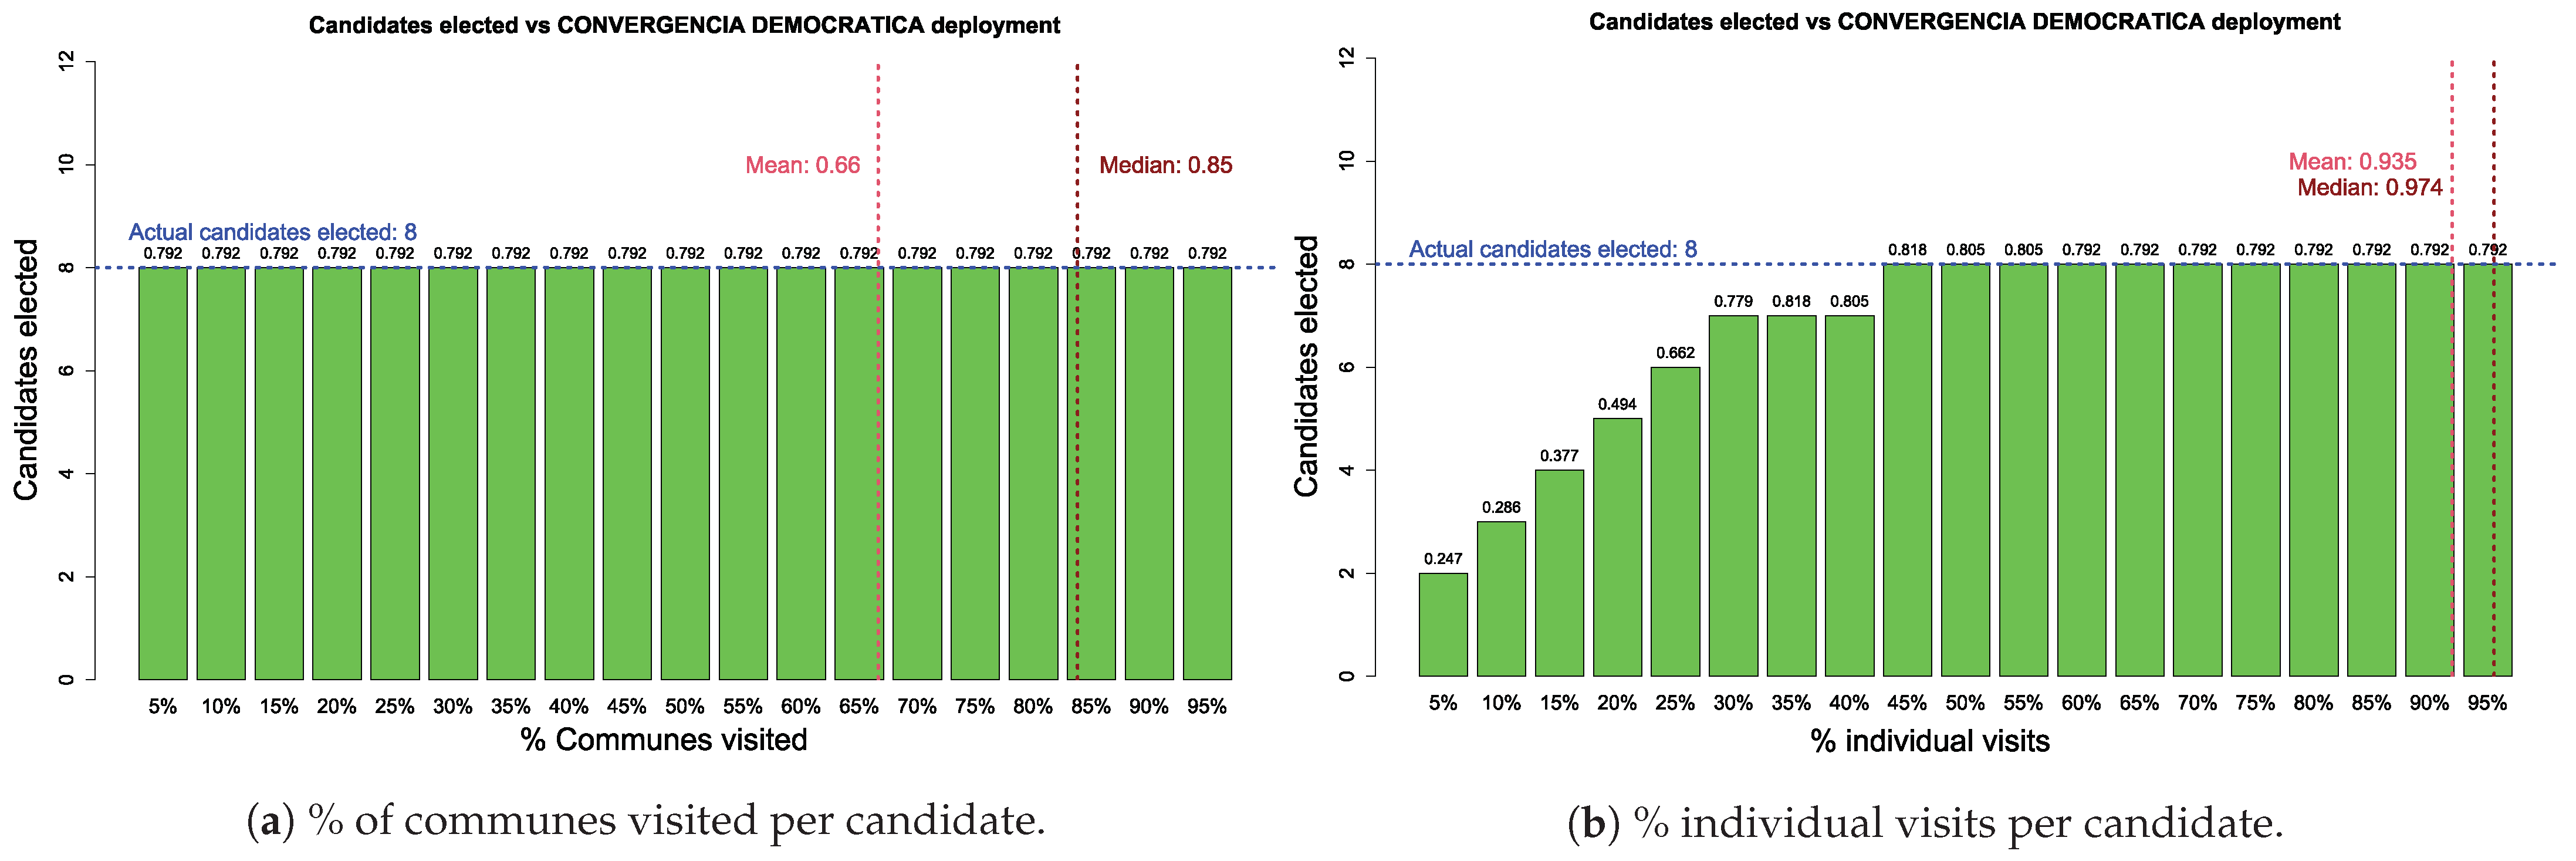
  • Percentage of communes visited, which corresponds to the fraction of communes in the district visited by the candidate.
  • Percentage of individual visits, which corresponds to the fraction of visits that the candidate makes without other candidates of his or her coalition.
In the case of incumbents, two additional attributes are considered:
3.
Percentage of visits to new communes, which corresponds to the fraction of visits made by the candidate to new communes in his district.
4.
Percentage of new communes visited, which corresponds to the fraction of new communes in the district that are visited by the candidate.
The values of these attributes were obtained through a semi-automatic text mining process applied to the wall posts from the candidates’ official Facebook accounts (if available). Facebook posts were retrieved on 8 July 2018, considering all posts made by candidates from 21 August until 15 November (four days before the election day, the last day that campaign activities were allowed). The official Facebook page of each candidate was searched, and each account was inspected and filtered (removing false accounts and those that do not provide territorial deployment information in their constituencies), obtaining a total of 294 accounts and 39,691 entries associated with territorial deployment activities. These entries allowed us to generate a record of visits to the communes of the district to which each candidate runs, as well as collaboration activities with other members of their coalition (If two candidates from the same coalition visited a commune on the same day, it is assumed that they developed collaborative activities.). The 294 candidates associated with those accounts correspond to the training sample.
Table 1 shows all the variables (and the type to which they correspond) classified by the two dimensions described above.
The dataset is divided into a training sample and a prediction sample (see Table 2). While the training sample is associated with the 294 candidates for whom we have retrieved territorial deployment records from their Facebook accounts, the prediction sample is associated with 551 candidates (for whom no Facebook account was available at the moment we initiated this study). From Table 2 we can observe that no territorial deployment data was available for any of the 10 independent candidates, while only one (out of ten) independent candidate was elected. Likewise, none of the candidates from the coalitions PTR and UP (4 and 56, respectively) are elected. Therefore, we removed from the sample all candidates from PTR, UP and IND coalitions in order to improve the balance of the input data, avoid overfitting and, in consequence, prevent misleading conclusions.

2.3. Data Analytics Algorithms

To analyze the dynamics between the profiles of the candidates, their campaign efforts and the outcomes of the 2017 elections for deputies in Chile, we implemented a data analytics approach encompassed by three classification algorithms frequently used in predicting electoral outcomes: (i) classification and regression trees (CART), (ii) random forest (RF) and (iii) multinomial logistic regression (mLogit) (further details will be given in the remainder of this section).
For ease of comprehension, let us consider the following notation. Suppose we have a sample of m observations (candidates, in this case), where each observation is characterized by n attributes and the class to which that observation belongs. That is, the i-th sample can be denoted as i ( x i y ˜ i ) = ( x 1 i , x 2 i , , x k i , , x n i y ˜ i ) , where x k i corresponds to the value of the k-th attribute of observation i, and y ˜ i corresponds to the class to which the observation i belongs (we will assume that there are q possible classes). Thus, the set of m candidates i ( x i y ˜ i ) ), with i { 1 , , m } , defines the pair
( X y ˜ ) = x 1 1 x 2 1 x n 1 y ˜ 1 x 1 m x 2 m x n m y ˜ m .
This study considers a sample of 294 candidates ( m = 294 , see Table 2) characterized by 10 attributes ( n = 10 , see Table 1) and 4 classes ( q = 4 , defined by the combination of the political past and the outcome of each candidate: 1≡ Incumbent-Elected, 2≡ Incumbent-Nonelected, 3≡ Challenger-Elected and 4≡ Challenger-Nonelected). For example, if x 1 i = male , then the gender of candidate i is male; if x 2 i = Challenger , it means that candidate i is challenger (or, which is the same, nonincumbent); likewise, if x 6 i = 30 % , then 30% of visits recorded by candidate i were in new communes of the district; finally, if y ˜ i = Challenger Electe it means that candidate i is a challenger who is elected.
Considering this notation, a classification method could be seen as a strategy that allows learning based on these m observations and with this learning to train a function f : X y { y 1 , , y q } m to be able to construct a pair ( X y ) that “represents” or “reproduces” as much as possible the relationships or patterns given by the observations ( X y ˜ ) . The aim is to develop a good generalization, i.e., to be able to accurately classify new observations, say x i , by associating a class, say y i , using the trained function f. Please note that the classification methods, including those considered in this study, fall within the category of supervised (machine) learning (see [34,35] for a broad discussion on this concept). In this paper, we used three state-of-the-art strategies for finding function f (classification function). These methods correspond to CART, RF and mLogit, which allow exploring different features of the studied phenomenon, and their use is largely supported by the related literature [3,36,37].
Method CART, introduced by [38], is a binary recursive partitioning procedure capable of processing continuous and nominal attributes. CART generates a regression tree when the vector y ˜ corresponds to an arrangement of continuous variables or a classification tree when the vector y ˜ corresponds to an arrangement of categorical variables; the problem under study corresponds to the latter case. In a classification tree, each node represents a subset of the sample associated with a binary classification rule, also known as splitting or branching rule, and the nodes branching from that node are expected to encode a smaller and more homogeneous subset of the sample. The tree is built starting from a root note which encodes the whole sample, say ( X y ˜ ) ); two nodes are branched from that node by splitting the sample in two disjoint set. This splitting is performed by selecting, using a classification accuracy function, one attribute and a corresponding threshold value (in case of a numerical attribute) or a partition of the set of possible categories (in the case of a categorical attributes). The process is repeated, recursively, until no further meaningful splitting can be performed; the terminal nodes correspond to the classification of the sample.
The random forest (RF) method, proposed by [39], consists of an assembly of classification trees, that is, a predictor where the results from a series of trees are combined to classify a set of observations to obtain a greater accuracy than that obtained by each tree individually and reducing an eventual over-fitting of the single tree classifier. Given a set of samples ( X y ˜ ) , a collection of, say J, subsets (i.e., subsets of candidates represented by their attributes and corresponding class label) are randomly selected with replacement, and a classification tree is constructed for each of them (following an equivalent procedure as the one described above). The final classifier is obtained by aggregating the resulting trees so that the class label associated with each terminal node corresponds to the most frequent class assigned to the corresponding terminal node among the J random trees.
The mLogit model is a generalization of the logistic regression method for problems with more than two classes [40] and is based on the same principles, classifying a categorical variable coded into two classes, usually associated with 1≡Success and 0≡Failure. Logistic regression seeks to determine the coefficients β 0 , β 1 , , β n of the linear regression
y ^ i = β 0 + k = 1 n β k x k i ,
where y ^ i i is the value of the line for object i, given the values of the attributes x 1 i , x 2 i , , x k i , , x n i . Naturally, because it is a line, the values can be much higher than 1 or much lower than 0. The logistic regression uses a logistic function (logit) to fit the results of y ^ i to the interval 0 , 1 as follows:
σ i = 1 1 + e y ^ i .
Clearly, when y ^ i , we get σ i 1 . On the other extreme, when y ^ i , we get σ i 0 , since e y ^ i . The simple logit approach considers that observations are classified into two categories, hence, a given threshold, say μ [ 0 , 1 ] , is defined such that observation i will be classified in the first category if σ i μ and in the second category, otherwise. However, as in our case we have four categories, we need the mLogit approach to map the corresponding σ i value (i.e., classifying observation i) into one of the four categories by a function π : σ i 1 , 2 , 3 , 4 , which completes the classification process. Function π is defined on the basis of the observed probability of a given observation (i.e., candidate) to be part of one of the four categories (see, e.g., [41,42,43]).
The methods described are implemented in the R package using rpart (recursive partitioning and regression trees) libraries [44,45] for CART, randomForest for RF [46], and nnet for mLogit [47,48].
To measure the performance of the considered classification algorithms we compute the so-called confusion matrix. In its basic form, for binary classification methods, the confusion matrix is characterized by four components: (i) the number of true positive, (ii) the number of true negative, (iii) the number of false positive, and (iv) the number of false negative. Hence, the empirical comparison is performed by applying the different algorithms on the same data set and then evaluating the performance of its classification capacity. The classification performance is measured by the accuracy, calculated as the sum of the correct classifications (true positives and true negatives) over the total sample.
In this work, however, a multiclass classification is performed, extending the binary definition of accuracy, through the formula presented in [49]:
Accuracy = i = 1 l t p i + t n i t p i + f n i + f p i + t n i l
where true positives ( t p i ) , true negatives ( t n i ) , false positives ( f p i ) , false negatives ( f n i ) are represented and l corresponds to the number of classes (4 in this case). Consequently, since the three classification methods are applied to the same prediction sample, it is possible to use accuracy to compare their performance. It is important to note that one disadvantage of accuracy is that it is presented as a total of tallies on the total sample, i.e., when comparing two algorithms, one, for example, could correctly predict all the incumbent-winners but not all the challenger-winners, while another could correctly predict more challenger-winners, but not correctly classify all incumbent-winners, and eventually, both algorithms would achieve the same accuracy. This variation could be even greater if the samples compared were different. However, this analysis is not the objective of the study, and the methods are compared with the same sample.

2.4. Method Outline and Implementation

The computational implementation of the experiments was performed in the R-package using an Intel (R) Core (TM) i7-7500U CPU @ 2.70 GHz (4CPUs). Next, the steps of the study are described.
Step 1
Compile information on the candidates for deputies in the 2017 elections in Chile from their official Facebook accounts, the library of the National Congress, and the SERVEL website.
Step 2
Refine and pre-process data obtained from Facebook using text extraction, examination, and data visualization techniques. This step is carried out following the methodology proposed in [50]:
  • Preprocessing the files by term extraction.
  • Structuring and storage of the contents as intermediate representation, through lists of communes associated with the district to which each candidate runs.
  • Application of analysis techniques on the intermediate representation through distribution analysis.
  • Visualization of the results.
Additionally, in this step, all the data are accumulated and sorted to generate a sample where each candidate is represented by a class and a set of attributes.
Step 3
Train the methods described in Section 2.3 with a subsample extracted from Step 2.
Step 4
Apply the classification methods trained in Step 3 to the candidates of the prediction sample (in the case of the variables associated with territorial deployment, for each candidate the mean values of these variables observed in the candidates from the training list are imputed).
Step 5
Compare the accuracy of the classification methods on the prediction sample. Select the method with the best accuracy value.
Step 6
Simulate different scenarios of territorial deployment by coalition, to analyze the impact of campaign strategies in the outcomes of the electoral process.
Step 7
Analyze the results obtained from two perspectives: first, from fitting the algorithms on the sample considered and, then, from the impact of the campaign strategies of the main coalitions in the outcomes of the electoral process.
This methodology allows—additionally—to analyze strategies of candidates in a semi-incumbent situation, defined as those who compete for seats in districts composed of one party in which they are incumbent and another in which they act as challenger.

3. Results and Discussion

As described in the previous section, the sample was subdivided into a set with which the three algorithms (mLogit, CART and RF) were trained and another in which the 2017 predictions for the electoral race for access to seats in the Honorable Chamber of Deputies of Chile were implemented.
The first result consists of the prediction of the elections of deputies based on the candidate’s profile and their campaign effort. The classification considers the outcome of each candidate (elected/nonelected) and their political past (incumbent/challenger) against the position they are running for. To visualize the performance of each algorithm, confusion matrices were constructed on the training samples (see Table 3a) and on the prediction samples (see Table 3b). To compare the performance of the algorithms in the two data sets, each candidate of the prediction set is imputed with the mean value of the territorial deployment attributes of their respective coalition, calculated based on their values for the candidates in the training sample. Thus, for example, for a candidate of the ChV coalition, the following values are imputed: percentage of visits to new communes x 6 i = 7.83%, percentage of new communes visited x 7 i = 10.98%, percentage of communes visited x 8 i = 69.0% and percentage of individual visits x 9 i = 75.2%. The use of imputed mean values is strongly supported in the literature [51,52,53].
Table 4 shows the accuracy of each algorithm on the prediction sample using the Equation (1). The results show that the model is capable of classifying each of the categories with a high level of accuracy, highlighting the nonelected challenger candidates, which represent the majority of both samples. These levels of accuracy are comparable with those obtained in similar studies [2,36].
Once the predictive capacity of the studied algorithms has been verified, the influence of territorial deployment decisions by coalition on the outcomes of the parliamentary elections is analyzed through simulations of different deployment scenarios. These simulations are performed by assigning to all the candidates of a coalition the same value of a territorial deployment attribute, varying between 5% and 95%, ceteris paribus. The mLogit method is used, which shows a slight advantage over the others for the sample under study. As an example, the outcomes of the ChV coalition, which has the candidates with the highest number of Facebook deployment records during the period analyzed, are shown below.
The first attribute analyzed is the percentage of communes visited. Figure 1a shows the number of candidates elected and the accuracy of the percentage of communes visited values between 5% and 95% of the ChV coalition. Above each bar of deployment effort, the accuracy of the model for the coalition is shown. In this case, the number of seats elected does not seem to be sensitive to different levels of the percentage of communes visited, which reveals that for this coalition, the available records do not adequately capture the influence of this attribute of territorial deployment on the performance of the candidates. However, as shown in Figure 1b, the electoral performance of the ChV coalition seems to be more sensitive to different levels of the percentage of individual visits. When a value similar to the observed mean value of this parameter (75.2%) is imputed, the model predicts the election of 30 candidates, while the real value is 32 candidates, which implies an accuracy greater than 90%. This behavior is quite interesting because, although these elections are decided on the basis of the D’Hondt system—which favors successful lists over successful individuals—the available records show that the individual visits is relevant even if a reduced number of cities are visited. Appendix A shows the results obtained by performing a similar analysis for the LFM and CD coalitions, both for the percentage of communes visited (see Figure A1a and Figure A2a, respectively) and for the percentage of individual visits (see Figure A1b and Figure A2b, respectively). Additionally, from Figure A1b and Figure A2b we can observe that the electoral performance of the candidates from LFM and CD coalitions seems to be more sensitive to number of individual visits.
In Figure A3 we display the structure of the classification tree obtained by the CART method, which reaches an accuracy above 92%. As seen in the terminal nodes, the tree classifies the candidates as follows: Incumbent-Elected 11%, Incumbent-Nonelected 2%, Challenger-Elected 17% and Challenger-Nonelected 70%. Given the structure of the tree obtained, it is evident that the main attribute among all the candidates corresponds to incumbency. Then, in the case of incumbents, the main classification attribute corresponds to percentage of budget used, while in the case of challengers, the main attribute corresponds to the elected official by popular vote. This shows that the political past of the candidates is crucial to explain their electoral performance because even in the case of not being an incumbent, having previously held an elected position can be decisive for their outcome. In fact, in the prediction set, of the 43 challengers who are classified as elected, 42 of them have held positions elected by popular vote. Regarding incumbents, we can see that 75% of those who spent less than 21% of the amount available for their campaign ultimately failed, while 97% of incumbents who spent more than 21% of their budget succeeded in the elections. These two observations reveal that other personal attributes (gender and coalition) and territorial deployment seem to have little relevance when predicting the electoral performance of a candidate.
It is important to note that the three classification algorithms used do not ensure a balance of the total number of candidates classified as elected between the different coalitions and parties (known as global balance); that is, the total number of candidates classified as elected could exceed the number of available seats. Although this is a relevant aspect, this imbalance has not been the focus of analysis in the literature, both in those works focused on predicting the percentage of shared votes and in works focused on predicting the total number of candidates elected by party. For example, [54,55] present forecasting models for the 2015 parliamentary elections of Great Britain; for which the number of candidates predicted to be elected are 630 and 650, respectively, even when the total number of seats in the election is 632. A similar situation, for the same elections, is presented in [56,57], who forecast vote shares for the most popular parties participating in the election.

Discussion

From a methodological point of view, our study shows that even when studying elections that take place after structural reforms in electoral systems, a specially tailored definition of attributes allows obtaining good results when the adequate data analytics approaches are applied. Likewise, the results reveal that traditional political features of candidates and their campaigns, and by extension also of the corresponding coalitions, are still predominant for explaining electoral results. As a matter of fact, the conclusions drawn in the recent study presented in [58] allow us to conclude that such observation is not only valid for the Chilean context.
In order to outline the implications of our results in the practice of political campaigning, we now present a more detailed discussion of the results obtained by the mLogit algorithm (whose attained classification performance is almost 95%, see Table 4). As presented above, the political past of the candidates, and in particular their electoral past, leads to a clear advantage for the incumbents: 4 out of 5 were elected. Likewise, for this group, the results show that 75% of those who spend less than one-fifth of the available budget would not be elected; in contrast, almost all (97%) of those who exceed this budget would be elected. For challenger candidates, coincidentally, the most relevant variable is their political past. The results show that it is very difficult to be elected without first having held a position elected by popular vote (almost 0% of chances), while the chances of challengers that have been elected in previous elections (even in different positions) might be as high as 32%. From a more political point of view, the candidate’s party or coalition, seems to be relevant only in the case of challenger candidates that have previously been elected for other positions. As seen from the classification tree, those candidates belonging to the coalitions ChV and FA are more likely to be elected than those from the other coalitions. This point needs to be addressed in greater detail in future studies, especially considering that the FA coalition was founded in 2017 and gained 20 of the 155 seats nationwide. This shows that the modifications to the electoral system reduced the entry barriers to new parties and coalitions to enter to the Parliament, which could be interpreted as a diversification of ideological representation in the political system. Additionally, from a campaign planning point of view, surprisingly, other attributes such as gender, years in office and those that measure territorial deployment seem to play no relevant role in the result of the elections. This later observation complements the results shown in Figure 1a, Figure A1a and Figure A2a, in the sense that, at least according to the available records, running a campaign that covers a large share of the district’s territory might lead to a similar result as running a campaign that covers only a small portion of it. Although this seems to be counter intuitive from a classical territorial representation point of view, that fact that districts’ population is typically concentrated into two or three large cities implies that no real incentives exist to visit additional cities as social networks allow boosting the communication with the voters in the whole district (and beyond) without further efforts.
Despite of the performance of the proposed approach, the attained results also reveal some shortcomings that should be addressed in a future research. One of the limitations of the proposed methodology is the dependence of our territorial deployment attributes to the data retrieved from social networks activity. Hence, the conclusions drawn from the influence of the territorial deployment requires all candidates to feature a (quantitatively) comparable activity in their social networks. This limitation could be addressed by including other attributes as well as other sources from where to retrieve territorial deployment data (e.g., from campaigns’ press coverage or from the official campaign logbook informed to the Electoral Service when requesting expenses reimbursement). Another limitation of our study is the fact that voters’ information, in particular from social network activity, is not included in our data analytics approaches. In consequence, the obtained results do not provide a full interpretation of the political dynamics between voters, candidates, coalitions and institutions. As shown, for instance, in [10,59], including social networks activity data from voters allows to analyze further political profiling of the electoral process, such as political polarization, changes in voting preferences and voters clustering. Therefore, including data from voters could enhance the sociopolitical scope of the proposed methodology, allowing a deeper analysis of the political context underlying the studied electoral process.

4. Conclusions and Future Work

This article seeks to measure the impact that candidate profiles and their campaign efforts have on the outcomes of elections for political representatives. For such purpose, we consider the 2017 election of deputies in Chile, which took place after reforming the electoral system, whose main modifications can be summarized as follows: the end of the binomial system, the redesign of electoral districts, the increase in the number of seats in parliament, and the requirement of gender parity in the lists of the different coalitions. Candidates’ profile is characterized by personal attributes, political affiliation and previous experience in elected offices (including the one of the considered election). Likewise, Candidates’ campaign effort is characterized by different measures of the candidates’ territorial deployment and by campaign expenditures. To the best of our knowledge, this is one of the first works considering, simultaneously, these dimensions in electoral performance prediction. The influence of these attributes in the electoral performance of the candidates is analyzed by a data analytics approach comprised by three supervised machine learning algorithms; CART, RF and mLogit. Namely, these algorithms are used for predicting the classification of candidates into to four categories: incumbent-elected, incumbent-nonelected, challenger-elected, challenger-nonelected. The performance of the three approaches achieved levels comparable to those presented by other studies with similar characteristics. Additionally, simulations are carried out to analyze whether is possible to estimate the territorial deployment levels required, by a given coalition, to maximize its electoral outcomes. The sensitivity analysis obtained from these simulations could be embedded into a decision-aid tool that may be of interest to campaign decision makers (e.g., candidates, coalitions, political scientists).
The obtained results reveal that it is very difficult to be elected without having previously held an elected official position: 32% of the challengers that managed to be elected previously held an official position, and 4 out of 5 incumbents won the reelection. Furthermore, for the case of incumbents, our results show that a minimum level of campaign expenditure (20% of electoral campaign budget) is could be enough for increasing the chances of success. For the case of challengers, the evidence shows that candidates belonging to the ChV and (the recently established) FA coalitions, are more likely to be elected than those from other coalitions. Interestingly, according to the available data, it seems that other attributes, such as years in office or gender, seem to play no relevant role in the result of the elections; the case of the latter attribute is particularly interesting considering the requirement of gender parity in the lists.
Finally, there are a number of research opportunities to extend the work presented in this paper. For instance, we could implement strategies that allow balancing the total number of seats classified as elected among the different parties with the actual number of seats available in parliament. Likewise, and according to the limitations outlined in the discussion section, we could extend the current approach by including an additional data analytics component, such as sentiment analysis, in order to analyze the social networks activity data from voters. As mentioned before, exploiting the information retrieved from voters could contribute to the generation of a map of the sociopolitical ecosystem [36,60]. From a more institutional point of view, it could be interesting to extend the current tool for the evaluation of new regulations to the electoral system; for instance, to measure the impact of imposing rules such as a maximum number of re-elections for an incumbent, or further requirements regarding gender parity.

Author Contributions

Conceptualization, C.C.-V., E.Á.-M. and M.M.Q.; methodology, C.C.-V., E.Á.-M. and J.P.; validation, E.Á.-M. and M.M.Q.; formal analysis, C.C.-V. and E.Á.-M.; investigation, C.C.-V., E.Á.-M. and J.P.; data curation, C.C.-V. and M.M.Q.; writing—original draft preparation, C.C.-V., E.Á.-M. and F.L.D.; writing—review and editing, C.C.-V., E.Á.-M. and F.L.D.; visualization, C.C.-V.; supervision, E.Á.-M. and J.P.; project administration, E.Á.-M.; funding acquisition, E.Á.-M. All authors have read and agreed to the published version of the manuscript.

Funding

C. Campos-Valdés acknlowledges the support of the National Agency of Research and Development (ANID), Chile, through the program ANID-PFCHA Doctorado Nacional 2018-21181055, F. Liberona acknlowledges the support of ANID through the program ANID-PCHA Magíster para Funcionarios del Sector Público 2020-79200116, E. Álvarez-Miranda acknowledges the support of ANID through the grant FONDECYT N.1180670 and through the Complex Engineering Systems Institute ANID PIA/BASAL AFB180003.

Institutional Review Board Statement

Not applicable.

Informed Consent Statement

Not applicable.

Data Availability Statement

Not applicable.

Conflicts of Interest

The authors declare no conflict of interest.

Appendix A. Territorial Deployment Simulations

Figure A1. Classification by mLogit of elected candidates belonging to LFM for different levels of territorial deployment
Mathematics 09 00902 g0a1
Figure A2. Classification by mLogit of elected candidates belonging to CD for different levels of territorial deployment
Mathematics 09 00902 g0a2

Appendix B. Classification Tree

Figure A3. Classification tree.
Mathematics 09 00902 g0a3

References

  1. Benoit, K. Models of electoral system change. Elect. Stud. 2004, 23, 363–389. [Google Scholar] [CrossRef]
  2. Livne, A.; Simmons, M.; Adar, E.; Adamic, L. The party is over here: Structure and content in the 2010 election. In Proceedings of the Fifth International AAAI Conference on Weblogs and Social Media, Barcelona, Spain, 17–21 July 2011. [Google Scholar]
  3. Rodríguez, S.; Allende-Cid, H.; Palma, W.; Alfaro, R.; Gonzalez, C.; Elortegui, C.; Santander, P. Forecasting the Chilean electoral year: Using twitter to predict the presidential elections of 2017. In Proceedings of the International Conference on Social Computing and Social Media, Las Vegas, NV, USA, 15–20 July 2018. [Google Scholar]
  4. Burnap, P.; Gibson, R.; Sloan, L.; Southern, R.; Williams, M. 140 characters to victory? Using Twitter to predict the UK 2015 General Election. Elect. Stud. 2016, 100, 230–233. [Google Scholar] [CrossRef] [Green Version]
  5. DiGrazia, J.; McKelvey, K.; Bollen, J.; Rojas, F. More tweets, more votes: Social media as a quantitative indicator of Political behavior. PLoS ONE 2013, 8, e79449. [Google Scholar] [CrossRef] [PubMed] [Green Version]
  6. Ganser, C.; Riordan, P. Vote expectations at the next level. Trying to predict vote shares in the 2013 German federal election by polling expectations. Elect. Stud. 2015, 100, 115–126. [Google Scholar] [CrossRef]
  7. Tumasjan, A.; Sprenger, T.; Sandner, P.; Welpe, I. Predicting elections with twitter: What 140 characters reveal about Political sentiment. In Proceedings of the Fourth International AAAI Conference on Weblogs and Social Media, Washington, DC, USA, 23–26 May 2010. [Google Scholar]
  8. Kruikemeier, S. How Political candidates use Twitter and the impact on votes. Comput. Hum. Behav. 2014, 34, 131–139. [Google Scholar] [CrossRef]
  9. LaMarre, H.; Suzuki-Lambrecht, Y. Tweeting democracy? Examining Twitter as an online public relations strategy for congressional campaigns. Public Relat. Rev. 2013, 39, 360–368. [Google Scholar] [CrossRef]
  10. Singh, P.; Dwivedi, Y.; Kahlon, K.; Pathania, A.; Sawhney, R. Can twitter analytics predict election outcome? An insight from 2017 Punjab assembly elections. Gov. Inf. Q. 2020, 37, 101444. [Google Scholar] [CrossRef]
  11. Baldwin-Philippi, J. Data ops, objectivity, and outsiders: Journalistic coverage of data campaigning. Political Commun. 2020, 37, 468–487. [Google Scholar] [CrossRef]
  12. Simon, F. “We power democracy”: Exploring the promises of the Political data analytics industry. Inf. Soc. 2019, 35, 158–169. [Google Scholar] [CrossRef]
  13. Ansolabehere, S.; Snyder, J.; Stewart, C. Old voters, new voters, and the personal vote: Using redistricting to measure the incumbency advantage. Am. J. Political Sci. 2000, 45, 17–34. [Google Scholar] [CrossRef]
  14. Shotts, K. The effect of majority-minority mandates on partisan gerrymandering. Am. J. Political Sci. 2001, 2001, 120–135. [Google Scholar] [CrossRef]
  15. Shotts, K. Gerrymandering, legislative composition, and national policy outcomes. Am. J. Political Sci. 2002, 2002, 398–414. [Google Scholar] [CrossRef]
  16. Ferejohn, J. On the decline of competition in congressional elections. Am. Political Sci. Rev. 1977, 71, 166–176. [Google Scholar] [CrossRef]
  17. Ansolabehere, S.; Snyder, J. The effects of redistricting on incumbents. Elect. Law J. 2012, 11, 490–502. [Google Scholar] [CrossRef] [Green Version]
  18. Servel. Nuevo Sistema Electoral Chileno: Método D’Hondt. 2017. Available online: https://www.servel.cl/nuevo-sistema-electoral-chileno-metodo-dhont-2/ (accessed on 3 November 2019).
  19. Nic, N.; Fletcher, R.; Kalogeropoulos, A.; Levy, D.; Nielsen, R. Reuters Institute Digital News Report 2018; Reuters Institute for the Study of Journalism: Oxford, UK, 2018. [Google Scholar]
  20. CADEM. El Chile Que Viene: Uso de Redes Sociales; Technical Report; CADEM: Región Metropolitana, Chile, 2019. [Google Scholar]
  21. Biblioteca del Congreso Nacional de Chile. Nuevo Sistema Electoral Para Elecciones Parlamentarias (Fin del Sistema Binominal). 2015. Available online: https://www.bcn.cl/leyfacil/recurso/nuevo-sistema-electoral-para-elecciones-parlamentarias-(fin-delsistema-binominal) (accessed on 1 October 2020).
  22. Loosemore, J.; Hanby, V. The theoretical limits of maximum distortion: Some analytic expressions for electoral systems. Br. J. Political Sci. 1971, 1, 467–477. [Google Scholar] [CrossRef]
  23. Jenkins, S. A woman’s work is never done? Fund-raising perception and effort among female state legislative candidates. Political Res. Q. 2007, 60, 230–239. [Google Scholar] [CrossRef]
  24. Krook, M.; Norris, P. Beyond quotas: Strategies to promote gender equality in elected office. Political Stud. 2014, 62, 2–20. [Google Scholar] [CrossRef] [Green Version]
  25. Siavelis, P. Electoral system, coalitional disintegration, and the future of Chile’s Concertación. Lat. Am. Res. Rev. 2005, 2005, 56–82. [Google Scholar] [CrossRef]
  26. Benoit, K.; Marsh, M. Incumbent and challenger campaign spending effects in proportional electoral systems: The Irish elections of 2002. Political Res. Q. 2010, 63, 159–173. [Google Scholar] [CrossRef]
  27. Biblioteca del Congreso Nacional de Chile. Reseñas biográficas Parlamentarias de Parlamentarios en Ejercicio). 2020. Available online: https://www.bcn.cl/historiapolitica/resenas_parlamentarias/index.html?categ=en_ejercicio&filtros=2) (accessed on 30 December 2020).
  28. Lago, I.; Bermúdez, S.; Guinjoan, M.; Rowe, K.; Simón, P. Party mobilization and electoral systems. Gov. Oppos. 2019, 54, 1–24. [Google Scholar] [CrossRef] [Green Version]
  29. Jacobson, G. The effects of campaign spending in congressional elections. Am. Political Sci. Rev. 1978, 72, 469–491. [Google Scholar] [CrossRef]
  30. Jacobson, G. Incumbents’ advantages in the 1978 US congressional elections. Legis. Stud. Q. 1981, 6, 183–200. [Google Scholar] [CrossRef]
  31. Jacobson, G. The effects of campaign spending in House elections: New evidence for old arguments. Am. J. Political Sci. 1990, 34, 334–362. [Google Scholar] [CrossRef] [Green Version]
  32. Morales Quiroga, M.; Piñeiro Rodríguez, R. Gasto en campaña y éxito electoral de los candidatos a diputados en Chile 2005. Rev. Cienc. Political (Santiago) 2010, 30, 645–667. [Google Scholar] [CrossRef]
  33. Servel. Ingresos y Gastos de Candidatos. 2018. Available online: https://www.servel.cl/ingresos-y-gastos-de-candidatos/ (accessed on 30 December 2020).
  34. Kotsiantis, S.; Zaharakis, I.; Pintelas, P. Supervised machine learning: A review of classification techniques. Emerg. Artif. Intell. Appl. Comput. Eng. 2007, 160, 3–24. [Google Scholar]
  35. Singh, A.; Thakur, N.; Sharma, A. A review of supervised machine learning algorithms. In Proceedings of the 3rd IEEE International Conference on Computing for Sustainable Global Development (INDIACom), New Delhi, India, 16–18 March 2016. [Google Scholar]
  36. Saad, S.; Yang, J. Twitter Sentiment Analysis Based on Ordinal Regression. IEEE Access 2019, 7, 163677–163685. [Google Scholar] [CrossRef]
  37. Díaz, J.; Morales, J. Comparación entre árboles de regresión CART y regresión lineal. Comun. Estadística 2013, 6, 175–195. [Google Scholar] [CrossRef]
  38. Breiman, L.; Friedman, J.; Stone, C.; Olshen, R. Classification and Regression Trees; CRC Press: Boca Raton, FL, USA, 1984. [Google Scholar]
  39. Breiman, L. Random forests. Mach. Learn. 2001, 45, 5–32. [Google Scholar] [CrossRef] [Green Version]
  40. Morgan, S.; Teachman, J. Logistic regression: Description, examples, and comparisons. J. Marriage Fam. 1988, 50, 929–936. [Google Scholar] [CrossRef]
  41. Hedeker, D. A mixed-effects multinomial logistic regression model. Stat. Med. 2003, 22, 1433–1446. [Google Scholar] [CrossRef]
  42. Nerlove, M.; Press, S. Univariate and Multivariate Log-Linear and Logistic Models; RAND: Santa Monica, CA, USA, 1973; Volume 1306. [Google Scholar]
  43. Wang, Y. A multinomial logistic regression modeling approach for anomaly intrusion detection. Comput. Secur. 2005, 24, 662–674. [Google Scholar] [CrossRef]
  44. Therneau, T.; Atkinson, E. An Introduction to Recursive Partitioning Using the RPART Routines; Technical Report; Mayo Foundation: Rochester, NY, USA, 1997. [Google Scholar]
  45. Therneau, T.; Atkinson, E. Rpart: Recursive Partitioning and Regression Trees; R Package Version 4.1-15; The R Foundation: Vienna, Austria, 2019. [Google Scholar]
  46. Liaw, A.; Wiener, M. RandomForest: Breiman and Cutler’s Random Forests for Classification and Regression; R Package Version 4.6-14; The R Foundation: Vienna, Austria, 2018. [Google Scholar]
  47. Venables, W.; Ripley, B. Modern Applied Statistics with S, 4th ed.; Springer: New York, NY, USA, 2002. [Google Scholar]
  48. Ripley, B.; Venables, W. Feed-Forward Neural Networks and Multinomial Log-Linear Models; R Package Version 7.3-15; The R Foundation: Vienna, Austria, 2018. [Google Scholar]
  49. Sokolova, M.; Lapalme, G. A systematic analysis of performance measures for classification tasks. Inf. Process. Manag. 2009, 45, 427–437. [Google Scholar] [CrossRef]
  50. Feldman, R.; Sanger, J. The Text Mining Handbook: Advanced Approaches in Analyzing Unstructured Data; Cambridge University Press: Cambridge, UK, 2007. [Google Scholar]
  51. Genolini, C.; Jacqmin-Gadda, H. Copy mean: A new method to impute intermittent missing values in longitudinal studies. Open J. Stat. 2013, 3, 26. [Google Scholar] [CrossRef] [Green Version]
  52. Guan, N.; Yusoff, M. Missing values in data analysis: Ignore or impute? Educ. Med. J. 2011, 3, e6–e11. [Google Scholar]
  53. Von Hippel, P. How to impute interactions, squares, and other transformed variables. Sociol. Methodol. 2009, 39, 265–291. [Google Scholar] [CrossRef]
  54. Mellon, J.; Fieldhouse, E. The British Election Study 2015 general election constituency forecast. Elect. Stud. 2016, 41, 250–254. [Google Scholar] [CrossRef]
  55. Whiteley, P.; Clarke, H.; Sanders, D.; Stewart, M. Forecasting the 2015 British general election: The Seats-Votes model. Elect. Stud. 2016, 41, 269–273. [Google Scholar] [CrossRef] [Green Version]
  56. Prosser, C. Do local elections predict the outcome of the next general election? Forecasting British general elections from local election national vote share estimates. Elect. Stud. 2016, 41, 274–278. [Google Scholar] [CrossRef] [Green Version]
  57. Stegmaier, M.; Williams, L. Forecasting the 2015 British election through party popularity functions. Elect. Stud. 2016, 41, 260–263. [Google Scholar] [CrossRef]
  58. König, P. Why Digital-Era Political Marketing is Not the Death Knell for Democracy: On the Importance of Placing Political Microtargeting in the Context of Party Competition. Stat. Political Policy 2020, 11, 87–110. [Google Scholar] [CrossRef]
  59. Grover, P.; Kar, A.; Dwivedi, Y.; Janssen, M. Polarization and acculturation in US Election 2016 outcomes—Can twitter analytics predict changes in voting preferences. Technol. Forecast. Soc. Chang. 2019, 145, 438–460. [Google Scholar] [CrossRef]
  60. McKelvey, K.; DiGrazia, J.; Rojas, F. Twitter publics: How online Political communities signaled electoral outcomes in the 2010 US house election. Inform. Commun. Soc. 2014, 17, 436–450. [Google Scholar] [CrossRef]
Figure 1. Classification by mLogit of elected candidates belonging to ChV for different levels of territorial deployment.
Mathematics 09 00902 g001
Table 1. Independent variables (attributes) considered in the study.
DimensionIdVariableType
Profile of the candidate1genderCategorical
2incumbencyCategorical
3years in officeQuantitative
4elected official by popular voteCategorical
5coalitionCategorical
Campaign effort6percentage of visits to new communesQuantitative
7percentage of new communes visitedQuantitative
8percentage of communes visitedQuantitative
9percentage of individual visitsQuantitative
10percentage of budget usedQuantitative
Table 2. Sample preprocessing summary.
CoalitionTrainingPrediction
ElectedNot electedTotalElectedNot electedTotal
Chile Vamos (ChV)415091325890
Coalición Regionalista Verde (CRV)10132932
Convergencia Democrática (CD)5313686977
Frente Amplio (FA)14486268793
La Fuerza de la Mayoría (LFM)1941602490114
Por Todo Chile (PTCh)0282819192
Sumemos (SUM)0161605353
Partido de Trab. Rev. (PTR)NANANA044
U. Patriótica (UP)NANANA05656
Independientes (IND)NANANA1910
Total 294 551
Table 3. Confusion matrix for the classification of parliamentary election outcomes using algorithms (mLogit/DT/RF). EI: Incumbent-Elected; INE: Incumbent-Nonelected; CE: Challenger-Elected; NEC: Challenger-Nonelected.
Prediction Results
IEINECECNE
IE31 / 29 / 310 / 1 / 00 / 0 / 00 / 0 / 0
INE0 / 2 / 07 / 6 / 70 / 0 / 00 / 0 / 0
CE0 / 0 / 00 / 0 / 038 / 38 / 4711 / 8 / 3
CNE0 / 0 / 00 / 0 / 011 / 11 / 2196 / 199 / 204
a Training sample.
Prediction Results
IEINECECNE
IE27 / 26 / 288 / 7 / 80 / 0 / 00 / 0 / 0
INE4 / 5 / 36 / 7 / 60 / 0 / 00 / 0 / 0
CE0 / 0 / 00 / 0 / 036 / 25 / 3513 / 11 / 13
CNE0 / 0 / 00 / 0 / 07 / 18 / 8450 / 452 / 451
b Prediction sample.
Table 4. Accuracy of the classification methods.
Accuracy
mLogit0.9419
CART0.9256
RF[0.8748–0.9419]
Publisher’s Note: MDPI stays neutral with regard to jurisdictional claims in published maps and institutional affiliations.

