Effect of Surface Roughness on Hydrogen-Induced Blister Behavior in Pure Iron

1
Sino-French Institute of Nuclear Engineering and Technology, Sun Yat-sen University, Zhuhai 519082, China
2
Department of Physics and Astronomy, Washington State University, Pullman, WA 99164, USA
*
Author to whom correspondence should be addressed.
Metals 2020, 10(6), 745; https://doi.org/10.3390/met10060745
Submission received: 24 April 2020
/
Revised: 15 May 2020
/
Accepted: 25 May 2020
/
Published: 3 June 2020
(This article belongs to the Special Issue Hydrogen Embrittlement of Metallic Materials)
Abstract
:The effect of surface roughness on hydrogen-induced blister behavior in pure iron was explored using optical microscopy and microcomputerized tomography. Hydrogen was introduced into the samples by electrochemical precharging methods with various hydrogen charging times. It is found that grinded surface exhibits higher roughness and compressive residual stress compared to those of polished surface. With increasing hydrogen charging time, hydrogen-induced blister height, blister width and blister area fraction increase, regardless of the grinded surface and polished surface. Further, hydrogen blister height and width of grinded surface are comparative to polished surface under the same hydrogen charging time. However, the blister area fraction and the number of blister on polished surface are considerably higher than the grinded surface, indicating that polished surface is more susceptible to the formation of blisters than that of grinded surface, both of surface and interior of the samples. This is dominantly rationalized in terms of the suppression effect of hydrogen invasion in grinded surfaces due to their higher residual compressive stress and higher dislocation density.
1. Introduction
In the presence of hydrogen, the degradation phenomena of mechanical properties are known as hydrogen embrittlement. According to the hydrogen damage mode in the materials, hydrogen-induced damages are divided into reversible hydrogen embrittlement and irreversible hydrogen embrittlement. One of the most common types of irreversible hydrogen embrittlement is hydrogen blister, which occurs in the nuclear power and petrochemical industry [1]. It has been reported that hydrogen blister can take place in various structural materials, such as W [1], Al [2], Be [3], Mo [4], pure iron and Fe-based alloys [5,6,7], although these materials are absence of an external stress. In order to evaluate hydrogen blister behavior of alloys, electrochemical hydrogen charging and hydrogen plasma methods are utilized to introduce hydrogen into samples [1,5,6]. The electrochemical hydrogen charging can cause large size of hydrogen blister [5], whereas small hydrogen blister with nanoscale size can be obtained by the hydrogen plasma method [1].
The investigation on hydrogen blisters of alloys has been extensively conducted and it has focused on the effect of metallurgical state (microstructure, predeformation and crystal orientation) and cathodic charging conditions (hydrogen charging density and time) on hydrogen blisters. On one hand, Dunne et al. [8] revealed that the microstructure of X70 steel had a profound effect on surface blister behavior, and banded ferrite-pearlite was the most susceptible to hydrogen blisters compared with ferrite-granular bainite, equiaxed ferrite-pearlite and bainitic ferrite microstructures. Laureys et al. [9,10], Singh et al. [11] and Rahman et al. [12] reported that hydrogen-induced cracking initiated from inclusion particle and crack propagation was driven by internal accumulated hydrogen pressure. The inclusions with spinal and rectangular shape were more likely to initiate a crack in comparison with globular inclusions [12]. Among deformed-, recovered- and recrystallized-samples, deformed-samples were the most sensitive to hydrogen blisters [9]. However, Ayadi et al. [13] demonstrated, experimentally and theoretically, that tensile and shear plastic straining reduced the size and density of surface blisters. For the pipeline steel with NbC precipitates, few nanometer-sized NbC served as strong hydrogen traps and inhibited the occurrence of blister on blister phenomena, whereas large NbC facilitated blisters formation through nucleating small blisters at the interfaces [14]. In addition, the nuclei of hydrogen blisters for pure iron [15] and W [16] were observed along grain boundaries. In comparison with coincidence site lattice grain boundaries, random grain boundaries were favorable for blistering, as demonstrated by the reference [17]. Crystallographic analysis showed that hydrogen blisters were preferentially formed in (001)-[1], (111)-oriented grain [18]. On the other hand, it was reported [9] that the initiation of blisters occurred once a certain hydrogen concentration was reached, such as 1.4 × 10⁻⁵ (mass %) for 18Ni maraging steel [7] and 2–3 ppm for X80 steel [19]. Applied hydrogen charging current density correlated with the alteration in internal crack morphology and it affected the blister shapes [20]. The cracks dominantly propagated through the grains at low current density and mostly along grain boundaries at high current density [9]. Compared to 0.5 M H2SO4 with 5 g L−1 thiourea, 0.1 M NaOH with 10 g L−1 thiourea electrolytes caused less hydrogen damage for the pure iron [20].
To date, two mainstream mechanisms of hydrogen blister in steels have been proposed. One is internal hydrogen pressure theory proposed by Zippa et al. [21], which maintains that plenty of hydrogen atoms are preferentially trapped at defect sites, such as matrix/inclusion interfaces and microvoids, and then they combine into hydrogen molecules accompanied with high hydrogen gas pressure. As locally critical hydrogen gas pressure reaches the cohesive strength of materials, hydrogen blisters happen. Hydrogen-vacancy interaction suggested by Ren et al. [6,22,23] is another hydrogen blister mechanism. This model involves four steps: 1) hydrogen promotes the formation of superabundant vacancy and increases vacancy stability; 2) vacancy cluster initiation through a group of vacancies; 3) a combination of vacancy cluster with hydrogen gas to form blister cavity and 4) blister growth and cracking. Hydrogen blister nucleation sites and propagation is related with microstructural defects, i.e., vacancies [6,23], dislocations [9], grain boundaries [15,16,17] and matrix/inclusion interfaces [5,6,12,14].
In practice, the surface roughness of the components is unequal due to different processing techniques and surface roughness requirements. The investigation on the effect of surface conditions on hydrogen blisters of the alloy has been limited. In this study, the effect of the grinded surface and polished surface on hydrogen blisters of pure iron was investigated. The surface states of samples were characterized by laser scanning confocal microscopy and X-ray stress analyzer. Optical microscopy (OM) and microcomputerized tomography (micro-CT) were used to quantify surface and internal hydrogen blisters. The relationship between hydrogen charging time and hydrogen blister parameters was given. Finally, the influence of surface roughness on hydrogen blister susceptibility of pure iron was discussed.
2. Experimental Procedure
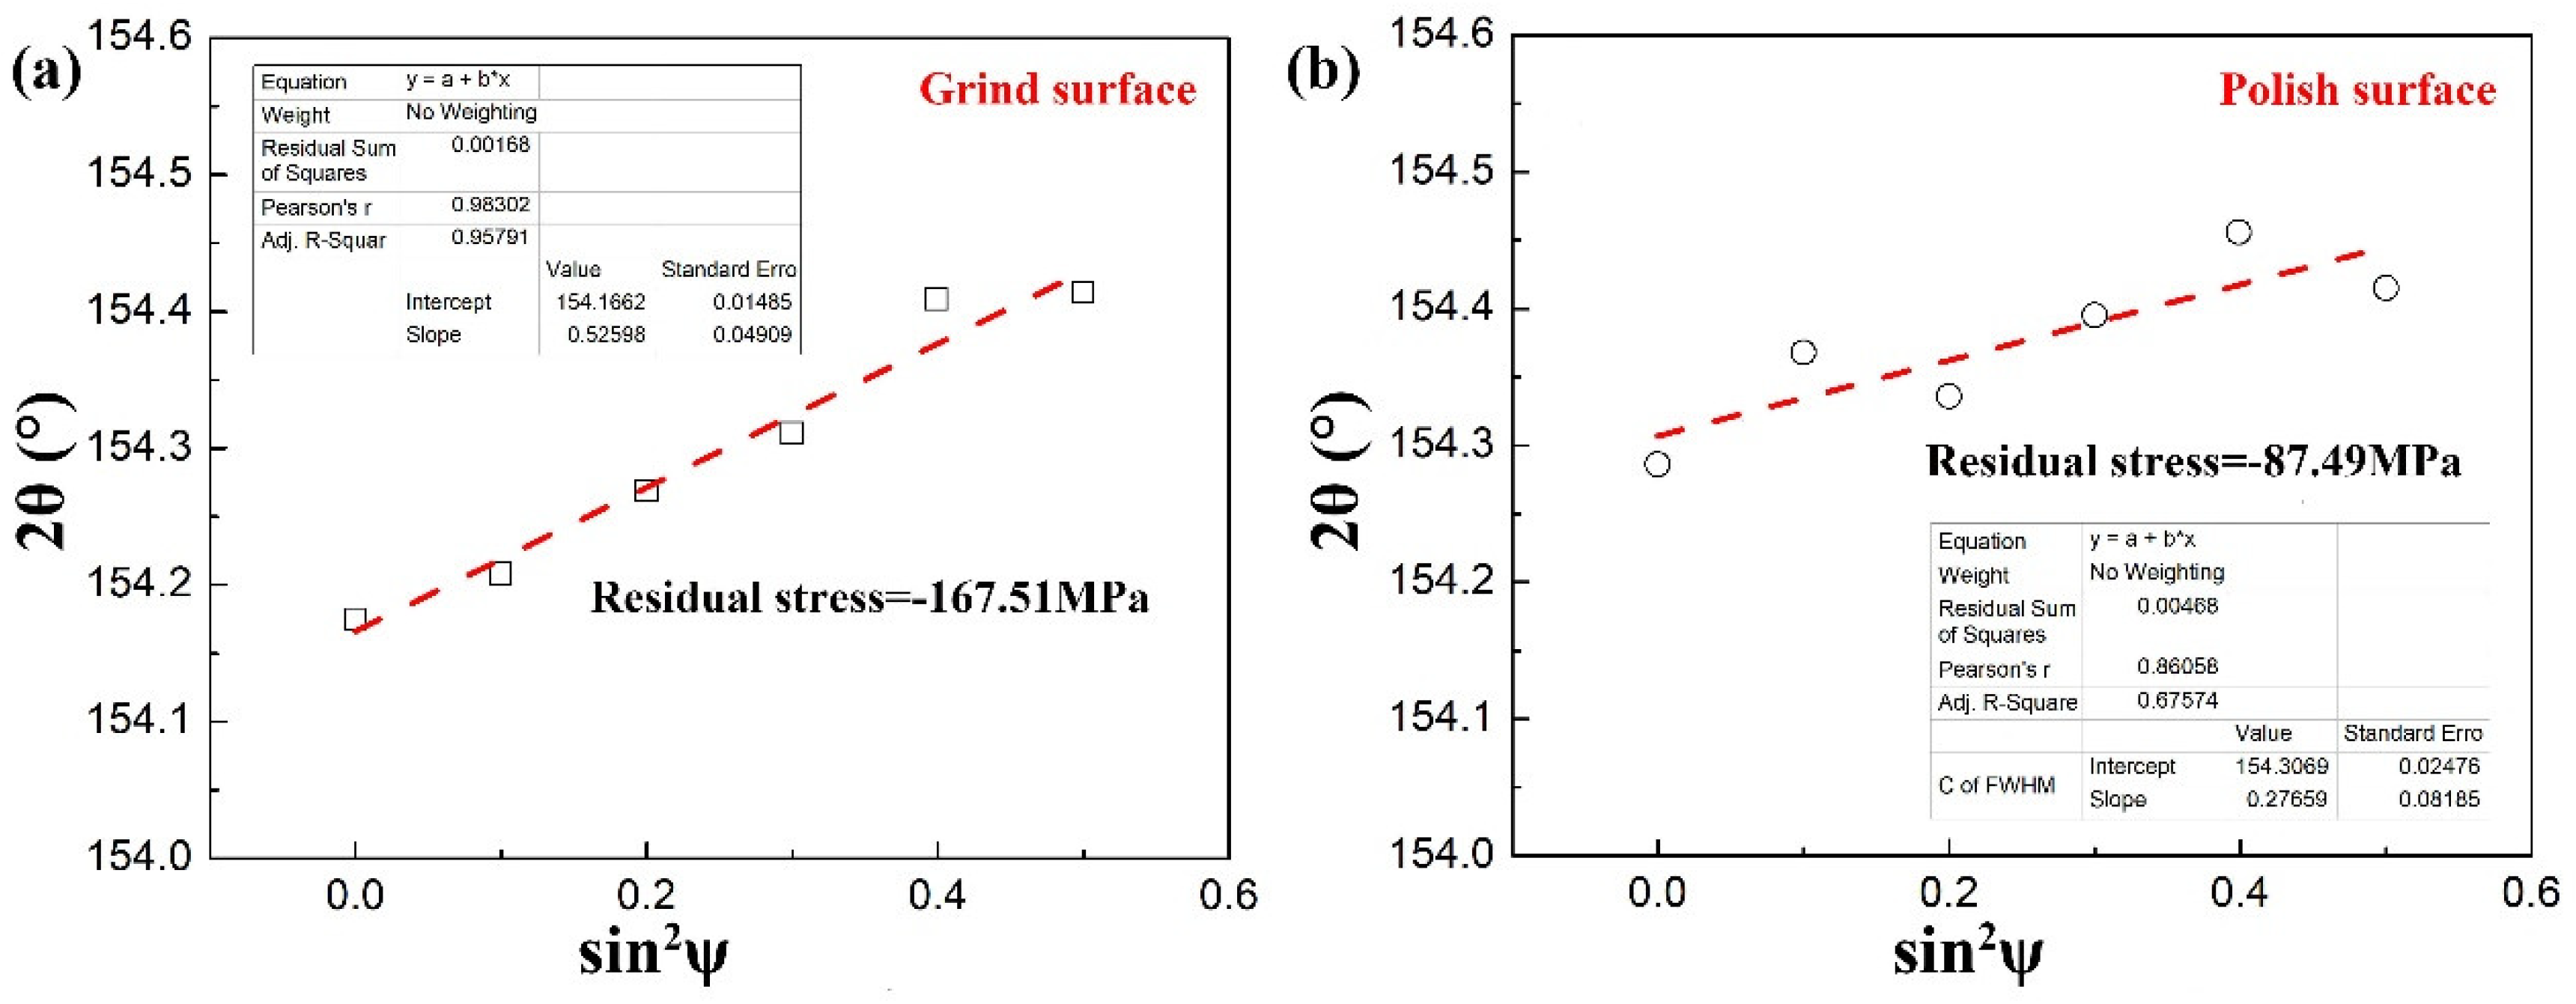
The materials investigated in this study were commercial annealed pure iron (C0.002-Ni0.003-Si0.001-Al0.001-Mn0.021-Ti0.001-P0.002-S0.004-Cr0.008-Fe balance (wt%)), which was received in the form of bulk. As-received iron was then sliced into plate samples with the dimension of 10 mm in length, 10 mm in width and 1.5 mm in thickness using wire electrical discharging machining. In order to obtain different surface topography on the samples, one side of 10 mm × 10 mm sample surface was grinded by a series of sandpapers with grits from #200, #400, #600, #800, #1000, #3000 to #7000, followed by mechanically polished, which was designated as a polished surface. In contrast, the opposite surface of the sample was subjected to grinding with sandpapers up to #1000 and it was labeled as a grinded surface. For their surface topography such as surface roughness, three-dimensional profilometry was characterized by laser scanning confocal microscopy. Additionally, surface residual stress were quantitatively determined using a Rigaku MSF/PSF-3M X-ray stress analyzer (Tokyo, Japan)with a Cr target operated at 30 kV by the sin2ψ method [24]. The scan range of 2θ was from 141.92° to 168.48° at tilt angles 0°, 18.4°, 26.6°, 33.2°, 39.2° and 45°. Then, residual stress was calculated from the slope between 2θ and sin2ψ curve, which was described as [24]:
where was the Young’s modulus, was the Poisson’s ratio and was the angle through which the samples was tilted.
Following standard metallurgical sample preparation, the samples were etched in 2% Nital solution for 15 s to reveal their optical microstructure. For electron backscatter diffraction (EBSD) analysis, the samples were subjected to the vibration polishing and then observed by EBSD equipped on scanning electron microscopy. The acceleration voltage was 20 kV and the operated current was 135 μA with a step size of 2 μm. To characterize the submicrostructure of iron, transmission electron microscopy (TEM) with operating voltage at 120 kV was used. The TEM sample with a dimension of 6 mm × 6 mm × 0.5 mm were cut by a wire electrical discharge machining, mechanically grinded to a thickness of 50 μm, and then thinned using an electrolytic twin jet machine in the solution, which was composed of 10% (vol.) perchloric acid and 90% (vol.) ethanol.
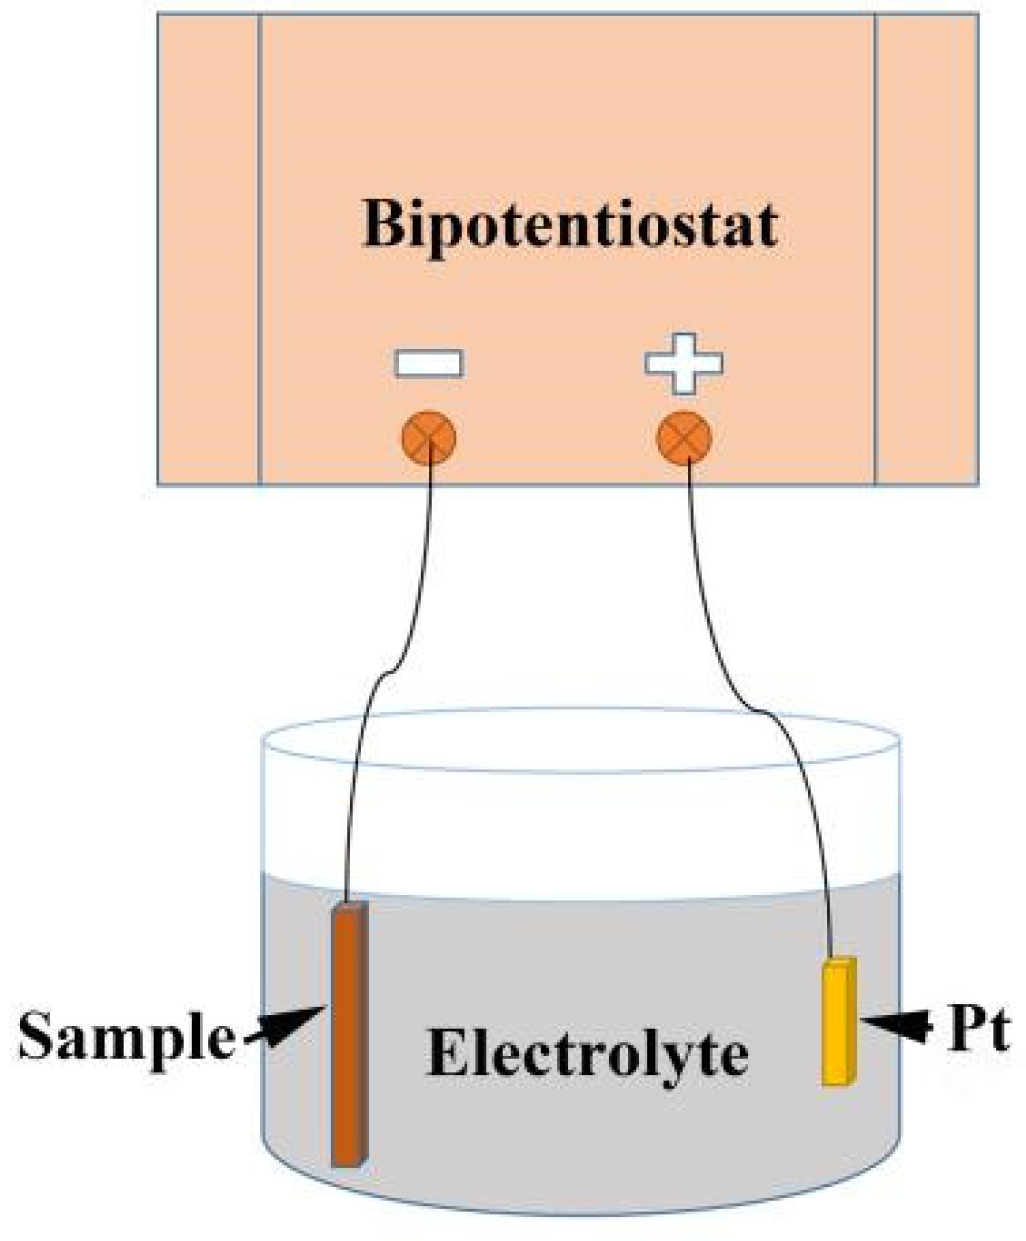
Hydrogen was introduced into the samples by means of electrochemical hydrogen charging method using bipotentiostat at room temperature (25 °C). During hydrogen charging, two electrodes were used, i.e., cylindrical platinum as an anode and the sample as a cathode. The sample was closely located to the beaker wall and the sample was situated at the opposite direction, as schematically illustrated in Figure 1. For each hydrogen charging condition, the relative position of both electrodes was almost the same. The electrolyte was 0.5 M H2SO4 with 1 g L−1 thiourea and hydrogen charging current density was about 40 mA cm−2 with various hydrogen charging time of 10 min, 30 min, 60 min, 180 min, 300 min and 480 min. Once hydrogen charging had been done, the samples were immediately immersed into ethanol to remove residual electrolyte. The blister height, blister width, blister area fraction and the number of blisters on the sample surface were statistically analyzed using OM, while micro-CT operated at 140 kV and 50 μA was used to determine hydrogen blisters within the samples.
3. Results
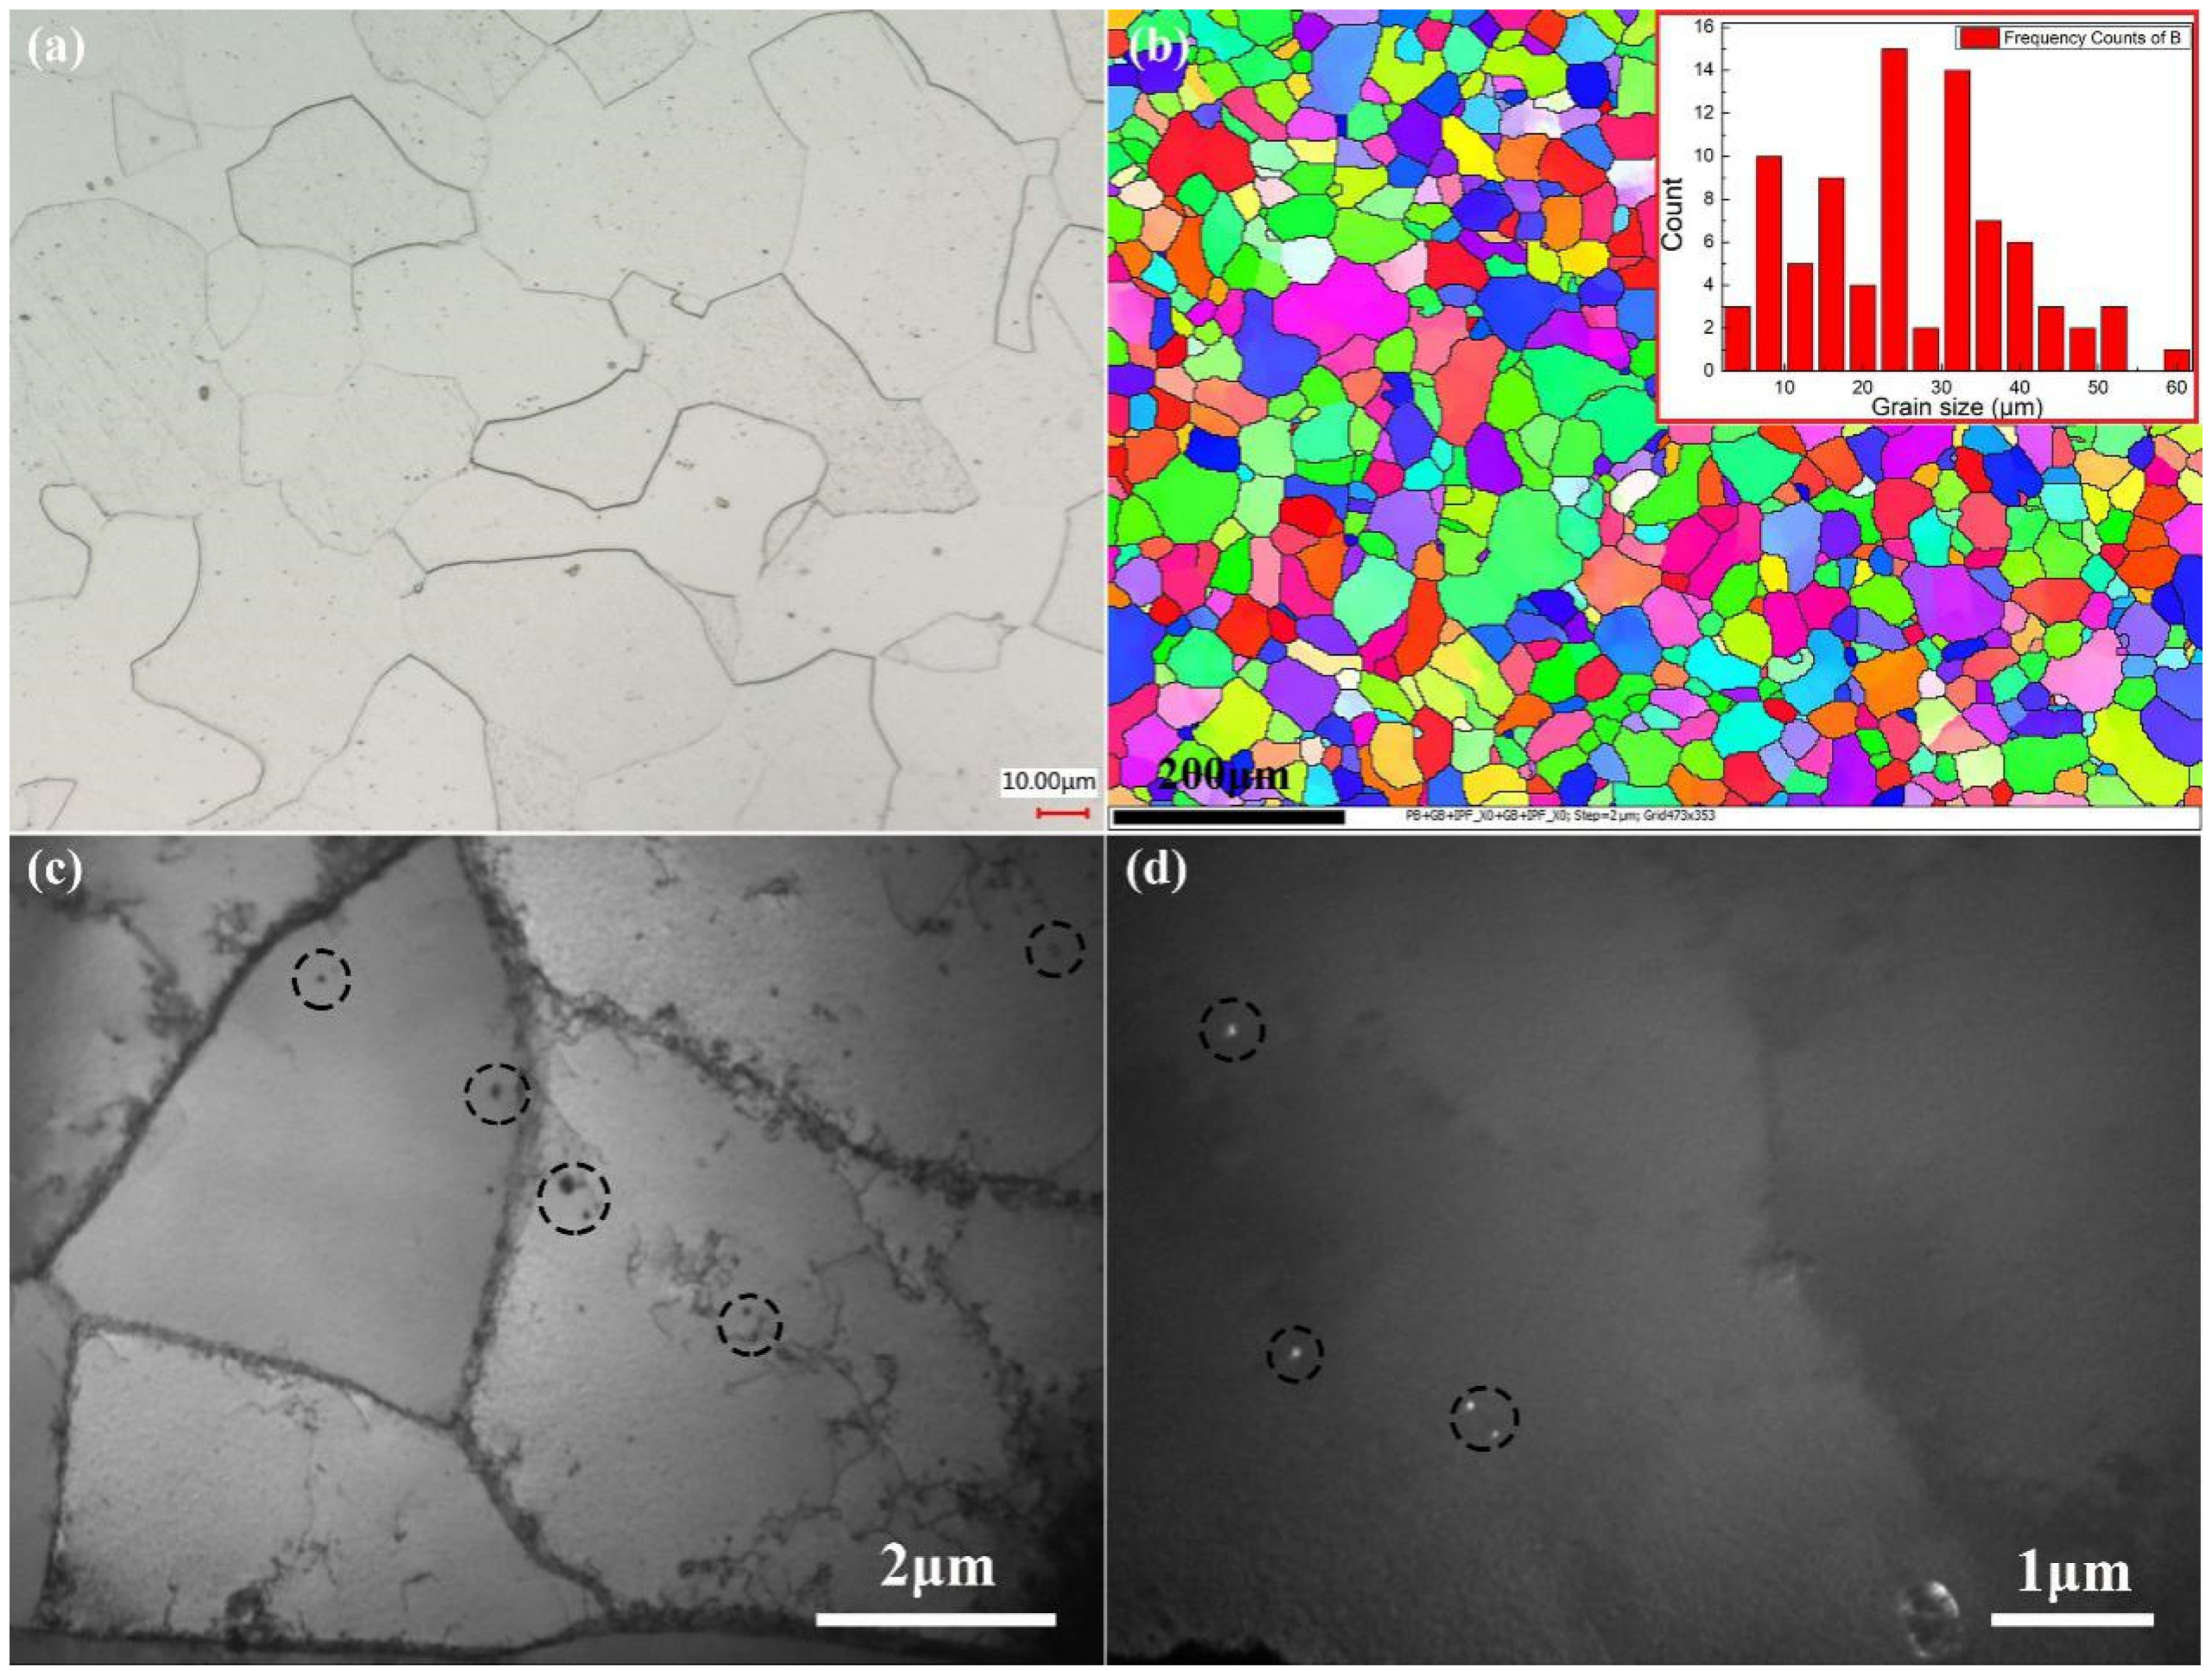
Figure 2 shows the initial microstructure of pure iron. The alloy exhibits equiaxed grain with an average grain size of 28 μm (Figure 2a,b), as determined by the linear intercept method. Figure 2b presents the inverse pole image of the alloy, indicating that its grain orientation is randomly distributed. Figure 2c gives a bright field TEM image of the alloy. Discrete single dislocation and dislocation tangles are observed in the sample. The dislocation density along grain boundaries is much higher than that of grain interior. Additionally, some precipitates with spherical shape indicated by black dotted circles are observed, as shown in Figure 2c,d, and their distribution is mostly within grains rather than grain boundaries. The size of the precipitates is at the nanoscale level. However, the accurate size of precipitates is not determined owing to limited resolution of the TEM equipment.
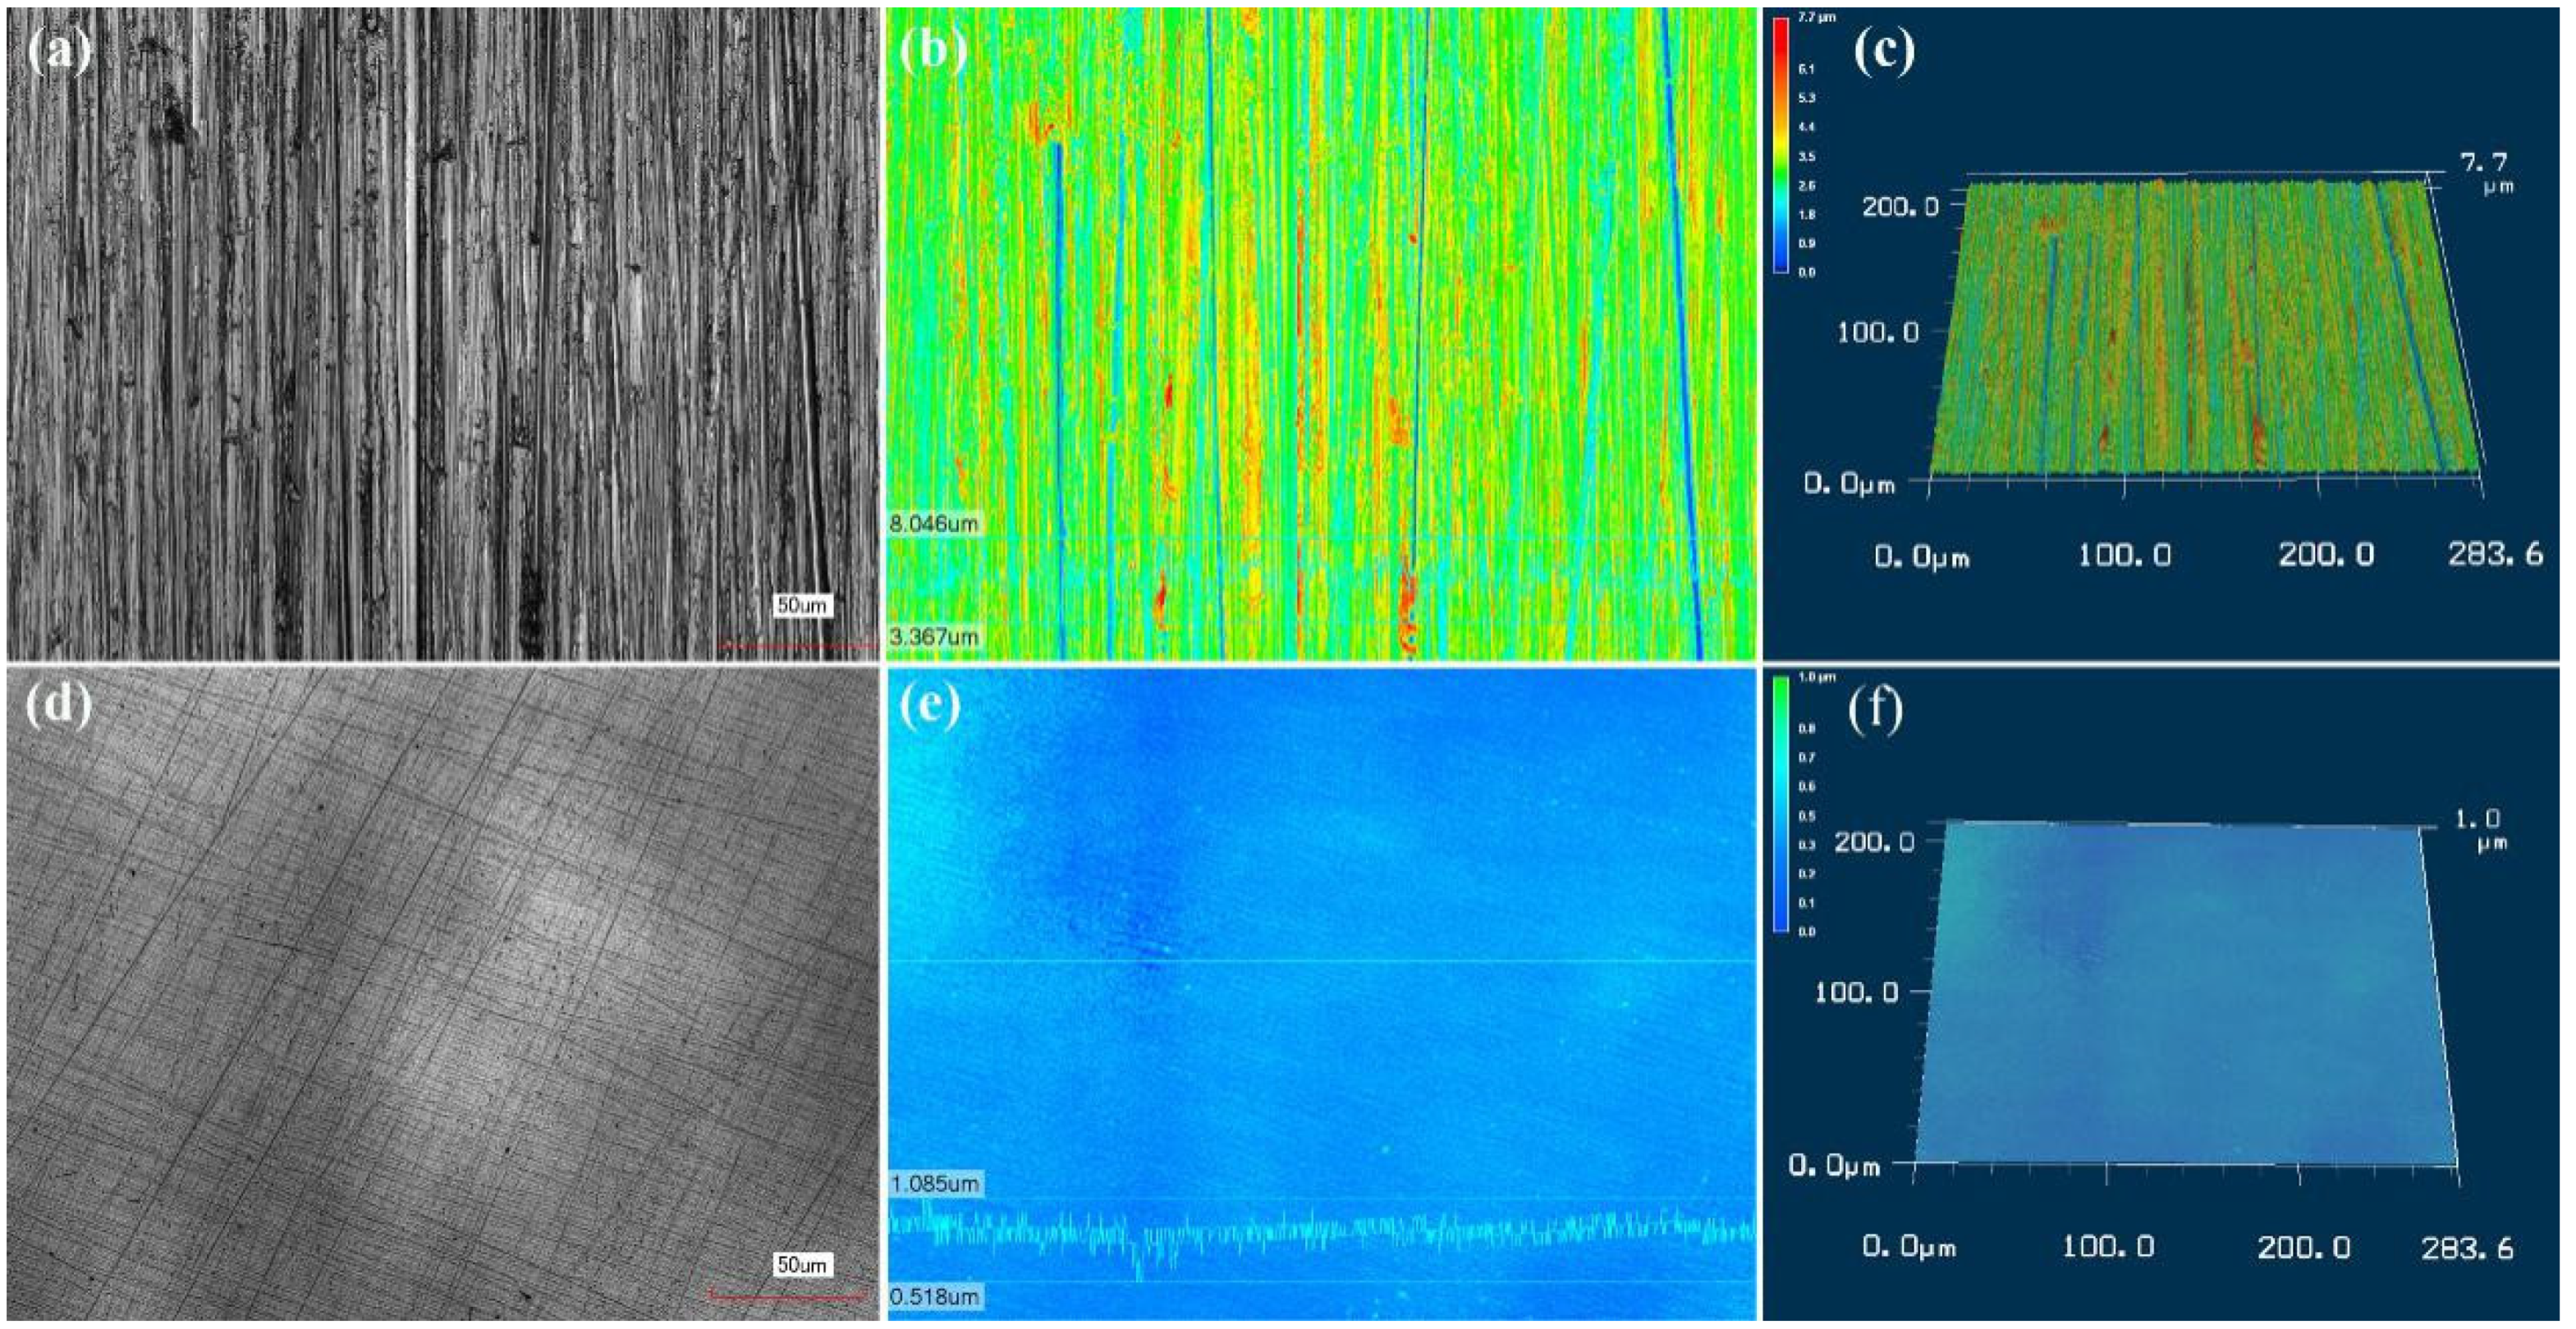
The surface morphology of grinded and polished iron is shown in Figure 3. For the grinded surface, its morphology is relatively rough with parallel deep scratches along the specific direction, as shown in Figure 3a–c, whereas cross fine scratches are detected on the polished surface (Figure 3d–f). The corresponding surface roughness of samples is quantified by arithmetical mean roughness (Ra) and maximum height of the profile (Rz). Compared to the polished surface, grinded surface exhibits much higher surface roughness. The value of Rz for grinded surface is 4.679 μm, which is about nine times higher than that of polished surface (0.567 μm). Ra of the grinded and polished surface is 0.056 μm and 0.616 μm, respectively. Figure 4 shows the 2θ vs. sin2ψ plot, indicating that compressive residual stresses are introduced in the samples during grind and polish procedures. According to Equation (1), their residual stresses are −167.51 MPa for grinded surface and −87.49 MPa for polished surface.
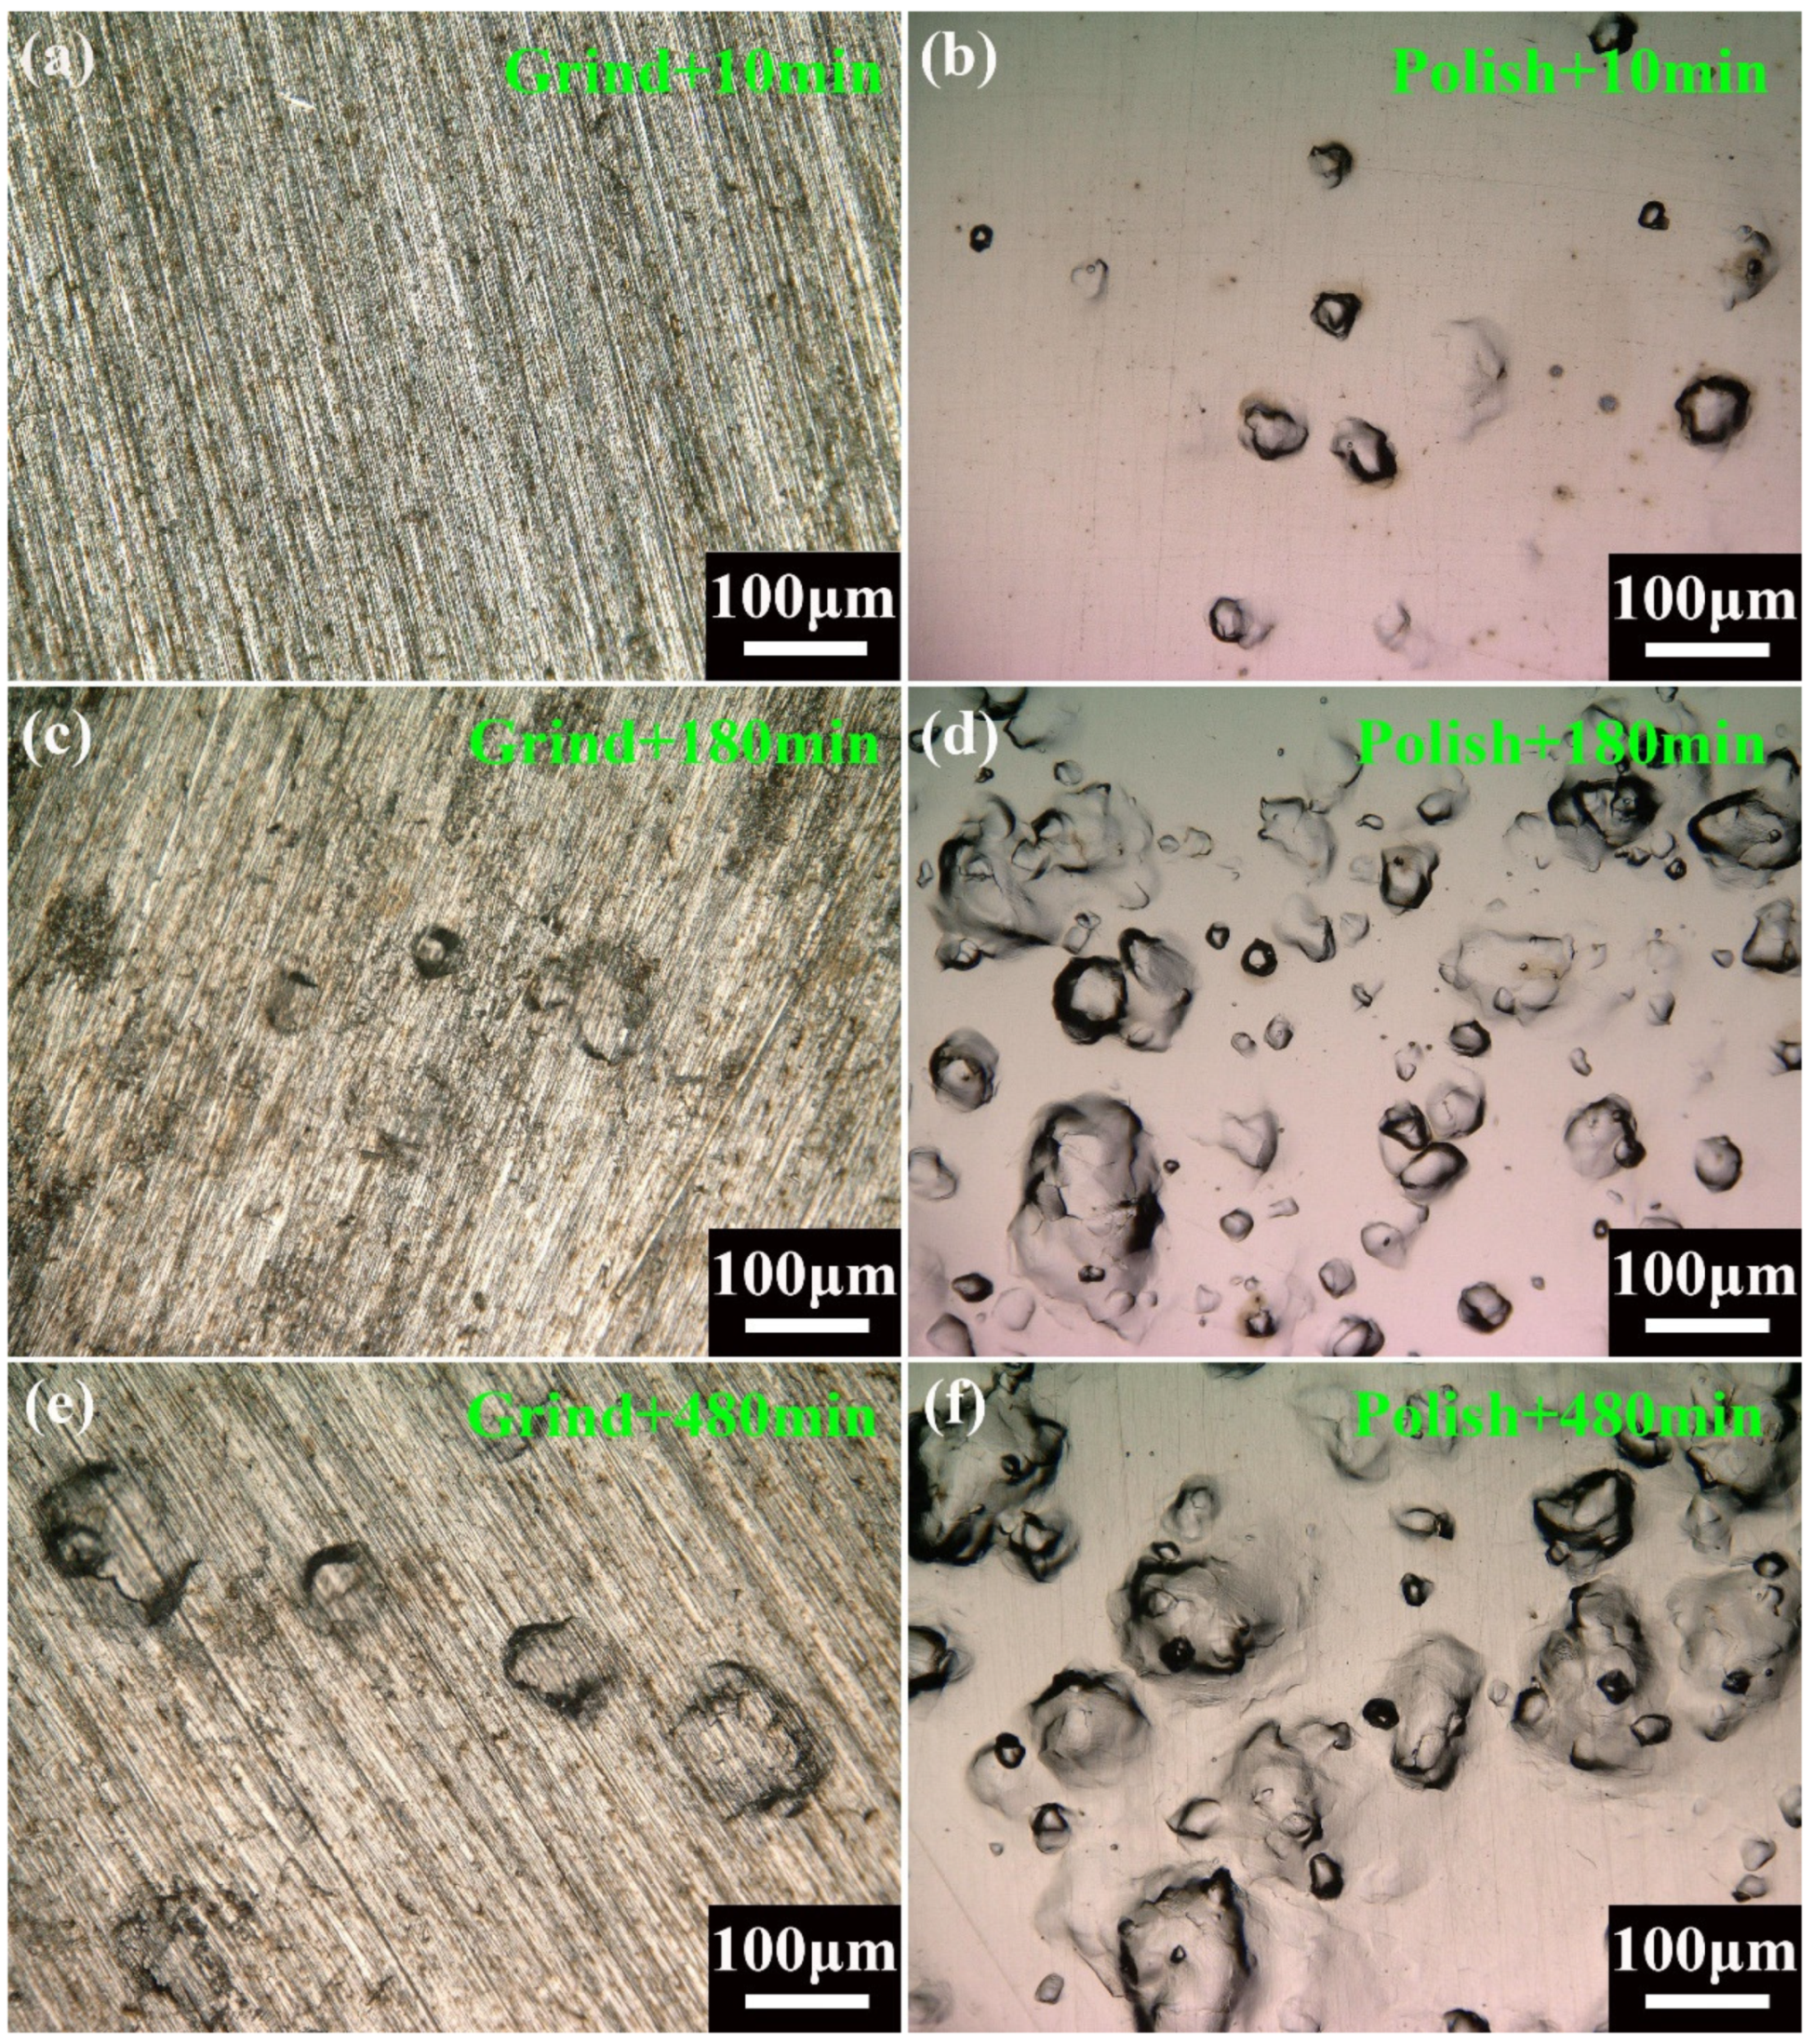
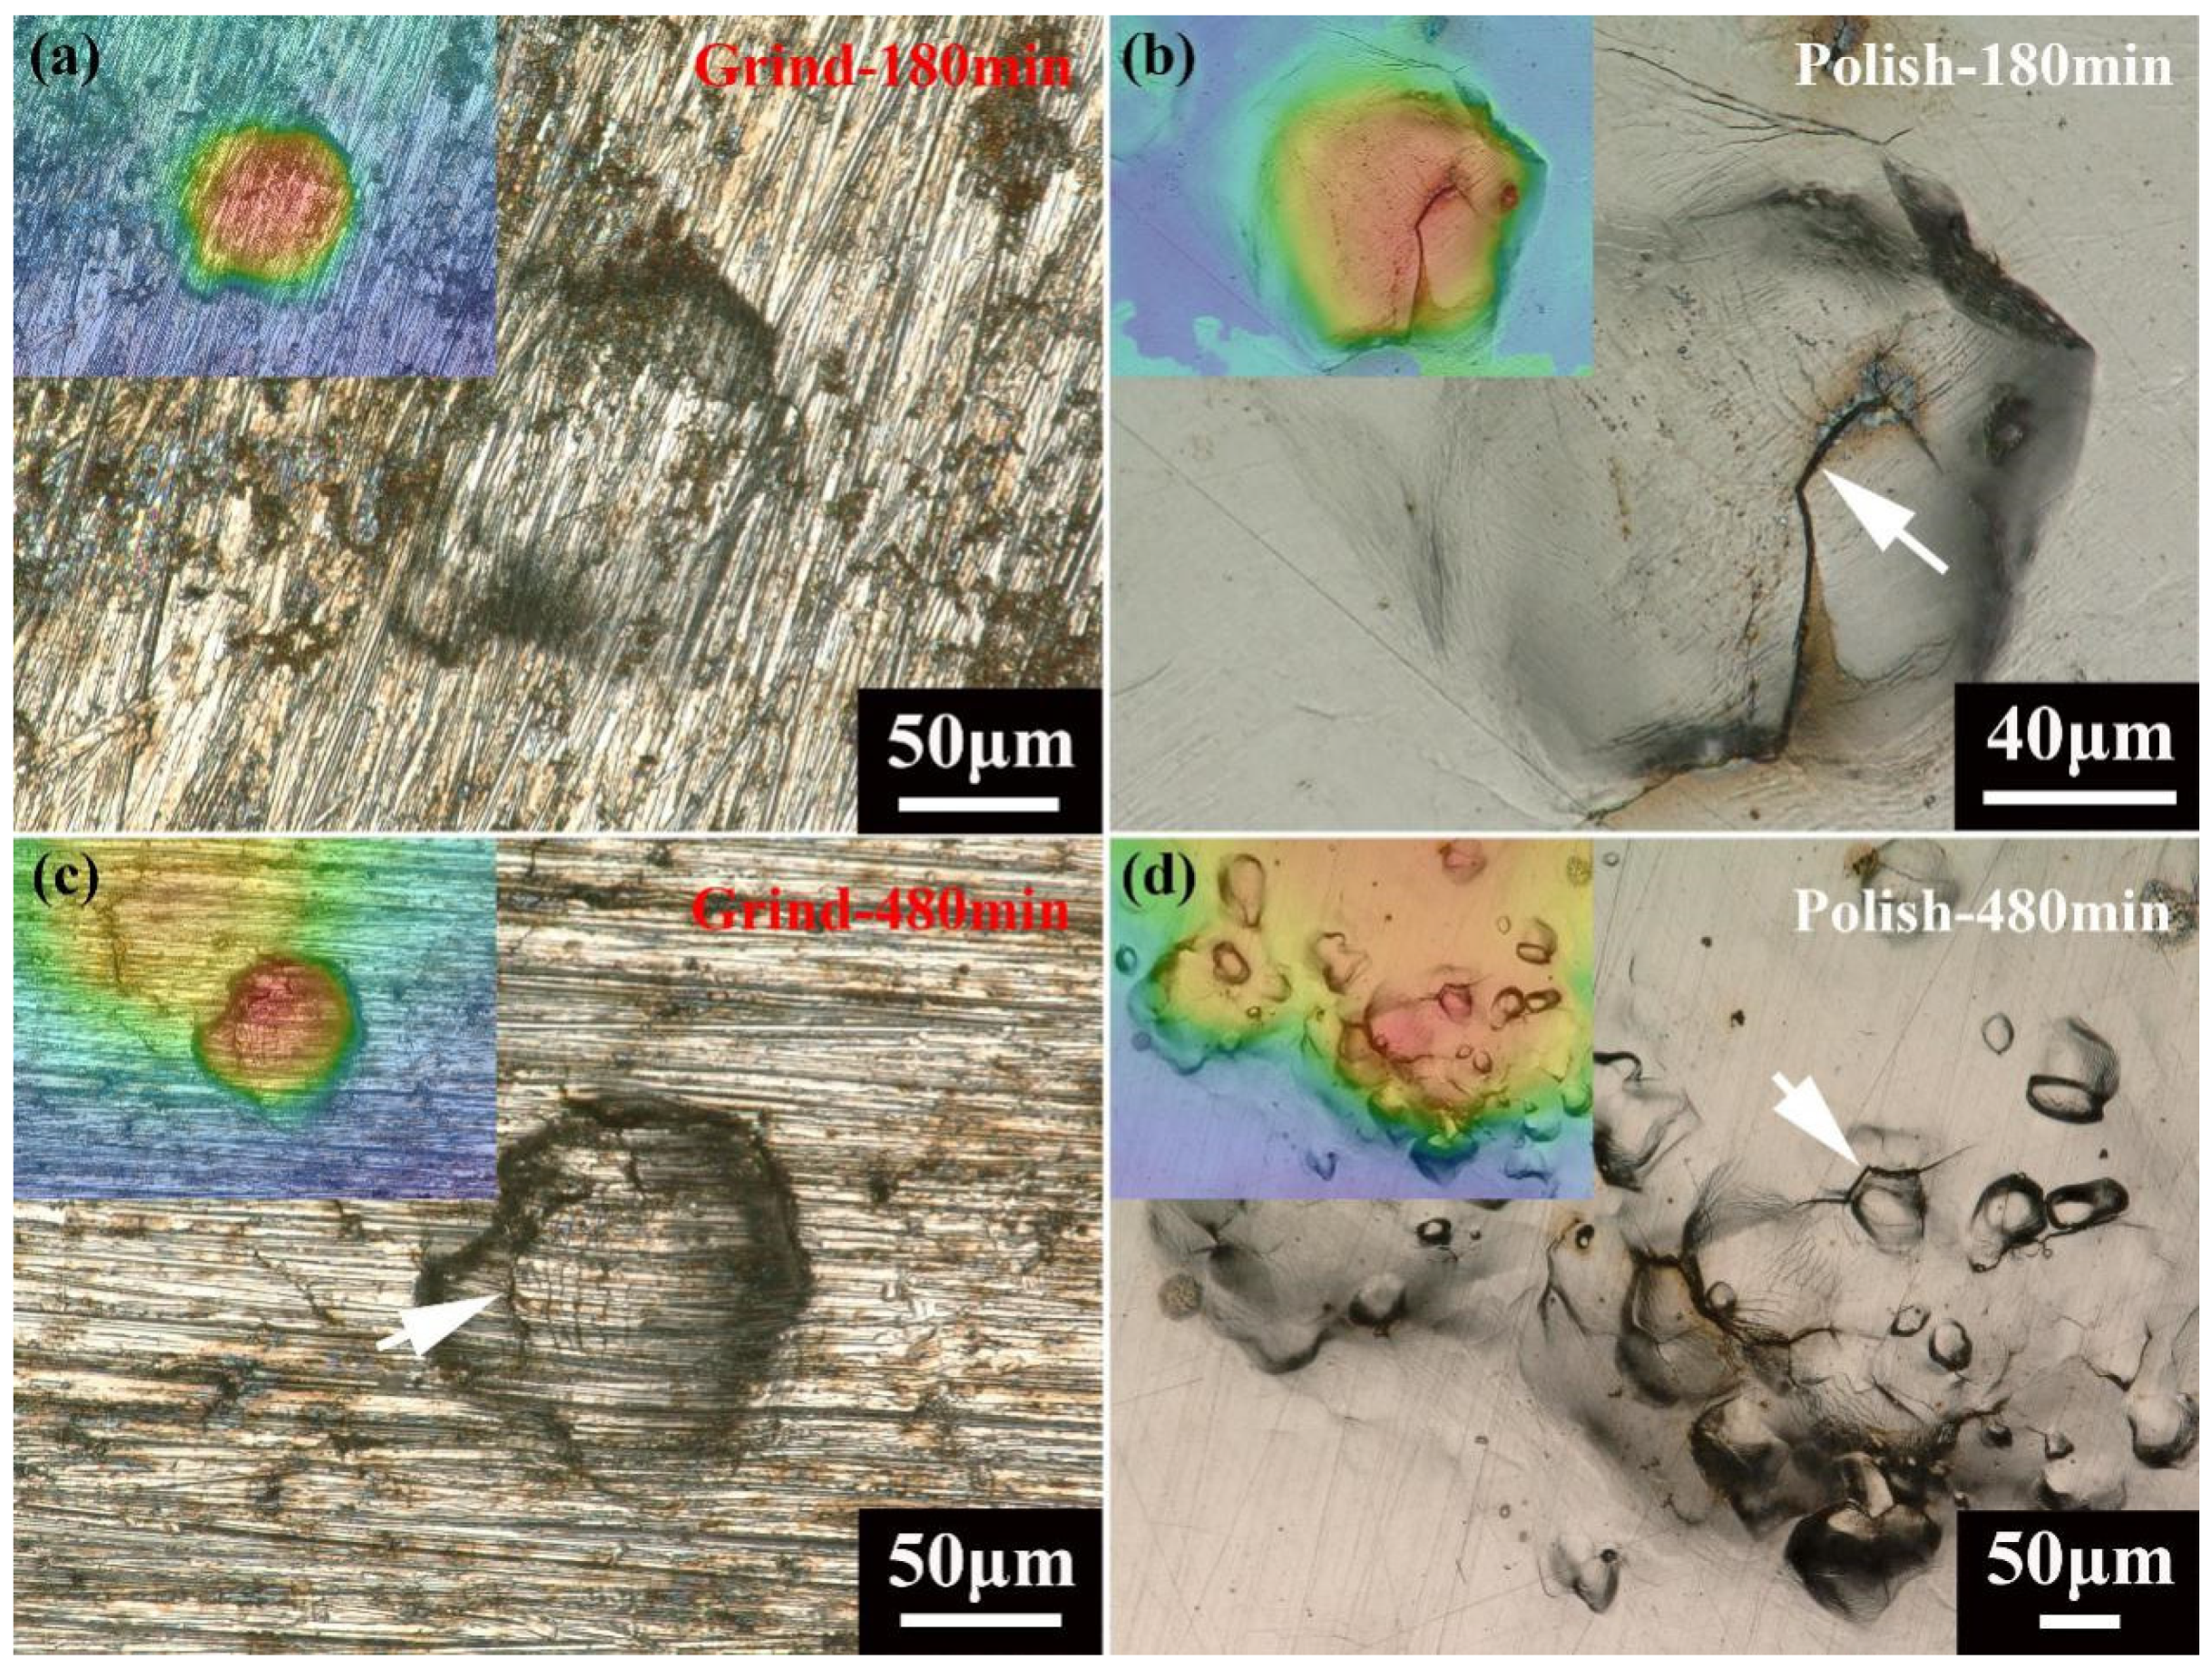
Figure 5 presents hydrogen blisters on grinded and polished surfaces under various hydrogen charging times. Both surfaces show obviously different hydrogen blister behavior and hydrogen blisters strongly correlate with surface conditions. The grinded surface exhibits a very limited number of hydrogen blisters. Specifically, no blister is observed for the grinded sample surface charged 10 min (Figure 5a), and the samples charged 180 min and 480 min present several isolated blisters (Figure 5c,e). In contrast, polished surface shows considerable hydrogen blisters (Figure 5b,d,f) under the same hydrogen charging time. Additionally, the differences of surface roughness corresponds to various blister morphology. The blisters on the grinded surface clearly exhibit an overall oval or circular shape, whereas polished surfaces show two types of blister morphology. One is single dome-like blisters with various sizes and the other is large dome-like blisters, on which some of the small blisters are superimposed. For both grinded and polished sample surface blisters, careful observation indicates that more blisters crack with an increase in hydrogen charging time, as indicated by a white arrowhead in Figure 6.
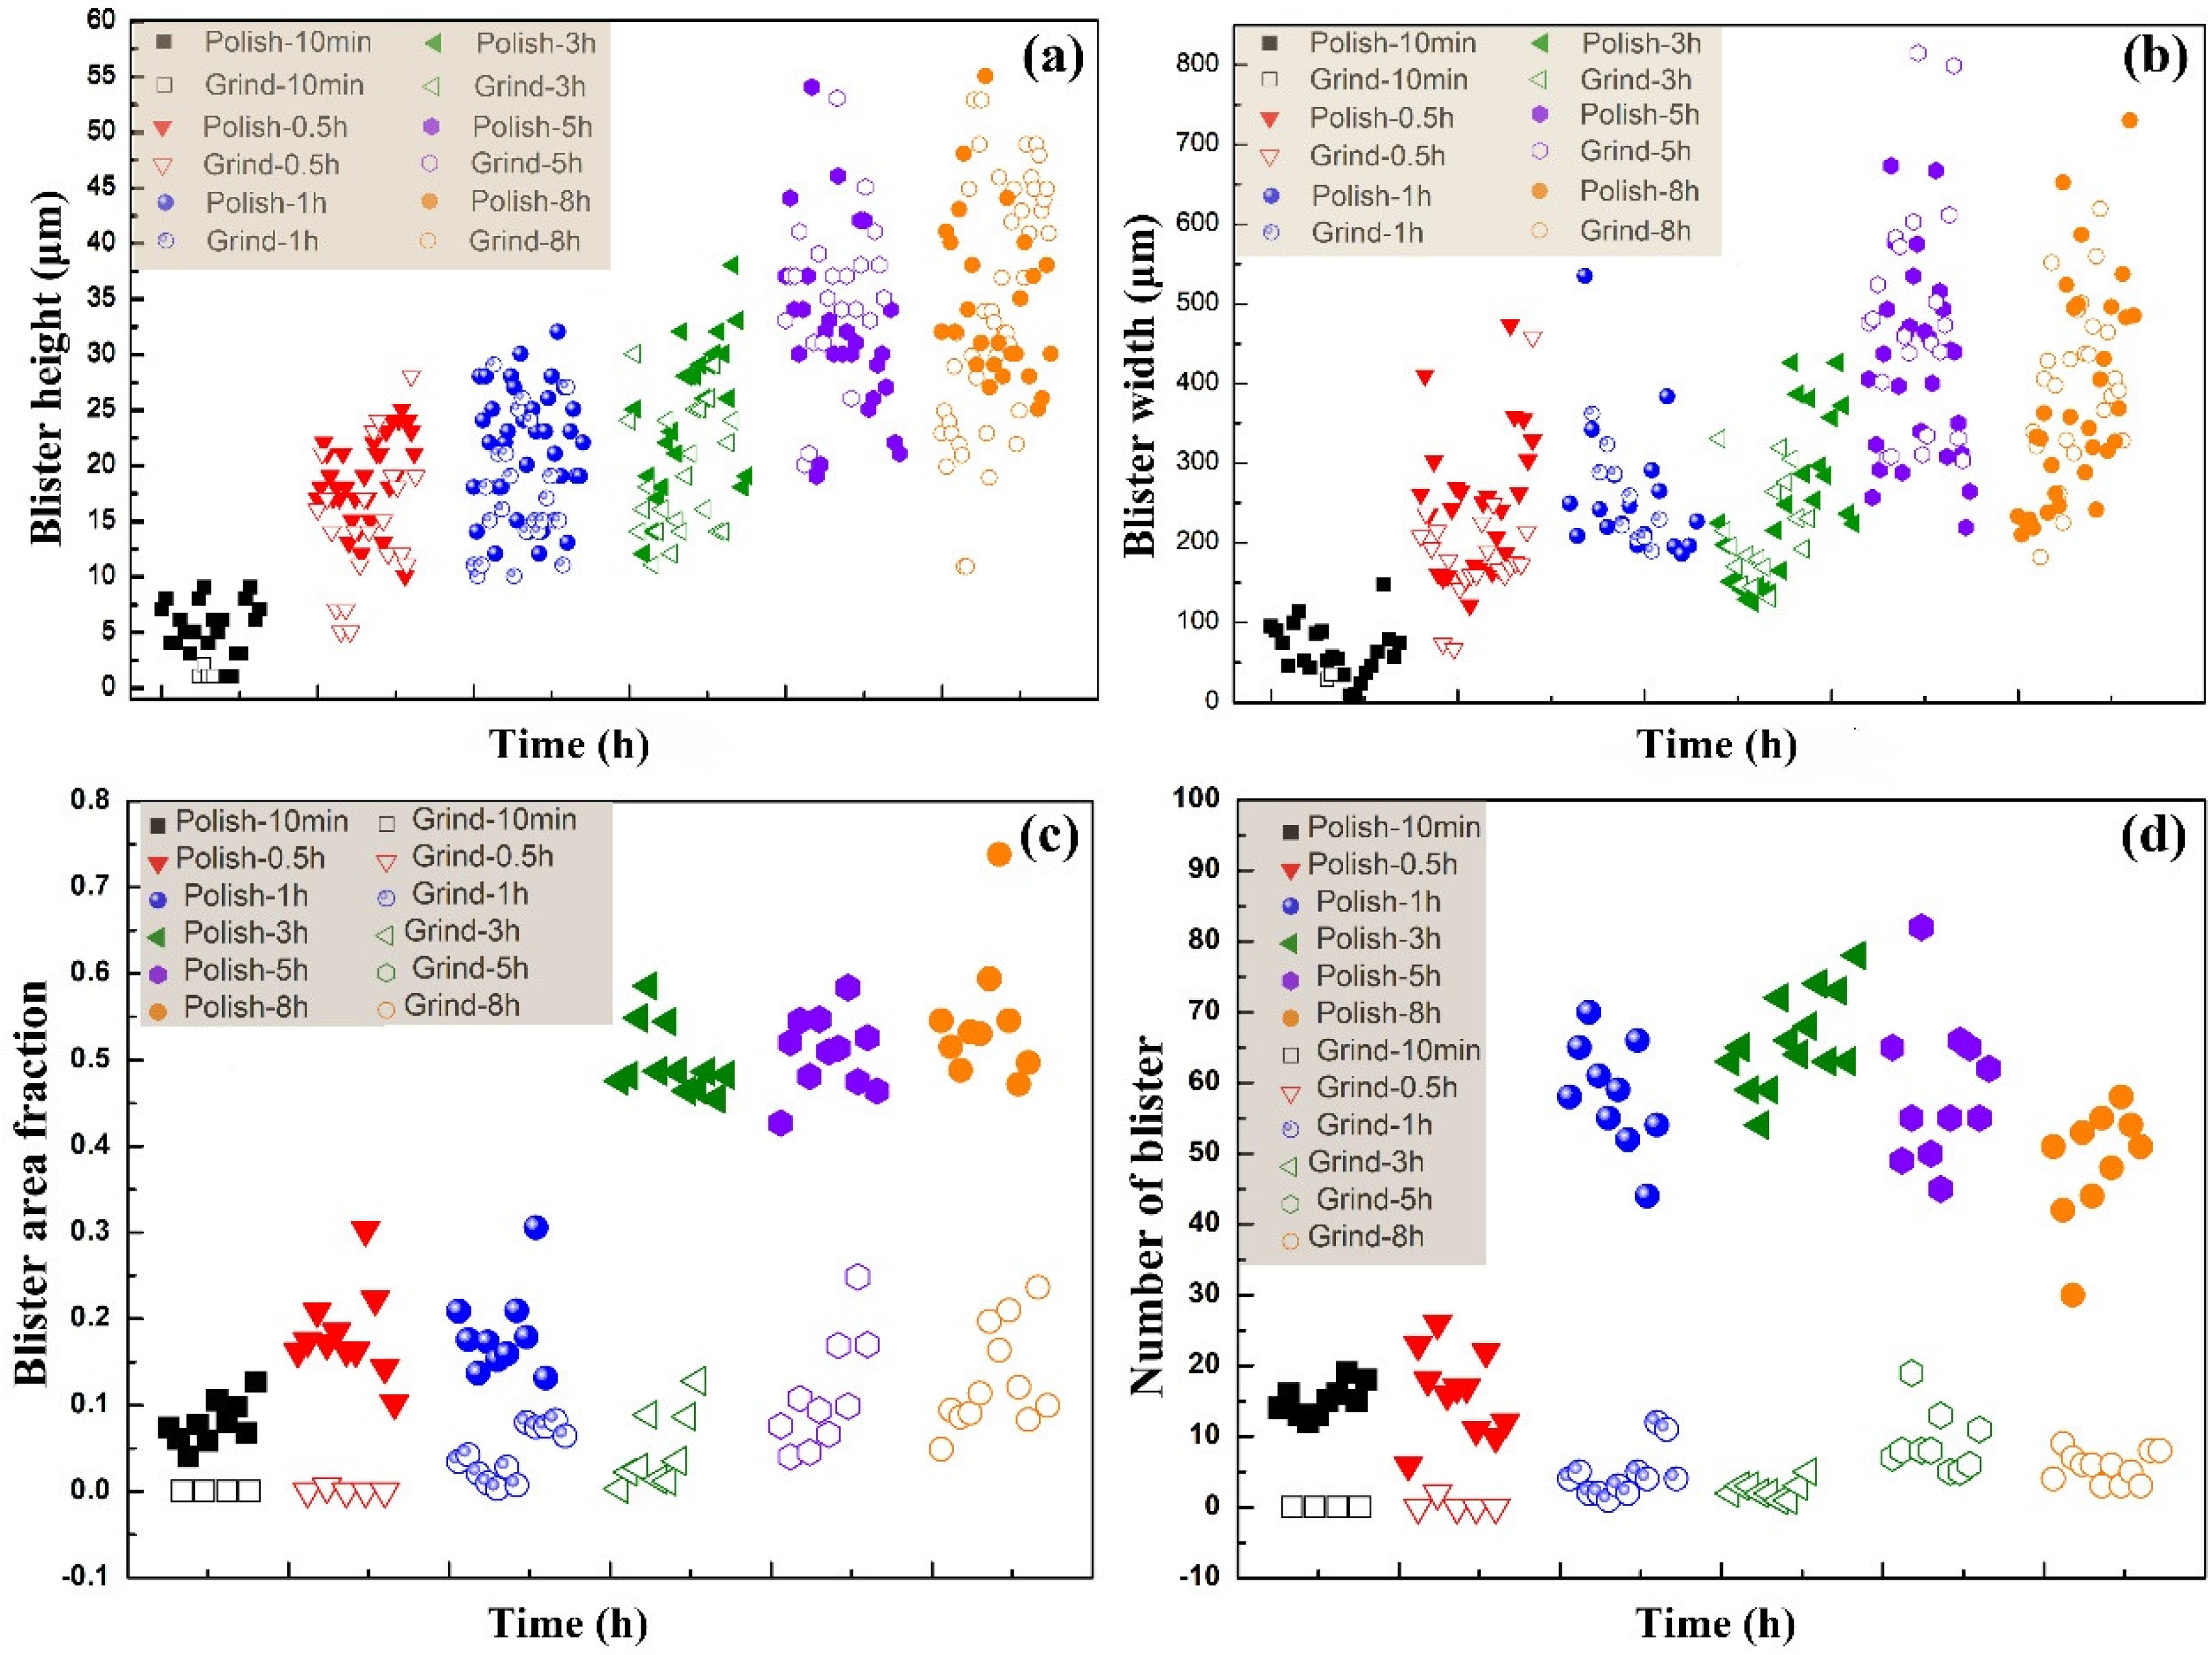
Figure 7 presents statistic results of hydrogen blister parameters on grinded and polished surfaces. With increasing hydrogen charging time, the values of blister height, blister width and blister area fraction present increasing trend independence of grinded and polished surface (Figure 7a–c), whereas the number of blisters on grinded and polished surface appears to increase before plateauing and then falls again (Figure 7d) due to the mergence of small blisters to large blisters (Figure 6d). There is no considerable difference on blister height and blister width between grinded surface and polished surface at the same hydrogen charging time, as shown in Figure 7a,b, respectively. For a grinded and polished surface, blister height varies from 1 to 60 μm and corresponding blister width is in the range from 10 to 800 μm. Interestingly, the blister area fraction and the number of blisters on polished surface is much higher than those of grinded surface (Figure 7c,d). The maximum blister area fraction and blister number are of 0.78 and 80 for polished surface and is approximately 0.25 and 15 for the grinded surface, respectively, indicating that polished surface is in favor of generating hydrogen blisters. Quantitative relationship between hydrogen blister parameters and hydrogen charging times is summarized as follows:
Blister width = 0.5245Time + 177.96 R2 = 0.6073 Polished surface
Blister width = 0.6145Time + 151.17 R2 = 0.6145 Grinded surface
Blister height = 0.0494Time + 14.117 R2 = 0.7485 Polished surface
Blister height = 0.0613Time + 9.605 R2 = 0.7747 Grinded surface
Blister area fraction = 0.001Time + 0.157 R2 = 0.7861 Polished surface
Blister area fraction = 0.0003Time + 0.157 R2 = 0.9054 Grinded surface
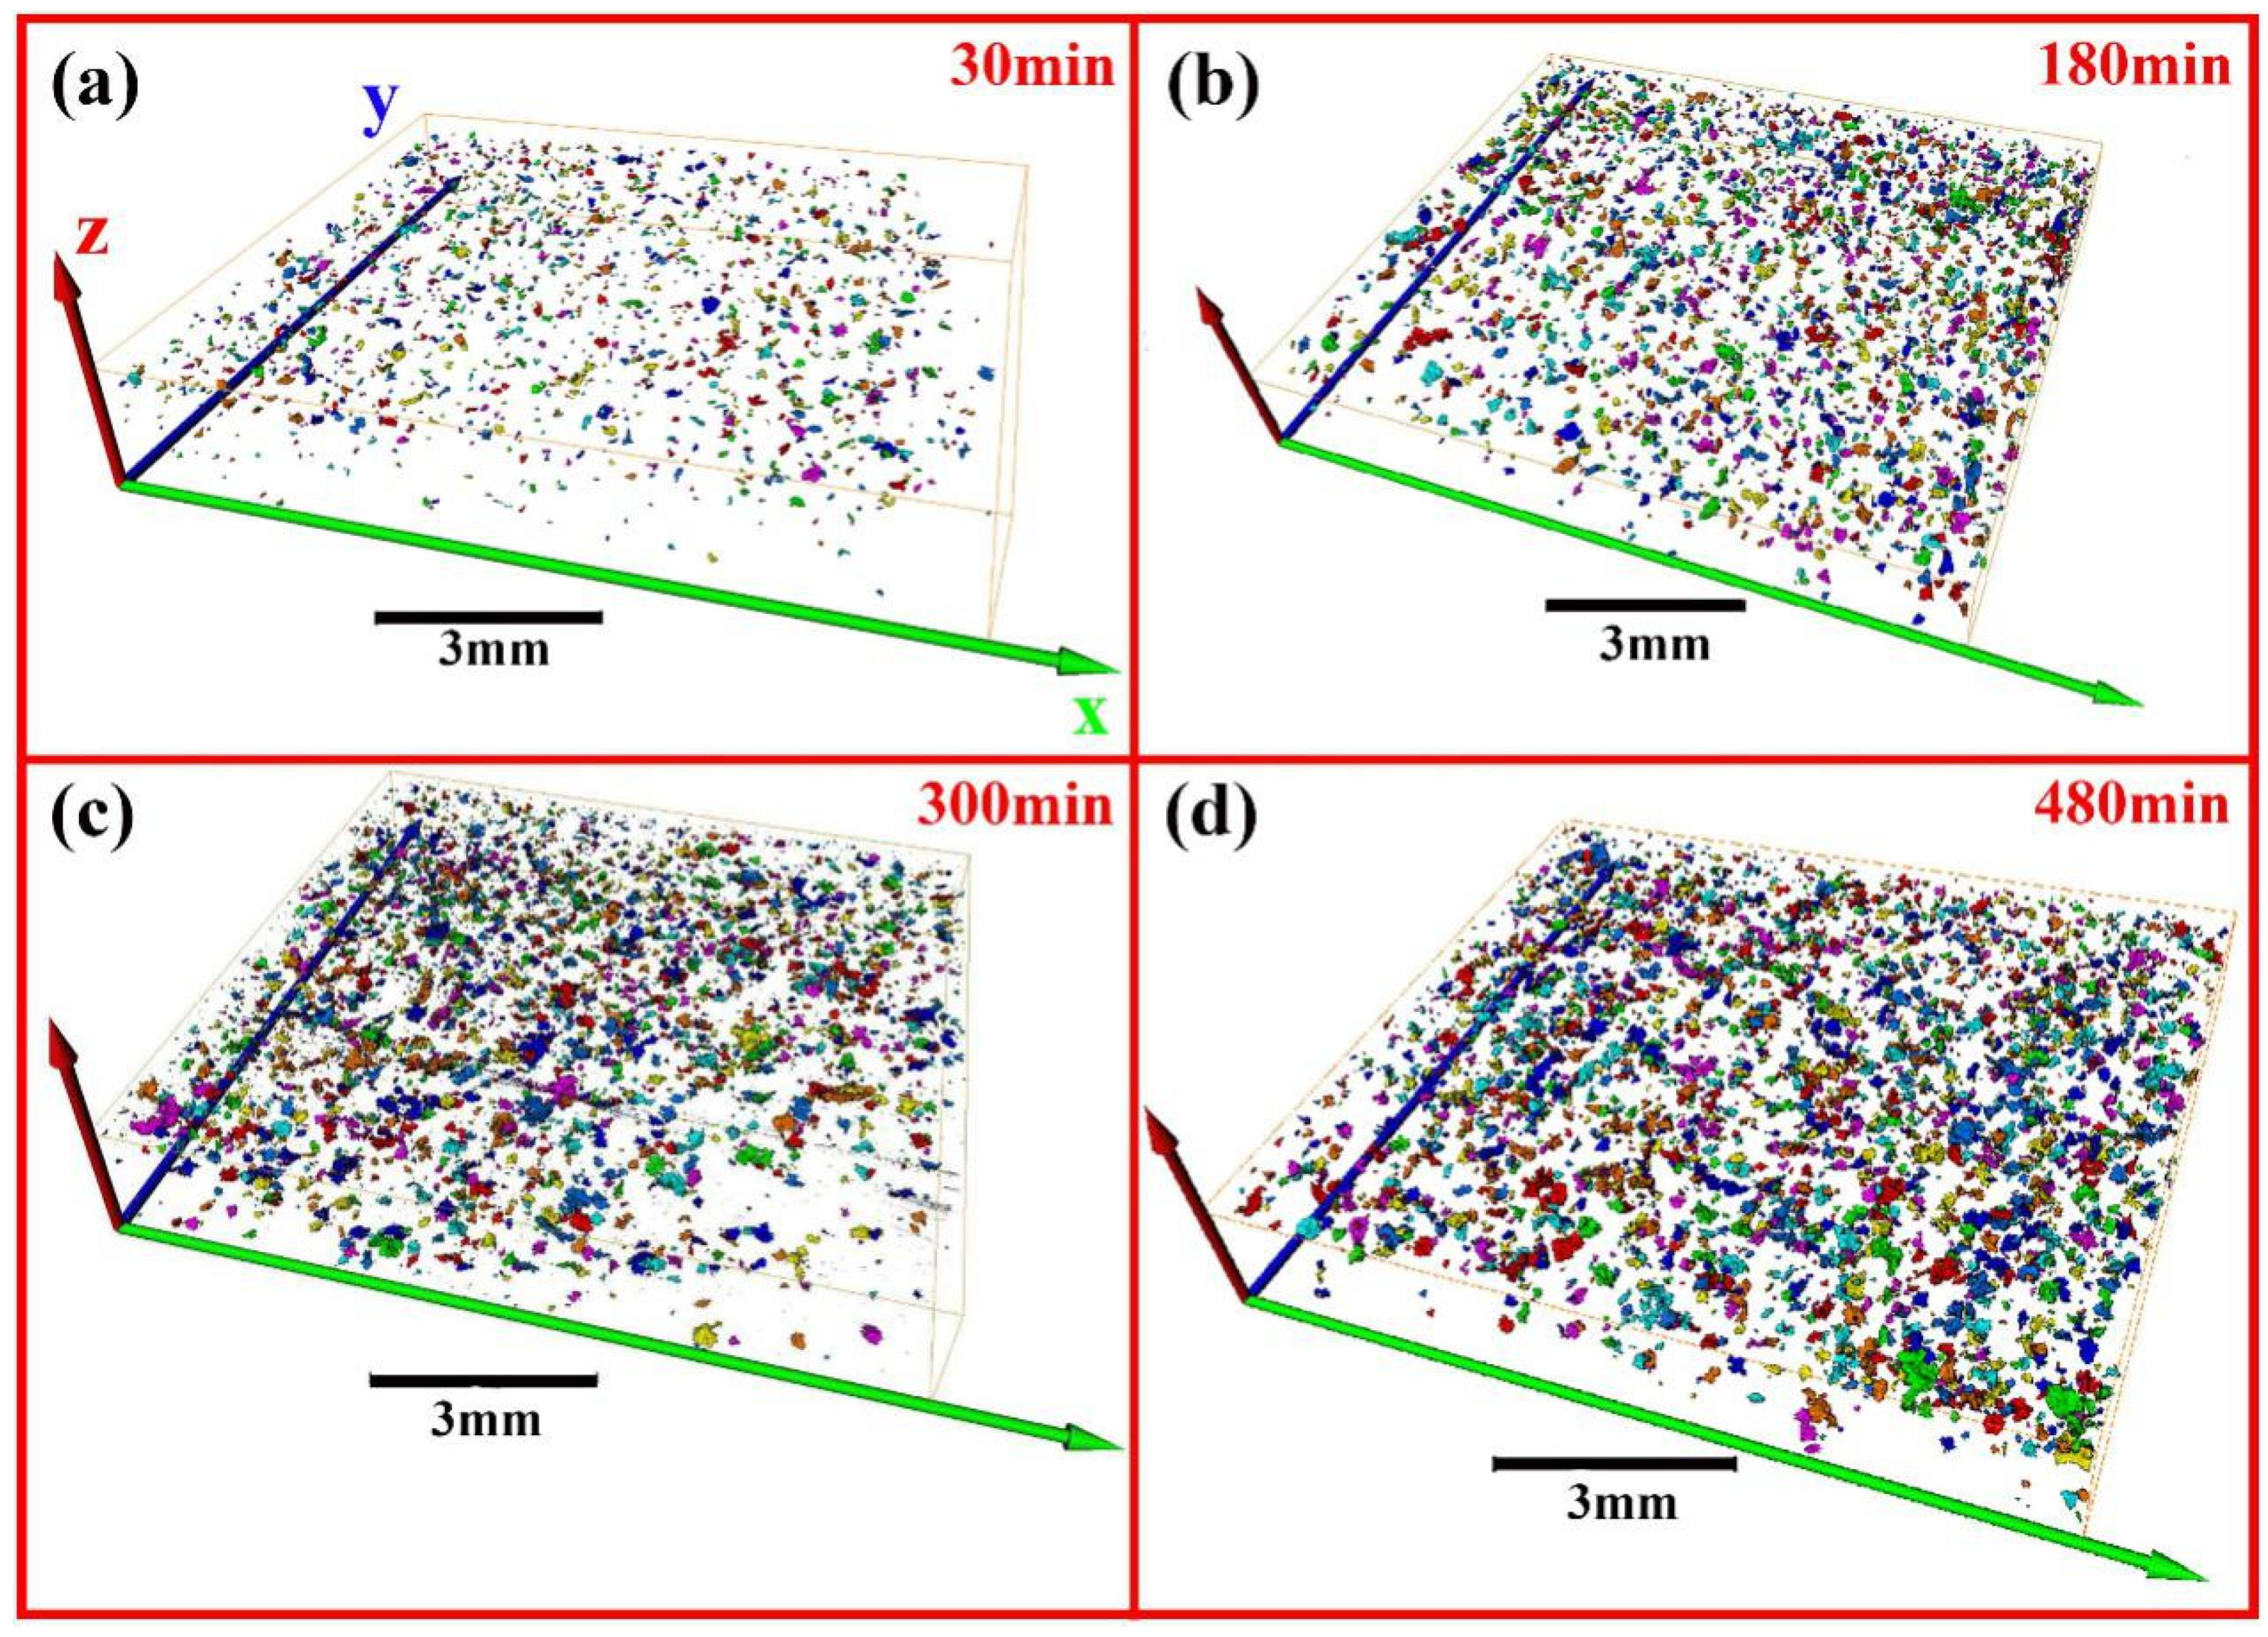
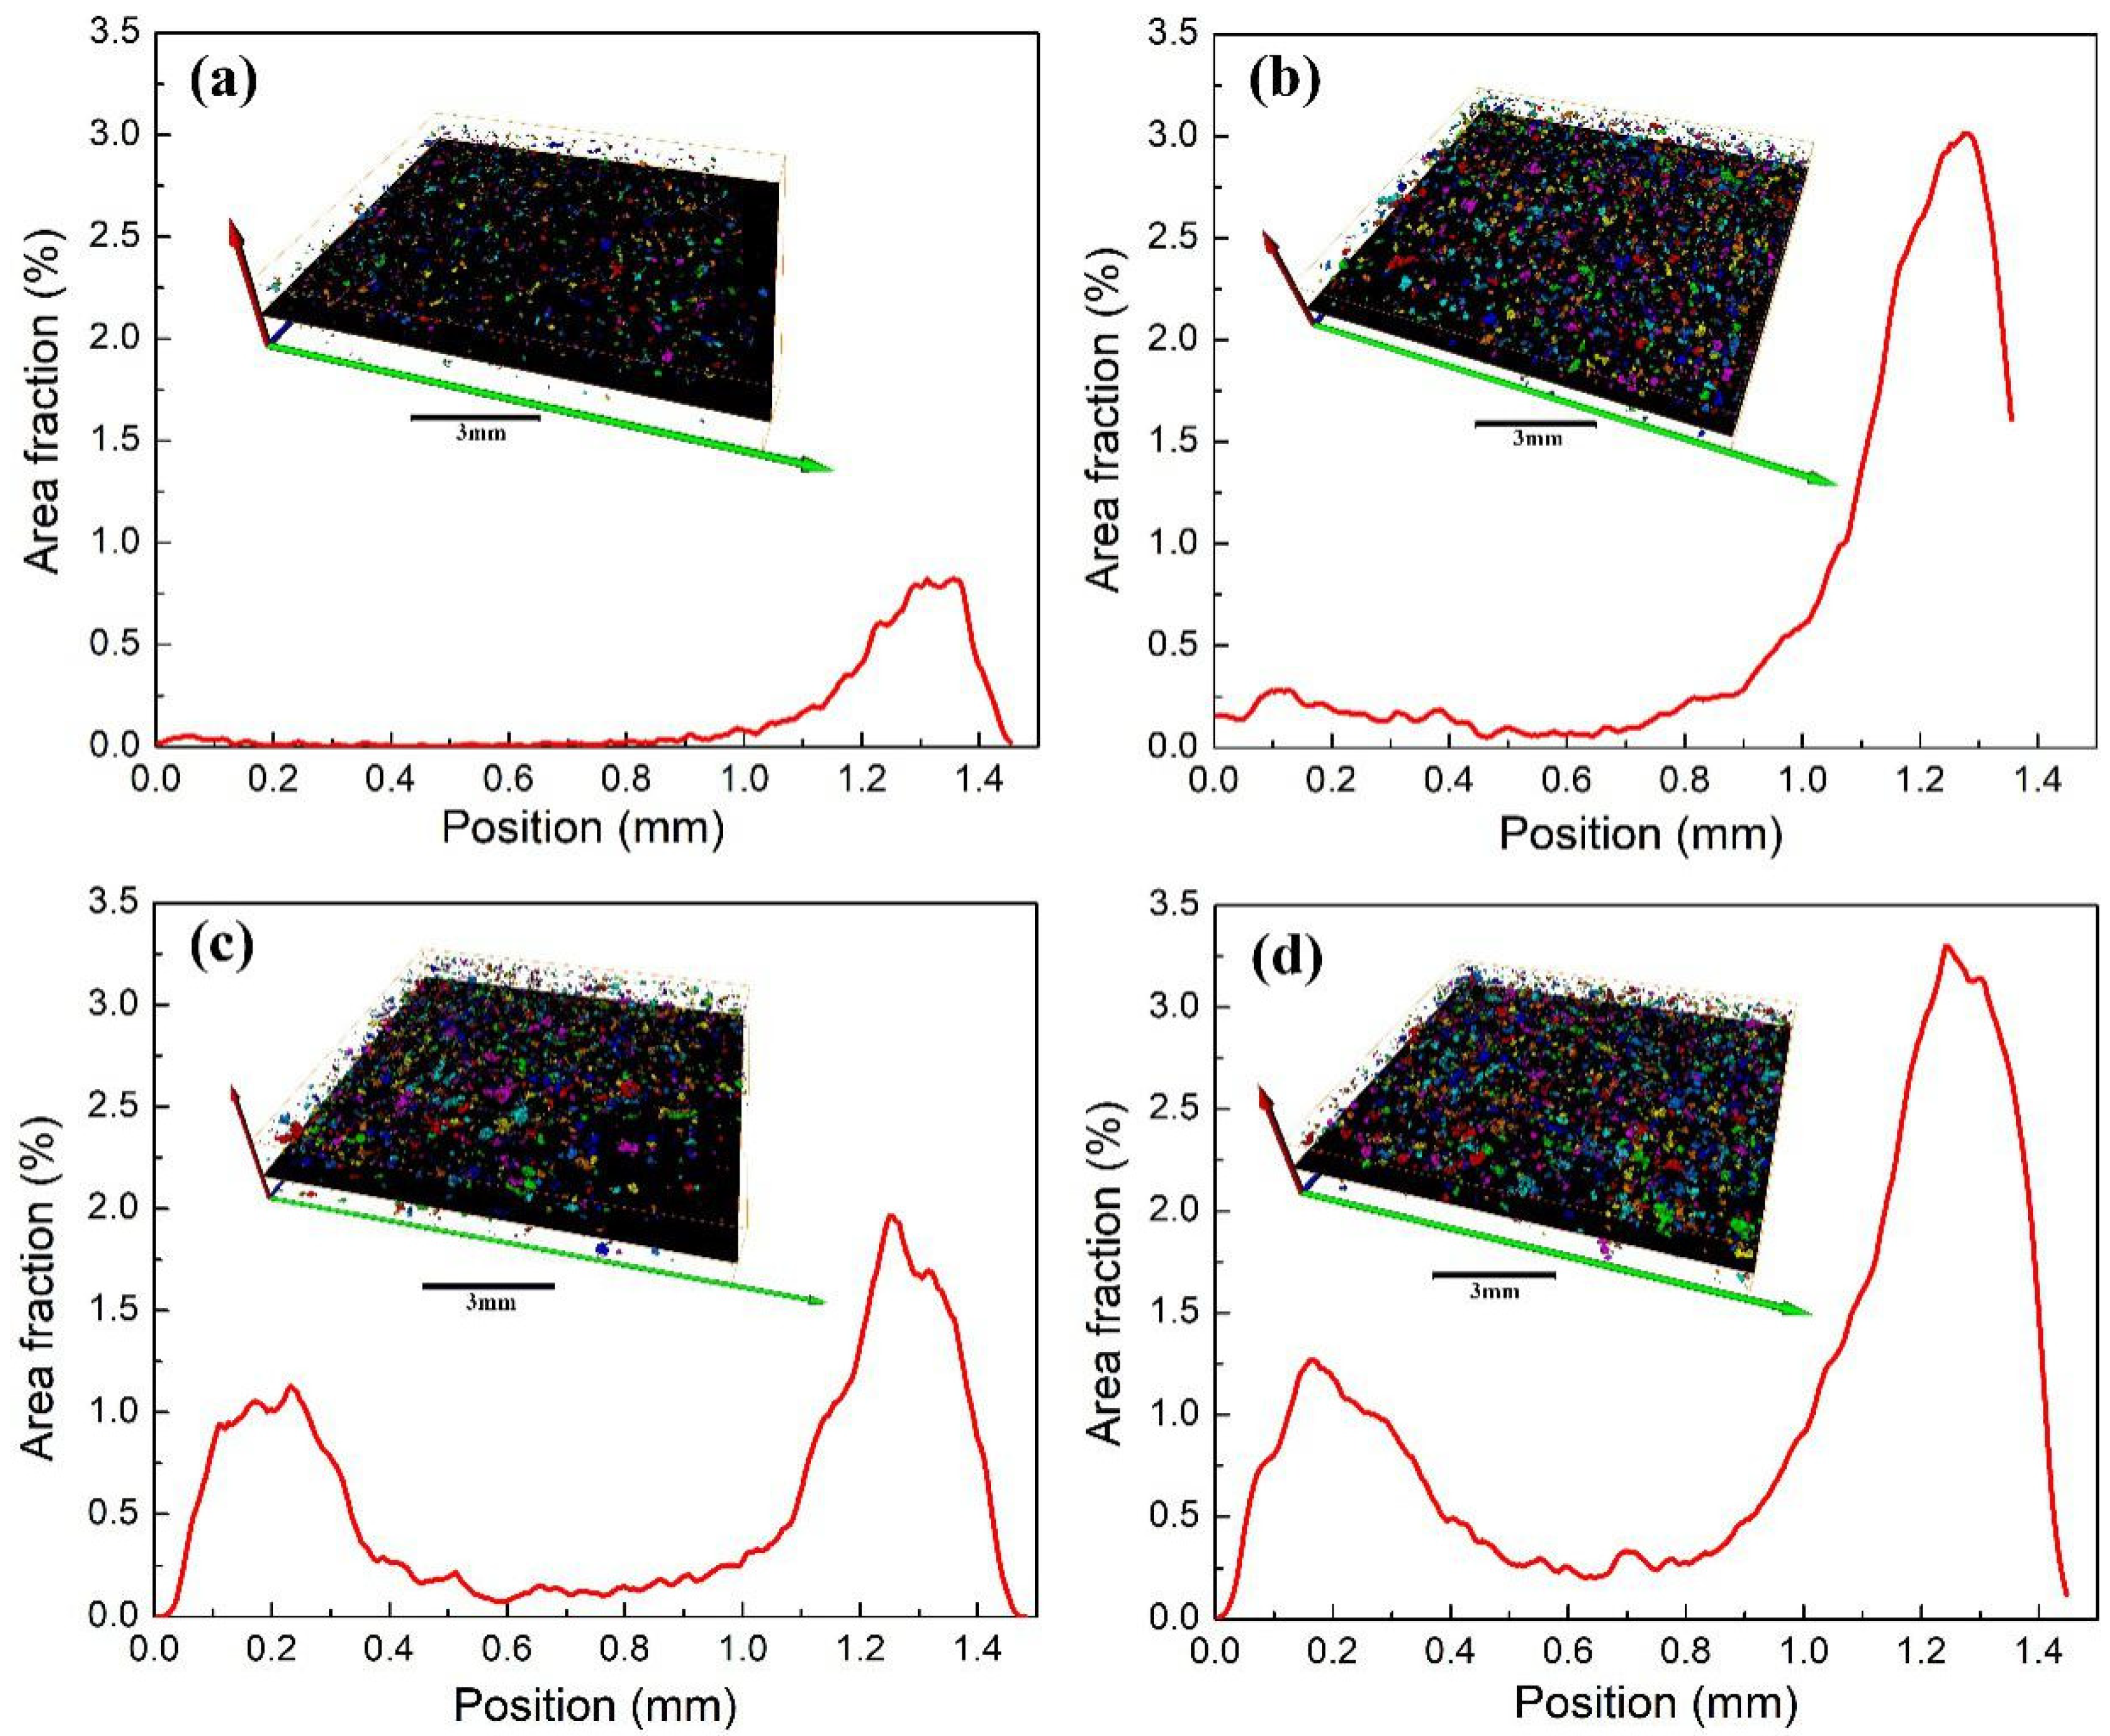
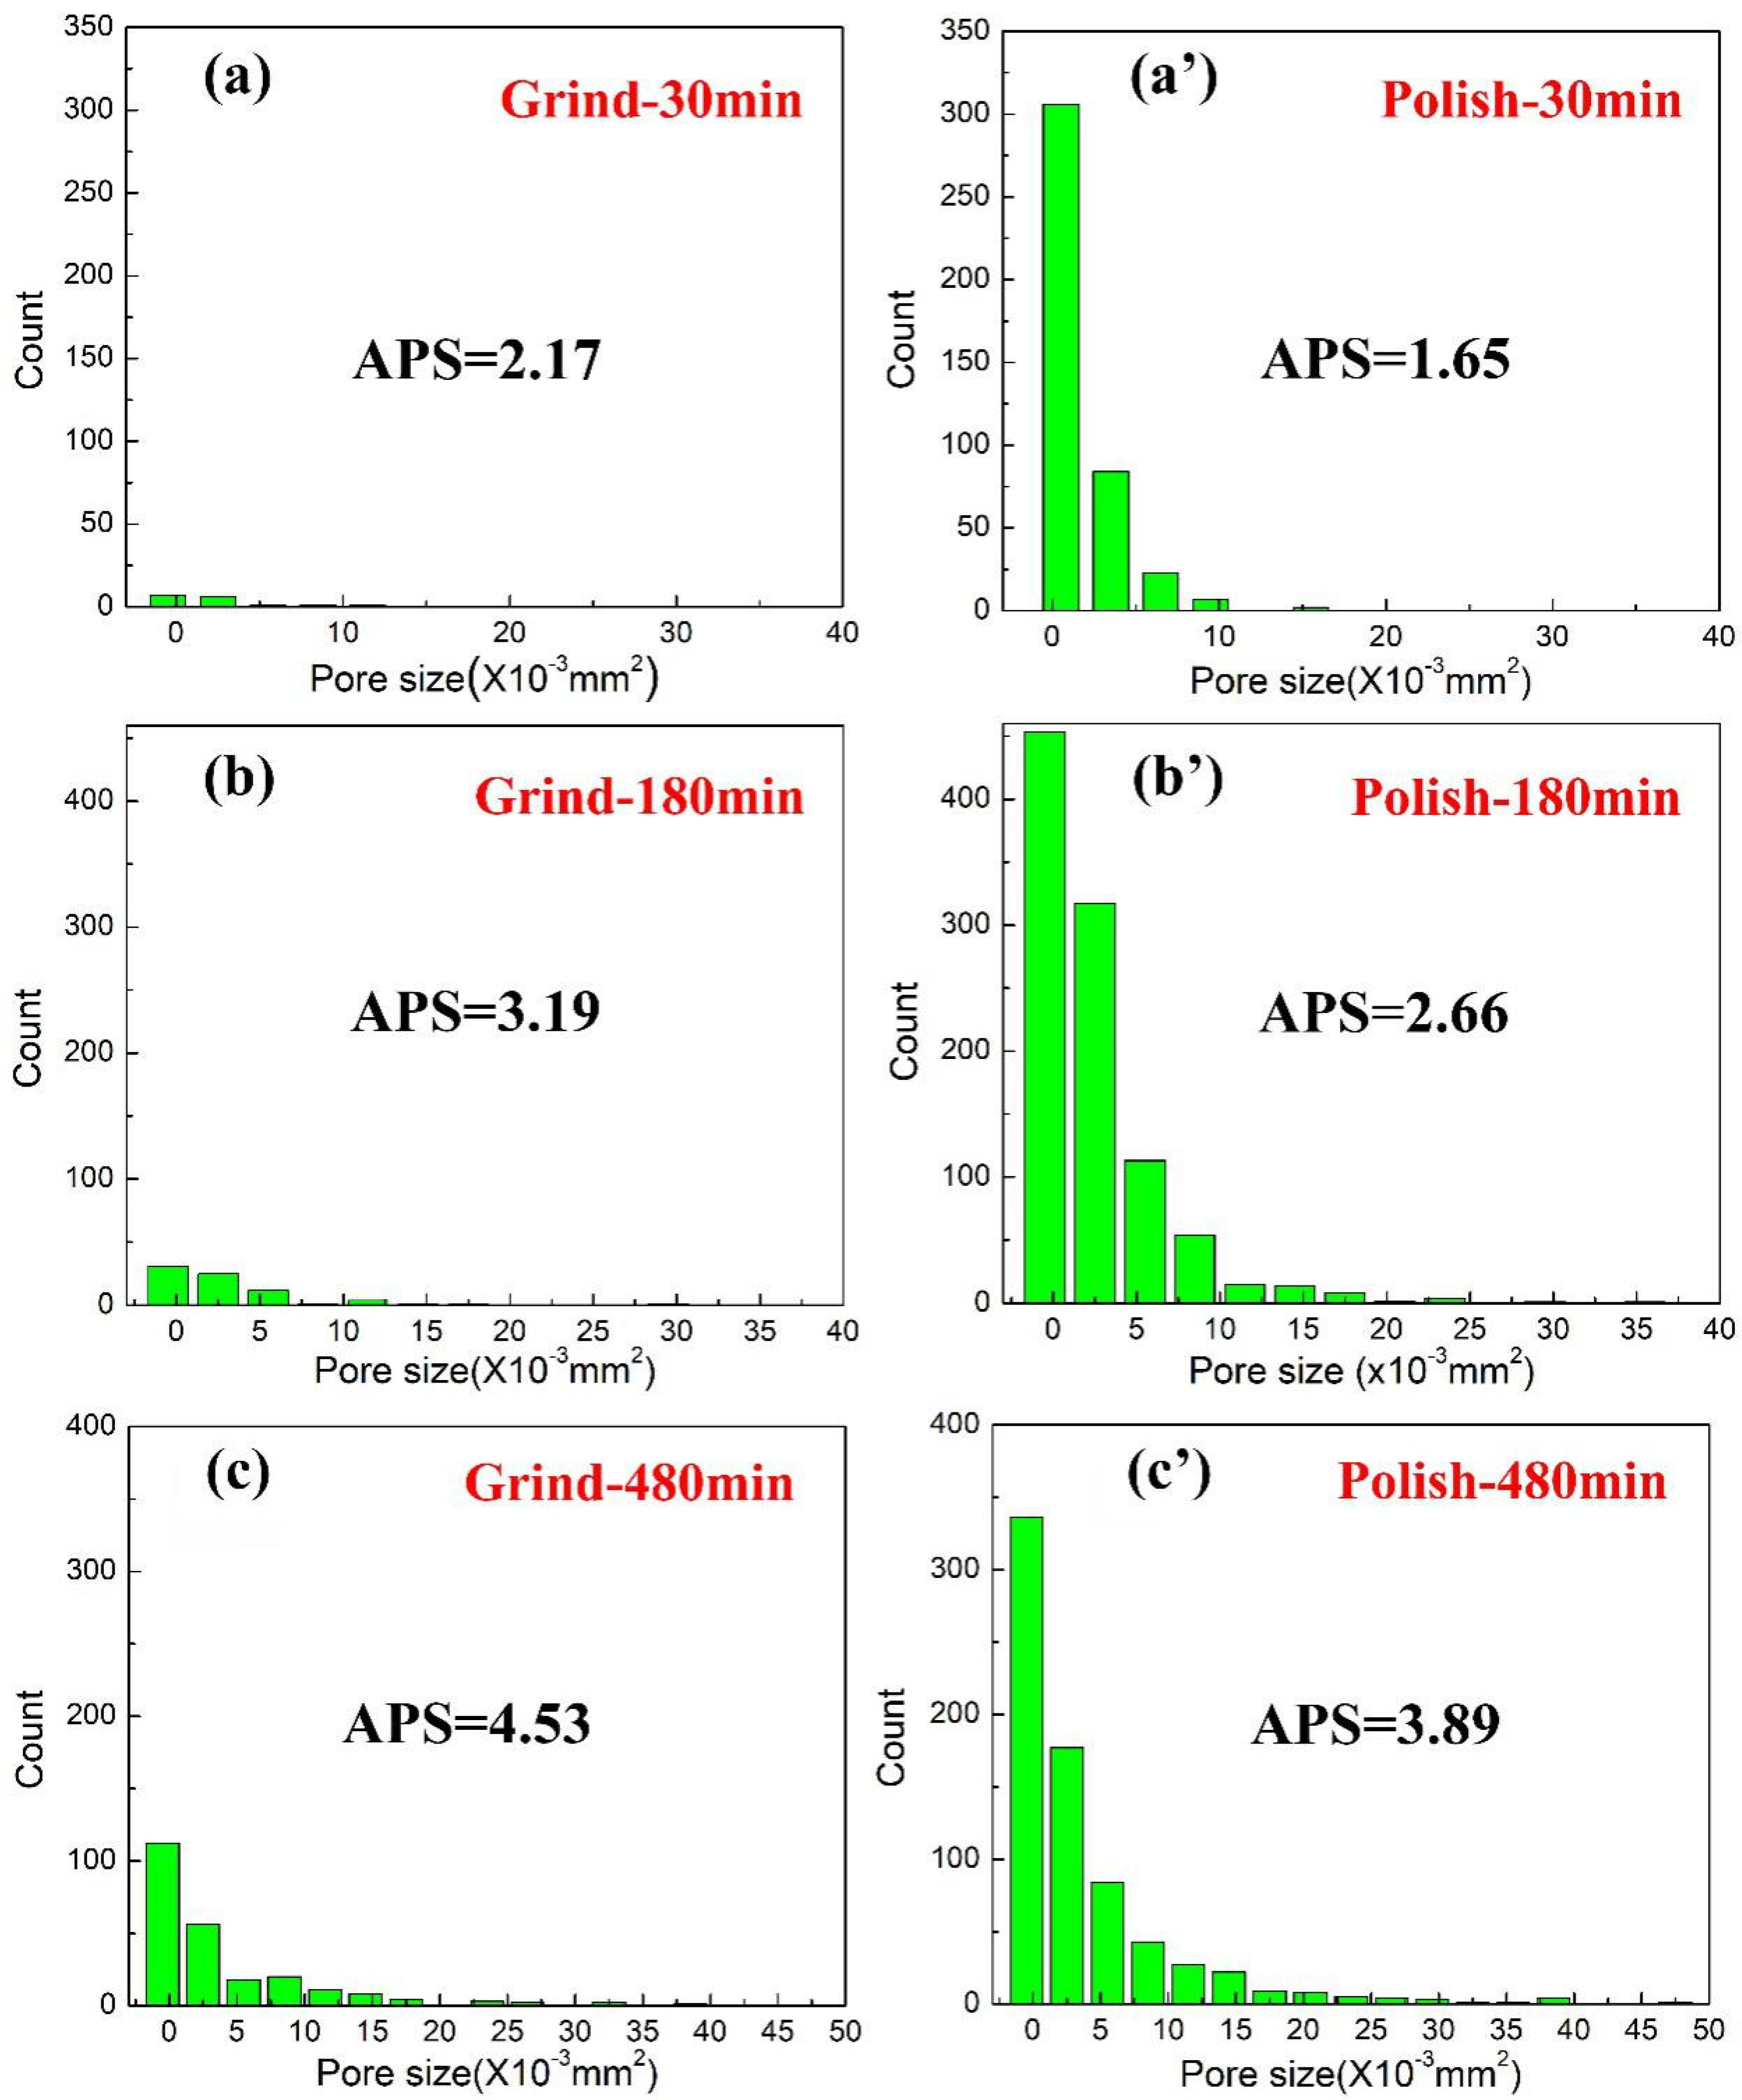
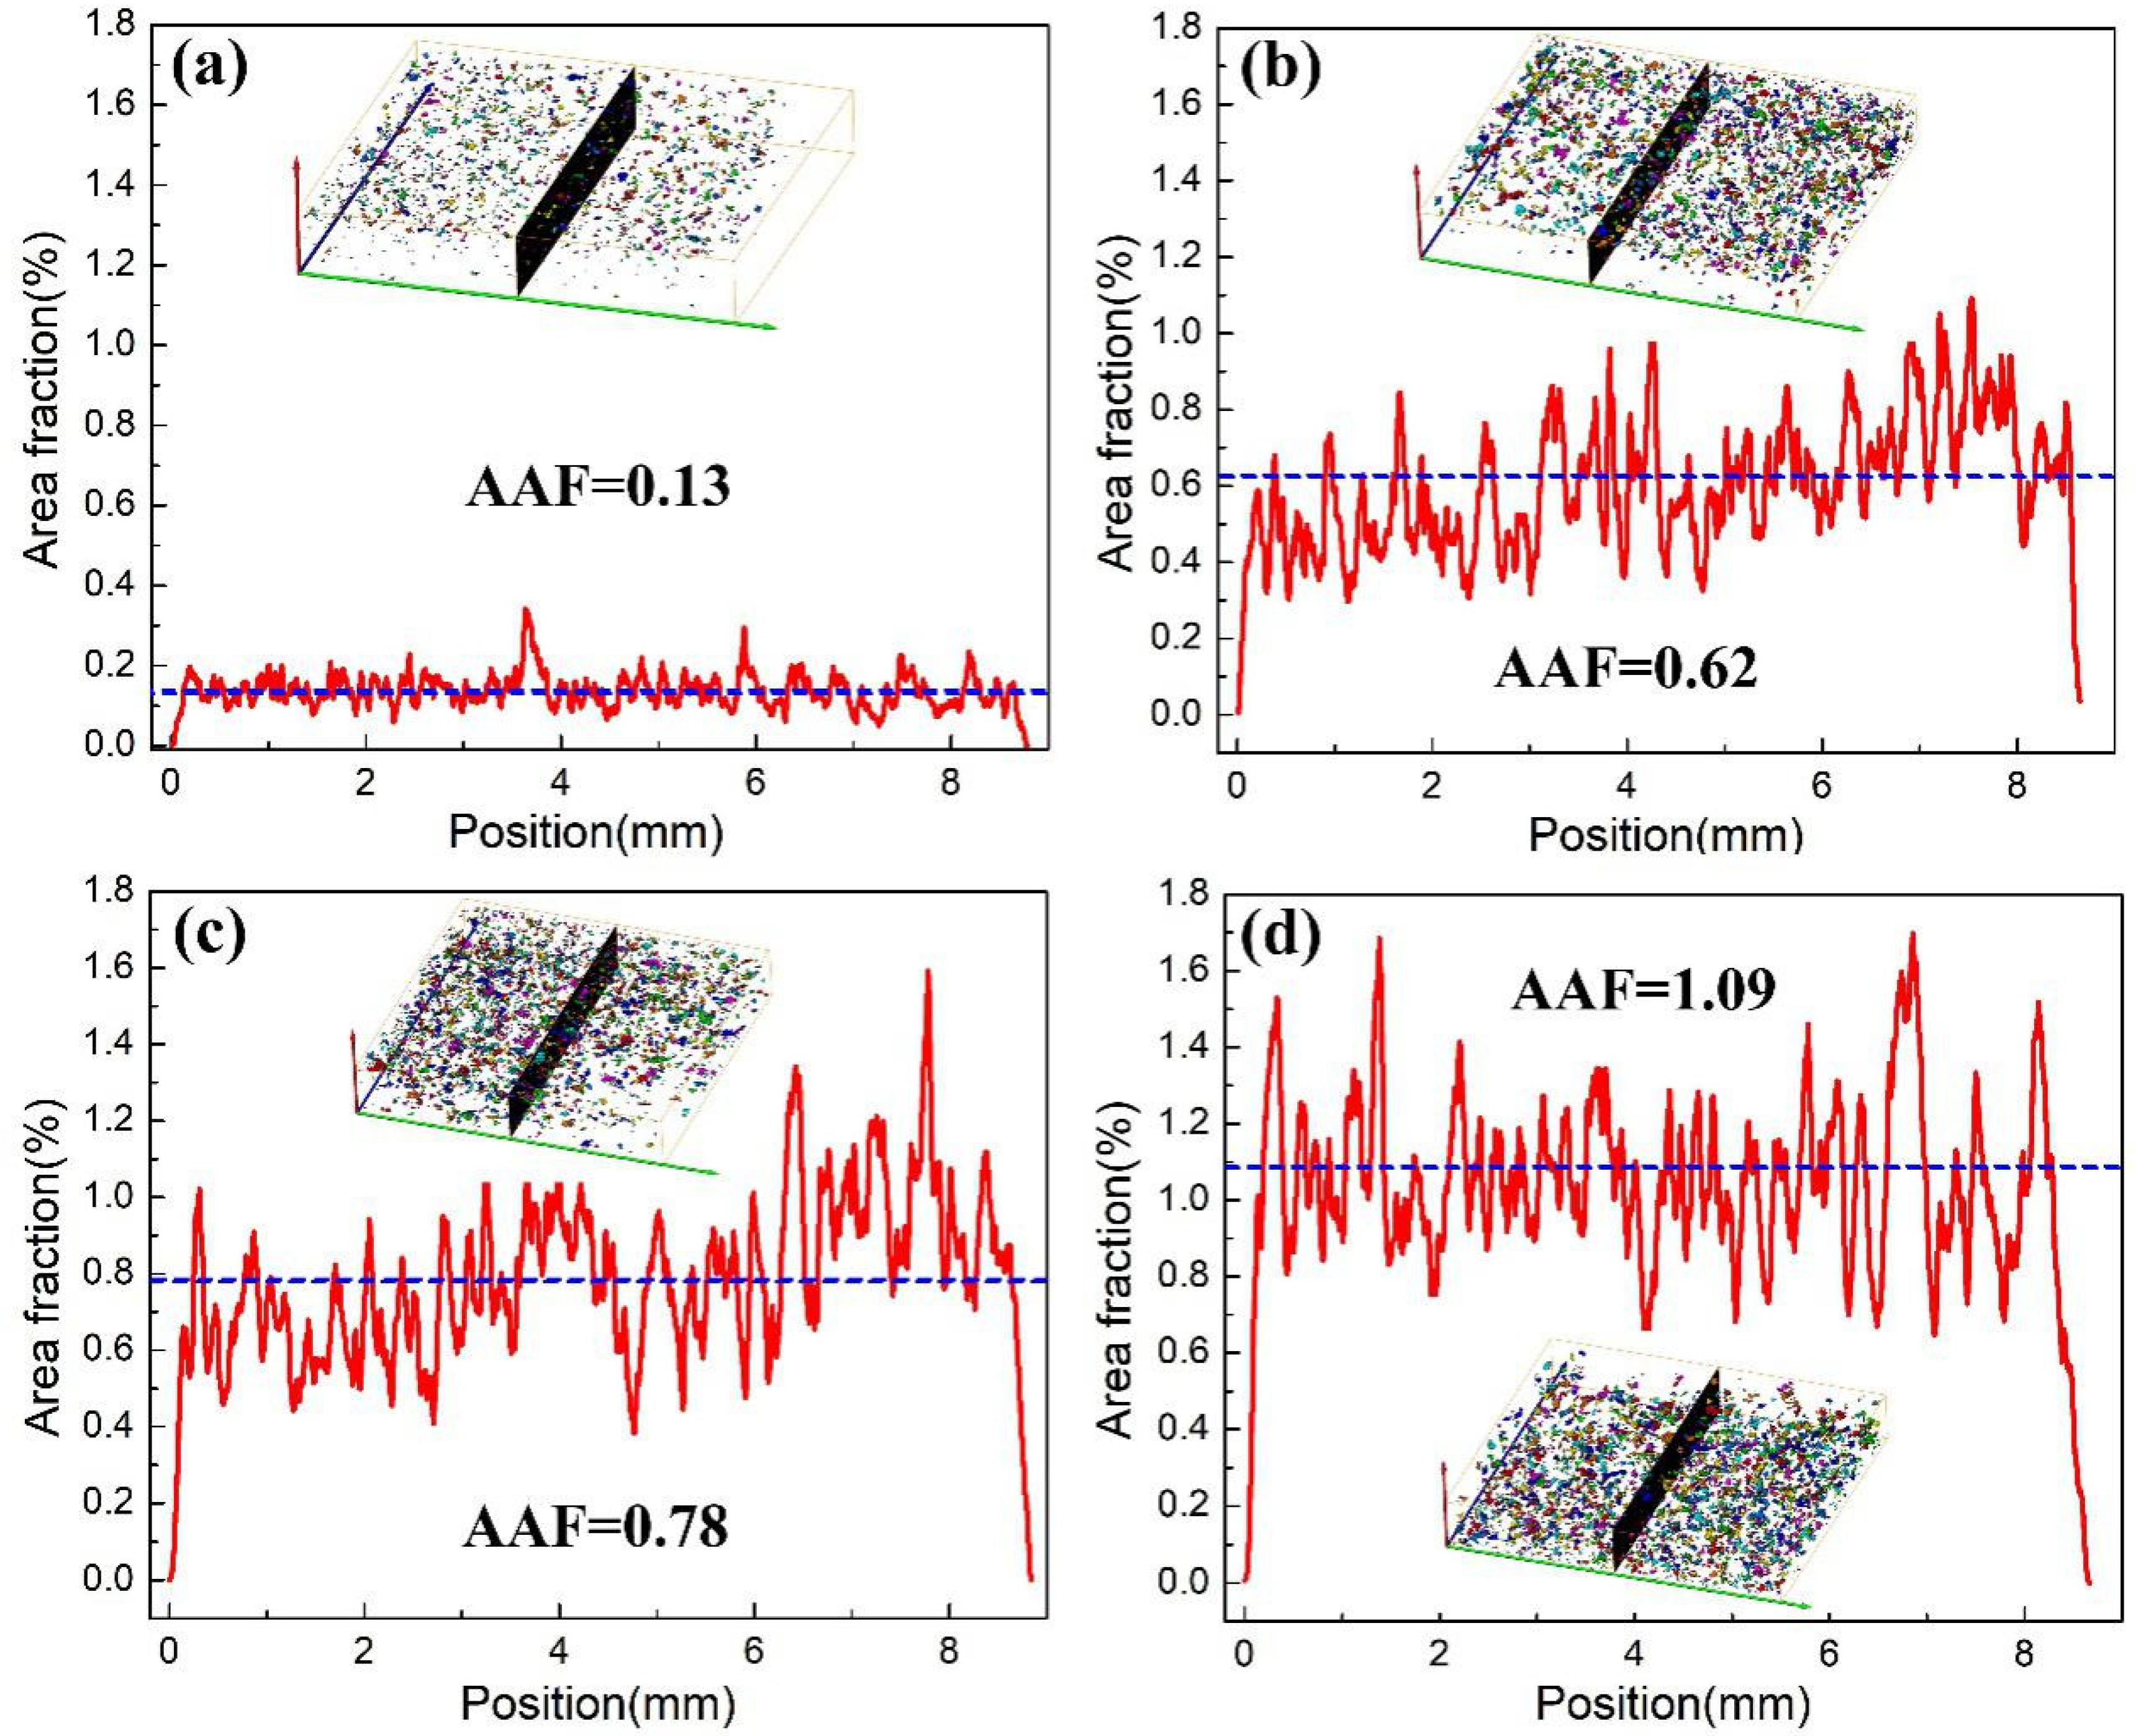
A set of radiographic projections was reconstructed to yield a 3-D model of the samples. This offers a precise 3-D visualization and quantitative analysis of hydrogen blisters in the bulk iron specimens. Figure 8 gives 3-D reconstruction of the overall samples, showing that the density and size of hydrogen blisters increase as hydrogen charging time enhances. In order to explore detailed hydrogen blister behavior, a series of slices along xy- and yz-planes in terms of the Cartesian coordinate system shown in Figure 8a were taken out from 3-D reconstructed models. Figure 9 shows the dependence of hydrogen blister area fraction along cross section (xy-plane) at the position from the grinded surface (0 mm) to the polished surface (1.45 mm) on hydrogen charging time. For the sample charged 30 min, only one peak near the polished surface is observed (Figure 9a) and two peaks appear with increasing hydrogen charging time (Figure 9b–d). One is situated near the polished surface and the other is located near the grinded surface. At the same distance from the surface, the blister area fraction near the polished surface is overall higher than that of grinded surface. For example, the value of blister area fraction at the 0.2 mm cross section is 1.32% and it increases to 3.25% at 1.25 mm. Figure 10 shows the histogram of pore area along a cross section at 0.2 mm and 1.25 mm, indicating that the small pore size is dominant for the grinded surface ((0–5) × 10−3 mm2) and polished surface ((0–10) × 10−3 mm2). With an increase in hydrogen charging time from 30 min, to 180 min, to 480 min, average pore size (APS) exhibits an increasing trend from 2170 μm2, to 3190 μm2, to 4530 μm2 near the grinded surface, and from 1650 μm2, to 2660 μm2, to 3890 μm2 near the polished surface. Interestingly, the blister area fraction of center cross section at 0.7 mm is 0, 0.12, 0.18 and 0.32 for 30 min, 180 min, 300 min and 480 min samples, respectively. The hydrogen blister area fraction along the longitudinal section is shown in Figure 11. As expected, the area fraction of pores shows no obvious fluctuations at a given time and an increase in hydrogen charging time leads to the increasing average area fraction (AAF), i.e., 0.13% for 30 min, 0.62% for 180 min, 0.78% for 300 min and 1.09% for 480 min. The relationship between AAF and hydrogen charging time is quantified as:
Average area fraction = 2.0634Time + 0.0014 R2 = 0.94
4. Discussion
As shown in Figure 5, Figure 7 and Figure 8, the polished surface is more susceptible to the formation of blisters than the grinded surface in light of surface and internal hydrogen blisters. This result is partially correlated with previous studies from Warrier et al. [25], Dong et al. [26] and Escobar et al. [27], who reveal that hydrogen blisters or the hydrogen diffusion behavior of alloys increase with a reduction of surface roughness. However, the novelty of this study is that the relationship between surface/internal blister parameters and hydrogen charging time is quantitatively described for grinded and polished surfaces. According to the hydrogen pressure theory [21], hydrogen atoms from the combination of hydrogen ion with electron during charging adsorb onto the metallic surface, diffuse towards the interior of the alloy, accumulate at hydrogen trapping sites and combine into hydrogen molecules with high pressure. Once the pressure reaches the cohesive strength of materials, hydrogen blisters take place. As mentioned in Figure 3, the grinded surface corresponds to deep kinks and ledges, and high chemical energy [28], which can serve as potential adsorption sites of hydrogen. Thus, compared to the polished surface, the grinded surface has high capability of trapping hydrogen, as demonstrated by Song et al. [29], who reported that the AZ31 alloy with higher surface roughness possessed higher hydrogen content, regardless of heat treatment conditions of the alloys. Simultaneously, Hudson et al. [30] stated that the rate of hydrogen absorption enhanced through roughening surface in SAE1020, types 1017 and 1205 steels. In addition, surface electron work function, which represents the minimum energy for electron immigration from solid surface to adjacent region outside of solid, depends on surface conditions. With an increase in surface roughness, the value of electron work function decreases [28,31]. During hydrogenation, hydrogen atoms are produced through combining hydrogen ions with an electron. This process is accelerated by the grinded surface in comparison with the polished surface. Based on two viewpoints above, it is summarily concluded that the grinded surface should facilitate the formation of hydrogen blisters. However, compared to the polished surface (−87.49 MPa), a large residual compressive stress is formed on the grinded surface (−167.51 MPa). Residual compressive stress lowers lattice spacing, leading to the retardation of hydrogen invasion and the suppression of local hydrogen accumulation. Li et al. [32] revealed that hydrogen diffusion behavior of PSB1080 steel decreased owing to surface compressive stress. Similarly, the suppression of hydrogen diffusion caused by compressive stress are evidenced by Takakuwa et al. [33,34], Yu et al. [35], Toribio et al. [36] and Wang et al. [37]. For alloys, hydrostatic stress is dominant for hydrogen distribution to some extent and it is affected by compressive stress. Numerical simulation results indicate that the hydrostatic stress around the crack tip is significantly affected by residual stress, and compressive stress causes crack closure with the reduction of local hydrogen concentration [38]. In addition, the grinded surface correlates with higher dislocation density compared with polished surface, which reduces hydrogen local accumulation with less hydrogen blisters. Ayadi et al. [13] reported that dislocations from deformed pure iron acted as effective hydrogen trapping sites and reduced hydrogen diffusivity, and was expected to prevent blister formation compared to undeformed iron. On the basis of the analysis above, the grinded surface exhibits the dual-effect on hydrogen behavior, i.e., accelerating hydrogen adsorption and reducing hydrogen invasion and accumulation. Since the reduction of hydrogen invasion and accumulation is dominant, the grinded surface shows low sensitivity to hydrogen blisters in comparison with the polished surface.
5. Conclusions
The influence of surface roughness on hydrogen blisters in pure iron were studied using optical microscopy, laser scanning confocal microscopy, X-ray stress analyzer and microcomputerized tomography. The conclusions are as follows:
- (1)
- The grinded surface exhibits higher surface roughness with Rz of 4.679 μm compared to that of the polished surface with Rz of 0.567 μm. Residual compressive stress is −167.51 MPa for the grinded surface and −87.49 MPa for the polished surface.
- (2)
- Regardless of the grinded and polished surfaces, blister height, blister width and hydrogen blister area fraction increase with increasing hydrogen charging time. At the same hydrogen charging time, hydrogen blister height and width are of no difference between the grinded and polished surface. However, hydrogen blister area fraction and the number of blisters on polished surface are much larger than the grinded surface.
- (3)
- The grinded surface presents lower sensitivity to hydrogen-induced blisters in comparison with the polished surface, which is attributed to the suppression of hydrogen invasion caused by higher residual compressive stress and higher dislocation density in the grinded surface.
Author Contributions
Conceptualization and methodology, X.L. and W.H.; investigation and validation, X.L., Y.W., W.H. and X.W.; writing—review and editing, X.L. and J.Z.; funding acquisition, X.L. All authors have read and agreed to the published version of the manuscript.
Funding
The authors acknowledge support from Guangdong Basic and Applied Basic Research Foundation (2019A1515110895) and basic start-up fund of Sun-Yat Sen University (45000-18841218).
Conflicts of Interest
The authors declare no conflict of interest.
References
- Ouaras, K.; Redolfi, M.; Vrel, D.; Quirós, C.; Lombardi, G.; Bonnin, X.; Hassouni, K. Tungsten Blister formation kinetic as a function of fluence, ion energy and grain orientation dependence under hydrogen plasma environment. J. Fusion Energy 2018, 37, 144–153. [Google Scholar] [CrossRef]
- Hoshihira, T.; Otsuka, T.; Tanabe, T. Visualization of hydrogen distribution around blisters by tritium radio-luminography. J. Nucl. Mater. 2009, 386, 776–779. [Google Scholar] [CrossRef]
- Quirós, C.; Mougenot, J.; Lombardi, G.; Redolfi, M.; Brinza, O.; Charles, Y.; Michau, A.; Hassouni, K. Blister formation and hydrogen retention in aluminium and beryllium: A modeling and experimental approach. Nucl Mater. Energ. 2017, 12, 1178–1183. [Google Scholar]
- Hoshihira, T.; Otsuka, T.; Wakabayashi, R.; Tanabe, T. Hydrogen behavior near surface regions in Mo and W studied by tritium tracer technique. J. Nucl. Mater. 2011, 417, 559–563. [Google Scholar] [CrossRef]
- Tiegel, M.C.; Martin, M.L.; Lehmberg, A.K.; Deutges, M.; Borchers, C.; Kirchheim, R. Crack and blister initiation and growth in purified iron due to hydrogen loading. Acta Mater. 2016, 115, 24–34. [Google Scholar] [CrossRef]
- Ren, X.; Chu, W.; Li, J.; Su, Y.; Qiao, L. The effects of inclusions and second phase particles on hydrogen-induced blistering in iron. Mater. Chem. Phys 2008, 107, 231–235. [Google Scholar] [CrossRef]
- Li, J.; Yin, H.; Yang, X.; Li, Q.; Zhang, P.; Xie, C.; Su, Y.; Qiao, L. Relationship between hydrogen diffusion and blistering nucleation and growth. J. Iron Steel Res. Int. 2016, 23, 1188–1194. [Google Scholar] [CrossRef]
- Dunne, D.P.; Hejazi, D.; Saleh, A.A.; Haq, A.J.; Calka, A.; Pereloma, E.V. Investigation of the effect of electrolytic hydrogen charging of X70 steel: I. The effect of microstructure on hydrogen-induced cold cracking and blistering. Int. J. Hydrogen Energy 2016, 41, 12411–12423. [Google Scholar] [CrossRef]
- Laureys, A.; Van den Eeckhout, E.; Petrov, R.; Verbeken, K. Effect of deformation and charging conditions on crack and blister formation during electrochemical hydrogen charging. Acta Mater. 2017, 127, 192–202. [Google Scholar] [CrossRef]
- Laureys, A.; Pinson, M.; Depover, T.; Petrov, R.; Verbeken, K. EBSD characterization of hydrogen induced blisters and internal cracks in TRIP-assisted steel. Mater. Charact. 2020, 159, 110029. [Google Scholar] [CrossRef]
- Singh, V.; Singh, R.; Arora, K.S.; Mahajan, D.K. Hydrogen induced blister cracking and mechanical failure in X65 pipeline steels. Int. J. Hydrogen Energy 2019, 44, 22039–22049. [Google Scholar] [CrossRef]
- Mostafijur Rahman, K.M.; Mohtadi-Bonab, M.A.; Ouellet, R.; Szpunar, J.; Zhu, N. Effect of electrochemical hydrogen charging on an API X70 pipeline steel with focus on characterization of inclusions. Int. J. Press. Vessels Pip. 2019, 173, 147–155. [Google Scholar] [CrossRef]
- Ayadi, S.; Charles, Y.; G aspérini, M.; Caron Lemaire, I.; Da Silva Botelho, T. Effect of loading mode on blistering in iron submitted to plastic prestrain before hydrogen cathodic charging. Int J Hydrogen Energy 2017, 42, 10555–10567. [Google Scholar] [CrossRef] [Green Version]
- Zhang, S.; Zhao, Q.; Liu, J.; Huang, F.; Huang, Y.; Li, X. Understanding the effect of niobium on hydrogen-induced blistering in pipeline steel: A combined experimental and theoretical study. Corros. Sci. 2019, 159, 108142. [Google Scholar] [CrossRef]
- Griesche, A.; Dabah, E.; Kannengiesser, T.; Kardjilov, N.; Hilger, A.; Manke, I. Three-dimensional imaging of hydrogen blister in iron with neutron tomography. Acta Mater. 2014, 78, 14–22. [Google Scholar] [CrossRef]
- Zhou, H.-B.; Liu, Y.-L.; Jin, S.; Zhang, Y.; Luo, G.-N.; Lu, G.-H. Towards suppressing H blistering by investigating the physical origin of the H–He interaction in W. Nucl. Fusion 2010, 50, 115010. [Google Scholar] [CrossRef]
- Tao, X.; Lv, G.C.; Kou, J.; Xiong, X.; Volinsky, A.A.; Ku, C.-S.; Chen, K.; Su, Y.-J. Synchrotron X-ray Laue diffraction study of hydrogen-induced blisters on iron grain boundaries. Scr. Mater. 2019, 169, 82–86. [Google Scholar] [CrossRef]
- Miyamoto, M.; Nishijima, D.; Ueda, Y.; Doerner, R.; Kurishita, H.; Baldwin, M.; Morito, S.; Ono, K.; Hanna, J. Observations of suppressed retention and blistering for tungsten exposed to deuterium–helium mixture plasmas. Nucl. Fusion 2009, 49, 065035. [Google Scholar] [CrossRef]
- Zhang, L.; Shen, H.; Lu, K.; Cao, W.; Sun, Y.; Fang, Y.; Xing, Y.; Du, Y.; Lu, M. Investigation of hydrogen concentration and hydrogen damage on API X80 steel surface under cathodic overprotection. Int. J. Hydrogen Energy 2017, 42, 29888–29896. [Google Scholar] [CrossRef]
- Escobar, D.P.; Miñambres, C.; Duprez, L.; Verbeken, K.; Verhaege, M. Internal and surface damage of multiphase steels and pure iron after electrochemical hydrogen charging. Corros. Sci. 2011, 53, 3166–3176. [Google Scholar] [CrossRef]
- Zapffe, C.; Sims, C. Hydrogen embrittlement, internal stress and defects in steel. Trans. AIME 1941, 145, 225–271. [Google Scholar]
- Ren, X.; Zhou, Q.; Shan, G.; Chu, W.; Li, J.; Su, Y.; Qiao, L. A nucleation mechanism of hydrogen blister in metals and alloys. Metall. Mater. Trans. A 2008, 39, 87–97. [Google Scholar] [CrossRef]
- Ren, X.; Zhou, Q.; Chu, W.; Li, J.; Su, Y.; Qiao, L. The mechanism of nucleation of hydrogen blister in metals. Chin. Sci. Bull. 2007, 52, 2000–2005. [Google Scholar] [CrossRef]
- Huang, J.; Li, Z. X-ray Diffraction of Polycrystalline Materials-experimental Principle Method and Application; Metallurgical Industry Press: Beijing, China, 2012; p. 174. [Google Scholar]
- Warrier, M.; Rai, A.; Schneider, R. A time dependent model to study the effect of surface roughness on reactive–diffusive transport in porous media. J. Nucl. Mater. 2009, 390, 203–206. [Google Scholar] [CrossRef] [Green Version]
- Dong, W.; Ledentu, V.; Sautet, P.; Eichler, A.; Hafner, J. Hydrogen adsorption on palladium: A comparative theoretical study of different surfaces. Surf. Sci. 1998, 411, 123–136. [Google Scholar] [CrossRef]
- Escobar, D.P.; Verbeken, K.; Duprez, L.; Verhaege, M. On the Methodology of Thermal Desorption Spectroscopy to Evaluate Hydrogen Embrittlement. Mater. Sci. Forum 2011, 706, 2354–2359. [Google Scholar]
- Seo, M.J.; Shim, H.-S.; Kim, K.M.; Hong, S.-I.; Hur, D.H. Influence of surface roughness on the corrosion behavior of Alloy 690TT in PWR primary water. Nucl. Eng. Des. 2014, 280, 62–68. [Google Scholar] [CrossRef]
- Song, G.; Xu, Z. The surface, microstructure and corrosion of magnesium alloy AZ31 sheet. Electron. Acta 2010, 55, 4148–4161. [Google Scholar] [CrossRef]
- Hudson, R.; Riedy, K.; Stragand, G. Influence of specimen geometry and surface roughness on hydrogen behavior in steel. Corrosion 1962, 18, 79–84. [Google Scholar] [CrossRef]
- Wan, Y.; Li, Y.; Wang, Q.; Zhang, K.; Wu, Y. The relationship of surface roughness and work function of pure silver by numerical modeling. Int. J. Electrochem. Sci. 2012, 7, 5204–5216. [Google Scholar]
- Li, X.; Zhang, J.; Wang, Y.; Ma, M.; Shen, S.; Song, X. The dual role of shot peening in hydrogen-assisted cracking of PSB1080 high strength steel. Mater. Des. 2016, 110, 602–615. [Google Scholar] [CrossRef]
- Takakuwa, O.; Soyama, H. Preventing Hydrogen Diffusion in Stainless Steel by Cavitating Jet in Air. In Proceedings of the 23rd International Conference on Water Jetting 2016, Seattle, DC, USA, 15–18 November 2016; BHR Group Limited: Wharley End, UK, 2016; pp. 215–221. [Google Scholar]
- Takakuwa, O.; Soyama, H. Suppression of hydrogen-assisted fatigue crack growth in austenitic stainless steel by cavitation peening. Int. J. Hydrogen Energy 2012, 37, 5268–5276. [Google Scholar] [CrossRef]
- Yu, J.; Jiang, C.; Zhang, Y. Influence of Alloying Elements and Effect of Stress on Anisotropic Hydrogen Diffusion in Zr-Based Alloys Predicted by Accelerated Kinetic Monte Carlo Simulations. In Proceedings of the 18th International Conference on Environmental Degradation of Materials in Nuclear Power Systems–Water Reactors, Portland, OR, USA, 13–17 August 2017; pp. 1815–1826. [Google Scholar]
- Toribio, J.; Kharin, V. Role of crack tip mechanics in stress corrosion cracking of high-strength steels. Int. J. Fract. 2004, 126, L57–L63. [Google Scholar] [CrossRef]
- Wang, L.F.; Shu, X.; Lu, G.-H.; Gao, F. Embedded-atom method potential for modeling hydrogen and hydrogen-defect interaction in tungsten. J. Phys. Condens. Matter 2017, 29, 435401. [Google Scholar] [CrossRef] [PubMed] [Green Version]
- Takakuwa, O.; Nishikawa, M.; Soyama, H. Numerical simulation of the effects of residual stress on the concentration of hydrogen around a crack tip. Surf. Coat. Technol. 2012, 206, 2892–2898. [Google Scholar] [CrossRef]
Figure 1.
Schematic diagram of electrochemical hydrogen charging set-up.

Figure 2.
Microstructure of pure iron. (a) Light optical microscopy image; (b) inverse pole figure; (c) TEM image and (d) dark field image taken from precipitates. Black dotted circles showing precipitates.
Figure 2.
Microstructure of pure iron. (a) Light optical microscopy image; (b) inverse pole figure; (c) TEM image and (d) dark field image taken from precipitates. Black dotted circles showing precipitates.

Figure 3.
Surface morphology of samples. (a–c) Grinded surface and (d–f) polished surface.

Figure 4.
The 2θ vs. sin2ψ plot for the iron as determined by the sin2ψ method. (a) Grinded surface and (b) polished surface.
Figure 4.
The 2θ vs. sin2ψ plot for the iron as determined by the sin2ψ method. (a) Grinded surface and (b) polished surface.

Figure 5.
Hydrogen blisters of grinded and polished surfaces at various hydrogen charging times: (a,b) 10 min; (c,d) 180 min and (e,f) 480 min.
Figure 5.
Hydrogen blisters of grinded and polished surfaces at various hydrogen charging times: (a,b) 10 min; (c,d) 180 min and (e,f) 480 min.

Figure 6.
Blister high magnification images of grinded and polished surfaces at various hydrogen charging times. (a) grind-180 min; (b) polish-180 min; (c) grind-480 min; (d) polish-480 min. Left upper corner images showing corresponding blister height profile. The red color indicating high position and the blue color indicating low position. White arrowhead indicating cracks on the blisters.

Figure 7.
Hydrogen blister parameters of grinded and polished surfaces with various hydrogen charging times. (a) Blister height; (b) blister width; (c) blister area fraction and (d) the number of blisters.
Figure 7.
Hydrogen blister parameters of grinded and polished surfaces with various hydrogen charging times. (a) Blister height; (b) blister width; (c) blister area fraction and (d) the number of blisters.

Figure 8.
Inclined view on reconstructed 3-D Micro-CT images of whole hydrogen charged iron samples at various hydrogen charging times: (a) 30 min; (b) 180 min; (c) 300 min and (d) 480 min. The top side is the polished surface and the bottom side is the grinded surface.
Figure 8.
Inclined view on reconstructed 3-D Micro-CT images of whole hydrogen charged iron samples at various hydrogen charging times: (a) 30 min; (b) 180 min; (c) 300 min and (d) 480 min. The top side is the polished surface and the bottom side is the grinded surface.

Figure 9.
Dependence of the hydrogen blister area fraction along the cross section on the position from the grinded surface (0 mm) to the polished surface (1.45 mm): (a) 30 min; (b) 180 min; (c) 300 min and (d) 480 min.
Figure 9.
Dependence of the hydrogen blister area fraction along the cross section on the position from the grinded surface (0 mm) to the polished surface (1.45 mm): (a) 30 min; (b) 180 min; (c) 300 min and (d) 480 min.

Figure 10.
Histogram of the pore area along the cross section at the same distance from the grinded surface and the polished surface: (a–c) 0.2 mm from grinded surface and (a’–c’) 0.2 mm from polished surface. APS: Average pore size.
Figure 10.
Histogram of the pore area along the cross section at the same distance from the grinded surface and the polished surface: (a–c) 0.2 mm from grinded surface and (a’–c’) 0.2 mm from polished surface. APS: Average pore size.

Figure 11.
Hydrogen blister area fraction along longitudinal section: (a) 30 min; (b) 180 min; (c) 300 min and (d) 480 min. AAF: Average area fraction.
Figure 11.
Hydrogen blister area fraction along longitudinal section: (a) 30 min; (b) 180 min; (c) 300 min and (d) 480 min. AAF: Average area fraction.

© 2020 by the authors. Licensee MDPI, Basel, Switzerland. This article is an open access article distributed under the terms and conditions of the Creative Commons Attribution (CC BY) license (http://creativecommons.org/licenses/by/4.0/).
Share and Cite
MDPI and ACS Style
Li, X.; Wang, Y.; Huang, W.; Zhang, J.; Wu, X. Effect of Surface Roughness on Hydrogen-Induced Blister Behavior in Pure Iron. Metals 2020, 10, 745. https://doi.org/10.3390/met10060745
AMA Style
Li X, Wang Y, Huang W, Zhang J, Wu X. Effect of Surface Roughness on Hydrogen-Induced Blister Behavior in Pure Iron. Metals. 2020; 10(6):745. https://doi.org/10.3390/met10060745
Chicago/Turabian StyleLi, Xinfeng, Yao Wang, Weihong Huang, Jin Zhang, and Xubin Wu. 2020. "Effect of Surface Roughness on Hydrogen-Induced Blister Behavior in Pure Iron" Metals 10, no. 6: 745. https://doi.org/10.3390/met10060745
Note that from the first issue of 2016, this journal uses article numbers instead of page numbers. See further details here.