Article

The Influence of the Process Parameters on the Densification and Microstructure Development of Laser Powder Bed Fused Inconel 939

Department of Applied Science and Technology, Politecnico di Torino, Corso Duca degli Abruzzi 24, 10129 Torino, Italy
*
Author to whom correspondence should be addressed.
Metals 2020, 10(7), 882; https://doi.org/10.3390/met10070882
Submission received: 18 June 2020 / Revised: 27 June 2020 / Accepted: 1 July 2020 / Published: 3 July 2020

Abstract

:
This work aims to investigate the effect of the process parameters on the densification and microstructure of Inconel 939 (IN939) alloy processed by laser powder bed fusion (LPBF). IN939 is a Ni-based superalloy with high creep and corrosion resistance that can be used up to around 850 °C under load, resulting in higher operative temperatures than the ones commonly allowed for Inconel 718 and Inconel 625 alloys (around 650 °C). However, this alloy can suffer from poor weldability involving possible crack formation. In order to minimize the residual porosity and the cracking density, specific process parameters were investigated. The parameters to generate IN939 samples almost pores-free (porosity ≤0.22%) with a cracking density ≤1.36 mm/mm2 as well as samples almost crack-free (≤0.10 mm/mm2) with limited residual porosity (≤0.89%) were determined. The microstructure revealed fine dendritic/cellular structures with the formation of sub-micrometric phases. A high concentration of these phases was also found along the intergranular cracks, suggesting that their presence, coupled to the high thermal stresses, can be the primary reason for crack formation during the LPBF process.

1. Introduction

Laser powder bed fusion (LPBF) is an additive manufacturing process attracting considerable attention from both the research and industrial sectors. This technology provides an excellent way to fabricate complex geometries for materials difficult to machine by conventional manufacturing processes (i.e., casting and wrought) [1,2,3,4]. Among these materials, Ni-based superalloys are typically considered difficult to machine due to their high mechanical properties, which are also maintained at high temperatures [5].
The most commonly processed LPBF Ni-based superalloys are Inconel 718 and Inconel 625 fabricated with a relative density close to 100% due to their good weldability [6,7,8,9,10]. Nevertheless, Inconel 718 and Inconel 625 can be used up to around 650 °C for applications under load. In fact, it is well known that the operative temperature of these alloys is limited under high load due to the coarsening and transformation of the metastable γ” (Ni3Nb—body-centered tetragonal) phase into the δ (Ni3Nb—orthorhombic) phase, which can drastically reduce the mechanical performance [11,12,13,14].
Consequently, there has been growing interest in developing Ni-based superalloys for application at higher temperatures than 650 °C by the LPBF process. Such superalloys include Hastelloy X [15,16], CM247LC [17,18,19,20] as well as Inconel 738LC [21,22]. As regards Hastelloy X, it was reported that a high concentration of Si and C could play a crucial role in increasing its cracking susceptibility [16,23]. Marchese et al. [24] revealed the formation of carbides along the cracks suggesting that the cracks derived from phases formation combined with high residual stresses. Sanchez-Mata et al. [25] were the first to succeed in defining the operative parameters to generate crack-free LPBF Hastelloy X alloy. Differently, CM247LC and Inconel 738LC result as very challenging to produce by LPBF due to their high content of Al and Ti, forming elements of the γ′ phase (Ni3(Al,Ti) [6,17,21,22]. For CM247LC, Carter et al. [6] reported the process parameters that permitted to minimize the porosity and the cracking density. In another study, Carter et al. [17] investigated the impact of a laser scanning strategy on a microstructure, observing cracks along the high angle grain boundaries due to the formation of phases in these areas. In addition to the high quantity of γ′ formation elements, for Inconel 738LC, Cloots et al. [21] found that the intergranular Zr segregations tend to trigger the cracking formation. Moreover, Qiu et al. [22] reported that also oxides can have a substantial impact on the initiation and propagation of the cracks.
All these studies indicated that several phenomena can trigger cracks formation within the family of the Ni-based superalloys. Different weld cracking mechanisms have been proposed to explain the formation of the cracks comprising solidification cracking, liquation cracking, strain-age cracking, and ductility dip cracking [18]. Solidification cracking occurs with the presence of liquid where the dendritic formation hinders the flow of the liquid in the interdendritic areas. Liquation cracking is caused by rapid heating that involves the melting of eutectic phases like γ′ particles or carbides combined with high residual stresses [18,26,27]. Strain-age cracking is provoked by the formation of phases within the material by reheating combined with residual stresses in the solid-state. Ductility dip cracking is related to the significant reduction in ductility within intermediate temperatures, and it is generally coupled to intergranular carbides formation [18,28,29,30]. Both these last two mechanisms commonly are triggered along the grain boundaries, occurring in the solid-state. For these reasons, ductility dip cracking has also been sometimes included in the strain-age cracking mechanism [18,28].
The presence of cracks can drastically affect the mechanical properties of the components, and therefore, post-processing treatments should be employed to consolidate the cracks. Hot isostatic pressing can be applied to close cracks and pores and to modify the microstructure [15,17,31,32].
Inconel 939 (IN939) is another Ni-based superalloy chiefly strengthened by the γ’—Ni3(Al,Ti) phase due to its high amount of Ti and Al. This material presents high creep resistance, corrosion, oxidation resistance, as well as microstructure stability up to around 850 °C [33,34,35,36,37,38]. Additionally, IN939 exhibits higher corrosion resistance than Inconel 738LC alloy. The cast version of the IN939 superalloy has been typically employed in blades and vanes of land-based and marine gas turbines for service temperatures up to around 850 °C. This alloy has also been considered for building large aircraft engine structures as well as turbine airfoils [33,34,35,36,37,38]. The majority of the investigations on cast IN939 concern the study of heat treatments to improve its mechanical properties as well as its microstructure stability under prolonged thermal exposures [36,39,40,41].
Regarding laser powder bed fused (LPBFed) IN939, Kanagarajah et al. [42] studied the microstructure of the as-built and after standard heat treatment (solutionizing at 1160 °C for 4 h followed by aging at 850 °C for 16 h), mainly focusing on the mechanical properties at room and high temperature. They revealed that LPBFed IN939 presents higher tensile properties than as-cast IN939 due to its finer microstructure. At 750 °C, the tensile properties of LPBFed IN939 were lower than traditional ones due to accelerated phases formation, indicating that the heat treatment must be tailored for the material processed by the LPBF. Philpott et al. [43] mainly focused on the effect of heat treatments on the microstructure evolution of LPBFed IN939, revealing the formation of γ′ precipitates and carbides.
The high level of γ′-forming elements (Al and Ti) as well as different carbides-forming elements (e.g., W, Ta, Ti, Nb) can affect the weldability of this alloy. However, to the authors’ knowledge, there are no published scientific papers that study the effect of different process parameters on the densification level of LPBFed IN939 alloy. The current work mainly deals with the role of the process parameters on the production of IN939 by LPBF. Moreover, the microstructure and cracking mechanisms are also investigated.

2. Materials and Methods

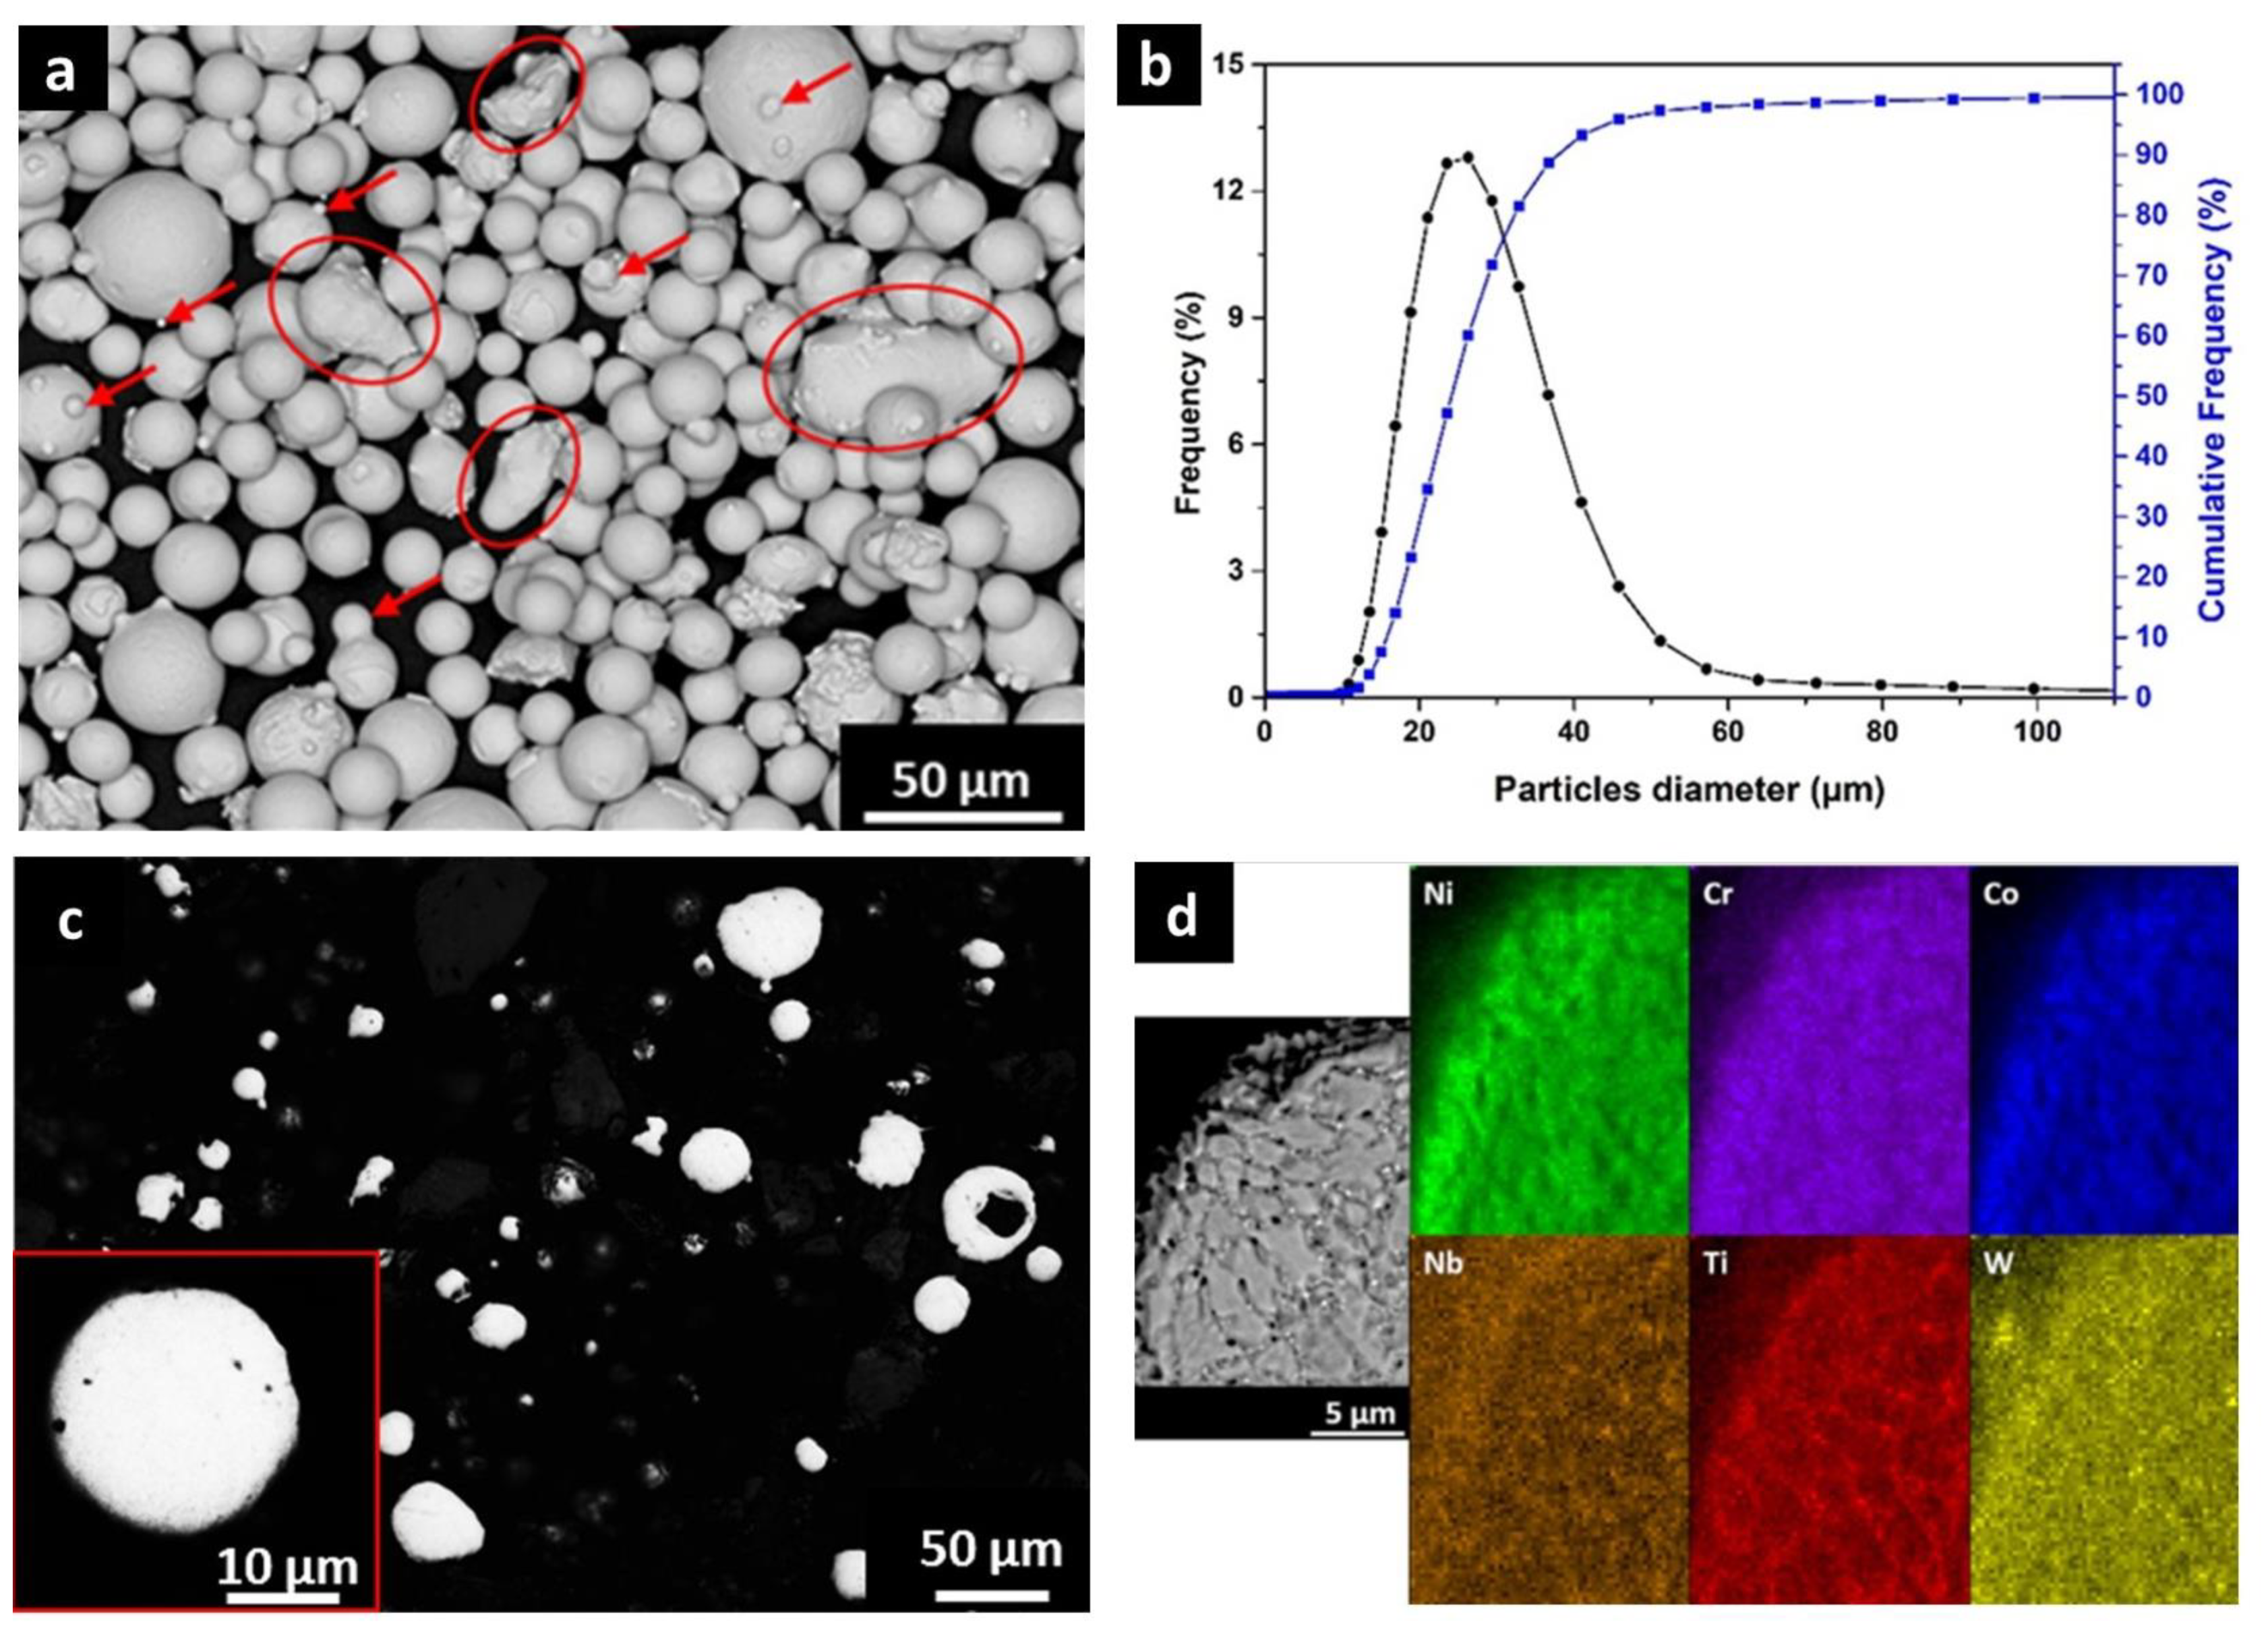
2.1. Powder Characterization

The gas atomized powder was purchased by LPW (Carpenter Additive) with the main chemical composition of the used powder reported in Table 1. The declared chemical composition was checked by focused ion beam-scanning electron microscopy (FIB-SEM, TESCAN S9000G, Tescan Orsay Holding, a.s., Brno, Czech Republic) equipped with energy dispersive X-ray spectrometry (EDS) detector in order to have a semi-quantitative identification coupled to C identification by means of combustion infrared analysis, obtaining a good correlation. The declared chemical composition was inside the standard chemical composition of typical cast IN939 alloy, as indicated in Table 1.
The particles were mostly spherical with the presence of satellites and a few irregular particles, highlighted in Figure 1a by red arrows and red ovals, respectively.
Figure 1b shows the particle size distribution and cumulative frequency of the powder, revealing a D10 of 16.8 µm, D50 of 26.1 µm and D90 of 40.7 µm, as determined by laser granulometry analysis. In order to remove possible large particles, the powder was sieved down to 50 µm.
The Hall flow test resulted in a flow time of 15.1 ± 0.2 s and an apparent density of 4.29 ± 0.01 g/cm3, following the ASTM B213 and ASTM B212 standards, respectively.
The cross-section of the particles (Figure 1c) polished up to 1 µm with diamond suspension revealed mainly the presence of particles with a low quantity of small spherical pores together with the limited existence of particles characterized by pores around 20 µm. These pores are typically formed due to the entrapped gas during the atomization process. Analyzing 3000 particles, the total residual porosity was assessed as 0.4 ± 0.2%. Finally, after chemical etching, the cross-section (Figure 1d) revealed dendrites with a width around 1–2 µm, enriched in Ti, W, and Nb and depleted of Ni, Cr, and Co within the interdendritic areas. The analysis was performed by means of the scanning electron microscope (SEM, Phenom XL, Phenom-World BV, Eindhoven, The Netherlands) equipped with EDS detector.

2.2. Process Parameter

IN939 cubic samples (10 × 10 × 10 mm3) were fabricated by means of a CONCEPT Mlab Cusing R system (Concept Laser GmbH, Lichtenfels, Germany) with laser power up to 100 W with a laser spot size of approximately 50 µm. For the process parameters optimization, it was chosen to modify the scanning speed and hatching distance keeping constant the laser power at 95 W and layer thickness at 20 µm. All the chosen parameter conditions are provided in Table A1 in Appendix A.
In order to define the energy delivered to the powder, the volumetric energy density (VED) is one of the approaches used for the process optimization of LPBFed materials. The VED (J/mm3) takes into account the laser power P (W), the scanning speed v (mm/s), the layer thickness t, and the hatching distance hd (both in mm) [44,45,46]:
V E D = P v · t · h d
VED values from 30 to 320 J/mm3 were selected to study the densification behavior of LPBF-processed specimens. A fixed scanning strategy was used, consisting of stripes of 5 mm with a rotation of 67° between consecutive layers of powder. A schematic representation of the scanning strategy is illustrated in Figure 2.

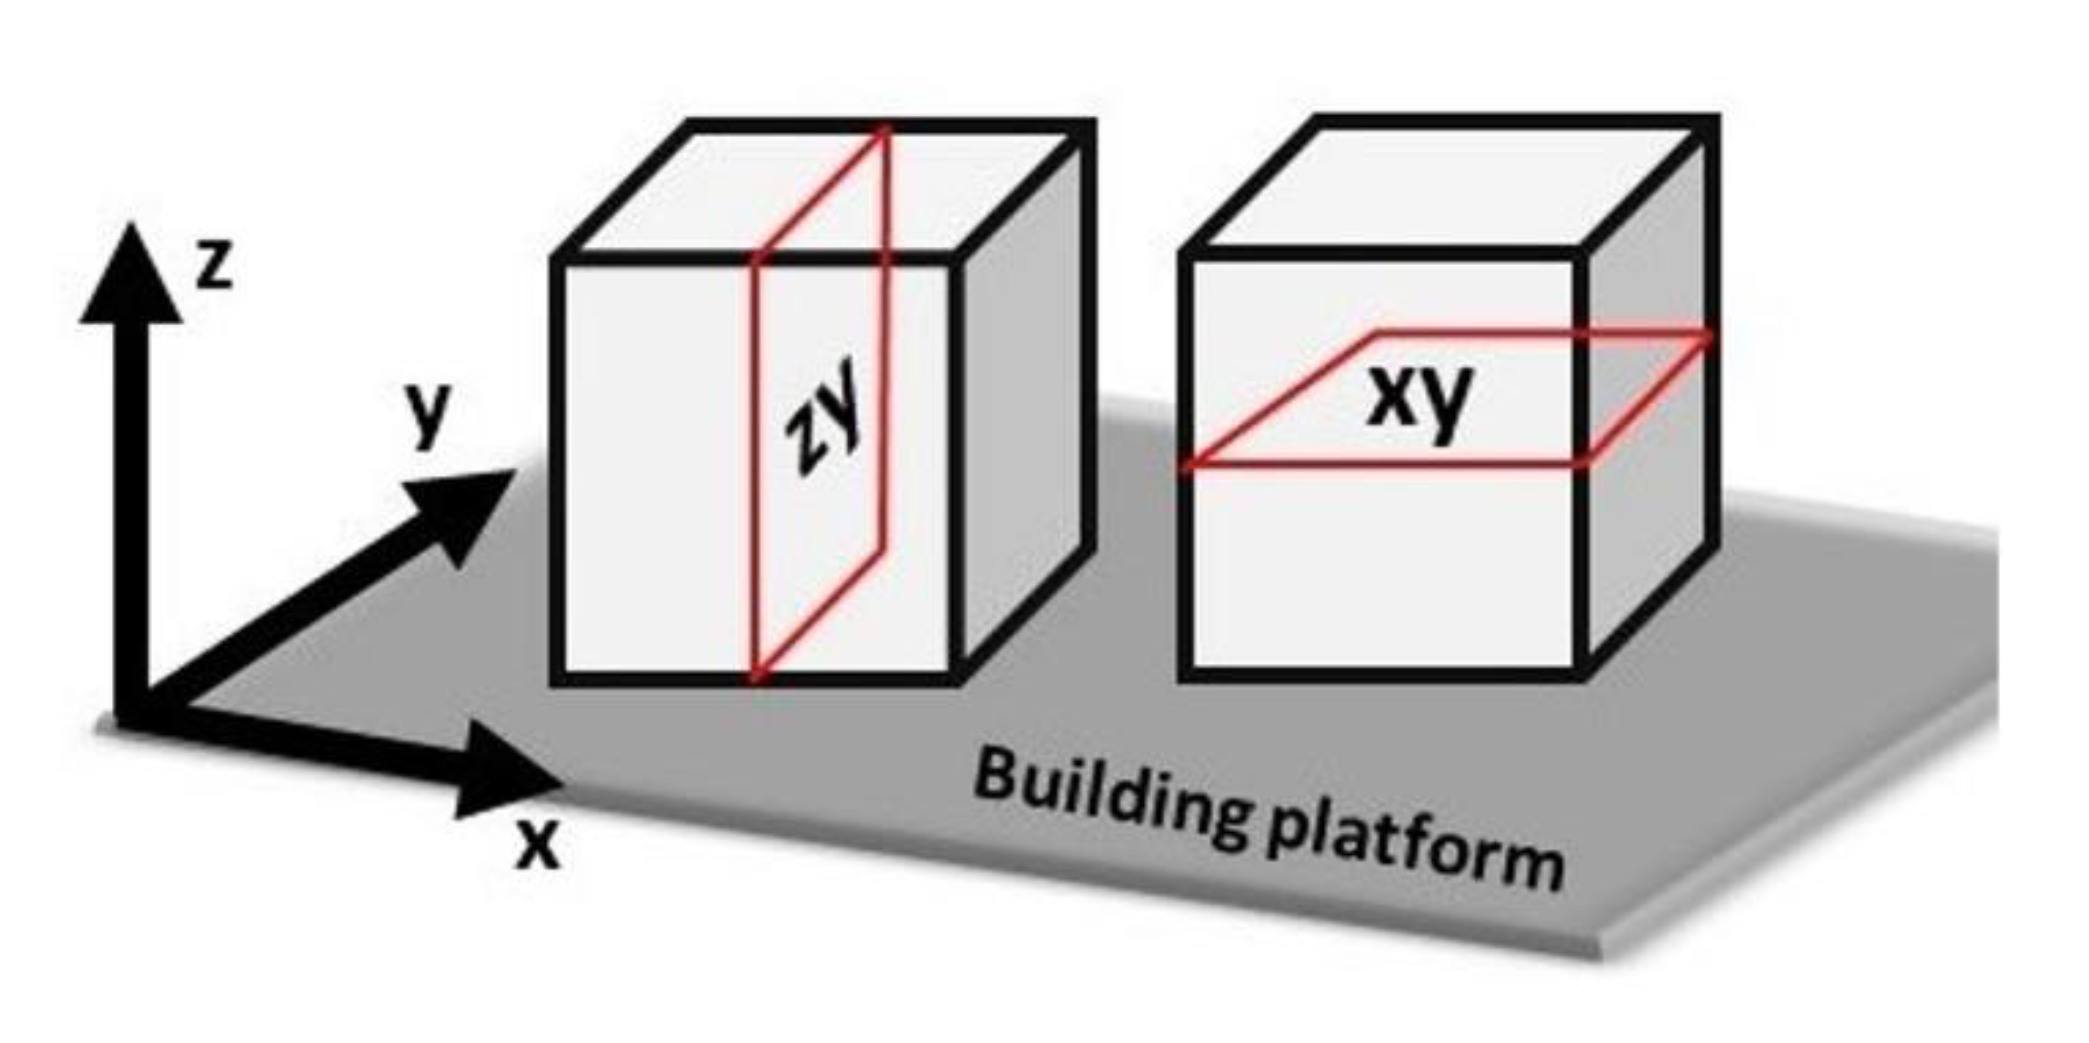
2.3. Microstructural Investigation

For the densification analysis (porosity and cracking density) and microstructure investigation, the zy plane was considered. Moreover, for the texture analysis, both the zy and xy planes were used, as schematically displayed in Figure 3.
The samples were cut and then polished down to 1 µm using diamond suspensions. The residual porosity was determined by a light optical microscope (LOM, Leica DMI 5000 M, Leica Microsystems, Wetzlar, Germany), taking 10 images at 50×, analyzing a total area of around 26 mm2. The optical micrographs were post-processed to determine the residual porosity in percentage through the Image J software. In order to determine the porosity, the cracks were removed from the LOM images.
The cracks resulted to be very tight, and it was difficult to obtain a reliable evaluation from the LOM images. Therefore, the cracking density was determined by SEM taking 10 images at 500×, investigating a total area around 3 mm2, and then post-processing the images by the Image J software. The cracking density reported as mm/mm2 was determined using the Ferret length as typically considered for other LPBFed Ni-based superalloys subjected to crack formation [6,18,24]. Examples of the procedure employed to analyze the residual porosity by LOM images and cracking density by SEM images, including the obtained post-processed images, are provided in Figure 4. More in detail, the LOM images were processed by the Image J software (version: 1.49v, National Institutes of Health, Bethesda, MD, USA) in order to highlight the defects (pores and cracks) in black, while the austenitic matrix was pointed out in white. Afterward, for the residual porosity determination (Figure 4a), the cracks were removed (Figure 4b), giving the possibility to determine the black areas of the porosity. In the other case, for the cracking density evaluation (Figure 4c), the pores were removed from the image, allowing the determination of the cracks pointed out in black (Figure 4d).
After etching with Kalling’s No.2 solution, the microstructure was evaluated by LOM, SEM, and FIB-SEM using EDS detectors. The crystallographic texture of the as-built samples was characterized using FIB-SEM equipped with an electron backscatter diffraction (EBSD) analyzer. The specimens were tilted by 70° and scanned at 20 kV, with a 1–2 µm step, analyzing them along the building direction (z-axis) and perpendicular to the building direction (xy plane).

3. Results and Discussion

3.1. Influence of the Process Parameters on the Densification

Porosity and cracking density of the different samples, correlated to the VED values, are reported in Figure 5a,e, respectively. Moreover, the assessed values of residual porosity and cracking density for the various combinations of process parameters are provided in Table A1 in Appendix A.
Considering the porosity (Figure 5a), it was possible to define three distinct areas based on the VED:
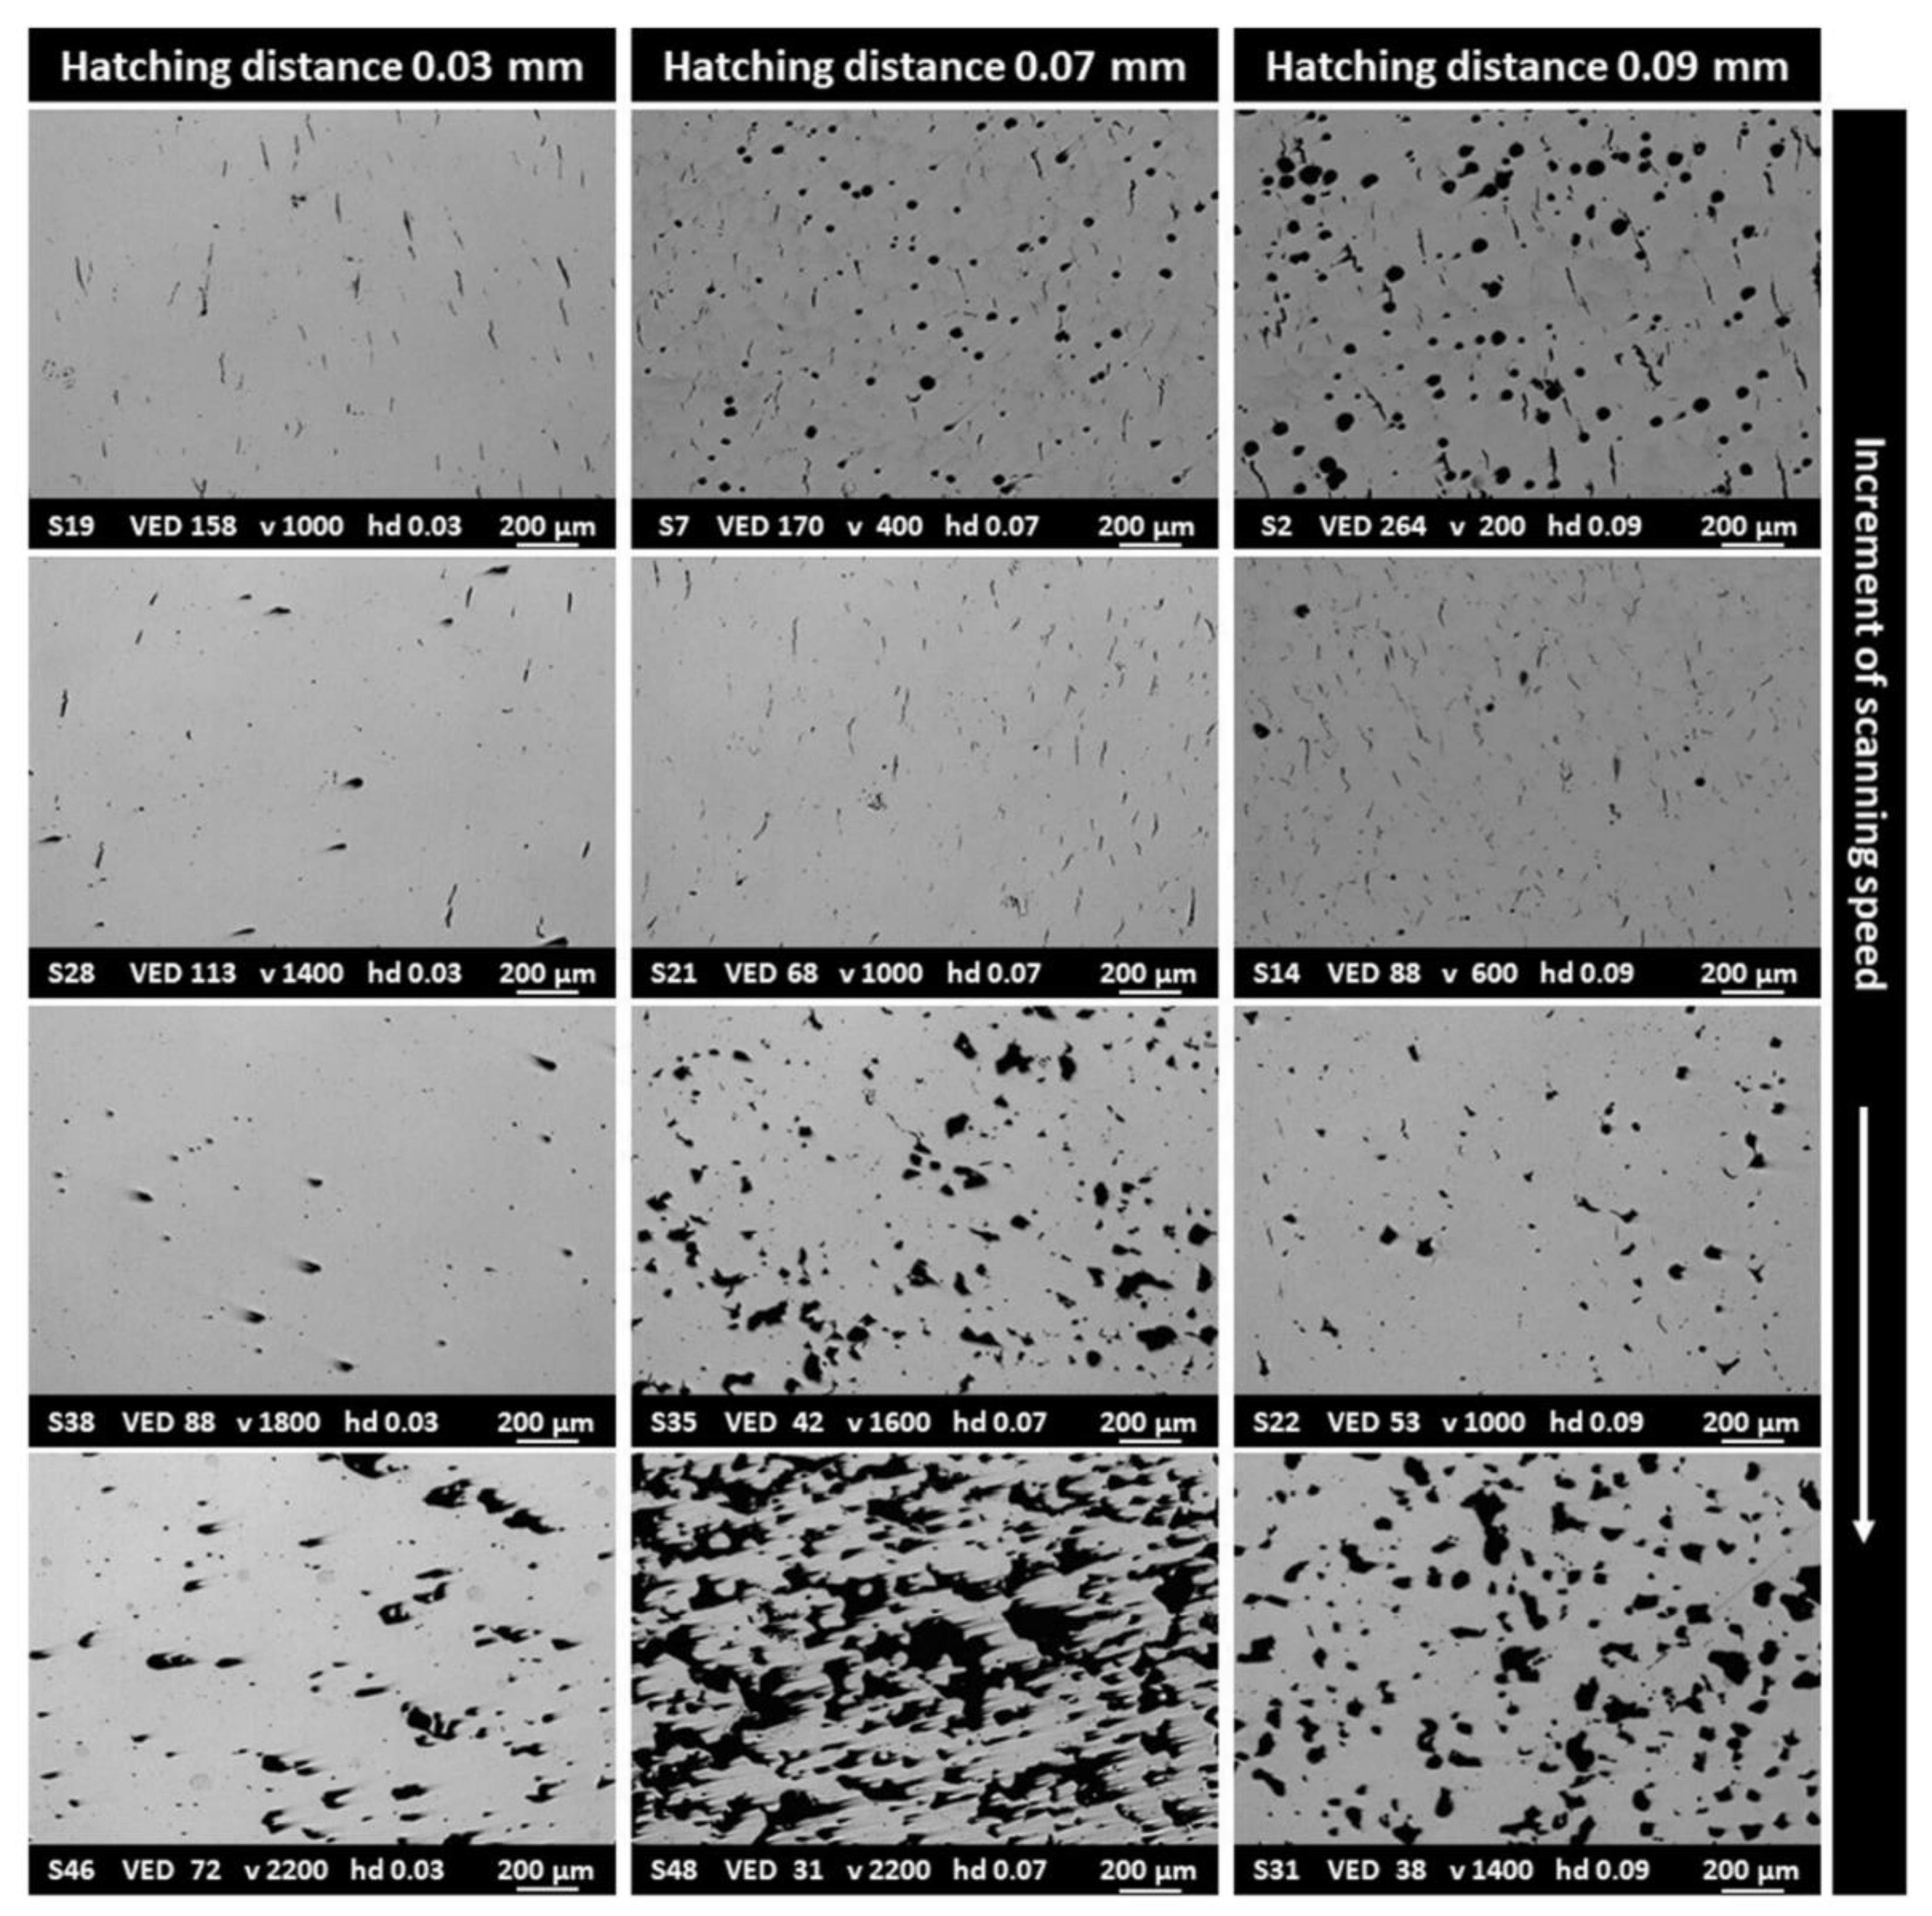
  • VED < 50 J/mm3 generated large pores and irregular lack of fusion, with sizes also larger than 200 µm, due to insufficient energy delivered to the material (Figure 5b);
  • A wide range of VED values between 50 and 160 J/mm3 provided an adequate amount of energy to melt the powder, and the predominant defects resulted to be the spherical pores (Figure 5c), with sizes typically up to around 20 µm, while some rare irregular pores (lack of fusion) could be still detected. However, it should be noted that some conditions with a VED ranging from 100 to 160 J/mm3 triggered a high residual porosity, and consequently, the effect of the single parameters should also be considered. An in-depth analysis will be provided in the following part of this paper;
  • For VED > 160 J/mm3, the energy gradually started inducing melt pool instability causing the formation of keyholes, with a large number of mostly spherical pores with sizes up to around 100 µm (Figure 5d).
In order to minimize the defects, the presence of an optimized range of VED values is typically determined for LPBFed materials (e.g., Inconel 625, Inconel 718, and Ti6Al4V) [2,6].
On the contrary, the effect of VED values on the cracking density (Figure 5e) did not show a significant trend. More in detail, different samples built with similar VED exhibited different cracking densities, as also indicated by the LOM images (Figure 5f–h) that show three specimens built with a VED from 85 to 88 J/mm3. Additionally, the reduced quantity of cracks for VED < 50 J/mm3 or VED > 300 J/mm3 can be associated with the dominant presence of large defects, with a release of the internal stresses that do not promote the formation of cracks, as displayed in the LOM images in Figure 5b,d.
The same VED values obtained with different parameters have a different effect on the melt pool solidification and its final shape [47]. The VED approach can be employed only for limiting the tested conditions, but successively, the effect of the singular parameters must be carefully examined to obtain a more accurate parameters optimization.
Figure 6a,b shows the average values of residual porosity for samples built with a different scanning speed and hatching distance, keeping constant the laser power and layer thickness (95 W and 20 µm).
The hatching distance from 0.11 to 0.15 mm did not allow the fabrication of dense samples, even applying a slow scanning speed (100–400 mm/s). For these conditions, it is evident that the energy provided to the material was not sufficient to achieve a high densification level, also using a slow scanning speed. Hatching distances of 0.07 and 0.09 mm revealed a minimum of residual porosity (<0.5%) for a scanning speed of 1000 and 800 mm/s, respectively. Moreover, a hatching distance of 0.03 and 0.05 mm generated a low residual porosity (<0.5%) using a scanning speed in the range 1000–1400 mm/s and 1000–1200 mm/s, respectively.
Therefore, each value of hatching distance is related to an optimized range of scanning speed. Exceeding the optimized values of scanning speed results in providing less energy to the material, thus producing residual porosities such as lack of fusion. On the contrary, a scanning speed inferior to the optimized range tends to transmit too much energy to the system, generating defects due to the melt pool instability.
It is worth noting that a hatching distance of 0.02 mm always generates high residual porosity within the range of the scanning speed employed. This could be associated with too extensive overlapping between two adjacent laser scannings, involving melt pools instability.
In conclusion, low porosities (<0.5%) were determined for the following combinations of scanning speed and hatching distance: (i) 800 mm/s with 0.09, 0.07 and 0.05 mm; (ii) 1000 mm/s with 0.07, 0.05 and 0.03 mm; (iii) 1200 mm/s with 0.05 and 0.03 mm; (iv) 1400 mm/s with 0.03 mm.
Similarly, the effect of different scanning speeds and hatching distances on the cracking density are provided in Figure 7a,b, respectively.
For all the operating ranges of hatching distance (0.02–0.15 mm), scanning speed plays a fundamental role, and values inferior to 600 mm/s are typically related to a high crack density. Differently, higher scanning speeds provoked a minor cracking formation, reaching an average cracking density ≤1 mm/mm2 mainly for scanning speeds from 1000 mm/s to 2200 mm/s, combined with hatching distances in the range of 0.09 to 0.02 mm, as pointed out in Figure 7b.
It is possible to speculate that higher scanning speeds reduce the energy delivered to melt the powder, thus contributing to mitigate the thermal stresses within the material. The cracks are typically formed when the thermal stress overcomes the tensile strength of the material. A more detailed discussion on cracking formation will be reported in Section 3.3.

3.2. Selection of Optimal Parameters

The current work investigated the parameters optimization performed keeping constant both laser power (at 95 W) and layer thickness (at 20 µm), modifying scanning speed and hatching distance. From the results, there was no set of parameters to minimize residual porosity and cracking density simultaneously. This mechanism can be discussed by the dependence of defects (pores and cracks) using some representative combined parameters reported in Figure 8.
Increasing the VED (low scan speed and reduced hatching distance) contributes to providing the full melting of the powder, reducing the risk of lack of fusion, but at the same time it triggers high thermal residual stresses leading to cracks formation (see samples S19, S28, S21 and S14 in Figure 8). Moreover, too high energy can generate keyholes (see samples S7 and S2 in Figure 8). On the other hand, reducing the VED (high scan speed and large hatching distance) limits the crack formation but involves a higher concentration of residual pores (pores and lack of fusion) throughout the material (see samples S38, S35, S22, S46, S48 and S31 in Figure 8).
Considering the average value with the addition of standard deviation (Appendix A-Table A1), the lowest porosity (≤0.4%) with a moderate cracking density (≤1.5 mm/mm2) was determined for a scanning speed of 1000 and 1200 mm/s combined with a hatching distance of 0.05 and 0.03 mm. Differently, the samples with the lowest cracking density (≤0.4 mm/mm2) and moderate porosity (≤1%) were determined for scanning speed of 1600 and 1800 mm/s combined with a hatching distance of 0.03 mm. Therefore, a hatching distance of 0.03 mm can be selected as the best compromise in order to maximize the warranty to minimize porosity or cracks. Using a larger hatching distance, the too low overlapping of the laser scans promotes the formation of a lack of fusion. On the other hand, inferior hatching distances create melt pool instability due to larger overlapping between scans triggering defects.
Among these conditions, the sample S38 (scanning speed of 1800 mm/s and hatching distance of 0.03 mm) revealed the lowest cracking density of 0.08 ± 0.02 mm/mm2 with a maximum residual porosity of 0.67 ± 0.22%. On the other hand, the sample S19 (scanning speed of 1000 mm/s and hatching distance of 0.03 mm) resulted in the lowest residual porosity of 0.14 ± 0.08% coupled to a cracking density of 0.80 ± 0.56 mm/mm2.
It should be noted that the current level of densification is not suitable for industrial applications due to the presence of large pores or cracks that could reduce the lifetime of the components. However, one of the two selected conditions with the lowest porosity (S19) or with the lowest cracking density (S38) could be subjected to hot isostatic pressing in order to obtain crack-free samples with an extremely low porosity level, making it suitable for industrial applications.

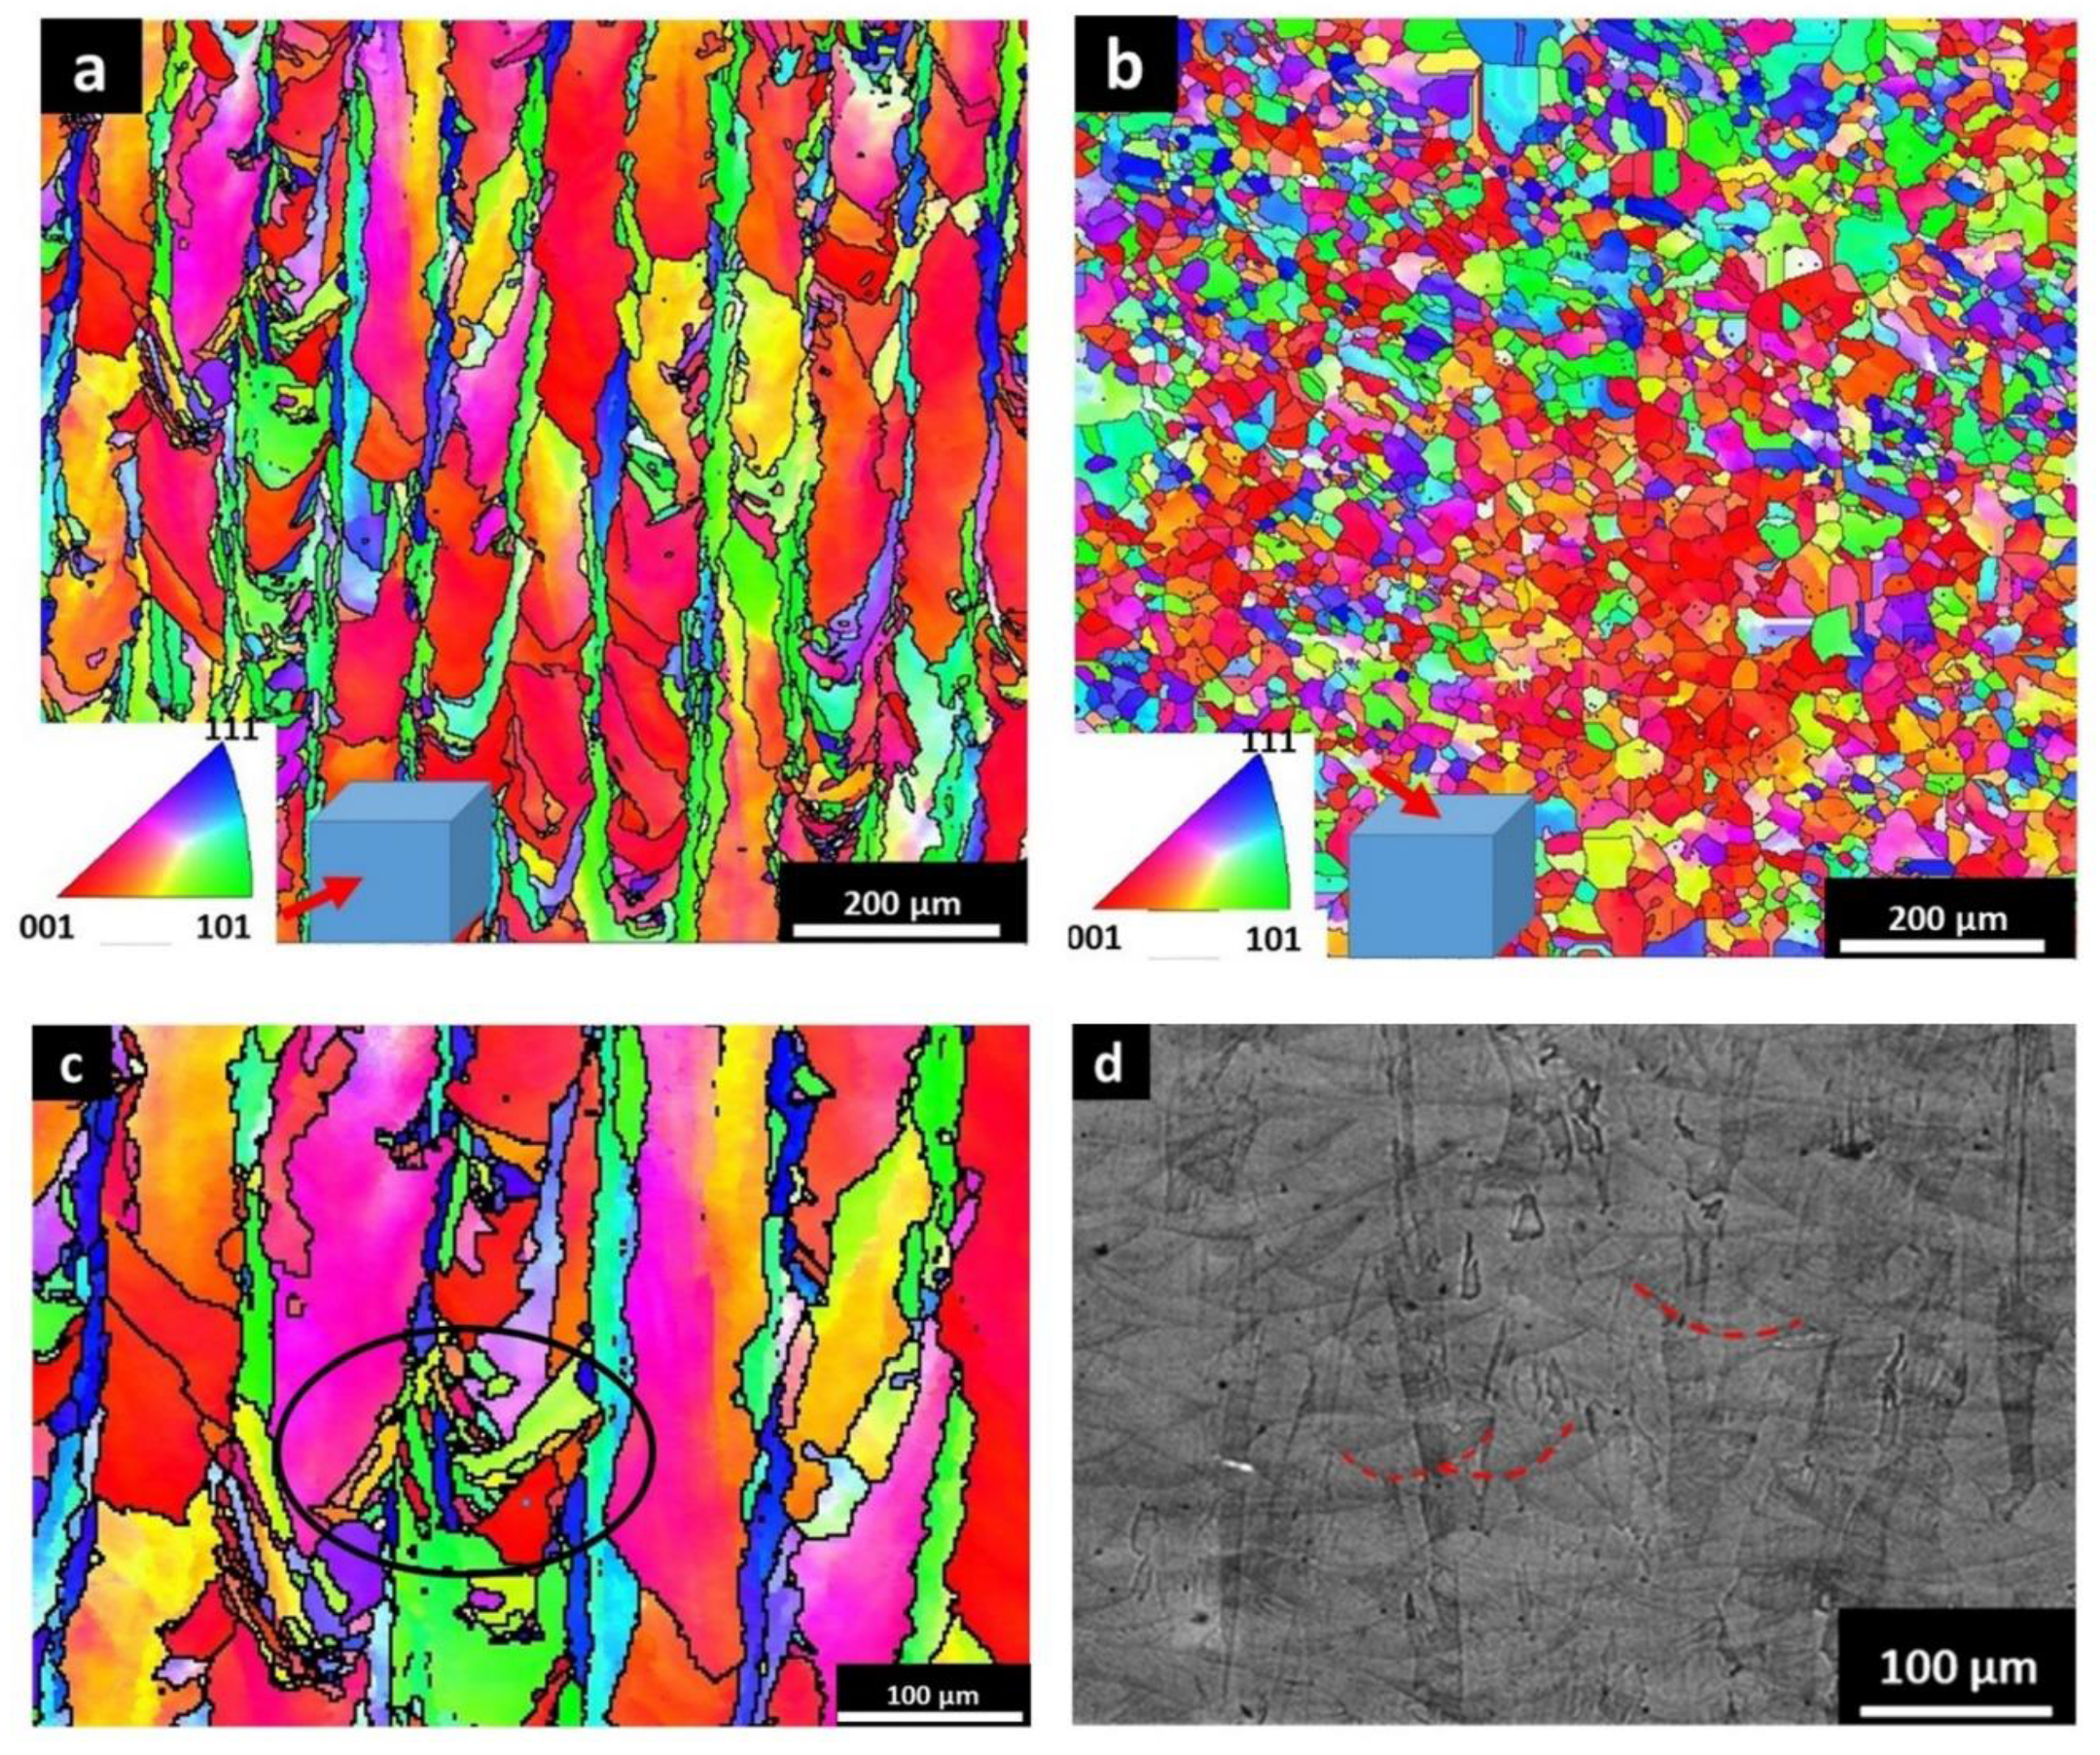
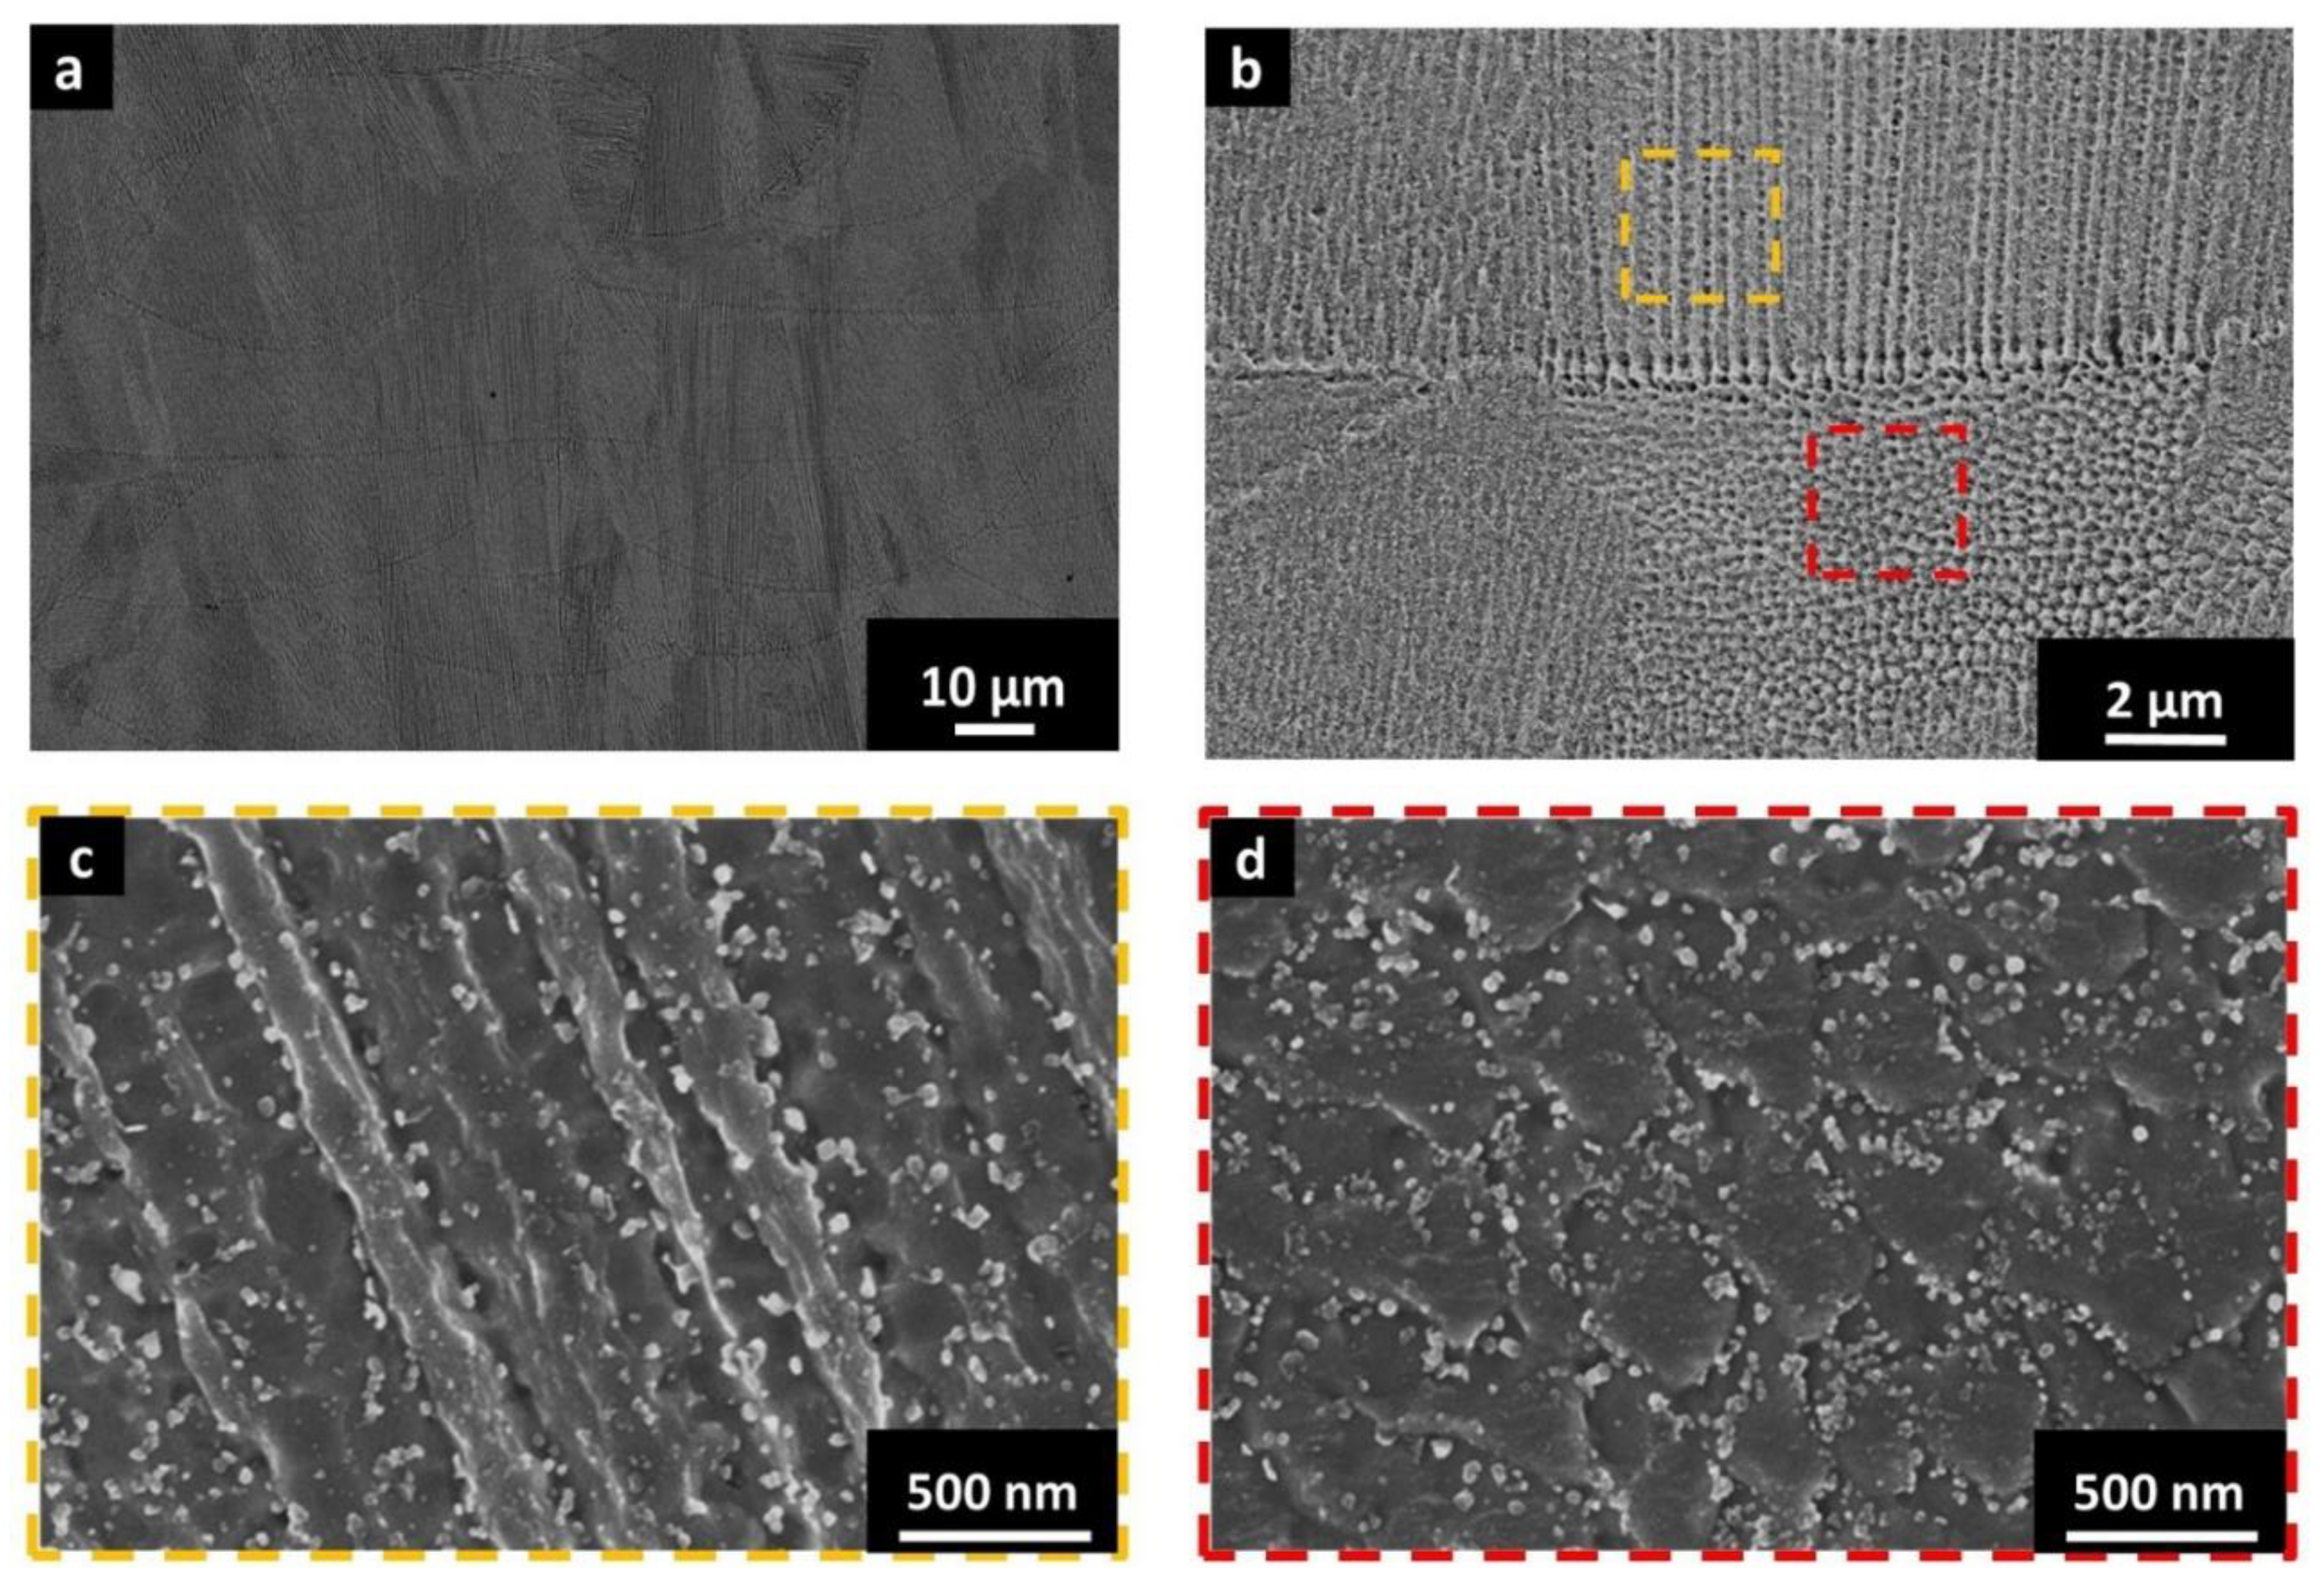
3.3. Microstructural Evaluation of LPBFed IN939

The microstructure of samples characterized by the lowest cracking density (sample S38—scanning speed of 1800 mm/s and hatching distance of 0.03 mm) is provided in Figure 9.
The EBSD maps (Figure 9a,b) reveal a pronounced texture along the <001> orientation (represented by the red color). The high angle grain boundaries (higher 10°) are marked in black, revealing large elongated grains that can reach a length of around 400 µm along the z-axis, while the cross-section of the columnar grains with a size mainly around 35 ± 15 µm are visible along the xy plane. The presence of a strong <001> texture has been often observed for LPBFed Ni-based superalloys [17,19,42,48,49].
The EBSD map in Figure 9c shows an area with smaller grains (highlighted by an oval) with a configuration similar to the melt pool architectures marked in red in the LOM image in Figure 9d. When the laser beam creates the melt pools, the columnar grains tend to be formed along the thermal flux orientation (towards the building platform). The majority of the grains grow, extending across several melt pools, along the z-axis, even though the overlapping between consecutive melt pools can give birth to smaller grains with different orientations.
The melt pools were composed of fine dendritic/cellular architectures (Figure 10a,b). The dendrites were characterized by sub-micrometric dimensions. From the primary dendritic arm spacing (PDAS), it is possible to roughly estimate the cooling rates by the following equation [49]:
P D A S = a · ε b
where a and b are constants with values 50 μm and 1/3, respectively, for nickel-based alloys, and ε is the cooling rate.
The values of PDAS were determined for the samples built using the parameters to minimize the cracking density (sample S38) and residual porosity (sample S19). For the samples S38 and S19, the PDAS was 0.35 ± 0.10 µm and 0.28 ± 0.11 µm, respectively. The PDAS of the two conditions resulted to be very similar, evaluating a cooling rate of around 106 °C/s, which is in agreement with the typical range of cooling rates associated with Ni-based superalloys processed by LPBF [25,49].
High-magnification views (Figure 10c,d) revealed the presence of sub-micrometric precipitates, with the largest ones mainly located along the interdendritic areas. These precipitates are most likely to be MC carbides and γ’ precipitates [35,41,50]. The formation of larger precipitates along the interdendritic areas is associated with the solidification process. When the dendrites are formed, the remaining liquid surrounding the dendritic core (interdendritic areas) starts to be enriched in segregated elements such as Ti, Nb and Ta (for IN939), leading to the formation of larger precipitates or possible segregations in these areas. For Ni-based superalloys, the presence of interdendritic areas characterized by chemical segregations can influence the formation of the phases under heat treatments, promoting a different microstructure evolution with respect to the traditional conditions, i.e., casting or wrought states [51,52,53]. In addition, for the LPBF process, the continuous temperature cycling caused by the remelting could provoke the formation of precipitates.
In order to better study the cracking phenomena, it was chosen to observe the sample S19 (scanning speed of 1000 mm/s and hatching distance of 0.03 mm), which is characterized by the lowest residual porosity and moderate cracking density. The micrographs (Figure 11a,b) show that the cracks were mainly located along the grain boundaries, as noted for other LPBFed Ni-based superalloys [16,18,21,24].
An EDS scan line (Figure 11b,c), performed across one of the typical “bridges” of a crack (an example is visible in the yellow circle in Figure 11b), revealed a slight enrichment of Nb, Ti and C which can suggest the formation of carbides, while the increment of Ti may also indicate γ′ formation. Based on the literature on traditional cast IN939, MC carbides, such as TiC and NbC, and γ′ phases could be formed [35,50].
The high-magnification view (Figure 11d) underlines that the cracks are covered by sub-micrometric intergranular precipitates, as indicated by the yellow arrow. It is possible to assume that the high concentration of precipitates along the grain boundaries can embrittle these areas. Consequently, the thermal stresses can overcome the tensile strength triggering the cracks. Based on the microstructural observations, the cracks may be ascribed to two different mechanisms: (i) liquation cracking due to the melting of eutectic phases such as γ′ precipitates and MC carbides; and (ii) strain-age cracking due to the carbides and γ′ precipitates formation during the heating of the material in the solid-state. In this scenario, a reduction in the C content could limit the formation of the carbides reducing the cracking formation.
Similarly, the critical role of the precipitates in the cracking formation was also reported to explain the limited weldability of the alloy for welding processes [35].

4. Conclusions

The current work regards the effect of the process parameter on the densification level of LPBFed IN939 alloy, including the investigation of the microstructure.
The process parameters optimization permitted to identify specific conditions to limit the porosity and cracking density.
From the results, the most appropriate hatching distance is 0.03 mm, which provides a good overlapping between consecutive laser scans for the reduction in cracking density and residual porosity. Hatching distances inferior to 0.03 mm create melt pool instability resulting in keyhole formation, while too large hatching distances create lack of fusion due to incomplete overlapping between consecutive laser scans. For the scanning speed, 1000 mm/s is effective in almost suppressing all the porosity, but the high energy delivered to the material results in crack formation. On the other hand, by increasing the scanning speed up to 1800 mm/s, it is possible to reduce the cracking formation, but at the same time, the residual porosity increases due to the lower energy delivered to the material.
From the analysis, the sample S38 (scanning speed of 1800 mm/s and hatching distance of 0.03 mm) exhibited the lowest cracking density of 0.08 ± 0.02 mm/mm2 with a residual porosity of 0.67 ± 0.22%. On the other hand, the sample S19 (scanning speed of 1000 mm/s and hatching distance of 0.03 mm) presented the lowest residual porosity of 0.14 ± 0.08% together with a cracking density of 0.80 ± 0.56 mm/mm2.
The microstructure revealed elongated grains along the building direction (z-axis) characterized by a strong texture along the <001> orientation. Inside the grains, a network of dendritic/cellular architectures with sub-micrometric phases mainly located along the grain boundaries and interdendritic areas were observed. This indicates that the high cooling rates of the process did not inhibit the formation of phases during the solidification.
The presence of high thermal residual stresses, due to the rapid cooling rate and subsequent heating/cooling cycles, coupled to a high fraction of intergranular precipitates, seems to provoke the formation of cracks along the grain boundaries.
The main results of the current study are the indication of specific parameters to process Inconel 939 by LPBF, revealing parameters for the fabrication of samples with a low cracking density and low residual porosity. Additionally, understanding the cracking mechanisms can help to identify strategies to mitigate or eliminate crack formation. For example, the reduction of C within the starting powder may limit the intergranular carbides, reducing the number of cracks.
Future studies will be performed to evaluate the mechanical properties of the as-built materials, as well as to investigate the effect of hot isostatic pressing on the densification, microstructure and mechanical properties. Hot isostatic pressing, in fact, can be effective in completely consolidating the material, making it suitable for industrial applications. Finally, future investigations will be carried out on the optimization of specific heat treatments to improve the mechanical properties.

Author Contributions

Conceptualization, G.M., S.P. and S.B.; investigation, G.M., S.P. and A.S.; data curation, S.P., G.M. and A.S.; writing—original draft preparation, G.M. and S.P.; writing—review and editing, G.M., D.M., M.L., D.U. and S.B.; supervision, M.L., P.F., D.U. and S.B. All authors have read and agreed to the published version of the manuscript.

Funding

This research received no external funding.

Acknowledgments

The authors would like to acknowledge the Integrated Additive Manufacturing Centre at Politecnico di Torino (IAM@PoliTo) where the specimens were fabricated.

Conflicts of Interest

The authors declare no conflict of interest.

Appendix A

Table A1. List of the process parameters employed to fabricate the different conditions coupled to the resulting total void content obtained using porosity content and crack density. P = 95 W and t = 20 µm are fixed parameters.
Sample IDvhdVEDResidual PorosityCracking Density
mm/smmJ/mm3%mm/mm2
S11000.153178.79 ± 1.240.65 ± 0.36
S22000.092648.35 ± 1.771.60 ± 0.62
S32000.112162.83 ± 2.043.51 ± 1.38
S42000.131833.54 ± 1.593.30 ± 0.44
S52000.151583.37 ± 15.84.22 ± 0.78
S64000.052382.54 ± 1.102.88 ± 0.56
S74000.071703.40 ± 0.992.58 ± 1.46
S84000.091323.39 ± 2.241.40 ± 0.90
S94000.111081.43 ± 0.341.36 ± 1.16
S104000.13911.74 ± 0.361.58 ± 0.74
S114000.15792.07 ± 0.365.90 ± 0.79
S126000.051580.58 ± 0.213.36 ± 1.19
S136000.071130.78 ± 0.404.60 ± 1.25
S146000.09880.82 ± 0.275.97 ± 0.60
S156000.11720.82 ± 0.142.09 ± 1.18
S168000.051190.28 ± 0.091.13 ± 0.52
S178000.07850.29 ± 0.132.83 ± 0.91
S188000.09660.36 ± 0.184.33 ± 1.08
S1910000.031580.14 ± 0.080.80 ± 0.56
S2010000.05950.21 ± 0.120.82 ± 0.57
S2110000.07680.21 ± 0.092.60 ± 1.08
S2210000.09531.83 ± 0.450.99 ± 0.68
S2312000.031320.17 ± 0.080.38 ± 0.12
S2412000.05790.17 ± 0.110.35 ± 0.33
S2512000.07573.06 ± 0.350.22 ± 0.20
S2612000.094418.41 ± 3.140.60 ± 0.23
S2714000.0217012.59 ± 4.800.64 ± 0.33
S2814000.031130.35 ± 0.210.55 ± 0.24
S2914000.05680.96 ± 0.760.51 ± 0.24
S3014000.074810.33 ± 3.190.75 ± 0.42
S3114000.093812.51 ± 1.990.66 ± 0.44
S3216000.021485.25 ± 3.760.69 ± 0.60
S3316000.03990.53 ± 0.230.23 ± 0.11
S3416000.05591.40 ± 0.520.54 ± 0.23
S3516000.07427.60 ± 2.761.28 ± 0.31
S3616000.093317.65 ± 4.180.76 ± 0.38
S3718000.021328.20 ± 2.850.70 ± 0.31
S3818000.03880.67 ± 0.220.08 ± 0.02
S3918000.05533.28 ± 1.500.30 ± 0.12
S4018000.073819.51 ± 1.480.18 ± 0.08
S4120000.021199.82 ± 3.360.22 ± 0.14
S4220000.03791.29 ± 0.330.15 ± 0.14
S4320000.05487.26 ± 1.580.17 ± 0.05
S4420000.073423.33 ± 3.250.31 ± 0.21
S4522000.0210815.40 ± 1.980.15 ± 0.06
S4622000.03723.59 ± 1.640.20 ± 0.13
S4722000.054312.96 ± 2.570.38 ± 0.17
S4822000.073141.55 ± 3.940.31 ± 0.16

References

  1. Gu, D.D.; Meiners, W.; Wissenbach, K.; Poprawe, R. Laser additive manufacturing of metallic components: Materials, processes and mechanisms. Int. Mater. Rev. 2012, 6608, 133–164. [Google Scholar] [CrossRef]
  2. Herzog, D.; Seyda, V.; Wycisk, E.; Emmelmann, C. Additive manufacturing of metals. Acta Mater. 2016, 117, 371–392. [Google Scholar] [CrossRef]
  3. Aristizabal, M.; Jamshidi, P.; Saboori, A.; Cox, S.C.; Attallah, M.M. Laser powder bed fusion of a Zr-alloy: Tensile properties and biocompatibility. Mater. Lett. 2020, 259, 126897. [Google Scholar] [CrossRef]
  4. Sames, W.J.; List, F.A.; Pannala, S.; Dehoff, R.R.; Babu, S.S. The metallurgy and processing science of metal additive manufacturing. Int. Mater. Rev. 2016, 61, 315–360. [Google Scholar] [CrossRef]
  5. Choudhury, I.; El-Baradie, M. Machinability of nickel-base super alloys: A general review. J. Mater. Process. Technol. 1998, 77, 278–284. [Google Scholar] [CrossRef]
  6. Carter, L.N.; Wang, X.; Read, N.; Khan, R.; Aristizabal, M.; Essa, K.; Attallah, M.M. Process optimisation of selective laser melting using energy density model for nickel based superalloys. Mater. Sci. Technol. 2016, 836, 1–5. [Google Scholar] [CrossRef]
  7. Chlebus, E.; Gruber, K.; Kuźnicka, B.; Kurzac, J.; Kurzynowski, T. Effect of heat treatment on the microstructure and mechanical properties of Inconel 718 processed by selective laser melting. Mater. Sci. Eng. A 2015, 639, 647–655. [Google Scholar] [CrossRef]
  8. Kim, S.H.; Shin, G.-H.; Kim, B.-K.; Kim, K.T.; Yang, D.-Y.; Aranas, C.; Choi, J.-P.; Yu, J.-H. Thermo-mechanical improvement of Inconel 718 using ex situ boron nitride-reinforced composites processed by laser powder bed fusion. Sci. Rep. 2017, 7, 14359. [Google Scholar] [CrossRef] [PubMed]
  9. Marchese, G.; Bassini, E.; Calandri, M.; Ambrosio, E.P.; Calignano, F.; Lorusso, M.; Manfredi, D.; Pavese, M.; Biamino, S.; Fino, P. Microstructural investigation of as-fabricated and heat- treated Inconel 625 and Inconel 718 fabricated by direct metal laser sintering: Contribution of Politecnico di Torino and Istituto Italiano di Tecnologia (IIT) di Torino. Met. Powder Rep. 2016, 71, 273–278. [Google Scholar] [CrossRef]
  10. Barros, R.; Silva, F.J.G.; Gouveia, R.M.; Saboori, A.; Marchese, G.; Biamino, S.; Salmi, A.; Atzeni, E. Laser Powder Bed Fusion of Inconel 718: Residual Stress Analysis Before and After Heat Treatment. Metals 2019, 9, 1290. [Google Scholar] [CrossRef] [Green Version]
  11. Zhang, H.; Li, C.; Guo, Q.; Ma, Z.; Huang, Y.; Li, H.; Liu, Y. Hot tensile behavior of cold-rolled Inconel 718 alloy at 650 °C: The role of δ phase. Mater. Sci. Eng. A 2018, 722, 136–146. [Google Scholar] [CrossRef]
  12. Nalawade, S.A.; Sundararaman, M.; Singh, J.B.; Verma, A.; Kishore, R. Precipitation of γ′ phase in δ-precipitated Alloy 718 during deformation at elevated temperatures. Mater. Sci. Eng. A 2010, 527, 2906–2909. [Google Scholar] [CrossRef]
  13. Smith, G.D.; Tillack, D.J.; Patel, S.J. Alloy 625—Impressive Past/Significant Presence/Awesome Future. Superalloys 2001, 718, 35–46. [Google Scholar] [CrossRef]
  14. Floreen, S.; Fuchs, G.E.; Yang, W.J. The Metallurgy of Alloy 625. Superalloys 1994, 718, 13–37. [Google Scholar] [CrossRef]
  15. Marchese, G.; Bassini, E.; Aversa, A.; Lombardi, M.; Ugues, D.; Fino, P.; Biamino, S. Microstructural Evolution of Post-Processed Hastelloy X Alloy Fabricated by Laser Powder Bed Fusion. Materials 2019, 12, 486. [Google Scholar] [CrossRef] [PubMed] [Green Version]
  16. Tomus, D.; Rometsch, P.A.; Heilmaier, M.; Wu, X. Effect of minor alloying elements on crack-formation characteristics of Hastelloy-X manufactured by selective laser melting. Addit. Manuf. 2017, 16, 65–72. [Google Scholar] [CrossRef]
  17. Carter, L.N.; Martin, C.; Withers, P.J.; Attallah, M.M. The influence of the laser scan strategy on grain structure and cracking behaviour in SLM powder-bed fabricated nickel superalloy. J. Alloys Compd. 2014, 615, 338–347. [Google Scholar] [CrossRef]
  18. Carter, L.N.; Attallah, M.M.; Reed, R.C. Laser Powder Bed Fabrication of Nickel-Base Superalloys: Influence of Parameters; Characterisation, Quantification and Mitigation of Cracking. In Proceedings of the Superalloys 2012: 12th International Symposium on Superalloys, Hoboken, NJ, USA, 9–13 September 2012; pp. 577–586. [Google Scholar] [CrossRef]
  19. Wang, X.; Carter, L.N.; Pang, B.; Attallah, M.M.; Loretto, M.H. Microstructure and yield strength of SLM-fabricated CM247LC Ni-Superalloy. Acta Mater. 2017, 128, 87–95. [Google Scholar] [CrossRef]
  20. Divya, V.D.; Muñoz-Moreno, R.; Messé, O.M.D.M.; Barnard, J.S.; Baker, S.; Illston, T.; Stone, H.J. Microstructure of selective laser melted CM247LC nickel-based superalloy and its evolution through heat treatment. Mater. Charact. 2016, 114, 62–74. [Google Scholar] [CrossRef] [Green Version]
  21. Cloots, M.; Uggowitzer, P.J.; Wegener, K. Investigations on the microstructure and crack formation of IN738LC samples processed by selective laser melting using Gaussian and doughnut profiles. Mater. Des. 2016, 89, 770–784. [Google Scholar] [CrossRef]
  22. Qiu, C.; Chen, H.; Liu, Q.; Yue, S.; Wang, H. On the solidification behaviour and cracking origin of a nickel-based superalloy during selective laser melting. Mater. Charact. 2019, 148, 330–344. [Google Scholar] [CrossRef]
  23. Tomus, D.; Jarvis, T.; Wu, X.; Mei, J.; Rometsch, P.; Herny, E.; Rideau, J.F.; Vaillant, S. Controlling the microstructure of Hastelloy-X components manufactured by Selective Laser Melting. Phys. Procedia 2013, 41, 823–827. [Google Scholar] [CrossRef] [Green Version]
  24. Marchese, G.; Basile, G.; Bassini, E.; Aversa, A.; Lombardi, M.; Ugues, D.; Fino, P.; Biamino, S. Study of the microstructure and cracking mechanisms of Hastelloy X produced by laser powder bed fusion. Materials 2018, 11, 106. [Google Scholar] [CrossRef] [Green Version]
  25. Sanchez-mata, O.; Wang, X.; Muñiz-lerma, J.A.; Shandiz, M.A.; Gauvin, R.; Brochu, M. Fabrication of Crack-Free Nickel-Based Superalloy Considered Non-Weldable during Laser Powder Bed Fusion. Materials 2018, 11, 1288. [Google Scholar] [CrossRef] [Green Version]
  26. Chen, Y.; Lu, F.; Zhang, K.; Nie, P.; Hosseini, S.R.E.; Feng, K.; Li, Z. Dendritic microstructure and hot cracking of laser additive manufactured Inconel 718 under improved base cooling. J. Alloys Compd. 2016, 670, 312–321. [Google Scholar] [CrossRef]
  27. Lippold, J.C.; Sowards, J.W.; Murray, G.M.; Alexandrov, B.T.; Ramirez, A.J. Weld solidification cracking in solid-solution strengthened ni-base filler metals. In Hot Cracking Phenomena in Welds II; Springer: Berlin/Heidelberg, Germany, 2008; pp. 147–170. [Google Scholar] [CrossRef]
  28. Zhang, X.; Chen, H.; Xu, L.; Xu, J.; Ren, X.; Chen, X. Cracking mechanism and susceptibility of laser melting deposited Inconel 738 superalloy. Mater. Des. 2019, 183, 108105. [Google Scholar] [CrossRef]
  29. Attallah, M.M.; Jennings, R.; Wang, X.; Carter, L.N. Additive manufacturing of Ni-based superalloys: The outstanding issues. MRS Bull. 2016, 41, 758–764. [Google Scholar] [CrossRef]
  30. Moosavy, H.N.; Aboutalebi, M.R.; Seyedein, S.H. An analytical algorithm to predict weldability of precipitation—strengthened nickel-base superalloys. J. Mater. Process. Technol. 2012, 212, 2210–2218. [Google Scholar] [CrossRef]
  31. Bassini, E.; Marchese, G.; Cattano, G.; Lombardi, M.; Biamino, S.; Ugues, D. Influence of solutioning on microstructure and hardness of hot isostatically pressed Astroloy. J. Alloys Compd. 2017, 723, 1082–1090. [Google Scholar] [CrossRef]
  32. Tomus, D.; Tian, Y.; Rometsch, P.A.; Heilmaier, M.; Wu, X. Influence of post heat treatments on anisotropy of mechanical behaviour and microstructure of Hastelloy-X parts produced by selective laser melting. Mater. Sci. Eng. A 2016, 667, 42–53. [Google Scholar] [CrossRef]
  33. González Albarrán, M.A.; Martínez, D.I.; Díaz, E.; Díaz, J.C.; Guzman, I.; Saucedo, E.; Guzman, A.M. Effect of preweld heat treatment on the microstructure of heat-affected zone (HAZ) and weldability of Inconel 939 superalloy. J. Mater. Eng. Perform. 2014, 23, 1125–1130. [Google Scholar] [CrossRef]
  34. González, M.A.; Martínez, D.I.; Pérez, A.; Guajardo, H. Microstructural rejuvenation through non-conventional heat treatments of an inconel 939 superalloy. Mater. Res. Soc. Symp. Proc. 2012, 1372, 89–96. [Google Scholar] [CrossRef]
  35. González, M.A.; Martínez, D.I.; Pérez, A.; Guajardo, H.; Garza, A. Microstructural response to heat affected zone cracking of prewelding heat-treated Inconel 939 superalloy. Mater. Charact. 2011, 62, 1116–1123. [Google Scholar] [CrossRef]
  36. Shaw, S.W.K. Response of in-939 to Process Variations. Superalloys 1980, 275–284. [Google Scholar] [CrossRef]
  37. Jahangiri, M.R.; Abedini, M. Effect of long time service exposure on microstructure and mechanical properties of gas turbine vanes made of IN939 alloy. Mater. Des. 2014, 64, 588–600. [Google Scholar] [CrossRef]
  38. Zhu, J.; Wise, A.; Nuhfer, T.; Holcomb, G.R.; Jablonski, P.D.; Sridhar, S.; Laughlin, D.E. High-temperature-oxidation-induced ordered structure in Inconel 939 superalloy exposed to oxy-combustion environments. Mater. Sci. Eng. A 2013, 566, 134–142. [Google Scholar] [CrossRef] [Green Version]
  39. Jahangiri, M.R.; Arabi, H.; Boutorabi, S.M.A. Comparison of microstructural stability of IN939 superalloy with two different manufacturing routes during long-time aging. Trans. Nonferrous Met. Soc. China 2014, 24, 1717–1729. [Google Scholar] [CrossRef]
  40. Footner, P.K.; Richards, B.P. Long-term growth of superalloy γ′ particles. J. Mater. Sci. 1982, 17, 2141–2153. [Google Scholar] [CrossRef]
  41. Mišković, Z.; Jovanović, M.; Gligić, M.; Lukić, B. Microstructural investigation of IN 939 superalloy. Vacuum 1992, 43, 709–711. [Google Scholar] [CrossRef]
  42. Kanagarajah, P.; Brenne, F.; Niendorf, T.; Maier, H.J. Inconel 939 processed by selective laser melting: Effect of microstructure and temperature on the mechanical properties under static and cyclic loading. Mater. Sci. Eng. A 2013, 588, 188–195. [Google Scholar] [CrossRef]
  43. Philpott, W.; Jepson, M.A.E.; Thomson, R.C. Comparison of the effects of a conventional heat treatment between cast and selective laser melted IN939 alloy. In Advances in Materials Technology for Fossil Power Plants—Proceedings from the 8th International Conference, Albufeira, Portugal, 11–14 October 2016; Parker, J., Shingledecker, J., Siefert, J., Eds.; Electric Power Research Institute (EPRI): Palo Alto, CA, USA, 2016. [Google Scholar]
  44. Read, N.; Wang, W.; Essa, K.; Attallah, M.M. Selective laser melting of AlSi10Mg alloy: Process optimisation and mechanical properties development. Mater. Des. 2015, 65, 417–424. [Google Scholar] [CrossRef] [Green Version]
  45. Marchese, G.; Aversa, A.; Lorusso, M.; Manfredi, D.; Calignano, F.; Lombardi, M.; Biamino, S.; Pavese, M. Development and characterisation of aluminium matrix nanocomposites ALSi10Mg/MgAl2O4 by laser powder bed fusion. Metals 2018, 8, 175. [Google Scholar] [CrossRef] [Green Version]
  46. Moussaoui, K.; Rubio, W.; Mousseigne, M.; Sultan, T.; Rezai, F. Effects of Selective Laser Melting additive manufacturing parameters of Inconel 718 on porosity, microstructure and mechanical properties. Mater. Sci. Eng. A 2018, 735, 182–190. [Google Scholar] [CrossRef] [Green Version]
  47. Scipioni Bertoli, U.; Wolfer, A.J.; Matthews, M.J.; Delplanque, J.P.R.; Schoenung, J.M. On the limitations of Volumetric Energy Density as a design parameter for Selective Laser Melting. Mater. Des. 2017, 113, 331–340. [Google Scholar] [CrossRef] [Green Version]
  48. Marchese, G.; Parizia, S.; Rashidi, M.; Saboori, A.; Manfredi, D.; Ugues, D.; Lombardi, M.; Hryha, E.; Biamino, S. The role of texturing and microstructure evolution on the tensile behavior of heat-treated Inconel 625 produced via laser powder bed fusion. Mater. Sci. Eng. A 2020, 769, 138500. [Google Scholar] [CrossRef]
  49. Li, S.; Wei, Q.; Shi, Y.; Zhu, Z.; Zhang, D. Microstructure Characteristics of Inconel 625 Superalloy Manufactured by Selective Laser Melting. J. Mater. Sci. Technol. 2015, 31, 946–952. [Google Scholar] [CrossRef]
  50. Gibbons, T.B.; Stickler, R. IN939: Metallurgy, Properties and Performance. In High Temp. Alloys Gas Turbines; Springer: Dordrecht, The Netherlands, 1982; pp. 369–393. [Google Scholar]
  51. Zhang, F.; Levine, L.E.; Allen, A.J.; Stoudt, M.R.; Lindwall, G.; Lass, E.A.; Williams, M.E.; Idell, Y.; Campbell, C.E. Effect of heat treatment on the microstructural evolution of a nickel-based superalloy additive-manufactured by laser powder bed fusion. Acta Mater. 2018, 152, 200–214. [Google Scholar] [CrossRef]
  52. Stoudt, M.R.; Lass, E.A.; Ng, D.S.; Williams, M.E.; Zhang, F.; Campbell, C.E.; Lindwall, G.; Levine, L.E. The Influence of Annealing Temperature and Time on the Formation of δ-Phase in Additively-Manufactured Inconel 625. Metall. Mater. Trans. A Phys. Metall. Mater. Sci. 2018, 49, 3028–3037. [Google Scholar] [CrossRef] [Green Version]
  53. Marchese, G.; Lorusso, M.; Parizia, S.; Bassini, E.; Lee, J.-W.; Calignano, F.; Manfredi, D.; Terner, M.; Hong, H.-U.; Ugues, D.; et al. Influence of heat treatments on microstructure evolution and mechanical properties of Inconel 625 processed by laser powder bed fusion. Mater. Sci. Eng. A 2018, 729, 64–75. [Google Scholar] [CrossRef]
Figure 1. (a) Scanning electron microscope (SEM) image of gas-atomized IN939 powder; (b) Particle size distribution and cumulative frequency distribution of the IN939 powder; (c) Cross-section of the polished IN939 particles; (d) Energy dispersive X-ray spectrometry (EDS) maps of an etched particle showing enrichment in Nb, Ti, and W, with depletion of Ni, Cr, and Co within the interdendritic areas.
Metals 10 00882 g001
Figure 2. Schematic illustration of the scanning strategy applied in the process optimization of IN939 alloy processed by laser powder bed fusion (LPBF).
Metals 10 00882 g002
Figure 3. Schematic representation of the analyzed orientations along the zy plane (along the building direction) and along the xy plane (perpendicular to the building direction).
Metals 10 00882 g003
Figure 4. (a) Light optical microscope (LOM) image showing the pores and cracks; (b) Post-processed LOM image revealing only pores for the residual porosity determination; (c) SEM image showing pores and cracks; (d) Post-processed SEM image exhibiting only cracks for the cracking density determination.
Metals 10 00882 g004
Figure 5. (a) Effect of volumetric energy density (VED) on the residual porosity of LPBFed IN939; (bd) LOM images of representative conditions revealing the different shapes and sizes of the detected pores; (e) Effect of VED on the cracking density of the LPBFed IN939; (fh) LOM images of representative conditions with very similar VED (85–88 J/mm3) showing different dimensions and concentrations of cracks.
Metals 10 00882 g005
Figure 6. (a) Effect of scanning speed and hatching distance on the porosity level; (b) Zoom of the porosity level lower than 5%.
Metals 10 00882 g006
Figure 7. (a) Effect of scanning speed and hatching distance on the cracking density of LPBFed IN939; (b) Zoom of cracking density lower than 1 mm/mm2.
Metals 10 00882 g007
Figure 8. Representative LOM images of LPBFed IN939 fabricated using different process parameters. Note the laser power and layer thickness are constant at 95 W and 20 µm, respectively.
Metals 10 00882 g008
Figure 9. (a,b) Electron backscatter diffraction (EBSD) maps with included inverse pole figure of LPBFed IN939 sample (S38) along the building direction (z-axis) and perpendicular to the building direction (xy plane), respectively; high angle grain boundaries (>10°) are marked by black line segments; (c) Zoom of the EBSD map along z-axis showing the presence of smaller grains triggered by melt pools; (d) Chemical etched LOM image of the LPBFed IN939 showing columnar grains and the melt pools, some of which are pointed out by red lines, along the building direction.
Metals 10 00882 g009
Figure 10. (a,b) SEM images of the LPBFed IN939 showing the melt pools; (c,d) High-magnification SEM images showing fine dendritic/cellular architectures. Kalling’s No.2 etchant was used.
Metals 10 00882 g010
Figure 11. (a) LOM image of the LPBFed IN939 sample (S19) showing cracks mainly located along the grain boundaries; (b) SEM image of a crack along the grain boundaries; (c) EDS scan line performed across one of the typical “bridges” of a crack; (d) SEM image of the phases covering an intergranular crack. Kalling’s No.2 etchant was used.
Metals 10 00882 g011
Table 1. IN939 main chemical composition of the IN939 in weight percent (wt. %): (1) chemical composition of the used powder provided from the supplier; (2) semi-quantitative analysis obtained by EDS analysis except for C determined by combustion infrared analysis of the used powder; (3) standard chemical composition range of cast IN939 alloy, data from [37].
IN939NiCrCoTiWAlTaNbCZrB
(1)Bal.22.5019.003.702.101.901.501.000.140.100.01
(2)Bal.22.3018.803.602.001.801.401.000.150.10-
(3) [37]Bal.22.00–22.8018.50–19.503.60–3.801.90–2.201.80–2.101.00–1.600.80–1.100.13–0.1650.08–0.120.008–0.012

