Article

The Effects of Severe Plastic Deformation and/or Thermal Treatment on the Mechanical Properties of Biodegradable Mg-Alloys

1
Physics of Nanostructured Materials, Faculty of Physics, University of Vienna, 1090 Wien, Austria
2
Faculty of Industrial Engineering, University of Applied Sciences–Technikum Wien, 1200 Wien, Austria
3
Center for Health & Bioresources, Biomedical Systems, AIT Austrian Institute of Technology GmbH, 2700 Wiener Neustadt, Austria
4
Materials Research Laboratory, University of Nova Gorica, SI-5270 Ajdovscina, Slovenia
5
Institute of Fundamental and Frontier Sciences, University of Electronic Science and Technology of China, Chengdu 610054, China
6
Department of Material Science and Non-Ferrous Metals Engineering, Faculty of Non-Ferrous Metals, AGH-University of Science and Technology, 30-059 Kraków, Poland
7
Division of Materials Engineering, Department Mechanical Engineering, LTH, Lund University, 223-65 Lund, Sweden
*
Author to whom correspondence should be addressed.
Metals 2020, 10(8), 1064; https://doi.org/10.3390/met10081064
Submission received: 22 June 2020 / Revised: 29 July 2020 / Accepted: 1 August 2020 / Published: 6 August 2020

Abstract

:
In this study, five MgZnCa alloys with low alloy content and high biocorrosion resistance were investigated during thermomechanical processing. As documented by microhardness and tensile tests, high pressure torsion (HPT)-processing and subsequent heat treatments led to strength increases of up to 250%; as much as about 1/3 of this increase was due to the heat treatment. Microstructural analyses by electron microscopy revealed a significant density of precipitates, but estimates of the Orowan strength exhibited values much smaller than the strength increases observed. Calculations using Kirchner’s model of vacancy hardening, however, showed that vacancy concentrations of 10⁵ could have accounted for the extensive hardening observed, at least when they formed vacancy agglomerates with sizes around 50–100 nm. While such an effect has been suggested for a selected Mg-alloy already in a previous paper of the authors, in this study the effect was substantiated by combined quantitative evaluations from differential scanning calorimetry and X-ray line profile analysis. Those exhibited vacancy concentrations of up to about 10−3 with a marked percentage being part of vacancy agglomerates, which has been confirmed by evaluations of defect specific activation migration enthalpies. The variations of Young’s modulus during HPT-processing and during the subsequent thermal treatments were small. Additionally, the corrosion rate did not markedly change compared to that of the homogenized state.

1. Introduction

Biodegradable Mg Alloys

Magnesium alloys, as the lightest structural materials, are becoming increasingly popular for numerous applications, especially for biodegradable implants. When the clinical function of permanent implants is served, they typically must be removed because of allergy problems and/or mechanical instabilities, e.g., the stress shielding effect [1], which arises from different Young’s moduli of bone and implant materials. Such a removal can be avoided when using biodegradable materials for implants provided the degradation time can be adjusted to the healing time. The implants dissolve in the human body after fulfilling their purposes by a corrosion process initiated by the body fluids [2].
MgZn-based alloys have been proposed as very suitable biodegradable materials for load-bearing applications due to their low density, comparably high strength and low Young’s modulus—coming close to that of bones and thus avoiding stress shielding.
In general, improvements in mechanical properties can be achieved through increased alloy content and/or precipitation formation. In the case of Mg, the first strategy is limited since the solubility of most alloying elements is limited [3,4]. Concerning the formation of precipitates in Mg-Zn systems, Mima and Tanaka [5] identified three important low-temperature ranges for Mg-Zn systems: (i) below 60 °C, the formation of stable Guinier–Preston (GP1) zones; (ii) 60–110 °C, the formation of stable rod-type and basal platelet-type precipitates along with unstable GP1 zones followed by growth of the former at the expense of dissolution of the latter; and (iii) above 110 °C, the formation of stable rod-type and basal platelet-type precipitates, the most stable ones being the rod type [6,7]. In a commercial Mg5.5Zn0.6Zr (wt%) alloy (ZK60), Orlov et al. [8] found intermetallic precipitates similar to the GP1 zones, as a result of special ageing conditions after plastic deformation.
Enhancing solid solution and/or precipitation for the sake of mechanical properties, however, increases the chemical reactivity and finally causes unacceptably large rates of corrosion in most environments [9]. Moreover, in the case of precipitate formation, it may exhibit a markedly enhanced Young’s modulus, thereby increasing the shielding effect. For all these reasons, using plastic deformation for the generation of lattice defects acting as barriers to dislocation movement, is an interesting alternative aiming at higher mechanical properties [10]. Importantly, the elastic moduli in texture-free polycrystalline aggregates do not change during plastic deformation.
In comparison to fcc and bcc metals, the critical resolved shear stresses in slip systems of hcp metals have large variations. Therefore, in Mg and its alloys, plastic deformation occurs by slip and/or twinning on a much lower number of systems, which significantly limits the ductility, especially at low temperatures [11]. This problem can be overcome by deformation at elevated temperatures, but then the production of lattice defects becomes increasingly balanced by their thermally activated annihilation, resulting in a decreasing total number of lattice defects. A better way is to process the materials by methods of severe plastic deformation (SPD) [12,13,14,15,16]. Those provide an enhanced hydrostatic pressure that is prevalent during deformation which suppresses the formation of cracks and extends deformability. In many works, equal channel angular pressing (ECAP, [17,18,19,20,21,22,23]) was used to deform Mg and Mg alloys for the sake of hardening through refining the microstructure, but still, cracks were formed during deformation at room temperature (RT), and continuous deformation was possible only above 200 °C allowing for grain sizes beyond 0.5 μm. As HPT yields much higher hydrostatic pressures (up to 10 GPa) than ECAP (1.5 GPa), processing can be extended to 10–100 times larger strains, thereby providing grain sizes down to 100 nm at room temperature (RT) processing [24,25,26,27,28]. Therefore, in the present investigation of low-concentration biodegradable Mg alloys, HPT was applied; we were expecting substantial grain refinement through massive dislocation production, by redistribution of solutes and also by a high concentration of vacancies [29,30,31]. Zehetbauer [32,33] and especially Horky et al. [33] for two selected Mg-alloys reported that these deformation-induced vacancies can form agglomerates that inhibit the dislocation movement and therefore increase the macroscopic strength; however, an extensive study of this effect has not been performed yet.
It was therefore the aim of this work to investigate thoroughly the strengthening capabilities of five biodegradable Mg alloys with low alloy content through the formation of both deformation-induced defects, including vacancy agglomerates, and precipitates via severe plastic deformation and heat treatments. The biodegradable MgZnCa-systems chosen here only included mineral nutrients that are not harmful to the human body. With the alloy constituents Zn and Ca, precipitates were formed, which not only impeded dislocation movement and thereby increased both strength and work hardening, but also stopped grain growth during solidification and thermal treatments [29]. Due to the fact that Ca is less noble than Mg, low MgZnCa systems also provide—according to Hofstetter et al. [9]—desirably slow and homogeneous degradation behavior with the low Mg alloys selected here.

2. Experimental Procedure

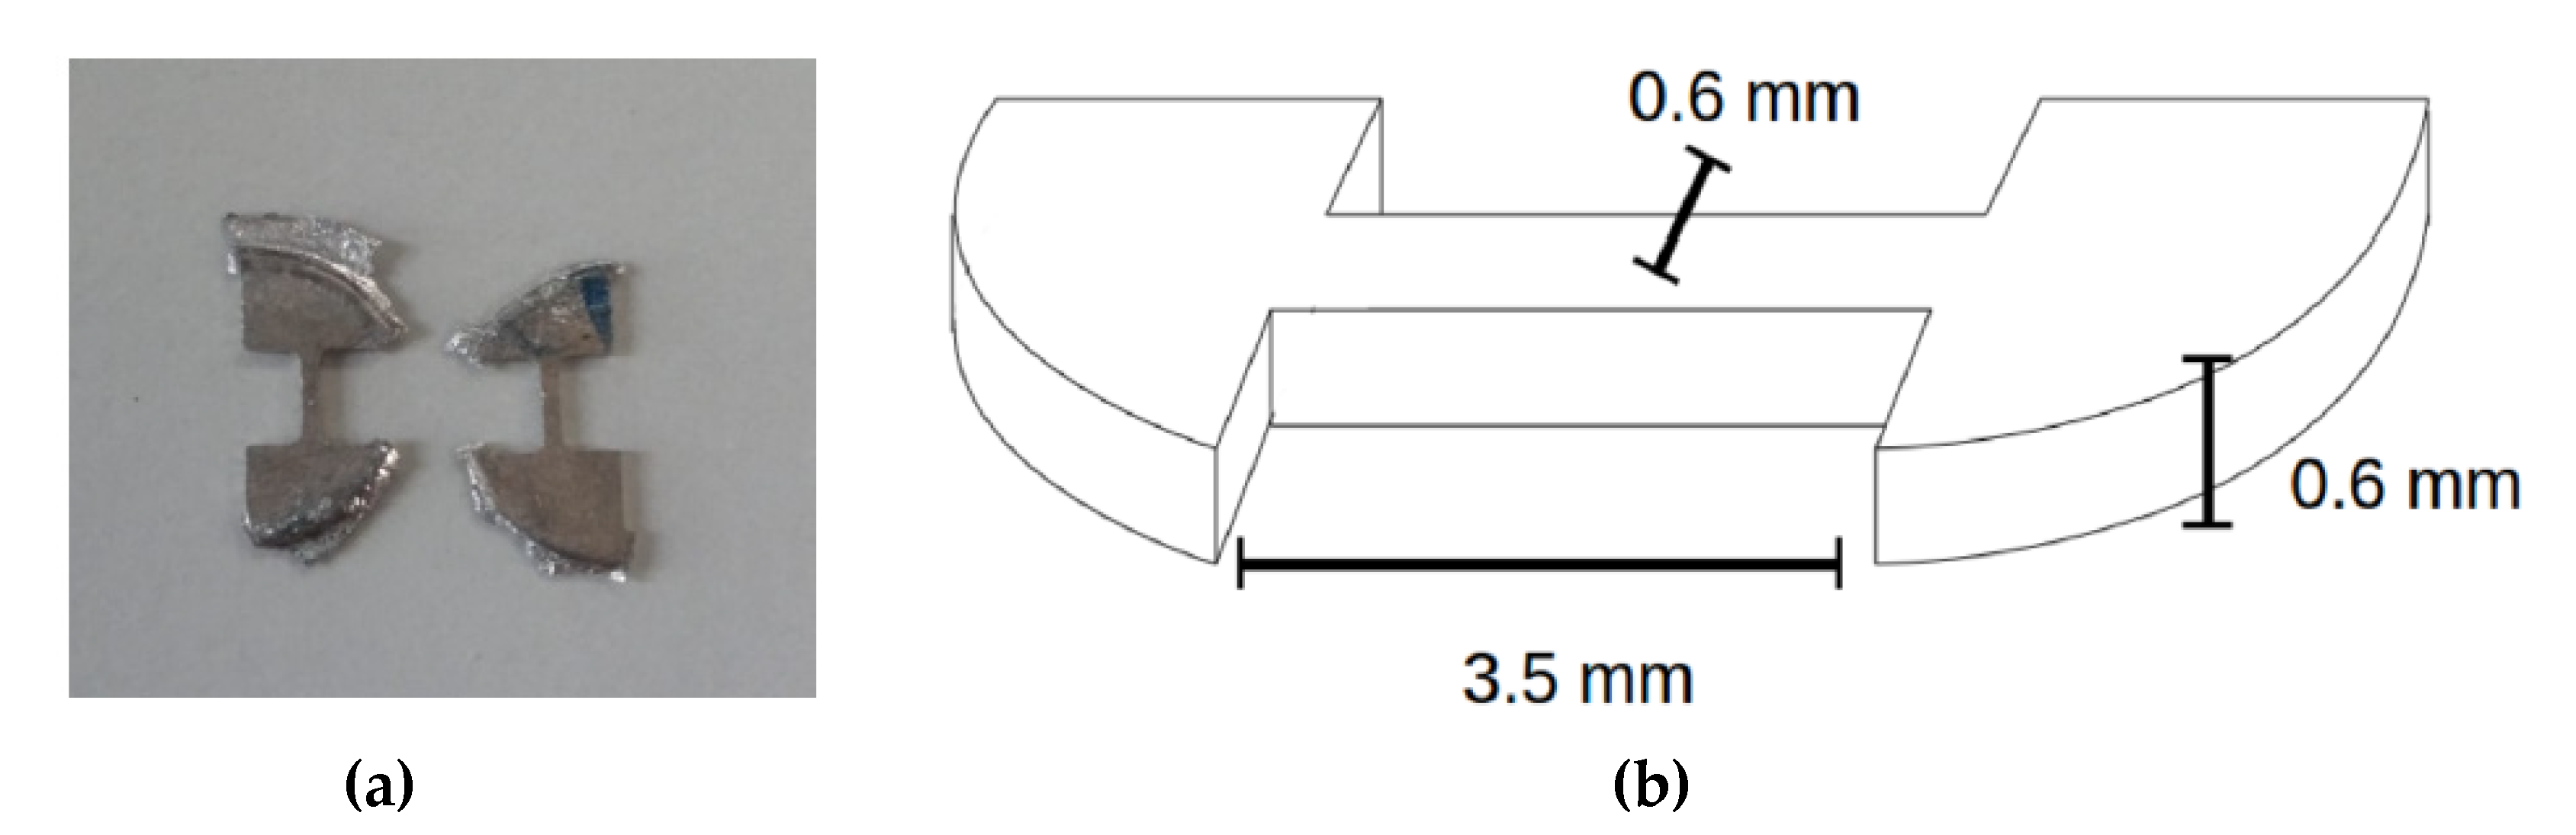
2.1. Materials, Samples and Preparations

Five alloys were investigated with compositions Mg5Zn0.3Ca, Mg5Zn0.15Ca, Mg5Zn0.15Ca0.15Zr, Mg5Zn and Mg0.3Ca. The emphasis of analyses was laid on the first three alloys; the last two alloys helped to understand the main findings in-depth. The alloys were cast at the LKR (Leichtmetall-Kompetenzzentrum Ranshofen, Ranshofen, Austria), a subsidiary of AIT (Austrian Institute of Technology, Wien, Austria). The chemical compositions of the alloys are shown in Table 1.
The specimens were homogenized in a resistance furnace in argon protective gas atmosphere in order to avoid strong oxidation, at 450 °C for 24 h for all alloys, except Mg5Zn which was heat treated at 350 °C for 12 h [34]. After that, the samples were either furnace-cooled or quenched to room temperature, and investigated separately.

2.2. HPT-Processing

For HPT-processing, disc-shaped samples with a diameter of 10 mm and a thickness of 0.7 mm were prepared. The hydrostatic pressure applied during HPT was 4 GPa, and the rotation speed was 0.2 rot/min. The samples were torsion strained to shear strains
γ T = 2 π N r h
with the von Mises strains ε being by a factor √3 smaller [35]. N means the number of rotations, r the sample radius and h the thickness of the sample. HPT-processing was performed at room temperature (RT).

2.3. Heat Treatments

Heat treatments of both the initial homogenized (IS) and the HPT-processed samples were performed over different time periods and at different temperatures between 50 °C and 240 °C in a silicon oil bath with a thermal stability of ±0.5 °C. After the heat treatments, the samples were quenched in RT-water to ensure fast cooling and high accuracy of heat treatment duration [34].

2.4. Characterization of Microstructure

2.4.1. Microhardness Tests

Vickers hardness was chosen as a measure of strength and investigated for all samples by an MHT-4 Micro Indentation Tester (ANTON PAAR, Graz, Austria), by applying a load of 0.5 N for 10 s. After the indentation, the indents’ areas were observed with a Light Microscope AXIOPLAN (ZEISS, Jena, Germany) using 50×/0.75 HD DIC and EPIPLAN 100×/0.75 objectives. The diagonals were measured from images taken with a CCD camera being part of the microscope, as shown in Figure 1. Asymmetries of indents did not affect the lengths of diagonals, and no crack formation occurred. When determining the hardness of an HPT-processed sample, the indents were taken at fixed radii from the center of the specimen, in order to ensure comparability of the results. At least 10 indents per sample state were evaluated.
For the measurements of Young’s modulus, a microindentation tester MHT-3 (ANTON PAAR, Graz, Austria) was used.

2.4.2. Tensile Tests

Strength and ductility were determined by tensile testing. Dogbone-shaped specimens with a cross-sectional area of 0.6 × 0.6 mm2 and a parallel gauge length of 3.5 mm in average (Figure 2) were cut via spark erosion from the HPT-processed and non-processed discs. The gauge length of the tensile samples was off-centered at a radius of the HPT-disc of approximately 3 mm.
A micro-tensile machine produced by MESSPHYSIK/ZWICK-RÖLL (Fürstenfeld, Austria) was used with load capacities in the range of 1–1000 N—suitable for determination of tensile properties and low cycle fatigue tests of small-scaled samples. Loads up to 120 N with a ramp speed of 0.2 mm/min giving the strain rate of approximately 1 × 10⁻³ s−1 were used. To obtain average values for the tensile test results, at least 3 samples were tested for each condition.

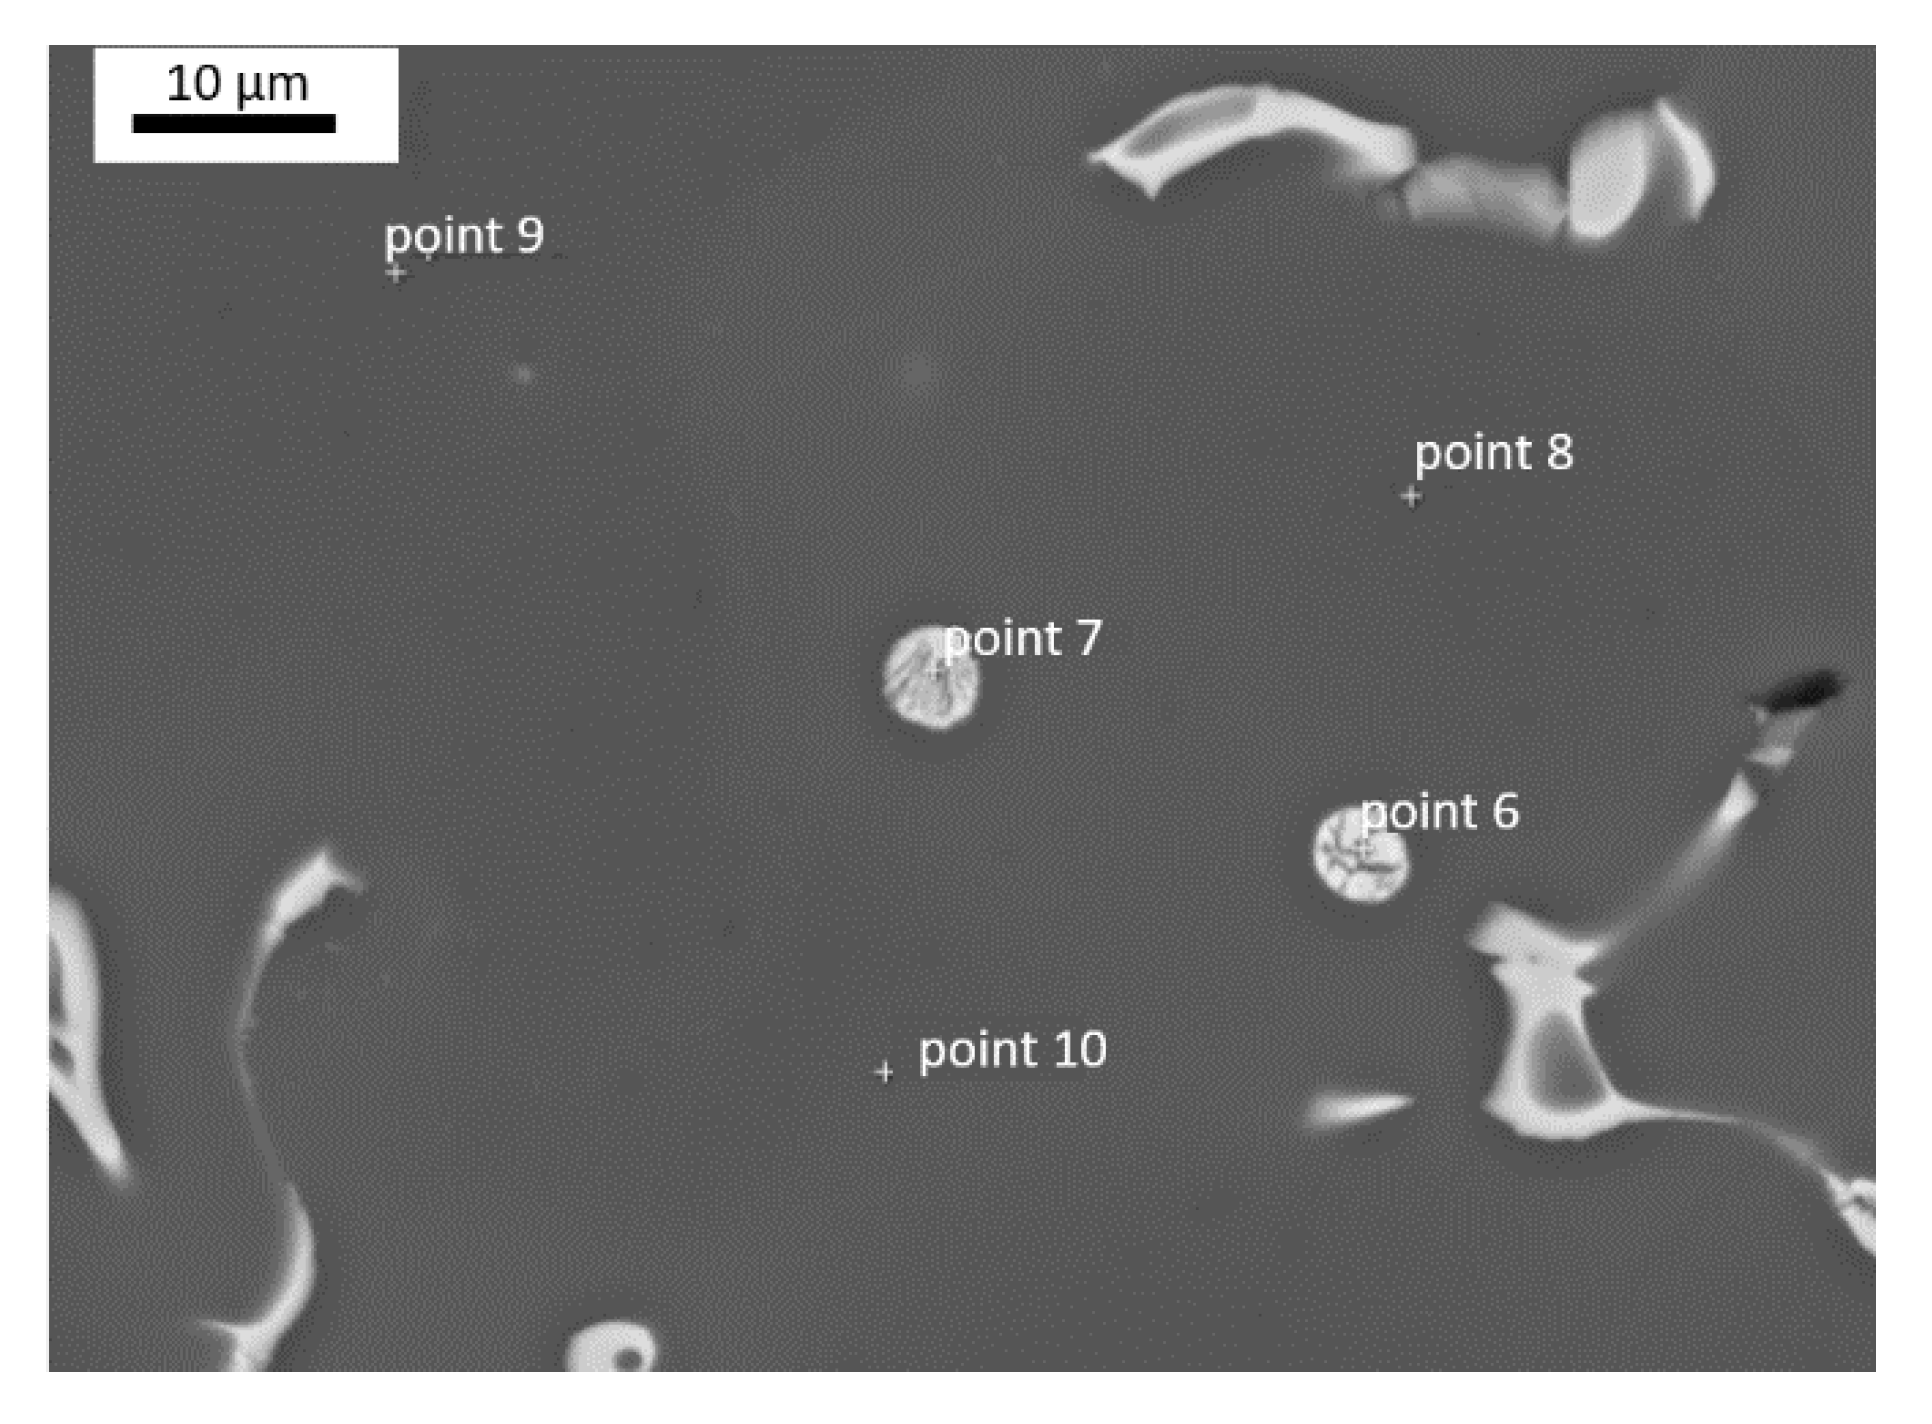
2.4.3. Electron Microscopy

In order to follow the relative redistribution of intermetallic precipitates throughout the matrix at the microscale, scanning electron microscopy (SEM) in backscattered-electron (BSE) imaging mode was carried out. For this purpose, a SUPRA 55 VP SEM (ZEISS, Jena, Germany) equipped with an energy-dispersive X-ray spectroscopy (EDS) analysis and imaging system was used. Samples were mechanically ground and polished down to a finish by employing ethanol lubricant and a 0.05 µm Al2O3 suspension. Detailed evaluation of the evolution of particles at the nano-scale was carried out by transmission electron microscopy (TEM) and scanning transmission electron microscopy (STEM). For this purpose, a JEM 2100F-UHR microscope (JEOL, Tokyo, Japan) equipped with a high-angle annular dark field (HAADF) detector was used. The same microscope is equipped with an EDS facility (Oxford Instruments, Abingdon, UK), which has been used for elemental analyses of the Mg alloys investigated. The specimens for TEM/STEM analyses were prepared by cutting a 3 mm disk out of the slice, and mechanically polishing with polishing paper (up to 2000 grit) and finishing with 1 µm suspension. During polishing only absolute ethanol has been used as a lubricant. Finally, the specimen was ion milled with grazing Ar+ ion beam, by means of a Precision Ion Polishing System (PIPS-II) (GATAN, Pleasanton, CA, USA) operated at 5 kV at the beginning down to 2 kV for the final step.

2.4.4. Differential Scanning Calorimetry

The differential scanning calorimetry (DSC) measurements were performed using two instruments, a DSC204 (NETZSCH, Selb, Germany) and a DSC8500 (PERKIN-ELMER, Cleveland, OH, USA) using aluminum crucibles. Heating was carried out in a linear way in a temperature range from 25 to 450 °C. The standard heating rate was 10 K/min. During DSC, the annealing of deformation-induced defects can be observed by the occurrence of exothermic peaks. The area of a given peak corresponds to the total energy being stored in all defects of a given type, E d e f e c t , from which its density can be derived. For dislocations, their stored energy E d i s l   is related to their density ρ [36]:
E d i s l = G b 2 ρ 4 π κ ln ( ( b ρ ) 1 )
where G is the shear modulus and b the absolute value of the Burgers vector. κ denotes the arithmetic average of 1 and (1 − ν), with ν = 0.343 as Poisson’s ratio, assuming equal parts of edge and screw dislocations. The concentration of vacancies cv can be evaluated from the stored energy of vacancies E v a c divided by the formation enthalpy per vacancy, ΔH (in Mg, ΔH = 1.27 × 10⁻¹⁹ Joule = 0.79 eV [37]),
c V = E v a c Δ H × ν × N a ,
with ν being the amount of substance and Na Avogadro’s number. Information on the nature of the defects can be obtained from the annealing peak temperature Tmax and the activation (defect’s migration) enthalpy Q. For the latter, the method of Kissinger [38] was applied by evaluating the shift of Tmax with changing heating rate. By plotting
ln ( ϕ T m a x 2 ) = Q R 1 T m a x + c o n s t
for various heating rates Φ and absolute peak temperatures Tmax, the migration enthalpy Q can be determined; R is the gas constant.

2.4.5. X-ray Diffraction Peak Profile Analysis (XPA)

Selected samples were subjected to X-ray diffraction peak profile analysis (XPA) measurements by means of a self-assembled double diffractometer to measure dislocation density ρ. The X-ray source was a MM9 X-ray rotating anode generator (RIGAKU, Tokyo, Japan) using monochromatic Co-Kα radiation, corresponding to a wavelength λ = 1.79 nm. The peak profiles were collected by a curved position-sensitive detector of type CPS-590 (INEL, Artenay, France), covering an angular range of 90° between 40° and 130°. For details of the diffraction theory of Bragg peak broadening related to dislocation density and crystallite size, see [39,40]. The evaluation of XPA data was done by the open source software (C) MWP-fit (Version 140518, Budapest, Hungary) [41,42].

2.4.6. Corrosion Tests

Corrosion tests were performed in testing tubes filled with 250 mL simulated body fluid (SBF) with a composition according to SBF27 from [43], a pH value of 7.35. The tests were conducted at a temperature of 37 °C and the SBF was changed every seven days. Two disc-shaped samples with the same diameter of 10 mm and a height between 0.4 mm and 0.7 mm were immersed together in order to have a larger total surface area. The samples were polished with SiC-paper (1200 grid) and cleaned with ethanol directly before the start of the test.
The corrosion of Mg alloys leads to the formation of hydrogen gas, which accumulates at the top of the testing tubes [44,45], according to the reaction
M g + 2 H 2 O M g ( O H ) 2 + H 2
The amount of H2 gas was recorded every 4 h and normalized by the initial sample’s surface area. A numerical derivation was conducted to obtain the corrosion rate followed by a moving average algorithm to smoothen the curves. Two tests were performed for each material in each condition. The corrosion test set-up has already been described previously [46,47].

3. Results

3.1. Achieving the Supersaturated Solid-Solution Condition

SEM images of the as-cast alloys reveal a large number of primary precipitates, which are represented by the areas with bright contrast in Figure 3, Figure 4 and Figure 5. On the microscale, the precipitates are distributed rather homogeneously in every sample condition. The level of contrast in these images signifies compositional changes in the microstructure, as it depends on the atomic numbers of the elements involved. All samples in the as-cast condition showed particles with a size of 5–10 μm, both within grain interiors and along grain boundaries. EDS analyses were done to reveal the chemistry of the primary precipitates. The analyses were achieved on well-defined points on the sample’s surface, as shown in Figure 3, revealing a spectrum of the chemical composition of each point investigated (Figure 4). A total of 10 points were used for the primary precipitates and the surrounding matrix to determine the mean value. The chemistry of these precipitates revealed by EDS is shown in Table 2. Further, phase diagrams from literature were used to estimate the compositions of the precipitates. Those of the primary particles should correspond to Mg2Ca, Zn13Mg12 and Ca2Mg5Zn5 [48]. A more detailed analysis on primary precipitates could have been done by TEM, but that was not the focus of this study. The total volume fraction of primary precipitates was determined to be about ~2% being estimated from the total area of the particles by means of standard image analysis methods.
During homogenization, the primary precipitates should have been thermally destroyed. It is not possible, however, to dissolve them completely in the Mg matrix, as its solid solubility is low: Ca has a solubility in Mg of 0.82 at% (1.35 wt%), and Zn has a solubility in Mg of 2.4 at% (6.2 wt%) [49]. Two cooling treatments—quenching and furnace cooling—were performed with all alloys (Figure 6): Quenched samples showed still widely spread precipitates, while the furnace-cooled ones did not, indicating almost a solid-solution state. For the alloys Mg5Zn and Mg5Zn0.3Ca, the volume fraction after quenching could be reduced to ~2% with a precipitation size of less than 5 µm. In case of furnace cooling, the remaining volume fraction of precipitates was less than 1% with a size in the nm-scale. For Mg5Zn0.15Ca and Mg5Zn0.15Ca0.15Zr both cooling treatments could reduce the volume fraction of primary precipitates to below 1%. As a common name for both states, “initial state (IS)” is used in all the following parts of this paper.
The results of microhardness (HV0.05) measurements of as-cast Mg5Zn0.3Ca, Mg5Zn, Mg0.3Ca, Mg5Zn0.15Ca and Mg5Zn0.15Ca0.15Zr samples, and in their furnace-cooled or quenched states, are listed in Table 3.

3.2. The Effect of Severe Plastic Deformation

After reaching the homogenized (initial) state, the samples were HPT processed at a hydrostatic pressure of 4 GPa by 0.5 and 2 rotations, reaching torsional strains up to γT~100. After that, microhardness (HV0.05) measurements were carried out while distributing them over the whole cross section. In particular, microhardness was measured along entire radii of the disc-shaped sample. In Figure 7, the microhardness values are presented as a function of torsional shear strain γT calculated according to Equation (1). After HPT of the furnace-cooled samples, the microhardness can be said to increase with increasing γT, and finally reaches saturation at around HV0.05 = 160 for all four alloys, while for Mg0.3Ca the saturation is reached already at around HV0.05 = 72 (Figure 7).
However, starting with the quenched IS condition, which showed a higher microhardness than the furnace-cooled initial state, microhardness after HPT processing saturated at lower values, for Mg5Zn0.3Ca and Mg5Zn at around HV0.05 = 140 and for Mg5Zn0.15Ca and Mg5Zn0.15Ca0.15Zr at around HV0.05 = 150 for the highest γT. For Mg0.3Ca, the saturation hardness was around HV0.05 = 64 only. The microhardness of the alloy with 0.15% Zr showed a slight tendency to decrease at higher strains (30–100) after a peak value at lower strains of approximately γT = 20. In terms of relative effects after HPT processing, the samples in the IS (furnace-cooled) showed microhardness increases of 175% for Mg5Zn0.3Ca, 190% for Mg5Zn, 135% for Mg5Zn0.15Ca0.15Zr, 85% for Mg5Zn0.15Ca and 53% for Mg0.3Ca. Even in relative numbers, the HPT-processed IS (quenched) samples showed smaller increases, 100% for Mg5Zn0.3Ca, 87% for Mg5Zn, 77% for Mg5Zn0.15Ca, 113% for Mg5Zn0.15Ca0.15Zr and 19% for Mg0.3Ca.

3.3. The Effects of Isothermal Heat Treatments

Microhardnesses of heat-treated alloys in the initial state and HPT-processed state have been reported in [34]. After homogenization, followed by furnace-cooling or quenching, Mg alloy samples were not only HPT-processed to ε~5 and ε~20, but also heat-treated for up to 29 h, at a constant temperature between 50–220 °C in intervals of 20 °C. After each isothermal heat treatment, microhardness was measured. Similarly to the results reported by Horky et al. [33] (see also Section 4.3 and Section 4.4), further hardness increases were observed in all alloys studied in this work except Mg0.3Ca, as discussed later. The highest hardness was observed after a heat treatment at 100 °C (see Figure 8a–e) and at an annealing time of 1 h (Figure 8).
The increases in the IS (furnace-cooled) samples were larger than in the IS (quenched); i.e., heat treatments of the furnace-cooled and HPT-processed samples gave a total increase of microhardness by 40%, while the heat treatments of the quenched and HPT-processed samples gave 15% only.
The binary alloy Mg0.3Ca had its hardness maxima after heat treatments at 75 °C and between 150 and 160 °C. When exceeding the annealing temperature of 100 °C (or 160 °C in the case of Mg0.3Ca), microhardness decreased significantly for all alloys; and at annealing temperatures near 220 °C, it reached original values before heat treatment.
It is interesting to note that the samples without any HPT-processing also showed a thermally-induced hardness maximum at around the same annealing temperatures, i.e., 100 °C and 160 °C, although the values remained substantially below those of the HPT-processed samples (Figure 8a–e).
The peak temperature of 100 °C was chosen to investigate how the extension of heat treating time up to 29 h affects hardness of Mg5Zn0.3Ca, Mg5Zn and Mg0.3Ca alloys HPT-processed to ε~5 and ε~20; see Figure 9. For almost all materials, hardness increased after one hour but did not increase further within the next 23 h of heat treatment. Only after longer heat treatment time, substantial decreases in hardness were observed. Figure 10 shows the results for a fixed heat treatment time of 24 h, and varying temperature between 25 and 150 °C. For HPT-processed samples, the highest hardness values were observed, most of them again at T = 100 °C. Significantly smaller or no hardness maxima at all were found in the case of IS samples heat treated at T = 100 °C.

3.4. Total Hardness Increase after Processing

The total hardness increase along the processing history of Mg5Zn0.3Ca and Mg5Zn in the IS (quenched and furnace-cooled) is summarized in Figure 11. A percentage in a bar shows the hardness increase from one processing stage to the next one. A percentage above a bar shows the total hardness increase from the first processing stage to the last one. A very high total hardness increase of up to 200% for Mg5Zn could be reached for the furnace-cooled samples, while the quenched ones showed a total hardness increase of only 100%.
The maximum hardness increase for furnace-cooled samples of about 200% could only be reached for Mg5Zn and Mg5Zn0.3Ca. Mg0.3Ca (Figure 12) showed a surprisingly high hardness increase of 150%, whereas Mg5Zn0.15Ca and Mg5Zn0.15Ca0.15Zr showed only an increase of 100%. The last two alloys did not show a reaction to heat treatments at all.

3.5. Tensile Strength and Ductility

Tensile tests were conducted for all five alloys in the initial state; HPT-deformed (0.5 and 2 rotations); and additionally, heat treated for 24 h at 100 °C. Representative engineering stress–strain curves obtained by micro-tensile testing are shown in Figure 13. In cases wherein no relative maximum was seen, the ultimate tensile strength (UTS) was derived by determining the maximum load and the initial cross section of the sample. For the determination of yield strength, a constant plastic strain of 1% was chosen. The difference in yield strength and UTS of the IS and HPT-processed samples typically amount to 100 MPa and 200 MPa, respectively. HPT-processing more than doubles the yield strength and also drastically increases the ultimate tensile strength by ~140% for Mg0.3Ca. For Mg5Zn0.3Ca and Mg5Zn, the UTS increased by ~45% and ~75%, respectively. For Mg5Zn0.15Ca and Mg5Zn0.15Ca0.15Zr, HPT processing reduced the maximum elongation to ~5%. This means that the ductility is much lower than that of the material in the initial state. The post-HPT heat treatment (condition of peak hardness) led to a further strong increase in yield strength by up to ~85% and a slight decrease in ultimate tensile strength. However, the elongation to failure still reached 5% only, not showing any response to thermal treatment after HPT-processing. The average values of strength and ductility measured in the tensile tests are summarized in Table 4.

3.6. Evolution of Young’s Modulus

From microhardness indentation tests, values of Young’s Modulus E of all materials and treatments can be evaluated too. They lie between 32–50 GPa (Table 5) considering all materials, but within one material they did not change by more than 18% due to the different treatments. Mg5Zn0.3Ca and Mg0.3Ca showed moderate differences of Young’s modulus at a strain of γT~8. Mg5Zn0.15Ca0.15Zr had a variation of Young’s Modulus at a strain of γT~2. Pole figures (002) (010) (011) and (102) of the samples with apparent variations of Young’s modulus during processing history were determined by XRD, displaying the crystallographic textures of the materials (Figure 14). From the latter, data of Young’s Modulus could be simulated (Figure 15 for Mg5Zn0.3Ca): each obtained texture was discretized and represented as a result from 100,000 grains all having the same weight. Based on the orientation of each grain and the compliance constants Sij, the individual Young’s modulus of each grain was calculated using Bunge’s interdependence [50] of Young’s modulus E with the materials’ compliances Sij, and with the texture components. Using Voigt’s average [51] for the E-values of all grains, an upper limit for the macroscopic E could be calculated. More details of the simulation have been given in publication [10]. The following compliances given in [52] for dilute Mg-alloys were used: S11 = 0.0172738 GPa−1, S12 = −0.01606 GPa−1; and S44 = 0.066667 GPa−1; neglecting influences from constituents Zn and Ca in higher percentages. These influences and the fact of upper-limit calculation may explain some positive, constant offsets of simulated values of E compared to the experimental values.

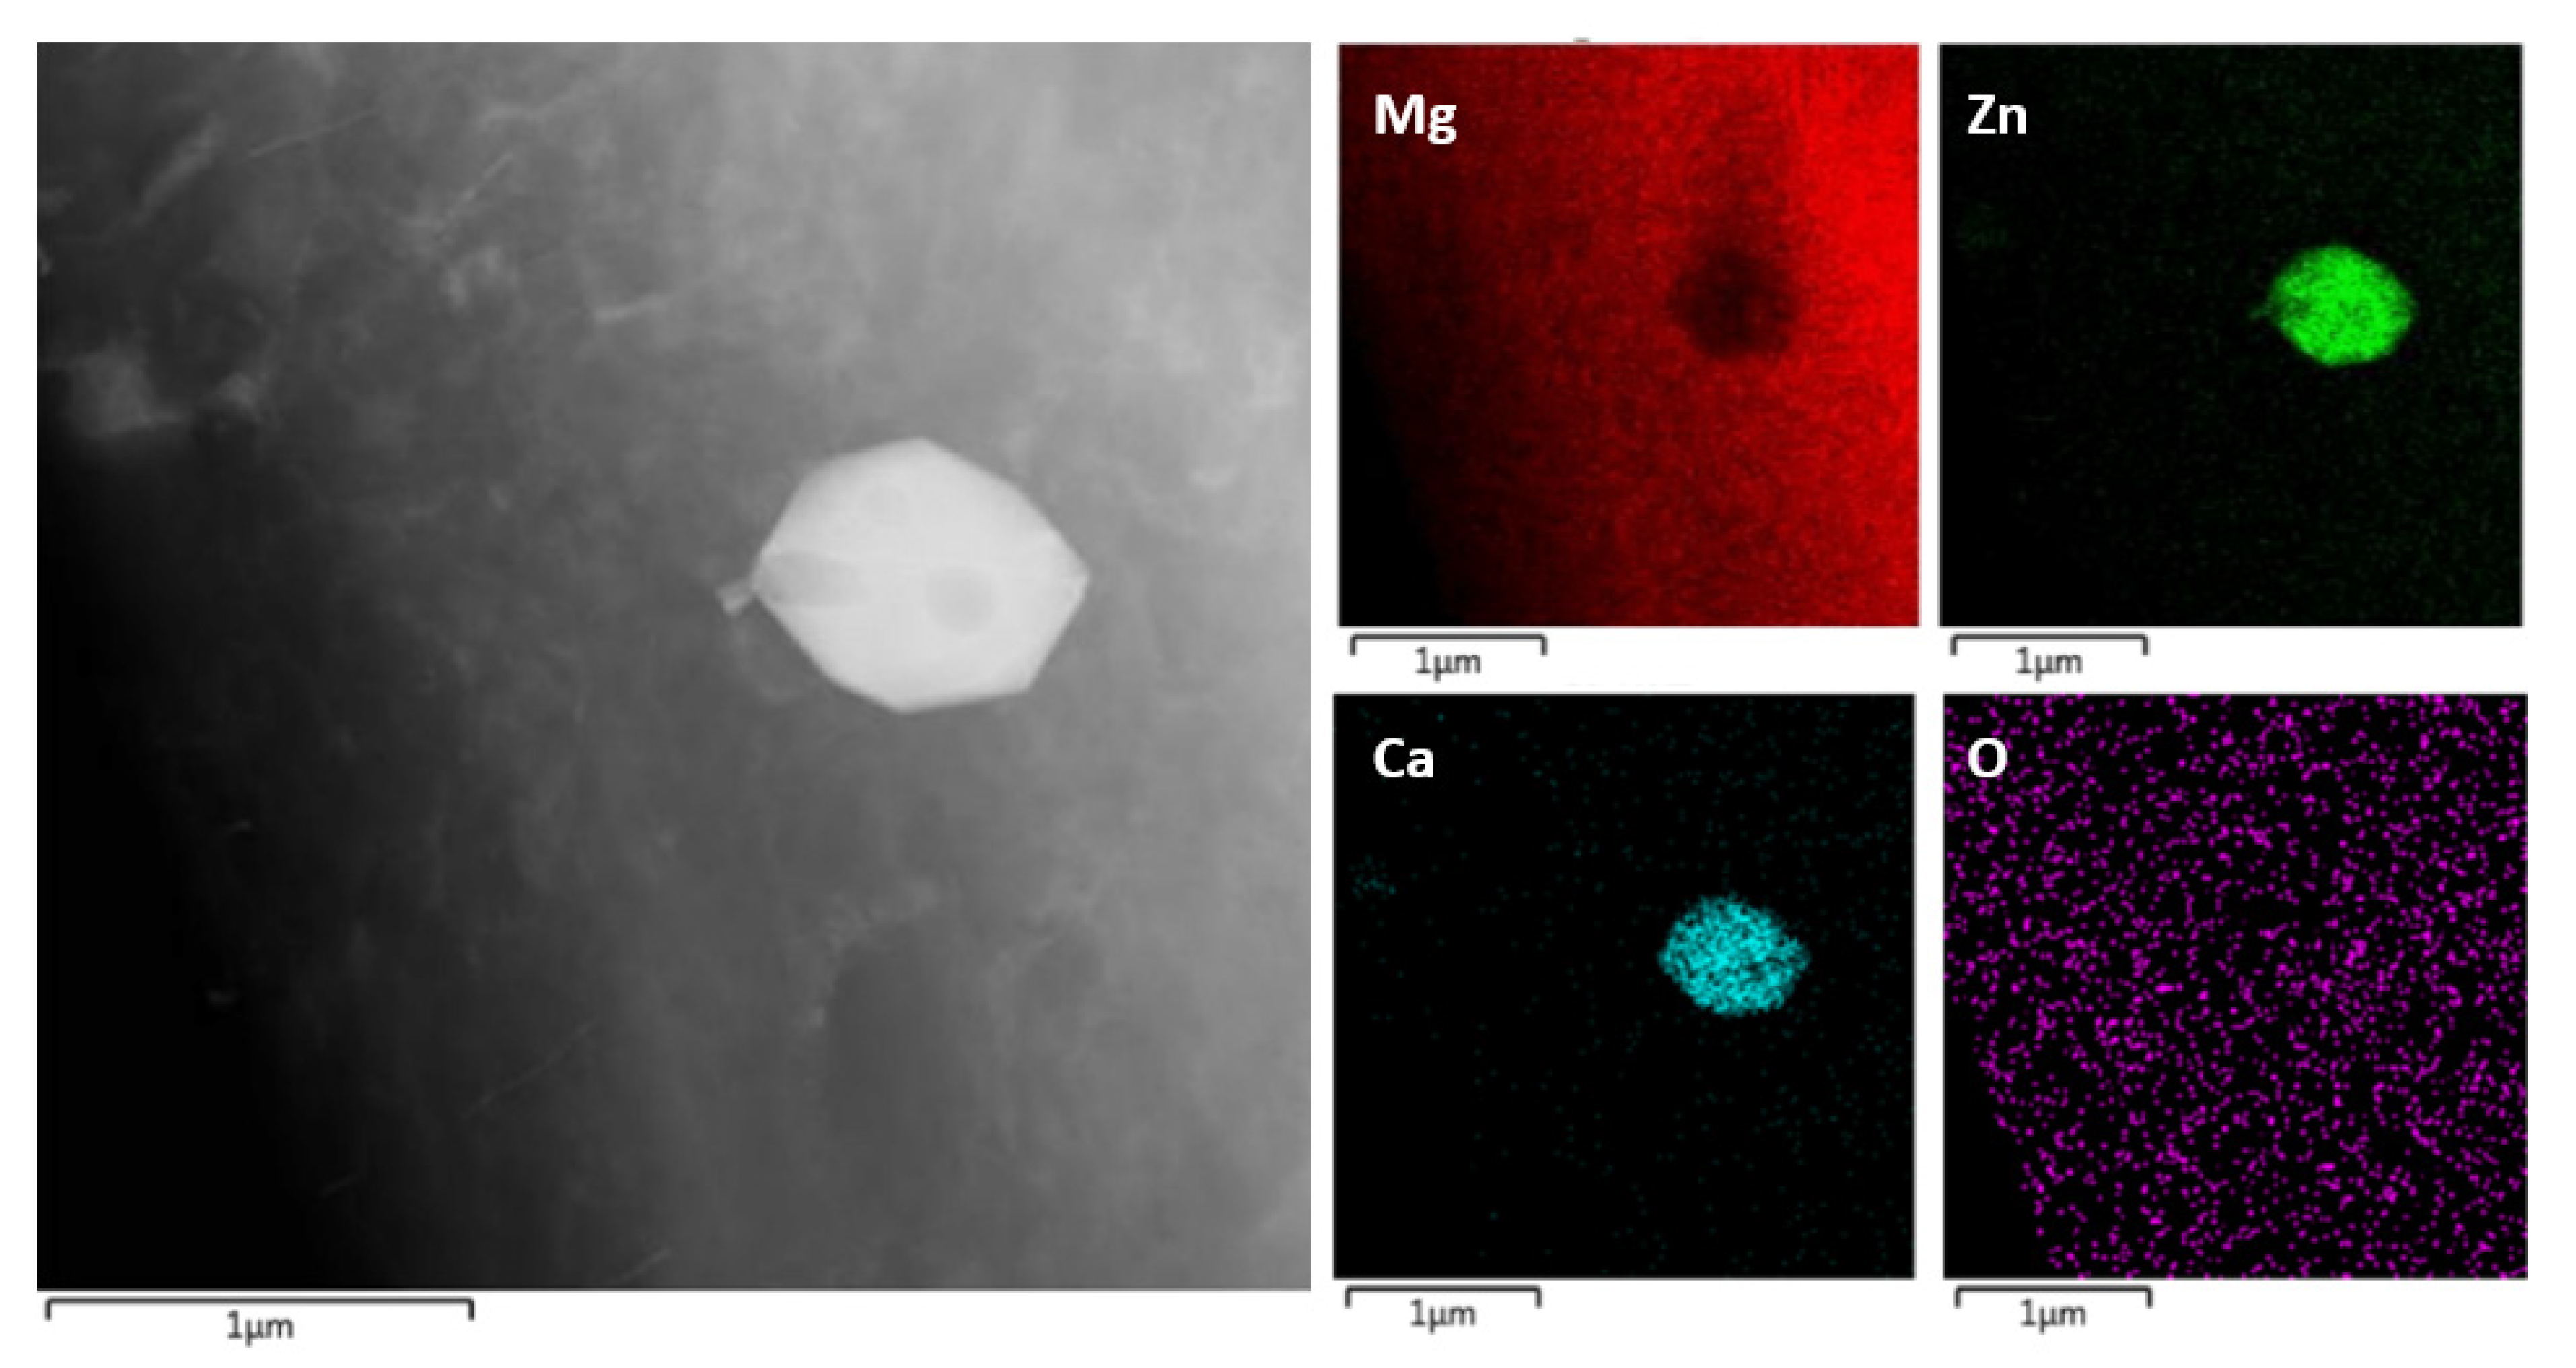
3.7. Electron Microscopy Analysis of Precipitate Structure Evolution

TEM analyses were done in order to understand how the mechanical properties of Mg samples are related to microstructural features, in particular, to different shapes and densities of precipitates that form during heat treatments. The samples were chosen based on the significance of microhardness results shown in Figure 10, for the alloy Mg5Zn0.3Ca, in the following three states:
(1)
IS (furnace-cooled) and additionally HPT-deformed at 4 GPa for 0.5 rotations at RT;
(2)
IS (furnace-cooled) and HPT-deformed at 4 GPa for 0.5 rotations at RT and heat treated at 100 °C for 24 h;
(3)
IS (furnace-cooled) and HPT-deformed at 4 GPa for 0.5 rotations at RT and heat treated at 125 °C for 24 h.
The three precipitate states reveal differences in morphology, size and density of precipitates in the range of 3–100 nm. Primary precipitates, as scattered residuals after annealing, did not show any substantial evolution during the processing history; see Figure 16—first row, SEM 200×.
Precipitates’ structures have been analyzed in all three states (Figure 16—second row, SEM about 10,000×), namely: polyhedral precipitates (P1), elongated precipitates (P2) and thinner phases. The thinner phases are at the boundaries of grains, or follow their contours. P1 and P2 do not change at all during processing, and can be observed in all states (Figure 17). P1 and P2 contain Zn and Ca, as seen in exemplary EDS maps of P1 precipitates (Figure 18).
Besides P1, P2 and thinner phases, further precipitates were observed in the heat-treated samples (Figure 16—third row, STEM, about 200,000×). P3-precipitates could be observed in both the heat -treated samples (Figure 19). In the sample heat treated at 100 °C, the P3-precipitates were located at the boundaries between grains and had a size of 20–50 nm. In the sample heat treated at 125 °C, those phases grew in size up to 100 nm. Additionally, ultrafine P4 precipitates (Figure 19) with a size less than 10 nm and up to 50 nm appeared. They were oriented normal to <0001> direction, but further verifications are required. These oriented platelets were not observed in the other two conditions.

3.8. Determination of SPD-Induced Defect Densities by DSC and XPA

With differential scanning calorimetry (DSC), one can distinguish between lattice defects through selected annealing. Defects always show exothermal peaks, while the endotherm ones indicate phase transformations. Defects with low migration enthalpy Q exhibit their annealing peaks at low temperatures while those with high Q are reflected by peaks at higher temperatures. For the case of defects produced by plastic deformation, it is well established [29,30] that for SPD-processed pure metals, up to three annealing peaks emerge which are dominated by the annealing of (i) single and/or double vacancies at approximately T = 0.2 Tm (Tm is the melting temperature in K) in the first peak, of (ii) vacancy agglomerates at about T = 0.3 Tm in the second peak and (iii) of dislocations around T = 0.3–0.4 Tm in the third peak, depending on the stress intensity of their arrangement [29]. These peaks can be shifted by up to 100 K to higher temperatures in alloyed metals because of trapping of defects by the alloying atoms.
As a representative for the DSC scans of all Mg alloys investigated, Figure 20 reveals the results for HPT-processed Mg5Zn0.3Ca. Only two peaks emerged in the DSC scans, a peak I between 100–200 °C (T = 0.4–0.5 Tm), and a peak II around 300–370 °C (T = 0.6–0.7 Tm). Comparisons with the results mentioned for SPD-processed materials, and especially with those from quenched Mg-alloys only exhibiting vacancy-type peaks [32,33], suggest that peak I indicates the annealing of single and double vacancies, while peak II results from an overlap of the second and third peak indicating the annealing of both vacancy agglomerates and dislocations at very similar temperatures.
For further identification of deformation-induced defects, their migration enthalpies Q (Figure 21) were evaluated by measuring the shift of annealing peak temperatures with different DSC heating rates (Kissinger analysis [38]). Results for activation enthalpies of peak I and peak II were 0.7–1.3 ± 0.1 eV and 1.3–3.8 ± 0.3 eV, respectively, for all alloys Mg5Zn0.3Ca, Mg5Zn, Mg5Zn0.15Ca and Mg5Zn0.15Ca0.15Zr. While peak I remains approximately constant with increasing HPT strain, peak II occasionally does not; for further interpretations, see the discussion section.
Following the procedure described in papers [30], combined DSC and XPA measurements were done in order to find out the concentrations of vacancies/vacancy agglomerates. The temperature ranges of the two DSC peaks I and II were further investigated by XPA. With constant crystallite size, the broadening of Bragg peak line profiles yields dislocation densities (N) which allow one—by means of Equation (2)—to estimate the energy which is stored in those dislocations (and their arrangements) solely (Edisl). The procedure is to subtract Edisl from the total stored energy Etot of peak I (or peak II, respecticely) in order to obtain Evac, the energy which is to be attributed to the vacancies/vacancy agglomerates. Evac yields the vacancy concentration cv by applying Equation (3). For all the furnace-cooled and HPT-processed alloys investigated, Table 6 (for peak I) and Table 7 (for peak II) list all these values in sequence.

3.9. Corrosion Tests

The results of corrosion tests are presented in Figure 22. The corrosion rate is plotted as a function of immersion time. It can be seen that the renewal of SBF after 7 and 14 days which removes corrosion products from the liquid and adjust the pH value back to 7.35 resulted in the boosts of hydrogen gas evolution and increases of corrosion rates.
It can be concluded from Figure 22 when comparing the curves of the as-cast with those of the IS samples that solid solution treatment decreases the corrosion rate in all the investigated alloys. The difference is least pronounced in the binary Mg-Ca alloy.
HPT-processing increased the corrosion rate of Mg5Zn slightly, while it had no detectable influence on corrosion rate in the case of Mg0.3Ca. In the case of Mg5Zn0.3Ca, HPT resulted in an increased corrosion rate in the first week and a decreased one in the third week.
The heat treatments carried out after solid solution treatment or after HPT-processing have no significant influence on the corrosion rates of Mg0.3Ca and Mg5Zn. In case of the ternary alloy Mg5Zn0.3Ca, the heat treatment after HPT leads to a decrease in the corrosion rate while the same heat treatment in the initial state leads to an increase in the corrosion rate.
The difference between the three alloys is largest in the IS as most of the primary precipitates become dissolved in this condition. It shows that the corrosion rate of Mg5Zn0.3Ca is highest especially in the first week of immersion. Mg5Zn alloy shows the lowest total hydrogen evolution and is less sensitive to the change of SBF. However, microscope images in [47] show that in the case of both Zn containing samples some parts are already missing after three weeks, while the Mg0.3Ca alloy shows a rather homogenous corrosion behavior.
The general appearance of the corrosion behavior is rather independent of the material treatment, meaning that Mg0.3Ca always shows a rather homogenous corrosion behavior and a thick surface layer of degradation products while Mg5Zn shows localized corrosion, and parts of the samples are missing after three weeks. Mg5Zn0.3Ca exhibits a strong surface roughness and some parts of the samples also completely dissolve. The amount of completely dissolved parts in both Zn-containing agrees well with the overall corrosion rates determined by the hydrogen evolution method (Figure 22).

4. Discussion

4.1. The Effect of Solid-Solution Treatment

The initial homogenization treatment of as-cast materials had the intention to re-solutionize primary precipitates, in all the materials considered in this study. Therefore, a homogenization treatment at 450 °C for 24 h was applied for Ca-containing alloys. An exception was made for Mg5Zn, for which a temperature of 350 °C for 12 h was chosen in order to avoid melting. Lower annealing times and temperatures did not remove the primary precipitates, and increasing the annealing time beyond 24 h did not change their density.
In order to stabilize at RT this well-homogenized state and to obtain supersaturated solid-solution condition (which is called the initial state (IS) in the forthcoming text), two types of cooling were used and investigated: furnace-cooling and quenching in ice water. The microhardness values of furnace-cooled alloys Mg5Zn0.3Ca, Mg5Zn, Mg5Zn0.15Ca and Mg5Zn0.15Ca0.15Zr were noticeably lower than those of as-cast samples (Table 3); the microhardness values of the quenched samples, however, were slightly higher.
Our explanation of the latter effect is as follows: As intended, the higher-temperature heating of the materials led to the dissolution of primary precipitates and annihilation of dislocations along with the reduction of the total area of grain boundaries. Nevertheless, the concentration of thermal vacancies was high at the high temperatures. Quenching froze the vacancies, and the higher the cooling rate, the higher was the number of quenched-in vacancies. However, in contrast to the mono-vacancies, di- and multi-vacancies and/or vacancy agglomerates form barriers to the dislocation motion, leading to the so-called quench-hardening [53]. The actually measured rise in microhardness after quenching in comparison with the as-cast state can be thus attributed to the quench-hardening effect.
In contrast, furnace-cooling leads to a decrease in hardness as a result of annealing of thermal vacancies during slow cooling. At the same time, grains start to coarsen and dislocations leave the lattice, both leading to the softening of materials.
SEM images (Figure 6) show that for the alloys Mg5Zn0.15Ca0.15Zr, Mg5Zn0.15Ca and Mg0.3Ca, no significant difference between the IS (furnace-cooled) and IS (quenched) exist in terms of primary precipitates. However, for Mg5Zn0.3Ca, it was not possible to completely dissolve Ca in the Mg matrix. Here, furnace-cooling was more effective than quenching for approaching the solid solution supersaturated state, and fewer residual primary precipitates were found.
However, the negative effect of furnace-cooling is reflected in the possible formation of various complex phases, which may not occur in the quenched samples. The nature and the composition of such phases may affect the microstructure and therefore the properties of the alloy. The densities of these precipitates may be difficult to measure, and the determination of parameters that control the formation of certain phases and/or types of precipitates, is not straight-forward [54].

4.2. The Effect of High-Pressure-Torsion

HPT-processing of a material results in significant increases of densities of dislocations, vacancies and agglomerates during or after HPT-processing. As the dislocations partially arrange into grain boundaries, a decrease in grain size causing an increase in strength and/or hardness takes place.
With HPT, a material workpiece can be exposed to very large torsional strains under hydrostatic pressures up to 10 GPa [55,56]. The large hydrostatic pressure suppresses the annihilation of lattice defects and thus provides grain refinements down to several nanometers and even until an amorphous state. Grain sizes in Mg and other alloys HPT-processed at room temperature can reach around 100 nm [57,58,59,60,61,62].
As already mentioned, during HPT-deformation of the investigated alloys to 0.5 rotation (γT~20) (Figure 11) at room temperature, microhardness increased by up to 130% compared to the furnace-cooled IS, while the increase reached only 80% compared to the quenched IS. When deforming the samples for two rotations and more (γT = 20–100), microhardness increased further, up to 190% for the furnace-cooled, and up to 100 % for the quenched samples. Again, the samples in the IS (furnace-cooled) showed slightly larger hardness at γT > 20 than the samples in the IS (quenched). This effect may be explained by the fact that in the furnace-cooled samples—in contrast to the quenched ones—some precipitates may exist before HPT, which stimulates the formation of deformation-induced defects, contributing to hardening. Nevertheless, after HPT-processing, both the conditions—furnace-cooled and quenched—reached almost the same hardness level.

4.3. The Effect of Post-HPT Heat Treatments on Strength

The most interesting observation in this work has been the additional substantial strength increase due to a heat treatment, after HPT-processing at RT. Such an effect has been already reported by Horky et al. [33] and Ojdanic et al. [34]. When thermally treating the samples for 1 h (Figure 8), a significant hardness peak was observed for all the furnace-cooled and quenched Mg5Zn0.3Ca and Mg5Zn samples at a temperature of around 100 °C (corresponding to T = 0.4 Tm); only Mg0.3Ca showed a peak at 75 °C. This effect may be attributed to the fact that only in the latter alloy Zn was missing.
In further experiments the peak temperature of 100 °C was set constant, and the annealing time was extended beyond 1 h (Figure 9), which revealed that hardness slightly increases up to 24 h and then decreases. Further heat treatments with the same annealing times of 24 h were done for all alloys for other annealing temperatures too (Figure 10). Again, like in case of only 1 h annealing, the significant hardness peak was found for the annealing treatment at 100 °C.
To sum up, heat treatments at T = 100 °C can increase the hardness of the HPT-processed samples by ~30% (for Mg5Zn0.3Ca and Mg5Zn) and even up to 75% for Mg0.3Ca. The alloys Mg5Zn0.15Ca and Mg5Zn0.15Ca0.15Zr show no response to the heat treatments. For the non-processed samples, hardness increases of up to 50% can be reached, starting from a much lower initial hardness level than in case of all the HPT-processed samples, however.

4.4. The Effect of Precipitates on Strength

In principle, the possible increase of yield strength during heat treatment consists of grain boundary strengthening, vacancy hardening and precipitation hardening, and can be written in a first approximation as
Δ σ t o t a l = Δ σ g r a i n s + Δ σ v a c a n c i e s + Δ σ p r e c i p i t a t e s
As the grain size was observed to stay constant during the heat treatments considered in this work (maximum 125 °C), changes of Δ σ t o t a l could only arise from Δ σ p r e c i p i t a t e s and/or from Δ σ v a c a n c i e s . For the estimation of contribution from precipitation hardening Δ σ p r e c i p i t a t e s in Equation (5), we assume that all precipitates are non-shearable and are spherical. By use of a modified Orowan Equation (6) [63], i.e.,
Δ σ p r e c i p i t a t e s = M 0.84 G b 2 π ( 1 ν ) 1 / 2 l ln r 2 b
the increase in yield strength Δ σ p r e c i p i t a t e s can be estimated. In Equation (6), M means the Taylor factor (M = 4.2 for random texture Mg [64]), G the shear modulus (G = 17 GPa), b the Burgers vector (b = 0.32 nm), ν the Poisson’s ratio (ν = 0.33), l the average interparticle spacing and r the average radius; for the following estimation, the values for l and r were taken from STEM images shown in Figure 16b (status after HPT + heat treatment) and Figure 16a (status after HPT only). The estimation leads to a difference of the yield strength due to precipitation hardening of ΔσHPT + HT − ΔσHPT = 115 − 92 = 23 MPa between the two conditions investigated for the furnace-cooled Mg5Zn0.3Ca samples. The measured difference, however, was 140 MPa; therefore, the result of these calculations is that the difference in the precipitation states cannot explain the extensive increase of the yield strength measured. The precipitates only contribute about 16% to the total increase in yield strength.

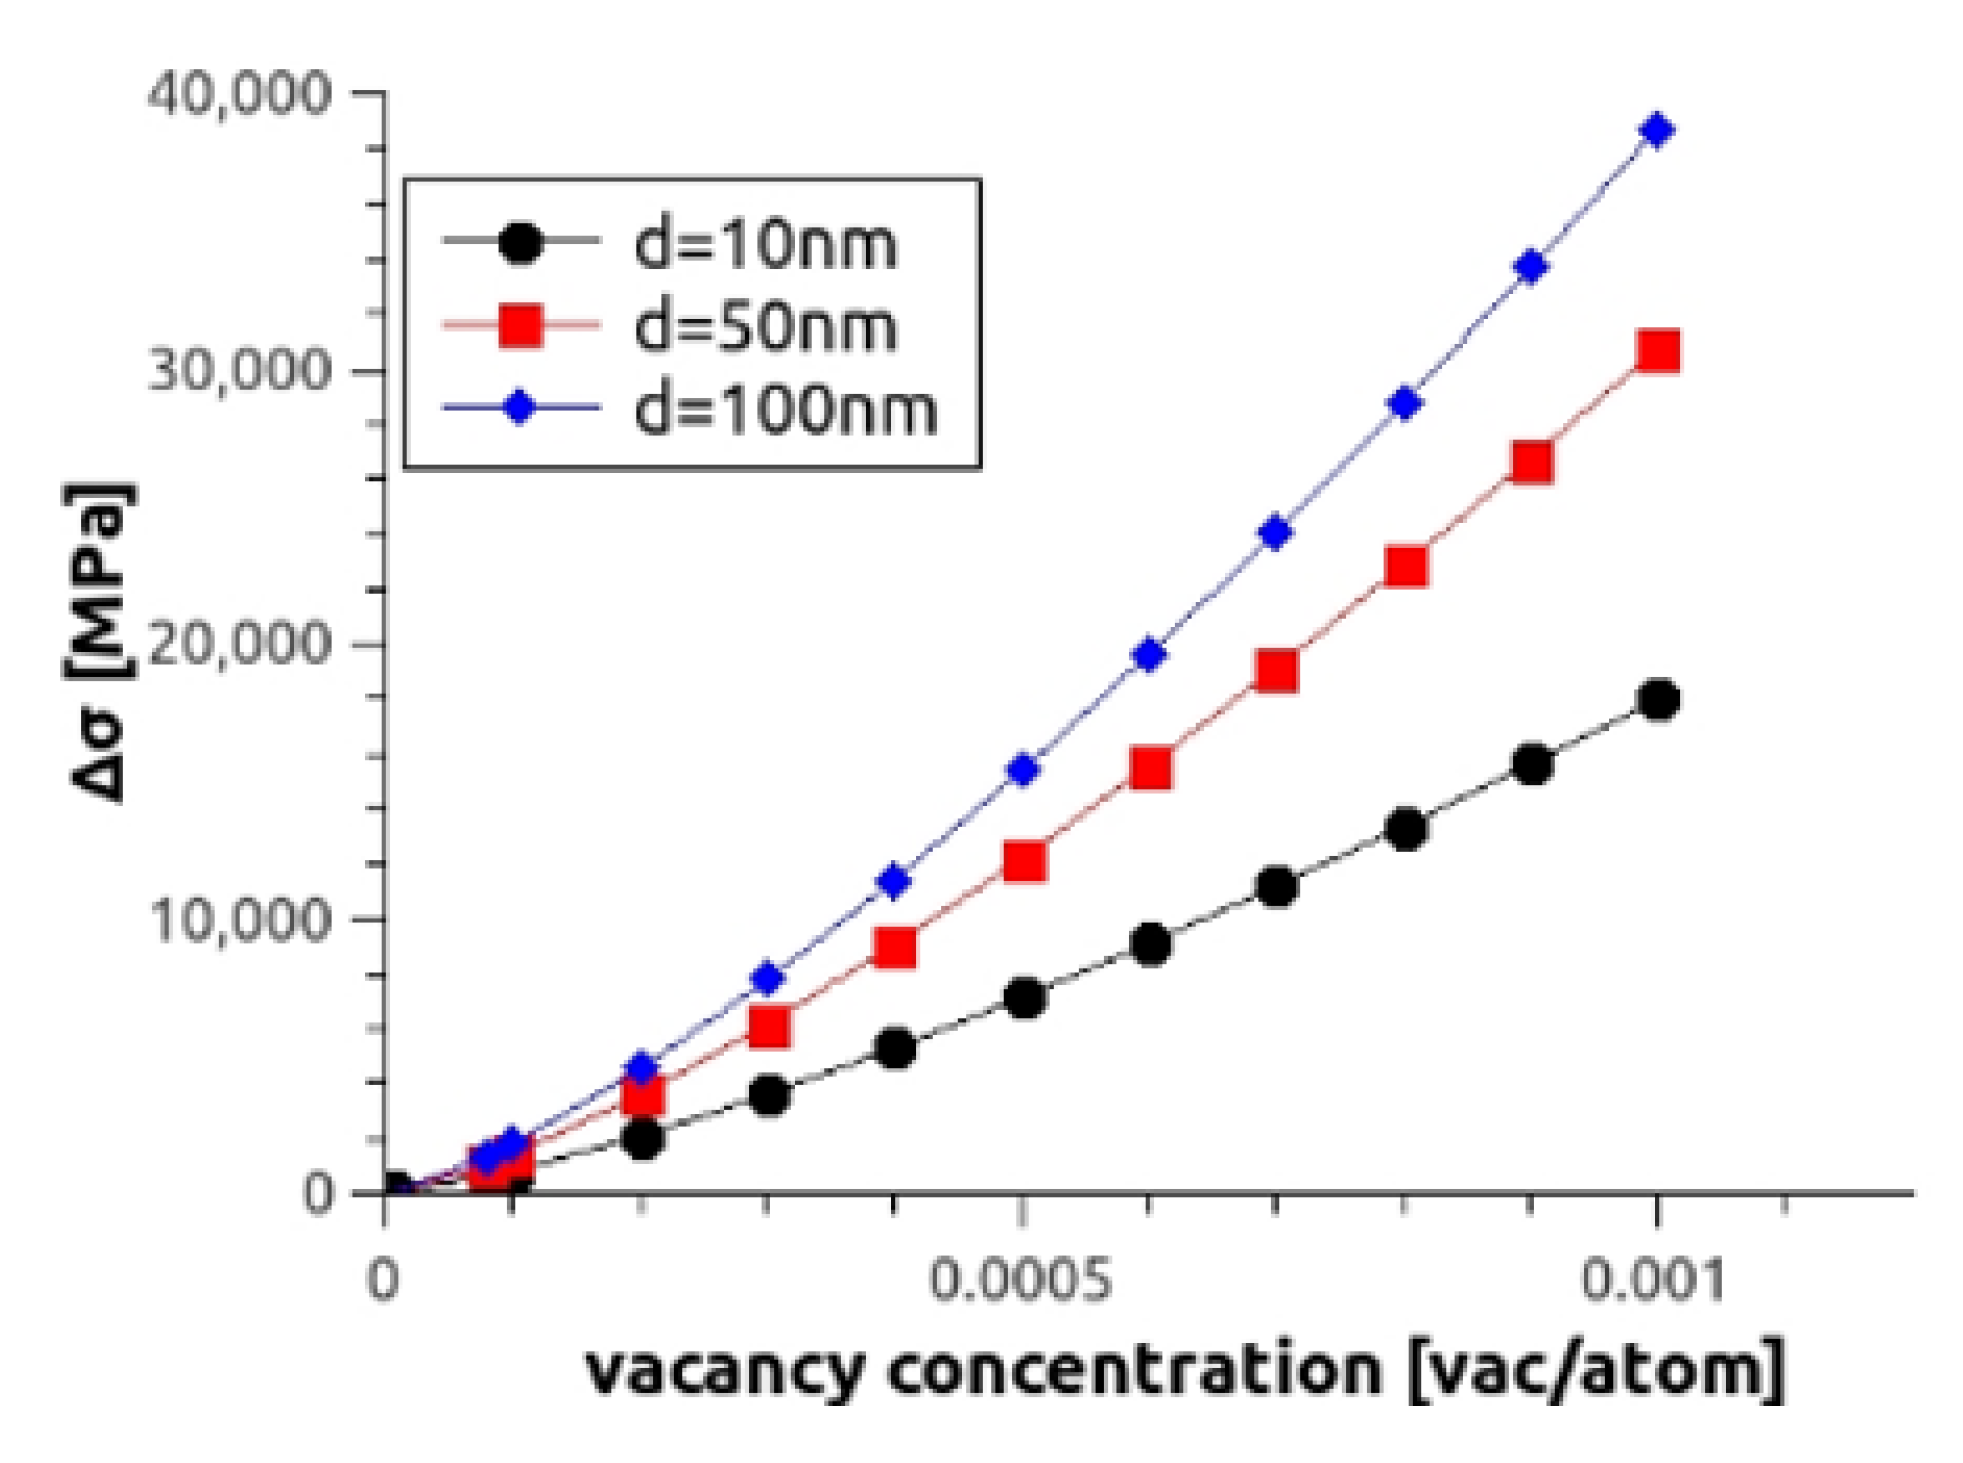
4.5. The Effect of Vacancy Agglomerates on Strength

During HPT-processing, vacancies and dislocations are introduced to the sample’s lattice. With increasing temperature during heat treatments, the vacancies form agglomerates [65]. Disc-shaped agglomerates form on the close-packed basal planes of the hexagonal Mg lattice [66]. The disc collapses if it is large enough and produces a prismatic dislocation loop. The Burgers vector of such a loop is perpendicular to the plane of the loop, and the loop is therefore immobile. The formed loops are exclusively located on the preferred slip planes of Mg and are therefore strong obstacles for the movement of other dislocations.
Examples of hardening due to the agglomeration of deformation-induced vacancies have already been given some years ago for single and polycrystals of hcp materials for moderate deformation strains [67], and recently even for fcc materials [68,69]. With the latter, the increases in microhardness and yield strength were between 5% and 10% and thereby considerably lower than those observed in this and the recent study of Horky et al. [33]. This may be attributed to the hexagonal lattice of Mg, which makes loop hardening particularly effective because of the coincidence of the loop planes with the preferred dislocation slip plane.
HPT-processed samples provide a significantly higher number of vacancies than non-processed samples in the IS; therefore, the hardness increase during heat treatments is much higher for these samples than for the non-processed ones. The slight hardness increase of the samples in IS is mainly caused by the comparably low number of precipitates (Figure 8) [34].
One interesting fact is that Mg0.3Ca also shows a hardness increase during heat treatments. The peak temperature is around 75 °C and it represents a thermally-induced strength increase of 74% for the HPT-processed sample, which is significantly higher than those measured for Mg5Zn0.3Ca and Mg5Zn. For the other samples, heat treatments contributed ~30% to the increase of hardness. Precipitates probably form in the Mg0.3Ca alloy during heat treatments, but further TEM analyses need to be done.
Previous assumptions were that Zn atoms act as trapping sites for vacancies, but the experimental data on Mg0.3Ca show that Zn alone cannot be responsible for the hardness increase due to trapping-induced vacancy agglomeration. Samples with Ca content of 0.15% (Figure 10) showed almost no increase in hardness during heat treatments when furnace-cooled. In this case the vacancies, induced by HPT deformation, may have stayed single and did not agglomerate, even though there was a Zn content of 5%; this is indicated by the vacancy concentrations cv for the DSC peaks I and II shown in Table 6 and Table 7, respectively. Obviously, the presence of Ca favors the formation of vacancy agglomerates.
As already reported in the previous Section 3, DSC and XPA measurements of furnace-cooled/HPT-processed/heat-treated samples show very large concentrations of vacancies up to ~10−3; (Table 6 and Table 7). These start to migrate/agglomerate/anneal at the very temperature (70–100 °C) where the largest values of microhardness appear. The present Kissinger analyses confirm this conclusion as they exhibit an enthalpy between Q(I) = 0.7–1.3 eV, which agrees well with literature values of vacancy migration enthalpies for Mg and Mg alloys, being 0.8–1 eV [37].
Moreover, it is well known from literature [30,68] that temperatures of peaks representing the annealing of single or double vacancies do not shift with the deformation degree applied. In contrast to that, the peak of dislocation annealing has been often found to shift to lower annealing temperatures the higher the deformation is. This effect can be understood as stress-assisted annihilation of dislocations because of their increasing stress field intensity due to increasing dislocation density at growing plastic deformation (see, e.g., [70]). In the present cases, variations of Q(II) were indeed found (Figure 23a,c) although occasionally at higher annealing temperatures as well. From this point of view, it is not surprising that the span of measured Q(II) = 1.3–3.8 ± 0.3 eV for dislocation annealing was much larger than that for vacancy annealing, Q(I). To substantiate these findings, a comparison with the dependence of annealing peak temperature on the applied deformation strain is helpful, as those values are known to be more accurate than those of activation enthalpies. Here, no such variations could be observed (Figure 23b,d), indicating that there may have been defects other than dislocations, too. When considering the evaluation of defect densities in this peak, vacancy concentrations of the order 10−4 could still be found, representing a substantial proportion of defects found in this peak II [30].
A theoretical description of vacancy loop hardening (increase in yield strength ∆σloops) of hexagonal metals is given by Kirchner [71]:
Δ σ l o o p s = G b k N a d 3 a 1
with N being the loop density (number of loops/m3); d the average loop diameter; and a and k constants that depend on the ratio of loop distance (λ = N−1/3) to diameter d. G and b represent the shear modulus and the Burgers vector, respectively. For a ratio λ/d > 10, the constants amount to a = 1/2 and k = 0.122; otherwise, a = 4/3 and k = 0.001. According to Equation (7), the strengthening potential of loops is higher if the loop density is larger.
Although we do not know the number and the size of the loops in our HPT-processed and heat-treated samples, we can estimate the amount of loop hardening via Kirchner’s equation (Equation (7)) by inserting the previously determined values for the vacancy concentration of HPT-processed materials and by an assumption for d. The number of vacancies per loop ( v a c l o o p ) and the loop density N   when assuming circular loops are given by
v a c l o o p = d 2 π 4 b 2
N = c V v a c l o o p
where cv is the concentration of vacancies assuming that all of them form loops. For simulations of the yield strength using Equation (7), the determined vacancy concentrations (Table 6 and Table 7) were used for each alloy, and average loop diameters of 10–100 nm were assumed. Figure 24 shows the calculated dependence of theoretical yield strength on measured vacancy concentration for all alloys, samples in the IS (furnace-cooled) and HPT-processed at room temperature.
The theoretical model predicts tremendously high increases in yield strength of up to 98 GPa (at cv = 2 × 10⁻³ being the highest measured vacancy concentration), for the furnace-cooled materials Mg5Zn0.3Ca and Mg5Zn0.15Ca. The lowest increase was found for the Mg0.3Ca alloy with around 16 GPa. Mg5Zn0.15Ca0.15Zr and Mg5Zn showed increases of around 39 GPa.
From a first perspective, those strength increases predicted by the model are far higher than the experimentally measured ones: On the Mg5Zn0.3Ca alloy processed by HPT at low temperatures, one can conclude that from the experimentally determined thermally-induced increase of yield strength of 115 MPa, around 23 MPa were caused by precipitates. This means that about 92 MPa represents hardening from vacancy agglomerates.
Further simulations of strength increases due to loop hardening along Kirchner’s model were done assuming fixed loop diameters at various fixed vacancy concentrations (Figure 25). The shaded area represents the field which spans all strength increases measured by tensile tests after HPT and heat treatment, for all materials investigated. The lines and full points represent fixed values of vacancy concentrations (lines) and fixed values of loop diameters (points). In addition to the estimations reported above, it is here even more evident that vacancy concentrations of the order of 10⁵ at maximum lead to the increased values of tensile strength measured. It means that the vacancy concentrations 10−3 measured by DSC and XPA are far too high to account for these strength increases. Obviously, a major part of the vacancies does not contribute to hardening as they were not part of agglomeration and still stay single.

4.6. The Effects of Processing Routes on Corrosion Behavior

Comparing now the corrosion properties of all alloys with all their microstructures, including HPT and thermal treatments at 100 °C, it turned out that none of the treatments that produced vacancies/vacancy agglomerates, dislocations and grain boundaries, had a significant impact on corrosion properties. Even a 24 h heat treatment following the HPT-processing did not change the corrosion rate or led to its increase. It can be concluded that the corrosion rate is much more affected by the composition of the alloy. As a side result, even the implementation of IS state out of the as-cast state decreased the corrosion rates of all materials studied here. It is expected that the dissolution of primary precipitates decreases the corrosion rate by reducing micro-galvanic corrosion effects.

4.7. The Effects of Processing Routes on the Evolutions of Texture and Young’s Modulus

In general, the microindentation measurements of Young’s modulus E showed moderate changes of E between the IS and all further treatments, being 18 GPa between all materials, and 14 GPa at maximum within the same material. Apart from a general positive offset of the simulated data compared to the measured ones because of an upper-limit calculation, the majority of simulations followed the measured values of E, at least in all cases of HPT-deformation: E slightly increased with increasing torsional strain γT, which increased the intensity of shear texture; the latter (and accordingly also E) reached saturation at highest γT where steady state deformation sets in. Thermal treatment, however, should not affect the texture and/or E as long as only recovery processes occur. On the other hand, recrystallization processes must be involved when E changes during thermal treatment, and when this change is also reflected in the simulation, like in the cases of (IS and heat-treated) samples shown in Figure 15. When the simulation does not follow the measured change of E during thermal treatment (e.g., as seen during long-time thermal treatment of HPT 0.5 rot sample) we must suppose the thermally-induced formation of a new phase which is perhaps not registered by XRD due to its small volume fraction. At this point, we conclude the discussion because, as already mentioned, the measured variations in E did not exceed 50 GPa which is still close to that of bone (E = 10–30 GPa) [72]; thus the requirements to avoid the stress-shielding effect [1] in implant applications were still fulfilled.

4.8. Tensile tests

When comparing the stress–strain curves of the alloys in the IS (furnace-cooled)/low-temperature HPT-processing for 0.5 rotations (Figure 13), it can be seen that ductility was markedly reduced in all the HPT-processed samples. After two or more rotations, the material became very brittle, as the failure occurred right after the elastic limit. After additional heat treatment, the samples remained very brittle. Since thermal treatments primarily launched the formation of vacancy agglomerates, it is evident that those were responsible for this brittleness observed.
The values of ultimate tensile strength (UTS) derived from the tensile tests suggest comparing them with the Vickers microhardness values (HV) as, according to literature [70,73], the UTS can be related to HV as
H V = m × U T S
with m as the so-called “Tabor factor.” For continuum materials or at least highly isotropic ones, m = 3, as the result of the theory of stress distribution of a force on a semi-infinite body [73]. Inserting now our measured data for UTS and HV, m turns out to be m = 4.2 with a relatively small standard deviation of ± 0.5 confirming the validity of (11). The strong deviation to the continuum value m = 3 can be explained by the fact that Mg alloys are typical examples of highly anisotropic materials. Therefore, another constant value m of Equation (10) is expected at least unless the materials exhibit strong textures [74].

5. Summary and Conclusions

The present study showed methods for the optimization of various MgZnCa alloys concerning their strength and corrosion properties. Several Mg alloys (Mg5Zn0.3Ca, Mg5Zn0.15Ca, Mg5Zn0.15Ca0.15Zr) have been investigated with respect to Vickers hardness, Young’s modulus, ductility and corrosion properties, and the results were compared to investigations of two binary alloys, Mg5Zn and Mg0.3Ca. The combined application of severe plastic deformation by HPT and heat treatments at low temperatures provided the production of both special intermetallic precipitates and vacancy agglomerates and thus tremendous increases of the alloy’s strength. Investigations were done using electron microscopes, microhardness and nanoindentation testing, a microtensile testing facility, XRD and DSC.
Homogenization of all materials was followed by furnace cooling; the fraction of primary precipitates could be reduced to below 1%, their size being close to 1 nm. The main results of our investigations are the following:
(1)
Microhardness increases of up to 250% after furnace cooling, further processing by HPT and/or heat treatment could be reached.
(2)
After those treatments, SEM and STEM investigations revealed complex precipitates, which contribute only ~16% to the hardness increase; this is the result of estimations applying the Orowan equation for precipitation hardening.
(3)
Trying for the first time quantitative analyses of HPT-induced defects, DSC and XPA measurements were undertaken which showed very large concentrations of vacancies (up to ~10−3;) in the furnace-cooled/HPT-processed/heat-treated samples. These started to migrate/agglomerate/anneal at the very temperature (70–100 °C) at which the largest microhardness appeared. Kissinger analyses confirmed that conclusion, as they exhibit a vacancy migration enthalpy between Q = 0.7–1.3 eV which agrees well with literature values for Mg and Mg alloys.
(4)
Theoretical calculations using Kirchner’s model indicated that about 1% of the HPT-induced vacancies formed vacancy agglomerates which could account for the significant thermally-induced hardness increases.
(5)
Tensile tests showed that the samples were rather brittle due to the high number of vacancies after HPT deformation and heat treatment. Elongations did not exceed 5%.
(6)
The Young’s modulus varied slightly during the processing history because of deformation, thermal treatment and second phase formation due to the evolutions of deformation textures and precipitates, but still remained too small to cause stress shielding; its maximum increase with regard to the homogenized state amounted to 15%.
(7)
Corrosion tests showed that neither the formation of vacancy agglomerates, dislocations and grain boundaries nor that of precipitates has a significant effect on corrosion rate. Mainly, the composition of biomedical binary or ternary Mg-alloys controls the corrosion rate.

Author Contributions

Conceptualization, M.V.; formal analysis, A.O.; investigation, A.O., J.H., M.F. and B.S.; data curation, A.O., J.H., M.J.Z., E.S., D.O. and M.F.; writing—original draft preparation, A.O.; writing—review and editing, M.J.Z., D.O., J.H., B.M. and M.F.; supervision, E.S., M.J.Z. and D.O.; project administration, D.O., M.J.Z., M.V. and S.G.; funding acquisition, D.O., M.J.Z., M.V. and S.G. All authors have read and agreed to the published version of the manuscript.

Funding

This research was funded by the Austrian Science Fund FWF (Fonds zur Förderung der Wissenschaftlichen Forschung Österreich), grant number I2815-N36, and the Slovenian Research Agency (Agencija Raziskovalno Republike Slovenije ARRS), grant number J2-7157.

Acknowledgments

The authors gratefully appreciate financial support from the projects J2-7157 and research program P2-0412 of the Slovenian Research Agency ARRS, and I2815-N36 of the Austrian Science Fund FWF. B.S., A.O. and M.Z. thank the Austrian and Slovenian Exchange Services for mutual visits within projects PL 14/2017 and PL 14/2019.

Conflicts of Interest

The authors declare no conflict of interest.

References

  1. Ridzwan, M.I.Z.; Shuib, S.; Hassan, A.Y.; Shokri, A.A.; Ibrahim, M.M. Problem of stress shielding and improvement to the hip implant designs: A review. J. Med. Sci. 2007, 7, 460–467. [Google Scholar]
  2. Atrens, A.; Liu, M.; Zainal Abidin, N.I. Corrosion mechanism applicable to biodegradable magnesium implants. Mater. Sci. Eng. B 2011, 176, 1609–1636. [Google Scholar] [CrossRef]
  3. Mordike, B.L.; Ebert, T. Magnesium. Mater. Sci. Eng. A 2001, 302, 37–45. [Google Scholar] [CrossRef]
  4. Agnew, S.R.; Nie, J.F. Preface to the viewpoint set on: The current state of magnesium alloy science and technology. Scr. Mater. 2010, 63, 671–673. [Google Scholar] [CrossRef]
  5. Mima, G.; Tanaka, Y. Main factors affecting the aging of magnesium-zinc alloys. Trans. JIM 1971, 12, 76–81. [Google Scholar] [CrossRef] [Green Version]
  6. Mima, G.; Tanaka, Y. Aging characteristics of magnesium-4 wt percent zinc alloy. Trans. JIM 1971, 12, 71–75. [Google Scholar] [CrossRef] [Green Version]
  7. Clark, J.B. Transmission electron microscopy study of age hardening in a Mg-5 wt.% Zn alloy. Acta Metall. 1965, 13, 1281–1289. [Google Scholar] [CrossRef]
  8. Orlov, D.; Pelliccia, D.; Fang, X.; Bourgeois, L.; Kirby, N.; Nikulin, A.Y.; Ameyama, K.; Estrin, Y. Particle evolution in Mg–Zn–Zr alloy processed by integrated extrusion and equal channel angular pressing: Evaluation by electron microscopy and synchrotron small-angle X-ray scattering. Acta Mater. 2014, 72, 110–124. [Google Scholar] [CrossRef]
  9. Hofstetter, J.; Becker, M.; Martinelli, E.; Weinberg, A.M.; Mingler, B.; Kilian, H.; Pogatscher, S.; Uggowitzer, P.J.; Löffler, J.F. High-Strength Low-Alloy (HSLA) Mg–Zn–Ca alloys with excellent biodegradation performance. JOM 2014, 66, 566–572. [Google Scholar] [CrossRef]
  10. Panigrahi, A.; Sulkowski, B.; Waitz, T.; Ozaltin, K.; Chrominski, W.; Pukenas, A.; Horky, J.; Lewandowska, M.; Skrotzki, W.; Zehetbauer, M. Mechanical properties, structural and texture evolution of biocompatible Ti-45Nb alloy processed by severe plastic deformation. J. Mech. Behav. Biomed. Mater. 2016, 62, 93–105. [Google Scholar] [CrossRef] [PubMed]
  11. Agnew, S.R.; Duygulu, O. A mechanistic understanding of the formability of magnesium: Examining the role of temperature on the deformation mechanisms. MSF 2003, 419, 177–188. [Google Scholar] [CrossRef]
  12. Alexander, D.J. New methods for severe plastic deformation processing. J. Mater. Eng. Perform. 2007, 16, 360–374. [Google Scholar] [CrossRef]
  13. Estrin, Y.; Vinogradov, A. Extreme grain refinement by severe plastic deformation: A wealth of challenging science. Acta Mater. 2013, 61, 782–817. [Google Scholar] [CrossRef]
  14. Valiev, R. Nanostructuring of metals by severe plastic deformation for advanced properties. Nat. Mater. 2004, 3, 511–516. [Google Scholar] [CrossRef] [PubMed]
  15. Somekawa, H.; Singh, A.; Mukai, T. Synergetic effect of grain refinement and spherical shaped precipitate dispersions in fracture toughness of a Mg-Zn-Zr Alloy. Mater. Trans. 2007, 48, 1422–1426. [Google Scholar] [CrossRef] [Green Version]
  16. Langdon, T.G. Twenty-five years of ultrafine-grained materials: Achieving exceptional properties through grain refinement. Acta Mater. 2013, 61, 7035–7059. [Google Scholar] [CrossRef]
  17. Fintová, S.; Kunz, L. Fatigue properties of magnesium alloy AZ91 processed by severe plastic deformation. J.Mech. Behav. Biomed. Mater. 2015, 42, 219–228. [Google Scholar] [CrossRef]
  18. Dumitru, F.-D.; Higuera-Cobos, O.F.; Cabrera, J.M. ZK60 alloy processed by ECAP: Microstructural, physical and mechanical characterization. Mater. Sci. Eng. A 2014, 594, 32–39. [Google Scholar] [CrossRef]
  19. Jiang, J.; Wang, Y.; Qu, J. Microstructure and mechanical properties of AZ61 alloys with large cross-sectional size fabricated by multi-pass ECAP. Mater. Sci. Eng. A 2013, 560, 473–480. [Google Scholar] [CrossRef]
  20. Yuan, Y.; Ma, A.; Jiang, J.; Lu, F.; Jian, W.; Song, D.; Zhu, Y.T. Optimizing the strength and ductility of AZ91 Mg alloy by ECAP and subsequent aging. Mater. Sci. Eng. A 2013, 588, 329–334. [Google Scholar] [CrossRef]
  21. Kulyasova, O.; Islamgaliev, R.; Mingler, B.; Zehetbauer, M. Microstructure and fatigue properties of the ultrafine-grained AM60 magnesium alloy processed by equal-channel angular pressing. Mater. Sci. Eng. A 2009, 503, 176–180. [Google Scholar] [CrossRef]
  22. Bryła, K.; Horky, J.; Krystian, M.; Lityńska-Dobrzyńska, L.; Mingler, B. Microstructure, mechanical properties, and degradation of Mg-Ag alloy after equal-channel angular pressing. Mater. Sci. Eng. C 2020, 109, 110543. [Google Scholar] [CrossRef] [PubMed]
  23. Bryła, K.; Krystian, M.; Horky, J.; Mingler, B.; Mroczka, K.; Kurtyka, P.; Lityńska-Dobrzyńska, L. Improvement of strength and ductility of an EZ magnesium alloy by applying two different ECAP concepts to processable initial states. Mater. Sci. Eng. A 2018, 737, 318–327. [Google Scholar] [CrossRef]
  24. Qiao, X.G.; Zhao, Y.W.; Gan, W.M.; Chen, Y.; Zheng, M.Y.; Wu, K.; Gao, N.; Starink, M.J. Hardening mechanism of commercially pure Mg processed by high pressure torsion at room temperature. Mater. Sci. Eng. A 2014, 619, 95–106. [Google Scholar] [CrossRef] [Green Version]
  25. Bonarski, B.J.; Schafler, E.; Mingler, B.; Skrotzki, W.; Mikulowski, B.; Zehetbauer, M.J. Texture evolution of Mg during high-pressure torsion. J. Mater. Sci. 2008, 43, 7513–7518. [Google Scholar] [CrossRef]
  26. Edalati, K.; Yamamoto, A.; Horita, Z.; Ishihara, T. High-pressure torsion of pure magnesium: Evolution of mechanical properties, microstructures and hydrogen storage capacity with equivalent strain. Scr. Mater. 2011, 64, 880–883. [Google Scholar] [CrossRef]
  27. Čížek, J.; Procházka, I.; Smola, B.; Stulíková, I.; Kužel, R.; Matěj, Z.; Cherkaska, V.; Islamgaliev, R.K.; Kulyasova, O. Microstructure and thermal stability of ultra fine grained Mg-based alloys prepared by high-pressure torsion. Mater. Sci. Eng. A 2007, 462, 121–126. [Google Scholar] [CrossRef]
  28. Čížek, J.; Procházka, I.; Smola, B.; Stulíková, I.; Očenášek, V.; Islamgaliev, R.K.; Kulyasova, O.B. The enhanced kinetics of precipitation effects in ultra fine grained mg alloys prepared by high pressure torsion. Def. Diff. Forum 2008, 273–276, 75–80. [Google Scholar] [CrossRef]
  29. Korznikova, E.; Schafler, E.; Steiner, G.; Zehetbauer, M.J. Measurements of Vacancy Type Defects in SPD Deformed Ni; Zhu, Y.T., Langdon, T.G., Horita, Z., Zehetbauer, M.J., Semiatin, S.L., Lowe, T.C., Eds.; The Minerals, Metals & Materials Society (TMS): Warrendate, PA, USA, 2006; pp. 97–102. [Google Scholar]
  30. Setman, D.; Schafler, E.; Korznikova, E.; Zehetbauer, M.J. The presence and nature of vacancy type defects in nanometals detained by severe plastic deformation. Mater. Sci. Eng. A 2008, 493, 116–122. [Google Scholar] [CrossRef]
  31. Schafler, E.; Steiner, G.; Korznikova, E.; Kerber, M.; Zehetbauer, M.J. Lattice defect investigation of ECAP-Cu by means of X-ray line profile analysis, calorimetry and electrical resistometry. Mater. Sci. Eng. A 2005, 410–411, 169–173. [Google Scholar] [CrossRef]
  32. Zehetbauer, M. Effects of non-equilibrium vacancies on strengthening. KEM 1995, 97, 287–306. [Google Scholar] [CrossRef]
  33. Horky, J.; Ghaffar, A.; Werbach, K.; Mingler, B.; Pogatscher, S.; Schäublin, R.; Setman, D.; Uggowitzer, P.J.; Löffler, J.F.; Zehetbauer, M.J. Exceptional strengthening of biodegradable Mg-Zn-Ca alloys through high pressure torsion and subsequent heat treatment. Materials 2019, 12, 2460. [Google Scholar] [CrossRef] [PubMed] [Green Version]
  34. Ojdanic, A.; Schafler, E.; Horky, J.; Orlov, D.; Zehetbauer, M. Strengthening of a biodegradable Mg–Zn–Ca alloy ZX50 after processing by HPT and heat treatment. In Magnesium Technology 2018; Orlov, D., Joshi, V., Solanki, K., Eds.; Springer International Publishing: Cham, Switzerland, 2018; pp. 277–282. ISBN 978-3-319-72332-7. [Google Scholar]
  35. Pippan, R.; Scheriau, S.; Hohenwarter, A.; Hafok, M. Advantages and limitations of HPT: A Review. MSF 2008, 584, 16–21. [Google Scholar] [CrossRef]
  36. Bever, M.B.; Holt, D.L.; Titchener, A.L. The stored energy of cold work. Prog. Mater. Sci. 1973, 17, 5–177. [Google Scholar] [CrossRef]
  37. Tzanetakis, P.; Hillairet, J.; Revel, G. The formation energy of vacancies in aluminium and magnesium. Phys. Status Solidi 1976, 75, 433–439. [Google Scholar] [CrossRef]
  38. Kissinger, H.E. Reaction kinetics in differential thermal analysis. Anal. Chem. 1957, 29, 1702–1706. [Google Scholar] [CrossRef]
  39. Ungár, T.; Tichy, G.; Gubicza, J.; Hellmig, R.J. Correlation between subgrains and coherently scattering domains. Powder Diffr. 2005, 20, 366–375. [Google Scholar] [CrossRef] [Green Version]
  40. Schafler, E.; Zehetbauer, M. Characterization of nanostructured materials by X-ray line profile analysis. Rev. Adv. Mater. Sci. 2005, 10, 28–33. [Google Scholar] [CrossRef] [Green Version]
  41. Ribárik, G.; Gubicza, J.; Ungár, T. Correlation between strength and microstructure of ball-milled Al–Mg alloys determined by X-ray diffraction. Mater. Sci. Eng. A 2004, 387–389, 343–347. [Google Scholar] [CrossRef]
  42. Convolutional Multiple Whole Profile fitting Main Page. Available online: http://csendes.elte.hu/cmwp/ (accessed on 27 March 2020).
  43. Müller, L.; Müller, F.A. Preparation of SBF with different HCO3- content and its influence on the composition of biomimetic apatites. Acta Biomater. 2006, 2, 181–189. [Google Scholar] [CrossRef]
  44. Kirkland, N.T.; Birbilis, N.; Staiger, M.P. Assessing the corrosion of biodegradable magnesium implants: A critical review of current methodologies and their limitations. Acta Biomater. 2012, 8, 925–936. [Google Scholar] [CrossRef] [PubMed]
  45. Thomas, S.; Medhekar, N.V.; Frankel, G.S.; Birbilis, N. Corrosion mechanism and hydrogen evolution on Mg. Curr. Opin. Solid State Mater. Sci. 2015, 19, 85–94. [Google Scholar] [CrossRef]
  46. Orlov, D.; Reinwalt, B.; Tayeb-Bey, I.; Wadsö, L.; Horky, J.; Ojdanic, A.; Schafler, E.; Zehetbauer, M. Advanced immersion testing of model mg-alloys for biomedical applications. In Magnesium Technology 2020; Jordon, J.B., Miller, V., Joshi, V.V., Neelameggham, N.R., Eds.; Springer Nature: Berlin/Heidelberg, Germany, 2020; pp. 235–242. ISBN 978-3-030-36646-9. [Google Scholar]
  47. Steiner Petrovič, D.; Mandrino, D.; Šarler, B.; Horky, J.; Ojdanic, A.; Zehetbauer, M.J.; Orlov, D. Surface analysis of biodegradable mg-alloys after immersion in simulated body fluid. Materials 2020, 13, 1740. [Google Scholar] [CrossRef] [Green Version]
  48. Cao, J.D.; Weber, T.; Schäublin, R.; Löffler, J.F. Equilibrium ternary intermetallic phase in the Mg–Zn–Ca system. J. Mater. Res. 2016, 31, 2147–2155. [Google Scholar] [CrossRef]
  49. Kirkland, N.T.; Birbilis, N. Magnesium Biomaterials: Design, Testing and Best Practice; Springer: Berlin/Heidelberg, Germany, 2014. [Google Scholar]
  50. Bunge, H.-J. Über die elastischen konstanten kubischer materialien mit beliebiger textur. Kristall und Technik 1968, 3, 431–438. [Google Scholar] [CrossRef]
  51. Voigt, W. Theoretische studien über die elastizitätsverhältnisse der kristalle. Abhandlungen der Königlichen Gesellschaft der Wissenschaften in Göttingen 1887, 34, 1–155. [Google Scholar]
  52. Long, T.R.; Smith, C.S. Single-crystal elastic constants of magnesium and magnesium alloys. Acta Metall. 1957, 5, 200–207. [Google Scholar] [CrossRef]
  53. Kimura, H.; Maddin, R. Quenching Hardening in Metals; American Elsevier Publishing Co., Inc.: New York, NY, USA, 1971. [Google Scholar]
  54. Sundman, B.O.; Ansara, I. The Gulliver–Scheil method for the calculation of solidification paths. In The SGTE Casebook: Thermodynamics at Work, 2nd ed.; Hack, K., Ed.; Woodhead Pub: Cambridge, UK; Boca Raton, FL, USA, 2008; pp. 343–346. ISBN 978-1-84569-215-5. [Google Scholar]
  55. Pippan, R. Bulk Nanostructured Materials; Zehetbauer, M.J., Zhu, Y.T., Eds.; Wiley-VCH: Weinheim, Germany, 2009; p. 217. [Google Scholar]
  56. Zehetbauer, M.; Grössinger, R.; Krenn, H.; Krystian, M.; Pippan, R.; Rogl, P.; Waitz, T.; Würschum, R. Bulk nanostructured functional materials by severe plastic deformation. Adv. Eng. Mater. 2010, 12, 692–700. [Google Scholar] [CrossRef]
  57. Zhilyaev, A.; Langdon, T.G. Using high-pressure torsion for metal processing: Fundamentals and applications. Prog. Mater. Sci. 2008, 53, 893–979. [Google Scholar] [CrossRef]
  58. Lee, S.; Edalati, K.; Horita, Z. Microstructures and mechanical properties of pure V and Mo processed by high-pressure torsion. Mater. Trans. 2010, 51, 1072–1079. [Google Scholar] [CrossRef] [Green Version]
  59. Lee, S.; Horita, Z.; Hirosawa, S.; Matsuda, K. Age-hardening of an Al–Li–Cu–Mg alloy (2091) processed by high-pressure torsion. Mater. Sci. Eng. A 2012, 546, 82–89. [Google Scholar] [CrossRef]
  60. Huang, Y.; Maury, N.; Zhang, N.X.; Langdon, T.G. Microstructures and mechanical properties of pure tantalum processed by high-pressure torsion. In IOP Conference Series: Materials Science and Engineering; IOP Science: Bristol, UK, 2014; Volume 63, p. 012100. [Google Scholar] [CrossRef] [Green Version]
  61. Wei, Q.; Zang, H.; Schuster, B.E.; Ramesh, K.T.; Valiev, R.Z.; Kecskes, L.J.; Dowding, R.J.; Magness, L.; Cho, K. Microstructure and mechanical properties of super-strong nanocrystalline tungsten processed by high-pressure torsion. Acta Mater. 2006, 54, 4079–4089. [Google Scholar] [CrossRef]
  62. Furuta, T.; Kuramoto, S.; Horibuchi, K.; Ohsuna, T.; Horita, Z. Ultrahigh strength of nanocrystalline iron-based alloys produced by high-pressure torsion. J. Mater. Sci. 2010, 45, 4745–4753. [Google Scholar] [CrossRef]
  63. Embury, J.D. Plastic flow in dispersion hardened materials. Metall. Mater. Trans. A 1985, 16, 2191–2200. [Google Scholar] [CrossRef]
  64. Shen, J.H.; Li, Y.L.; Wei, Q. Statistic derivation of Taylor factors for polycrystalline metals with application to pure magnesium. Mater. Sci. Eng. A 2013, 582, 270–275. [Google Scholar] [CrossRef]
  65. Hull, D.; Bacon, D.J. Introduction to Dislocations; Butterworth-Heinemann: Oxford, UK, 2001. [Google Scholar]
  66. Hampshire, J.M.; Hardie, D. Hardening of pure magnesium by lattice defects. Acta Metall. 1974, 22, 657–663. [Google Scholar] [CrossRef]
  67. Zehetbauer, M.; Seumer, V. Cold work hardening in stages IV and V of F.C.C. metals—I. Experiments and interpretation. Acta Metall. Mater. 1993, 41, 577–588. [Google Scholar] [CrossRef]
  68. Cengeri, P.; Kerber, M.B.; Schafler, E.; Zehetbauer, M.J.; Setman, D. Strengthening during heat treatment of HPT processed copper and nickel. Mater. Sci. Eng. A 2019, 742, 124–131. [Google Scholar] [CrossRef]
  69. Su, L.H.; Lu, C.; Tieu, A.K.; He, L.Z.; Zhang, Y.; Wexler, D. Vacancy-assisted hardening in nanostructured metals. Mater. Lett. 2011, 65, 514–516. [Google Scholar] [CrossRef]
  70. Zhang, P.; Li, S.X.; Zhang, Z.F. General relationship between strength and hardness. Mater. Sci. Eng. A 2011, 529, 62–73. [Google Scholar] [CrossRef]
  71. Kirchner, H. Loop hardening of hexagonal metals. Z. Met. 1976, 67, 525–532. [Google Scholar]
  72. Radha, R.; Sreekanth, D. Insight of magnesium alloys and composites for orthopedic implant applications—A review. J. Magnes. Alloys 2017, 5, 286–312. [Google Scholar] [CrossRef]
  73. Tabor, D. The Hardness of Metals; Oxford University Press: Oxford, UK, 2000. [Google Scholar]
  74. Khodabakhshi, F.; Haghshenas, M.; Eskandari, H.; Koohbor, B. Hardness−strength relationships in fine and ultra-fine grained metals processed through constrained groove pressing. Mater. Sci. Eng. A 2015, 636, 331–339. [Google Scholar] [CrossRef]
Figure 1. An image of an indentation taken with a CCD camera, with d1 and d2 as the measured diagonals of the indentation. They amount to approximately 25 µm.
Metals 10 01064 g001
Figure 2. (a) Tensile test samples punched from Mg alloys in question, (b) dimensions of a punched sample.
Metals 10 01064 g002
Figure 3. SEM image of Mg5Zn0.3Ca. EDS was carried out at well-defined points (here #6–#10) on the sample’s surface. Mainly, the primary precipitates were investigated, but so was the surrounding matrix.
Metals 10 01064 g003
Figure 4. Exemplary EDS analysis of point 7 indicated in Figure 3, for a Mg5Zn0.3Ca sample. Intensity peaks (counts/s) for different energies (eV) correspond to EDS signals from Ca, Zn, Mg, Ca, Ca, Zn, and Zn again (in sequence from left to right).
Metals 10 01064 g004
Figure 5. SEM image of the as-cast alloy Mg5Zn0.3Ca, (a) with about 100× magnification (b) with about 500× magnification.
Metals 10 01064 g005
Figure 6. SEM images of all alloys after best-condition annealing, and quenching or furnace-cooling.
Metals 10 01064 g006
Figure 7. Microhardness results for (a) Mg5Zn0.3Ca, (b) Mg5Zn, (c) Mg5Zn0.15Ca, (d) Mg5Zn0.15Ca0.15Zr and (e) Mg0.3Ca in the initial state (IS–dotted line) after furnace-cooling (FC, black) and quenching (Q, red) and additional HPT deformation at room temperature at 4 GPa, 0.5 and 2 rotations giving torsional strains up to γT~100.
Metals 10 01064 g007aMetals 10 01064 g007b
Figure 8. Microhardness after heat treatments for 1 h at various temperatures for (a) Mg5Zn0.3Ca (b) Mg5Zn (c) Mg5Zn0.5Ca (d) Mg5Zn0.15Ca0.15Zr and (e) Mg0.3Ca in the IS (furnace-cooled) (grey), at ε~5 (red) and ε~20 (black).
Metals 10 01064 g008
Figure 9. Microhardness after heat treatments at the peak temperature of 100 °C with varying annealing times up to 29 h for Mg5Zn0.3Ca (black), Mg5Zn (red) and Mg0.3Ca (blue) processed at different strains.
Metals 10 01064 g009
Figure 10. Results of microhardness measurements of Mg alloys in the IS (furnace-cooled) and after HPT-processing at 4 GPa and 0.5 rotations, and additional heat treatment for 24 h at varying temperatures. (a) Mg5Zn0.3Ca (black), Mg5Zn (red) and Mg0.3Ca (grey); and (b) Mg5Zn0.15Ca0.15Zr (red) and Mg5Zn0.15Ca (black).
Metals 10 01064 g010
Figure 11. Total microhardness increases of Mg5Zn0.3Ca and Mg5Zn in the IS (furnace-cooled and quenched) and additional HPT deformations after 4 GPa and 0.5 rotations and additional heat treatment at 100 °C for 24 h.
Metals 10 01064 g011
Figure 12. Total hardness increases of Mg5Zn0.3Ca, Mg5Zn, Mg0.3Ca, Mg5Zn0.15Ca and Mg5Zn0.15Ca0.15Zr from the IS (furnace-cooled), HPT processing at 4 GPa and 0.5 rotations; and additionally, heat treatment at the peak temperatures of 100 °C for 24 h, and 75 °C for 24 h for Mg0.3Ca.
Metals 10 01064 g012
Figure 13. Representative tensile stress–strain curves of IS, IS and heat-treated, HPT-processed (0.5 and 2 rotations) and HPT-processed and subsequently heat-treated Mg5Zn samples. Both heat treatments were done at 100 °C through 24 h.
Metals 10 01064 g013
Figure 14. Pole figures displaying crystallographic textures of Mg5Zn0.3Ca samples in the IS (furnace-cooled) and HPT-processed by 2 rotations (torsional strain γT~8) and additional heat treatment at 100 °C for 1 and 24 h.
Metals 10 01064 g014
Figure 15. Comparison of measured and simulated values of Young’s modulus data obtained from microhardness measurements and texture evaluations for Mg5Zn0.3Ca.
Metals 10 01064 g015
Figure 16. SEM (upper two rows) and STEM (bottom row) images of Mg5Zn0.3Ca samples (a) after HPT-processing; (b) after HPT and additional heat treatment at 100 °C for 24 h; and (c) after HPT and additional heat treatment at 125 °C for 24 h. HPT-processing was carried out by 0.5 rotations under 4 GPa pressure at RT.
Metals 10 01064 g016
Figure 17. STEM image of Mg5Zn0.3Ca, HPT-processed at 0.5 rotations, showing P1, P2 and thinner precipitates (blue arrows). The TEM image in the top left corner is a close-up of the P1 precipitate. Thinner precipitates are located at the grain boundaries, following their contours.
Metals 10 01064 g017
Figure 18. EDS maps of a P1 precipitate in a Mg5Zn0.3Ca sample. These precipitates contain Zn (green) and Ca (blue); Mg (red) was mainly observed in the surrounding matrix. O (pink) appeared in all sample areas; it most likely came from the atmospheric oxidation of prepared TEM foils.
Metals 10 01064 g018
Figure 19. TEM images of the HPT-processed (0.5 rot) and heat-treated Mg5Zn0.3Ca sample (a) at 100 °C for 24 h and (b) HPT processed and heat treated at 125 °C for 24 h showing P3 and P4 precipitates.
Metals 10 01064 g019
Figure 20. A typical heat flow curve as function of the temperature, for HPT-processed Mg5Zn0.3Ca (black curve—0.5 rotations, red curve—2 rotations) showing two exothermal peaks I and II. The stored energies Etotal of the HPT-induced defects were evaluated from the areas of the peaks.
Metals 10 01064 g020
Figure 21. Typical Kissinger plot referring to Equation (4) comprising the peak temperatures Tmax of peak I and peak II measured by DSC, for HPT-processed Mg5Zn0.15Ca at 4 GPa for 0.5 rotation. The full lines represent the regression to the experimental data; the activation enthalpy Q was calculated from their slopes.
Metals 10 01064 g021
Figure 22. Corrosion rates of (a) Mg0.3Ca (b) Mg5Zn and (c) Mg5Zn0.3Ca in different conditions determined by immersion testing in simulated body fluid at body temperature. The SBF was renewed all 7 days.
Metals 10 01064 g022
Figure 23. (a) Activation enthalpies Q as evaluated from DSC scans and peak temperatures Tmax measured by DSC for different HPT-processed alloys: (a,b) Mg5Zn0.15Ca (full symbols) and Mg5Zn0.15Ca0.15Zr (open symbols), and (c,d) Mg5Zn0.3Ca (full symbols) and Mg5Zn (open symbols), all alloys as a function of torsional strain γT. The red symbols represent the migration enthalpies of dislocation-type and agglomerate defects (peak II) and the black ones those of single/double vacancies (peak I). Errors are about 0.1 eV for Q, and 5 °C for Tmax.
Metals 10 01064 g023
Figure 24. Illustration of the increase of yield strength as a function of vacancy concentration for the case of Mg5Zn alloy, samples of which were in the (IS (furnace-cooled) + HPT-processed) state.
Metals 10 01064 g024
Figure 25. Increase of strength as a function of loop diameter at various vacancy concentrations. The red shaded area represents the values all measured vacancy-induced strength increases found in all materials which were investigated in this work.
Metals 10 01064 g025
Table 1. Chemical compositions of the investigated alloys.
AlloyMg (at%)Zn (at%)Ca (at%)Zr (at%)
Mg5Zn0.3Ca94.28 ± 0.035.44 ± 0.030.28 ± 0.03-
Mg5Zn94.77 ± 0.035.23 ± 0.03--
Mg0.3Ca99.73 ± 0.03-0.27 ± 0.03-
Mg5Zn0.15Ca94.90 ± 0.035.1 ± 0.030.15 ± 0.03-
Mg5Zn0.15Ca0.15Zr94.40 ± 0.035.6 ± 0.030.18 ± 0.030.18 ± 0.03
Table 2. Chemistry of the precipitates revealed by EDS.
AlloyMg (at%)Zn (at%)Ca (at%)
Mg5Zn0.3Ca65 ± 531 ± 74 ± 1
Mg5Zn76 ± 424 ± 3-
Mg0.3Ca90 ± 1-10 ± 1
Mg5Zn0.15Ca28 ± 670 ± 53 ± 1
Mg5Zn0.15Ca0.15Zr24 ± 572 ± 54 ± 1
Table 3. Microhardness results of Mg5Zn0.3Ca, Mg5Zn0.15Ca, Mg5Zn0.15Ca0.15Zr and the two alloys Mg5Zn and Mg0.3Ca in the as-cast, furnace-cooled and quenched states.
AlloyHV0.05
as-Cast
HV0.05
Furnace-Cooled
HV0.05
Quenched
Mg5Zn0.3Ca65 ± 658 ± 170 ± 2
Mg5Zn70 ± 955 ± 276 ± 4
Mg0.3Ca50 ± 347 ± 154 ± 3
Mg5Zn0.15Ca77 ± 278 ± 383 ± 5
Mg5Zn0.15Ca0.15Zr78 ± 474 ± 376 ± 3
Table 4. Average values and standard deviations of yield strength σyield, ultimate tensile strength (UTS) and total engineering strain (εtotal) of all alloys in different conditions. HPT deformation was done at 0.5 rotations (0.5) or 2 rotations (2); heat treatments (HT) were done at 100 °C for 24 h.
AlloyConditionσyield (MPa)UTS (MPa)εtotal (%)
Mg5Zn0.3CaIS70 ± 10153 ± 1015 ± 1
IS + HT95 ± 15175 ± 1914 ± 2
HPT (0.5)163 ± 36221 ± 217 ± 2
HPT (0.5) + HT303 ± 35310 ± 555 ± 1
HPT (2)55 ± 1655 ± 161 ± 0.1
HPT (2) + HT209 ± 45209 ± 454 ± 1
Mg5ZnIS90 ± 10174 ± 5717 ± 3
IS + HT155 ± 15180 ± 2817 ± 3
HPT (0.5)280 ± 10303 ± 205 ± 1
HPT (0.5) + HT310 ± 26329 ± 365 ± 1
HPT (2)280 ± 22280 ± 226 ± 1
HPT (2) + HT185 ± 51185 ± 515 ± 1
Mg0.3CaIS36 ± 2092 ± 418 ± 6
IS + HT24 ± 957 ± 1030 ± 10
HPT (0.5)210 ± 26222 ± 2810 ± 2
HPT (0.5) + HT245 ± 5250 ± 25 ± 2
HPT (2)202 ± 20206 ± 1714 ± 3
HPT (2) + HT255 ± 42258 ± 396 ± 1
Mg5Zn0.15CaIS120 ± 5339 ± 4017 ± 4
IS + HT94 ± 12180 ± 2516 ± 2
HPT (0.5)246 ± 15285 ± 197 ± 2
HPT (0.5) + HT265 ± 5268 ± 226 ± 1
HPT (2)306 ± 22306 ± 226 ± 2
HPT (2) + HT395 ± 25418 ± 255 ± 1
Mg5Zn0.15Ca0.15ZrIS165 ± 15266 ± 4915 ± 2
IS + HT180 ± 40204 ± 2717 ± 4
HPT (0.5)230 ± 10224 ± 826 ± 1
HPT (0.5) + HT280 ± 10285 ± 205 ± 1
HPT (2)303 ± 40309 ± 245 ± 1
HPT (2) + HT270 ± 10292 ± 247 ± 2
Table 5. Young’s moduli of all alloys in various conditions.
AlloyConditionE (GPa)
Mg5Zn0.3CaIS43 ± 1
IS + HT42 ± 3
HPT (0.5)44 ± 1
HPT (0.5) + HT47 ± 2
HPT (2)50 ± 5
HPT (2) + HT37 ± 3
Mg5ZnIS44 ± 4
IS + HT46 ± 3
HPT (0.5)50 ± 4
HPT (0.5) + HT46 ± 2
HPT (2)45 ± 3
Mg0.3CaIS32 ± 1
IS + HT33 ± 2
HPT (0.5)40 ± 2
HPT (0.5) + HT43 ± 1
HPT (2) + HT33 ± 4
Mg5Zn0.15CaIS44 ± 2
IS + HT35 ± 5
HPT (0.5)37 ± 3
HPT (0.5) + HT32 ± 2
HPT (2)45 ± 2
HPT (2) + HT46 ± 3
Mg5Zn0.15Ca0.15ZrIS40 ± 3
IS + HT40 ± 2
HPT (0.5)42 ± 2
HPT (0.5) + HT37 ± 2
HPT (2)44 ± 2
HPT (2) + HT45 ± 3
Table 6. Measured and calculated data for DSC peak I. ρ is the dislocation density, cv the vacancy concentration.
SampleEtotal (J/g)ρ (m−2)Edisl (J/g)Evac (J/g)cv
Mg5Zn0.3Ca9.7 ± 21.1 × 10¹⁴ ± 10130.06 ± 0.029.6 ± 22 × 103 ± 1 × 10⁻⁴
Mg5Zn5.1 ± 0.52.0 × 1014 ± 10130.10 ± 0.055.1 ± 0.51 × 10⁻³ ± 1 × 10⁻⁴
Mg5Zn0.15Ca8.2 ± 0.72.0 × 1014 ± 10130.05 ± 0.018.2 ± 0.82 × 10⁻³ ± 2 × 10⁻⁴
Mg5Zn0.15Ca0.15Zr5.4 ± 0.21.6 × 1014 ± 10130.02 ± 0.015.4 ± 0.31 × 10⁻³ ± 9 × 10⁻⁵
Mg0.3Ca1.7 ± 0.53.1 × 1014 ± 10130.05 ± 0.011.7 ± 0.55 × 10⁻⁴ ± 1 × 10⁻⁴
Table 7. Measured and calculated data for DSC peak II. ρ is the dislocation density, cv the vacancy concentration.
SampleEtotal (J/g)ρ (m−2)Edisl (J/g)Evac (J/g)cv
Mg5Zn0.3Ca3.0 ± 0.54.1 × 1014 ± 10130.2 ± 0.12.7 ± 0.38 × 10⁻⁴ ± 1 × 10⁻⁴
Mg5Zn1.5 ± 0.24.4 × 1014 ± 10130.3 ± 0.11.0 ± 0.13 × 10⁻⁴ ± 1 × 10⁻⁴
Mg5Zn0.15Ca0.8 ± 0.13.6 × 1014 ± 10130.4 ± 0.10.4 ± 0.11 × 10⁻⁴ ± 9 × 10⁻⁵
Mg5Zn0.15Ca0.15Zr1.5 ± 0.013.5 × 1014 ± 10130.3 ± 0.11.1 ± 0.13 × 10⁻⁴ ± 2 × 10⁻⁵
Mg0.3Ca0.7 ± 0.12.2 × 1014 ± 10130.2 ± 0.010.5 ± 0.11 × 10⁻⁴ ± 1 × 10⁻⁵

