Prediction of Surface Integrity Parameters in Roller Burnishing of Ti6Al4V


1
Department of Engineering for Innovation, University of Salento, 73100 Lecce, Italy
2
Department of Mechanical, Energy and Management Engineering, University of Calabria, 87036 Rende, Italy
*
Author to whom correspondence should be addressed.
Metals 2020, 10(12), 1671; https://doi.org/10.3390/met10121671
Submission received: 28 October 2020
/
Revised: 8 December 2020
/
Accepted: 9 December 2020
/
Published: 14 December 2020
Abstract
:Burnishing is considered a super finishing process able to drastically increase surface quality in terms of hardness and roughness of the manufactured parts. Consequently, it is considered appealing for the performance enhancement of products where the surface quality plays a crucial role. However, when burnishing grade 5 titanium alloy, a quantitative relationship between process parameters and surface integrity is still missing. This work provides a deep analysis of the burnishing parameters and their influence on the surface integrity of Ti-6Al-4V. In particular, starting from a large experimental campaign, statistical analysis of the results is performed and models able to describe the surface integrity response based on different burnishing parameters are presented. The overall results allow us to clearly define the relationship within the input and output variables identifying, by the proposed models, different operational windows for surface integrity improvement.
1. Introduction
Performance enhancement of the component in service (i.e., fatigue and corrosion resistance, surface microhardness and roughness) is strictly related to the high-quality surface finishing. This aspect influences the behavior and functional properties of the produced components: stiffness, wear, lubrication, fatigue, etc. Thus, a comprehensive understanding of the burnishing process is essential in order to better design the burnishing process, choosing the proper processing parameters and conditions. Several studies have been conducted to investigate the effects of different process parameters (feed, speed, tool geometry and material, etc.) and lubri-coolant conditions [1,2,3] on the surface aspect during severe plastic deformation processes and burnishing [4,5,6,7,8,9,10,11,12,13,14].
Revankar et al. [15] investigated the influence of burnishing speed and feed on surface roughness and hardness, during the burnishing of titanium alloy (Ti–6Al–4V). The optimization results revealed that burnishing feed and burnishing speed are the significant parameters for minimizing the surface roughness. Significant enhancement in surface hardness (17%) and surface finish (77%) was shown when compared to the as-received machined surface. Chomienne et al. [16] analyzed the influence of ball-burnishing on the residual stress profile during the processing of martensitic steel: burnishing force was revealed to be the most influential factor for surface change. Tang et al. [17] studied the effect of cryogenic burnishing on the corrosion product film formation mechanism of Ti-6Al-4V titanium. Compared with unburnished ones, cryo-burnished specimens had a thicker subsurface layer with fewer defects with improved compactness, thickness and protection of corrosion product film on the Ti-6Al-4V alloy. Rodriguez et al. [18] presented a complete analysis of the main beneficial aspects produced by the application of ball-burnishing on AISI 1045 turned parts. The study verified that burnishing speed variation hardly affects the surface finish and hardness of the workpiece and burnishing at high pressures increases the surface hardness, while burnishing feed rate is important for increasing the productivity. Ball-burnishing improved the surface quality (even reaching 0.3 μm Ra), increased the hardness of the workpiece surface (up to 60% Brinell) and introduced compressive residual stresses for a depth of 1 mm, improving, consequently, the fatigue life of the component and its wear resistance. Yilmaz and Sadeler [19] performed impact wear tests on ball-burnished 316L stainless steel. The experimental results showed that the previous ball-burnishing treatment affected the grain structure, which caused deformation on the surface. The ball-burnishing treatment also increased the surface hardness of the 316L stainless steel by 31%. Due to increased surface hardness, volume losses during impact wear tests were less than those in the untreated specimens.
Revankar et al. [20] considered various burnishing process parameters (speed, feed, force and number of passes) to reduce the specific wear rate and coefficient of friction in processing Ti-6Al-4V alloy. The optimization results showed that the specific wear rate decreased by 52%, whereas the coefficient of friction was reduced by 64% as compared to the turned surface, confirming a significant wear resistance improvement. Furthermore, surface microhardness increased from 340 to 405HV, surface roughness decreased from 0.45 to 0.12 µm and compressive residual stresses were also found beneath the burnished surface. Nguyen et al. [21] improved the surface quality of AISI 1045 steel by performing a series of roller-burnishing experiments. They investigated the influence of spindle speed (S), feed rate (F) and burnishing depth (D) on three surface quality features: surface roughness (Ra), surface hardness (H) and hardness depth (HD) of the interior roller-burnishing. An evolutionary algorithm named the archive-based micro genetic algorithm (AMGA) was implemented to develop a set of non-linear equations determining the best machining conditions among those investigated.
Hassan et al. [22] studied the influence of feed, speed, forces and number of tool passes on surface hardness and roughness during the roller-burnishing of non-ferrous materials (aluminum alloy and brass). It was found that roller-burnishing improves surface quality when process parameters were kept under control and, furthermore, experiments revealed that force and the number of burnishing tool passes are the main influential parameters for the material under investigation.
Amini et al. [23], by a full factorial experimental design, studied the influence of ultrasonic vibration, feed rate, and pass number on surface roughness and hardness when ball-burnishing aluminum 6061 and AISI 1045 steel plates. As the main result, compared to the conventional burnishing process, it was found that the association of both static and dynamic loading in the ultrasonic-assisted burnishing process enhances the hardness surface value and hardened depth and reduces surface roughness.
García-Granada et al. [24] studied the influence of the ball-burnishing process on AISI 1038 steel and AA2017-T4 aluminum alloy. They found that burnishing increased the compressive residual stresses in layers up to 0.6 mm deep for the chosen testing conditions, justifying the relevance of burnishing as an industrial finishing process with particular interest for finish parts subjected to fatigue working regimes. Furthermore, similar induced residual stresses were found in both the x and y direction.
Sachin et al. [25] investigated the influence of a novel diamond burnishing tool on a 17-4 PH stainless steel in cryogenic conditions. Better surface integrity results (roughness, surface hardness, subsurface microhardness and residual stress) were found when compared with dry and Minimum Quantity of Lubricant (MQL) conditions.
Khalilpourazary et al. [26] analyzed a new approach in the burnishing process of Al7175 using nanofluid containing alumina nanoparticles. Significant improvements in surface roughness and microhardness compared to those of dry burnishing were found. Furthermore, the results confirmed the presence of a thin layer of 0.4mm of alumina ceramic on the burnished workpiece surface.
The state of the art demonstrates that the burnishing process is of relevant interest for super finishing products, especially when they need to overcome strict regulations on reliability and performance, such as fatigue life, wear or corrosion. However, burnishing force is, most of the time, considered as an input variable of the process and it is consequently related with the surface characteristics. Even though this way allows industry to easily implement the process in the working line, it does not offer the possibility to completely assess the process parameters’ influence on the final surface integrity. In this context, this work shows a deep statistical analysis of roller-burnishing of Ti-6Al-4V with varying process parameters on the surface integrity of the burnished material in terms of surface roughness, hardness and wear rate. A custom-made tool was used and the overall analysis allowed us to develop models able to describe the surface integrity parameters influenced by the process in order to select the right combination according to the specific needs.
2. Materials and Methods
Grade 5 titanium alloy Ti-6Al-4V workpiece material was employed in the form of cylindrical bars with a diameter of 30 mm. The chemical composition of the alloy was: Fe = 0.13%wt, C = 0.014%wt, N = 0.021%wt, H = 0.001%wt, O = 0.17%wt, Al = 6.31%wt, V = 4.25%wt, Y < 0.001%wt. The initial hardness was found to be of 380HV and the microstructure was verified to be of equiaxed α grains with intergranular β. Roller-burnishing tests were performed by a high-speed Computer Numerical Control (CNC) turning center equipped with a coolant/lubricant delivery line. Thus, three different configurations were considered: dry, minimum quantity of lubrication (MQL) and cryogenic (Cryo) lubro-cooling conditions. Some of the data were experimentally collected in a previous work, where the authors demonstrated how the setup of the sole burnishing force leads to a significant loss of information on the mechanics of the process and its influence on the final surface state [27].
In the MQL condition, the lubricant was delivered to the tool–workpiece contact zone through an external nozzle. The liquid used was a vegetable oil with a flow rate of 60 mL/h. Cryogenic coolant LN2 was delivered by a couple of external nozzles with an inner diameter of 2 mm and a pressure of 6 bar at a distance of 10 mm from the contact zone. The nozzles were set to spray on the unprocessed surface at a distance of 10 mm from the roller tool, resulting in a surface pre-freezing effect, which avoids effects on the tool bearing system, allowing a consistent improvement of the surface quality of the processed part. Burnishing tests were performed by two custom-made roller-burnishing tools with a core material of hardened steel used in the coated and uncoated configuration: stellite coating with a thickness of about 200 μm was deposited by a cold spray method. A customized crotch tool holder was held in a Kistler 9257 three-component piezoelectric dynamometer for measuring forces, while an infrared thermo-camera was used to detect (having a known value of emissivity) the whole thermal field.
The experimental campaign was based on a mixed-level full factorial design, as reported in Table 1. In more detail, factors such as burnishing speed (v), burnishing depth (DoB), tool roller radius (R) and lubricant/cooling conditions were varied over three levels, while the tool surface characteristics were varied over two levels, namely coated and uncoated. Thus, a total of 162 experiments were performed, with three repetitions for each test. Furthermore, an explorative preliminary experimental campaign, based on the Taguchi method was also performed in order to select the values of feed rate and the number of passes, which were fixed at 0.05 mm/rev and 2, respectively. It is worth noting that the burnishing forces were measured as an output of the process instead of controlled input variables, in order to maintain the same burnishing depth and guarantee the same dimensional tolerances in each of the investigated cases. In fact, the proper setting of burnishing parameters is crucial to avoid exceeding the tolerance field. Furthermore, when the burnishing force is fixed, it is difficult to relate the other processing parameters directly with the obtained surface quality.
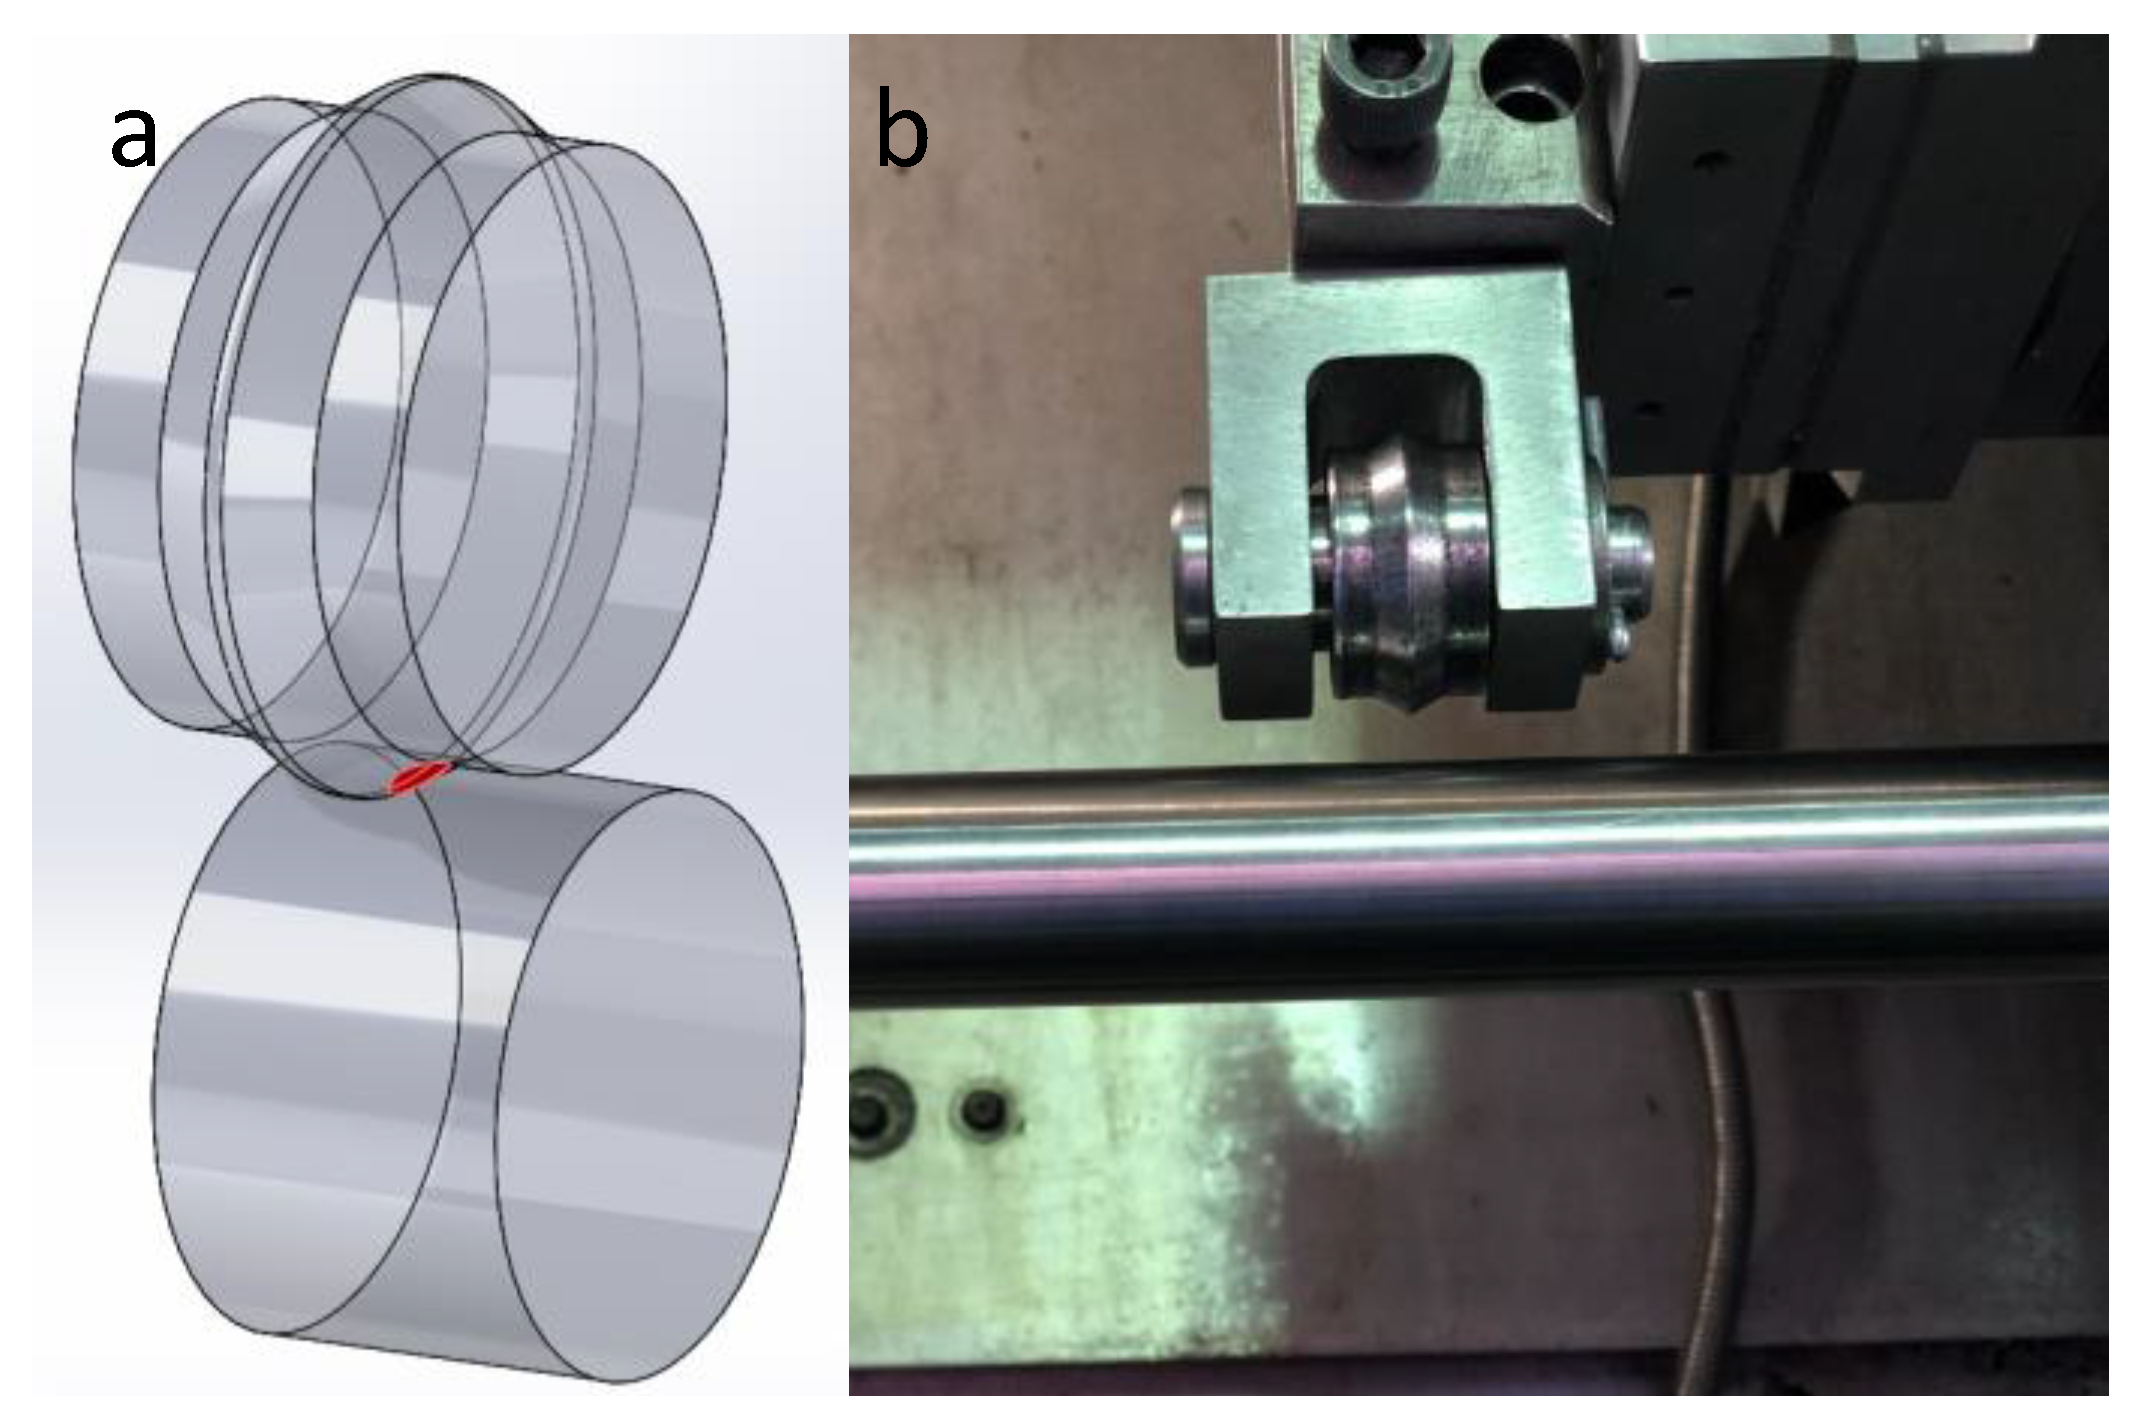
Moreover, it was possible to customize the tool and the holder for the specific needs. Afterward, burnished samples were cut in the transverse direction and mounted into a resin holder for further analysis. Furthermore, the in-house production allowed us to make a sufficient number of burnishing tools so that, in order to avoid undesired effects due to tool wear, a fresh one was used for each testing condition. Figure 1 reports a schematic of the tool–workpiece contact design and the burnishing configuration. The tool was made with hardened steel and the radius, shown in Figure 1, is 1 mm. The cross section was then mechanically polished and etched using Kroll’s reagent (92 mL of distilled water, 6 ml of nitric acid, 2 ml of hydrochloric acid) and then analyzed under an optical microscope (1000×). A non-contact 3D confocal profilometer was used to probe the surface roughness Ra in the feed direction as an average of 10 lines with best fit line subtraction methods (with automatic cut-off selection according to ISO 4288-1996). Finally, the Vickers micro-hardness (HV0.1) of the surface and subsurface layer was probed by means of an instrumented micro indenter.
Furthermore, wear tests were carried out on another batch of burnished samples by means of a linearly reciprocating ball-on-flat sliding wear test performed according to the ASTM G133 standard on a tribometer equipped with an alumina ball as a static partner. The tests were carried out on the burnished samples and the as-machined surface. The specific wear rate was calculated using the Archard model, Wr = V/Fn·l (mm3/N/m), where V is the sample volume loss, Fn is the average normal load and l is the sliding distance. A confocal white light 3D surface profilometer was used to measure the volume loss of the burnished specimen for the wear rate evaluation.
3. Results and Discussion
3.1. Statistical Analysis of the Experimental Results
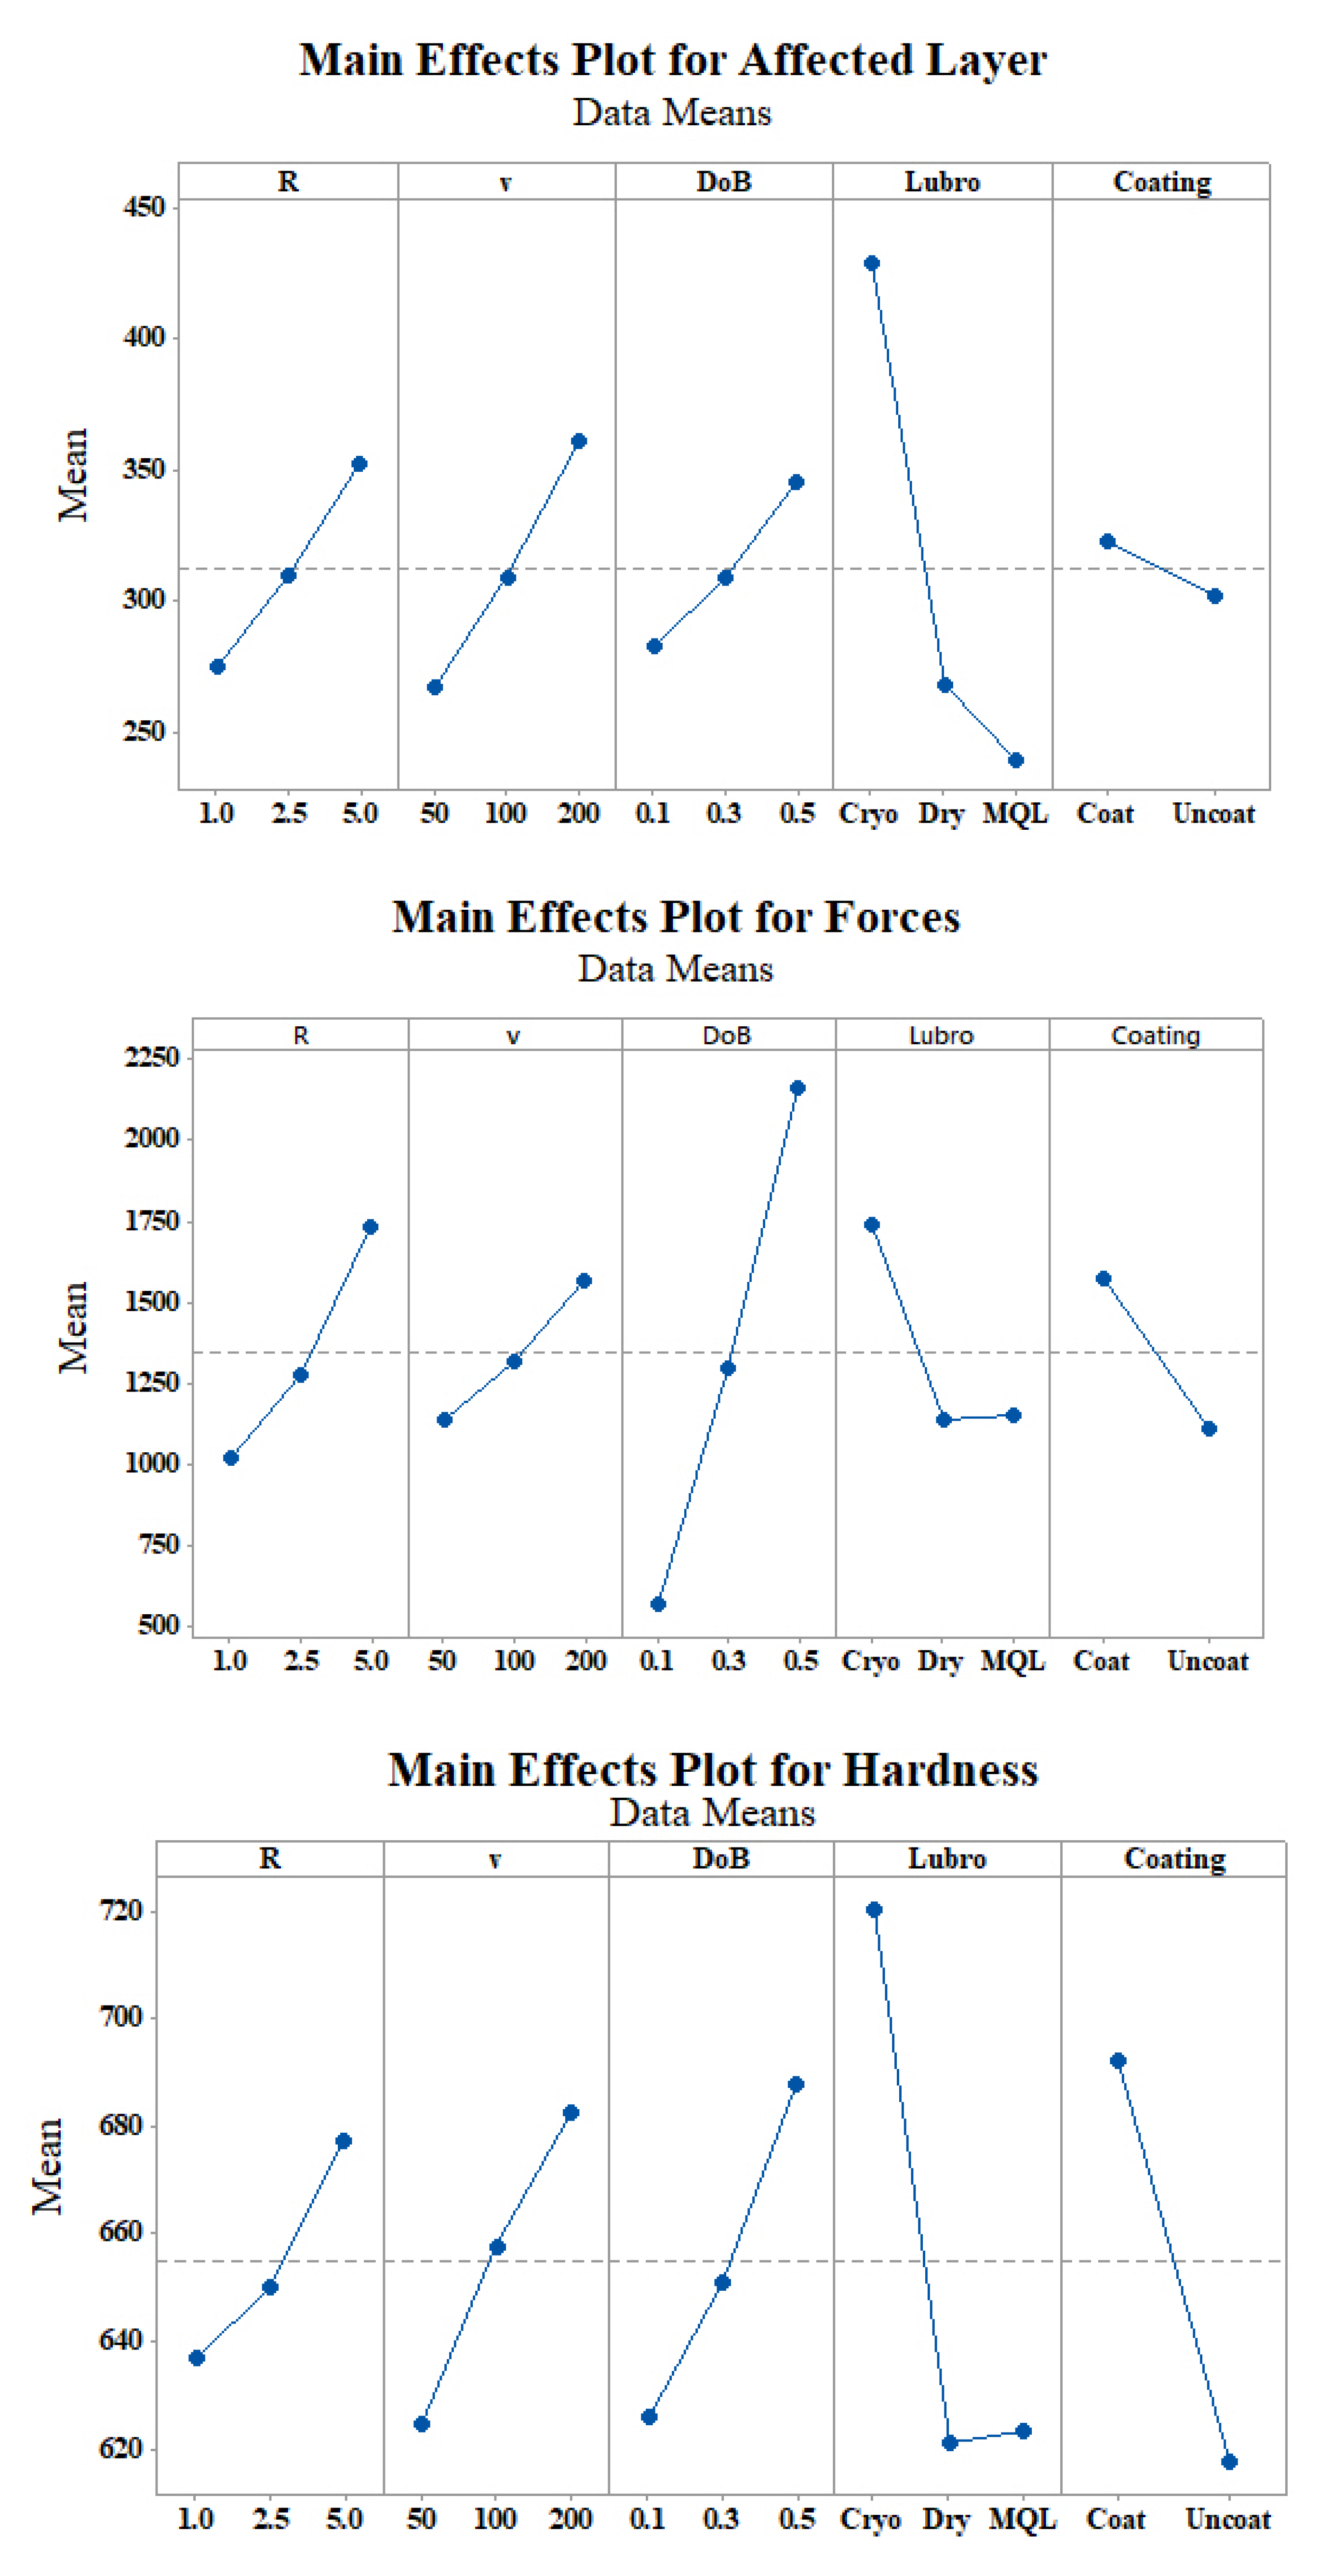
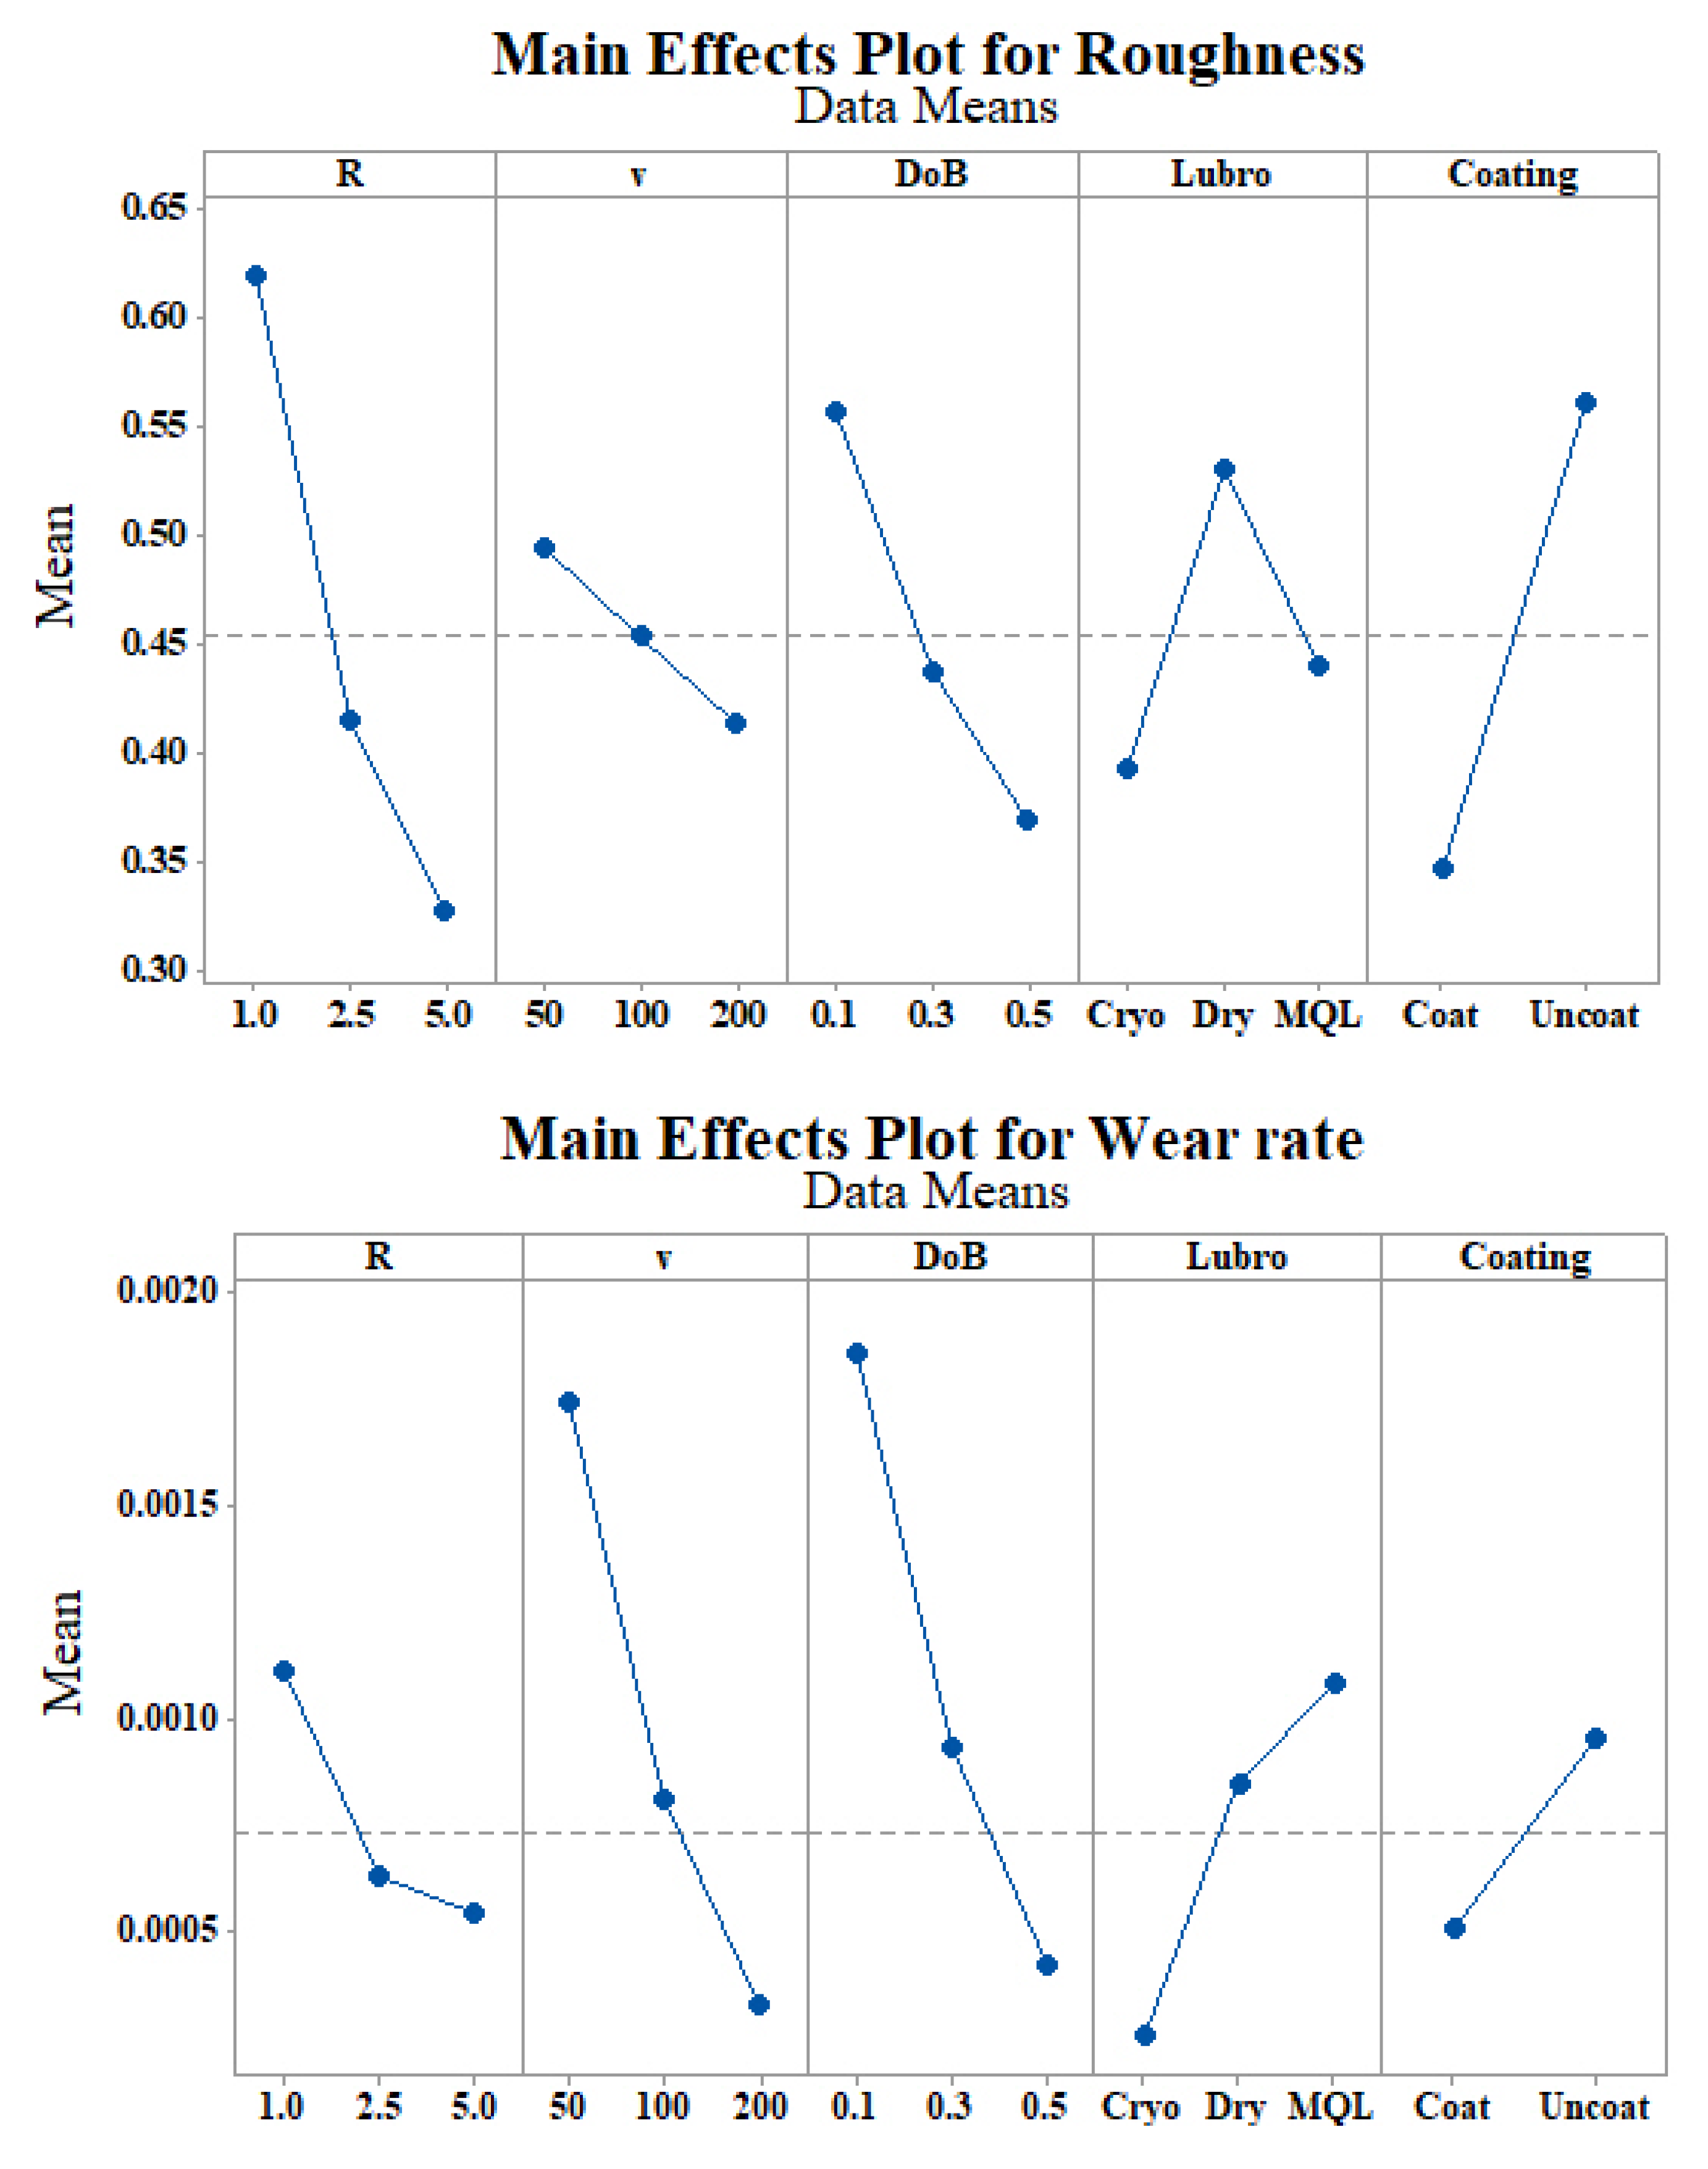
The influence of the burnishing parameters on the measured product performance was evaluated, defining and analyzing a full factorial experimental plan able to describe the relationships between some process inputs and the quality parameters, such as surface roughness, affected layer depth, surface hardness and wear rate. Figure 2 shows the main effects plot for the selected variables.
It is worth noting how the burnishing forces increased when increasing the plowing effect of the process itself, which is achieved when increasing the radius or the federate. In fact, at an increased radius, the overlap of a previous and a subsequent pass is larger, resulting in a more efficient pressing of the material roughness. It is also clear from the figure that the sole force trend leads to losing important information on the influence of the other parameters on the surface state and the overall process effects, as also demonstrated in previous investigations [27]. Thus, a statistical analysis can successfully help to find models describing the physical process.
As a general trend, an increase in burnishing forces, defined as those acting in the radial direction, is registered when increasing the burnishing speed, depth (DoB) and tool radius. In fact, when the amount of material in contact with the tool during the burnishing process rises, stronger forces are needed to overcome the material resistance. MQL does not cause significant changes in terms of burnishing forces if compared with the dry condition. That is mainly due to very low temperature changes during the process. In fact, a maximum temperature of about 40 °C was detected during the burnishing tests. Thus, it is not possible to register any thermal softening effect during the tests, so MQL and dry conditions give almost the same results. Furthermore, cryogenic cooling leads to a significant increase in burnishing forces since the strain hardening effect is distinguishable for Ti-6Al-4V at very low temperatures.
A similar trend is verified for the hardness behavior. In fact, an increase in tool radius, together with the depth of burnishing and speed, leads to greater surface hardness for the burnished workpiece, as well as the cryogenic cooling, which is more effective to increase surface hardness. Additionally, the depth at which a hardness change takes place (affected layer) increases at increasing burnishing depth, tool radius and speed. That is due to the effectiveness in strain hardening the material when cryogenic cooling is applied. Additionally, at increased surface contact (thus at increasing tool radius and DoB), the amount of plastic deformation increases, leading to a more pronounced hardness change effect. Furthermore, the roughness analysis highlights a trend of improved surface quality at increasing burnishing depth, speed and tool radius. In fact, it is possible to state that there was no flaking effect detected during the tests. This highlights that the parameters’ ranges are within “the optimal” window of process parameters able to improve the surface characteristics. Finally, coated tools induced an increase in burnishing forces, surface hardness and a decrease in surface roughness. This is due to the higher roller hardness, which improves the coated rolling resistance, leading to an increased strain hardening on the processed layer resulting, in turn, in an increased need for applied forces, superior hardness and reduced surface roughness.
A regression analysis was also performed on the experimental set in order to determine models able to describe the output variable trend considering the process parameter effects.
Thus, the regression equations for the considered output variables are reported below.
3.1.1. Surface Roughness (Ra)
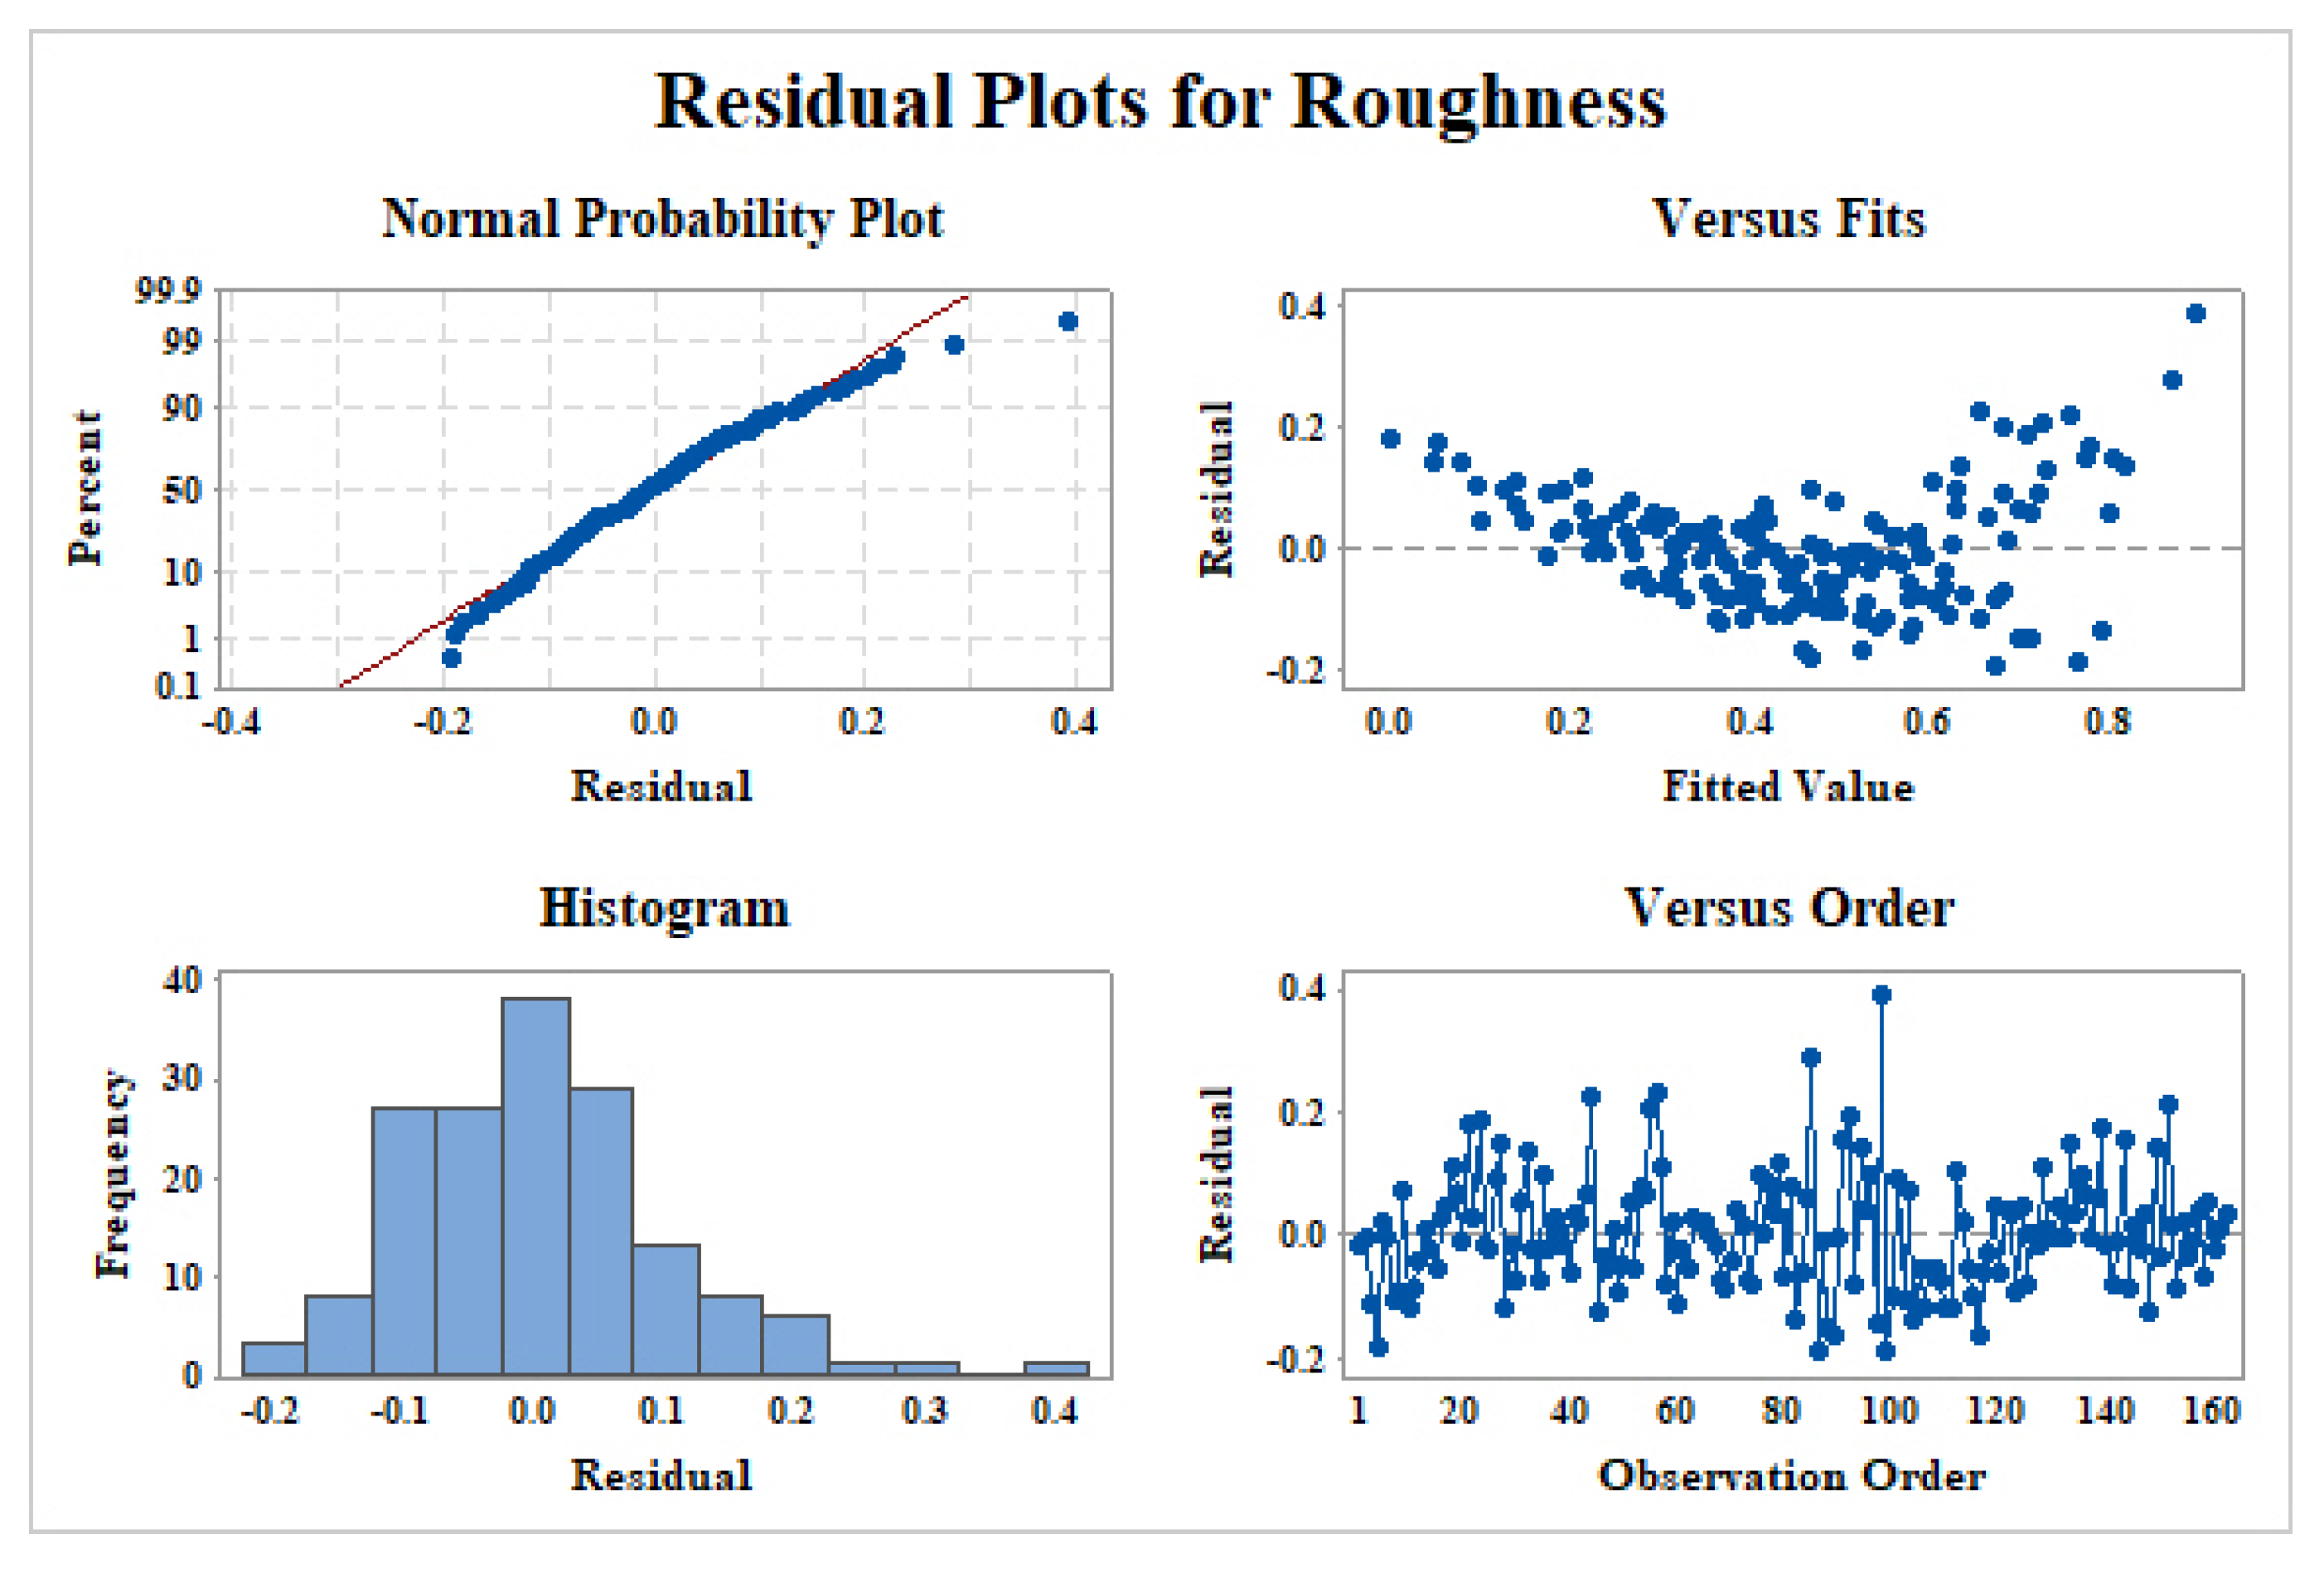
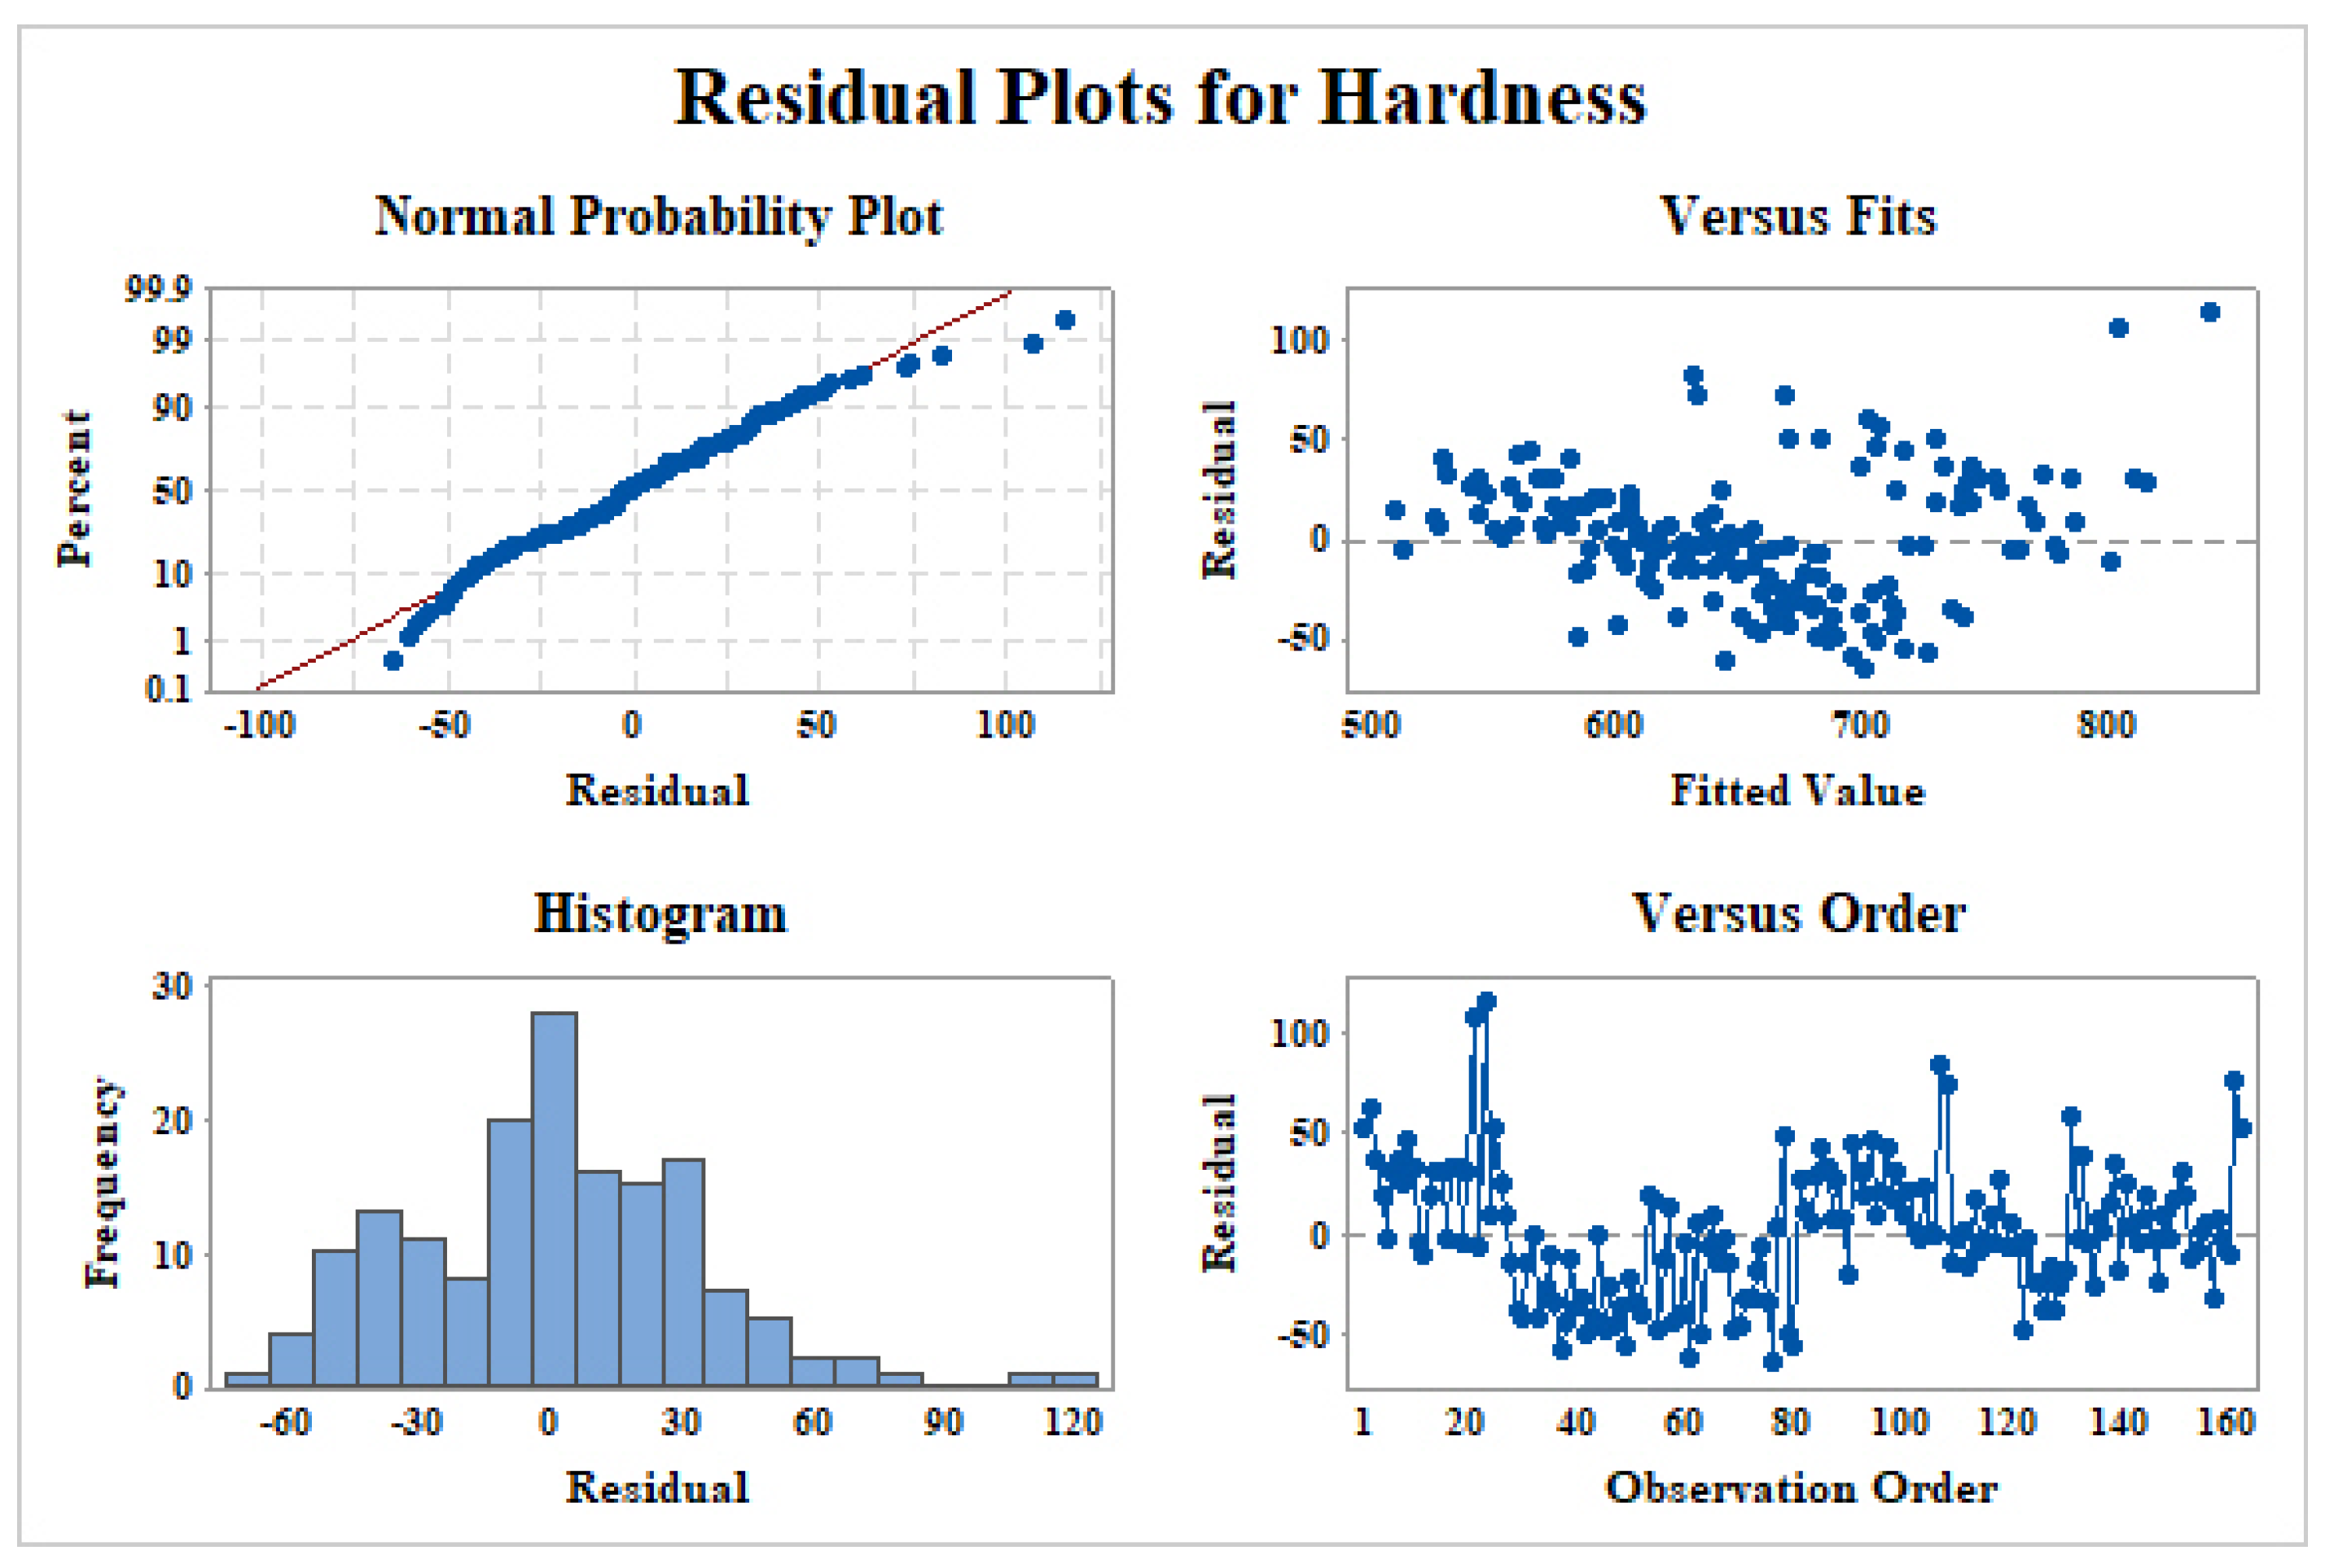
Figure 3 reports the residual plot data for the statistical analysis of roughness.
It is possible to state that the normal probability follows a straight line well, indicating that the residuals are normally distributed. Few outliers are also detected. In fact, the histogram shows a slight skewness on the right side. The residuals versus fit indicate the possibility to improve the model, adding a higher order term. However, the distribution is still good. Finally, the assumption that the residuals are independent of one another is confirmed by the residuals vs. order. Figure 4 reports the model vs. data plot for selected cases.
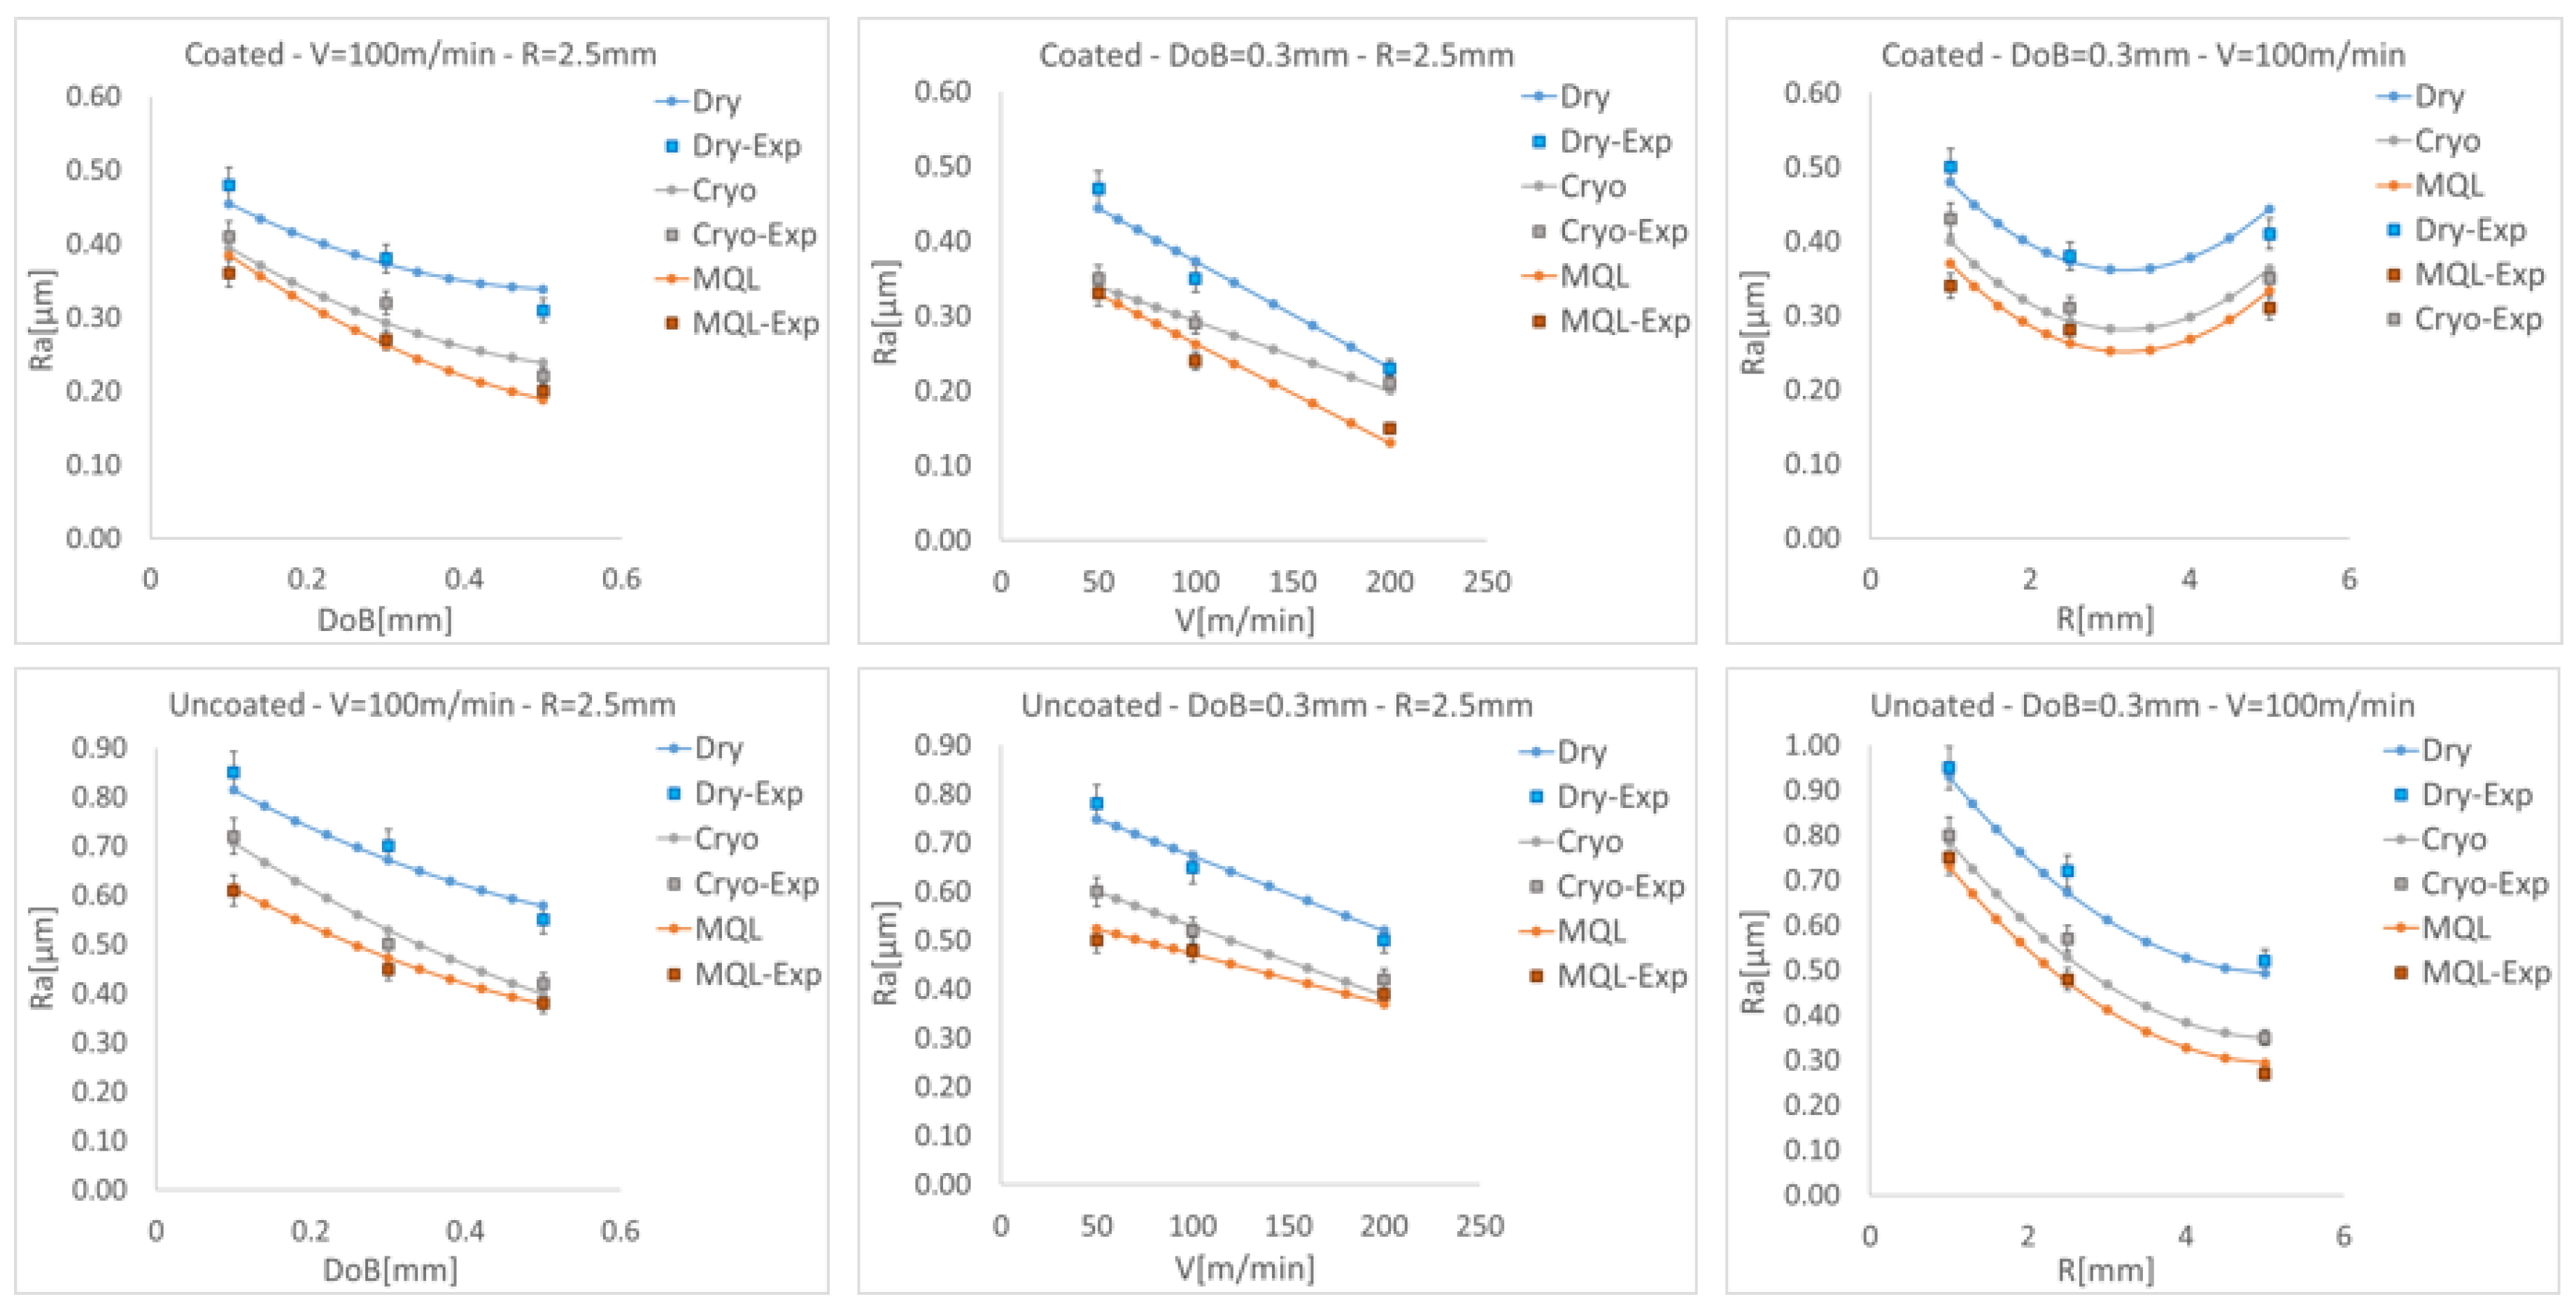
It is possible to verify whether the trend is well interpolated by the model as well as whether the capability to predict the experimental data is satisfactory. In particular, the cryogenic condition does not lead to better roughness parameters since the lubrication effect is not present there. On the contrary, the MQL condition always improves the surface roughness.
The roughness presents a lower bound at a radius close to 3 µm, which reasonably means an optimal tradeoff point between plowing effect at a selected DoB. In fact, when increasing the DoB, a higher radius can be employed for smoothing the surface further, while at a lower DoB, the plowing effect is deteriorated by the lack of continuity in the contact during the process. The coated tools, having a lower wear rate, also ensure a better surface condition, which is also proved at a higher burnishing speed. The best conditions for surface roughness occur under the MQL lubrication method, while the cryogenic condition seems to slightly deteriorate the surface state.
3.1.2. Surface Hardness (HV)
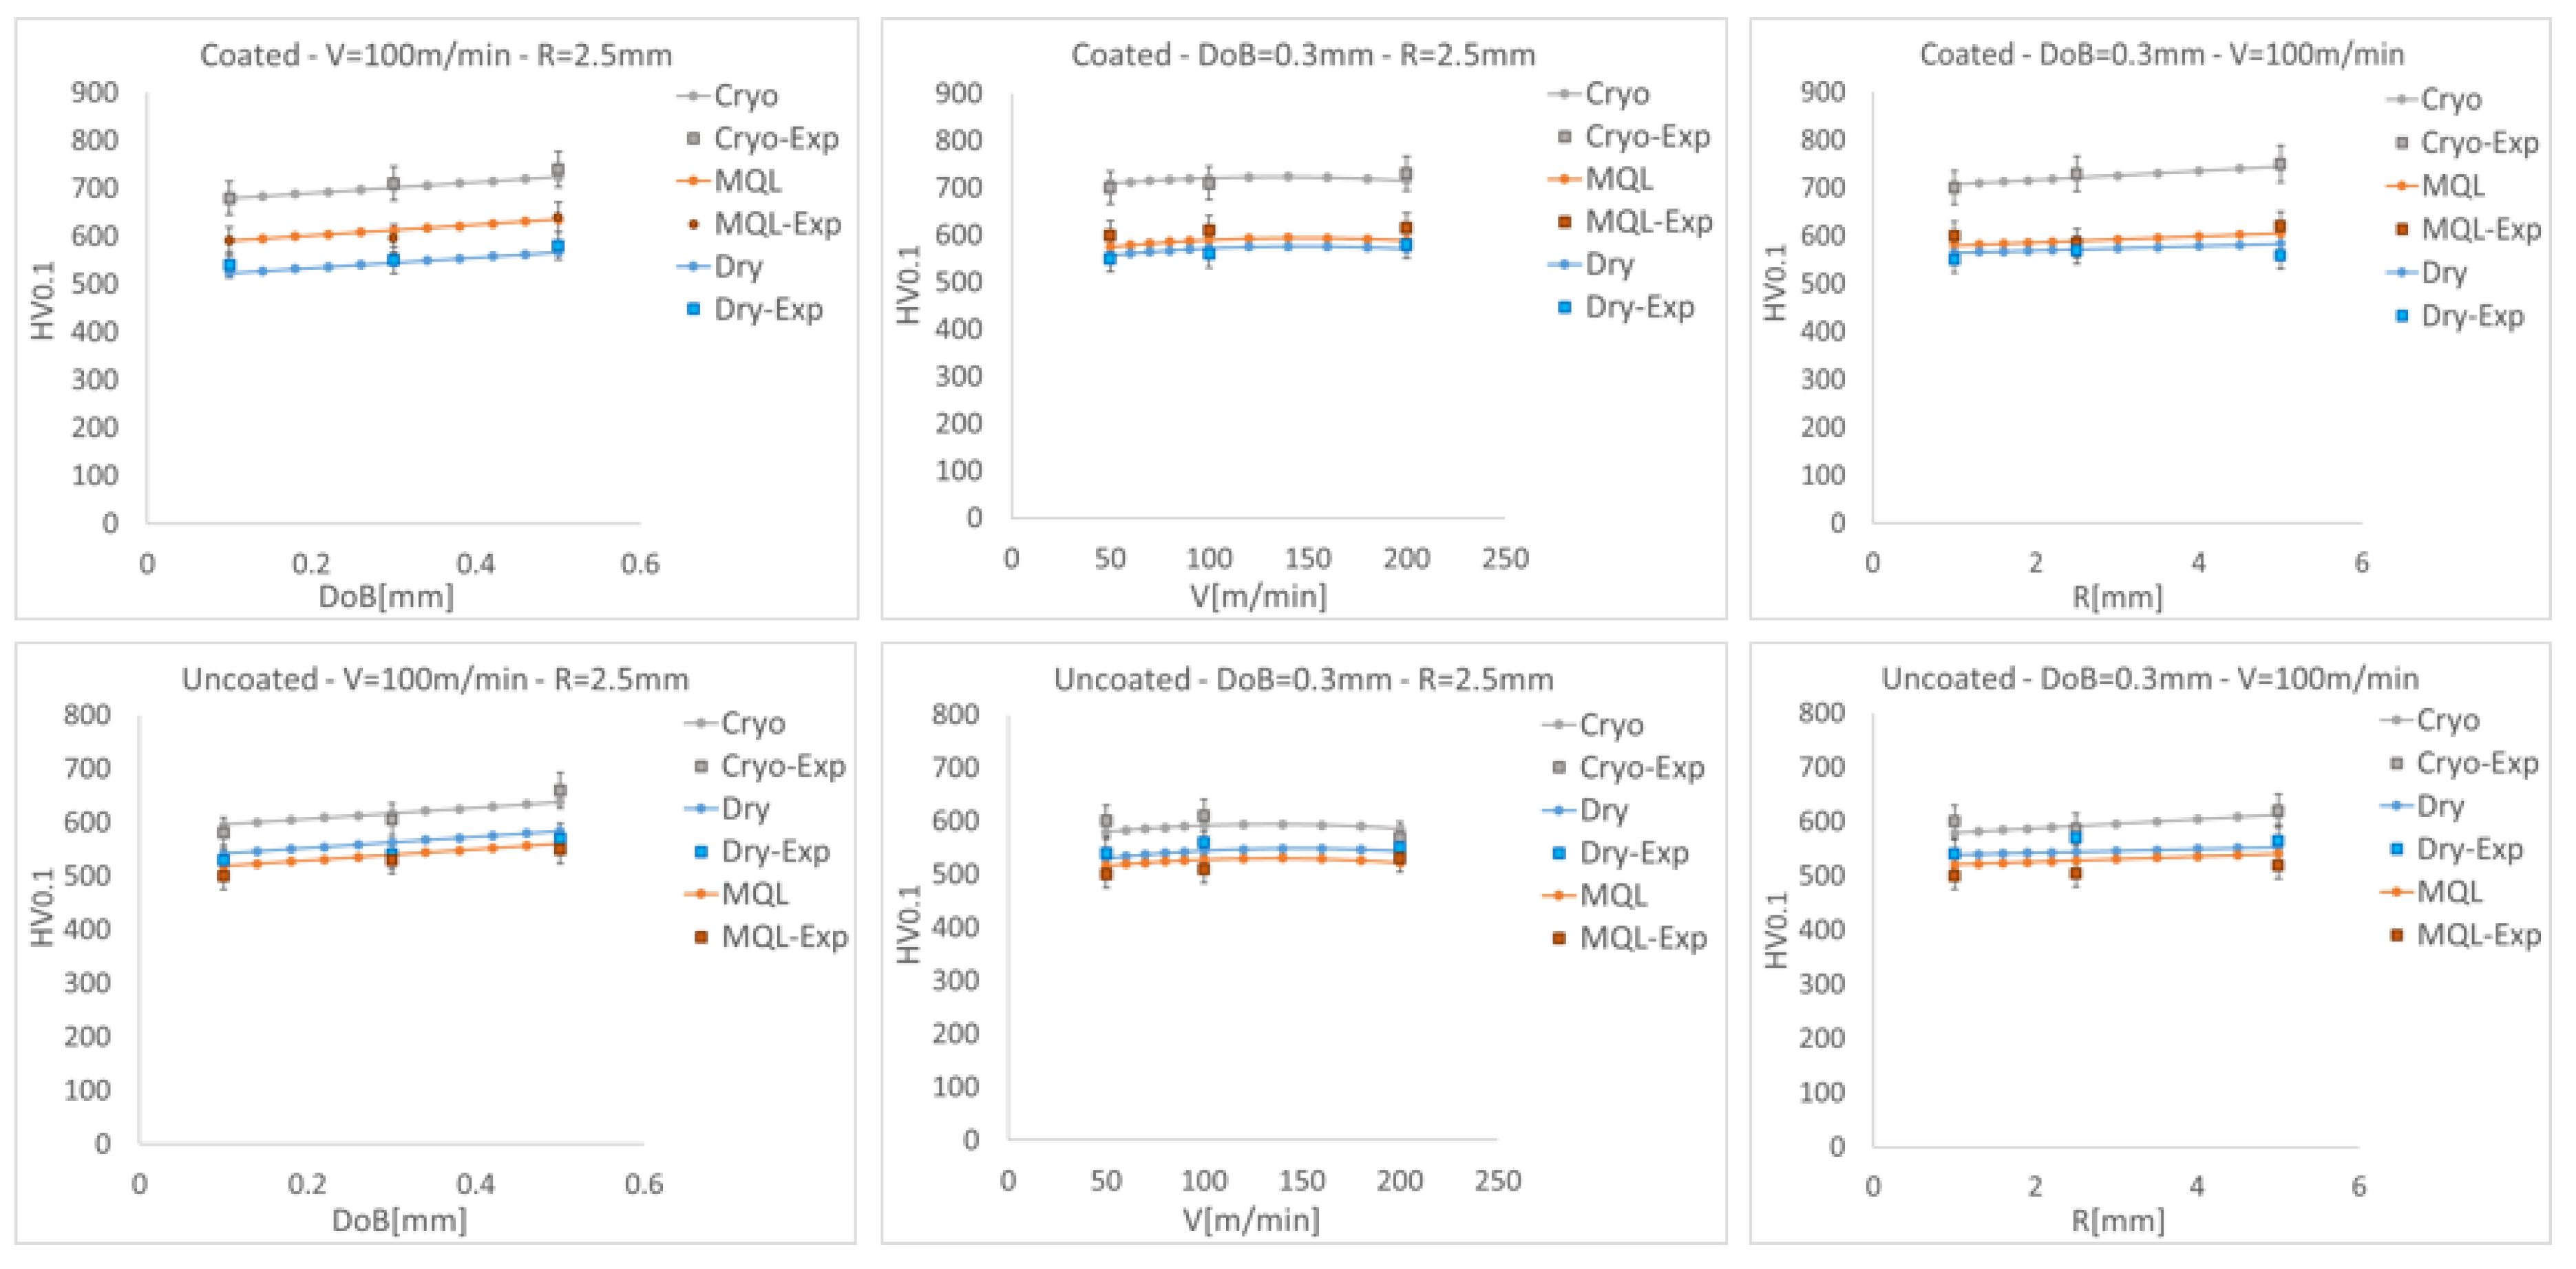
The statistics suggest an increased hardness improvement when stronger forces are applied but, also, they indicate which process parameters have higher effects on it. Figure 5 shows the comparison between the model and the experimental data. Good agreement is found between them and a general trend of increasing hardness when increasing the burnishing forces is verified. Furthermore, cryogenic conditions lead to an improved hardness, increasing as a consequence of efficient plowing combined with work hardening [28].
Equation (2) reports the model from the statistics for hardness prediction.
Table 3 reports the model variable values.
While forces surely influenced changes in hardness, the contact radius also seemed to have a non-negligible effect on surface hardness modification. In fact, a larger radius leads to a larger contact and effective plowing. The model is less efficient in predicting the effects of the DoB changes. This is most probably due to the high variability in the experimental tests strictly related to the measurement method, which is characterized by an high dispersion rate due to the local surface phenomena taking place and affecting the results. Finally, the DoB also plays a role in the hardness modification, increasing the surface hardness when a higher value of depth of burnishing is imposed.
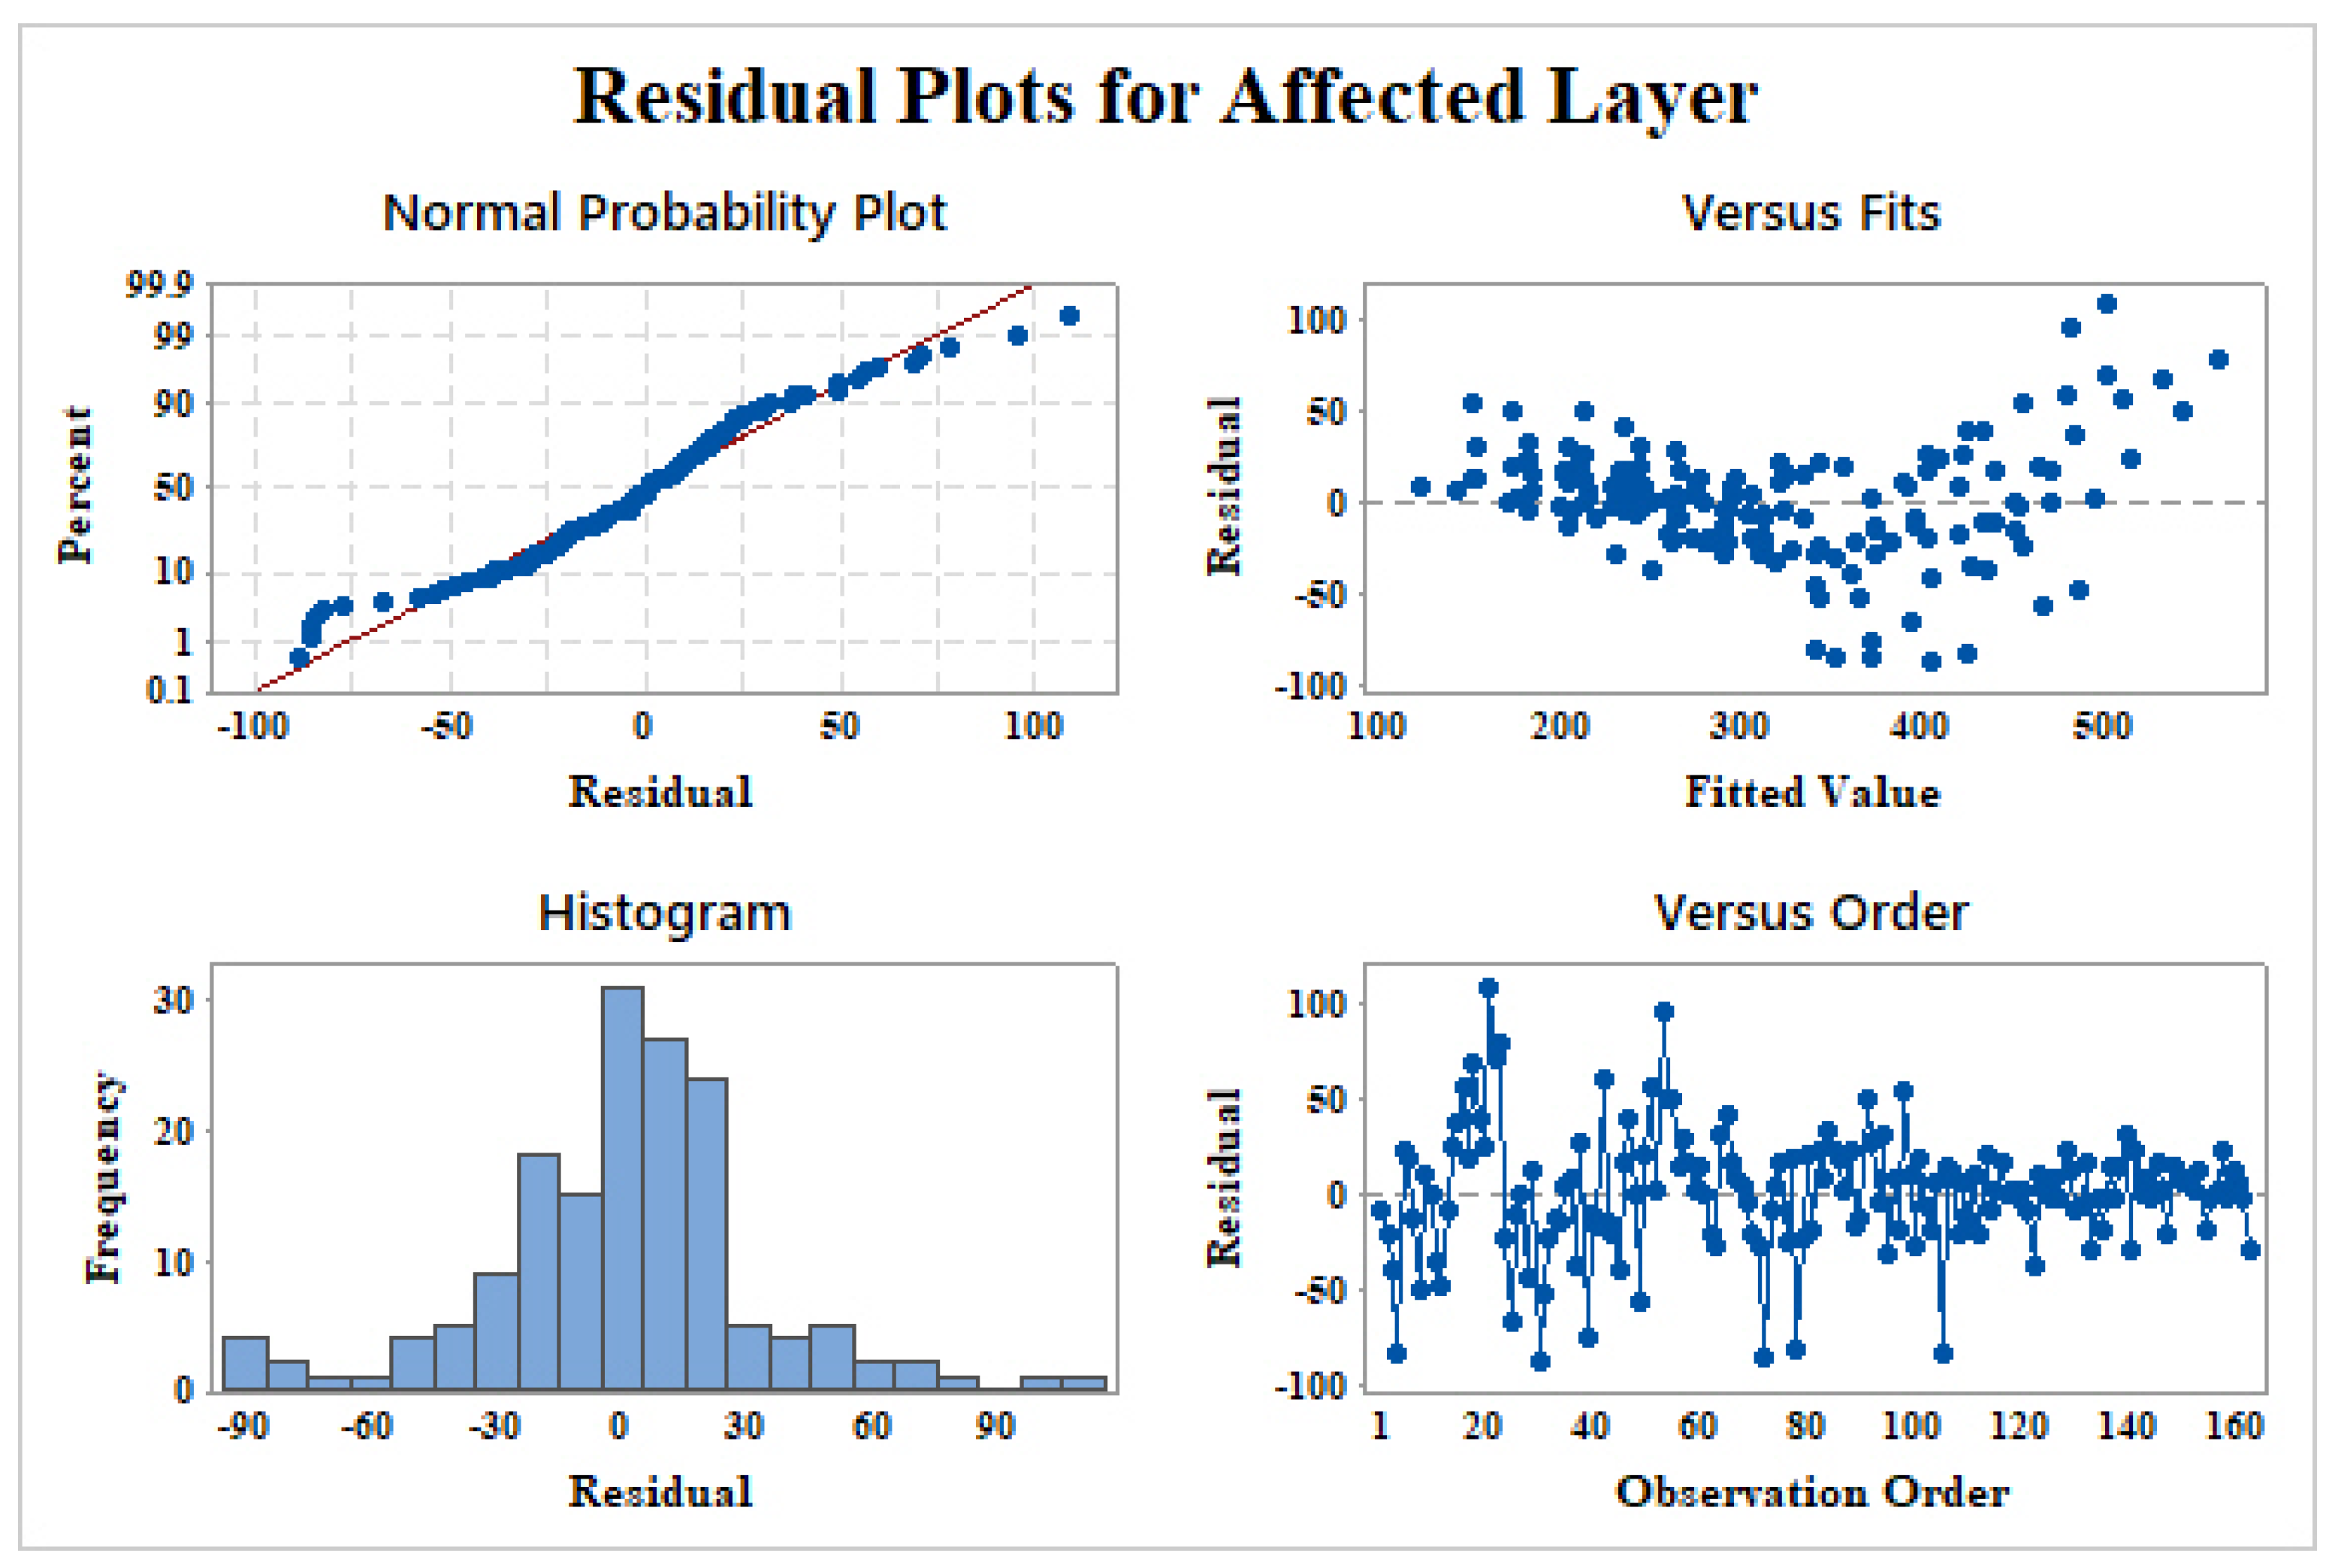
Figure 6 shows the residual plots for hardness. The distribution is close to a straight line and there are some outliers, which were not included in the calculation of the model.
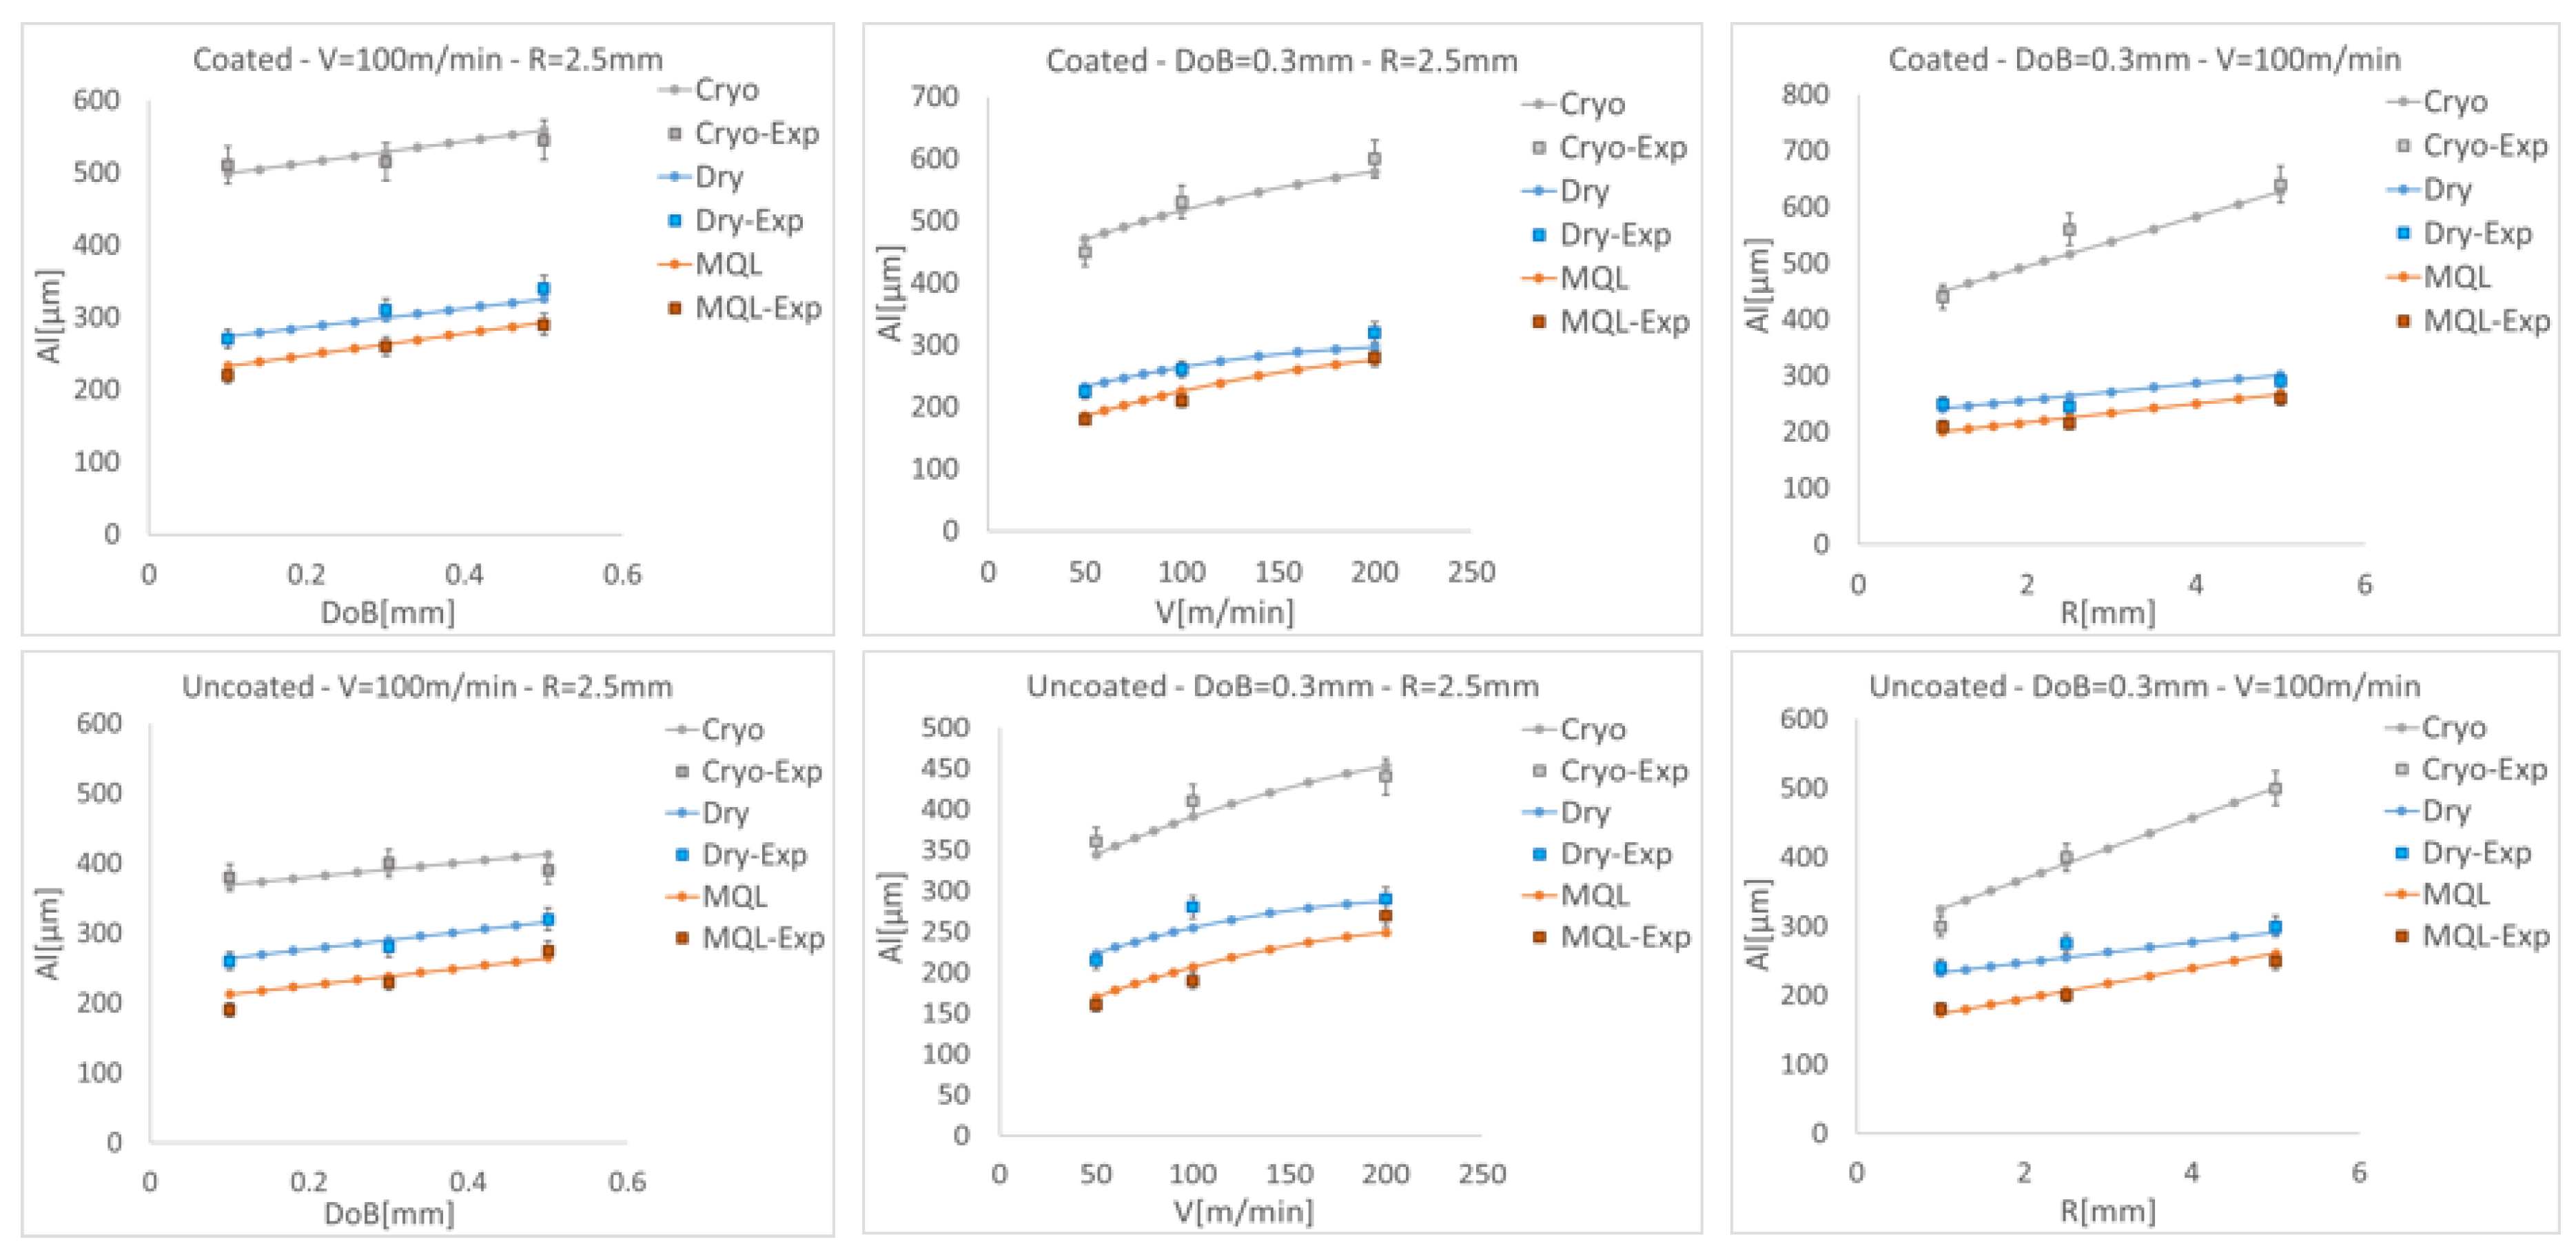
3.1.3. Affected Layer (Al)
A model for the affected layer was also developed based on statistics. Equation (3) is related to the prediction of Al before performing the experimental campaign.
Table 4 reports the model variable values.
It is worth noting that from Figure 7 it is still possible to verify a normal distribution of the data even though a higher order term could improve the model and some more outliers are detected.
The models proposed fit the experimental results well, also following the general trend of increasing the affected layer with increasing burnishing forces and, consequently, feed rate, speed and radius, shown in Figure 8.
The comparison also allows us to verify the relationship between affected layer depth and the selected burnishing parameters. In particular, it is evident that the marked effect of the radius can lead to a deeper deformed layer due to a more efficient plowing effect generated by a larger contact surface between the tool and the surface. Furthermore, the forces affect the modified layer depth as the combination of a larger radius and DoB also leads to a force increase. Furthermore, cryogenic conditions lead to a deeper burnishing affected layer mainly due to the influence of the temperature on the strain hardening and workpiece plasticity [29].
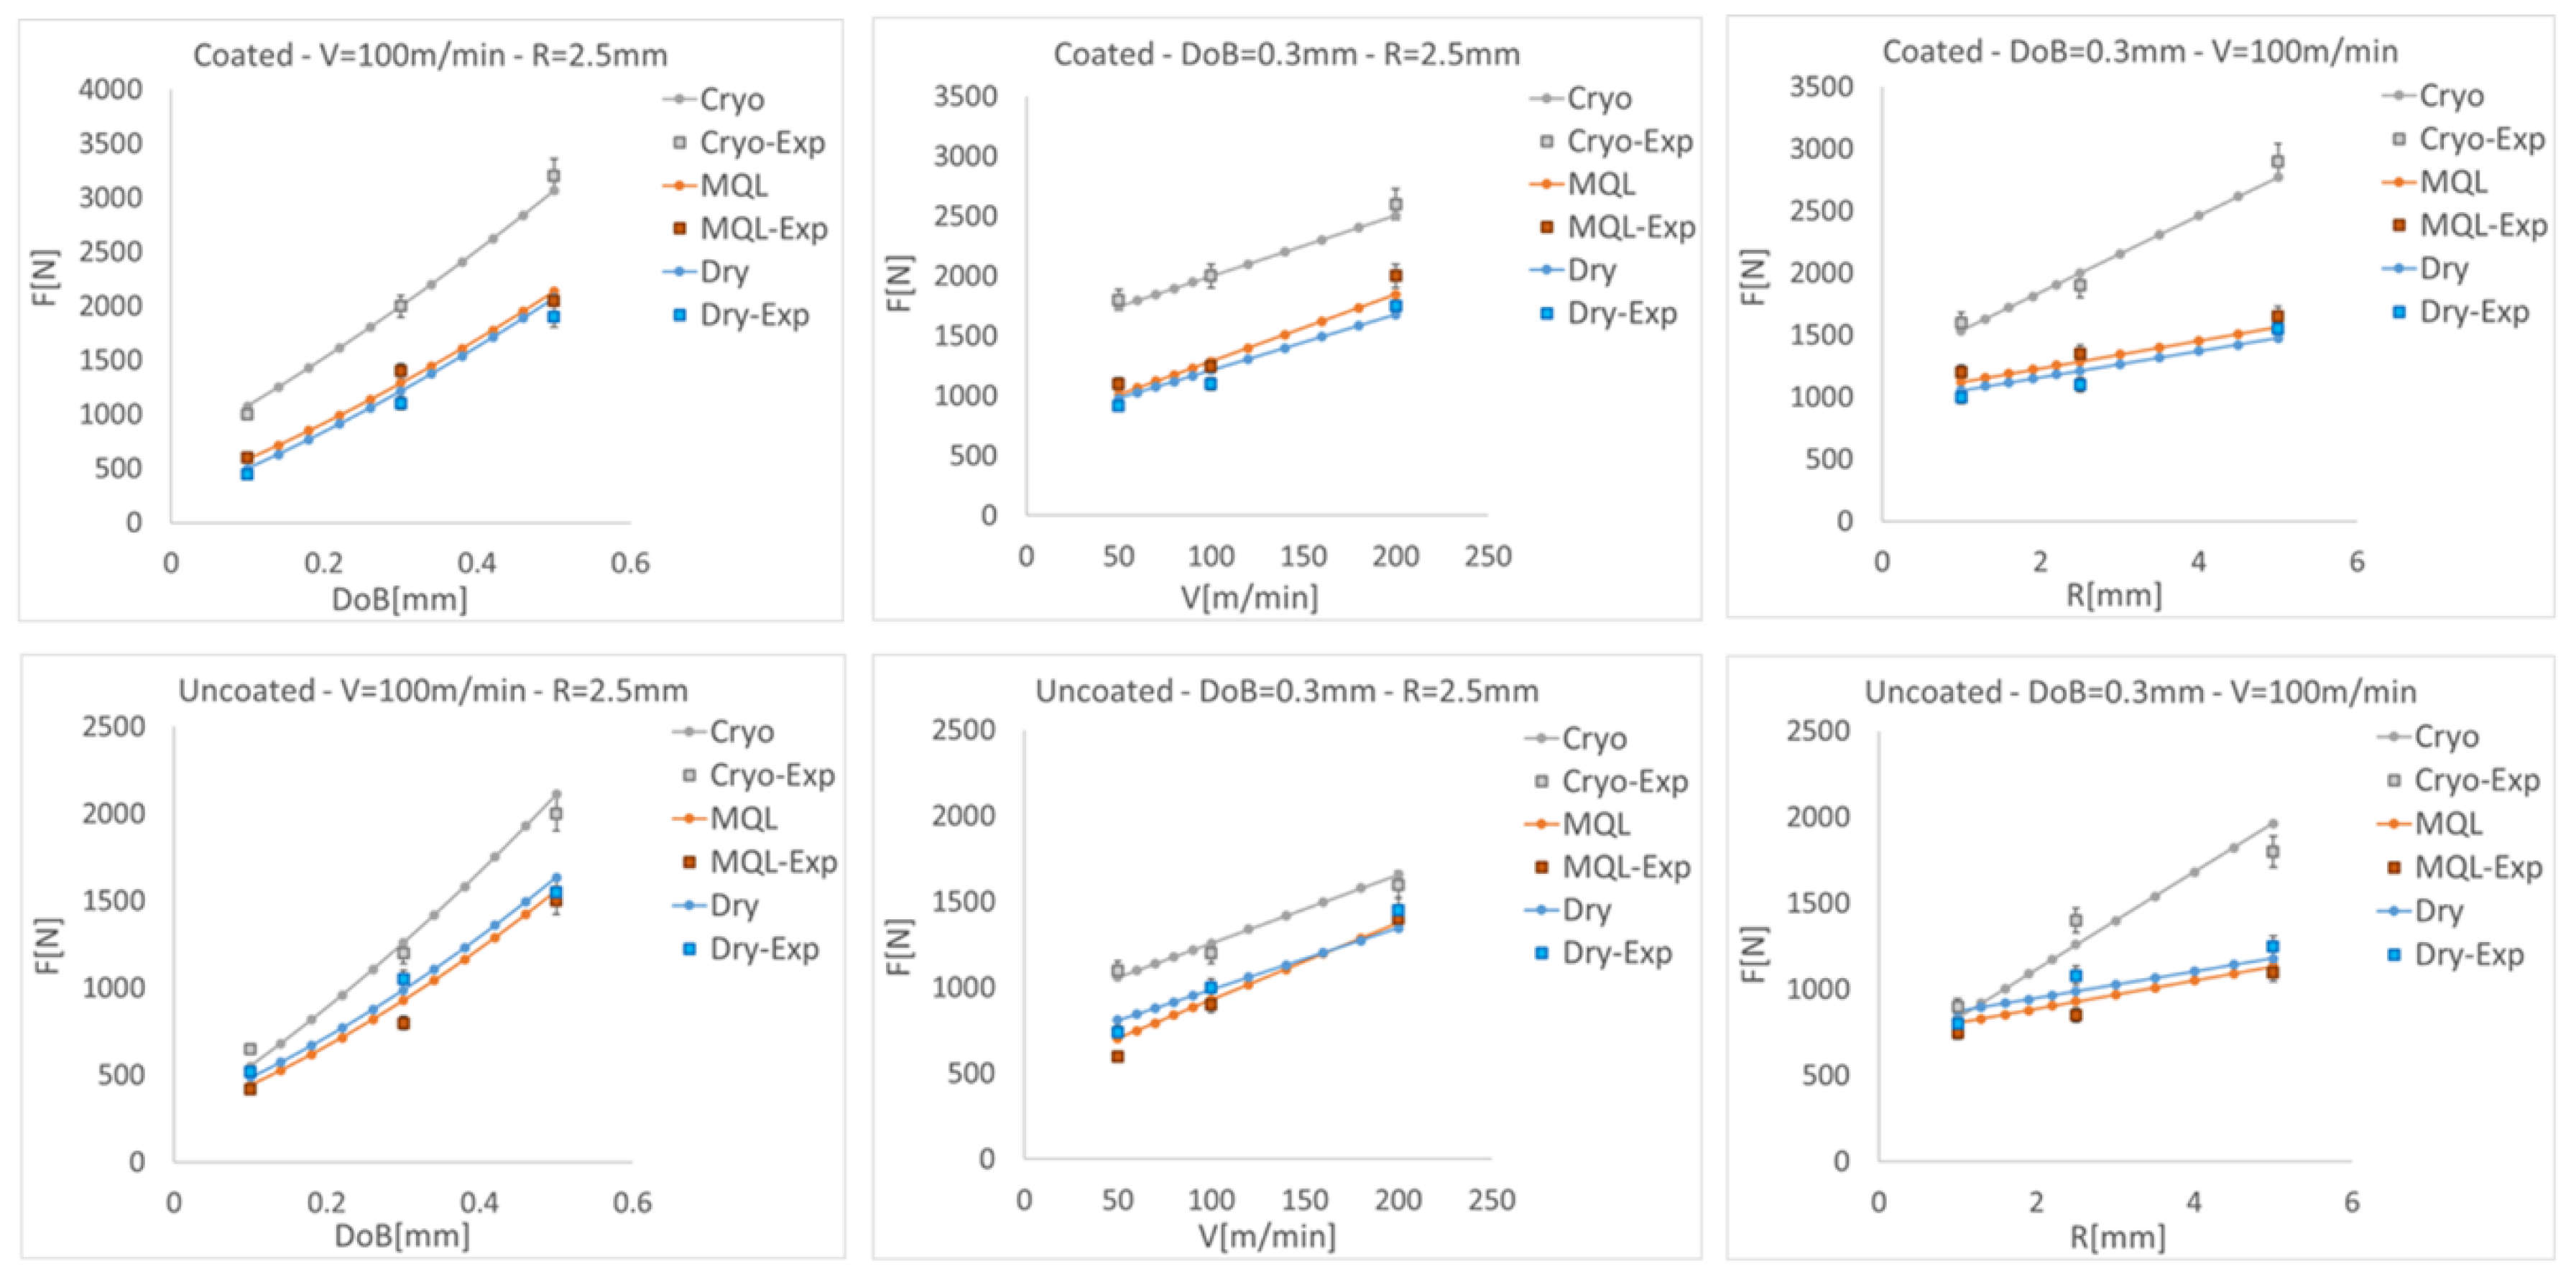
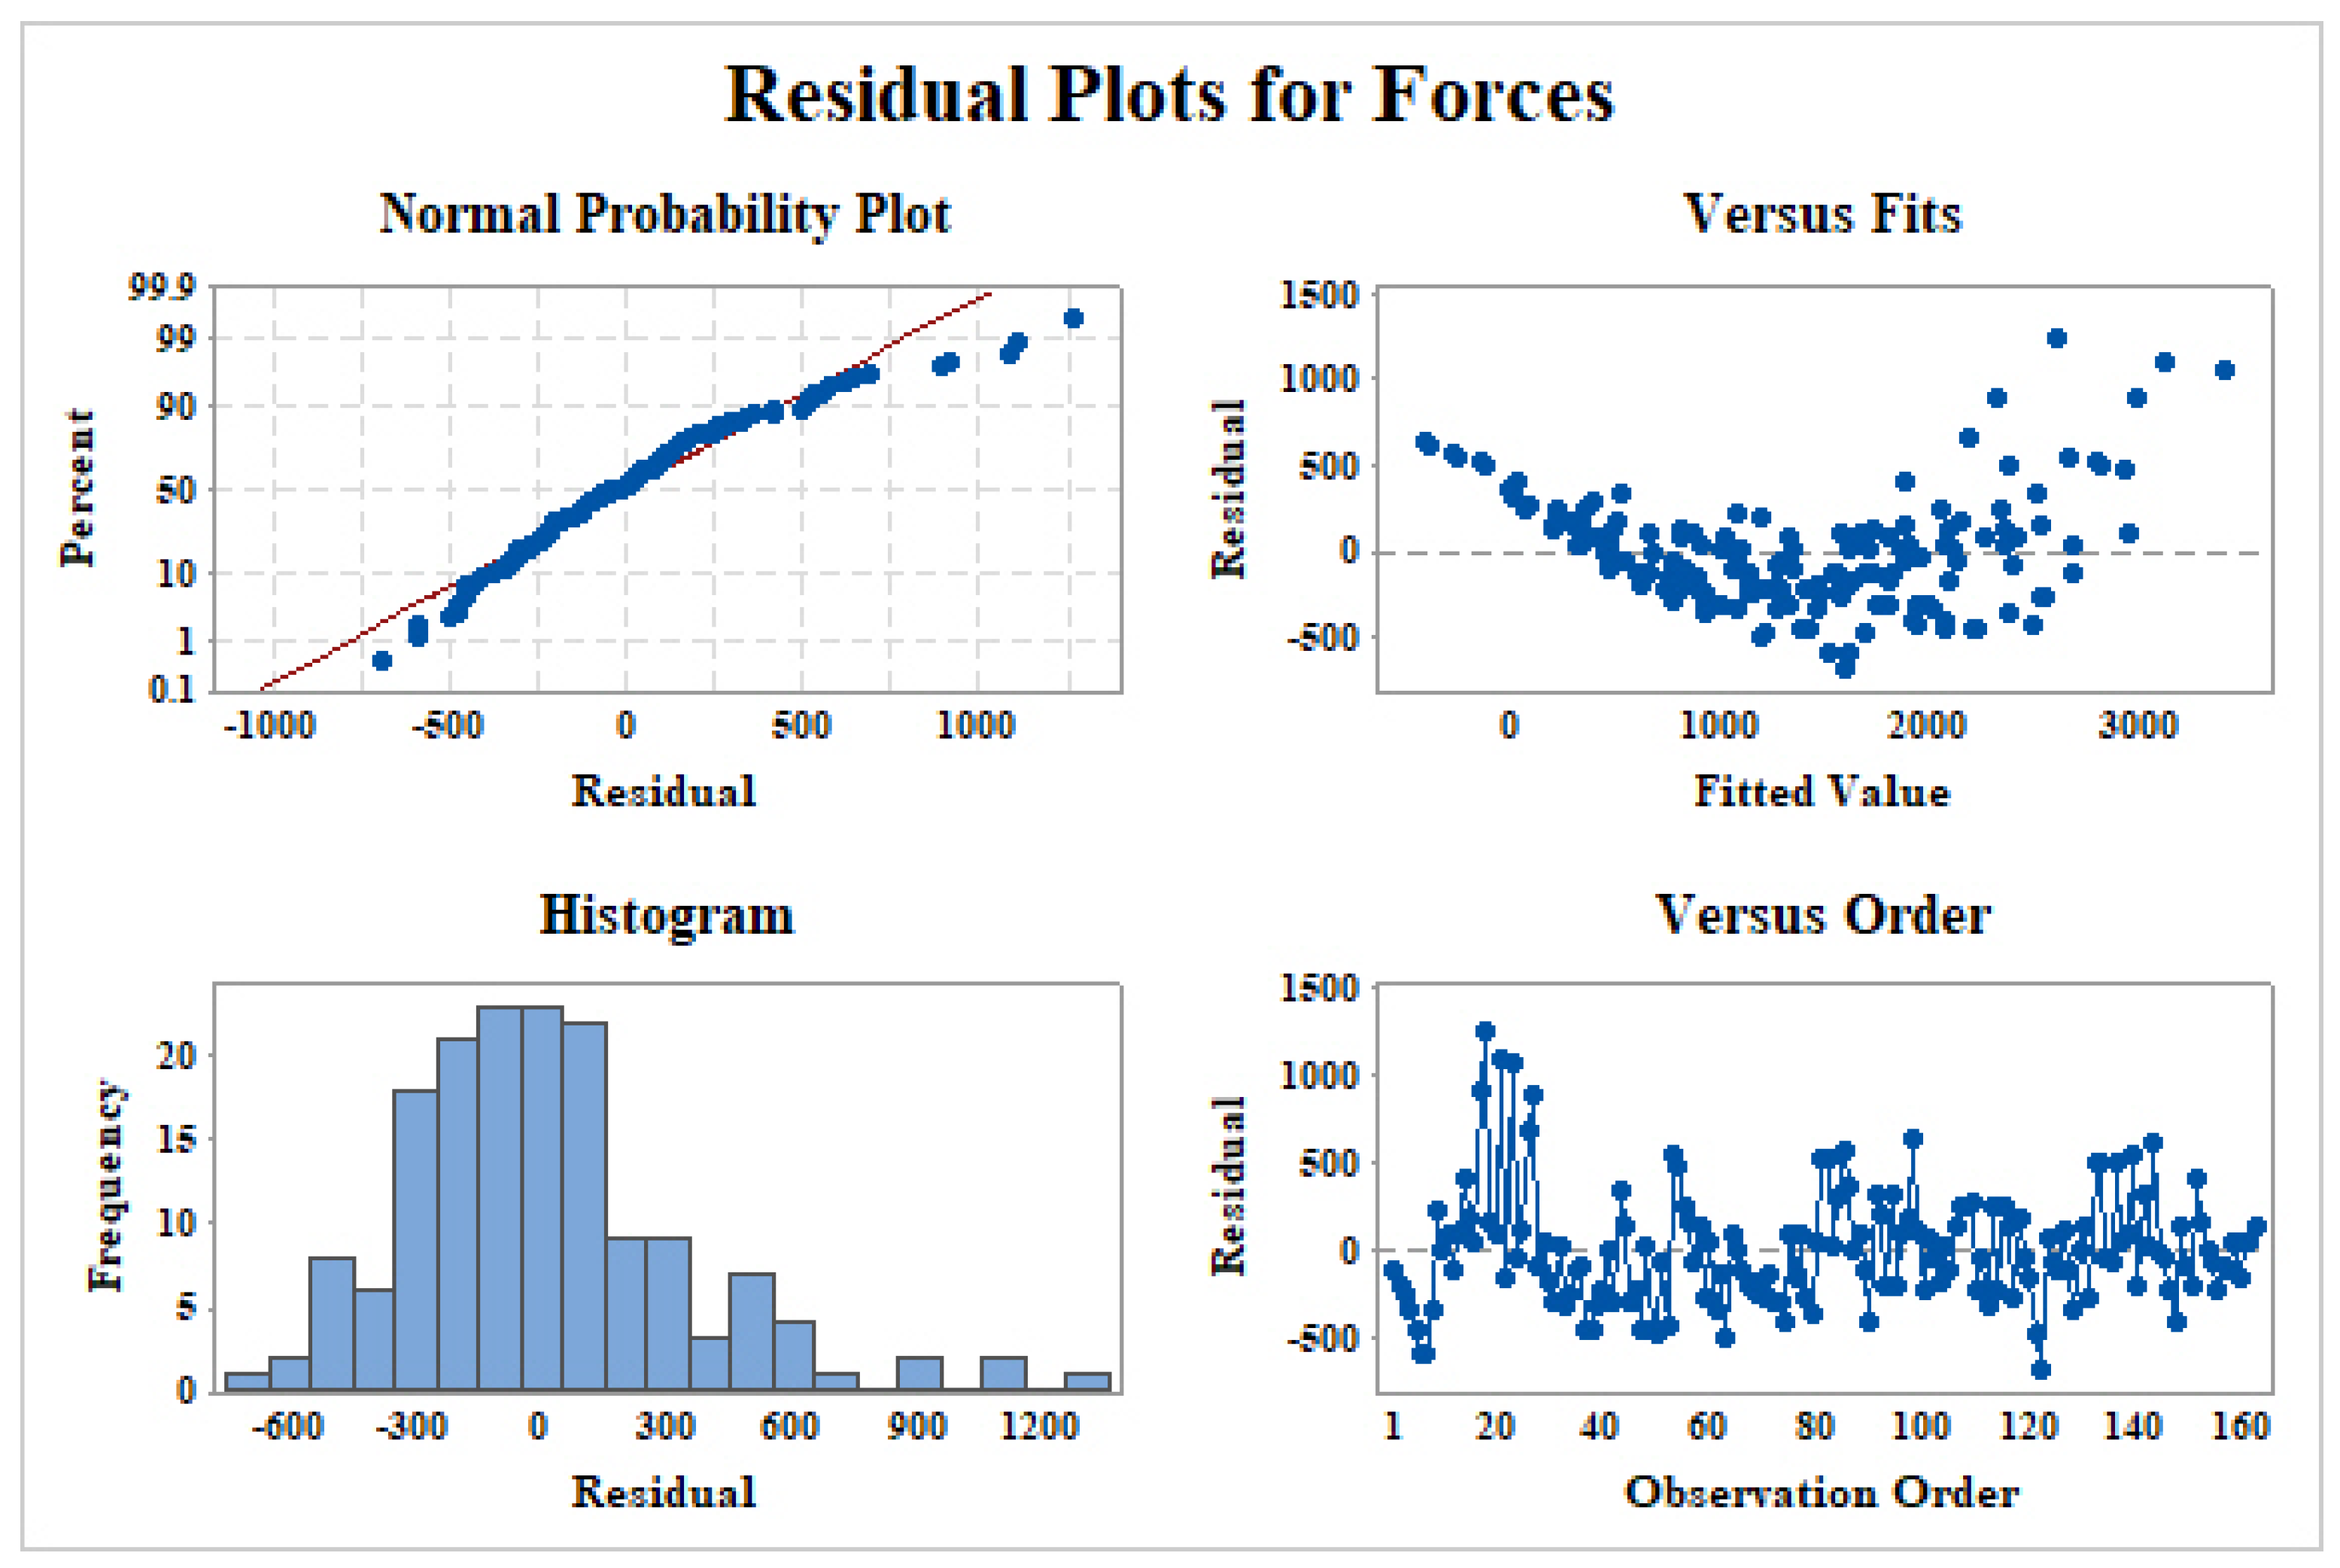
3.1.4. Burnishing Forces (F)
An equation describing the relationship between the burnishing parameters and the forces is shown herein. Table 5 reports the values of the variables.
Figure 9 shows the good agreement between the model and the experimental data.
In particular, the dependency of the burnishing forces on the input parameters is confirmed to a different extent. In particular, the burnishing forces are strongly influenced by the lubricant conditions selected and the selected depth of burnishing. On the other hand, they are also affected by the coating conditions, while the speed seems to have a lower effect on forces.
The overall trend follows the experimental setup. The residual plot shown in Figure 10 is pretty similar to that for the affected layer, showing a histogram skewed to the right. Some outliers are also visible. Thus, the statistical results can be considered valid.
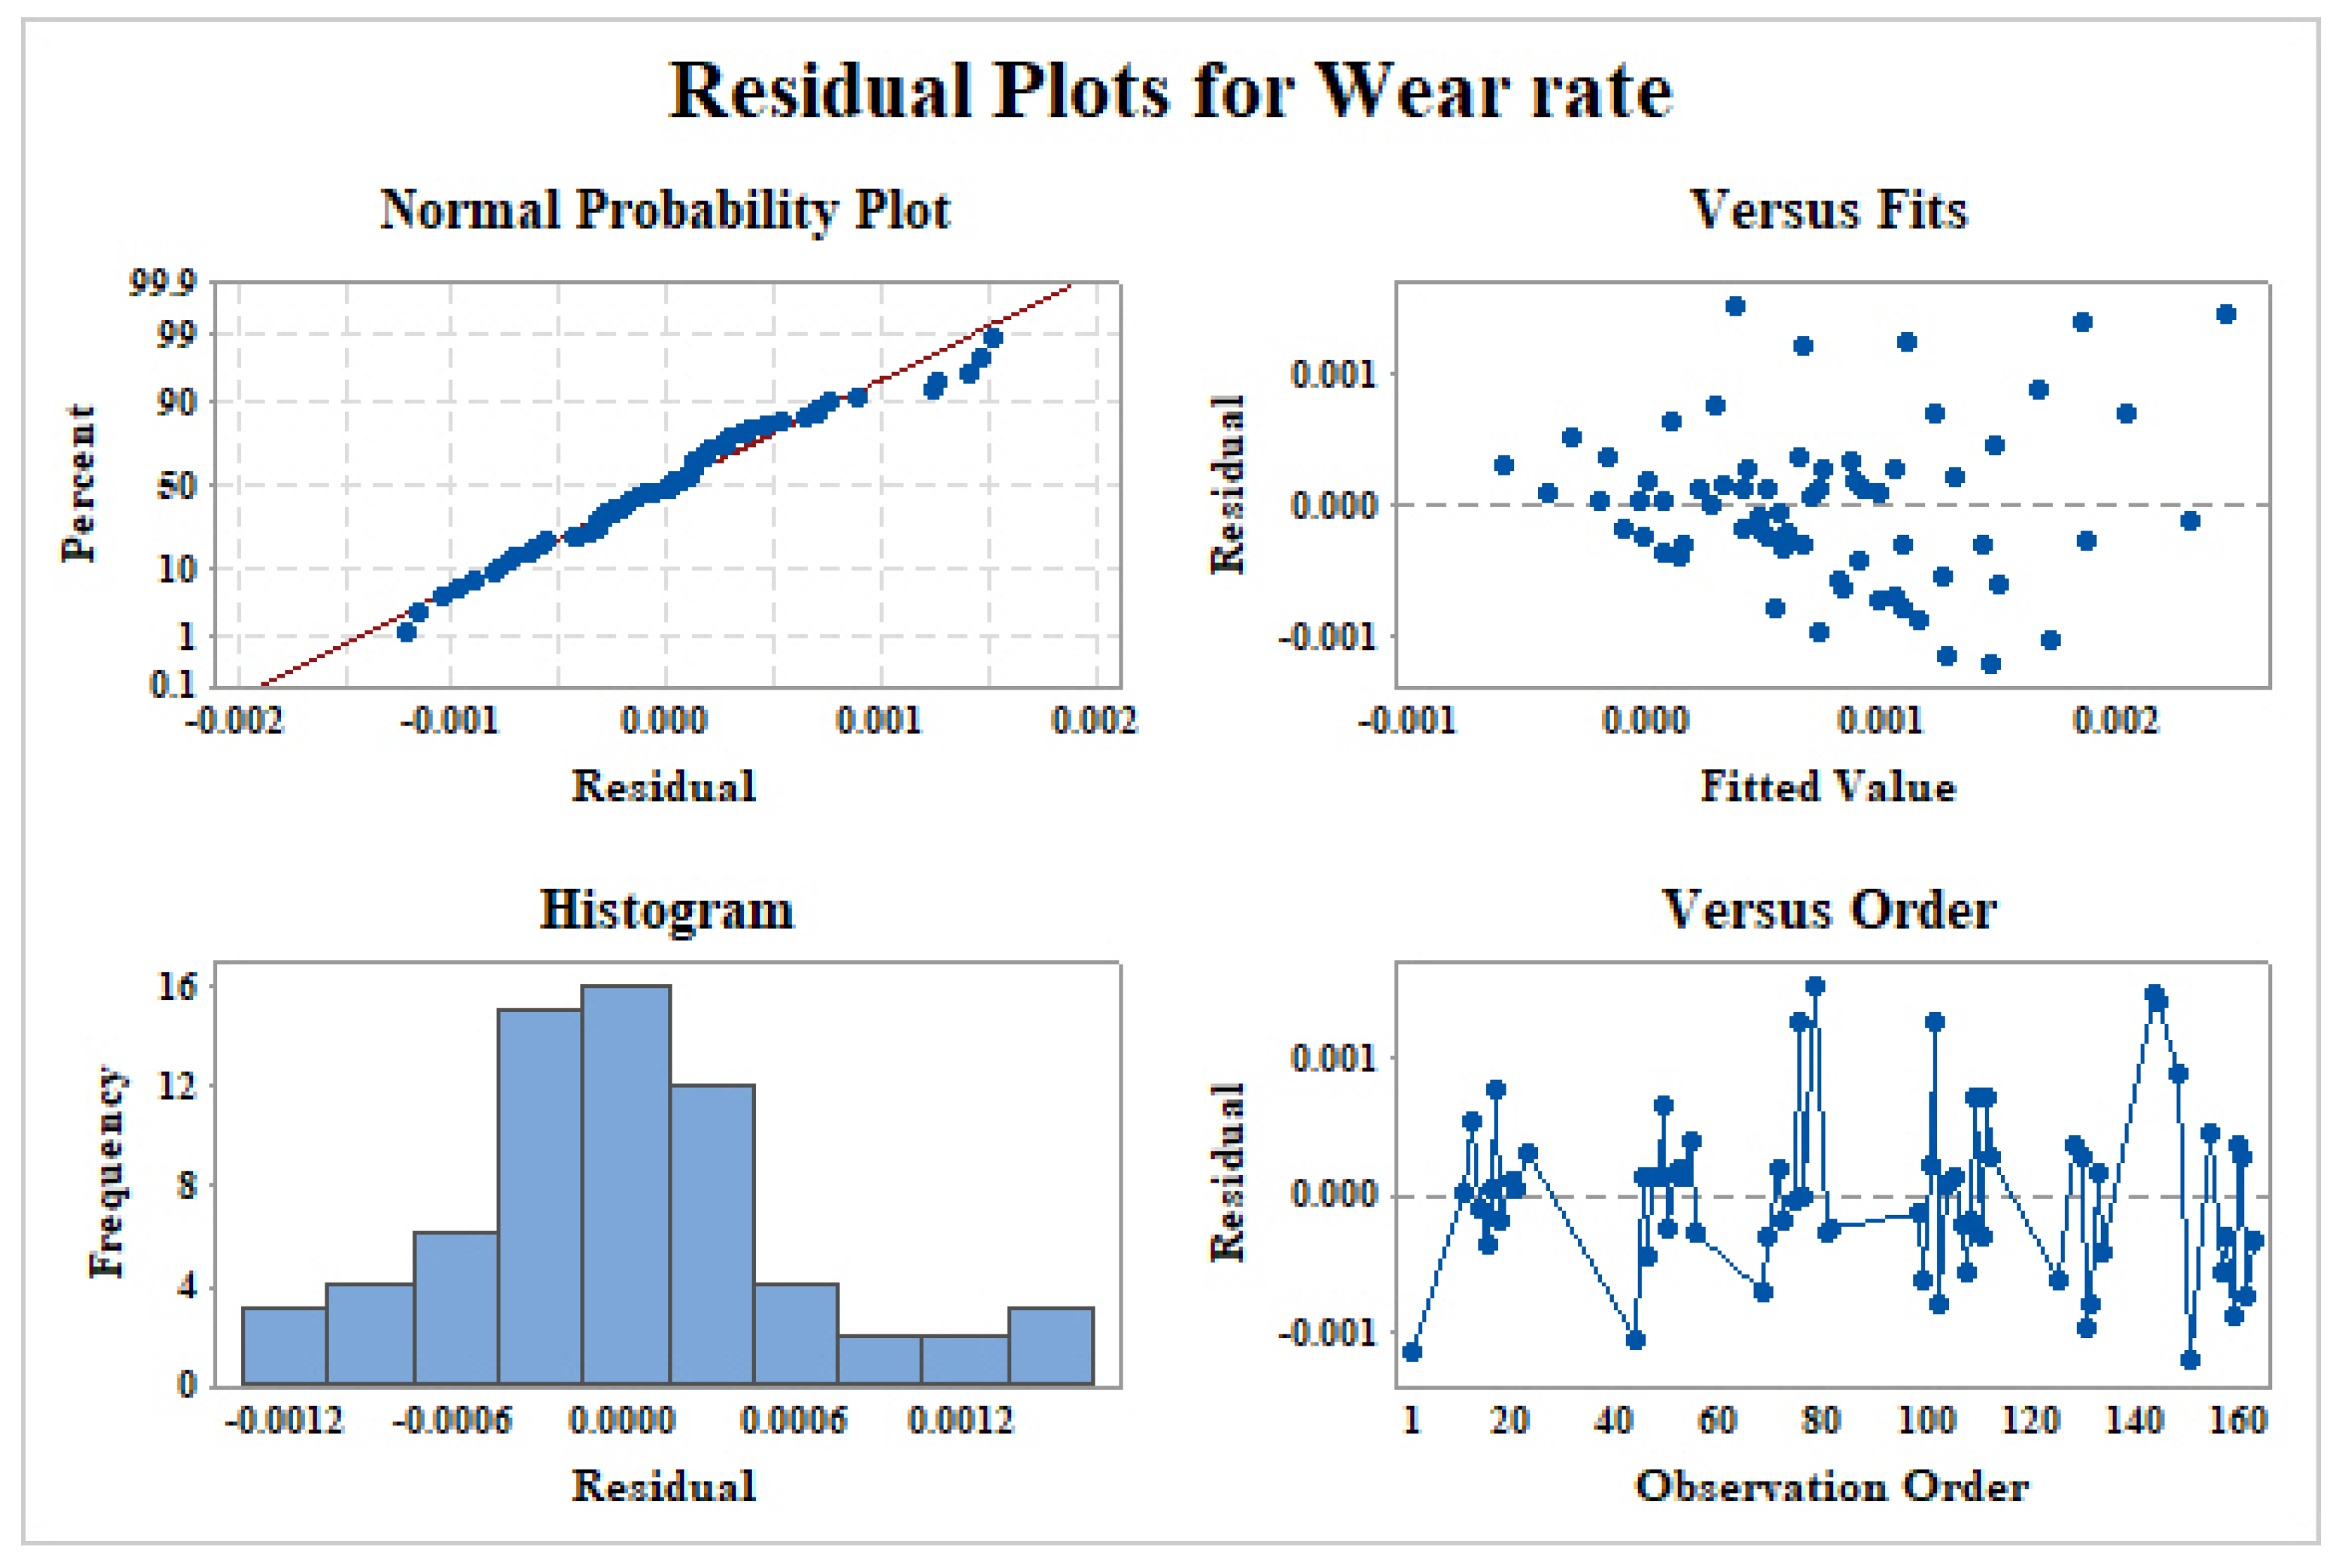
3.1.5. Wear Rate (Wr)
Finally, the wear rate equation is reported in Equation (5) and the constant values are reported in Table 6.
Figure 11 highlights a normal distribution of the data. The distribution is close to a straight line and there are some outliers, which were not included in the calculation of the model.
Based on the obtained results, an overall evaluation of the burnishing parameters and their effects on surface integrity can be performed.
In particular, based on the obtained data, a combination of process parameters that allows us to obtain superior results is found.
The strain hardening capability of the material under investigation plays a crucial role in explaining the obtained results. In fact, the effectiveness in strain hardening the material when cryogenic cooling is applied is evident from the hardness and affected layer results, together with the effect due to an increased surface contact when a larger radius and deep process are employed. From the other side, having a cooler process means reducing the capability of the roughness profile to be smoothed so that MQL offers, even if to a lesser extent, better results in terms of roughness.
4. Model Validation
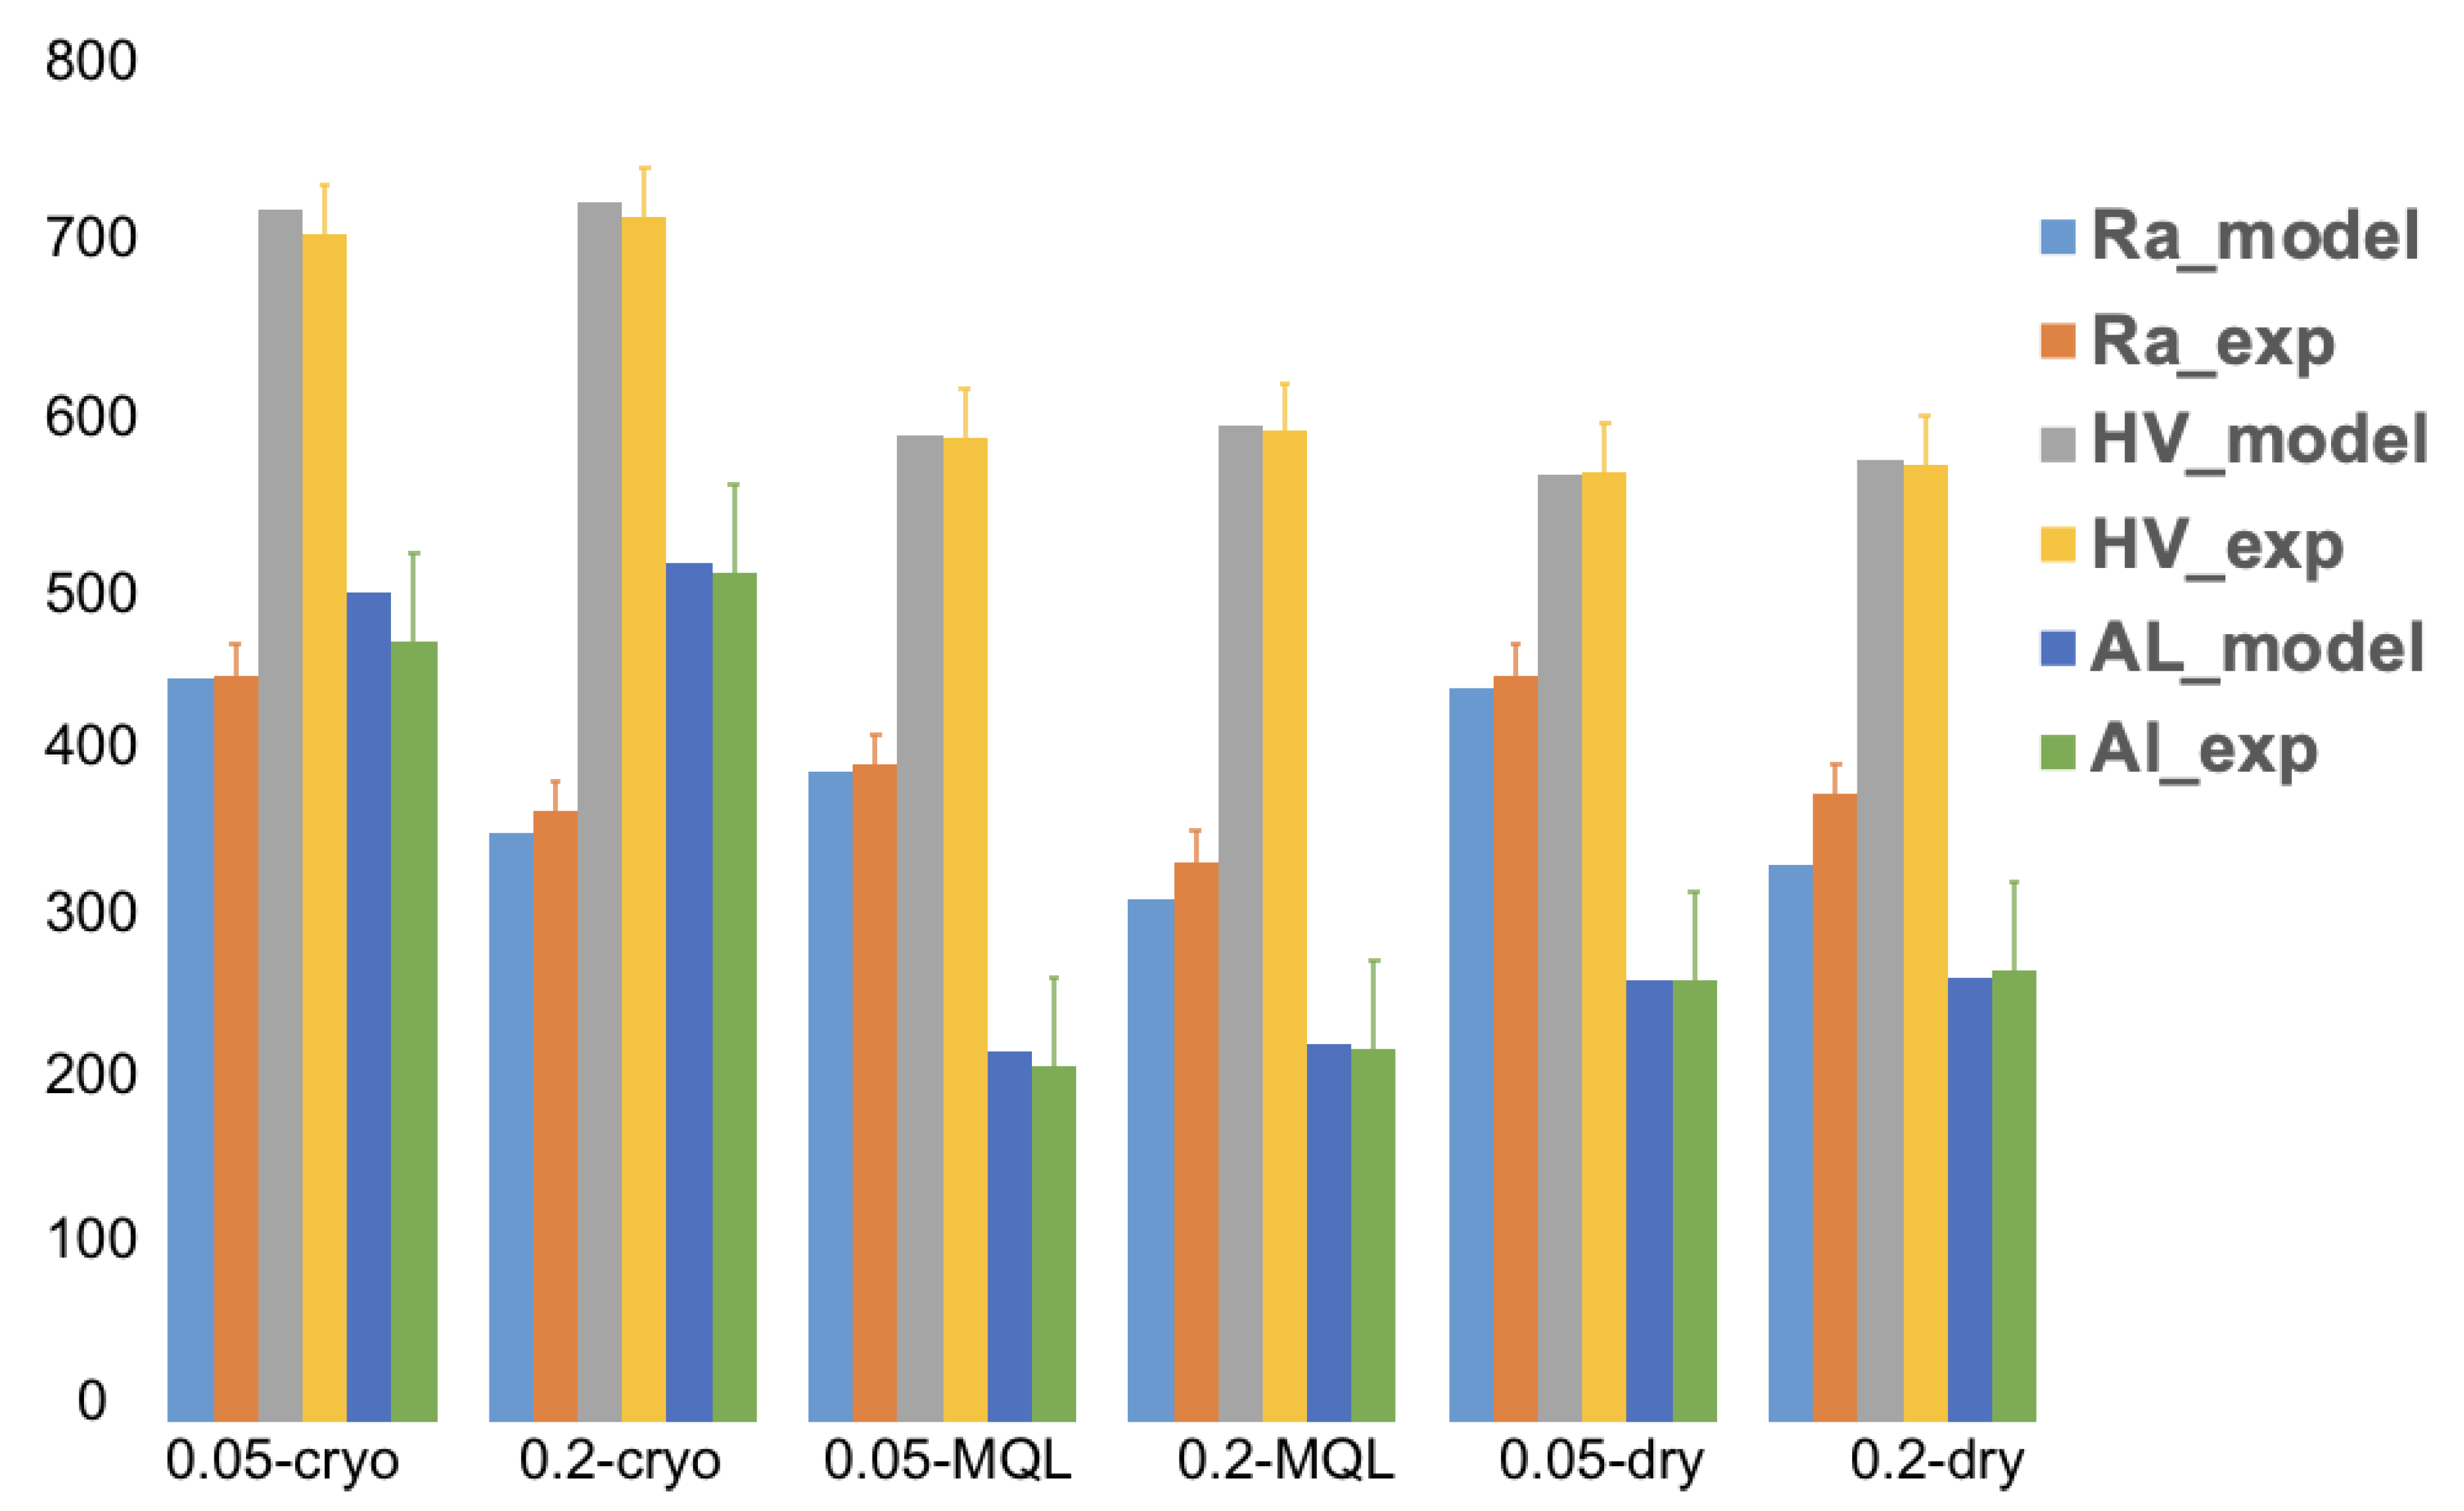
A further set of experimental data was used to validate the models presented in the previous section in order to verify the reliability of the results. Thus, as reported in Table 7, a total set of six experimental datasets was employed to verify the models.
Thus, experimental versus models are plotted together in Figure 12 for all the validation sets.
As is possible to see from the graphs, a very good agreement is achieved when predicting the surface integrity variables for the new set so the model can be successfully employed when planning burnishing experiments for the same material and tool.
Additionally, the models are able to link the process parameters to the burnishing force that is, usually, an input variable leading, consequently, to the loss of important information about the relationship between process parameters and surface quality. The overall error is always contained so the model prediction is sufficiently reliable.
5. Conclusions
This paper presents a deep study of the influence of burnishing process parameters on the surface integrity of Ti-6Al-4V titanium alloy. In particular, models for surface integrity parameters were developed. It is important to underline that the obtained results refer to the particular material involved in the process together with the geometry of the burnishing tool. However, some general conclusions can be still be drawn, helping the manufacturer to distinguish the effects of the different parameters on the desired product conditions. In particular, based on the obtained data, cryogenic conditions, together with the coated tools, led to the best surface hardness and depth of the affected layer, while MQL conditions with coated tools led to a better roughness value.
The regression analysis helps to guide the manufacturer through the parameter’s combinations, leading to a better surface quality, based on the specific needs. In particular, the developed model fit the obtained results well, helping to better specify the effects of the single process parameters on the output variables. A very good agreement between models and experiments is verified. Overall, cryogenic conditions, together with the coated tools, led to the best surface hardness, which reached a value of 956 HV0.1 when burnishing at 200 m/min and 0.3 mm of DoB with 5 mm of tool radius. The same parameters were verified to be the best combination to achieve a lower wear rate (1.7 × 10⁻⁴ mm3/N/m) and a deeper affected layer (640 μm). On the contrary, the MQL lubricant condition, together with the coated tools, led to the best surface roughness value (0.14 μm). Thus, the presented work offers a useful tool to define an operational window for burnishing Ti-6Al-4V according to the specific needs. In fact, based on the presented evaluation, the user can select the parameters that drastically decrease the surface roughness, increase hardness, etc.
Author Contributions
Author Contributions: Conceptualization, G.R. and A.D.P.; methodology, G.R. and L.F. software, G.R., S.C.; validation, S.C. and L.F.; formal analysis, G.R., L.F., A.D.P., S.C.; investigation, G.R., L.F., A.D.P., S.C.; resources, A.D.P. and L.F.; data curation, G.R., S.C., L.F., A.D.P.; writing—original draft preparation, G.R.; writing—review and editing, G.R., L.F., S.C., A.D.P.; visualization, G.R., L.F., S.C., A.D.P.; supervision, L.F. and A.D.P. All authors have read and agreed to the published version of the manuscript.
Funding
This research received no external funding.
Conflicts of Interest
The authors declare no conflict of interest.
References
- Shokrani, A.; Dhokia, V.; Newman, S.T. Investigation of the effects of cryogenic machining on surface integrity in CNC end milling of Ti–6Al–4V titanium alloy. J. Manuf. Process. 2019, 21, 172–179. [Google Scholar] [CrossRef] [Green Version]
- Del Prete, A.; Primo, T.; Franchi, R. Super-Nickel Orthogonal Turning Operations Optimization. Procedia CIRP 2013, 8, 164–169. [Google Scholar] [CrossRef] [Green Version]
- Schrenk, M.; Krenn, S.; Rodríguez Ripoll, M.; Nevosad, A.; Paar, S.; Grundtner, R.; Rohm, G.; Franek, F. Statistical analysis on the impact of process parameters on tool damage during press hardening. J. Manuf. Process. 2016, 23, 222–230. [Google Scholar] [CrossRef]
- Nestler, A.; Schubert, A. Roller Burnishing of Particle Reinforced Aluminium Matrix Composites. Metals 2018, 8, 95. [Google Scholar] [CrossRef] [Green Version]
- Uddin, M.S.; Hall, C.; Hooper, R.; Charrault, E.; Murphy, P.; Santos, V. Finite Element Analysis of Surface Integrity in Deep Ball-Burnishing of a Biodegradable AZ31B Mg Alloy. Metals 2018, 8, 136. [Google Scholar] [CrossRef] [Green Version]
- Swirad, S. Surface texture characterization of alpha-beta titanium alloy (Ti6Al4V) after hydrostatic burnishing. MATEC Web Conf. 2018, 189, 01001. [Google Scholar] [CrossRef]
- Jerez-Mesa, R.; Landon, R.Y.; Travieso-Rodriguez, J.A.; Dessein, G.; Lluma-Fuentes, J.; Wagner, V. Topological surface integrity modification of AISI 1038 alloy after vibration-assisted ball burnishing. Surf. Coat. Technol. 2018, 319, 364–377. [Google Scholar] [CrossRef] [Green Version]
- Avilés, R.; Albizuri, J.; Rodríguez, A.; De Lacalle, L.L. Influence of low-plasticity ball burnishing on the high-cycle fatigue strength of medium carbon AISI 1045 steel. Int. J. Fatigue 2013, 55, 230–244. [Google Scholar] [CrossRef]
- Randjelovic, S.; Tadic, B.; Todorovic, P.M.; Vukelic, D.; Miloradovic, D.; Radenkovic, M.; Tsiafis, C. Modelling of the ball burnishing process with a high-stiffness tool. Int. J. Adv. Manuf. Technol. 2015, 81, 1509–1518. [Google Scholar] [CrossRef]
- Srinivasa Rao, D.; Suresh Hebbar, H.; Komaraiah, M. Surface Hardening of High-Strength Low Alloy Steels (HSLA) Dual-Phase Steels by Ball Burnishing Using Factorial Design. J. Mater. Manuf. Process. 2007, 22, 825–829. [Google Scholar] [CrossRef]
- El-Taweel, T.A.; El-Axir, M.H. Analysis and optimization of the ball burnishing process through the Taguchi technique. Int. J. Adv. Manuf. Technol. 2009, 41, 301–310. [Google Scholar] [CrossRef]
- Jerez-Mesa, R.; Travieso-Rodríguez, J.A.; Landon, Y.; Dessein, G.; Lluma-Fuentes, J.; Wagner, V. Comprehensive analysis of surface integrity modification of ball-end milled Ti-6Al-4V surfaces through vibration-assisted ball burnishing. J. Mater. Process. Technol. 2019, 267, 230–240. [Google Scholar] [CrossRef]
- Gomez-Gras, G.; Travieso-Rodriguez, J.A.; Gonzalez-Rojas, H.A.; Nápoles-Alberro, A.; Carrillo, F.J.; Dessein, G. Study of a ball burnishing vibration-assisted process. Proc. Inst. Mech. Eng. B: J. Eng. 2015, 229, 172–177. [Google Scholar] [CrossRef] [Green Version]
- Franchi, R.; Del Prete, A.; Umbrello, D. Inverse analysis procedure to determine flow stress and friction data for finite element modeling of machining. Int. J. Mater. Form. 2017, 10, 685–695. [Google Scholar] [CrossRef]
- Revankar, G.D.; Shetty, R.; Rao, S.S.; Gaitonde, V.N. Analysis of surface roughness and hardness in ball burnishing of titanium alloy. Measurement 2014, 58, 256–268. [Google Scholar] [CrossRef]
- Chomienne, V.; Valiorgue, F.; Rech, J.; Verdu, C. Influence of ball burnishing on residual stress profile of a 15-5PH stainless steel. CIRP J. Manuf. Sci. Technol. 2016, 13, 90–96. [Google Scholar] [CrossRef]
- Tang, J.; Luo, H.; Qi, Y.; Xu, P.; Ma, S.; Zhang, Z.; Ma, Y. The effect of cryogenic burnishing on the formation mechanism of corrosion product film of Ti-6Al-4V titanium alloy in 0.9% NaCl solution. Surf. Coat. Technol. 2018, 345, 123–131. [Google Scholar] [CrossRef]
- Rodríguez, A.; López de Lacalle, L.N.; Celaya, A.; Lamikiz, A.; Albizuri, J. Surface improvement of shafts by the deep ball-burnishing technique. Surf. Coat. Technol. 2012, 206, 2817–2824. [Google Scholar] [CrossRef]
- Yilmaz, H.; Sadeler, R. Impact wear behavior of ball burnished 316L stainless steel. Surf. Coat. Technol. 2019, 363, 369–378. [Google Scholar] [CrossRef]
- Revankar, G.D.; Shetty, R.; Rao, S.S.; Gaitonde, V.N. Wear resistance enhancement of titanium alloy (Ti–6Al–4V) by ball burnishing process. J. Mater. Res. Technol. 2017, 6, 13–32. [Google Scholar] [CrossRef] [Green Version]
- Nguyen, T.T.; Le, X.B. Optimization of interior roller burnishing process for improving surface quality. J. Mater. Manuf. Process. 2018, 33, 1233–1241. [Google Scholar] [CrossRef]
- Hassan, A.M.; Al-Wahhab, O.M.A. Surface characteristics of some roller burnished non-ferrous components. J. Mater Manuf. Process. 1998, 13, 505–515. [Google Scholar] [CrossRef]
- Amini, S.; Bagheri, A.; Teimouri, R. Ultrasonic-assisted ball burnishing of aluminum 6061 and AISI 1045 steel. J. Mater. Manuf. Process. 2018, 33, 1250–1259. [Google Scholar] [CrossRef]
- García-Granada, A.A.; Gomez-Gras, G.; Jerez-Mesa, R.; Travieso-Rodriguez, J.A.; Reyes, G. Ball-burnishing effect on deep residual stress on AISI 1038 and AA2017-T4. J. Mater. Manuf. Process. 2017, 32, 1279–1289. [Google Scholar] [CrossRef]
- Sachin, B.; Narendranath, S.; Chakradhar, D. Effect of working parameters on the surface integrity in cryogenic diamond burnishing of 17-4 PH stainless steel with a novel diamond burnishing tool. J. Manuf. Process. 2019, 38, 564–571. [Google Scholar] [CrossRef]
- Khalilpourazary, S.; Salehi, J. How alumina nanoparticles impact surface characteristics of Al7175 in roller burnishing process. J. Manuf. Process. 2019, 39, 1–11. [Google Scholar] [CrossRef]
- Rotella, G.; Rinaldi, S.; Filice, L. Roller burnishing of Ti6Al4V under different cooling/lubrication conditions and tool design: Effects on surface integrity. Int. J. Adv. Manuf. Technol. 2020, 106, 431–440. [Google Scholar] [CrossRef]
- Caudill, J.; Schoop, J.; Jawahir, I.S. Producing sustainable nanostructures in Ti-6Al-4V alloys for improved surface integrity and increased functional life in aerospace applications by cryogenic burnishing. Proc. CIRP 2019, 80, 120–125. [Google Scholar] [CrossRef]
- Caudill, J.; Huang, B.; Arvin, C.; Schoop, J.; Meyer, K.; Jawahir, I.S. Enhancing the surface integrity of Ti-6Al-4V alloy through cryogenic burnishing. Proc. CIRP 2014, 13, 243–248. [Google Scholar] [CrossRef] [Green Version]
Figure 1.
Tool design (a) and burnishing setup (b) for the experimental campaign.

Figure 2.
Main effects plot for all the evaluated process inputs and outputs: R (mm), v (m/min), DoB (mm).
Figure 2.
Main effects plot for all the evaluated process inputs and outputs: R (mm), v (m/min), DoB (mm).


Figure 3.
Residual plots for roughness.

Figure 4.
Roughness prediction for selected cases.

Figure 5.
Hardness prediction for selected cases.

Figure 6.
Residual plots for hardness.

Figure 7.
Residual plots for affected layer.

Figure 8.
Model prediction of affected layer Al vs. experiments.

Figure 9.
Model prediction for forces vs. experiments.

Figure 10.
Residual plots for forces.

Figure 11.
Residual plots for wear rate.

Figure 12.
Validation data for numerical vs. experimental results: DoB (mm) on x axis; Ra (µm × 103), HV0.1, AL (µm).
Figure 12.
Validation data for numerical vs. experimental results: DoB (mm) on x axis; Ra (µm × 103), HV0.1, AL (µm).


Table 1.
Design of experiments for burnishing Ti-6Al-4V alloy.
| Factors | Level 1 | Level 2 | Level 3 |
|---|---|---|---|
| Lubricant/coolant Lc | Dry | MQL | Cryogenic |
| Burnishing depth (mm) DoB | 0.1 | 0.3 | 0.5 |
| Burnishing speed (m/min) v | 50 | 100 | 200 |
| Roller radius (mm) R | 1 | 2.5 | 5 |
| Tool condition C | coated | uncoated | - |
Table 2.
Values for roughness constant C in varying lubro/cooling and coating conditions.
| Dry a/b/c/d | MQL a/b/c/d | Cryogenic a/b/c/d | |
|---|---|---|---|
| Coated | 0.95/0.2/1.6 × 10−3/1.1 | 0.9/0.2/1.1 × 10−3/1 | 1/0.2/1.7 × 10−3/0.9 |
| Uncoated | 1.6/0.3/1.810−3/1.4 | 1.4/0.3/1.310−3/1.2 | 1.65/0.3/1.8 × 10−3/1.2 |
Table 3.
Values for hardness constants in varying lubro/cooling and coating conditions.
| Dry a/b/c/d | MQL a/b/c/d | Cryogenic a/b/c/d | |
|---|---|---|---|
| Coated | 554.1/14.8/0.9/63.2 | 574.1/13.3/0.9/82.1 | 703.9/10.1/0.8/86.4 |
| Uncoated | 531.9/15.9/0.9/71.4 | 522.6/14.4/0.8/90.3 | 579.5/11.2/0.8/94.6 |
Table 4.
Values for affected layer constants in varying lubro/cooling and coating conditions.
| Dry a/b/c/d | MQL a/b/c/d | Cryogenic a/b/c/d | |
|---|---|---|---|
| Coated | 162.9/9.9/0.8/12.7 | 85.5/16.9/1.1/25 | 238.8/39.2/1.1/110.8 |
| Uncoated | 154.4/9.8/0.8/11.7 | 74.7/16.8/0.9/24 | 158/39/1.1/109.8 |
Table 5.
Values for force constants in varying lubro/cooling and coating conditions.
| Dry a/b/c/d | MQL a/b/c/d | Cryogenic a/b/c/d | |
|---|---|---|---|
| Coated | 158/−91.3/1.4/955 | 153/−86.7/2.3/884 | 84/113.1/1.8/1985 |
| Uncoated | 433/−119.2/0.3/−112 | 293/−114.6/1.2/−183 | −158/85.2/0.72/918 |
Table 6.
Values for wear rate constants in varying lubro/cooling and coating conditions.
| Dry a/b/c/d | MQL a/b/c/d | Cryogenic a/b/c/d | |
|---|---|---|---|
| Coated | 1.04 × 10⁻⁴/2.1 × 10−4/4 × 10−7/5.1 × 10−4 | 1.11 × 10⁻³/2.1 × 10−4/4 × 10−7/5.1 × 10−4 | 8.1 × 10⁻⁴/2.1 × 10−4/4 × 10−7/5.1 × 10−4 |
| Uncoated | 1.07 × 10⁻³/2.1 × 10−4/4 × 10−7/5.1 × 10−4 | 1.14 × 10⁻³/2.1 × 10−4/4 × 10−7/5.1 × 10−4 | 8.4 × 10⁻⁴/2.1 × 10−4/4 × 10−7/5.1 × 10−4 |
Table 7.
Design of experiments for results validation in burnishing Ti-6Al-4V alloy.
| Factors | Level 1 | Level 2 | Level 3 |
|---|---|---|---|
| Lubricant/coolant Lc | DRY | MQL | CRYO |
| Burnishing depth (mm) DoB | 0.05 | 0.2 | - |
| Burnishing speed (m/min) v | - | - | 100 |
| Roller radius (mm) R | - | 2.5 | - |
| Tool condition C | coated | - | - |
Publisher’s Note: MDPI stays neutral with regard to jurisdictional claims in published maps and institutional affiliations. |
© 2020 by the authors. Licensee MDPI, Basel, Switzerland. This article is an open access article distributed under the terms and conditions of the Creative Commons Attribution (CC BY) license (http://creativecommons.org/licenses/by/4.0/).
Share and Cite
MDPI and ACS Style
Rotella, G.; Caruso, S.; Del Prete, A.; Filice, L. Prediction of Surface Integrity Parameters in Roller Burnishing of Ti6Al4V. Metals 2020, 10, 1671. https://doi.org/10.3390/met10121671
AMA Style
Rotella G, Caruso S, Del Prete A, Filice L. Prediction of Surface Integrity Parameters in Roller Burnishing of Ti6Al4V. Metals. 2020; 10(12):1671. https://doi.org/10.3390/met10121671
Chicago/Turabian StyleRotella, Giovanna, Serafino Caruso, Antonio Del Prete, and Luigino Filice. 2020. "Prediction of Surface Integrity Parameters in Roller Burnishing of Ti6Al4V" Metals 10, no. 12: 1671. https://doi.org/10.3390/met10121671
Note that from the first issue of 2016, this journal uses article numbers instead of page numbers. See further details here.