
Analysis of Additional Load and Fatigue Life of Preloaded Bolts in a Flange Joint Considering a Bolt Bending Load


Faculty of Mechanical Engineering, University of Ljubljana, Askerceva 6, 1000 Ljubljana, Slovenia
*
Author to whom correspondence should be addressed.
Metals 2021, 11(3), 449; https://doi.org/10.3390/met11030449
Submission received: 31 January 2021
/
Revised: 25 February 2021
/
Accepted: 2 March 2021
/
Published: 9 March 2021
(This article belongs to the Special Issue Fatigue Life Prediction of Metallic Materials)
Abstract
:The influence of the working load on the dynamic loading of the bolt was investigated in our study for two cases of flange joints. The analytical calculation according to the Verein Deutscher Ingenieure (VDI) 2230 recommendation and the numerical analysis using the finite element method (FEM) were performed for a model of a four-bolt joint. To verify the FEM analysis, the forces in the bolts were measured during preloading and during the application of the working load on the test rig. Based on the analytical and numerical results, the influence of the working load application point on the bolt load and its fatigue life was analysed for different cases. Comparison of the results shows that the analytical method overestimates the additional bolt stresses at low working load, mainly due to the extremely large fraction of bending stress. As the working load increases, the differences between the two methods decrease, but only for the reason that the analytical method can only linearly scale the overestimated results at lower working load, and FEM analysis, on the other hand, shows a progressive increase of the additional stress in the bolt at higher working loads due to the spreading of the flange. It is also shown that a high washer significantly increases the fatigue life of the bolt for two reasons: (i) a high washer reduces the additional stress in the bolt, and (ii) the high washer shifts the critical fatigue point from the thread area to the transition of the bolt shank to the head.
1. Introduction
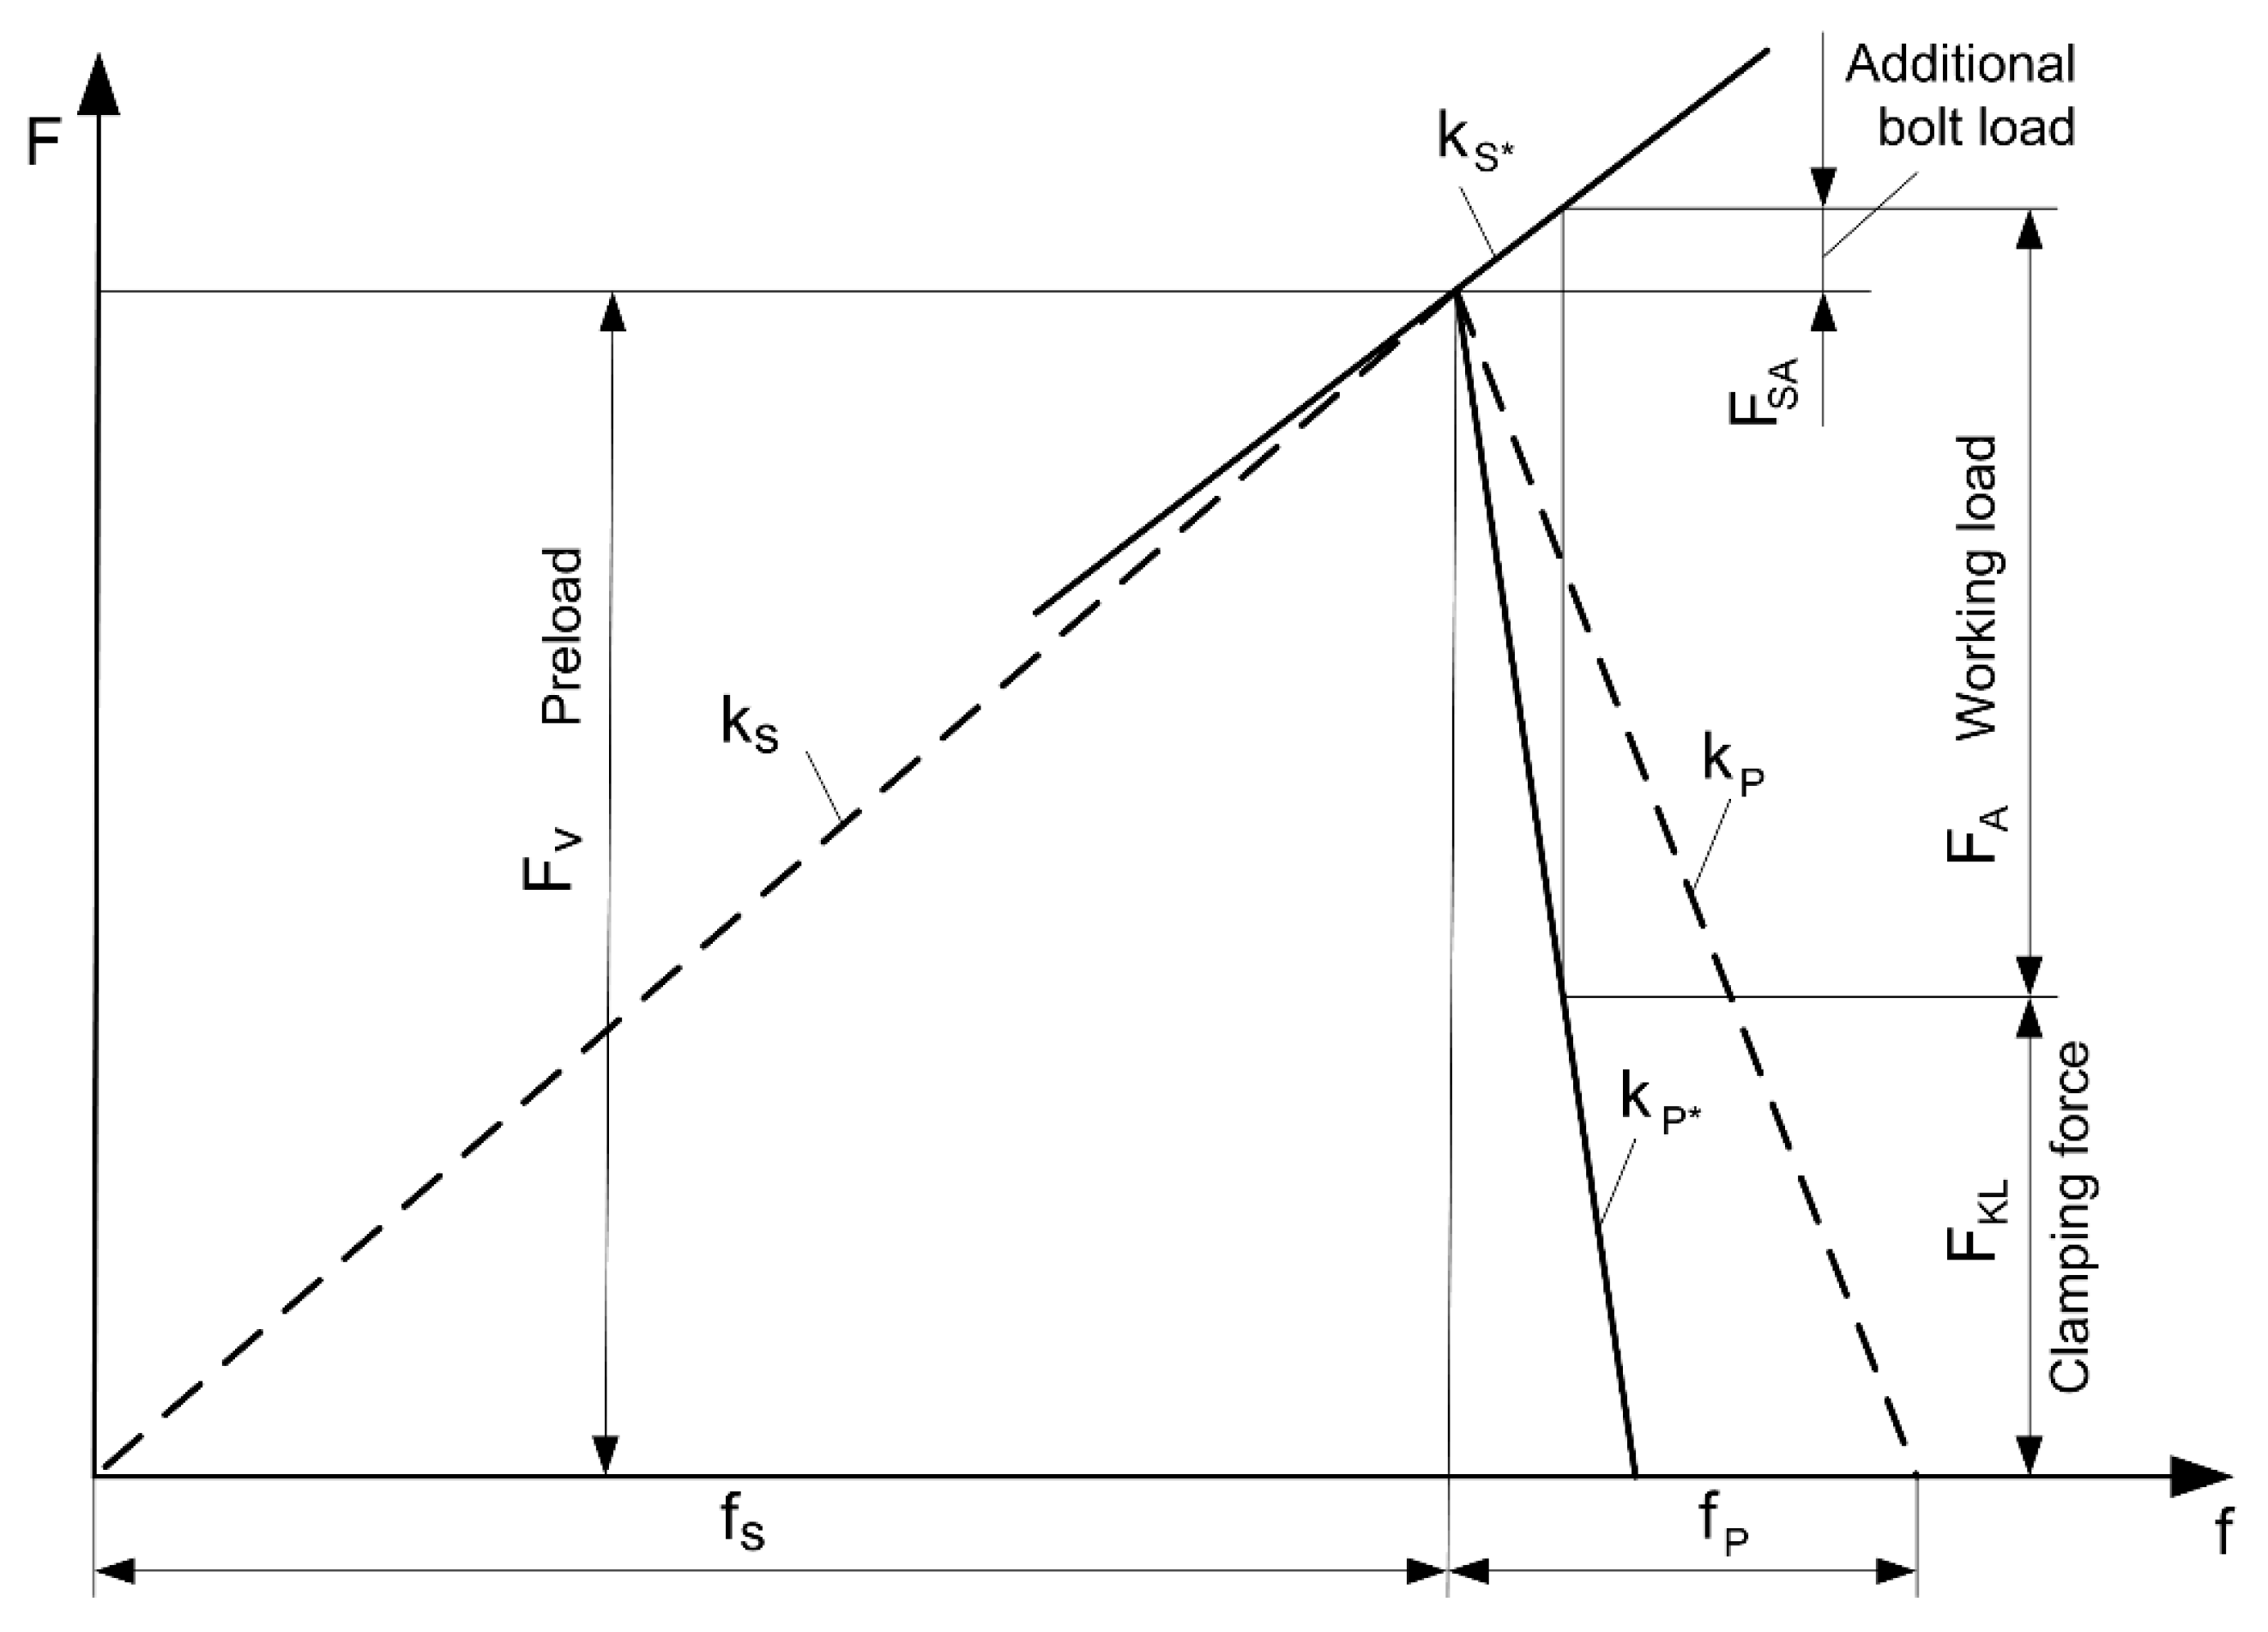
Bolts are the most commonly used machine elements for detachable joints of machine parts and elements of steel structures. Theoretical foundations of preloaded bolted joints are discussed in the publications in the field of machine elements [1,2,3]. Most bolted joints are made with several bolts, which are not evenly loaded. A case with an uneven load of bolts in a simple bracket-wall connection is described by Oman in [4]. An algorithm for calculating the force in individual bolts is given, based on numerical analysis and experiment. During assembly, the bolts are tightened to the specified torque, resulting in an axial force in the bolt and a compression between the clamping parts. The fatigue of the bolt is affected by the alternating force in the bolt and the bending moment transmitted to the bolt. By proper design of the entire bolted joint and selection of appropriate preload, the alternating force and bending moment can be significantly reduced for the same working load. The dynamic load of the bolt is influenced by the stiffness of the bolt and the clamping parts. The bolts should have the lowest possible stiffness and the clamping parts the highest possible stiffness. This effect can be seen from the force-deformation diagram shown in Figure 1. The bolt stiffness is lower the longer the bolt is and the smaller its diameter is. Long elastic bolts are used in internal combustion engines for cylinder head–engine block connection and for piston rod connection [5].
Bolted flange joints are often used in pressure vessels and piping. Bolted flange joints with gaskets are discussed in more detail in the standard [6]. For different types of gaskets, the surface pressure on the gasket is defined, which ensures sealing and prevents leakage from the pipe or pressure vessel. The required bolt preload depends on the type of gasket. Depending on the modulus of elasticity, there are hard, semi-hard and soft gaskets. The influence of a gasket on the required bolt preload is discussed in numerous papers in the scientific literature [7,8,9,10]. In addition to the load on the joint elements (flange, gasket, bolt), a leakage of a joint at different preloads is also analysed in the studies.
Bolted flange joints are also used in connections of tower segments at cableways and wind turbines. In such joints, the external load is random and is applied to individual bolts through the tower. Fatigue of mechanical elements of a wind turbine is discussed in analytical, numerical and experimental studies [11,12,13]. Ajaei and Soyoz discuss the effect of bolt preload on fatigue in a bolted joint of a wind turbine tower [14]. They considered the actual random loading of the tower due to the strength and direction of the wind as well as the loading of the individual bolts. The results of the numerical analyses show that the bending load on the bolt has a significant effect on its fatigue life.
In general, bolted flange joints of structural elements are much more critical in terms of fatigue than bolted flange joints on piping or pressure vessels. The reason for this is the design criterion. In the case of pipeline joints or pressure vessels, the main criterion is tightness, i.e., the joints are over-dimensioned from the point of view of the load-bearing capacity of the bolts. For bolted flange joints of structural elements, the criterion is the load carrying capacity of the bolts and the flange itself.
When a working load is applied to a preloaded bolted joint, the axial force in the bolt changes. Normally, the force in the bolt increases, but it can also decrease. An example where the force in the bolt decreases at certain moments is found in the joints of wind turbine towers. The ratio between additional bolt load and working load is the load factor. Cornwell [15] numerically determined load factors for different materials of clamping parts and for different shapes. Based on numerical analysis, he derived an equation to calculate the load factor. This equation applies to concentric preload and working load. However, in most practical applications, both the preload and the working load are eccentric. Therefore, this equation has very limited applicability. The concentrically loaded bolted joint was studied numerically and experimentally by Cardoso et al. [16]. Their results agree very well with the analytical results using VDI 2230 [17]. The VDI 2230 recommendation used in our analysis also provides a general analytical calculation for an eccentric load. By using a load factor, it considers a change of both the resilience during operation and the working load application point. An algorithm is derived for calculating the alternating stress in the bolt that considers the eccentricity of the preload and the working load.
The aim of our research was to determine more precisely the influence of the working load on the bolt, which depends mainly on the geometry of the bolted joint. The load factors were calculated analytically and numerically for two different cases of the geometry and two different values of the compensating insert stiffness. Standard flange dimensions with a flat contact surface were used. Low and high washers were used under the bolt head, and harder and softer inserts were used between the flanges. The alternating stress ranges in the bolt were calculated analytically and numerically for all four cases, and the fatigue life of the bolt was estimated based on these values. The results obtained were compared and the reasons for the differences are explained in Section 4. An evaluation of the suitability of each method for each case of preloaded bolted flange joints is given in the conclusion.
2. Analytical Evaluation of a Bolted Joint
2.1. Forces in a Preloaded Bolted Joint
Starting with the force-deformation diagram shown in Figure 1, we first define the basic terms used in the analyses. In the literature, different symbols are used for the same quantities. The symbols and indices in equations in this paper correspond to VDI 2230. When the bolt is preloaded with a force FV, the bolt is elongated by fS and the clamping parts shrink by fP. When the working load FA is applied, the force in the bolt increases while the pressure between the clamping parts decreases. In a special case where the working load acts at the same point as the preloading force, the stiffness of the joint during operation remains the same as during preloading. In reality, only some clamping parts are unloaded, while others are still compressed, which contributes to a flatter characteristics of the bolt kS* and a steeper characteristics of the clamping parts kP* (see Figure 1). In VDI 2230, this effect is considered by the load introduction factor. The diagram shown in Figure 1 applies to a centric load. With flange joints, the working load acts eccentrically. Therefore, the influence of the eccentricity is also taken into account in the calculations.
2.2. Shape and Dimensions of a Bolted Flange Joint
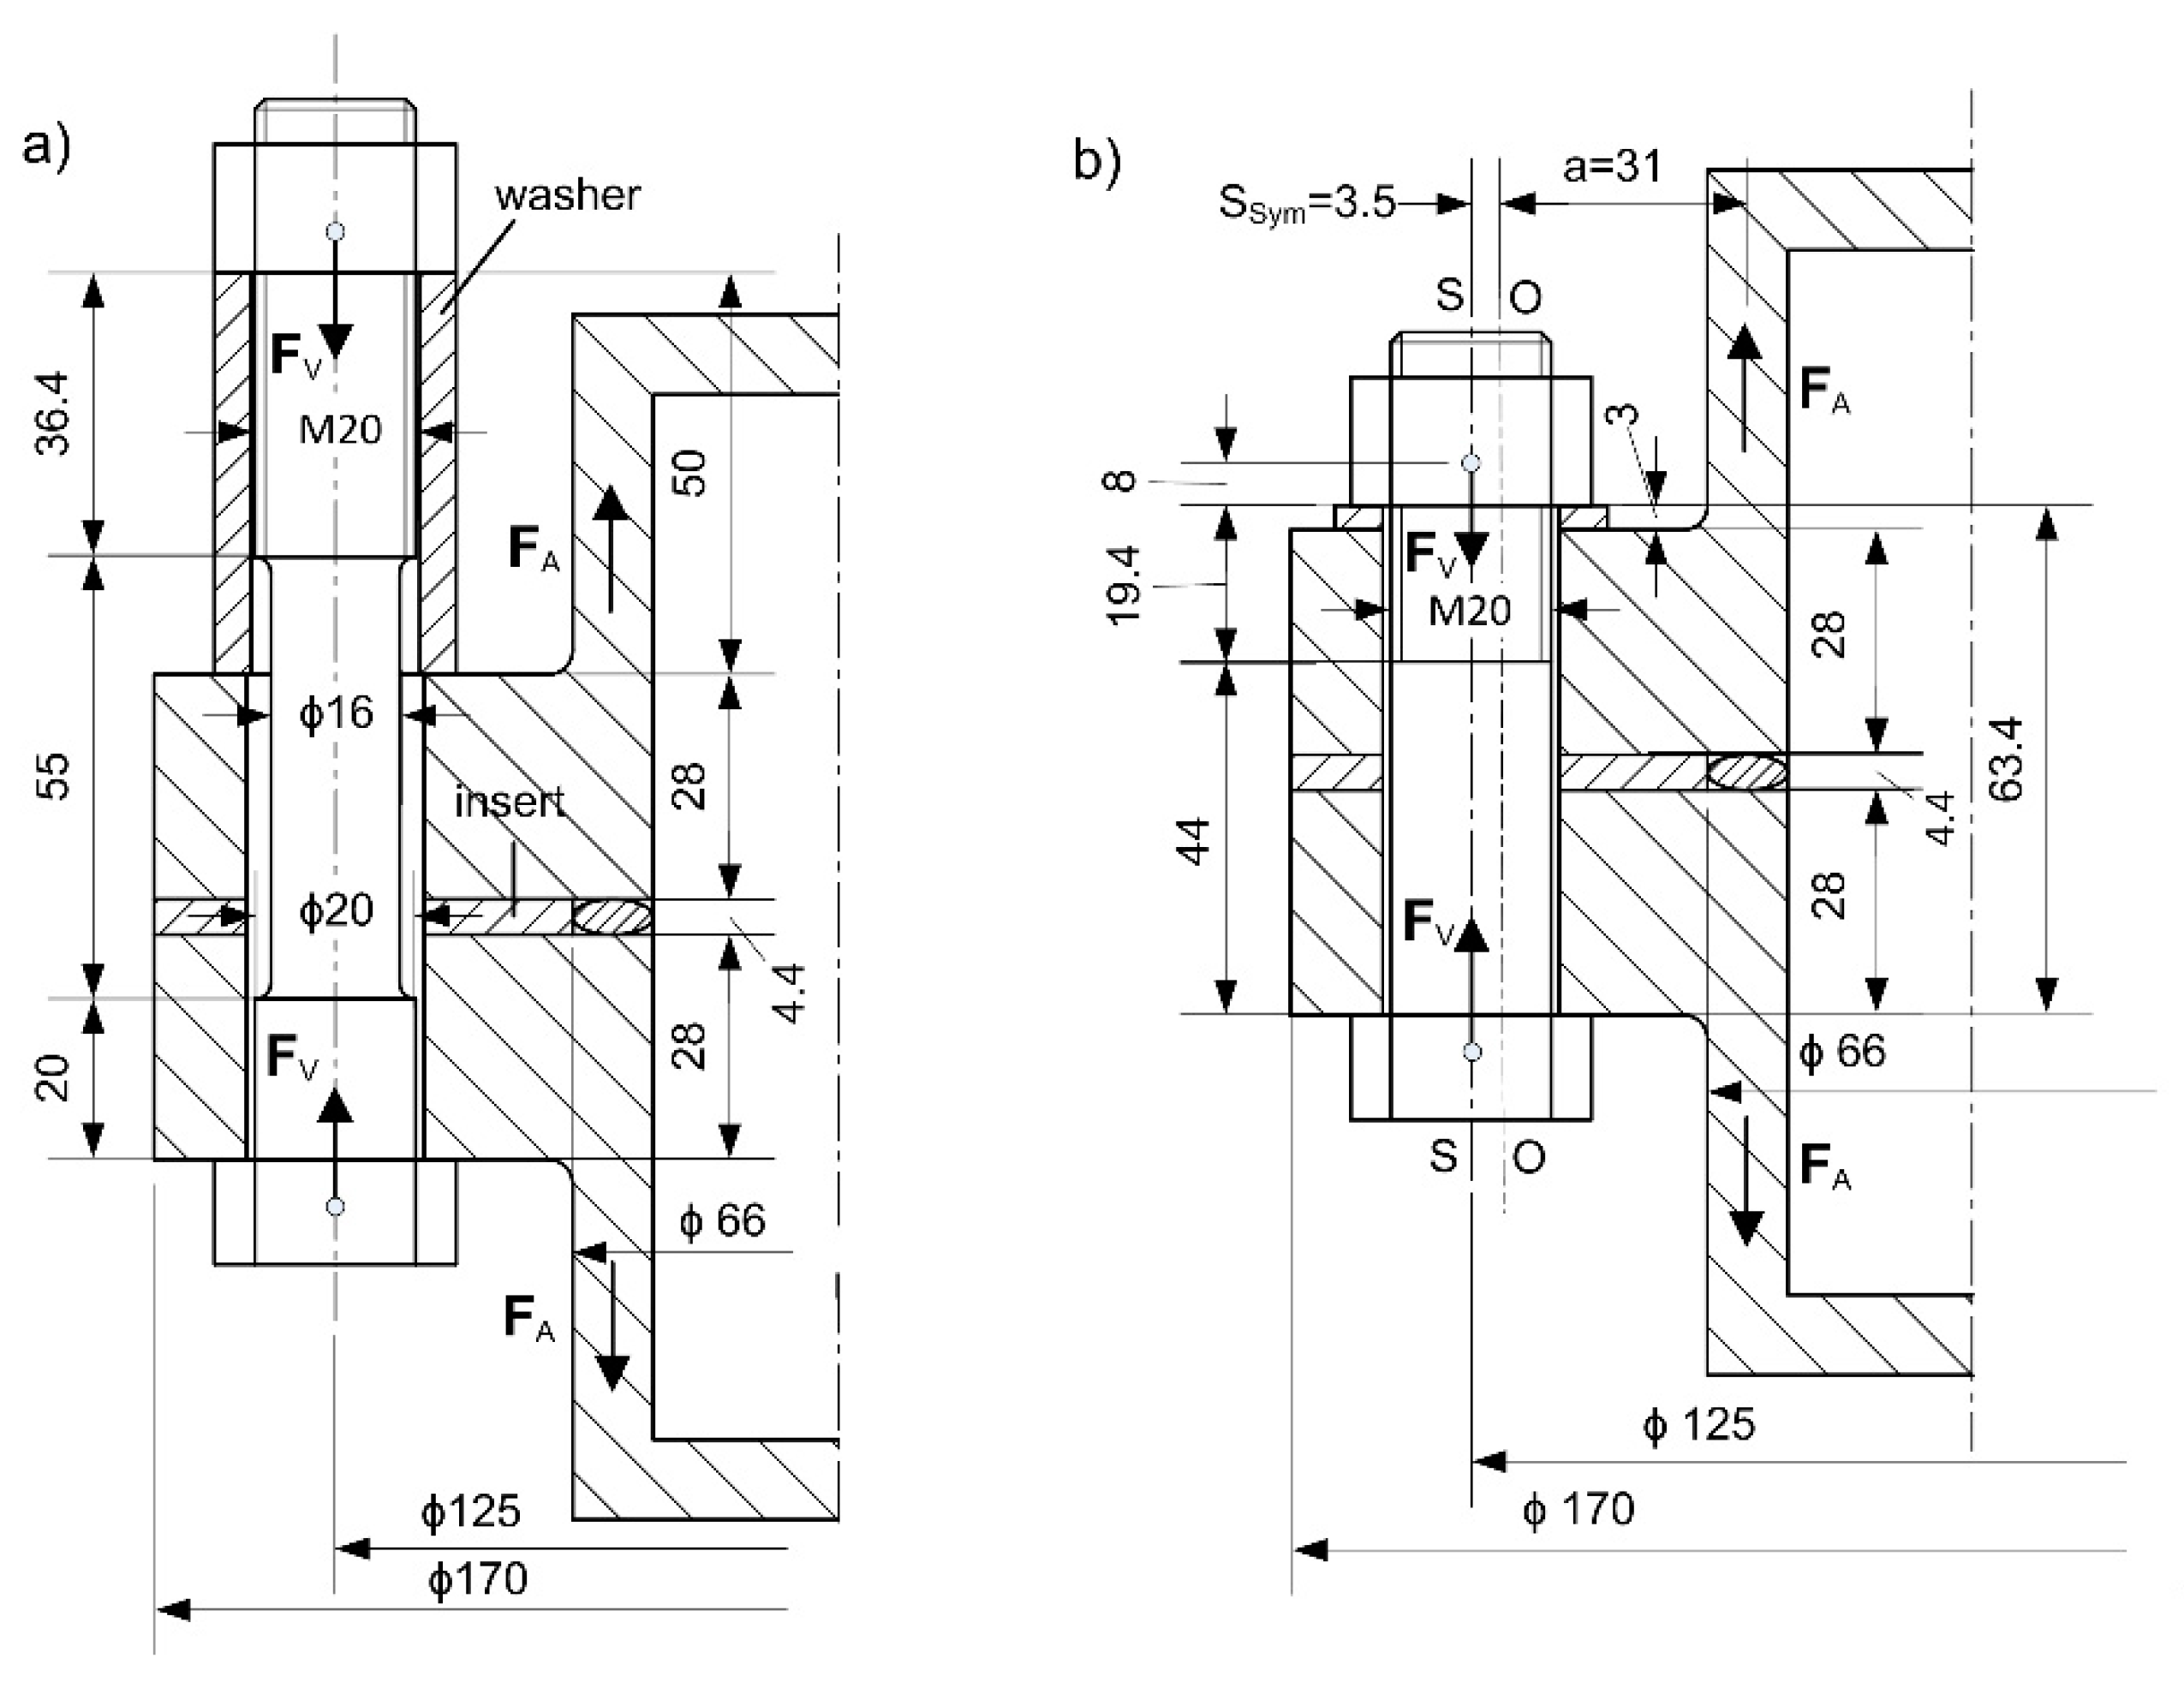
A detail of the bolted flange joint used in this study is shown in Figure 2a. The dimensions of the flange comply with standard 1092 [18] for flange joints. A spacer sleeve is inserted between the nut and the flange, which reduces both the stiffness of the bolt and the resilience of the clamping parts. There is a hard insert between the flat flanges. For comparison, the classical flange joint without a sleeve was also calculated analytically and numerically (Figure 1b). Both variants were analysed numerically and analytically also for the case of a softer insert.
From the analytical, numerical and experimental results of the considered cases, it is evident that an additional load on the bolt that is critical from the fatigue point of view occurs at relatively high working load, which requires a high pressure in the flange. The maximum allowable pressure for a standard flange that was used is 160 bar, which is significantly lower than the maximum pressure used in our study (640 bar). For standard flanges, the pressure is limited to ensure tightness, which is not the subject of this study, so a higher pressure is reasonable. Larger additional forces on the bolt occur in practice with flange joints of structural parts/beams, where the conditions are comparable to those discussed in this paper.
2.3. Resilience of Bolt and Clamping Parts
Bolts have several different cross-sections Ai with different values of stiffness ksi along their length. The bolt can be treated as several springs connected in series. The total stiffness of the bolt is calculated as:
VDI 2230 introduces bolt resilience:
The total resilience of the bolt is a sum of resilience values of the individual bolt segments. In addition to the resilience of individual parts of the shank δ1, δ2, δGew, the resilience of the bolt head δK, the resilience of the part of the bolt screwed into the nut δG and the resilience of the nut δM were also considered.
For the case considered (see Figure 2), the resilience of the long bolt is δS,HW = 3.06 × 10⁻⁶ mm/N, and the resilience of the short bolt is δS,LW = 1.53 × 10⁻⁶ mm/N.
The resilience of the clamping parts also results from the sum of the resilience values of the individual segments that are subjected to compressive stress during preloading. It is possible to precisely calculate the resilience of the sleeve with an outer diameter DA, inner diameter dh and a length lW. Long and short washers are treated as sleeves. The insert between the flanges is also treated as a short sleeve. The outside diameter of the insert is equal to the flange diameter.
It is not possible to accurately calculate the resilience of flanges analytically. In the scientific literature, several equations can be found for this purpose, mostly based on the results of numerical analyses [19,20,21,22,23,24]. Most commonly, the hollow pressure cone method with a cone angle of φ = 30° is used to determine the resilience of the clamping parts [1]. Pressure cones are also used in the VDI 2230 recommendation. Equation (5) is used to calculate the flange resilience. The first term in the numerator refers to the resilience of the cones, the second to the resilience of the segment between the cones when the cones do not meet in a common plane.
The total resilience of the clamping parts is the sum of the resilience values of the flanges δF, the insert resilience δI and the washer resilience δW.
When determining the load factor, the corrected resilience δP* and δP** are used, which also consider the eccentricity of the preload ssym and the eccentricity of the working load at a distance a. The data for the low washer case are: a = 31 mm and ssym = 3.5 mm.
In Equations (7) and (8), li represents the length of the clamping parts, IBersi is a replacement moment of inertia and EP modulus of elasticity. The modulus of elasticity of 2.1 × 10⁵ MPa was used for all steel parts and the hard insert and 2000 MPa for soft insert.
2.4. Results of the Analytical Calculation
The results of the analytical calculations for the four variants are presented in Table 1. The calculations consider both the eccentricity of the preload and the eccentricity of the working load. It is assumed that the working load acts in the middle of the pipe wall. Additional force in the bolt FSA is calculated by multiplying the working load by the load factor ϕ*en. The influence of the working load application point is considered by the load introduction factor n [17].
The stress range σabr, which has the main effect on the fatigue life of the bolt, is calculated as follows:
where, σSAbo is the upper additional stress in the bolt thread region and σSAbu the lower additional stress in the bolt thread region, respectively. If the load is eccentric, the bending load of the bolt is also important. The total additional stress considering both the tensile and bending stress σSAb is then calculated by Equation (12), where the first part of the equation is the tensile stress σSAt and the second part is the bending stress σSab* in the bolt.
The bending resilience of the clamping parts βP and the bolt βS depend on the length of the segments lSi − lPi, the Young’s modulus ES − EPi and the moment of inertia of the segment ISi. For the clamping parts, the moment of inertia changes with height, so a replacement moment of inertia IBersi is introduced into the calculations [18]. For M20 standard bolt, the stress cross section is AS = 245 mm2 and the moment of resistance of the stress cross section of the bolt thread is WS = 540 mm3.
Table 1 shows the results of the analytical calculation at a pressure of 160 bar or a working force per bolt of 13.6 kN. In the analytical calculation, a number of parameters occur that are estimated and cannot be determined exactly (n, a, ssym, IBers). For example, there are several different determination approaches for the calculation of the resilience of clamping parts. Nevertheless, the calculated stresses are a good indicator of the additional bolt stress due to the working load. The fraction of stress due to the additional force in the bolt is very small in all cases considered, much smaller than the fraction of bending stress. For comparison, the theoretical values for the centric working load and the load introduction factor of n = 1 are given. If the hard insert is replaced by a soft one, which has a modulus of elasticity about 100× smaller, the stress range increases by about 2.5×. With a long washer, both the resilience of the bolt and the resilience of the clamping parts are higher. The total stress range is about half that of a low washer. Since the washer does not deflect and it does not contribute to the flange stiffness (see Figure 9), it was not considered in the calculation of the replacement moment of inertia. The load introduction factor n was determined according to the recommendation of VDI 2230 with regard to the position of the working load application point along the height of the clamping parts and the eccentricity. The analytical calculation with all the details can be found in the Supplementary Material as an Excel workbook.
3. Numerical Analysis
Accurate calculation of the stress-strain state in flange joints is extremely difficult, regardless of whether the joint is loaded symmetrically or asymmetrically (e.g., in bending), because in most cases, even with symmetrical loading, the bending load acts on the bolts in addition to the axial load due to the elastic flange. For this reason, when using analytical methods, it is not possible to properly account for all influencing parameters to obtain a completely accurate description of the stress-strain conditions in an individual bolt or the entire joint. The finite element method, on the other hand, can take all relevant parameters into account. For this reason, the finite element (FE) method has been increasingly used to simulate flange joints in recent years [25,26,27,28,29,30,31,32], and the results have been used to improve analytical models, among others. FE analysis is also used in this paper as a reference method to determine the realistic bolt load in the discussed flange joint. Comparing the results of the FE analysis with the results of the currently most developed analytical methods and tests allows the evaluation of the analytical methods and the possibility to show their limitations.
3.1. Finite Elements Model
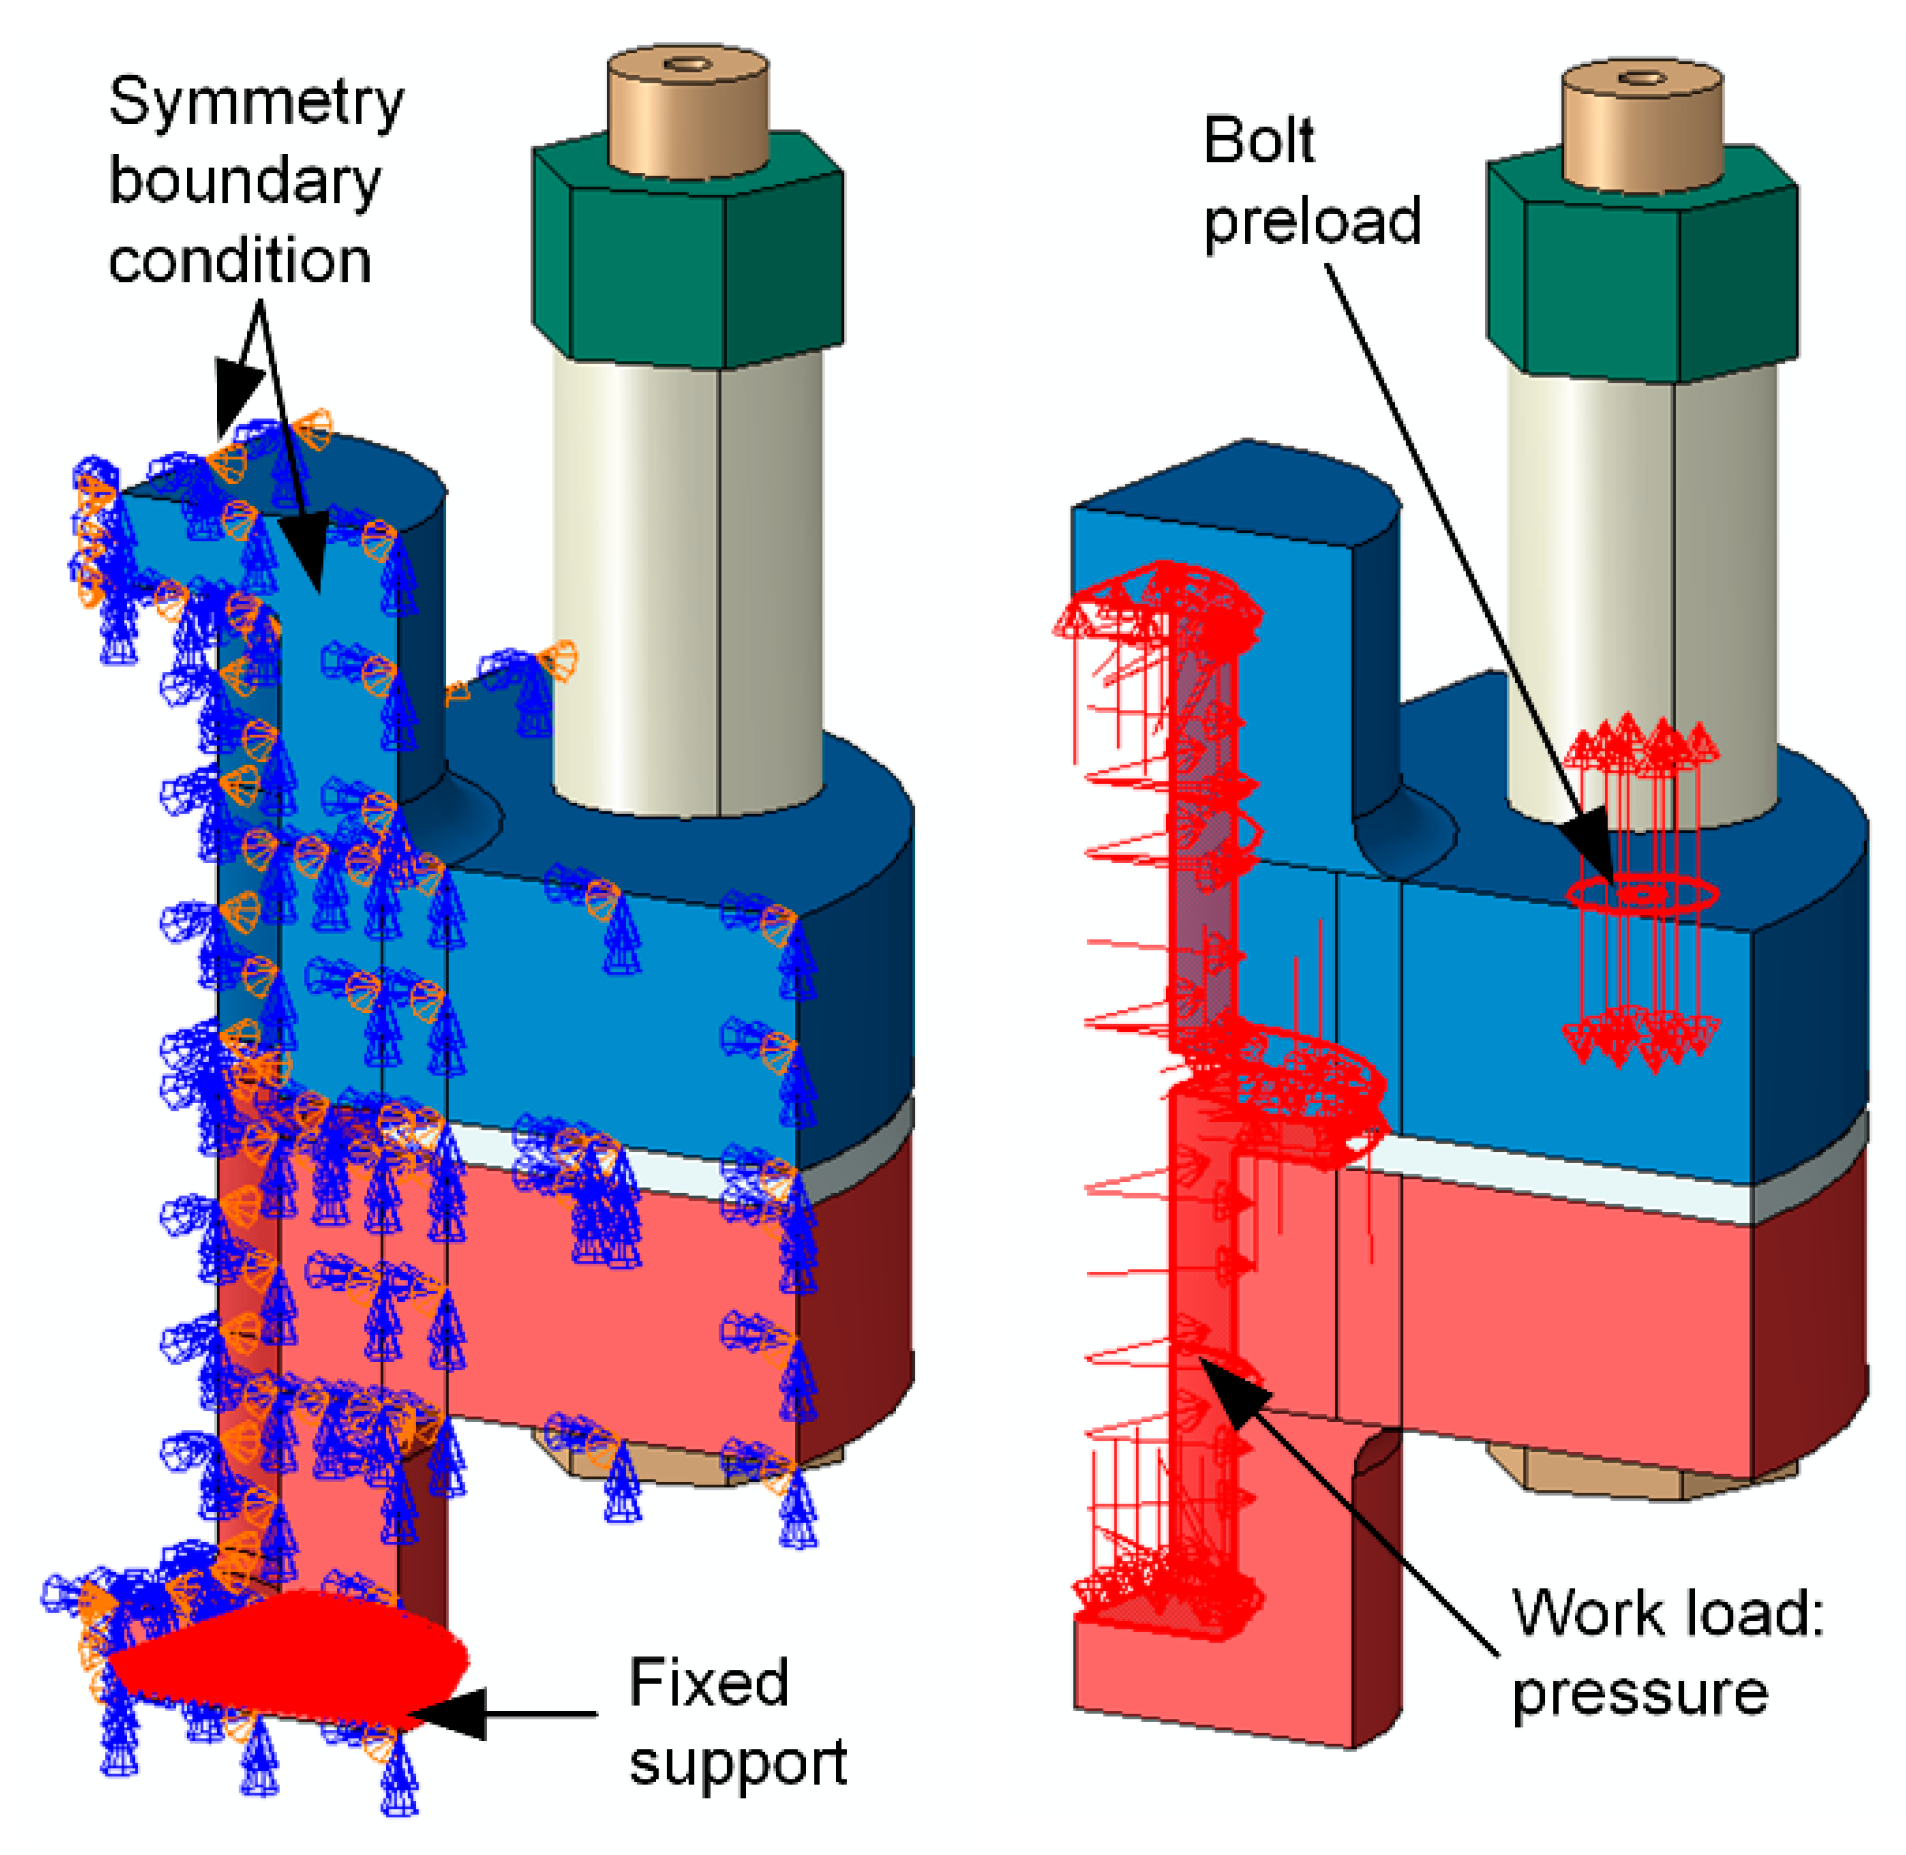
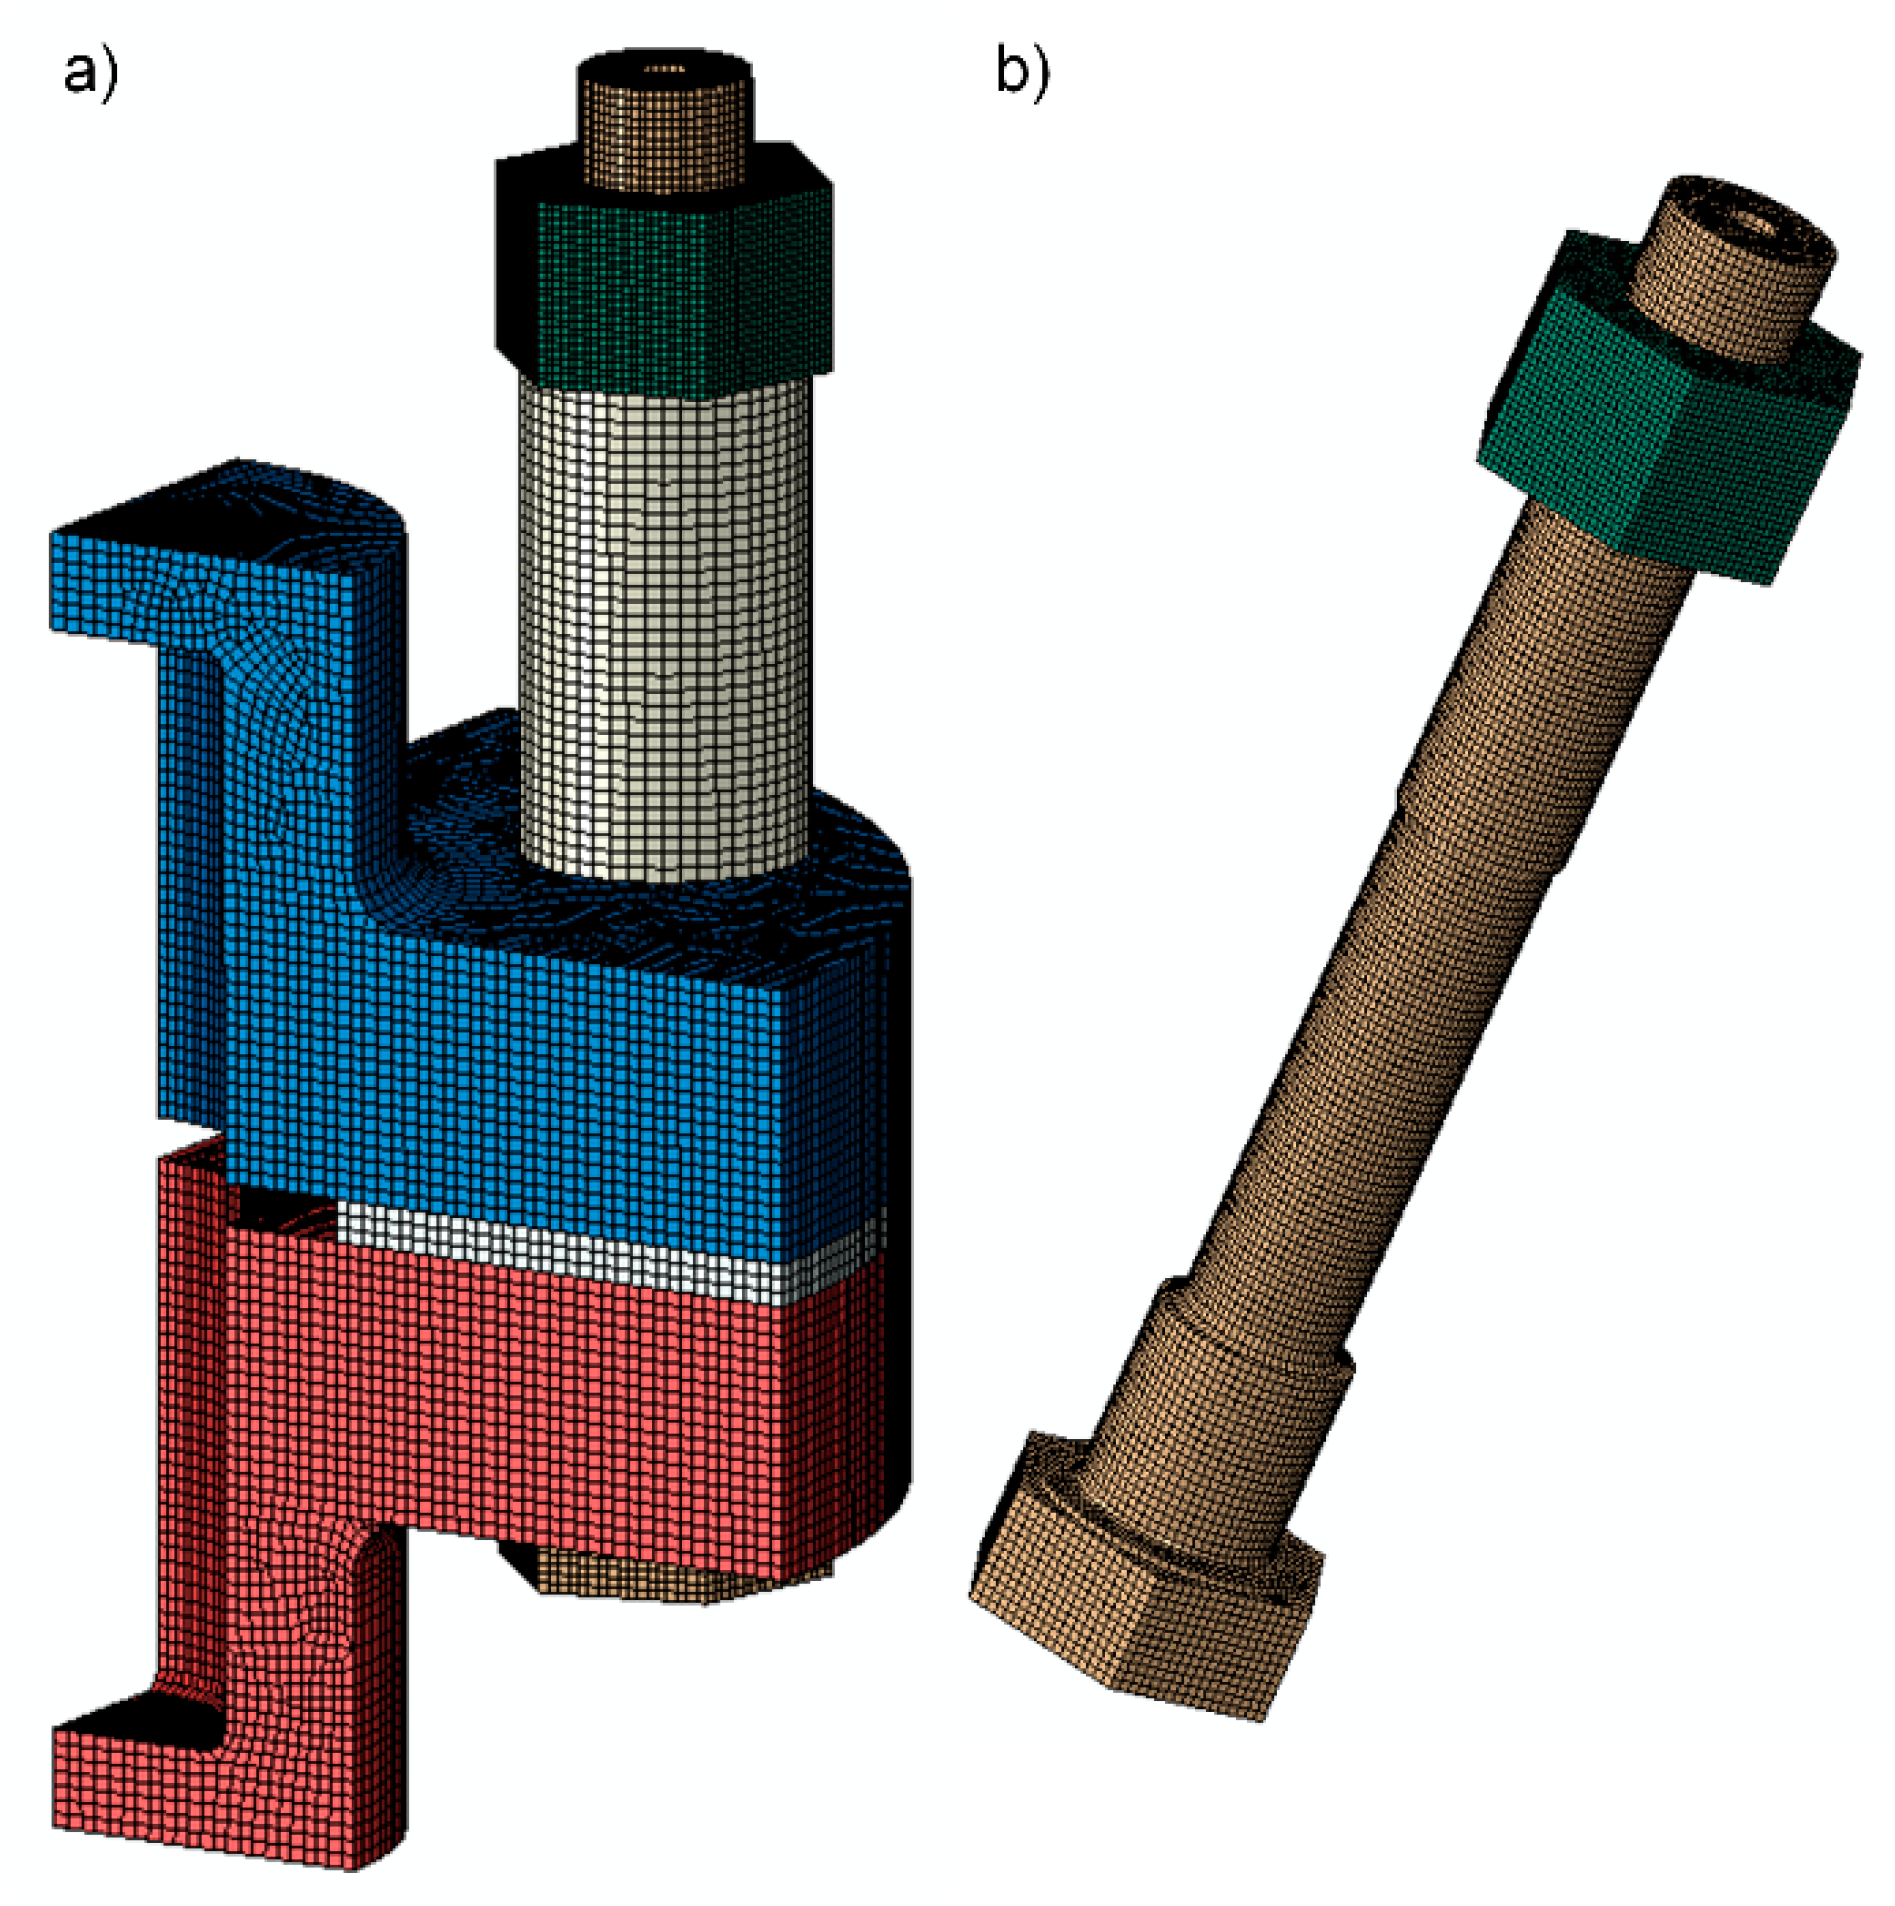
All numerical calculations were performed using ABAQUS 2019 software by Dassault Systemes. The model used describes in detail the same geometry used for the analytical calculation. The geometry is shown in Figure 2, and the model with its boundary conditions can be seen in Figure 3. Due to the symmetry of the model, only one-fourth of the entire model was used in the analysis, and the corresponding symmetry boundary conditions were used on the symmetry planes, as shown in Figure 3. Contact boundary conditions were used on all contact surfaces (bolt head–bottom flange, flanges–insert, washer–top flange, and washer–nut), and the coefficient of friction of 0.25 was considered. The bolt-nut connection is modelled with a tie connection property. All analyses were performed in two steps. In the first step (sub-step values: 0–1), a preload force of 50 kN was applied to the bolt. In the second step (sub-step values: 1–2), a pressure of up to a maximum of 640 bar was applied over the entire inside of the flange (see Figure 4; this pressure results in an axial working load of 54.7 kN). “Fix the bolt at its current length” loading method was used at the end of the first step (the end of preload). The second part of the analysis was performed in eight sub-steps, so that the results are available for smaller working loads as well. Like the analytical calculations, the FE analysis was performed for four different cases: two different bolt lengths/washer heights and two different values of insert stiffness (hard and soft insert). For a more credible comparison of bolt fatigue between the high and low washer cases, the high washer FE analyses were performed for both the standard bolt (this is a more credible comparison to a standard bolt used in the low washer cases) and the modified bolt (for comparison to the analytical and experimental results where modified bolt was used), as shown in Figure 4. Hexahedral elements with quadratic geometric order were used to discretise the model. The mesh used is shown in Figure 4. The model shown in Figure 4 is composed of 228,114 elements and 996,046 nodes. The mesh used is quite dense in order to prevent distortion on the elements at the rounded passages on the bolt. With the capabilities of the computer available, the model was still manageable, but the discretization used could be coarser. The influence of the size as well as the type of elements (linear, quadratic) on results was also analysed, for which the results are presented in the results section. Even at the maximum working load, all parts were still in the elastic region (even locally), so the elastic material model was the default material model for all parts. For steel parts, a Young’s modulus of E = 210,000 MPa and a Poisson’s ratio of ν = 0.3 were used, while for the soft insert a Young’s modulus of E = 2000 MPa and a Poisson’s ratio of ν = 0.36 were used.
3.2. Results of the Finite Element Analyses
The following results were analysed:
- change of axial force in the bolt due to the working load,
- distribution of the axial stress in the bolt shank (calculation of the bending ratio and the axial stress range) and
- the influence of the size and type of elements on results.
3.2.1. Change of Axial Force in the Bolt Due to the Working Load
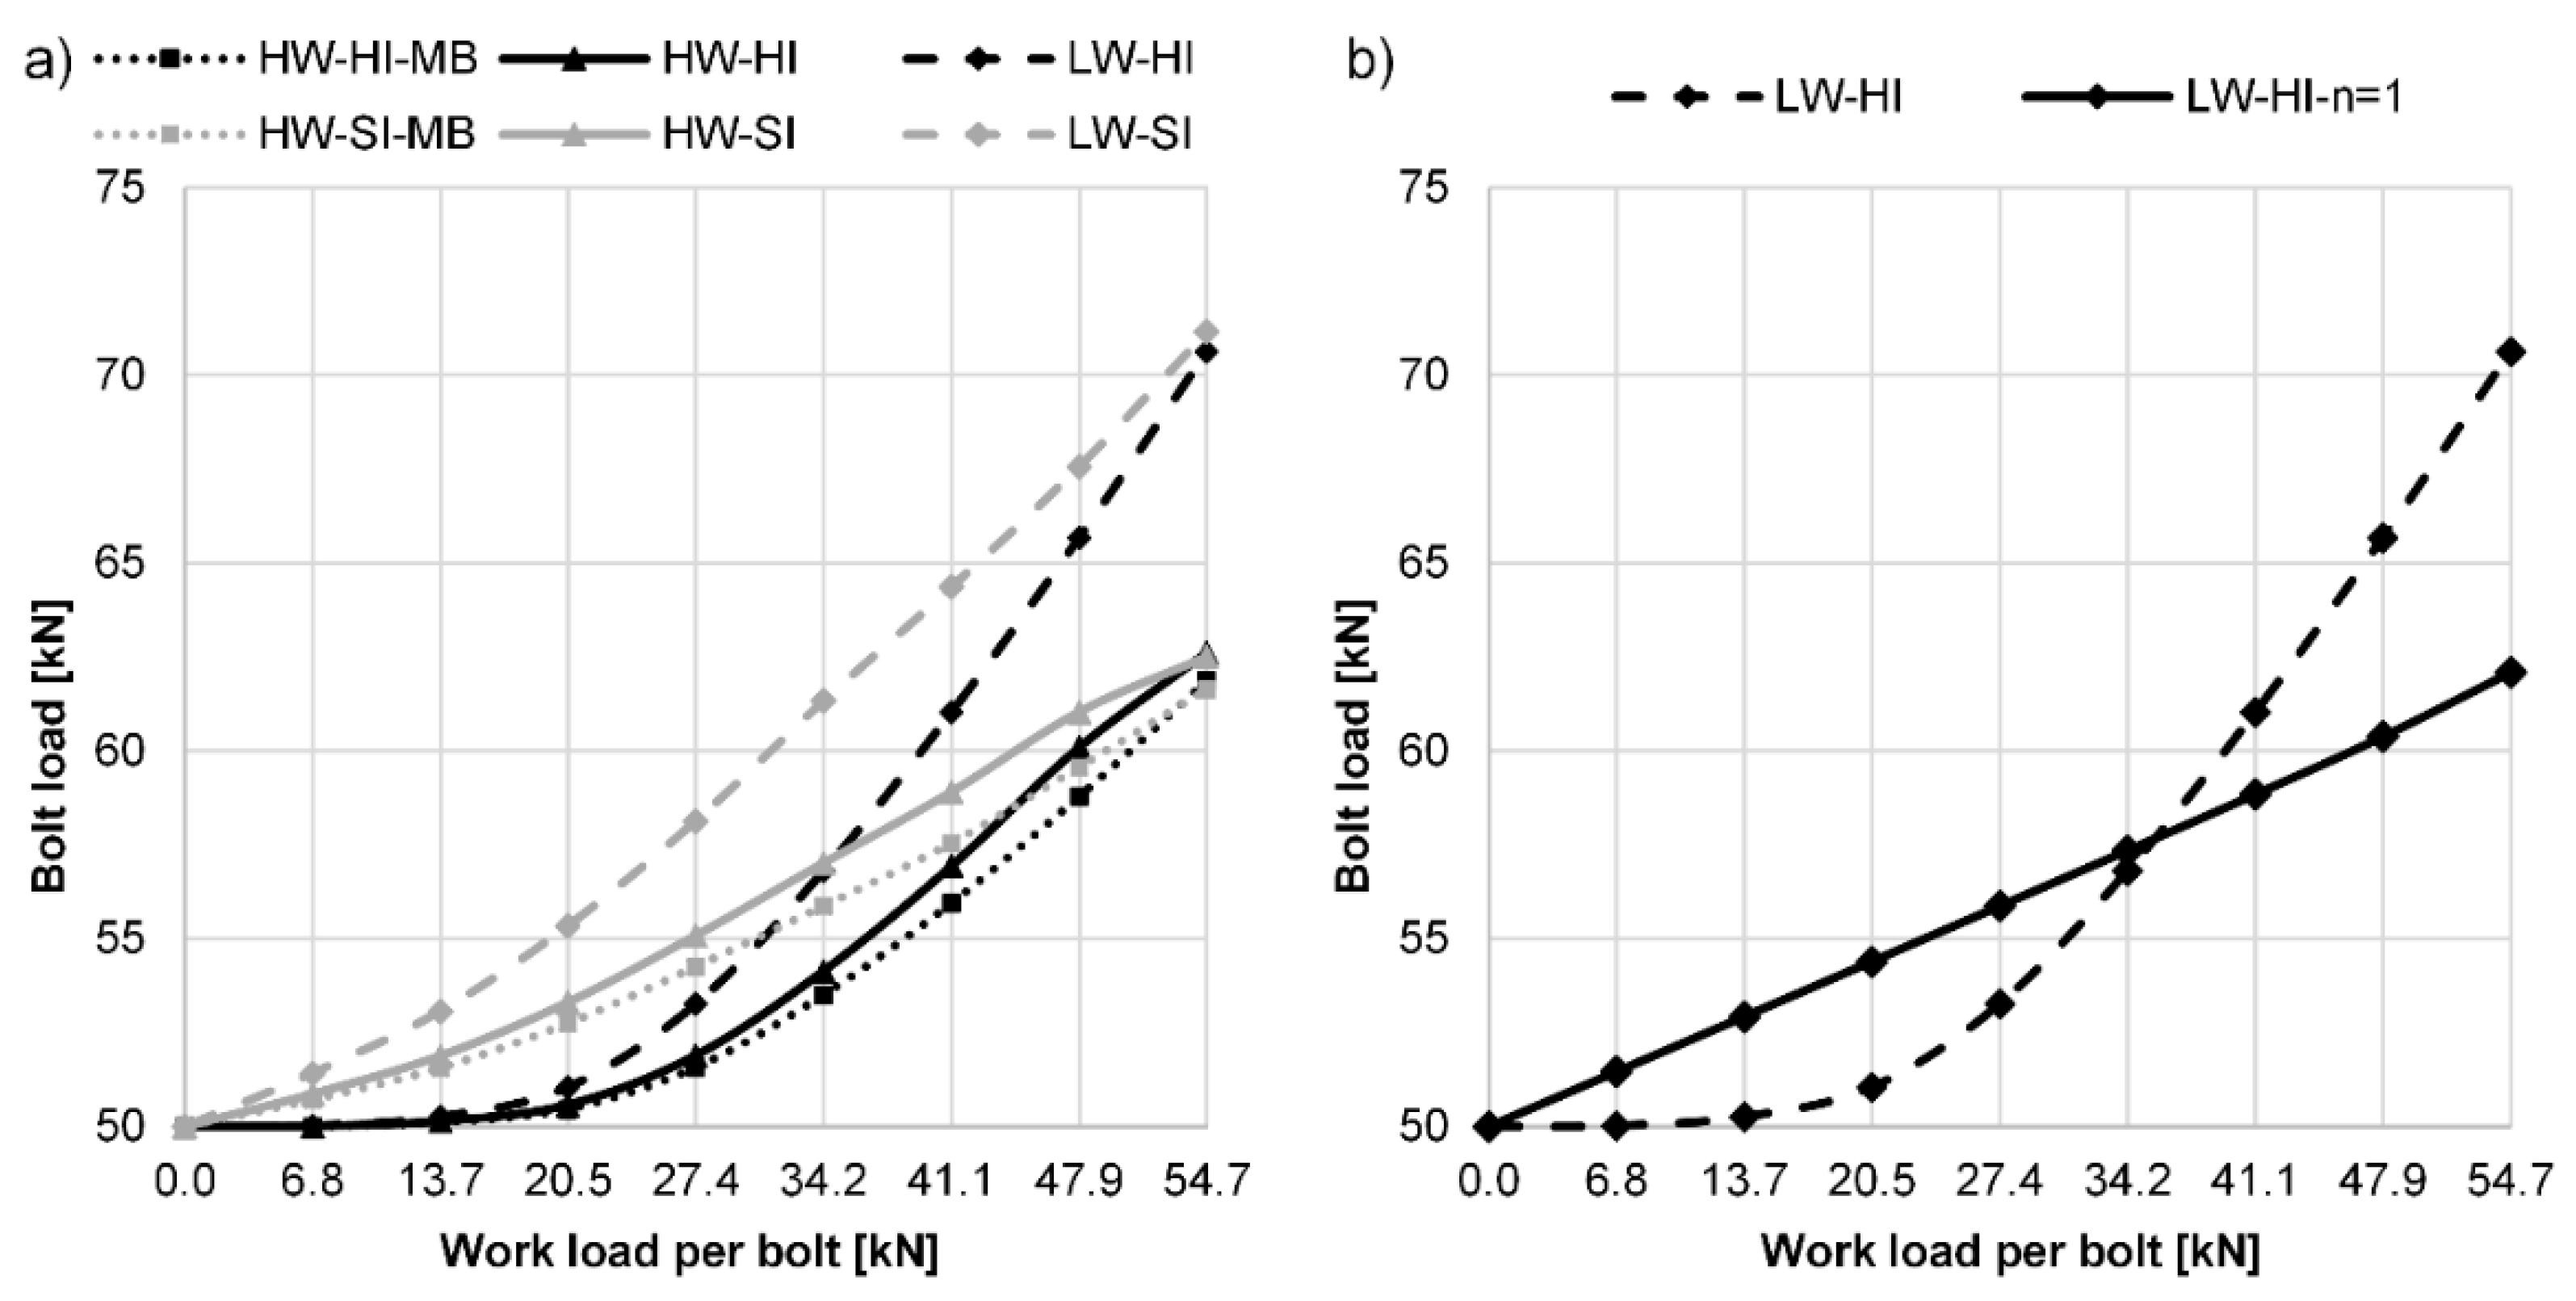
The results of FE analyses showing a change of force in a bolt due to a working load are shown in Figure 5a. The force profile in a bolt is shown only for the second step of the analysis (sub-step values: 1–2), because in the first step of the analysis (sub-step values: 0–1), where the bolts are preloaded, the force increases linearly in all cases until the final preload value is reached. From this point on, the force in the bolt (as shown in Figure 5a) increases slightly differently for each case considered, depending on the magnitude of the working load. Comparing first the difference between the standard bolt (solid lines) and the modified bolt (dotted line), which has a slightly thinner shank and a through hole, the additional force on the modified bolt is slightly smaller than in the case of the standard bolt due to the slightly greater elasticity of the modified bolt. The diagram in Figure 5a also shows the difference in additional force on the bolt if either a low washer (dashed line) or a high washer (solid and dotted lines) is used. As expected, the additional force is higher with a low washer than with a high washer. It can also be seen that for a small additional load (up to working load of 13.7 kN) and a hard insert, the difference in axial force profile between the short and long washer is very small. However, as the flange begins to open and the additional force on the bolt becomes increasingly dependent on the bending of the flange, the difference increases rapidly. The reason is that in the case of a longer bolt or a high washer, the distance between the flanges and therefore the change in bolt length is transferred to a longer length of the bolt, resulting in a smaller increase of axial force. Comparing the results of axial force in the bolt for hard (black lines) and soft (grey lines) inserts in Figure 5a, it is clear that the largest differences in axial forces in the bolt occur at lower working loads and are completely eliminated at the highest ones. The reason for such a profile of axial forces in the bolt is due to the difference in the load factor calculated according to Equation (10), which depends on the load introduction factor and the ratio of the stiffness values between the bolt and the flange, in combination with the bending. This difference is therefore to be expected. Figure 5b shows in more detail how the load introduction factor in combination with the bending affects the axial force in the bolt. For the case of a high washer and a hard insert, the actual behaviour is shown by a dashed line and it is clear that the increase in axial force in the bolt at low working load is extremely small due to the small value of the load introduction factor n. To facilitate the idea of the actual load introduction factor, the diagram also shows the axial force progression in the bolt in the case of a low washer and a hard insert, assuming that the additional force acts completely symmetrically under the bolt head, so that the load introduction factor n = 1 (full line). In particular, when the additional load is small, a comparison of the solid and dashed lines shows that the real load introduction factor when the applied working load per bolt is 13.7 kN is equal to n = 0.09. This is significantly less than what VDI 2230 (which was used for the analytical calculation in this study) assumes for this form of a joint (n = 0.3). Similar conclusions are also described by Griza et al. in [33].
3.2.2. Distribution of Axial Stress in the Bolt Shank
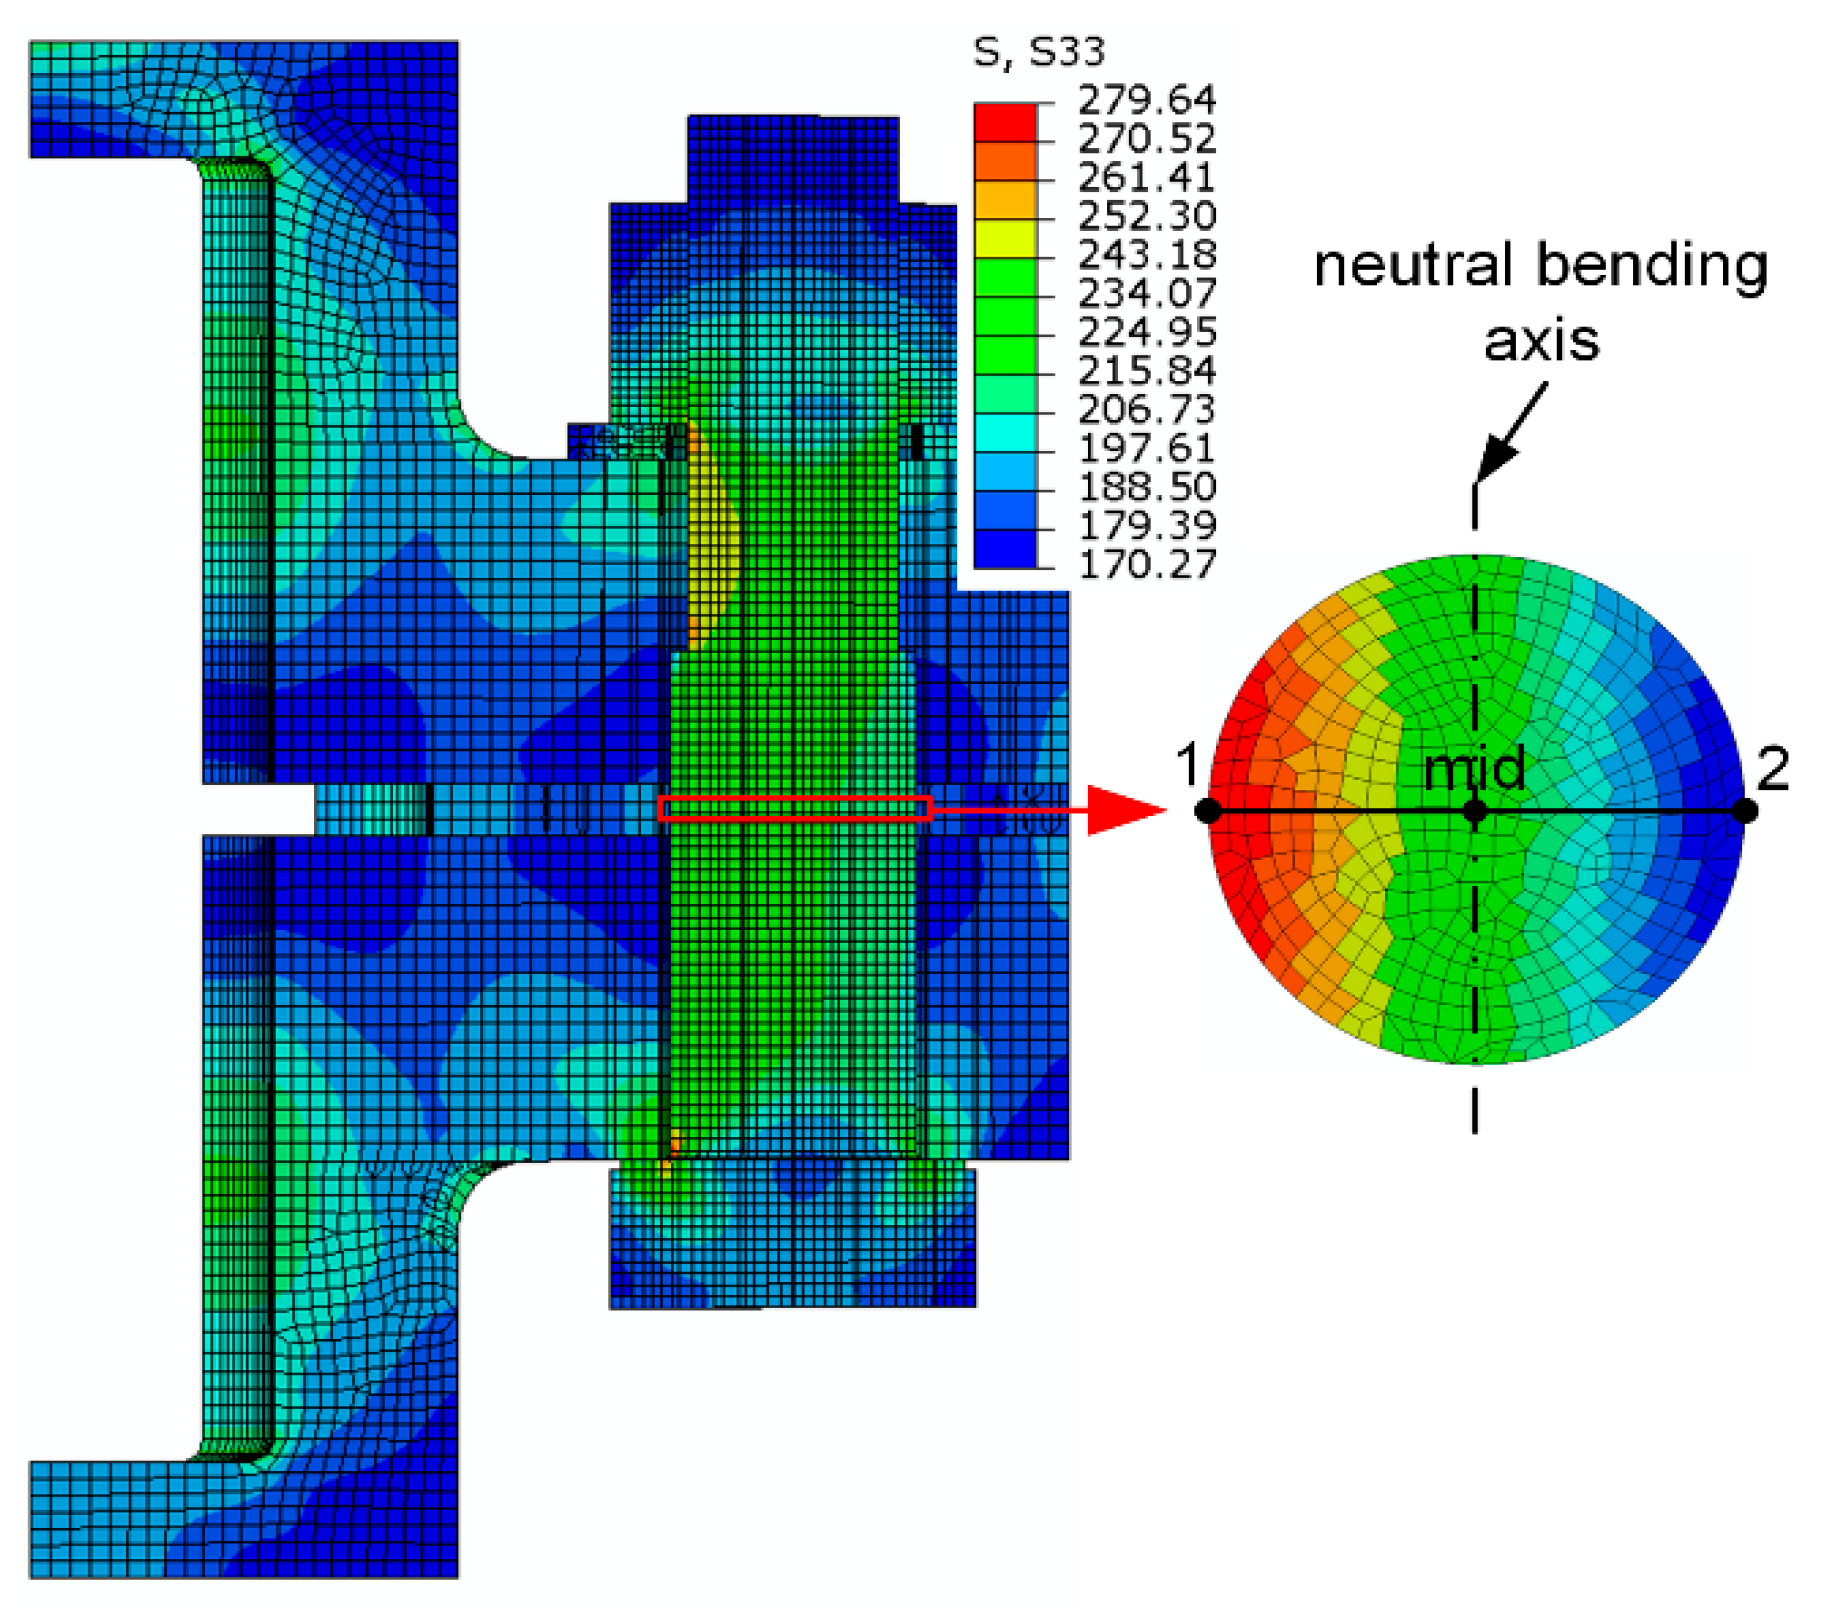
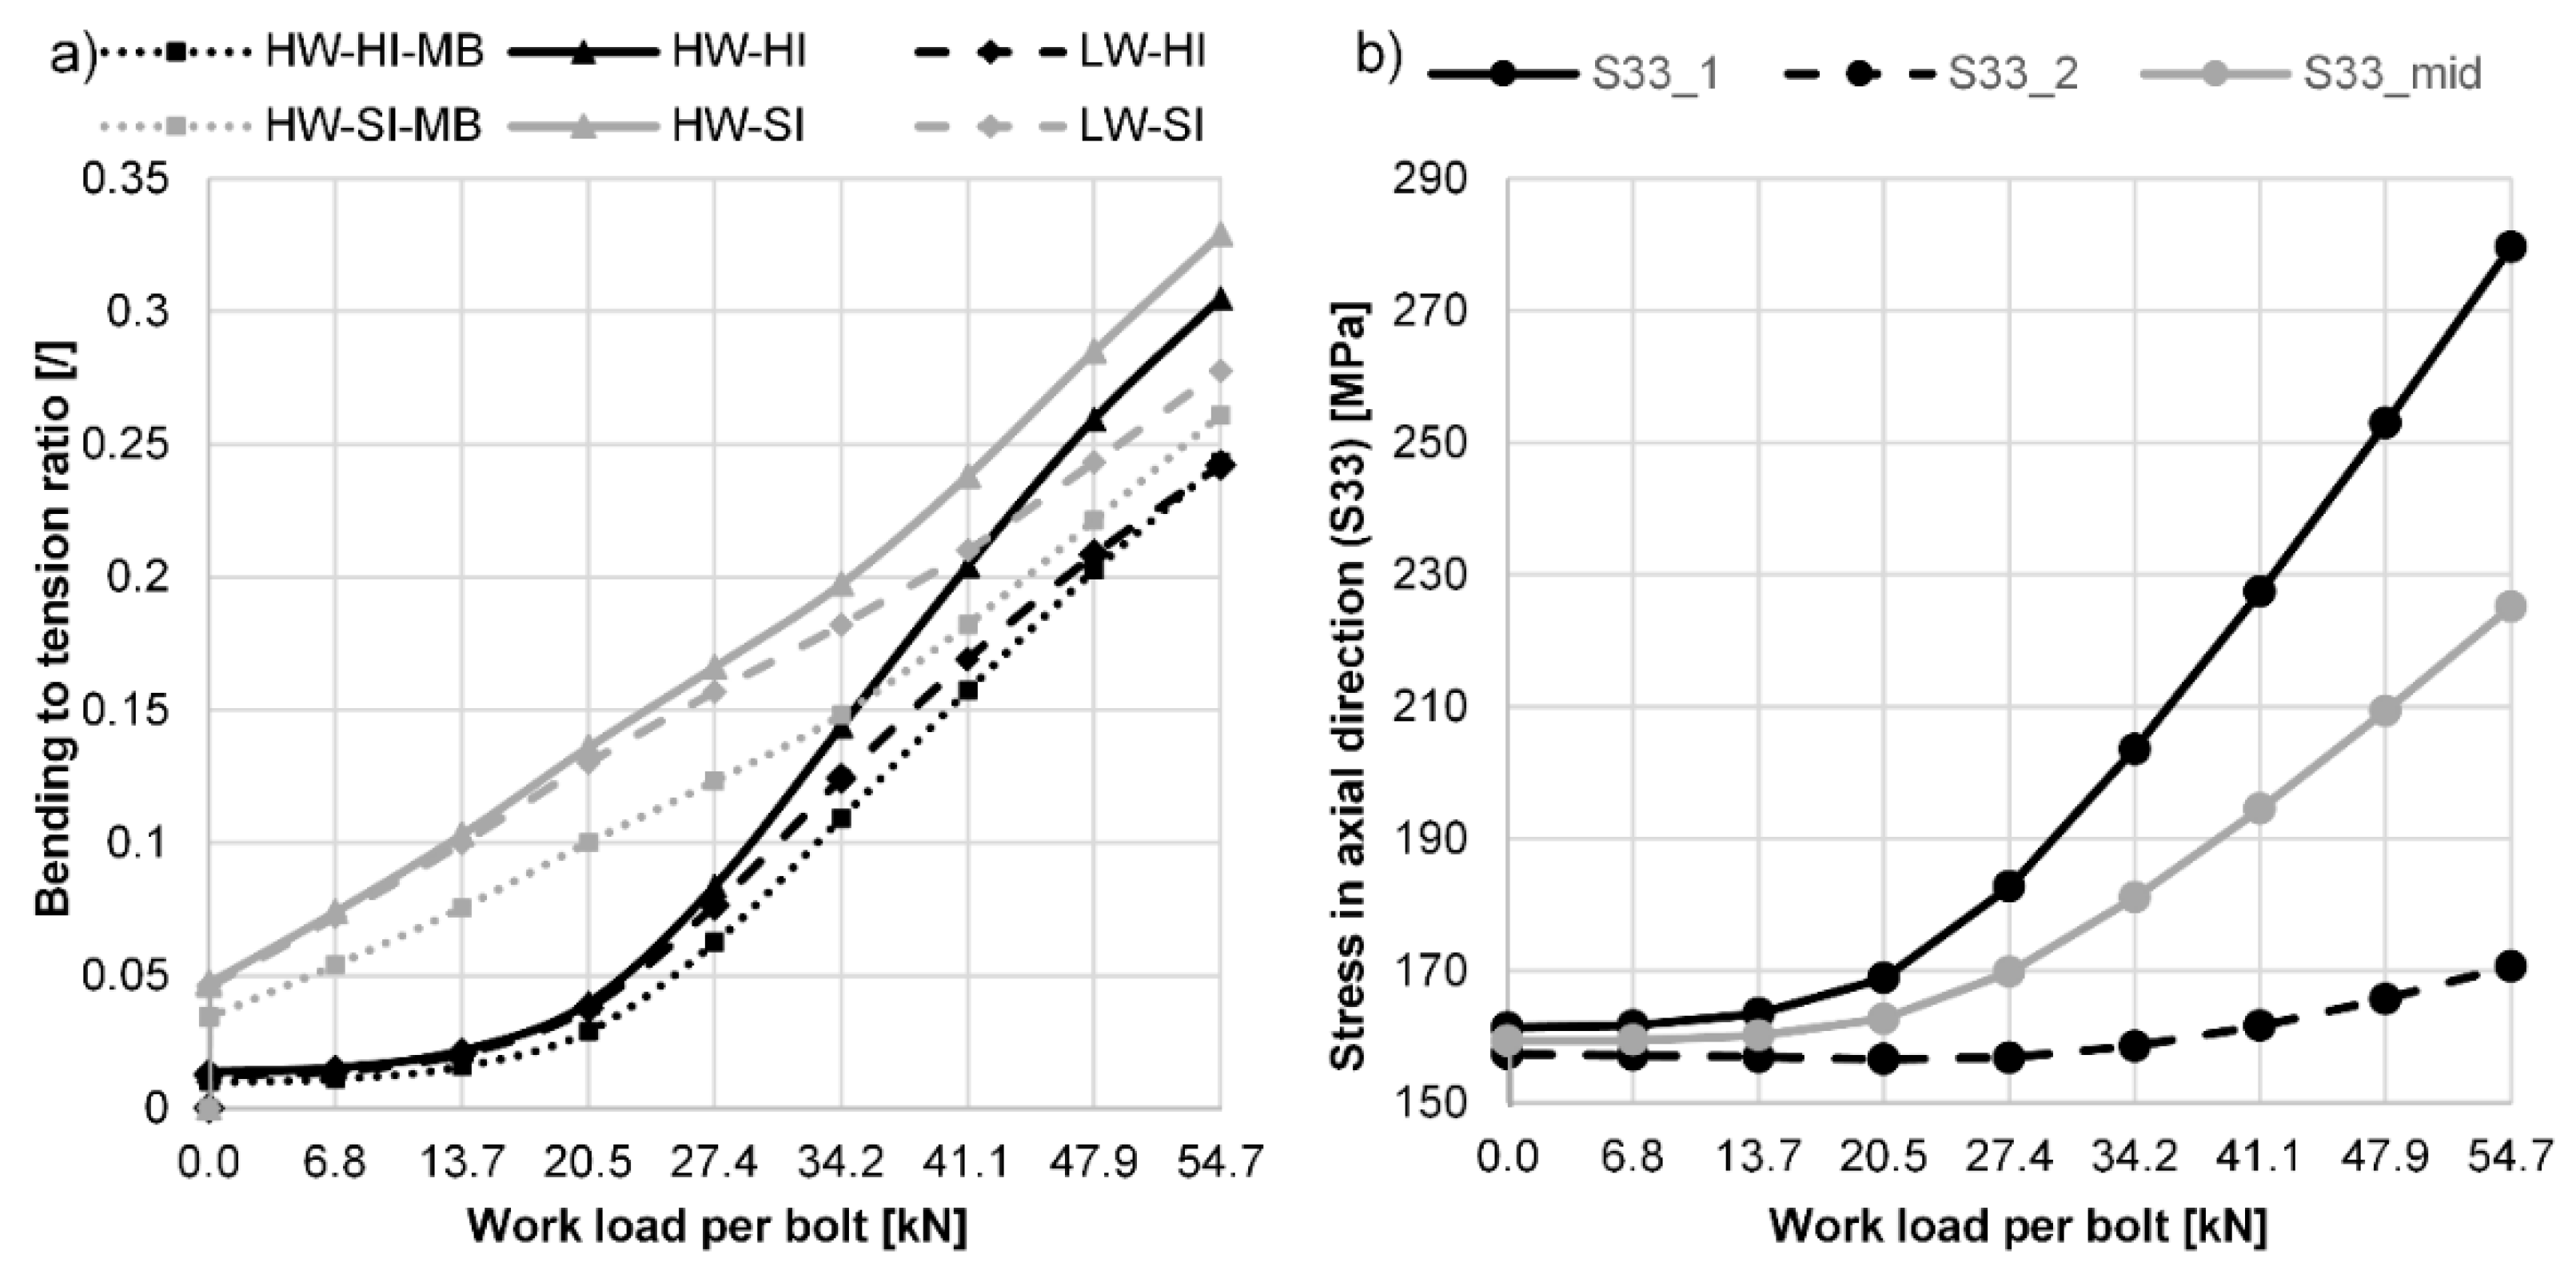
From the distribution of axial force in the bolt shank, the proportion of stress due to pure axial load and due to bending can be determined. To determine the bending to tension ratio, the values of axial stress in the bolt shank are read from the FE analyses exactly at the point where the centre of the insert is located (see Figure 6). From the range of elements at this level, the values with the maximum (1) and minimum (2) stresses and the stress on the neutral axis (mid) (the value of tensile stress due to pure axial loading) are read perpendicular to the direction of the neutral bending axis (see Figure 6). The changes in these stresses as the working load is increased are shown in Figure 7b (the case with a high washer and a hard insert). Half of the difference between the maximum and minimum stresses is the bending portion of the stress, which is used to calculate the bending to tension ratio using Equation (15). The results of this ratio are shown in Figure 7a for all six cases studied.
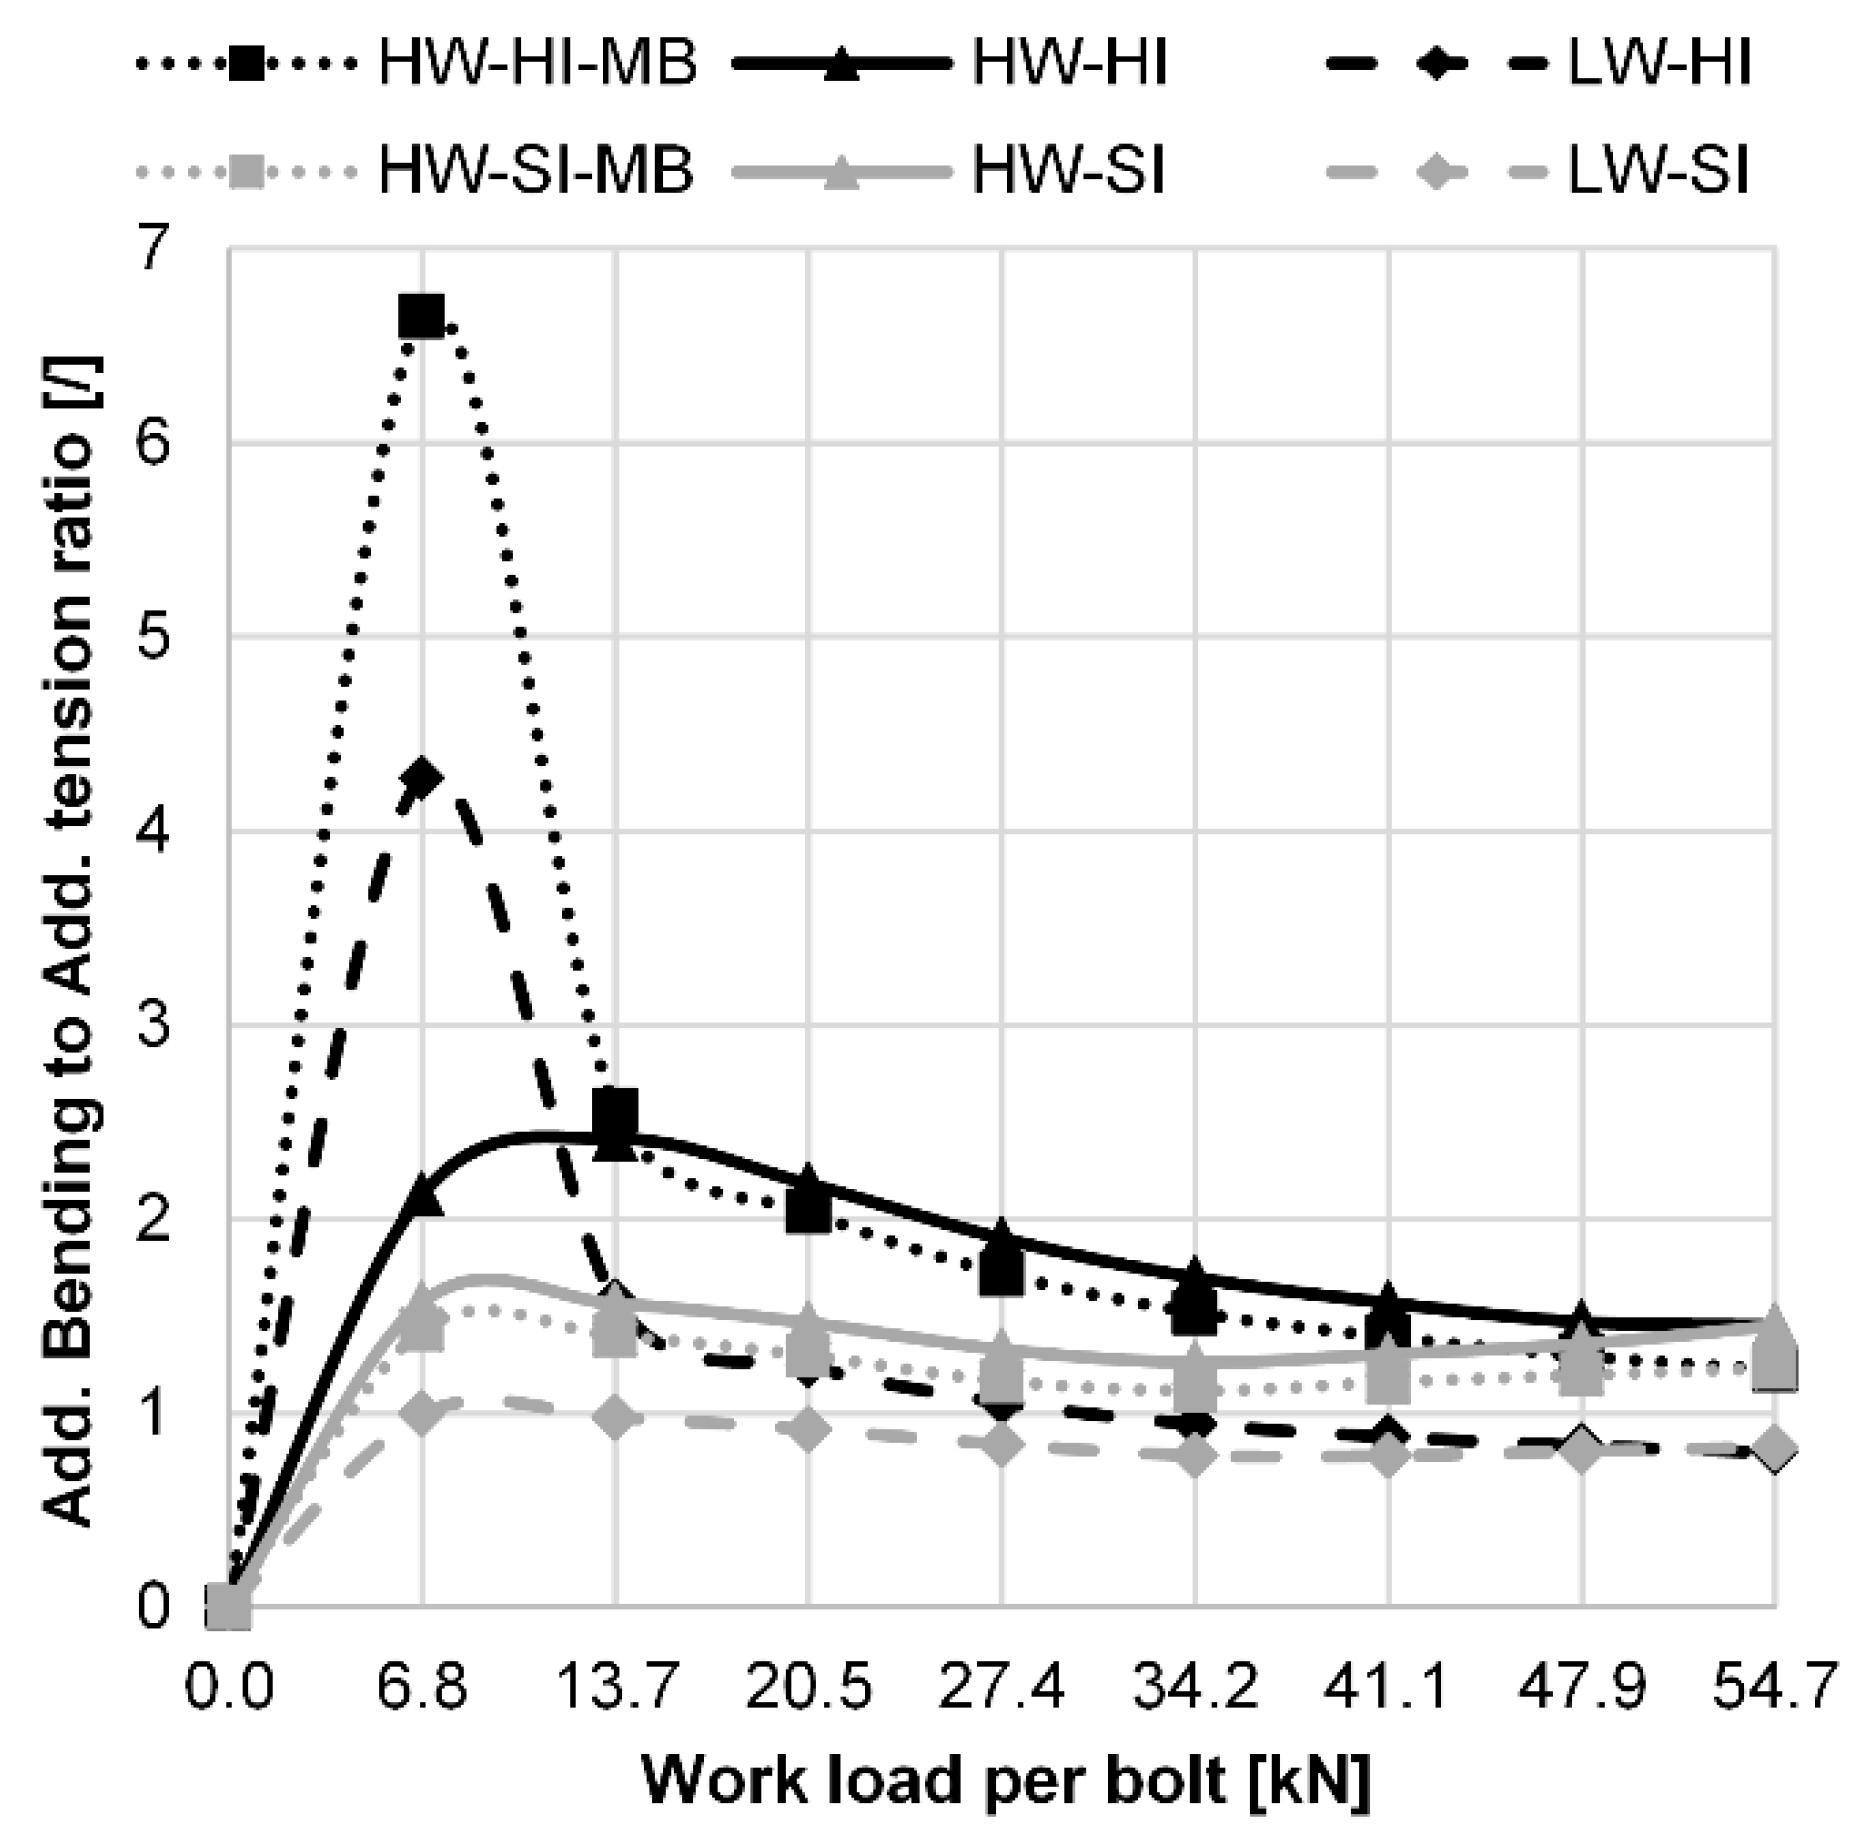
Due to the geometry of the flange, the pressure cones (i.e., the pressure-affected zone) cannot develop evenly in all directions when the bolt is preloaded, resulting in an asymmetric pressure-loaded zone that can create some bending in the bolt during preloading. As shown in Figure 7, some bending occurs in the bolt in our cases during preloading, too. The effect is significantly more pronounced in the case of a soft insert (grey line), as about 4% of the total stress is added by the bending in these cases, and only 1% in the case of a hard insert. As expected, the bending-to-tension (BTR) ratio increases with an increased working load. It can be seen from Figure 7a that the increase is not linear. For the soft insert (grey line) the increase is fairly linear, while for the hard insert (black line) a large change in slope is visible at working load of 13.7 kN. The same has already been observed when monitoring the bolt axial forces (see Figure 5a), confirming the assumption that at higher additional load, the bending plays a major role and it would be a big mistake to neglect it. The BTR ratio is calculated with respect to the total tensile stress in the bolt; therefore, the values shown are relatively small as most of this stress is caused by the bolt preload. If the ratio of the additional bending load to the additional tensile load is calculated, as shown in Figure 8, it can be seen that a very large portion of the additional bolt load is caused by bending. Since the amplitude of the bolt load depends only on the additional bolt load and the fatigue of the bolt depends only on the amplitude of the load, it can be concluded that at low working load, bending has a decisive influence on the fatigue life of a bolt, while at very high working load, bending influences the fatigue life of a bolt approximately to the same extent as the axial tensile load. This diagram confirms the great influence of bending on the fatigue life of a bolt when a dynamic working load is present.
In order to facilitate the illustration of the flange and bolt deformation in the presence of the working load, Figure 9 shows the deformations for the case with high and low washer at maximum working force and deformation scale factor of 100. It is evident from Figure 9 that the high washer has no effect on the flange bending stiffness, since the flange deformation is more or less the same in both cases shown. On the other hand, it is obvious that the bolt does not deflect uniformly along its entire length. The largest bending deformation of the bolt occurs at the junction of the two flanges, where the opening/spreading takes place. Due to this fact, the high washer has a great influence on the distribution of the additional stresses along the bolt.
3.2.3. The Influence of the Size and Type of Elements on Results
Several analyses were performed with different mesh sizes and element types (linear, quadratic) to show the influence of the FE model size on the results. In all cases, hexahedral elements were used. Three parameters were chosen to compare the results, namely the additional force in the bolt FSA at a working load of FA = 13.7 kN, the tensile stress range σSAt and the bending stress range σSab* in the cross-section of the bolt positioned at the centre of the insert. All analyses were performed for the case of high washer with hard insert and standard bolt (HW-HI). The results are presented in Table 2.
Comparison of results from FEM with different mesh sizes shows that very fine meshes, such as those used in our analyses, can be increased in size without much effect on the results as long as the basic mesh size recommendations are followed, providing at least three elements per thickness. If the mesh size is increased further, this can lead to larger variations in the results. The results also show that the use of quadratic or linear elements does not change the result much when the mesh used is relatively small, but has a large impact when the mesh is very large. Table 2 also shows that the use of quadratic elements leads to the highest load conditions in the case of the course mesh, which we believe is more of a coincidence in this case. Therefore, it is proposed to determine the mesh size based on basic recommendations.
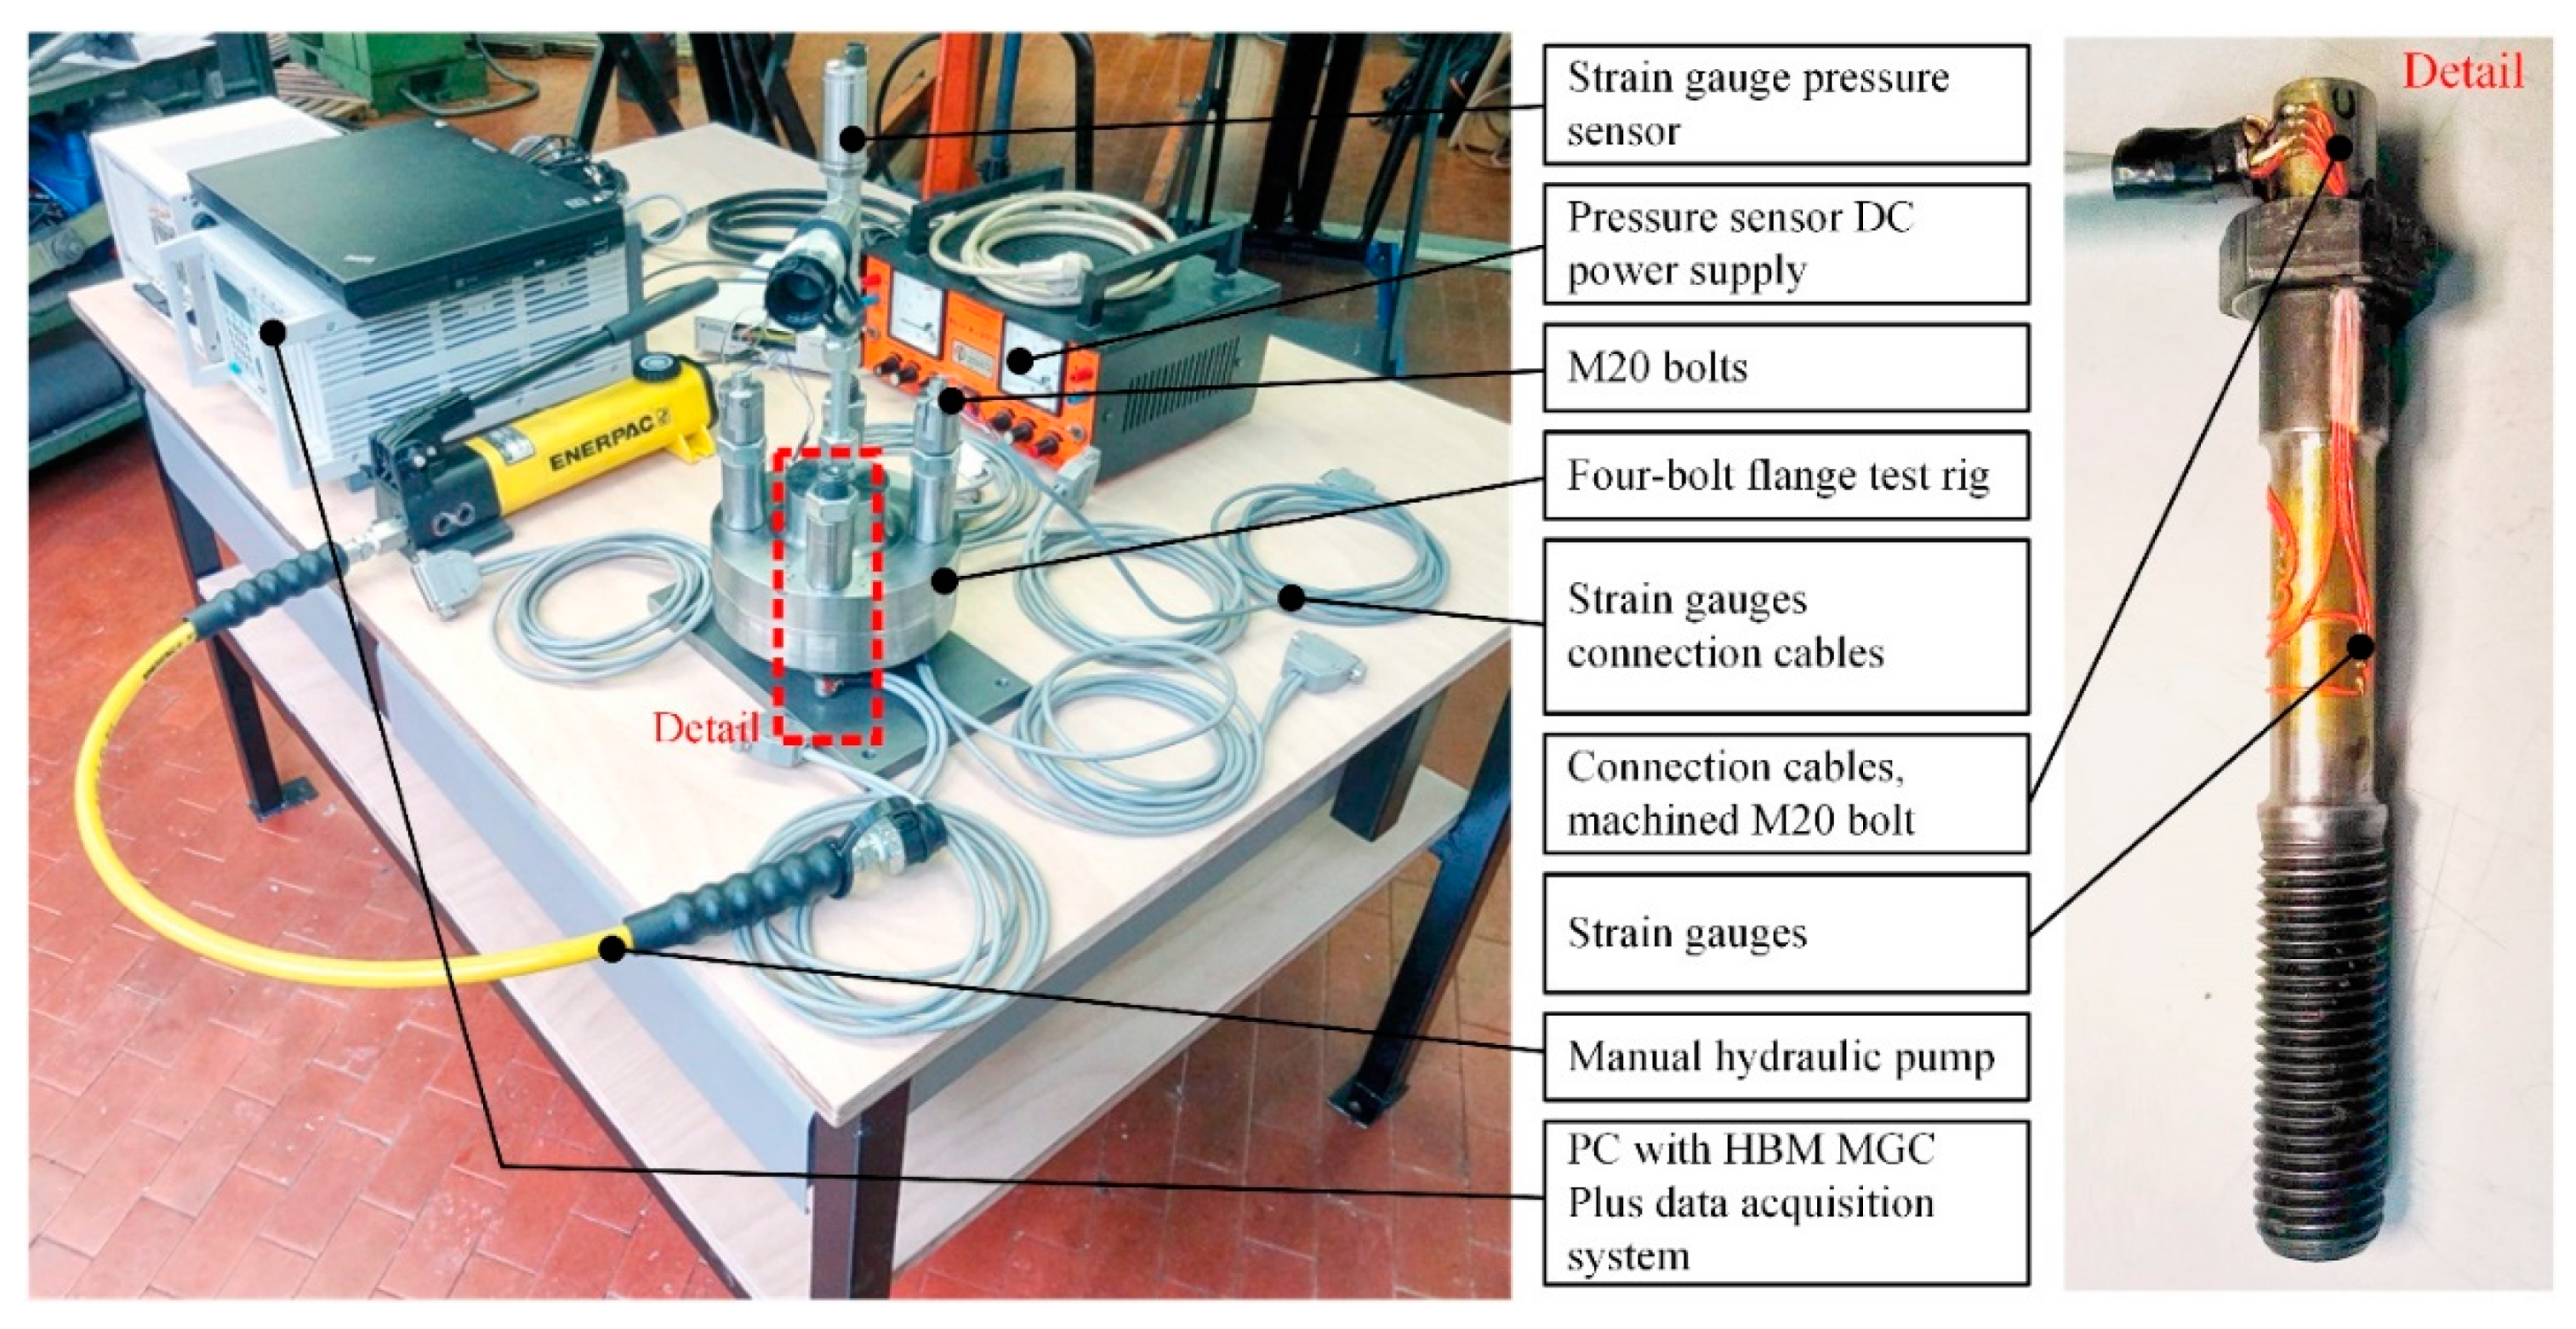
4. Experimental Analysis
To verify the results of the FE analysis, a test was also conducted for the case with a long washer and a hard insert using a modified bolt that allowed the strain gauges to be attached. The test rig and all other measuring equipment are shown in Figure 10. All four bolts are equipped with two pairs of XY strain gauges: one pair measures axial load and another pair measures bending load. Two force-measuring strain gauges are located on the neutral bending axis, one on each side of the bolt, and the bending-measuring strain gauges are located perpendicular to the neutral bending axis, one on the side of the bolt closer to the flange centre and another on the other side. For force and bending measurements, the strain gauges are electrically connected to form a full Wheatstone bridge circuit, which provides double signal amplification and compensation for temperature and either bending or axial force. The working load is applied by pressurised oil inside the flange, generated by a manual Enerpac (USA) hydraulic pump P141 that delivers up to 700 bar of pressure. The pressure is measured by the strain gauge pressure sensor with a measuring range between 0 and 400 bar.
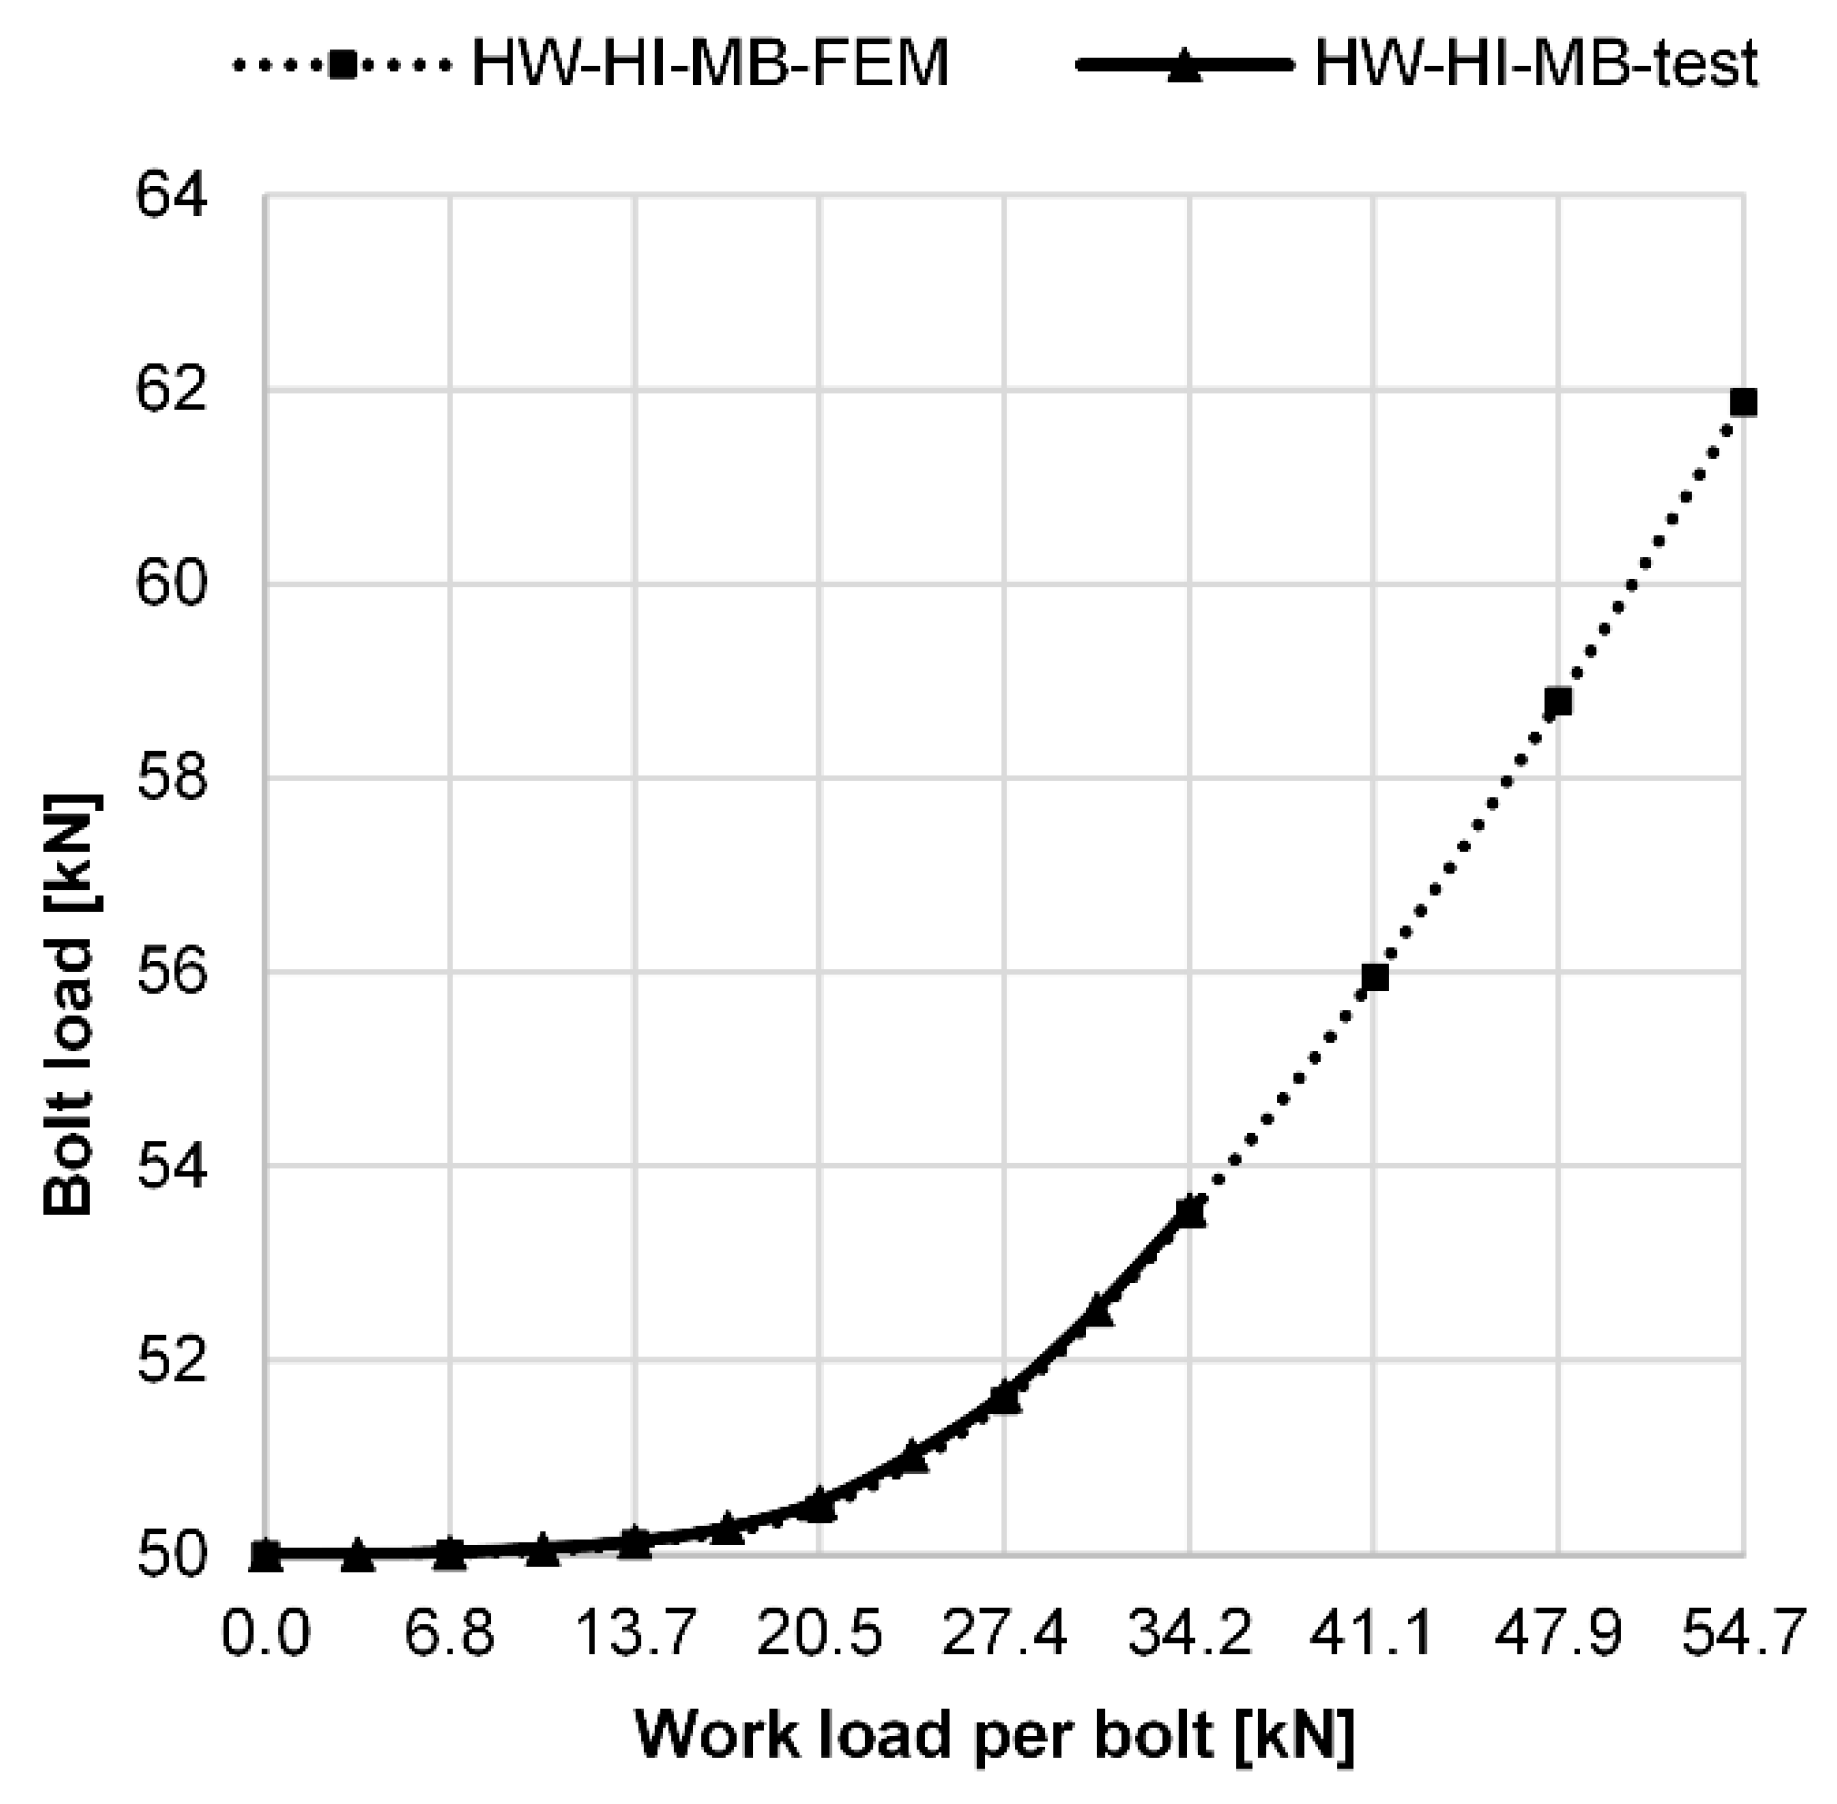
Results of the Finite Element Analyses
The measurement was made by gradually tightening all four bolts to a preload of 50 kN. In the next step, the pressure inside the flange was generated with a manual oil pump in steps of 40 bar up to a maximum pressure of 400 bar, which was limited by the pressure sensor used. The results of the measurement together with the results of the FEM analysis of the exact same model are shown in Figure 11. The results show a very good agreement of the experimental results with the results of the FEM analysis. From the consistency of the results shown in Figure 11, it can be concluded that the FEM analysis used gives accurate results even in the absolute terms. Therefore, all other results of the FEM analyses performed for different cases are considered to be absolutely accurate and can therefore be compared with the results obtained by the VDI analytical method.
5. Comparison of Analytical and Numerical Results
The comparison of analytical and numerical results is performed for a working load of 13.6 kN. The results for both analytical and numerical methods are presented in Table 3. Since the analytical method assumes a uniform distribution of the tensile and bending stresses along the entire length of the bolt, it is reasonable to calculate the stresses at the smallest cross-section of the bolt, which is the threaded part of the shank. For this reason, the numerical results are also presented for the threaded section only. The results show that, compared to the numerical analysis, the analytical method slightly overestimates the additional bolt force when a hard insert is used and underestimates it by a factor of 3 when a soft insert is used. The same applies to the additional axial tensile stress in the bolt. However, a comparison of the additional bending stress in the bolt shows that the analytical method greatly overestimates the value of the bending compared to the numerical results: for high washer and hard insert by 47 times, for high washer and soft insert by 15 times, for low washer and hard insert by 11.5 times, and for low washer and soft insert by 4.5 times. The reason for such a large difference can be found in a number of parameters that must be estimated in the analytical method for estimating the bending stress in the bolt. An additional reason for the cases with a high washer is described in more detail in the next section, where it can be seen that the bending is almost completely eliminated due to the influence of the washer in the threaded part of the bolt, which obviously cannot be accounted for by the analytical method. Nevertheless, we can conclude that even the most sophisticated analytical methods are quite limited and one must be very careful when using them. From the obtained results, we can conclude that it is difficult to accurately estimate the real stresses in the bolt in a flanged joint with a high bending fraction using the analytical methods. The analytically obtained results in our case are very conservative, but this can quickly change to another more dangerous side if some parameters are evaluated differently, which is also the case if the working force would be higher. This will be discussed further in the next section.
6. Fatigue Life Calculation
The fatigue behaviour of a bolt, or more specifically the threaded portion of a bolt, is very similar and comparable to the fatigue behaviour of a weld. In both cases, there is a notch causing a high local stress concentration that later leads to a fatigue crack. In the case of a bolt, this critical point is the thread root. Stress concentrations can be slightly higher at two other locations on the thread: at the runout of the thread and at the point where the thread of the nut first engages the thread of the bolt. For this reason, fatigue damage of a tensile loaded bolt most often occurs at the point of contact with the nut. In some cases, the bolt has another critical point: the transition of the bolt shank to the head. In the case of standard bolts, the rounding at this transition is sufficient, so that this point is not critical in the case of a pure axial load. However, with additional bending load, where the bending stress is not necessarily evenly distributed along the length of the bolt, this point can also be critical.
In most cases, the fatigue life of a bolt is hardly affected by the mean stress level or the quality of the bolt material due to the notch and the associated local stress concentration [34,35,36]. For this reason, these factors are neglected in most studies and also in the Eurocode 3 standard [37].
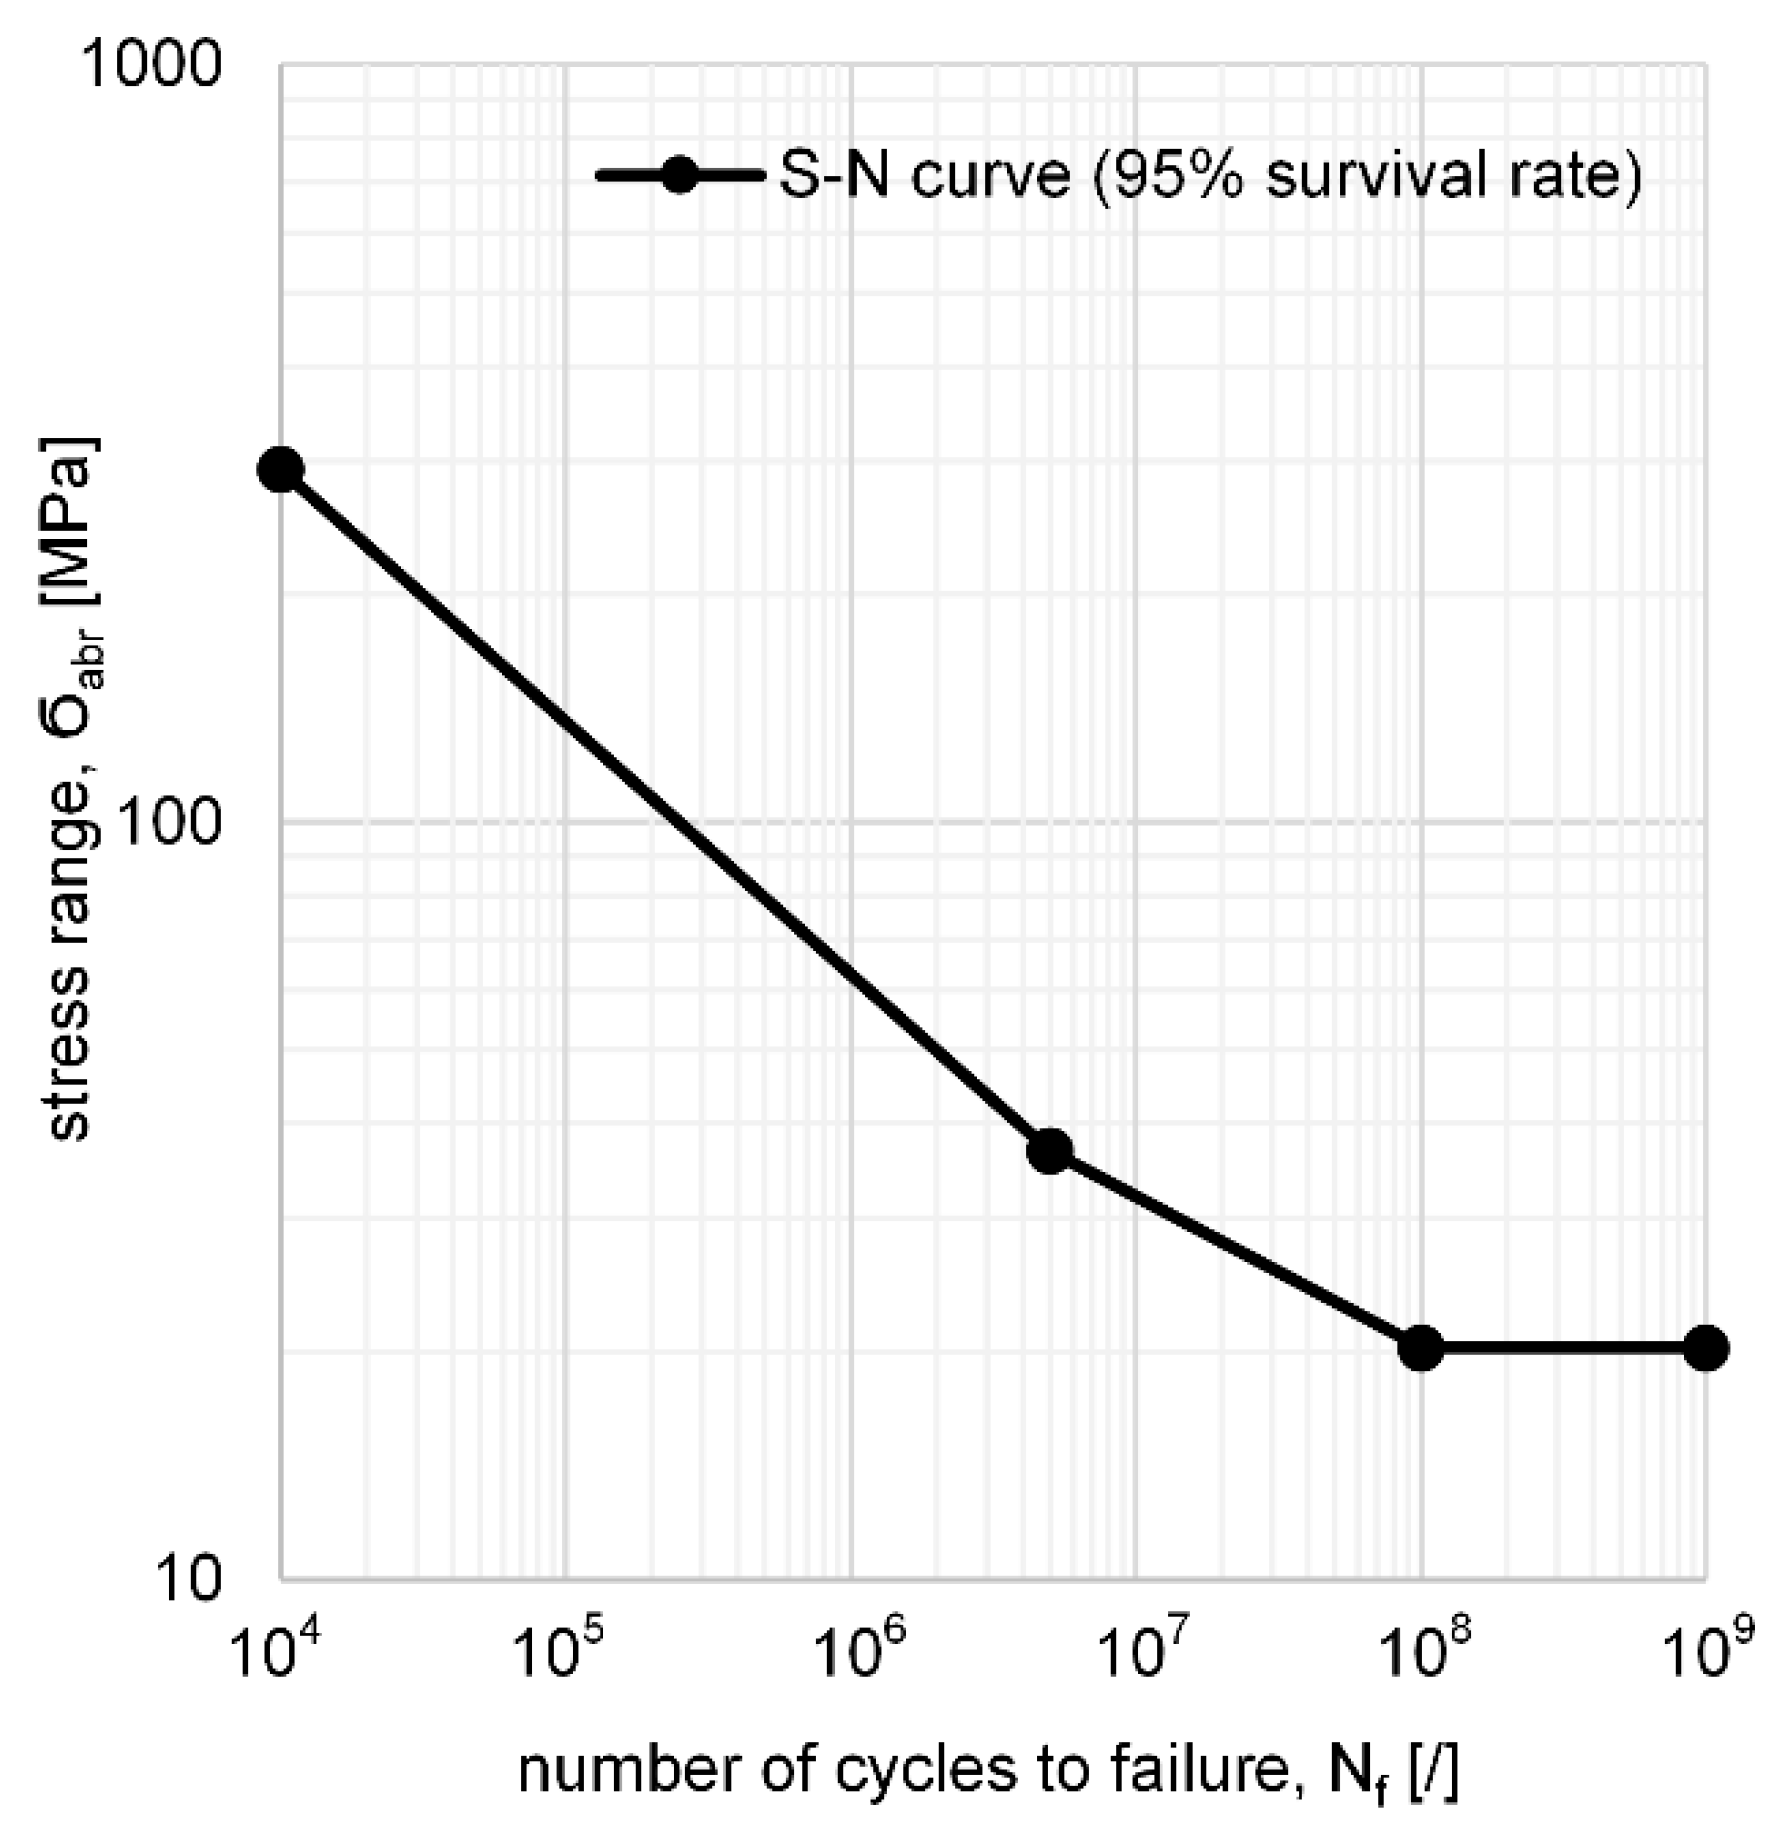
The Eurocode 3 fatigue life S-N curve was used in this study to determine the fatigue life of bolts for the cases considered. According to the Eurocode 3 classification, tensile loaded bolts are in the detail category 50. Therefore, the fatigue life (S-N) curve from the Eurocode standard shown in Figure 12 was used to determine the fatigue life of bolts.
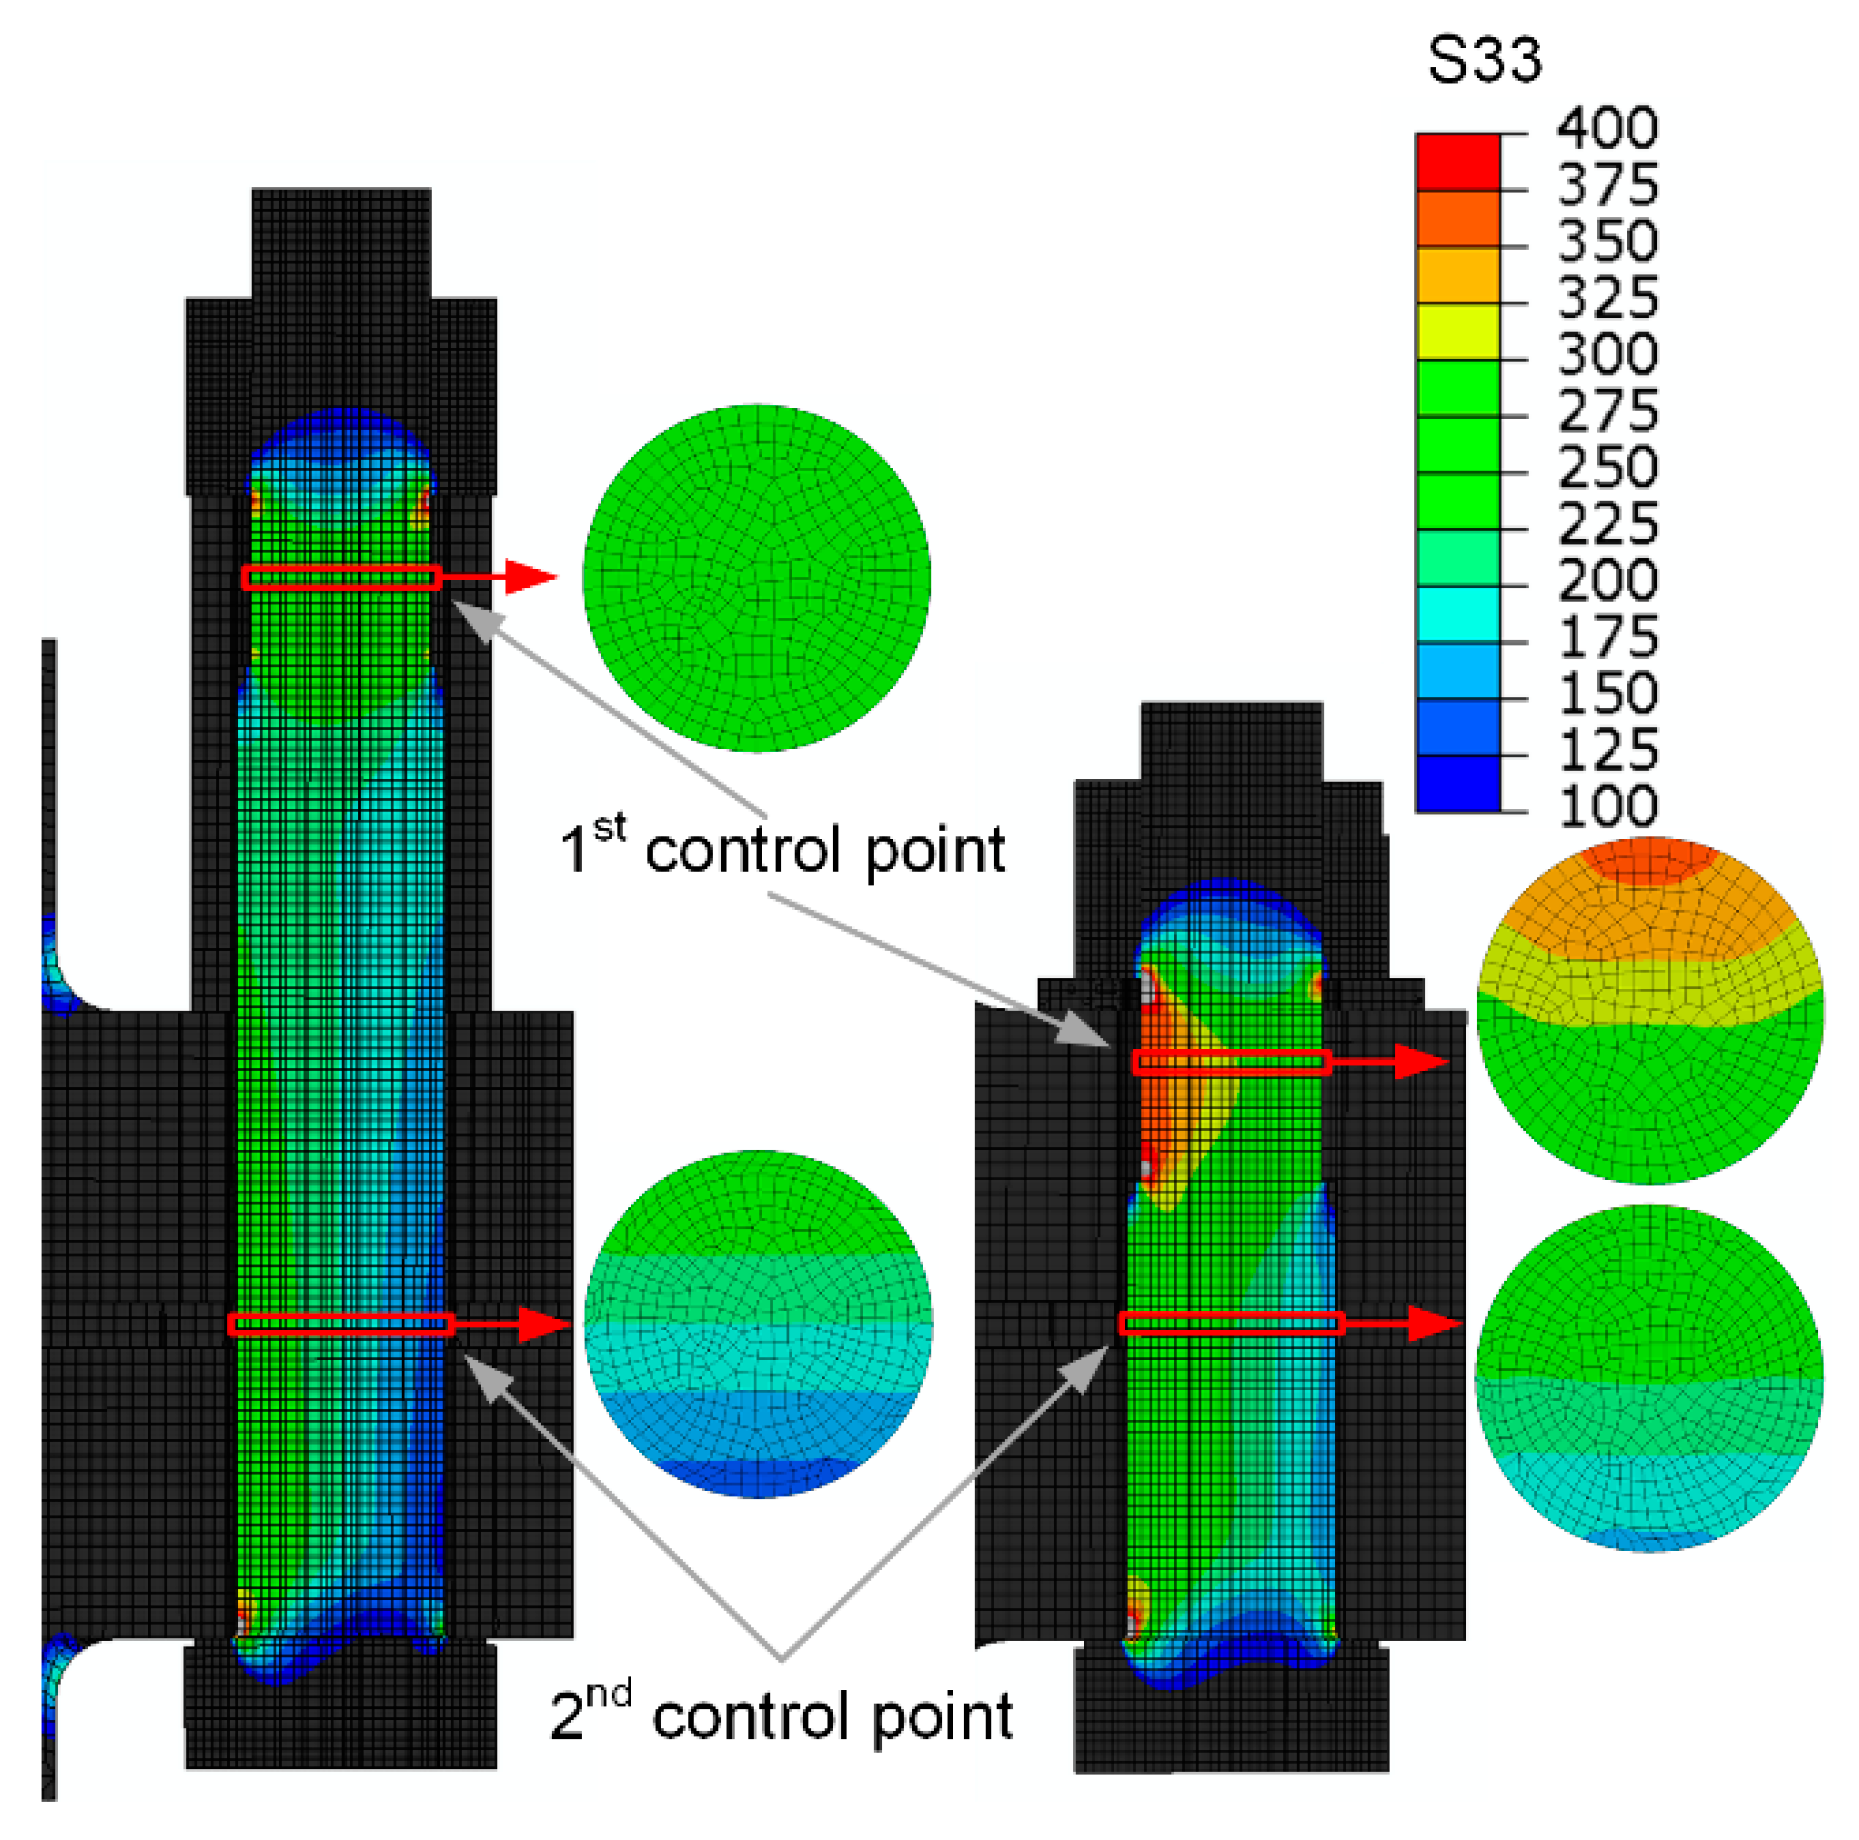
The stress range in both cases (evaluation based on analytical calculation and evaluation based on numerical analysis) was calculated as the nominal value of the stress in the bolt shank, taking into account the tensile and bending stresses according to the standard. In the evaluation based on numerical analyses, the stress range was determined at two locations, as shown in Figure 13, as it is found that for a long washer, the bending part of the additional bolt load in the lower part of the shank (second control point) without thread is significantly different from that in the upper part of the shank near the nut (first control point). As can be seen from Figure 13, the bending is almost completely eliminated due to the long washer in the threaded part of the shank, which is normally the most critical region for fatigue damage. In such a case, the critical point may also be at the transition of the bolt shank to the head. For this reason, another control point was added to the analysis to determine the nominal stress range in the unthreaded part of the shank.
For fatigue life Nabr calculation, Equation (16) was used for stress ranges greater than 36.84 MPa and Equation (17) for stress ranges between 36.84 MPa and 20.23 MPa. Stress ranges below 20.23 MPa do not cause damage (according to the Eurocode 3 standard), which means that at this value the bolt has its endurance limit.
Results of the stress ranges in the bolt for two control points gained by numerical analysis are shown in Table 4 together with the analytically calculated stress ranges for eight different working loads ranging from 6.84 kN to 54.74 kN per bolt. Determined stress ranges are afterward used for the calculation of the bolt fatigue life. Results are shown in Table 5.
The results of the fatigue life estimation show that the analytical method overestimates the values of the additional stresses in the bolt over the entire range of workloads considered, thus underestimating the fatigue life of the bolt. As described in the previous chapter, this is mainly due to the large overestimation of the bending portion of the stress. It is also clear that the analytical method can only assume a linear increase of the additional stresses in the bolt with increasing working load. The results of the numerical analysis show that this is not the case, as the spreading of the flange changes the proportion of the flange that transmits compressive loads. Therefore, the stiffness of the clamping parts is changed, which consequently affects how the additional load is distributed across the flange or bolt. From the graph in Figure 8a, it can be seen that the additional bolt force increases progressively as the working load increases. This is especially the case when the entire flange is rigid and contains no elastic insert. The difference due to the progressive increase of the additional load in the bolt in the case of the numerical method and the linear increase in the case of the analytical method leads to the fact that the analytical method, in terms of bolt fatigue, is very conservative at lower working loads, but it underestimates the stress and thus overestimates the fatigue life when the working load is higher. For this reason, the analytical method used is only safe to use up to the point where the flanges begin to spread, which happens very early under asymmetric loading. Therefore, the analytical method is practically useless for bolted flanged connections of structural components.
If we compare the results for cases with high and low washers, we can see that high washers increase the service life by 3 to 5 times. There are two reasons for this. Firstly, the high washer reduces the additional stresses in the bolt, and secondly, it relieves the most critical part of the bolt from fatigue point of view. The critical part of the bolt when using a high washer is thus shifted from the thread area to the transition of the shank to the bolt head.
The expected fatigue life is also positively affected by the thinning of the bolt, which increases its elasticity in the area that is not critical for fatigue. The results also show that the soft insert has a negative effect on the fatigue life and should therefore be avoided in structural flange joints.
7. Conclusions
Based on analytical calculations and numerical analyses, our key findings are as follows:
- The additional bolt load increases linearly as long as compressive stresses are present at the inner edge of the flange. When the joint begins to open, the additional load in the bolt starts to increase progressively. Because of this fact, analytical methods are normally valid only to the point when the spreading of the flanges starts to occur.
- The experimental verification confirmed that the FEM analysis can be considered as a reference method, as the FEM analysis results proved to be accurate even in the absolute terms.
- Due to the eccentricity of the working load, bending stresses occur in the bolt and account for a large proportion of the total stress range in the bolt. The additional bending-to-tensile stress ratio can be as high as 6 for lower working loads and about 1 for very high working loads.
- By using a high washer under the nut, the stress range and the risk of fatigue damage to the bolt are significantly reduced. In our case, the increase in fatigue life of the bolt is about 300%–500% (depending on the geometry and working load). There are two reasons for the lower amplitude (i.e., lower stress range) when a long washer is used: the first reason is the reduced additional load in the bolt, and the second reason is the reduced additional bending stress in the bolt, which is almost completely eliminated from the bolt threaded region due to the long washer.
- By using a high washer, the critical point of the bolt is shifted from the first contact of the bolt thread with the nut thread to the transition of the shank to the bolt head. The reduced notch effect and larger cross-section at this point greatly increases the fatigue life of the bolt.
- The application of the used analytical method is very challenging when considering the bending stress component in the bolt, as it requires the evaluation of many factors whose values are difficult to determine accurately. This can lead to large deviations from the results obtained by the FEM analysis or experimentaly. For this reason, the analytical results in our research deviate significantly from the experimental or FEM analysis results.
- Note that the mesh size and the type of elements used are known to affect the results of the FEM analyses. For our example, the size of the model is still acceptable, which contains at least three elements in thickness, i.e., about 30,000 elements.
Supplementary Materials
The following are available online at https://www.mdpi.com/2075-4701/11/3/449/s1, a MS Excel workbook with the detailed data of the analytical calculation performed in this article and a more extensive printout of FEM analysis results.
Author Contributions
The authors contributed to the content of the article as follows: conceptualization, S.O., I.O. and J.K.; methodology, I.O., S.O. and J.K.; software, S.O.; validation, I.O., J.K., M.N. and S.O.; formal analysis, S.O. and I.O.; investigation, S.O. and I.O.; resources, J.K. and M.N.; data curation, S.O. and I.O.; writing—original draft preparation, S.O. and I.O.; writing—review and editing, I.O., S.O., J.K. and M.N.; visualization, S.O.; supervision, J.K. and M.N.; project administration, J.K. and M.N.; funding acquisition, J.K. and M.N. All authors have read and agreed to the published version of the manuscript.
Funding
This research was funded by the Slovenian Research Agency (ARRS), grant research programme P2-0182 (R&D evaluations—Razvojna vrednotenja).
Data Availability Statement
The data presented in this study are available online at www.mdpi.com/xxx/s1, as a MS Excel workbook with the detailed data of the analytical calculation performed in this article and a more extensive printout of FEM analysis results.
Conflicts of Interest
The authors declare no conflict of interest. The funders had no role in the design of the study; in the collection, analyses, or interpretation of data; in the writing of the manuscript, or in the decision to publish the results.
References
- Budynas, R.G.; Nisbett, J.K. Shigley’s Mechanical Engineering Design; McGrawHill: New York, NY, USA, 2011. [Google Scholar]
- Niemann, G.; Winter, H.; Höhn, B.R.; Stahl, K. Maschinenelemente 1—Konstruktion und Berechnung von Verbindungen, Lagern, Wellen; Springer: Berlin/Heidelberg, Germany, 2019. [Google Scholar]
- Schmid, S.R.; Hamrock, B.J.; Jacobson, B.O. Fundamentals of Machine Elements; CRC Press: Boca Raton, FL, USA, 2014. [Google Scholar]
- Oman, S.; Nagode, M. Bolted Connection of an End-Plate Cantilever Beam: The Distribution of Operating Force. Stroj. Vestn. J. Mech. Eng. 2017, 63, 617–627. [Google Scholar] [CrossRef] [Green Version]
- Griza, S.; Bertoni, F.; Zanon, G.; Reguly, A.; Strohaecker, T. Fatigue in engine connecting rod bolt due to forming laps. Eng. Fail. Anal. 2009, 16, 1542–1548. [Google Scholar] [CrossRef]
- European Committee for Standardization. EN 1591-1:2014 Flanges and Their Joints—Design Rules for Gasketed Circular Flange Connections—Part 3: Calculation; European Committee for Standardization: Brussels, Belgium, 2014. [Google Scholar]
- Jaszak, P. The elastic serrated gasket of the flange bolted joints. Int. J. Press. Vessel. Pip. 2019, 176, 103954. [Google Scholar] [CrossRef]
- Abid, M.; Nash, D.H.; Javed, S.; Wajid, H.A. Performance of a gasket joint ander bolt up and combined pressure, axial and thermal loading—FEA study. Int. J. Press. Vessel. Pip. 2018, 168, 166–173. [Google Scholar] [CrossRef] [Green Version]
- Jaszak, P.; Adamek, K. Design and analysis of the flange-bolted joint with respect to required tightness and strength. Open Eng. 2019, 9, 338–349. [Google Scholar] [CrossRef]
- Cao, J.; Zhang, Z. Finite element analysis and mathematical characterization of contact pressure distribution in bolted joints. J. Mech. Sci. Technol. 2019, 33, 4715–4725. [Google Scholar] [CrossRef]
- Van-Long, H.; Jean-Pierre, J.; Jean-François, D. Behaviour of bolted flange joints in tubular structures under monotonic, repeated and fatigue loadings I: Experimental tests. J. Constr. Steel Res. 2013, 85, 1–11. [Google Scholar] [CrossRef]
- Shirani, M.; Härkegård, G. Fatigue life distribution and size effect in ductile cast iron for wind turbine components. Eng. Fail. Anal. 2011, 18, 12–24. [Google Scholar] [CrossRef]
- Pavlović, M.; Heistermann, C.; Veljković, M.; Pak, D.; Feldmann, M.; Rebelo, C.; da Silva, L.S. Connections in towers for wind converters, part I: Evaluation of down scaled experiments. J. Constr. Steel Res. 2015, 115, 445–457. [Google Scholar] [CrossRef]
- Ajaei, B.B.; Soyoz, S. Effects of preload deficiency on fatigue demands of wind turbine tower bolts. J. Constr. Steel Res. 2020, 166, 105933. [Google Scholar] [CrossRef]
- Cornwell, R.E. Computation of load factors in bolted connections. Proc. Inst. Mech. Eng. Part C J. Mech. Eng. Sci. 2008, 223, 795–808. [Google Scholar] [CrossRef]
- Cardoso, R.C.; Nascimento, B.L.; Thompson, F.D.F.; Griza, S. Study of bolted joint axial stiffness using finite element analyses, experimental tests, and analytical calculations. Proc. Inst. Mech. Eng. Part C J. Mech. Eng. Sci. 2020, 234, 4671–4681. [Google Scholar] [CrossRef]
- VDI. VDI 2230-1: 2015 Systematic Calculation of Highly Stressed Bolted Joints—Joints with One Cylindrical Bolt; VDI Verlag: Diseldorf, Germany, 2015. [Google Scholar]
- European Committee for Standardization. EN 1092-1:2018 Flanges and Their Joints—Circular Flanges for Pipes, Valves, Fittings and Accessories, PN Designated—Part 1: Steel Flanges; European Committee for Standardization: Brussels, Belgium, 2018. [Google Scholar]
- Zhu, L.; Bouzid, A.-H.; Hong, J. Analytical evaluation of elastic interaction in bolted flange joints. Int. J. Press. Vessel. Pip. 2018, 165, 176–184. [Google Scholar] [CrossRef]
- Wileman, J.; Choudhury, M.; Green, I. Computation of Member Stiffness in Bolted Connections. J. Mech. Des. 1991, 113, 432–437. [Google Scholar] [CrossRef]
- Lehnhoff, T.F.; Ko, K.I.; McKay, M.L. Member Stiffness and Contact Pressure Distribution of Bolted Joints. J. Mech. Des. 1994, 116, 550–557. [Google Scholar] [CrossRef]
- Lehnhoff, T.F.; Bunyard, B.A. Effects of Bolt Threads on the Stiffness of Bolted Joints. J. Press. Vessel. Technol. 2000, 123, 161–165. [Google Scholar] [CrossRef]
- Musto, J.C.; Konkle, N.R. Computation of Member Stiffness in the Design of Bolted Joints. J. Mech. Des. 2005, 128, 1357–1360. [Google Scholar] [CrossRef]
- Naruse, T.; Shibutani, Y. Equivalent stiffness evaluations of clamped plates in bolted joints under loading. J. Solid Mech. Mater. Eng. 2010, 2, 1791–1805. [Google Scholar] [CrossRef] [Green Version]
- Coria, I.; Martin, I.; Bouzid, A.H.; Heras, I.; Abasolo, M. Efficient assembly of bolted joints under external loads using numerical FAM. Int. J. Mech. Sci. 2018, 142, 575–582. [Google Scholar] [CrossRef]
- Williams, J.G.; Anley, R.E.; Nash, D.H.; Gray, T.G.F. Analysis of externaly loaded bolted joints: Analitical, computational and experimental study. Int. J. Press. Vessel. Pip. 2009, 86, 420–427. [Google Scholar] [CrossRef] [Green Version]
- Shi, G.; Shi, Y.; Wang, Y.; Bradford, M.A. Numerical simulation of steel pretensioned bolted end-plate connections of different types and details. Eng. Struct. 2008, 30, 2677–2686. [Google Scholar] [CrossRef]
- Diaz, C.; Victoria, M.; Martí, P.; Querin, O.M.; Martí-Montrull, P. FE model of beam-to-column extended end-plate joints. J. Constr. Steel Res. 2011, 67, 1578–1590. [Google Scholar] [CrossRef]
- Drosopoulos, G.; Stavroulakis, G.; Abdalla, K. 3D Finite element analysis of end—Plate steel joints. Steel Compos. Struct. 2012, 12, 93–115. [Google Scholar] [CrossRef]
- Wang, M.; Shi, Y.; Wang, Y.; Shi, G. Numerical study on seismic behaviours of steel frame end-plate connections. J. Constr. Steel Res. 2013, 90, 140–152. [Google Scholar] [CrossRef]
- Saberi, V.; Gerami, M.; Kheyroddin, A. Comparison of bolted end plate and T-stub connection sensitivity to component thickness. J. Constr. Steel Res. 2014, 98, 134–145. [Google Scholar] [CrossRef]
- El-Khoriby, S.; Sakr, M.A.; Khalifa, T.M.; Eladly, M.M. Modelling and behaviour of beam-to-column connections under axial force and cyclic bending. J. Constr. Steel Res. 2017, 129, 171–184. [Google Scholar] [CrossRef]
- Griza, S.; da Silva, M.E.G.; dos Santos, S.V. The effect of bolt length in the fatigue strength of M24x3 bolt studs. Eng. Fail. Anal. 2013, 34, 397–406. [Google Scholar] [CrossRef]
- Griza, S.; da Silva, M.E.G.; dos Santos, S.V.; Strohaecker, T.R. Experimental evaluation of cyclic stresses on axially loaded bolted joints. Proc. Inst. Mech. Eng. Part C. J. Mech. Eng. Sci. 2016, 230, 2611–2622. [Google Scholar] [CrossRef]
- ECCS. European Recommendations for Bolted Connections in Structural Steelwork; ECCS: Brussels, Belgium, 1985; Volume 38. [Google Scholar]
- Gurney, T.R. Fatigue of Welded Structures; Cambridge University Press: Cambridge, UK, 1968. [Google Scholar]
- European Committee for Standardization. EN 1993-1-9, Eurocode 3: Design of Steel Structures—Part 1–9: Fatigue; European Committee for Standardization (CEN): Brussels, Belgium, 2005. [Google Scholar]
Figure 1.
Force-deformation diagram with symbols and names of forces.

Figure 2.
Shape and dimensions of a bolted joint: (a) with a high washer (HW), (b) with a low washer (LW).
Figure 2.
Shape and dimensions of a bolted joint: (a) with a high washer (HW), (b) with a low washer (LW).

Figure 3.
Basic geometrical model with boundary conditions (example with a high washer and modified bolt).
Figure 3.
Basic geometrical model with boundary conditions (example with a high washer and modified bolt).

Figure 4.
The computational mesh: (a) complete assembly, (b) bolt (example with a high washer and modified bolt).
Figure 4.
The computational mesh: (a) complete assembly, (b) bolt (example with a high washer and modified bolt).

Figure 5.
Results of the finite element (FE) analyses: (a) bolt load (HW—high washer, LW—low washer, HI—hard insert, SI—soft insert, MB—modified bolt); (b) comparison of realistic bolt load and bolt load when the working force is applied under the bolt head and nut (n = 1).
Figure 5.
Results of the finite element (FE) analyses: (a) bolt load (HW—high washer, LW—low washer, HI—hard insert, SI—soft insert, MB—modified bolt); (b) comparison of realistic bolt load and bolt load when the working force is applied under the bolt head and nut (n = 1).

Figure 6.
Results of the FE analyses: extraction of axial bolt stress (legend is only valid for the displayed slice of elements).
Figure 6.
Results of the FE analyses: extraction of axial bolt stress (legend is only valid for the displayed slice of elements).

Figure 7.
Results of the FE analyses: (a) bending to axial tension stress ratio in the bolt; (b) axial stress in the bolt at various positions.
Figure 7.
Results of the FE analyses: (a) bending to axial tension stress ratio in the bolt; (b) axial stress in the bolt at various positions.

Figure 8.
Results of the FE analyses: additional bending to additional axial tension stress ratio in the bolt.
Figure 8.
Results of the FE analyses: additional bending to additional axial tension stress ratio in the bolt.

Figure 9.
Results of the FE analyses: demonstration of flange and bolt deformation at high working load using a deformation scale factor of 100 for high (left) and low washer (right).
Figure 9.
Results of the FE analyses: demonstration of flange and bolt deformation at high working load using a deformation scale factor of 100 for high (left) and low washer (right).

Figure 10.
Used test rig and other measuring equipment.

Figure 11.
Measured and numerically calculated bolt load depending on the applied working load.

Figure 12.
S-N curve for bolts for 95% survival rate [37].
Figure 12.
S-N curve for bolts for 95% survival rate [37].

Figure 13.
Control point locations for determination of the nominal stress range.


Table 1.
Bolted joint resilience and bolt stress ranges (HW—high washer, LW—low washer, HI—hard insert, SI—soft insert, MB—modified bolt).
Table 1.
Bolted joint resilience and bolt stress ranges (HW—high washer, LW—low washer, HI—hard insert, SI—soft insert, MB—modified bolt).
| Geometry | δS [mm/N] | δP [mm/N] | δP* [mm/N] | δP** [mm/N] | n | φen* [−] | FA [kN] | FSA [kN] | σSAt [MPa] | σSAb* [MPa] | σabr [MPa] |
|---|---|---|---|---|---|---|---|---|---|---|---|
| HW-HI-MB | 3.06 × 10⁻⁶ | 1.07 × 10⁻⁶ | 1.07 × 10⁻⁶ | 1.07 × 10⁻⁶ | 0.1 | 0.026 | 13.6 | 0.36 | 1.45 | 9.44 | 10.89 |
| HW-SI-MB | 3.06 × 10⁻⁶ | 2.04 × 10⁻⁶ | 2.04 × 10⁻⁶ | 2.04 × 10⁻⁶ | 0.1 | 0.040 | 13.6 | 0.55 | 2.23 | 25.15 | 27.38 |
| LW-HI | 1.53 × 10⁻⁶ | 3.19 × 10⁻⁷ | 1.29 × 10⁻⁷ | 1.31 × 10⁻⁷ | 0.3 | 0.021 | 13.6 | 0.29 | 1.15 | 20.86 | 22.01 |
| LW-SI | 1.53 × 10⁻⁶ | 1.28 × 10⁻⁶ | 1.34 × 10⁻⁶ | 7.57 × 10⁻⁷ | 0.3 | 0.079 | 13.6 | 1.08 | 4.41 | 52.32 | 56.73 |
| HW-HI-MB, n = 1 | 3.06 × 10⁻⁶ | 1.07 ×1 0−6 | 1.07 × 10⁻⁶ | 1.07 × 10⁻⁶ | 1.0 | 0.260 | 13.6 | 3.56 | 14.51 | 0.00 | 14.51 |
| HW-SI-MB, n = 1 | 3.06 × 10⁻⁶ | 2.04 ×1 0−6 | 2.04 × 10⁻⁶ | 2.04 × 10⁻⁶ | 1.0 | 0.400 | 13.6 | 5.47 | 22.31 | 0.00 | 22.31 |
| LW-HI, n = 1 | 1.53 × 10⁻⁶ | 3.62 × 10⁻⁷ | 3.62 × 10⁻⁷ | 3.62 × 10⁻⁷ | 1.0 | 0.171 | 13.6 | 2.33 | 9.52 | 0.00 | 9.52 |
| LW-SI, n = 1 | 1.53 × 10⁻⁶ | 1.32 × 10⁻⁶ | 1.32 × 10⁻⁶ | 1.32 × 10⁻⁶ | 1.0 | 0.446 | 13.6 | 6.10 | 24.92 | 0.00 | 24.92 |
Stress range is calculated for an alternating load: σSAbu = 0.
Table 2.
Influence of the size and type of elements on FEM results.
| Mesh Size Description | Number of Elements | Number of Nodes | Elements Type | FA [kN] | FSA [kN] | σSAt [MPa] | σSAb* [MPa] |
|---|---|---|---|---|---|---|---|
| 3 or more elements by thickness | 219,398 | 956,641 | Quadratic | 13.6 | 0.141 | 0.448 | 1.266 |
| 3 or more elements by thickness | 219,398 | 245,993 | Linear | 13.6 | 0.139 | 0.442 | 1.275 |
| 3 elements by thickness | 29,774 | 144,073 | Quadratic | 13.6 | 0.128 | 0.406 | 1.108 |
| 3 elements by thickness | 29,774 | 38,232 | Linear | 13.6 | 0.125 | 0.397 | 1.124 |
| 1-2 elements by thickness | 5596 | 29,060 | Quadratic | 13.6 | 0.146 | 0.464 | 1.387 |
| 1-2 elements by thickness | 5596 | 7891 | Linear | 13.6 | 0.101 | 0.321 | 0.918 |
| Quadratic elements: C3D20R | - | - | - | - | - | - | |
| Linear elements: C3D8R | - | - | - | - | - | - | |
Table 3.
Comparison of analytically and numerically calculated additional bolt forces, tensile stress ranges, bending stress ranges and total stress ranges at working load of 13.6 kN (HW—high washer, LW—low washer, HI—hard insert, SI—soft insert, MB—modified bolt).
Table 3.
Comparison of analytically and numerically calculated additional bolt forces, tensile stress ranges, bending stress ranges and total stress ranges at working load of 13.6 kN (HW—high washer, LW—low washer, HI—hard insert, SI—soft insert, MB—modified bolt).
| Analysis Type | Geometry | FA [kN] | FSA [kN] | σSAt [MPa] | σSAb* [MPa] | σSAb [MPa] |
|---|---|---|---|---|---|---|
| Analytical | HW-HI-MB | 13.6 | 0.356 | 1.5 | 9.4 | 10.9 |
| HW-SI-MB | 13.6 | 0.547 | 2.2 | 25.2 | 27.4 | |
| LW-HI | 13.6 | 0.281 | 1.1 | 20.8 | 22.0 | |
| LW-SI | 13.6 | 1.080 | 4.4 | 52.3 | 56.7 | |
| Numerical: Thread | HW-HI-MB | 13.6 | 0.112 | 0.5 | 0.2 | 0.6 |
| HW-SI-MB | 13.6 | 1.553 | 6.3 | 1.7 | 8.0 | |
| LW-HI | 13.6 | 0.257 | 1.0 | 1.8 | 2.8 | |
| LW-SI | 13.6 | 3.074 | 12.5 | 11.2 | 23.8 |
Table 4.
Determined stress ranges σabr (MPa) gained by numerical and analytical analyses for different working loads (for the numerical analyses bold values indicate a critical case).
Table 4.
Determined stress ranges σabr (MPa) gained by numerical and analytical analyses for different working loads (for the numerical analyses bold values indicate a critical case).
| Analysis Type | Geometry | Work Load [kN] | |||||||
|---|---|---|---|---|---|---|---|---|---|
| 6.84 | 13.68 | 20.53 | 27.37 | 34.2 | 41.05 | 47.89 | 54.74 | ||
| Numerical: Head-Shank Transition | HW-HI-MB | 0.39 | 1.91 | 6.05 | 16.78 | 33.21 | 52.42 | 73.44 | 95.35 |
| HW-HI | 0.27 | 1.72 | 6.02 | 17.67 | 35.79 | 56.94 | 79.68 | 98.91 | |
| HW-SI-MB | 6.40 | 13.74 | 23.10 | 33.52 | 45.16 | 59.29 | 76.33 | 94.20 | |
| HW-SI | 7.25 | 15.53 | 26.14 | 37.91 | 50.75 | 65.63 | 83.17 | 97.98 | |
| LW-HI | 0.31 | 2.12 | 7.49 | 21.36 | 42.16 | 66.02 | 91.57 | 118.23 | |
| LW-SI | 9.03 | 19.33 | 32.62 | 47.62 | 64.29 | 81.39 | 100.91 | 122.87 | |
| Numerical: Thread | HW-HI-MB | 0.05 | 0.61 | 2.49 | 8.29 | 18.26 | 30.78 | 45.36 | 61.47 |
| HW-HI | 0.02 | 0.52 | 2.24 | 7.54 | 16.70 | 28.23 | 41.74 | 59.87 | |
| HW-SI-MB | 3.69 | 8.02 | 14.10 | 21.70 | 29.90 | 38.54 | 49.10 | 60.20 | |
| HW-SI | 3.42 | 7.43 | 13.14 | 20.37 | 28.23 | 36.00 | 45.85 | 59.40 | |
| LW-HI | 0.48 | 2.84 | 9.58 | 26.65 | 52.20 | 81.51 | 112.96 | 145.82 | |
| LW-SI | 11.10 | 23.77 | 40.16 | 58.75 | 79.48 | 100.67 | 124.67 | 151.56 | |
| Analytical | HW-HI-MB | 5.44 | 10.89 | 16.33 | 21.77 | 27.22 | 32.66 | 38.10 | 43.55 |
| HW-SI-MB | 13.69 | 27.38 | 41.07 | 54.77 | 68.46 | 82.15 | 95.84 | 109.53 | |
| LW-HI | 11.00 | 21.99 | 32.99 | 43.98 | 54.98 | 65.97 | 76.97 | 87.96 | |
| LW-SI | 28.35 | 56.71 | 85.06 | 113.41 | 141.77 | 170.12 | 198.47 | 226.82 | |
Table 5.
Fatigue life assessment of the bolt for numerically and analytically gained stress ranges (number of cycles to failure)—(for the numerical analyses bold values indicate a critical case).
Table 5.
Fatigue life assessment of the bolt for numerically and analytically gained stress ranges (number of cycles to failure)—(for the numerical analyses bold values indicate a critical case).
| Analysis Type | Geometry | Work Load [kN] | |||||||
|---|---|---|---|---|---|---|---|---|---|
| 6.84 | 13.68 | 20.53 | 27.37 | 34.2 | 41.05 | 47.89 | 54.74 | ||
| Numerical: Head-Shank Transition | HW-HI-MB | INF | INF | INF | INF | 8.40 × 10⁶ | 1.74 × 10⁶ | 6.31 × 10⁵ | 2.88 × 10⁵ |
| HW-HI | INF | INF | INF | INF | 5.78 × 10⁶ | 1.35 × 10⁶ | 4.94 × 10⁵ | 2.58 × 10⁵ | |
| HW-SI-MB | INF | INF | 5.16 × 10⁷ | 8.02 × 10⁶ | 2.71 × 10⁶ | 1.20 × 10⁶ | 5.62 × 10⁵ | 2.99 × 10⁵ | |
| HW-SI | INF | INF | 2.78 × 10⁷ | 4.59 × 10⁶ | 1.91 × 10⁶ | 8.84 × 10⁵ | 4.35 × 10⁵ | 2.66 × 10⁵ | |
| LW-HI | INF | INF | INF | 7.64 × 10⁷ | 3.34 × 10⁶ | 8.69 × 10⁵ | 3.26 × 10⁵ | 1.51 × 10⁵ | |
| LW-SI | INF | INF | 9.18 × 10⁶ | 2.31 × 10⁶ | 9.41 × 10⁵ | 4.64 × 10⁵ | 2.43 × 10⁵ | 1.35 × 10⁵ | |
| Numerical: Thread | HW-HI-MB | INF | INF | INF | INF | INF | 1.23 × 10⁷ | 2.68 × 10⁶ | 1.08 × 10⁶ |
| HW-HI | INF | INF | INF | INF | INF | 1.89 × 10⁷ | 3.44 × 10⁶ | 1.16 × 10⁶ | |
| HW-SI-MB | INF | INF | INF | 7.05 × 10⁷ | 1.42 × 10⁷ | 4.37 × 10⁶ | 2.11 × 10⁶ | 1.15 × 10⁶ | |
| HW-SI | INF | INF | INF | 9.68 × 10⁷ | 1.89 × 10⁷ | 5.61 × 10⁶ | 2.59 × 10⁶ | 1.19 × 10⁶ | |
| LW-HI | INF | INF | INF | 2.52 × 10⁷ | 1.76 × 10⁶ | 4.62 × 10⁵ | 1.73 × 10⁵ | 8.06 × 10⁴ | |
| LW-SI | INF | 4.47 × 10⁷ | 3.86 × 10⁶ | 1.23 × 10⁵ | 4.98 × 10⁵ | 2.45 × 10⁵ | 1.29 × 10⁵ | 7.1 × 10⁴ | |
| Analytical | HW-HI-MB | INF | INF | INF | 6.93 × 10⁷ | 2.27 × 10⁷ | 9.13 × 10⁶ | 4.52 × 10⁶ | 3.03 × 10⁶ |
| HW-SI-MB | INF | 2.20 × 10⁷ | 3.61 × 10⁶ | 1.52 × 10⁶ | 7.79 × 10⁵ | 4.51 × 10⁵ | 2.84 × 10⁵ | 1.90 × 10⁵ | |
| LW-HI | INF | 6.60 × 10⁷ | 8.69 × 10⁶ | 2.94 × 10⁶ | 1.50 × 10⁶ | 8.71 × 10⁵ | 5.48 × 10⁵ | 3.67 × 10⁵ | |
| LW-SI | 1.85 × 10⁷ | 1.37 × 10⁶ | 4.06 × 10⁵ | 1.71 × 10⁵ | 8.77 × 10⁴ | 5.08 × 10⁴ | 3.20 × 10⁴ | 2.14 × 10⁴ | |
Publisher’s Note: MDPI stays neutral with regard to jurisdictional claims in published maps and institutional affiliations. |
© 2021 by the authors. Licensee MDPI, Basel, Switzerland. This article is an open access article distributed under the terms and conditions of the Creative Commons Attribution (CC BY) license (http://creativecommons.org/licenses/by/4.0/).
Share and Cite
MDPI and ACS Style
Okorn, I.; Nagode, M.; Klemenc, J.; Oman, S. Analysis of Additional Load and Fatigue Life of Preloaded Bolts in a Flange Joint Considering a Bolt Bending Load. Metals 2021, 11, 449. https://doi.org/10.3390/met11030449
AMA Style
Okorn I, Nagode M, Klemenc J, Oman S. Analysis of Additional Load and Fatigue Life of Preloaded Bolts in a Flange Joint Considering a Bolt Bending Load. Metals. 2021; 11(3):449. https://doi.org/10.3390/met11030449
Chicago/Turabian StyleOkorn, Ivan, Marko Nagode, Jernej Klemenc, and Simon Oman. 2021. "Analysis of Additional Load and Fatigue Life of Preloaded Bolts in a Flange Joint Considering a Bolt Bending Load" Metals 11, no. 3: 449. https://doi.org/10.3390/met11030449
Note that from the first issue of 2016, this journal uses article numbers instead of page numbers. See further details here.