
Vibration Damping and Acoustic Behavior of PU-Filled Non-Stochastic Aluminum Cellular Solids


1
CMEMS-UMinho, Campus of Azurém, University of Minho, 4800-058 Guimarães, Portugal
2
MEtRiCS-Mechanical Engineering and Resource Sustainability Center, Campus of Azurém, University pf Minho, 4800-058 Guimarães, Portugal
*
Author to whom correspondence should be addressed.
Metals 2021, 11(5), 725; https://doi.org/10.3390/met11050725
Submission received: 29 March 2021
/
Revised: 17 April 2021
/
Accepted: 26 April 2021
/
Published: 28 April 2021
(This article belongs to the Special Issue Advances and Applications in Cellular Metals)
Abstract
:Aluminum-based cellular solids are promising lightweight structural materials considering their high specific strength and vibration damping, being potential candidates for future railway vehicles with enhanced riding comfort and low fuel consumption. The filling of these lattices with polymer-based (i.e., polyurethane) foams may further improve the overall vibration/noise-damping without significantly increasing their density. This study explores the dynamic (i.e., frequency response) and acoustic properties of unfilled and polyurethane-filled aluminum cellular solids to characterize their behavior and explore their benefits in terms of vibration and noise-damping. It is shown that polyurethane filling can increase the vibration damping and transmission loss, especially if the infiltration process uses flexible foams. Considering sound reflection, however, it is shown that polyurethane filled samples (0.27–0.30 at 300 Hz) tend to display lower values of sound absorption coefficient relatively to unfilled samples (0.75 at 600 Hz), is this attributed to a reduction in overall porosity, tortuosity and flow resistivity. Foam-filled samples (43–44 dB at 700–1200 Hz) were shown to be more suitable to reduce sound transmission rather than reflection than unfilled samples (21 dB at 700 Hz). It was shown that the morphology of these cellular solids might be optimized depending on the desired application: (i) unfilled aluminum cellular solids are appropriate to mitigate internal noises due to their high sound absorption coefficient; and (ii) PU filled cellular solids are appropriate to prevent exterior noises and vibration damping due to their high transmission loss in a wide range of frequencies and vibration damping.
1. Introduction
The European Union has set severe targets to control emissions (CO2), having defined a 60% reduction in fuel consumption-related carbon emissions by 2050 [1]. A specific measure to this reduction is transferring 50% of road passengers to rail and waterborne vehicles. For both users and the neighbors of their infrastructure, the attractiveness of these transports is crucial for this transition. Indeed, the European Commission estimates that a 2255 M€ saving could be achieved soon (2015–2035) by reducing railway noise and vibration [2]. This noise/vibration damping could be promoted by the design of high damping materials with structural (i.e., load-bearing) capacity to produce light vehicles with enhanced passenger comfort and low-energy consumption.
Cellular solids are known as a promising solutions to enhance noise-damping when their source cannot be completely eliminated. For instance, cellular solids have been studied and shown to be viable solutions to reduce sound reflection and propagation [3,4]. Thus, they may be designed to have high sound absorption coefficient and transmission loss values relative to bulk materials [5,6]. Additionally, they have lightweight characteristics due to their low specific density and high specific static/dynamic mechanical properties [7,8]. Given these attractive properties, there is a current trend on exploring cellular solids in applications that classically use bulk materials, especially in the transportation industries.
In applications in which high static loading is also required, these cellular solids have a metallic solid phase [7]. However, it is also known that these metallic cellular solids have lower vibration damping capacity than those with a polymer solid phase [9]. There have been extensive developments in the design and manufacturing of hybrid configurations using the referred composite materials [10,11]. One such approach is the foaming of polymer-based foams within the voids of an architectured metallic lattice.
This study shows an approach to further enhance the vibration and noise-damping capacity of open-cell non-stochastic cellular solids. Samples are impregnated with flexible and rigid polyurethane foams, and their dynamic behavior and acoustic properties are analyzed in both unfilled and filled states. The experimental results are compared with current materials in railway vehicles to determine if the designed cellular solids are interesting solutions for future railway applications. Results show that sample filling has a strong influence on the damping and acoustic behavior of these materials, enabling their tailoring for different application, such as (i) vehicle interior noise mitigation using unfilled samples with high sound absorption coefficient; (ii) or exterior noise/vibration insulation using PU filled samples due to their high transmission loss and damping.
2. Materials and Methods
2.1. Cellular Lattice Design and Manufacturing
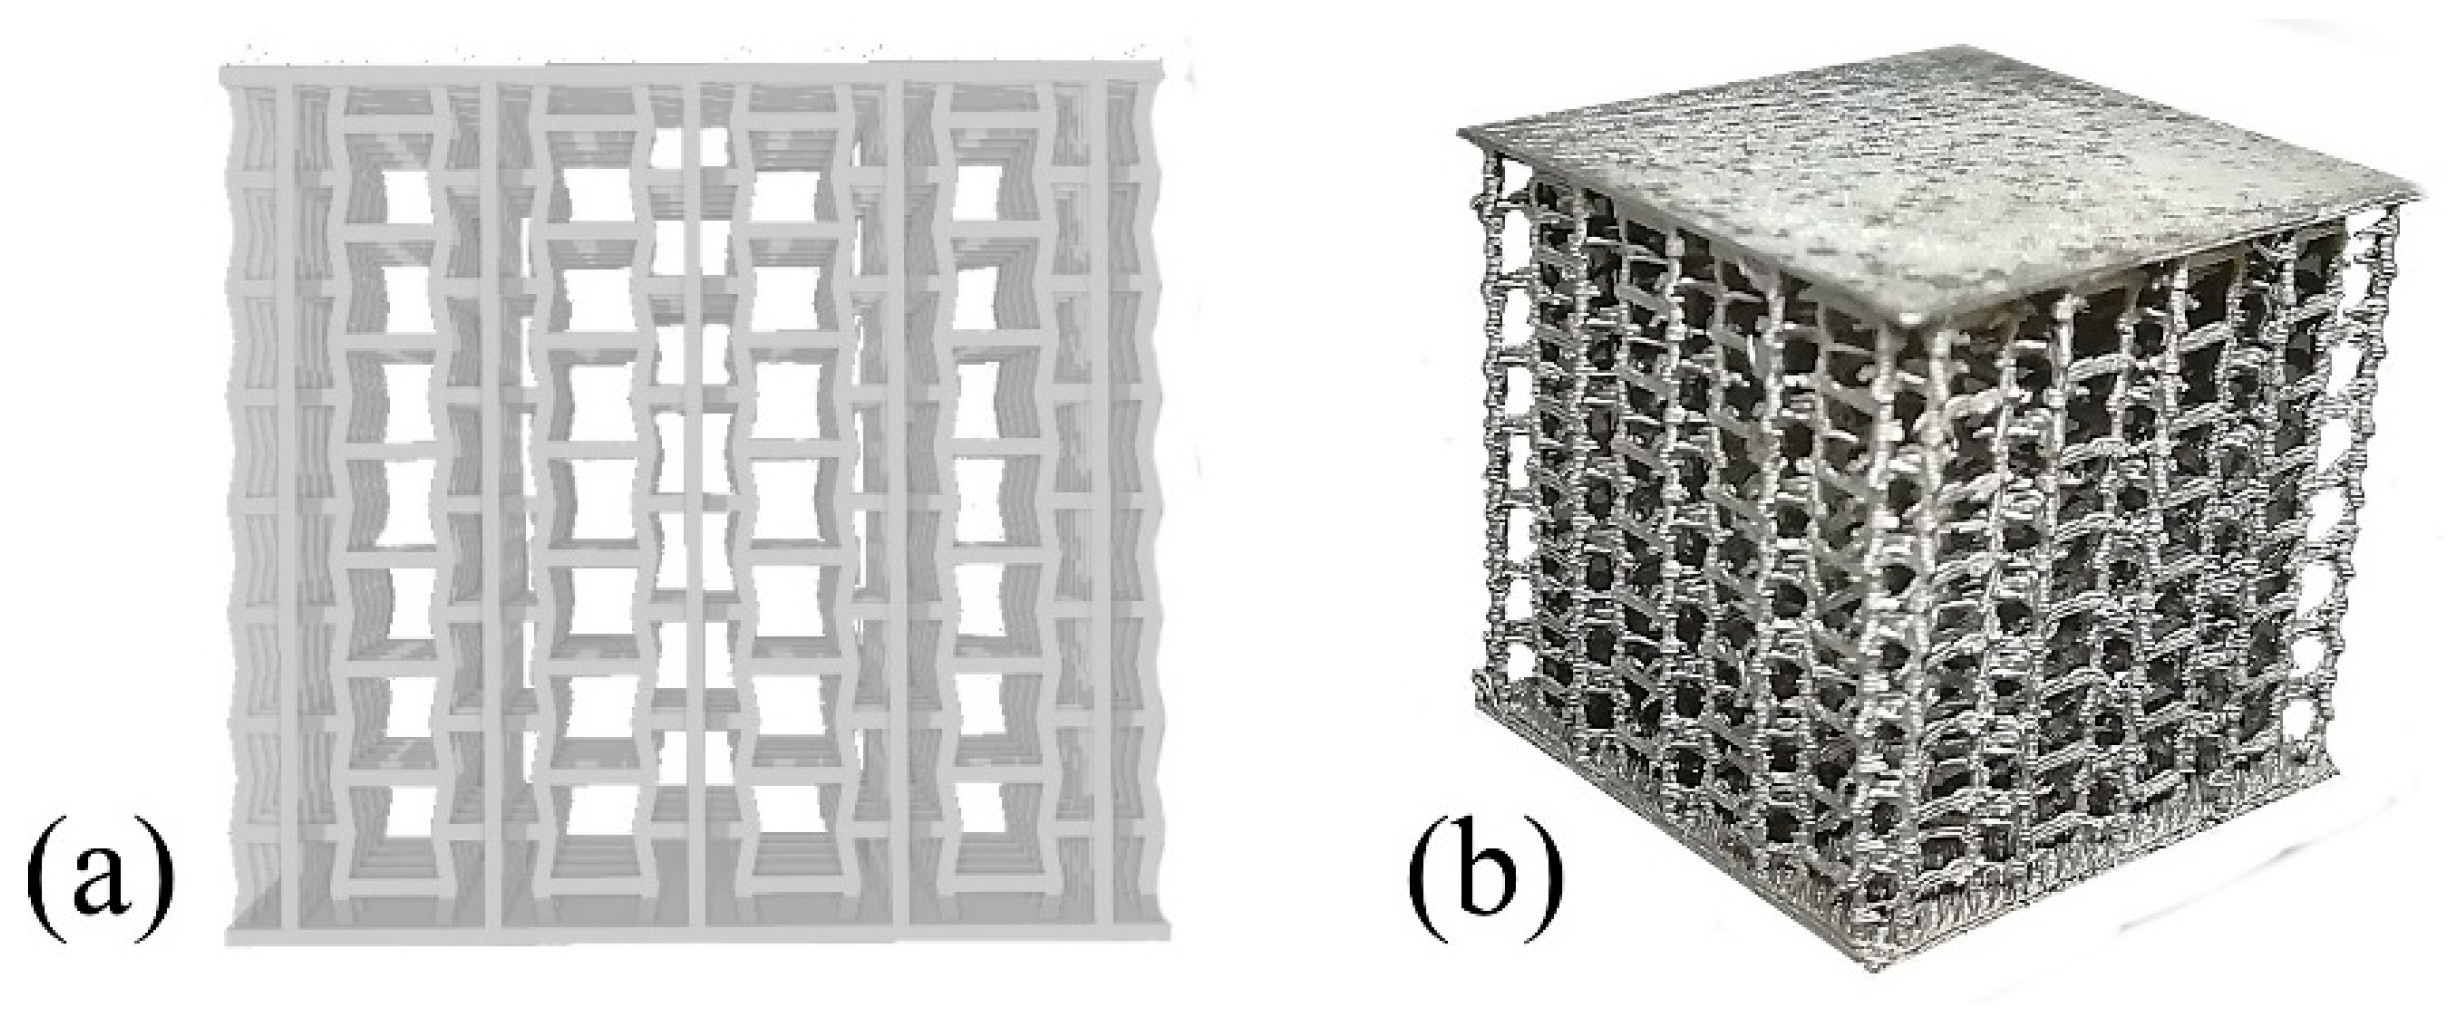
Aluminum-based cellular solids (Figure 1a) were designed in a three-dimensional non-stochastic (9 × 9 × 8 cells—height × width × thickness = 30.18 ± 0.05 mm × 33.59 ± 0.28 mm × 33.59 ± 0.28 mm) configuration with a specific density (ρ*/ρ0) of 0.058 ± 0.005, with periodic cells that resemble inverted (i.e., auxetic) honeycombs as we have detailed in [7] by the periodic distribution o unitary cells with ribs/struts with 2 mm length and 0.6 mm diameter, a rib/strut −10° angle. Two 0.6 mm plates were also included in the top and bottom of the samples.
These designs were manufactured by an additive manufacturing assisted investment casting process, already detailed by the authors in [12] where the samples are manufactured by: (i) 3D-printing a PLA sacrificial model by FFF; (ii) production of gypsum model by the dipping of the sacrificial model, curing the plaster and heat-treating the ceramic to harden it and eliminate the PLA model; (iii) vacuum casting an A356 alloy to obtain the metal sample.
The final shape of the cast and heat-treated (T6) samples may be visualized in Figure 1b. Overall, this process yields fine and detailed ribs/struts with a high-quality microstructure (globular 73 ± 39 μm α-Al grains, modified/refined eutectic Si and absence of significant defects) with good fabrication repeatability and anisotropic behavior [13]. This implies that fabrication-related variations in the tested samples (e.g., dimensional and microstructural changes) do not significantly affect the results of this study.
2.2. Polyurethane Filling
Polymer-based foams are frequently related to noise-damping, having been successfully employed to mitigate this kind of solicitations in many applications [14,15,16]. Considering this, the metallic cellular solids (Figure 1) were infiltrated with polyurethane (PU) foams to determine if this is beneficial for the overall noise mitigation of the designed composites. Given that the mechanical properties of PU are related to its chemical composition and density, the samples were infiltrated with rigid and flexible foams.
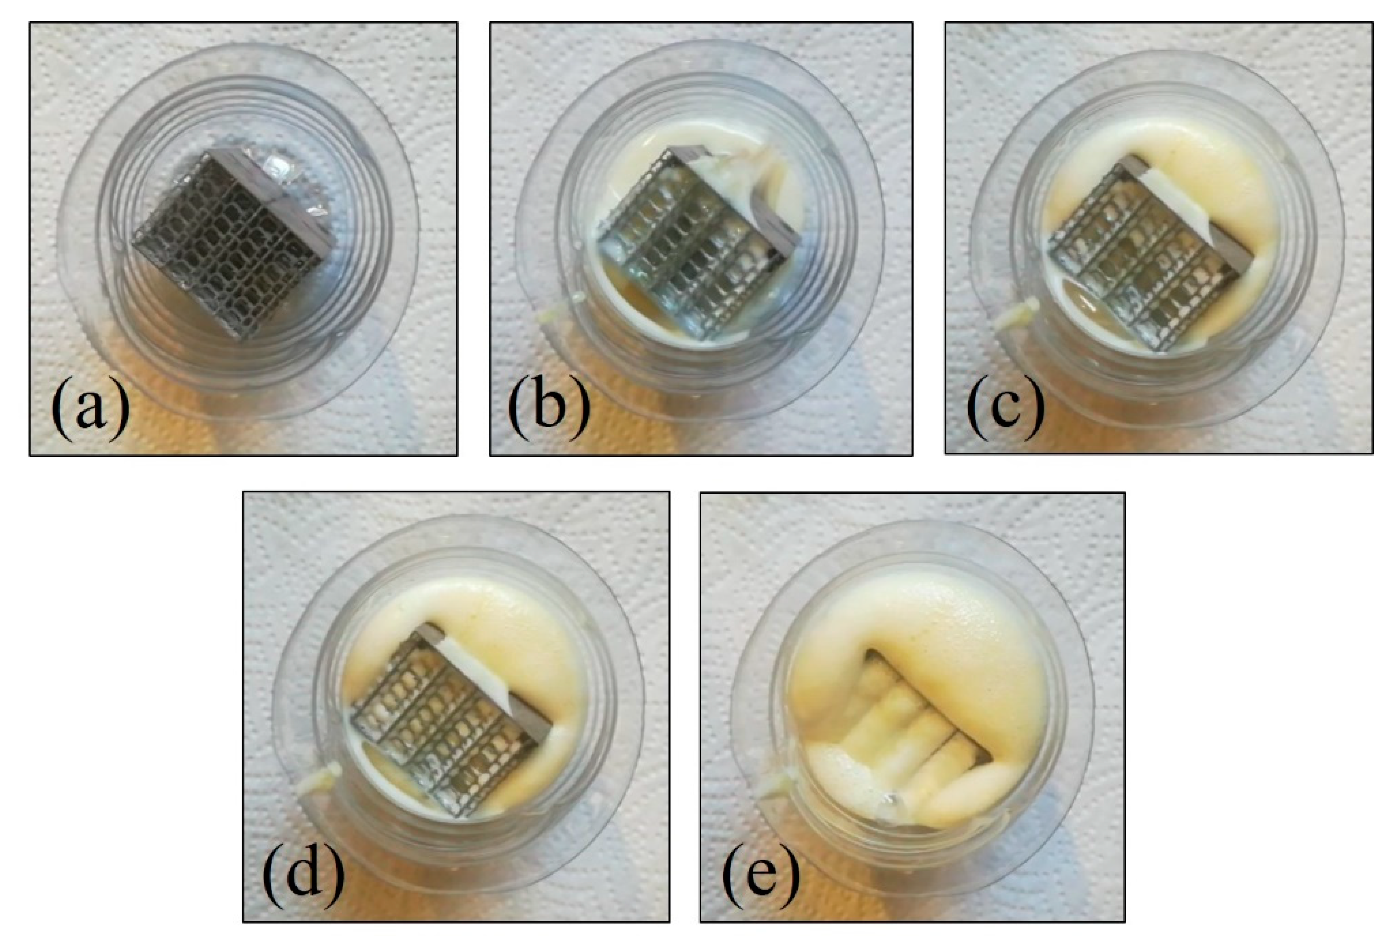
The reagents to manufacture the PU foams (Plastiform foams) were weighted and mixed in a beaker according to the proportions described in Table 1. After a homogenized mixture is achieved, the reagents were cast into a vessel holding a sample (Figure 2a). It may be observed by the progression in Figure 2b–e that the foaming process can penetrate the cellular structure of the sample. The remaining PU foams in the exterior of the sample were removed by a combination of cutting and polishing with SiC paper.
Additionally, the properties of the produced foams may be observed in Table 2. Recurring to this table, it is observed that both flexible and rigid foams are characterized by an open-cell configuration with small changes in their apparent density that was determined by the classic Archimedes approach.
2.3. Vibration Testing
The vibration tests to the samples were performed in accordance with the protocol that was developed by the authors in [7] to characterize the dynamic properties of cellular solids. Samples were fixed to a shaker (LDS V201, Brüel & Kjær, Nærum, Denmark) and load cell (221B02, PCB Piezotronics, Depew, NY, USA) through a tapered hole in their bottom, and their response was measured by a triaxial accelerometer (356A14, PCB Piezotronics, Depew, NY, USA) glued to the top of the sample. Shaker excitation and accelerometer/load cell responses were processed by an LMS Scadas mobile spectrum analyzer (Siemens, Munich, Germany) in a 1000 to 6000 Hz range. This allowed the plotting of the sample frequency response function (FRF) and the estimation of this damping ratio (ξ) by the half-power bandwidth method [17]. A total of five samples were analyzed for each tested configuration (i.e., unfilled, rigid and flexible fillings).
2.4. Acoustic Testing of the Samples
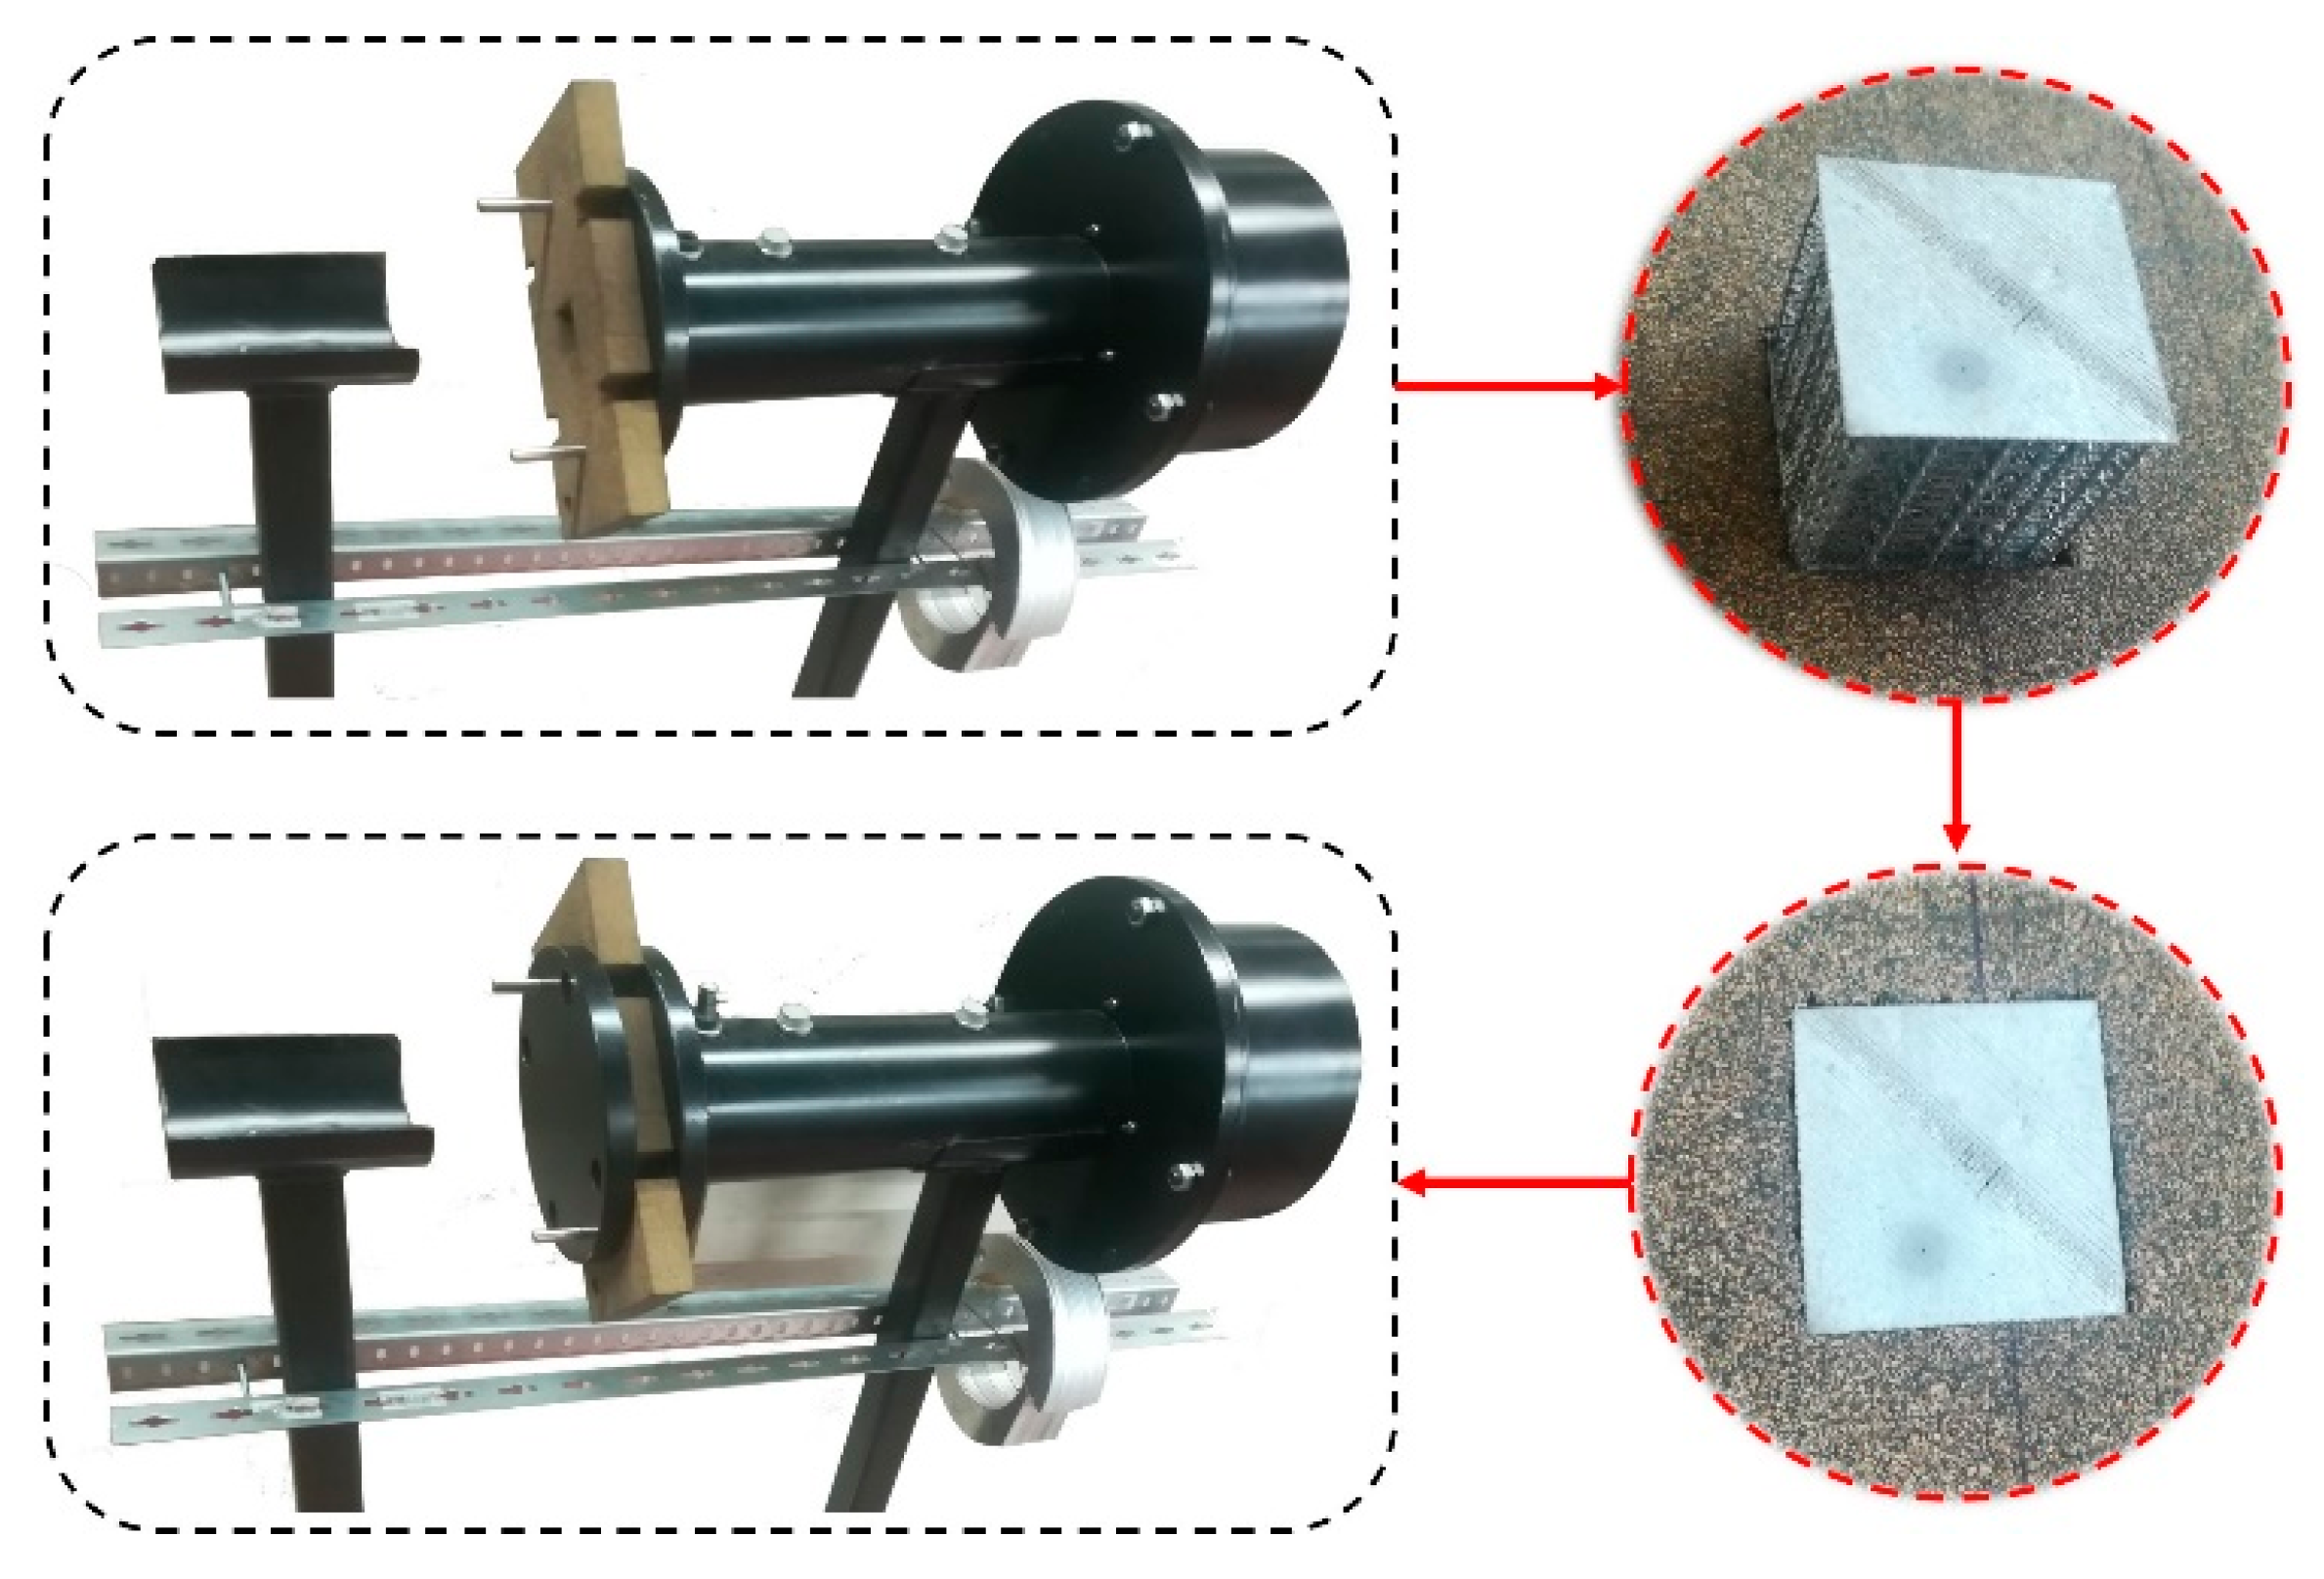
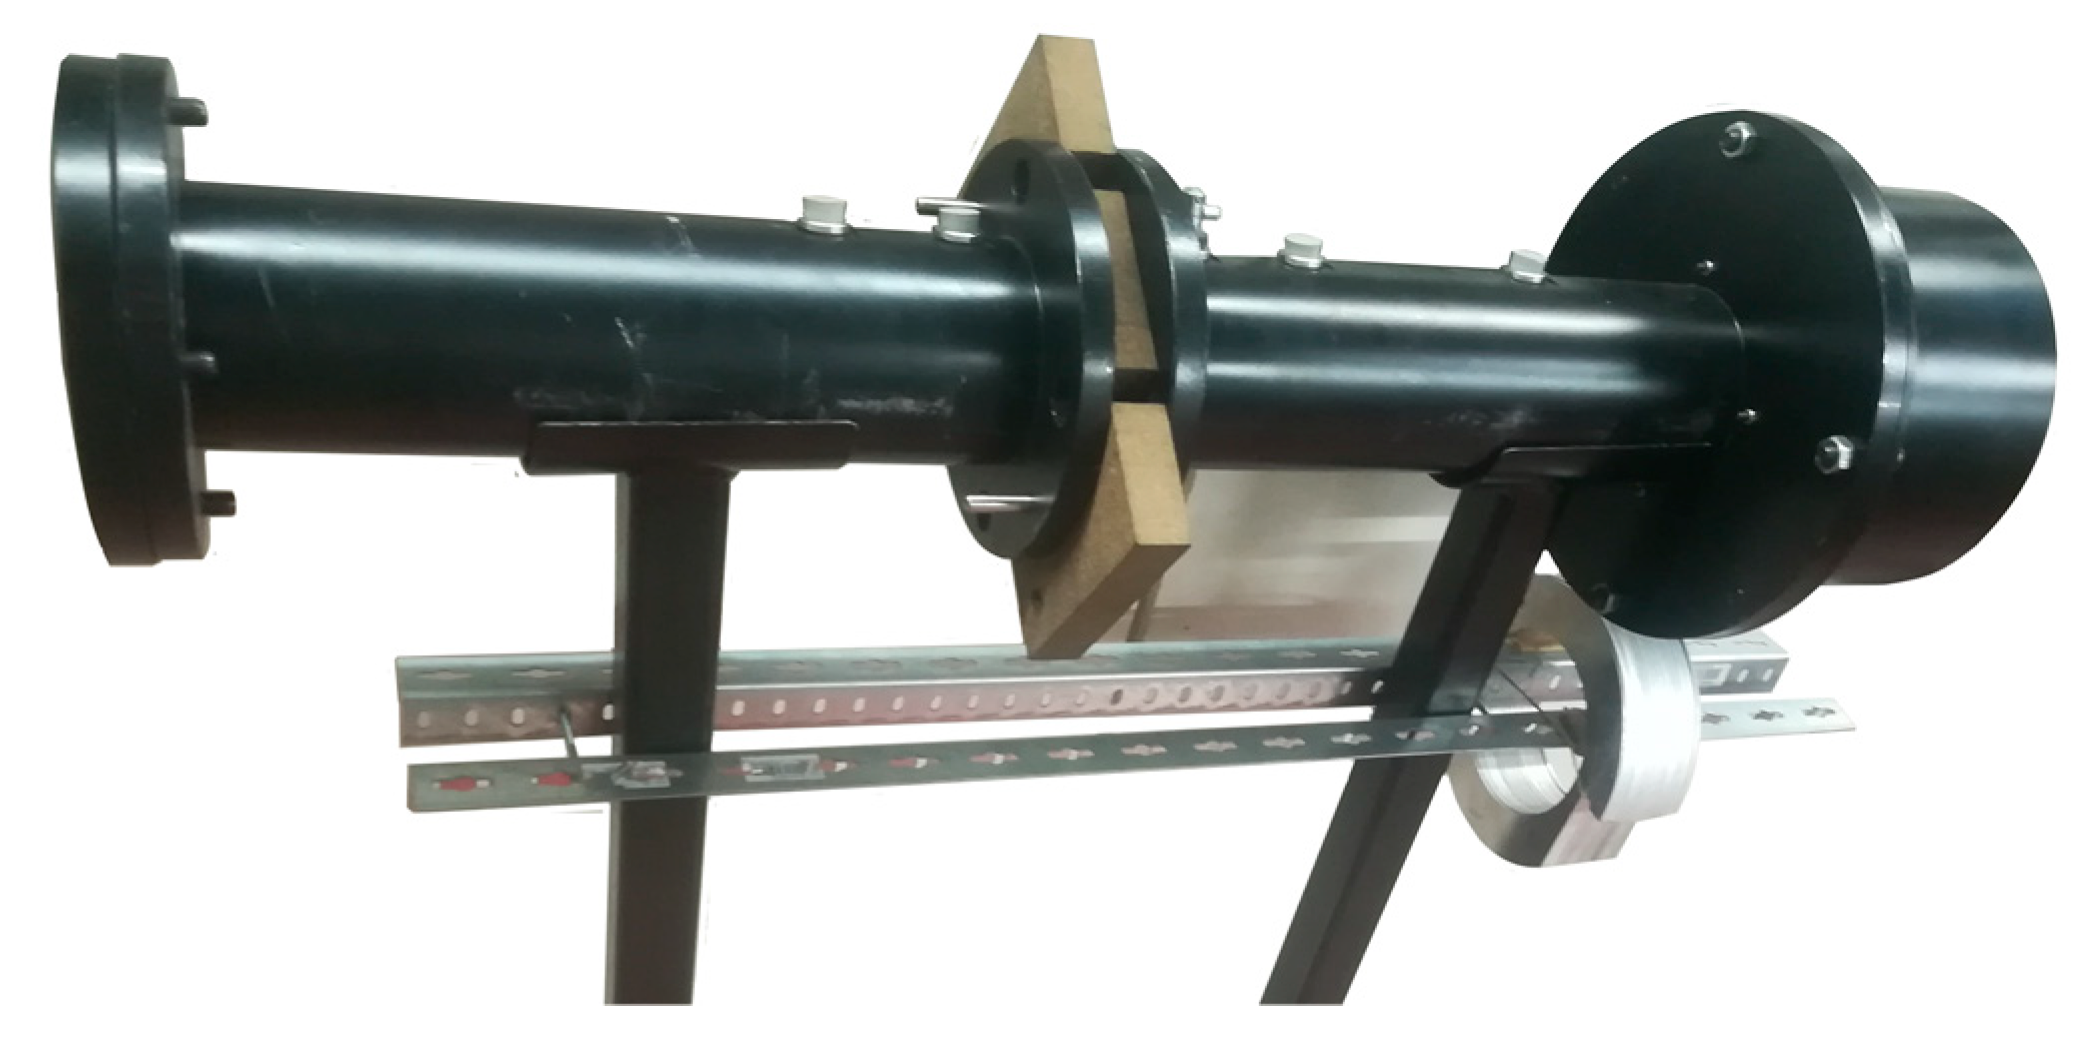
A custom-built impedance tube (Figure 3) was placed inside an anechoic chamber and used to measure the sound absorption coefficient and the transmission loss of the unfilled and foam-filled samples. Due to the geometric characteristics, the tube was designed to be operated in frequencies between 100 Hz and 2000 Hz. Given that the size of the samples (height × width × length = 30.18 ± 0.09 mm × 33.59 ± 0.28 mm × 33.59 ± 0.28 mm) is significantly smaller than the tube diameter (100 mm), a corkboard was cut to accommodate the samples during the tests and make an airtight seal (Figure 3). Previously to the tests, a calibration procedure was performed with the corkboard without the sample to determine the absorption and transmission of the board itself. The equipment software can use this calibration to normalize the final tests and estimate the properties of the sample. A total of five samples were tested for each type (i.e., sound absorption and transmission) of the test.
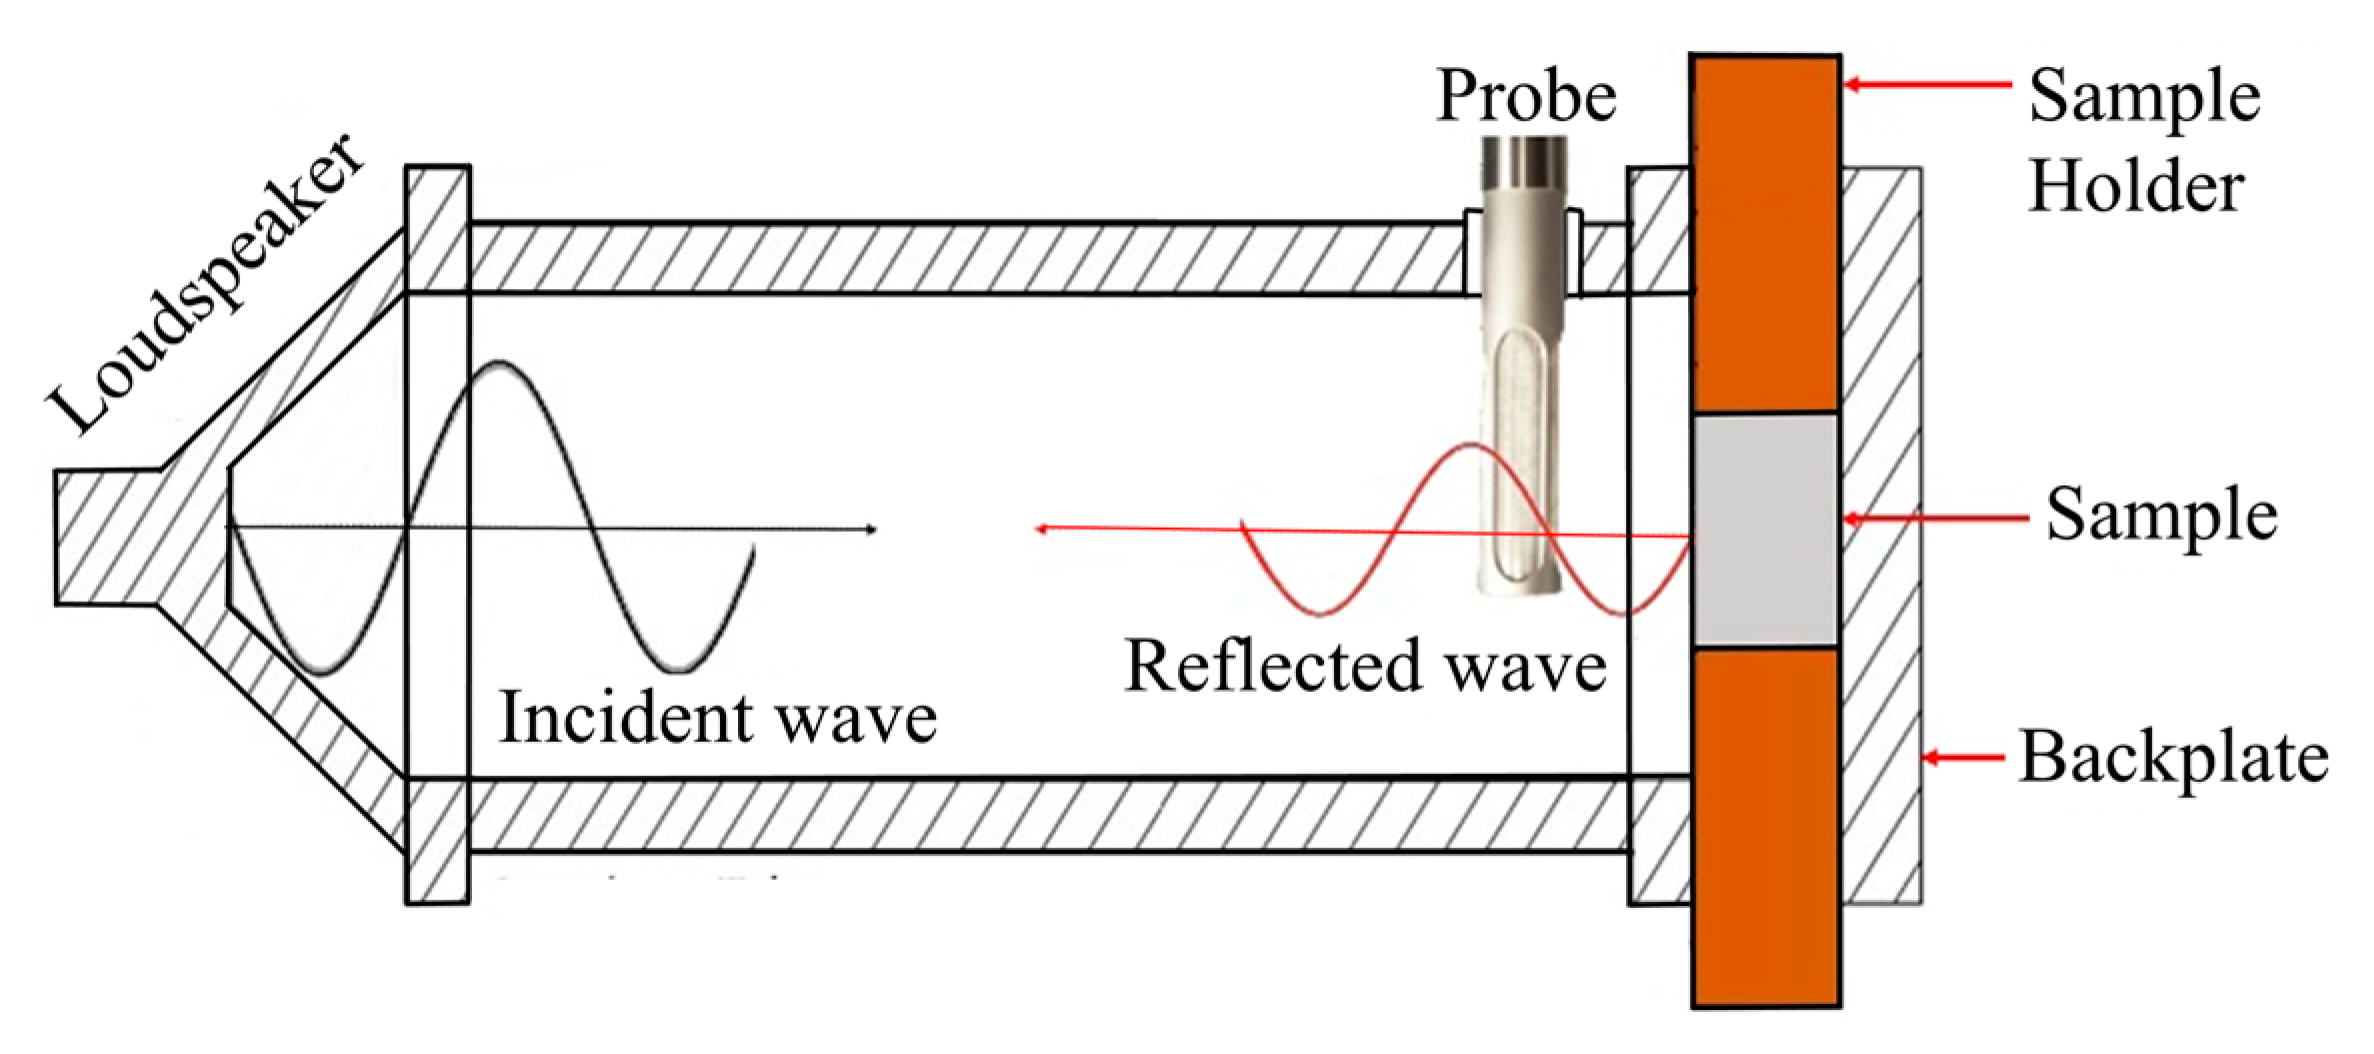
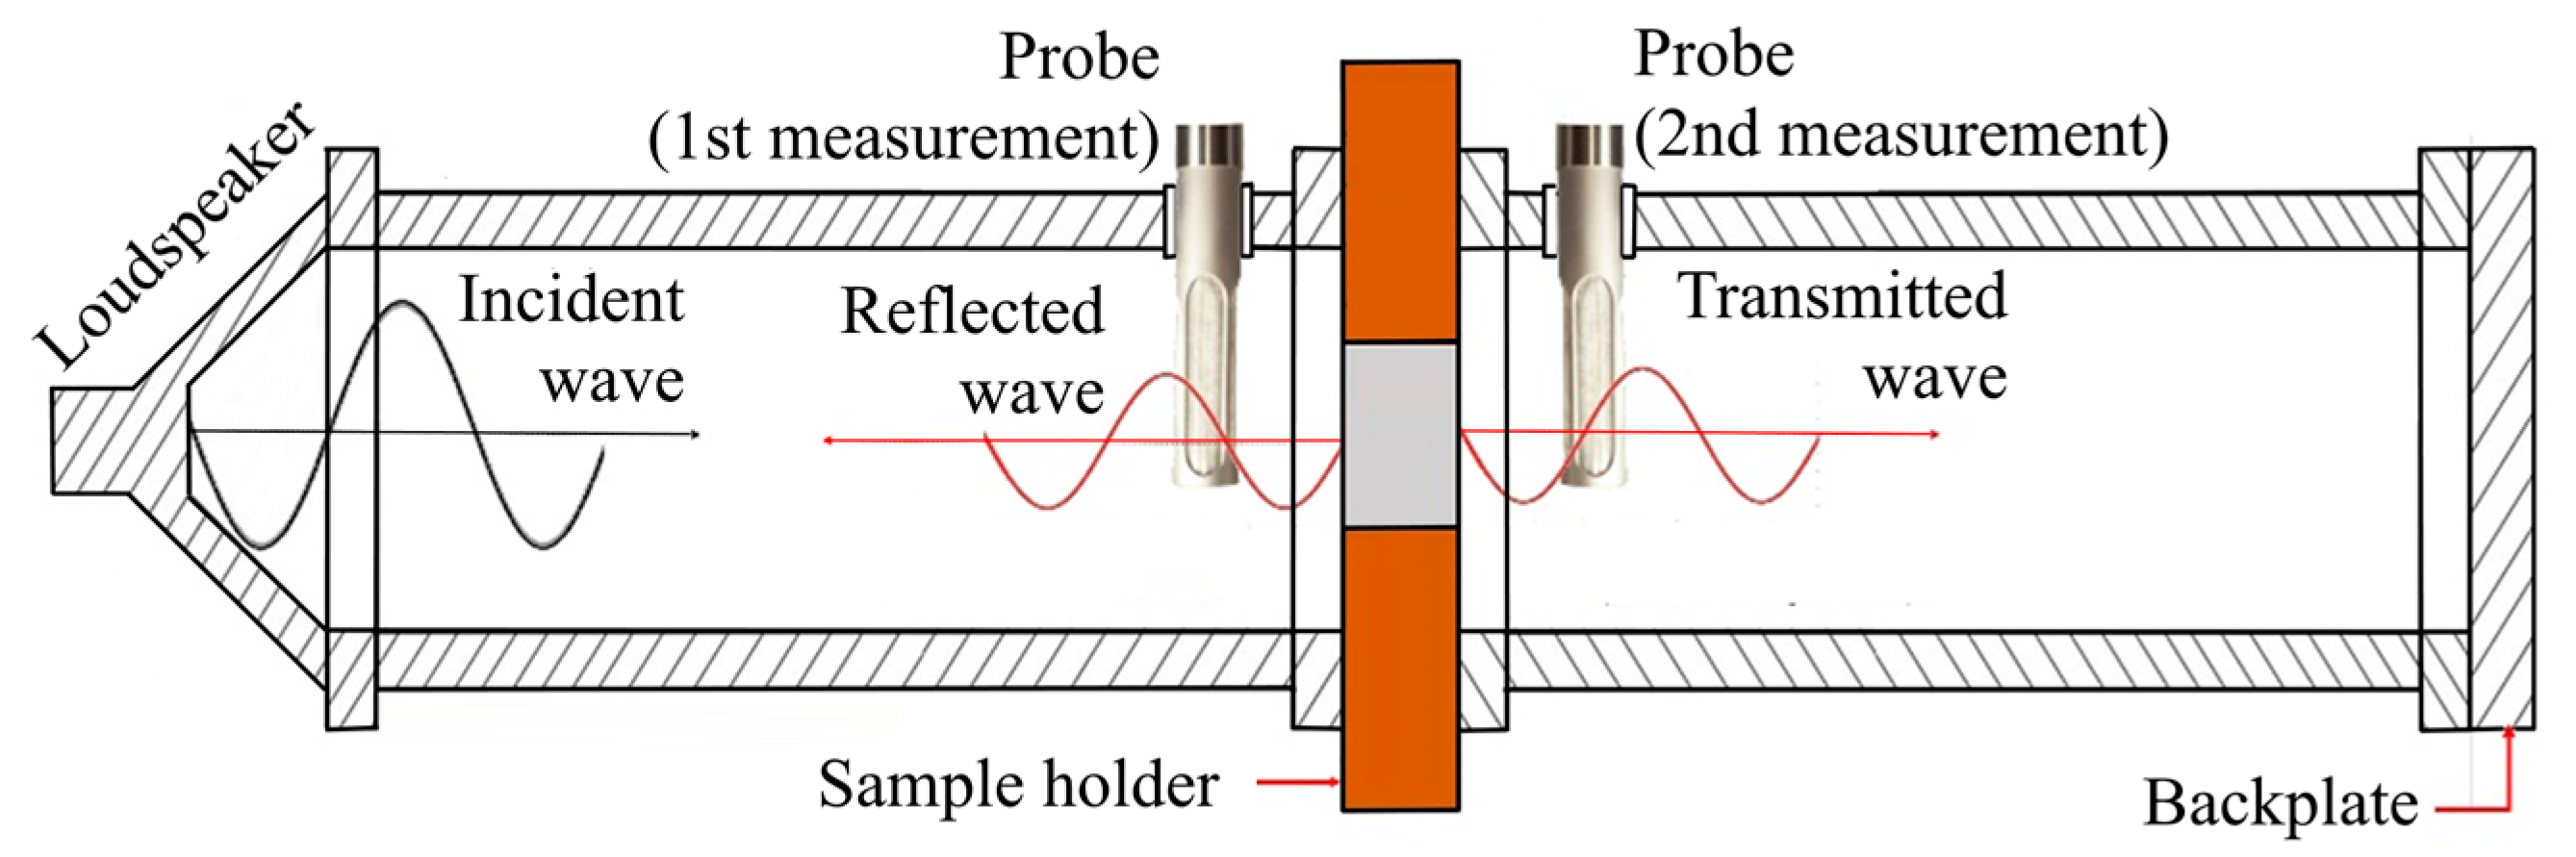
According to the scheme in Figure 4, a random sound signal (100–2000 Hz) is generated by a microflown preamplifier through a loudspeaker and travels in the form of a plane wave inside the tube. The referred wave travels along the tube and ends up hitting the sample as an incident wave (Figure 4). In the sound absorption and acoustic impedance tests, the incident plane wave that is reflected (i.e., reflected wave) is measured by the probe that is placed facing the sample.
The normal sound absorption coefficient (α—Equation (1)) was calculated by monitoring the frequency-dependent reflection coefficient (R(ω)—Equation (2)) on a fixed position (x) [18]. This reflection coefficient is determined by the measurement of the acoustic impedance (Z(ω)) during the test, according to Equation (3), where P is the captures sound pressure level and u the particle velocity [19]:
The reflection coefficient may be influenced by the ambient condition, i.e., it is dependent on the air density (ρ) and speed of sound (C) according to Equations (4) and (5) [20]. These variables are themselves dependent on ambient variables, such as temperature (T, 27 ± 2 °C) and atmospheric pressure (P, 45 ± 3 kPa):
The transmission loss (TL) of the samples was determined using a variation of the previous process. An additional tube length was added to determine the Sound pressure level after the sample, and an additional measurement was performed using the same probe (Figure 5). Transmission loss may be calculated using Equation (6) and the measured transmitted (Zt) and incident (Zi) acoustic impedances [21]. The values of incident acoustic impedance (Zi) were measured recurring to the same method used for the sound absorption coefficient (Equation (3)). As for the transmitted acoustic impedance (Zt) was determined in a similar approach, but by changing the probe to the other side of the sample (Figure 6) to measure the transmitted wave:
The usual process for the determination of the sound absorption coefficient and transmission loss usually includes using two distinct microphones to monitor the differential between sound pressures in different tube locations. These methods are described in the standards ISO 10,534 and ASTM E2611. In this study, a single probe was used for both methods. The probe that was used in this study is part of a novel trend that uses a sensor that can monitor not only the instant values of pressure but also the particle velocity. This way, using only one probe, it is possible to calculate the acoustic impedance. This approach has been proved valid, and its results are highly correlated with those obtained using the classic standards [22,23,24,25].
3. Results and Discussion
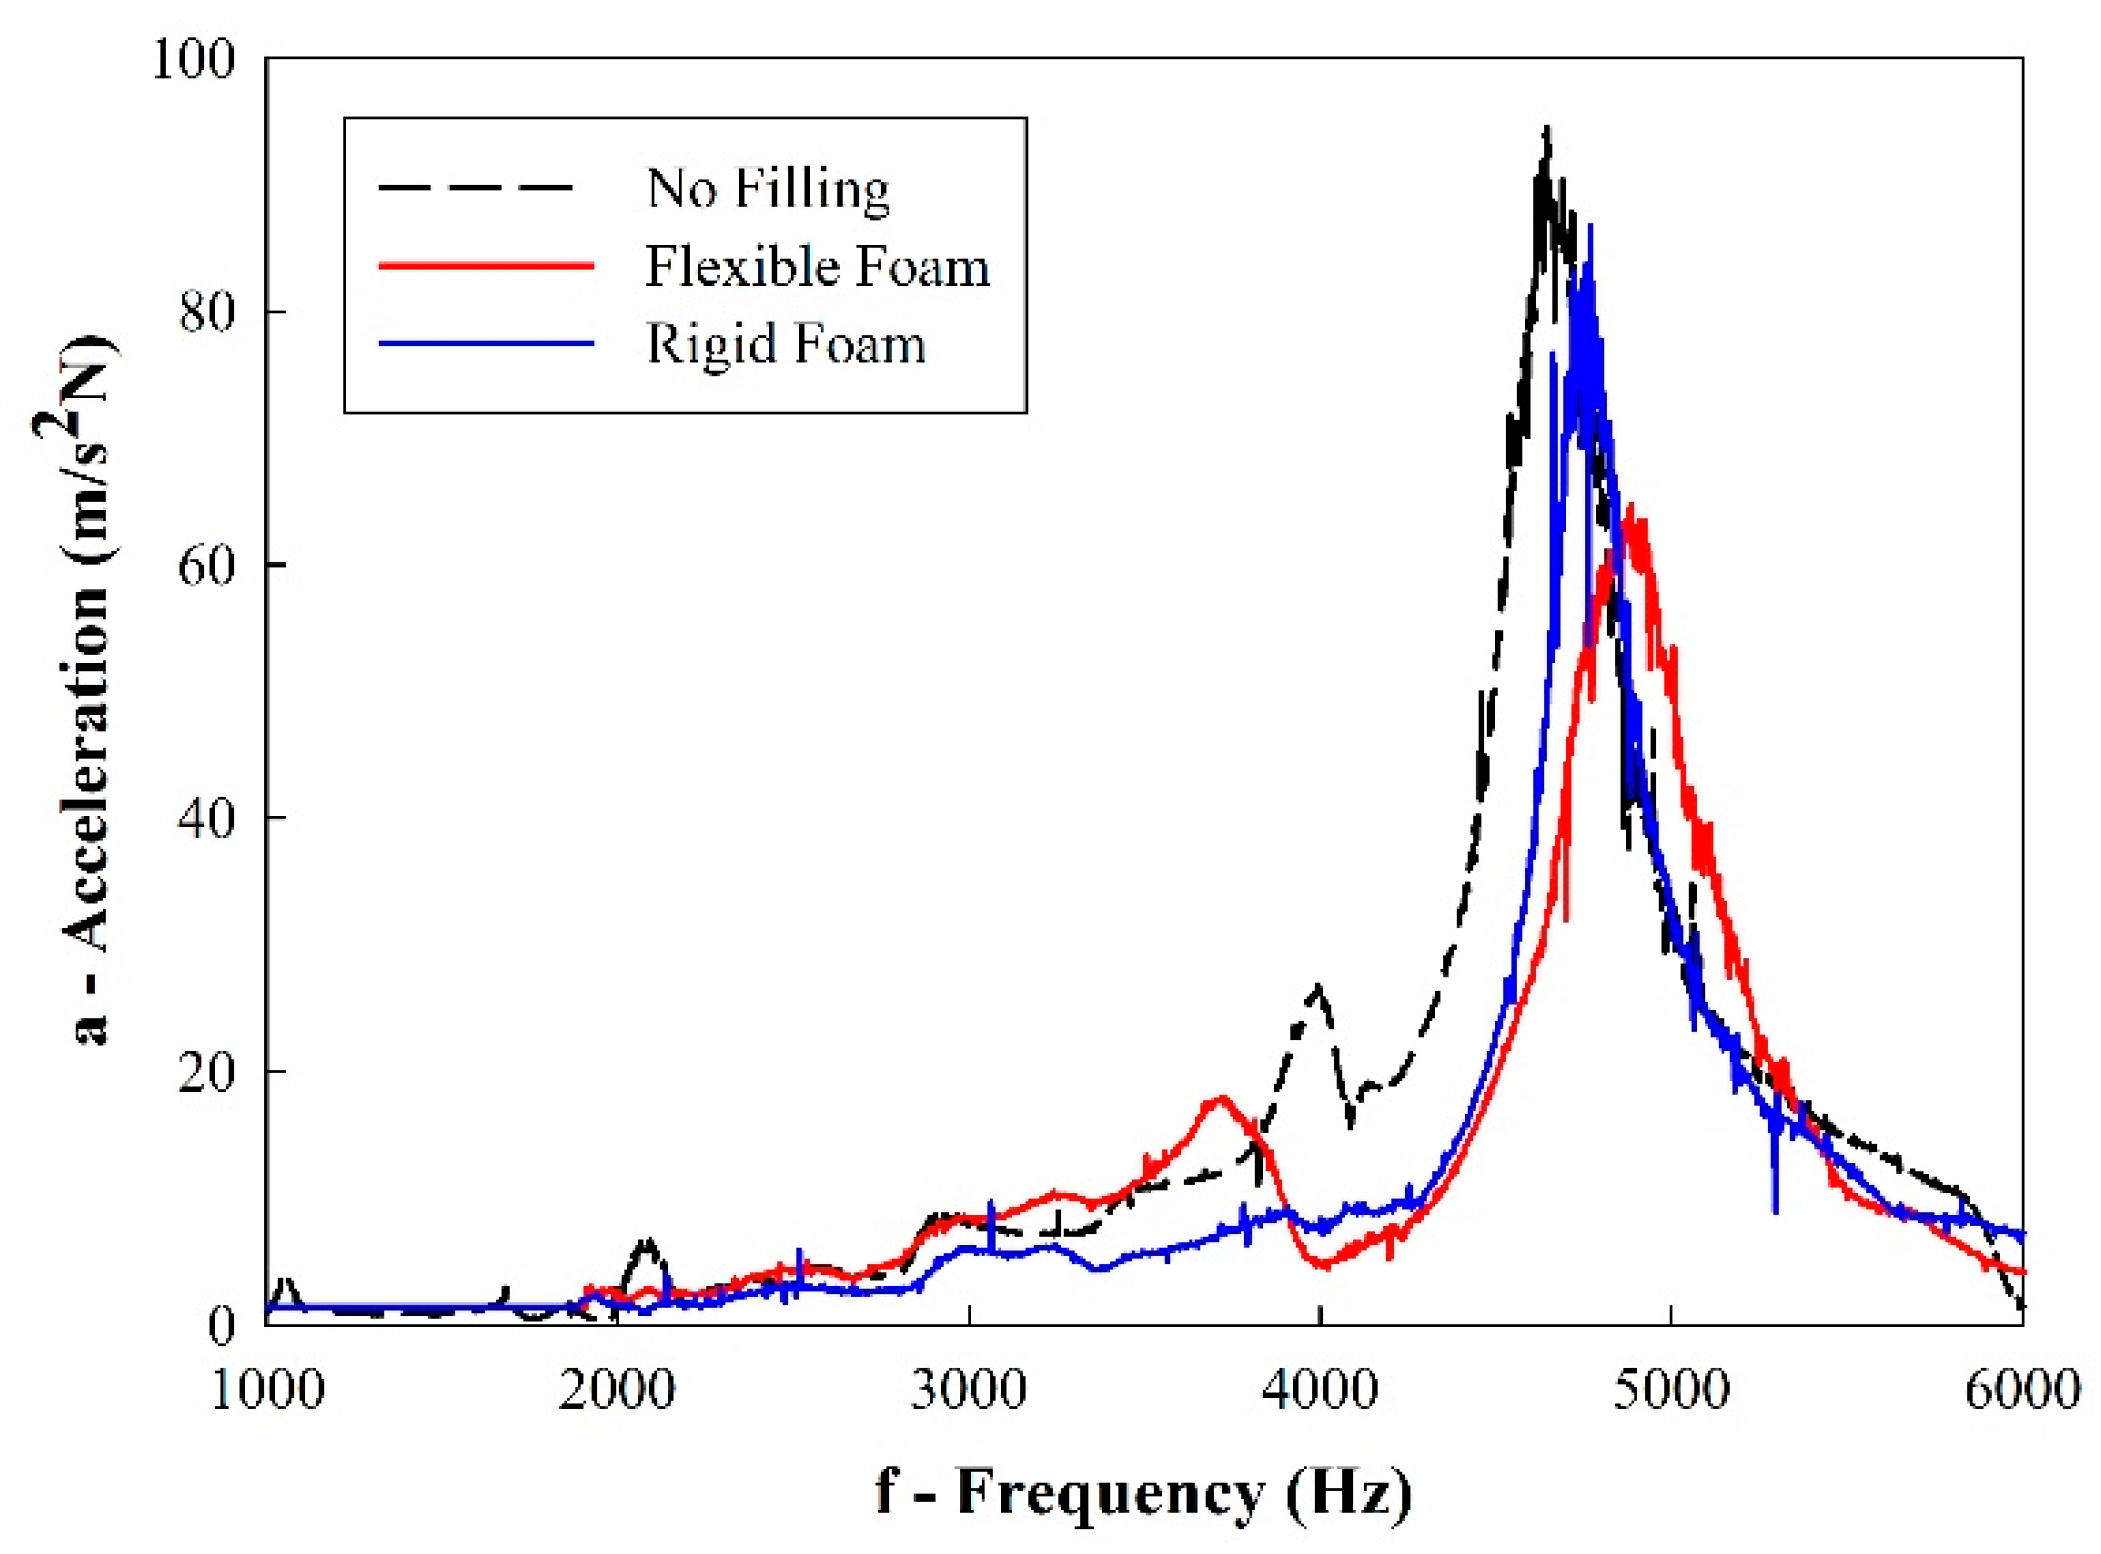
Figure 7 shows the frequency response functions (FRF) from the vibration testing. It is evidenced that the inclusion of a polymeric foam filling has a significant impact on the damping of the cellular solids, lowering the acceleration peaks in sample eigenfrequencies.
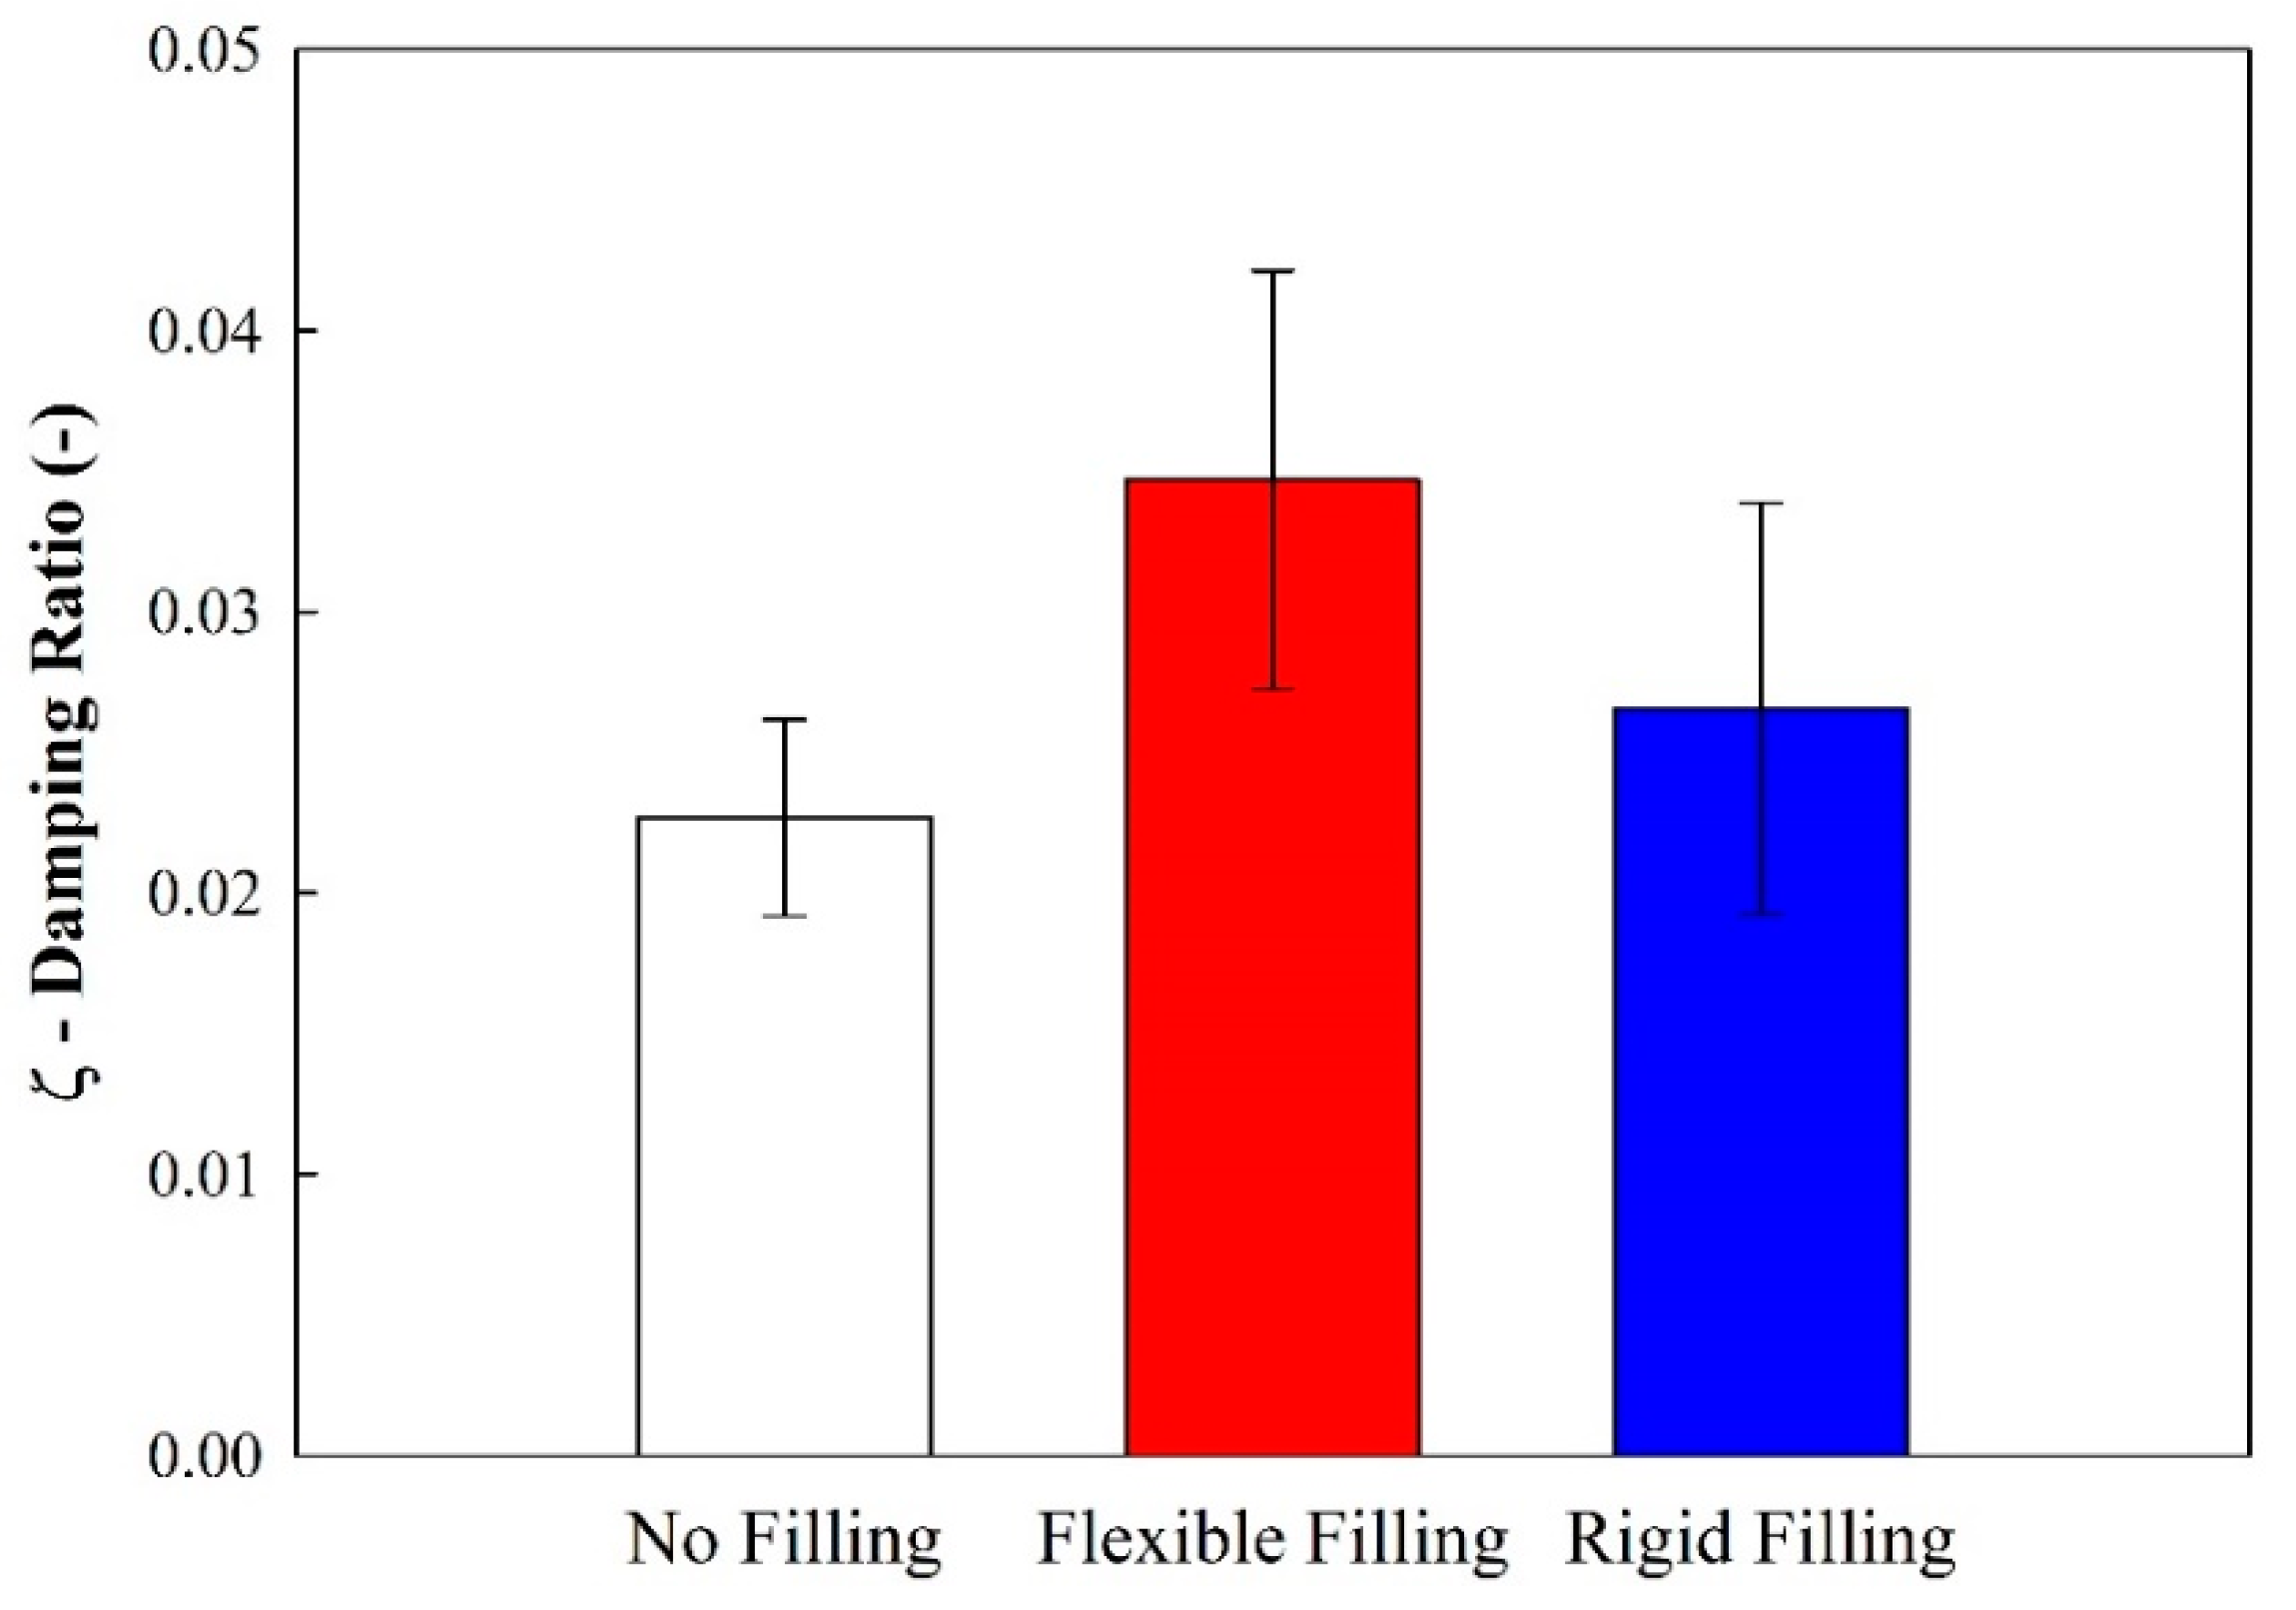
Using the half-power method, it was possible to calculate the damping ratio for each tested sample (Figure 8). It may be concluded that a flexible filling generates more damping capacity than when a rigid filling is used. Polyurethane foams in flexible configurations are known to have higher damping values than in rigid configurations.
While the filling of the sample has proven to be beneficial to increase the structural vibration damping capacity, they also have the objective of increasing the acoustic damping, i.e., they should promote an overall noise reduction and increase riding comfort.
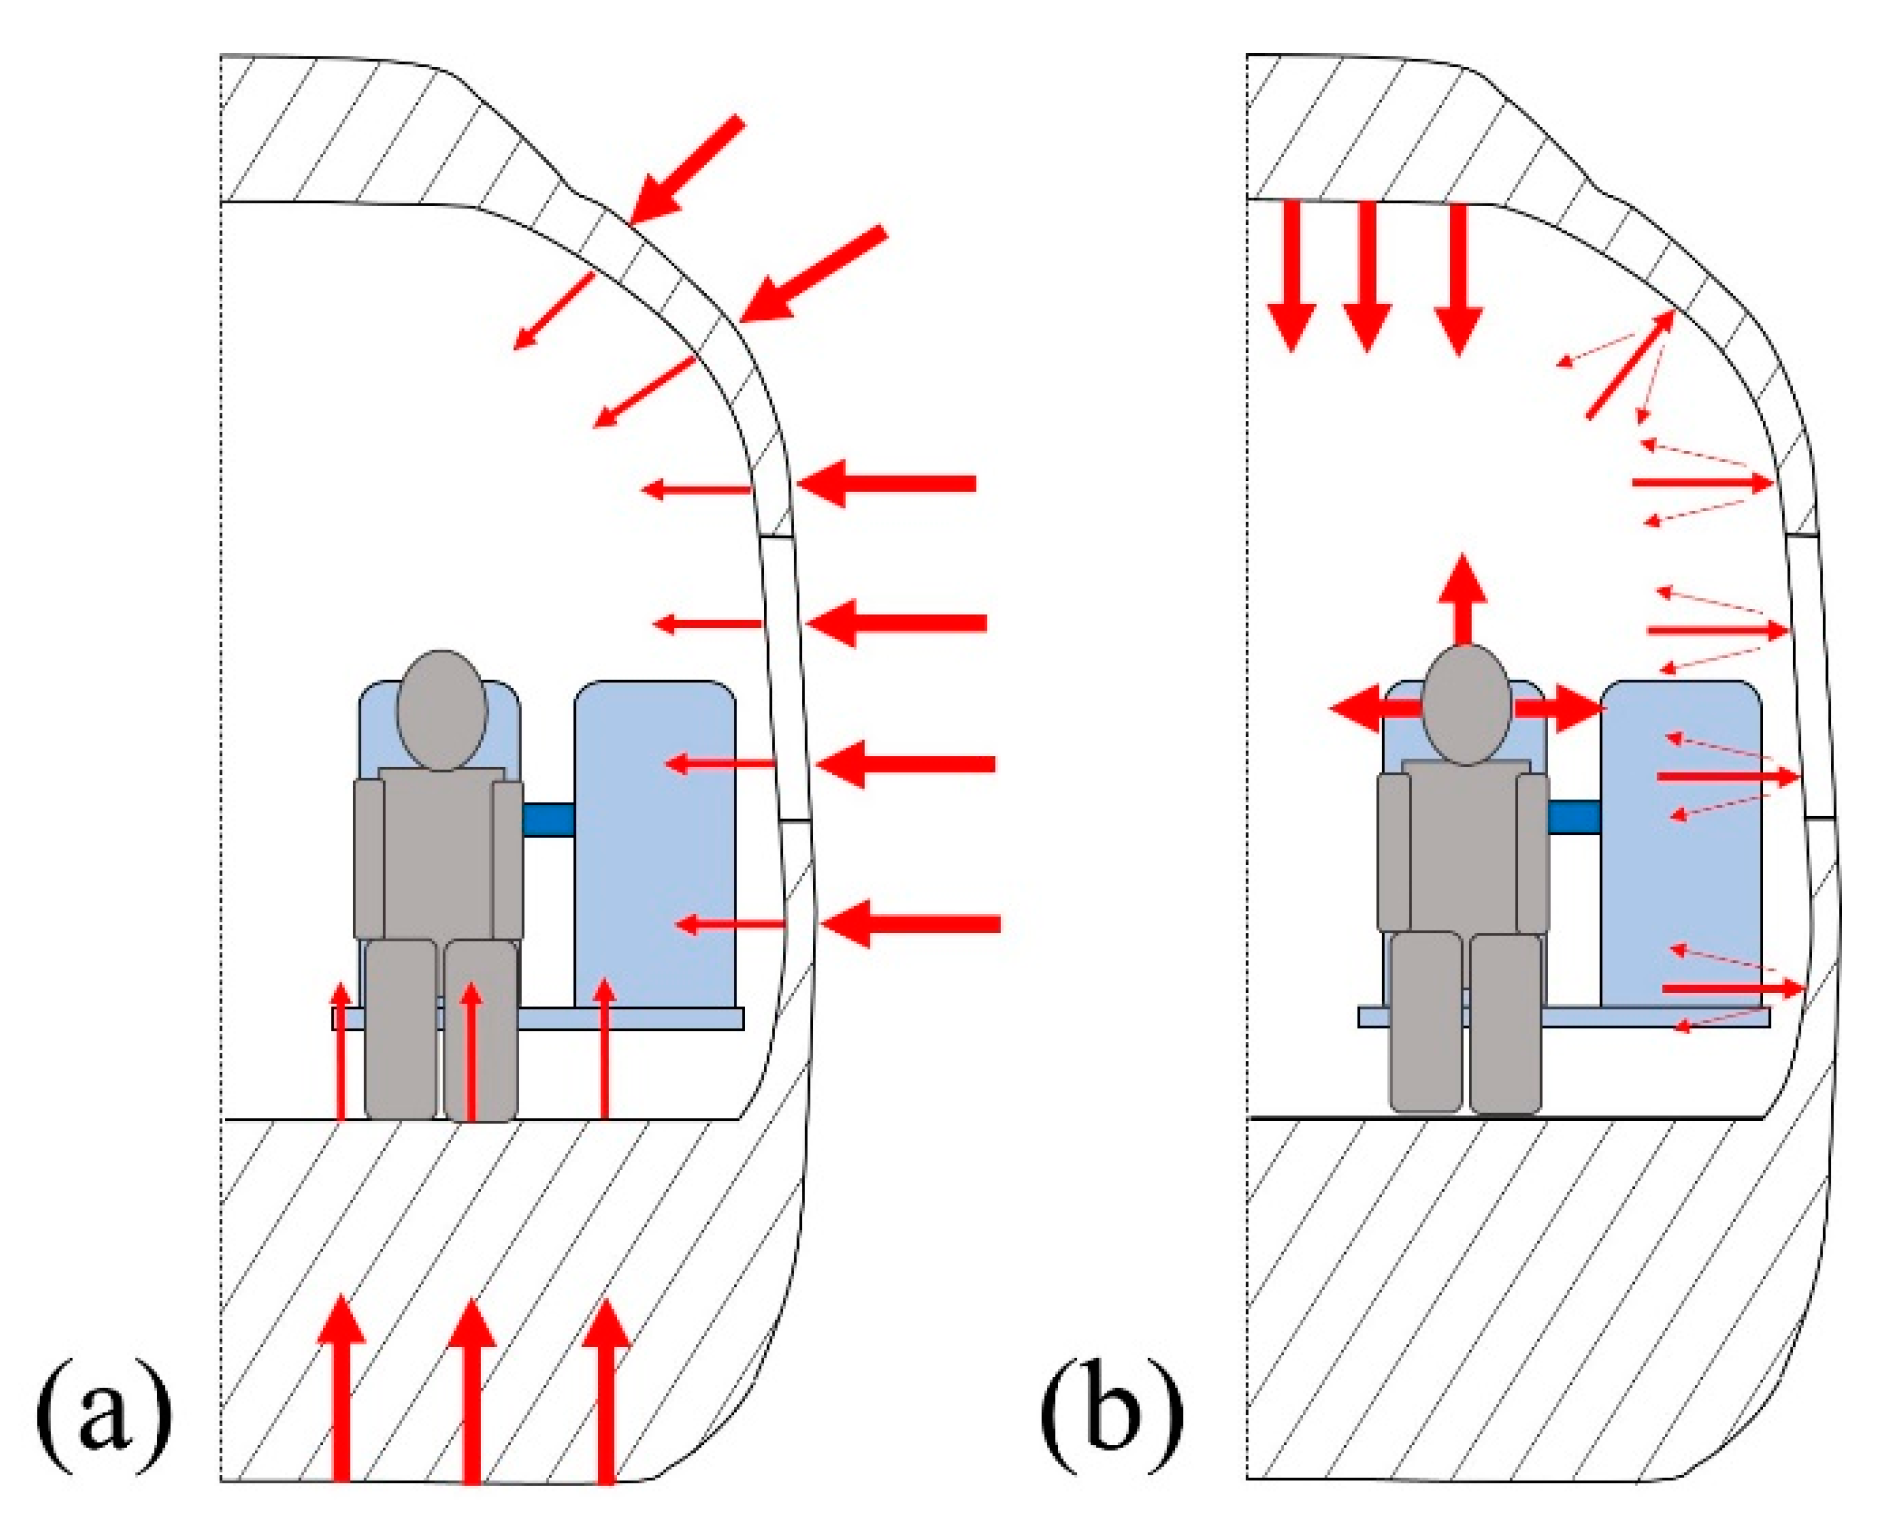
It is known that the main source of noise is the resultant from the exterior of the train cabin (Figure 9a). The damping of exterior noise would greatly benefit the riding comfort of the occupants. The damping of these exterior sources may be correlated with the transmission loss in the material that is used to build the vehicle. Thus, from a designer’s point of view, such panels should have high values of transmission loss on a wide range of frequencies. However, it is impossible to completely block the noise transmission, and, consequently, there is a part that is conducted to the interior of the cabin. This noise adds up to the noise that is generated in the interior of the cabin (Figure 9b), either by its functional equipment (e.g., air conditioning, automated doors, etc.) or passenger interaction. Thus, the material that is used to build the car body should also display a high absorption coefficient (α) to damp the referred noises.
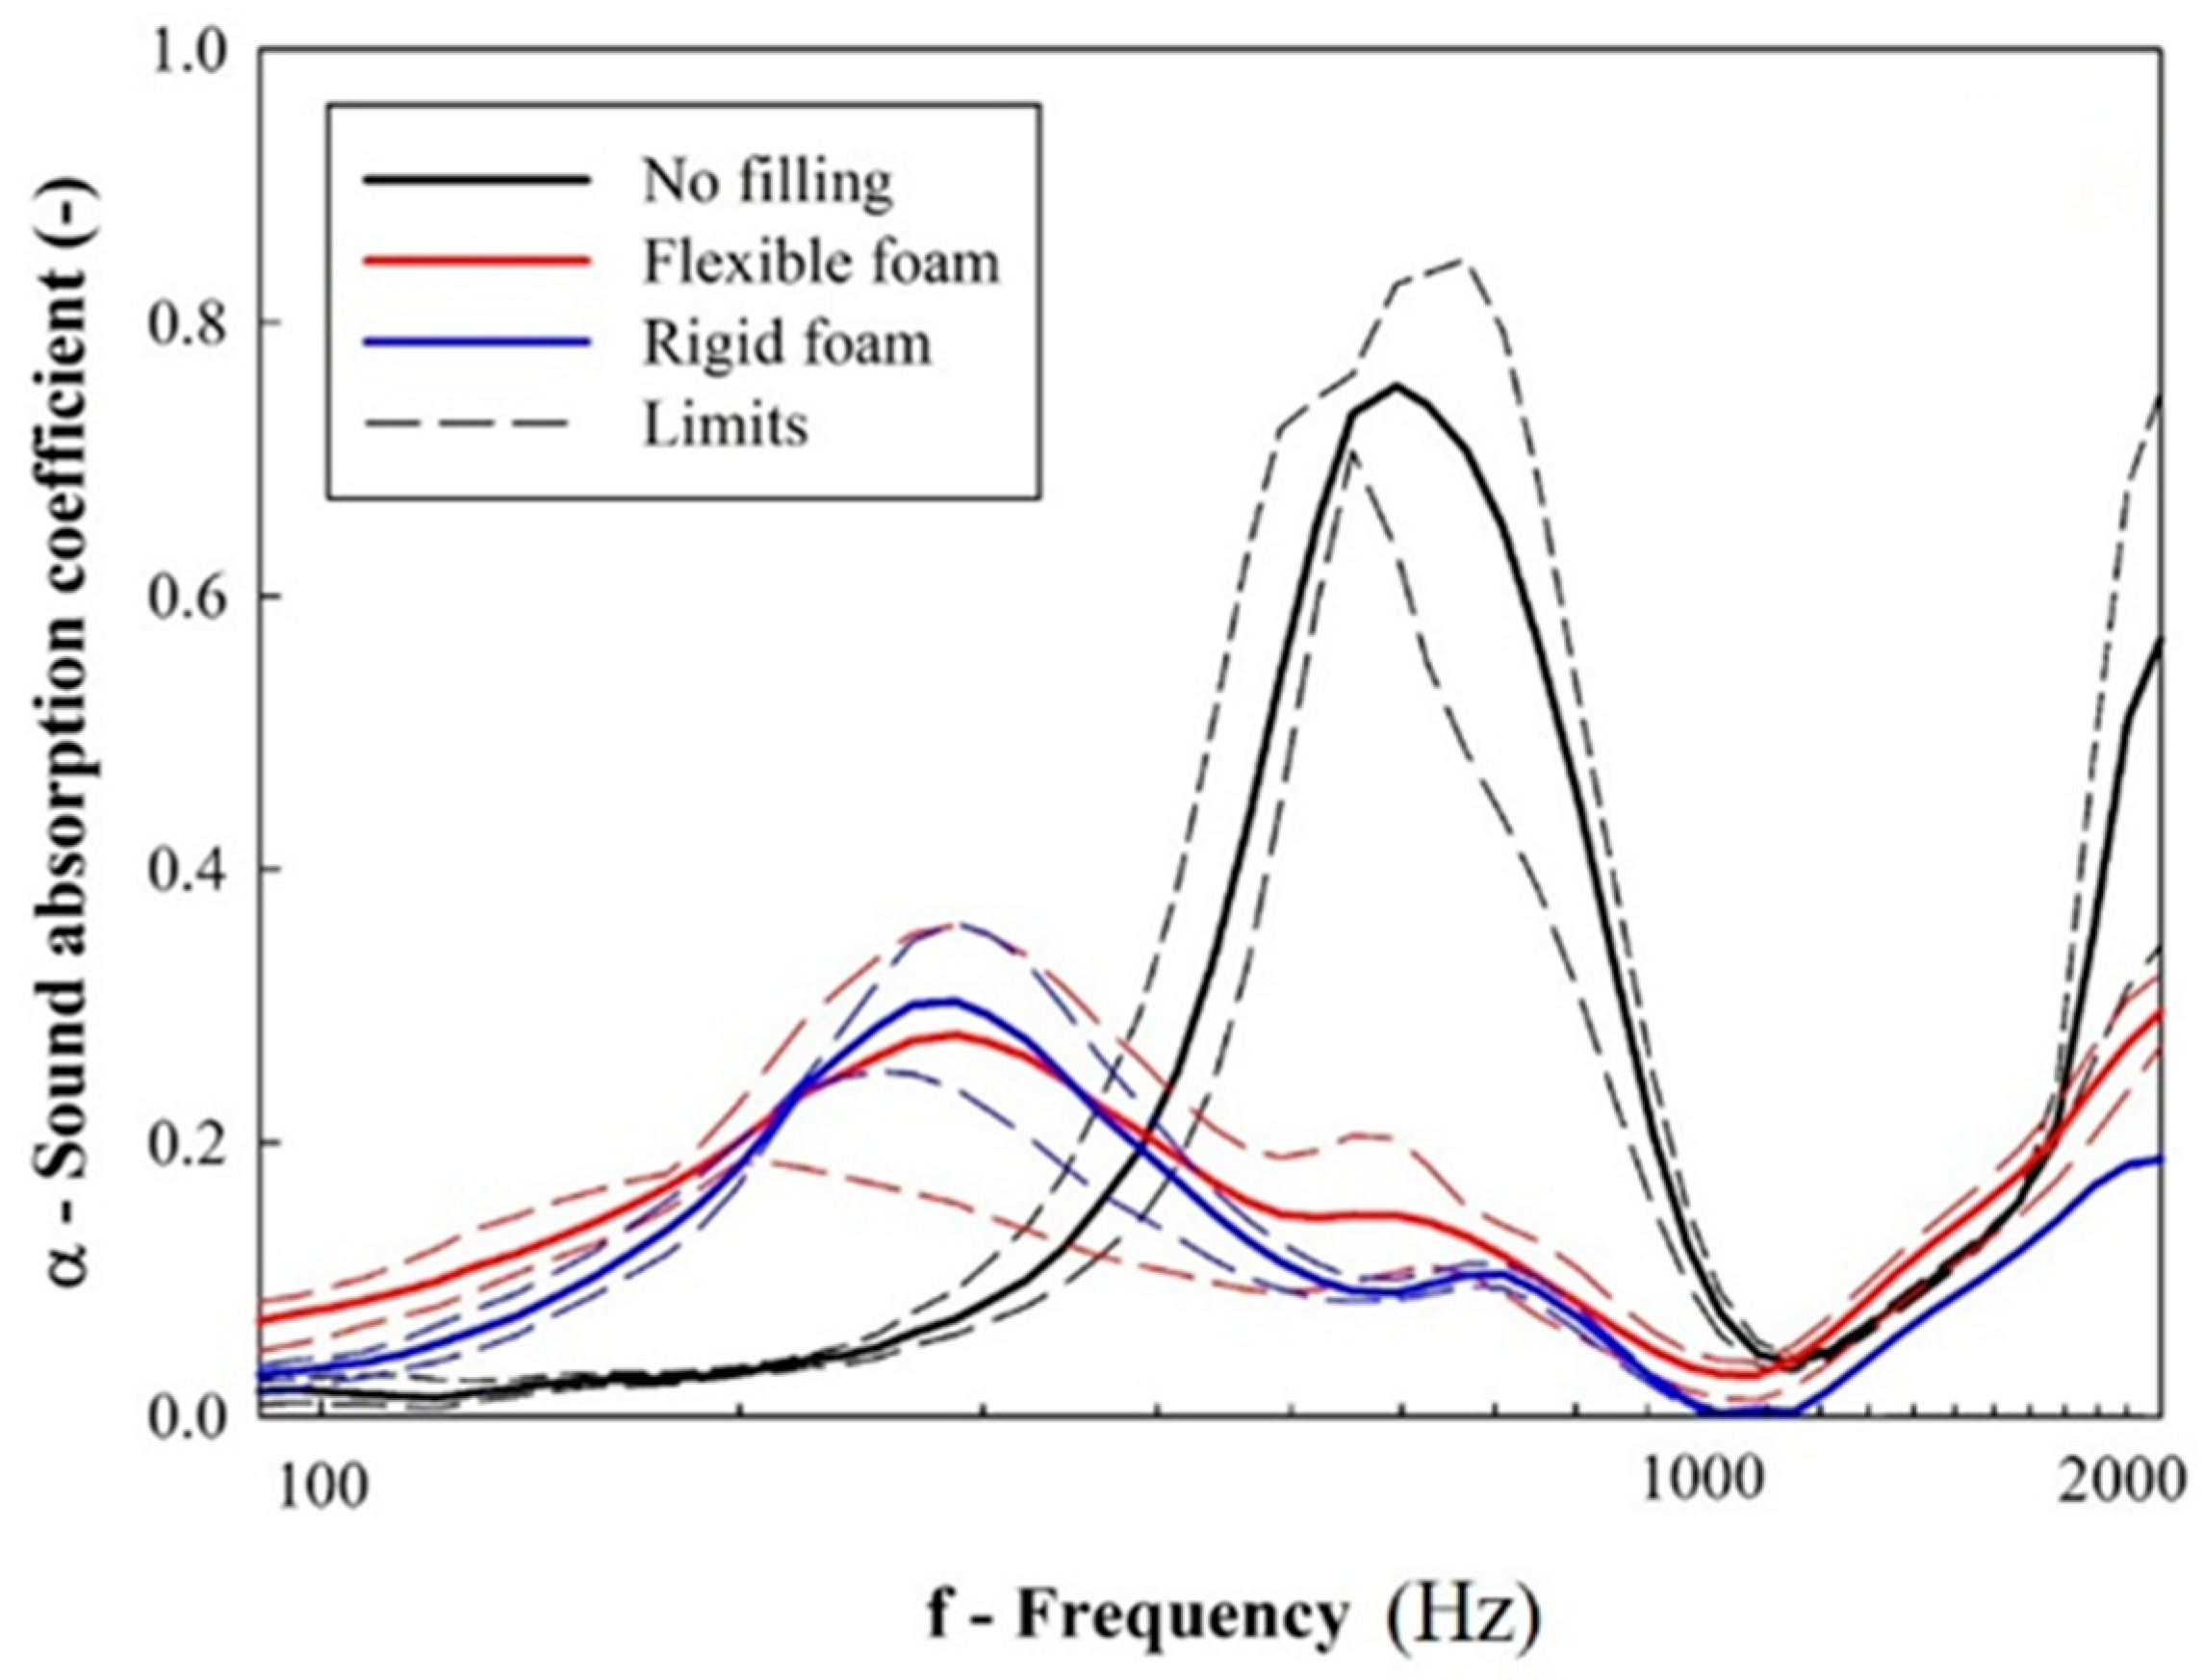
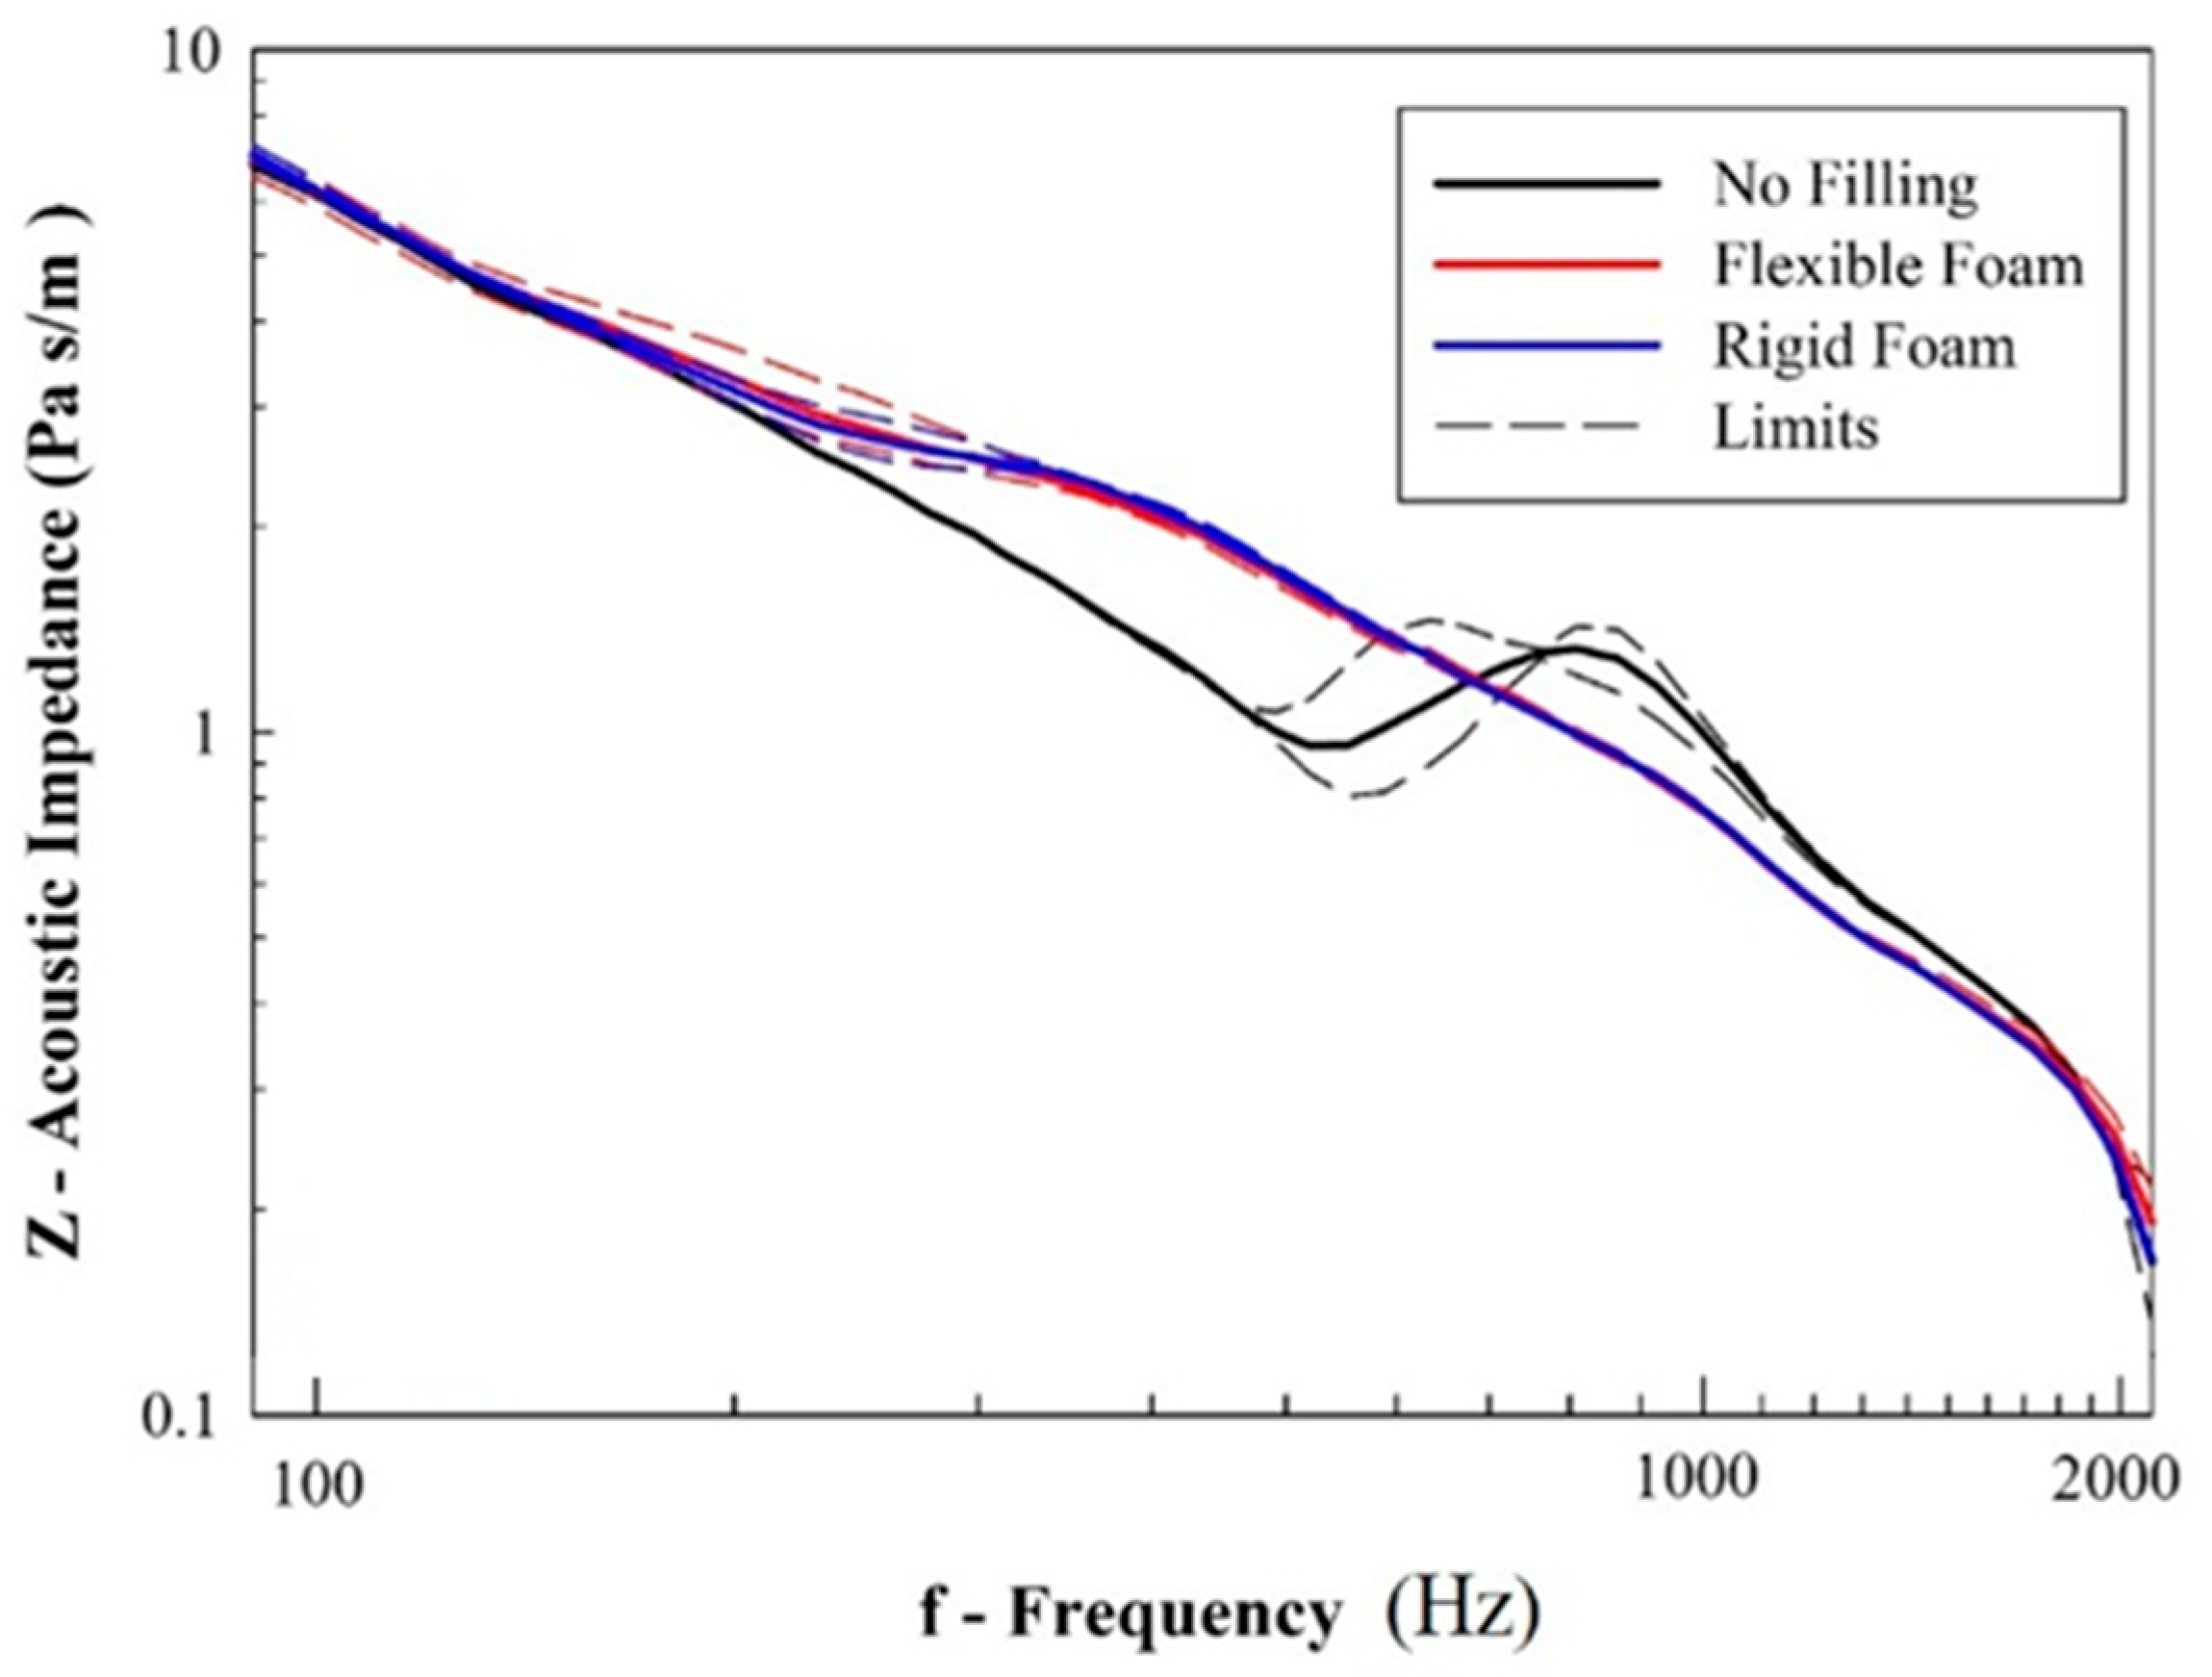
Considering the ability of the material to damp the reflected acoustic noise inside the cabin, Figure 10 shows the average resultant frequency-dependent sound absorption coefficient of unfilled and foam-filled samples. According to Equations (1) and (3), the results in Figure 11 are dependent on the values of acoustic impedance, i.e., the opposition that the system imposes on the propagation of acoustic waves.
The results (Figure 9) show that unfilled samples display a very pronounced absorption peak near 600 Hz. However, when polyurethane foams are used to fill the cellular core, this peak is shifted to a lower frequency (300 Hz). More important, even though polymer foams are commonly associated as a solution to enhance noise-damping capacity [26,27], the experimental results show a reduction in the absorption peaks.
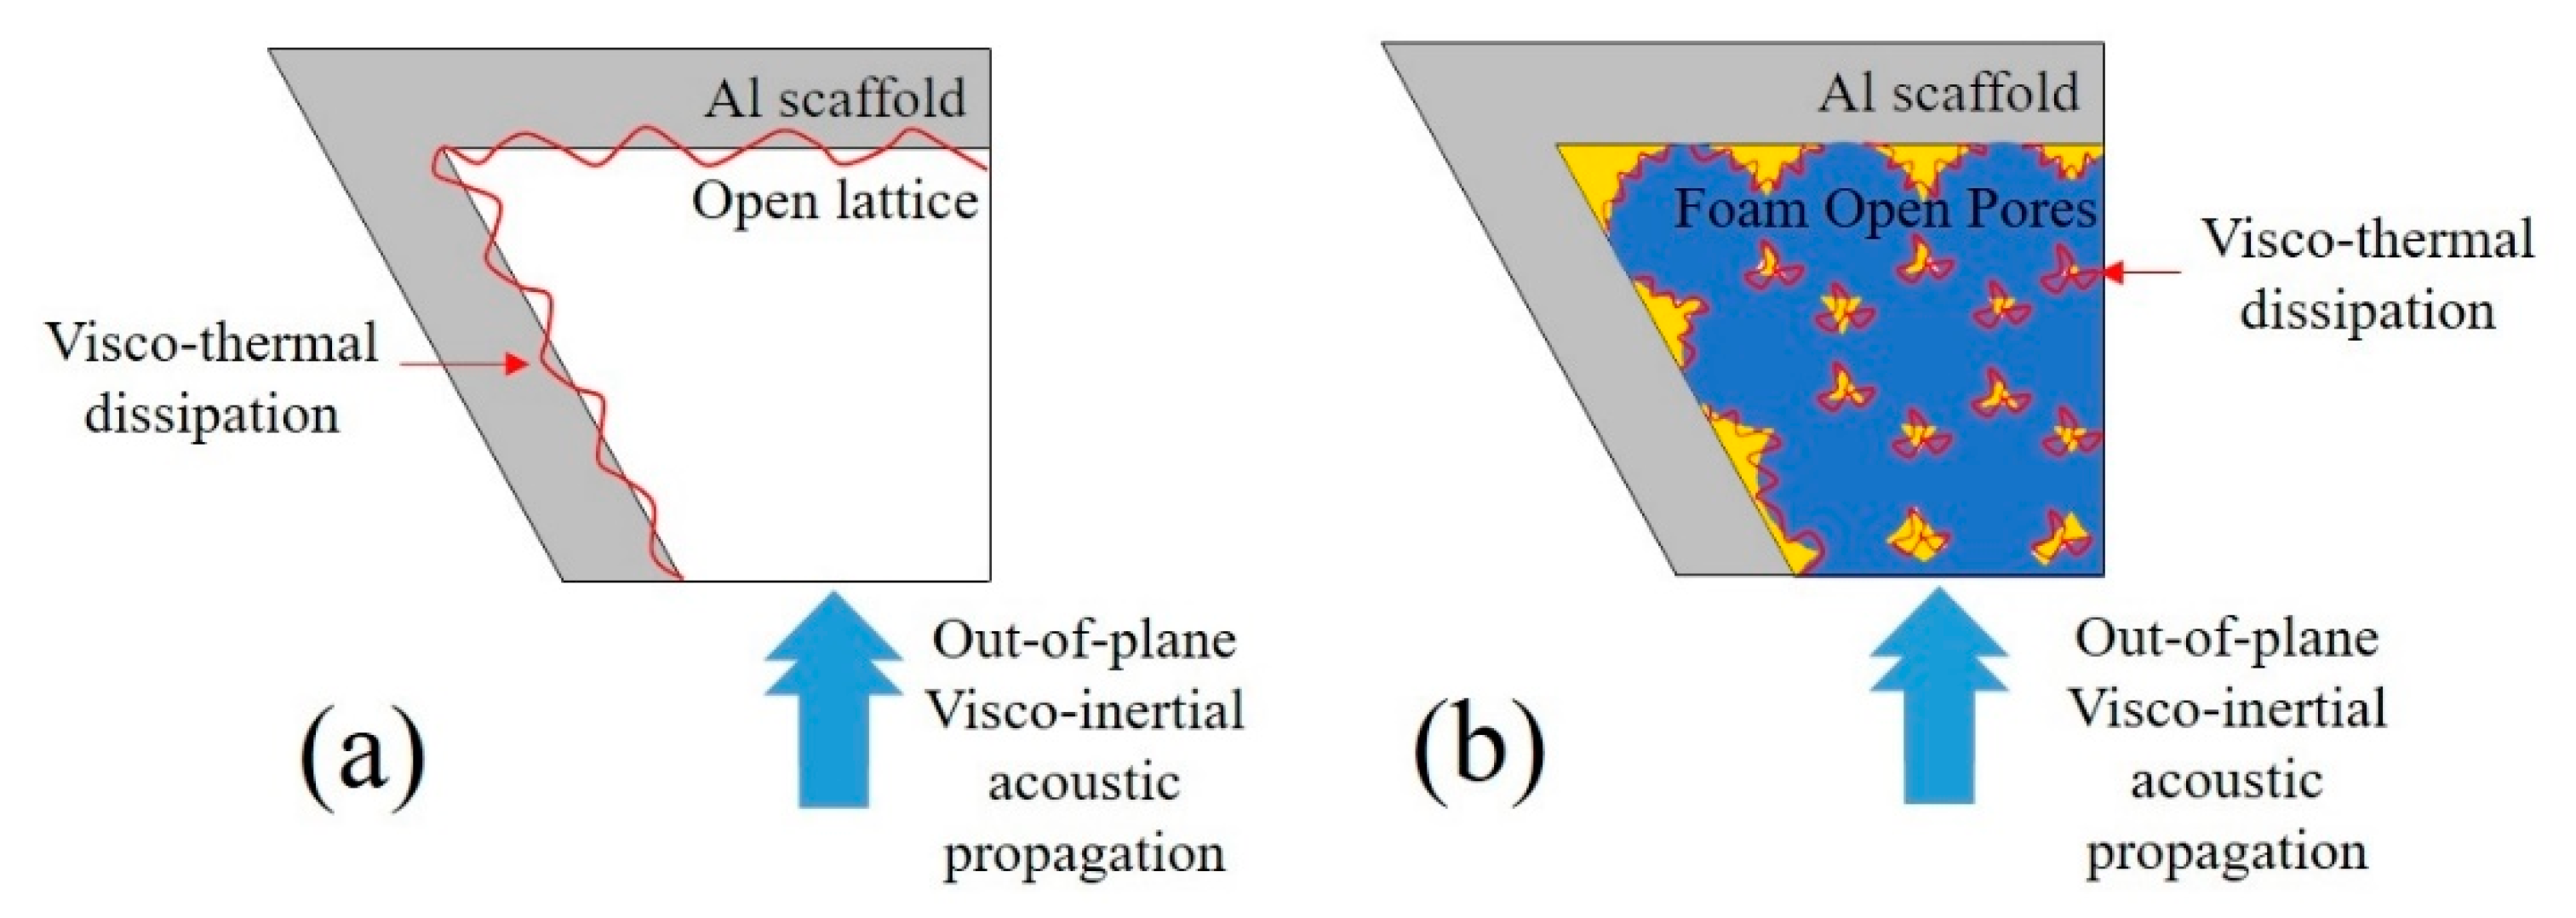
It is known that the sound propagation in porous media, such as cellular solids, may be described by (i) rigid or (ii) poroelastic structures [28]. The first is applicable in rigid porous media and, in this case, is associated with the acoustic propagation within the designed cellular solid. This propagation may be described by the Johnson–Champoux–Allard–Lafarge (JCAL) model [29,30]. The referred model states that the characteristic acoustic impedance of the system (—Equation (7)) is dependent on the visco-inertial [31] effects by changes in dynamic density () and visco-thermal effects by variations in the dynamic Bulk modulus () [32]:
The angular frequency (ω) dependent dynamic density () is known to be influenced in four variables: sample porosity (Φ), airflow resistivity (σ), high-frequency limit tortuosity () and the viscous characteristic length (Λ). These are correlated by Equation (8), in which the constants and η are, respectively, the air density and dynamic viscosity [3,17]:
To compensate for these effects, the JCAL model corrects the characteristic acoustic impedance (Equation (8)) with a dynamic bulk modulus (—Equation (9)). Where the thermal effects are dependent on two variables: the thermal characteristic length (Λ′) and the static thermal permeability (). Equation (8) also includes the contribution of constants, such as the specific heat (γ), atmospheric pressure (P0), heat capacity (Cp) and thermal conductivity (k) [32,33]:
Equation (8) is related to the visco-inertial effects on acoustic propagation. However, the heat exchange and thermal dissipation (Equation (9)) by acoustic excitation in rigid open-cell porous media must also be considered to correctly estimate the acoustic propagation [4,31,34].
While in unfilled samples (Figure 12a), the visco-inertial propagation of the acoustic waves is performed through the rather open aluminum matrix and the thermal interaction is suggested to be residual due to the low values of the superficial area in which the visco-thermal dissipation occurs. This may not be true in foam-filled samples (Figure 12b). In these samples, the superficial area in the foams is much more significant, and so is the visco-thermal dissipation in their boundary layer.
Using the relation in Equations (7)–(9) and a graphical tool made available by the Matelys Research Lab (Vaulx-en-Velin, France) [34], a sensibility analysis was performed on each variable to determine their influence and variations in the shape of a typical frequency-dependent sound absorption coefficient plot (Figure 13, Figure 14, Figure 15 and Figure 16). This analysis is used to suggest the transformations in the acoustic impedance and, consequently, sound absorption in the unfilled and flexible/rigid foam-filled samples.
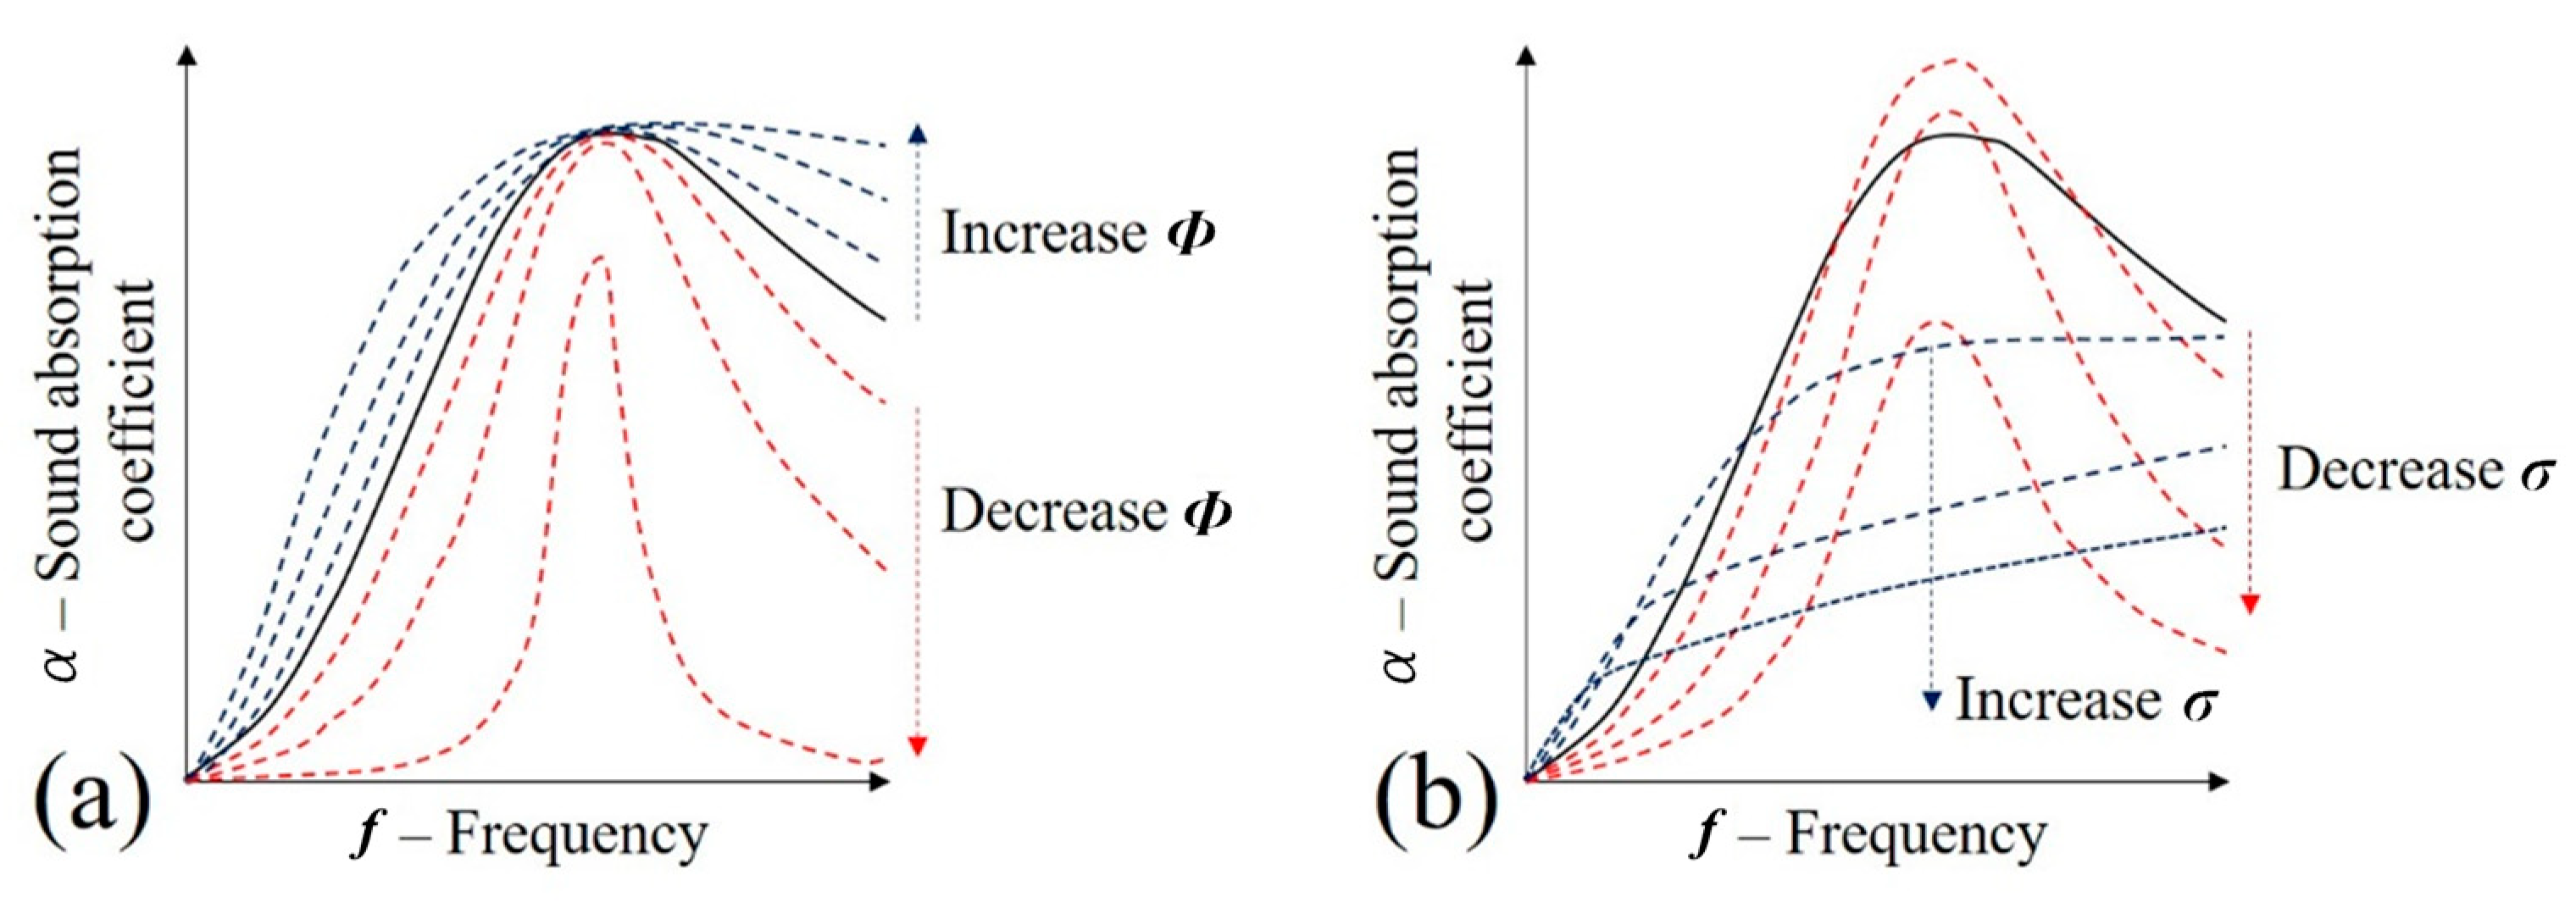
Sample porosity (Φ—Figure 13a) is defined as the ratio of the fluid volume that occupies the interior of a cellular solid [35], and it is, fundamentally, the fraction of the material that is not solid (i.e., Φ = 1 − ). According to Figure 13a, it may be observed that as the value of porosity is decreased, so does the sound absorption coefficient. This effect has already been known to occur in other porous media [15,36,37]. This is justified by the closing effect on the cells of the porous media and the difficult absorption during the visco- inertial and thermal process during the propagation [38]. It is worth mentioning that, for the acoustic propagation purpose, only the open-cell porosity is taken into consideration. In fact, this is the case with the adopted foams. It is suggested that during the filling process, the porosity is decreased, and, thus, there is a relative reduction in the sound absorption coefficient.
According to Darcy’s law (Equation (10)), the decrease in porosity may increase the static air flow resistivity (σ) for a given pressure gradient () and fluid velocity () [39]. Observing Figure 13b, it is suggested that this can lower the sound absorption coefficient, being this fact also reported in other studies [40]:
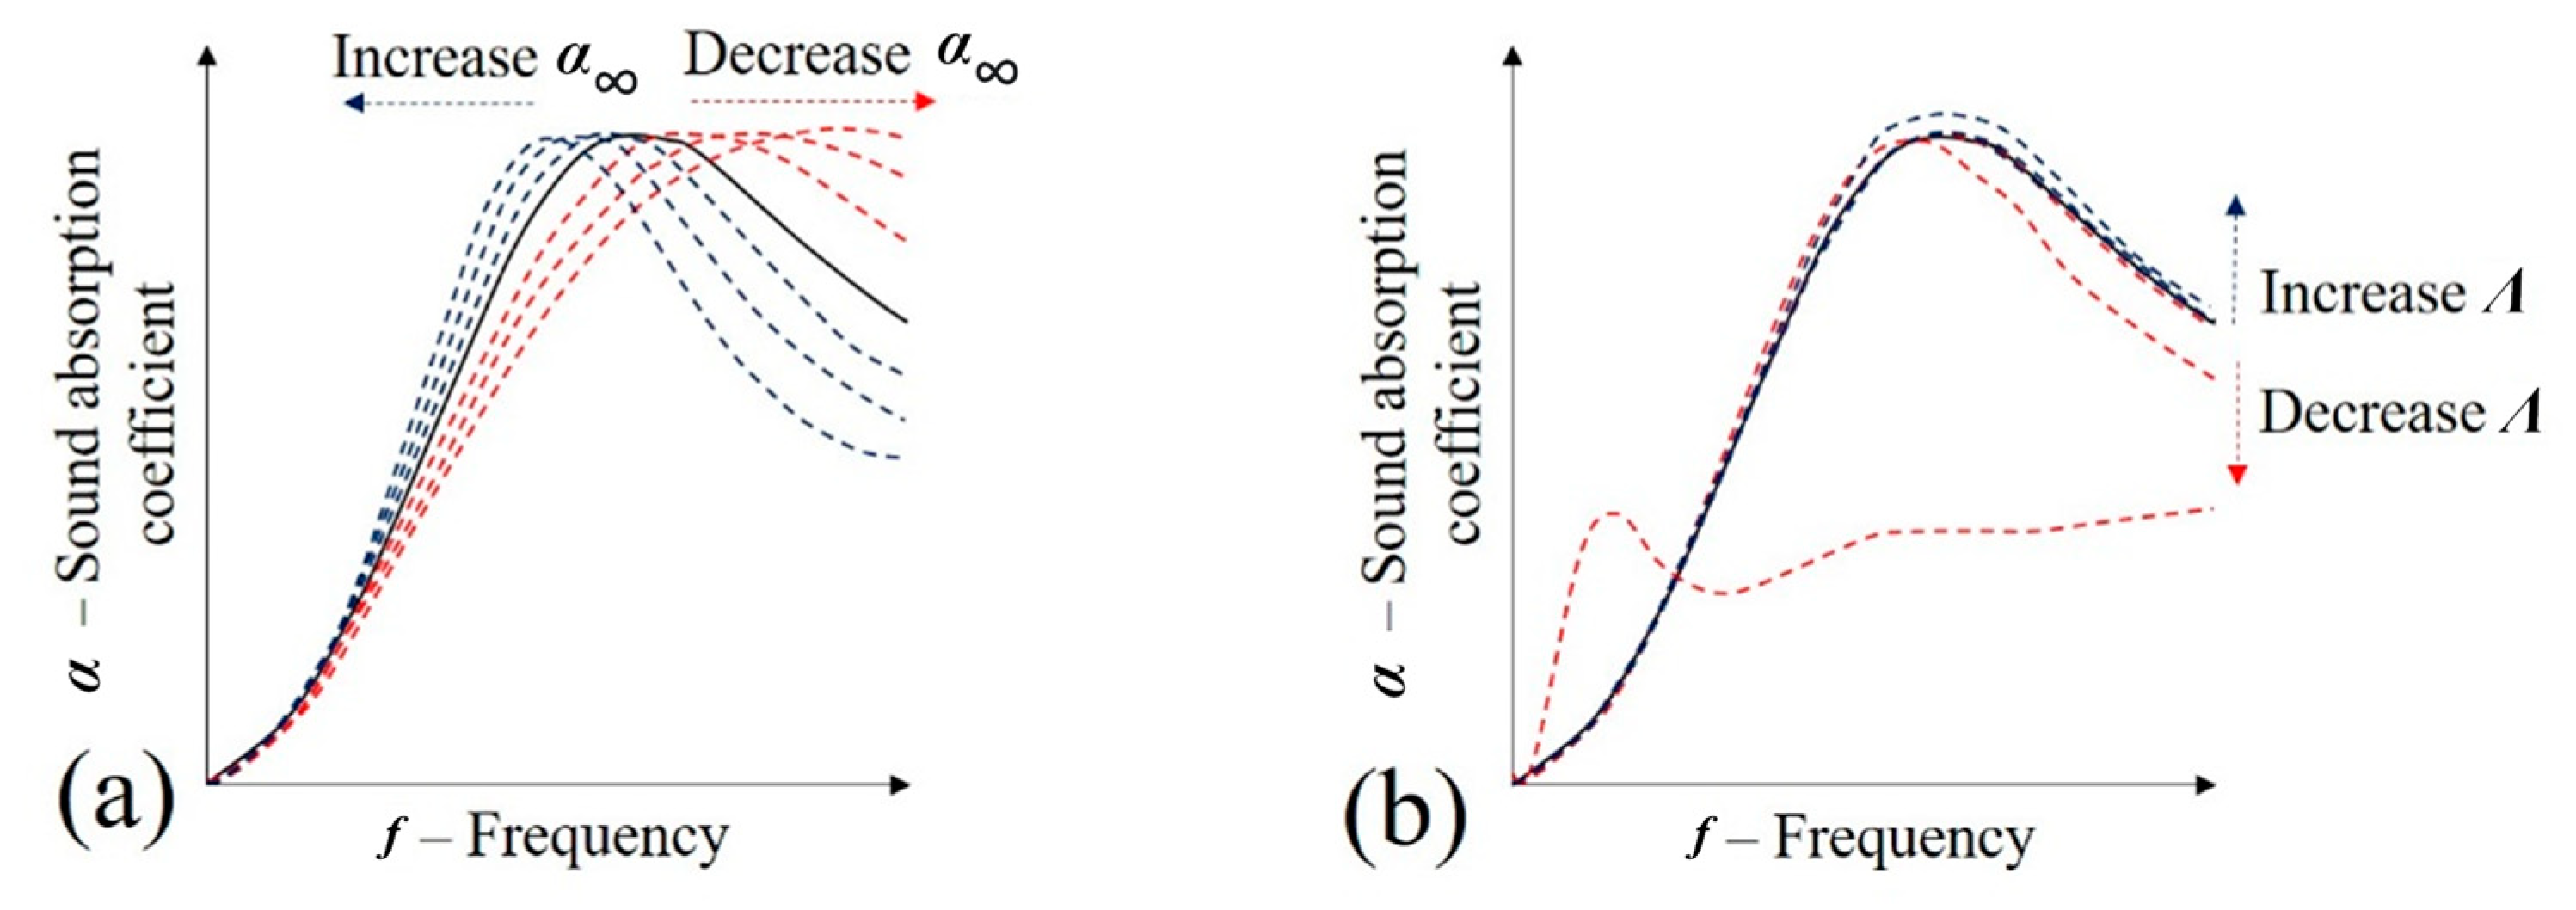
The high-frequency limit of the tortuosity () is related to the geometrical disorder of the porous media in which the acoustic propagation occurs [29] and may assume values between 1 and 3 [41]. The lower limit is generally characteristic of parallel streamlines, while the upper limit is used in extremely disordered systems (e.g., for typical polyurethane foam, = 1.29 [34]). It is considered that the tortuosity is increased when the samples are infiltrated by foam. Observing Figure 14a, it is suggested that the sound absorption peak may be moved to a lower frequency. This hypothesis may be supported by studies on other porous media [37,42].
The viscous characteristic length (Λ) describes the viscous effects of the flow [29]. A general description may be observed in Equation (11) [43], where this variable is defined as the relation between the pore volume (V) and superficial area (A) in a given fluid velocity (v). It may be understood that this relation is highly dependent on the porosity (Φ) and tortuosity () (Equation (12), where is the static viscous permeability [43]). Due to the suggested reduction in porosity and elevation in tortuosity, it is proposed that the filing of the samples with foam increases the values of viscous characteristic length (Λ). Observing Figure 14b, it may be observed that this may contribute to the increase in sound absorption coefficient:
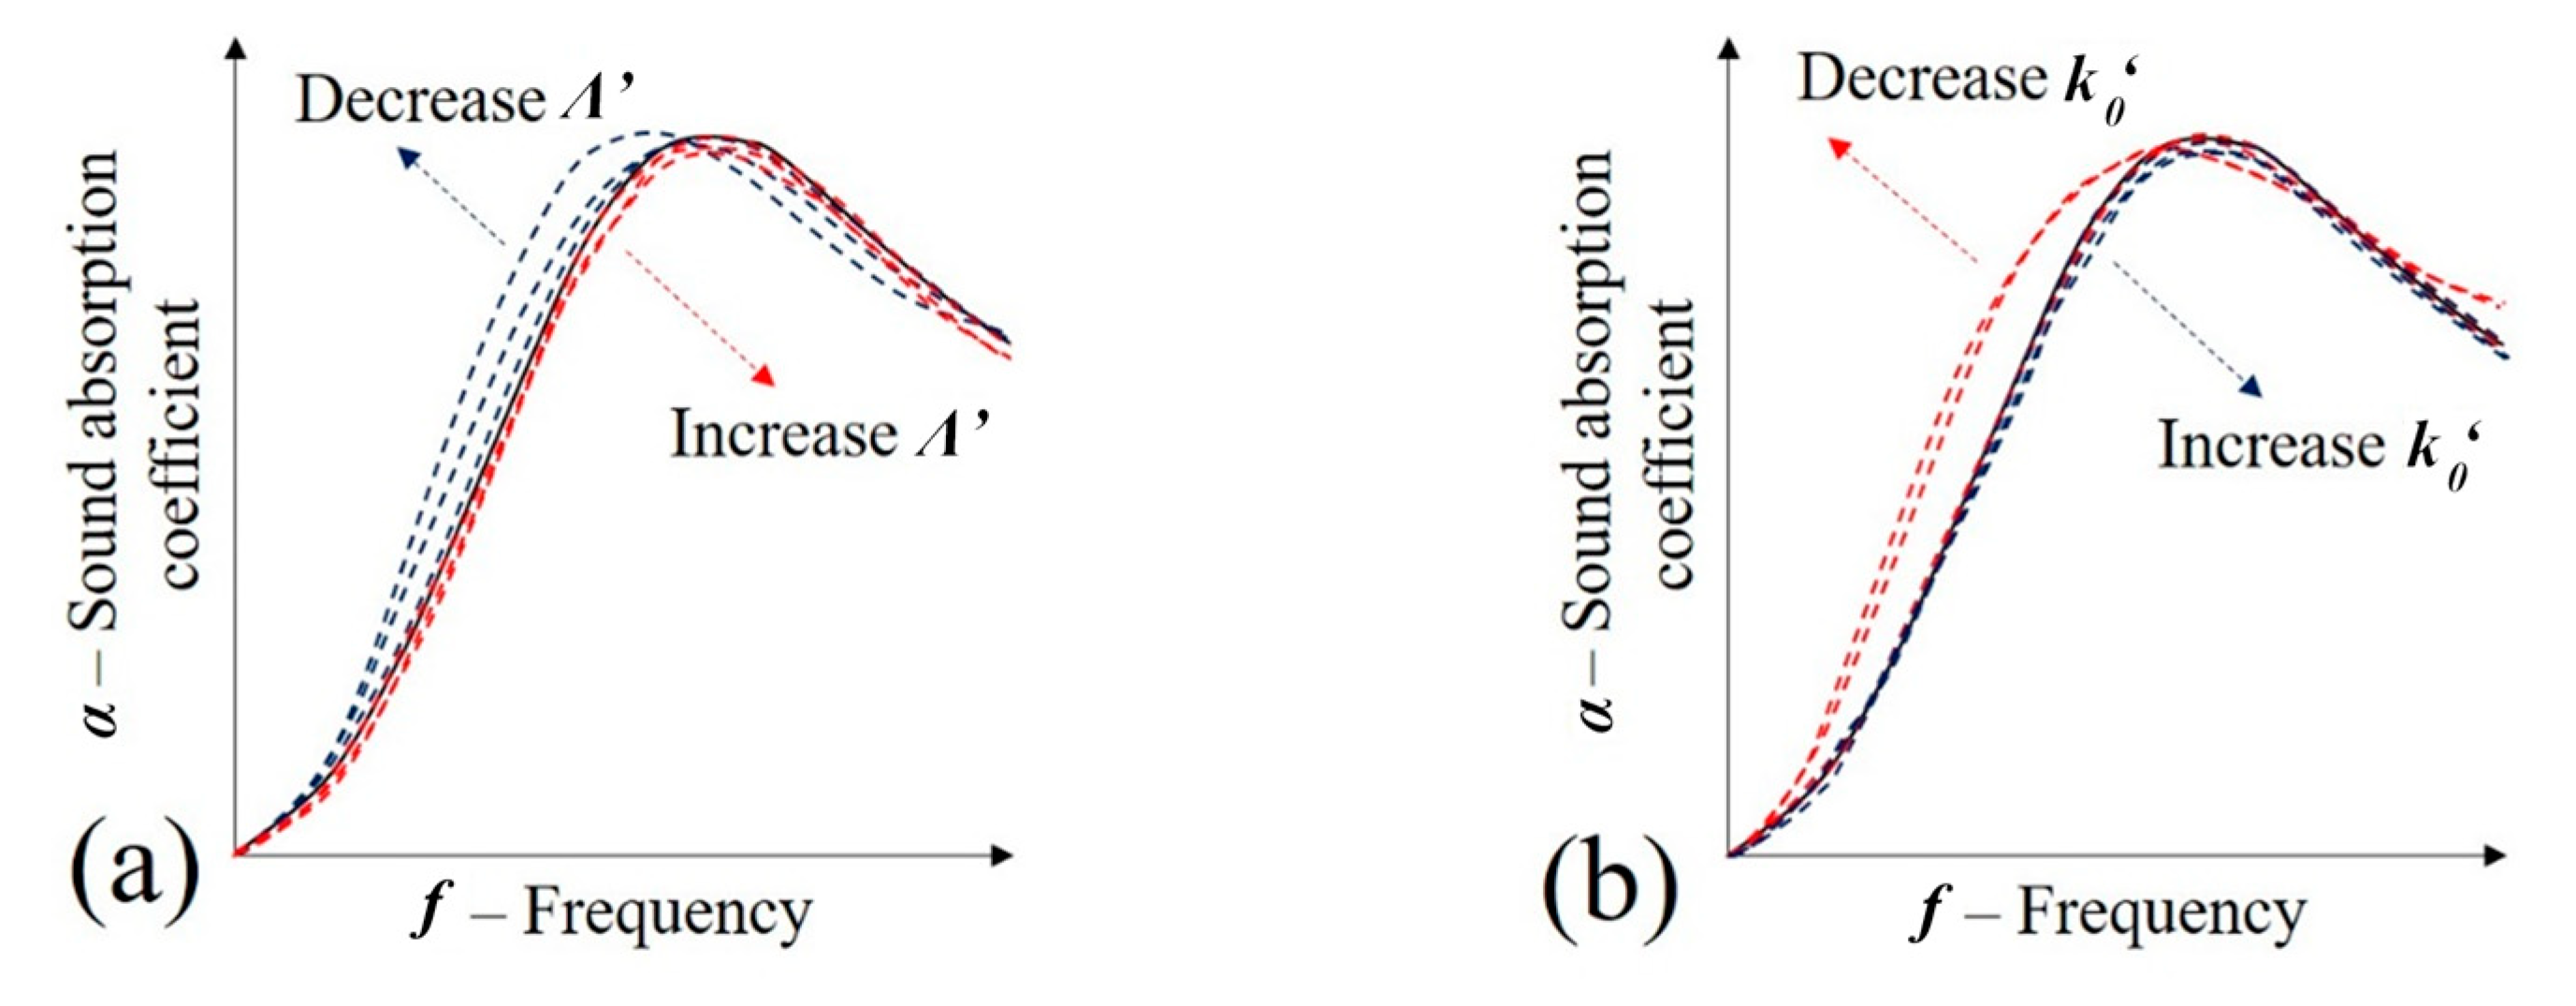
A similar analysis may be performed to determine the variations in the thermal characteristic length (Λ′) that accounts for the thermal dissipation in the periodic unit cell [5]. Given that this variable is also predominantly affected by the ratio of pore volume and superficial area (Equation (11)) [44] and recurring to Figure 15a, it may be observed that as the value of this variable increases, there may be an elevation in the sound absorption coefficient.
The frequency-dependent dynamic thermal permeability () may be calculated using Equation (13), being dependent on the differentials of pressure and time (/), porosity (Φ), air thermal conductivity (k) and excess of the temperature inside the cellular solid (τ) [40,42]. The static thermal permeability (k′0) relates thermal effects between the rigid frame and the fluid at low frequencies actuating in the boundary layer, according to Equation (13) [45]. Given its dependence on the sample porosity, it is suggested that the foam infiltration process can decrease the value of the static thermal permeability. Thus, according to Figure 15b, it is expected a lowering in sound absorption and peak frequency:
If, during the acoustic propagation, the structure can no longer be considered rigid, for instance, in the case of the polyurethane foams that are used to infiltrate the samples, the formulation must be corrected [43]. According to the poroelastic Biot’s theory [46,47], the surface impedance (Z) may be calculated using Equations (15) and (16) [48]:
where
The referred theory considers that the propagation by compression waves is due to three separate waves: fast (P1) and slower (P2) compression waves and a shear wave (S) [48]. Considering these facts, the surface impedance (Z) may be divided into four possible impedance combinations according to Equations (17) and (18). These combinations are related to the fast (1) and slow (2) waves on the solid (s) and fluid (f) parts: , , and [49]:
Overall, the constants that need to be determined to perform the calculations in Equations (15)–(18) may be calculated using Equations (19)–(22) [48]:
where
The equivalent mass densities (, and ) in the system may be determined by Equations (23)–(25) [50]. The latter can relate the poroelastic influence in the initially rigid approach described early by using the dynamic density (—Equation (8)) that is determined in the JCAL model. It may be highlighted that the equivalent mass densities are also influenced by the foam and air densities, respectively, and .
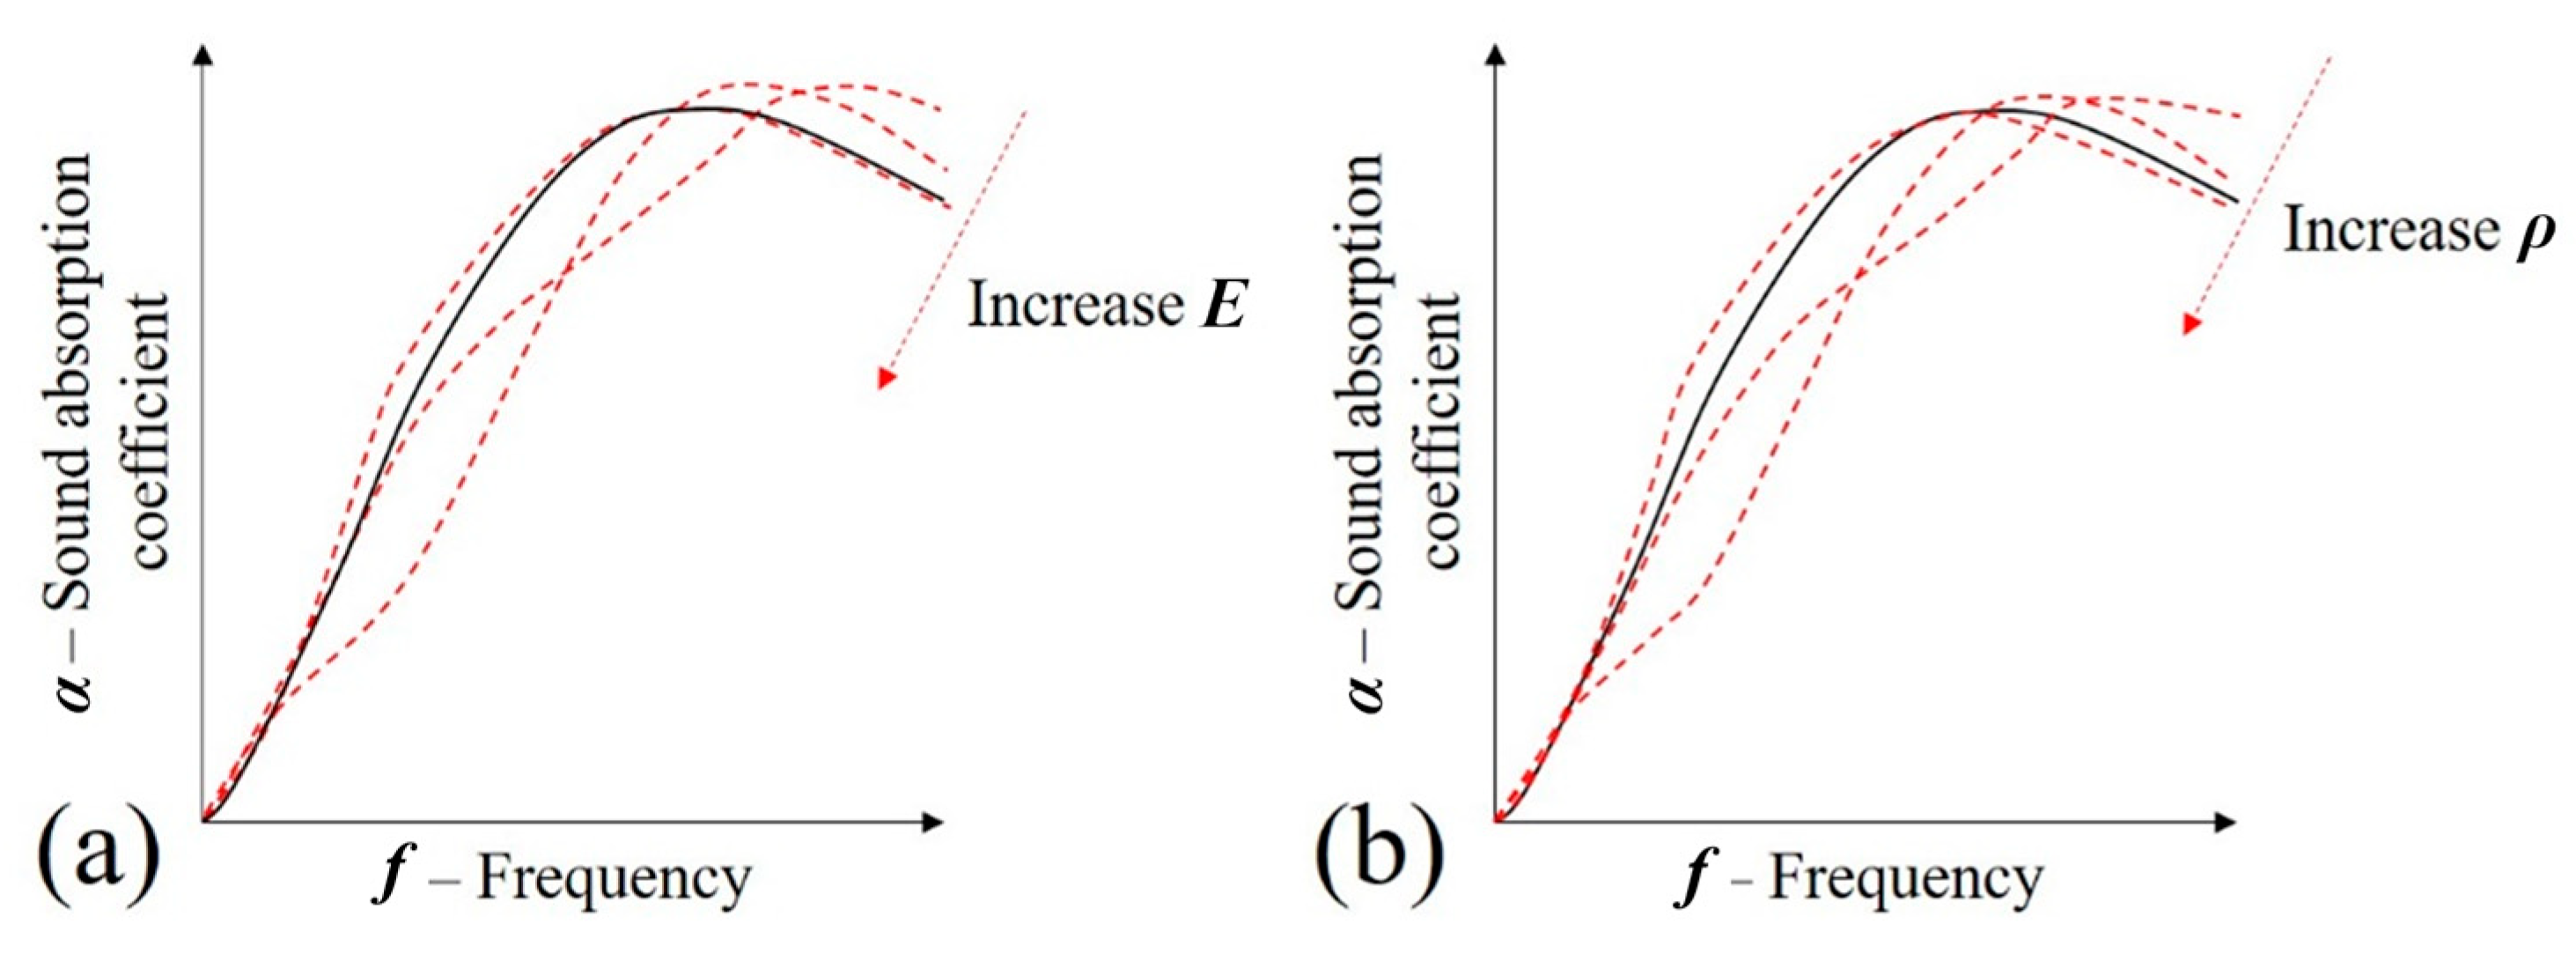
The remaining parameters that need to be used in the solving of Equations (23)–(25) are known as Biot coefficients (P, Q and R) and may be determined by Equation (26) to (28) [28]. Parameters themselves are influenced by the sample porosity (Φ), the shear modulus (G), the variable KB (Equation (29)) and the Poisson’s ratio (ν) [28]. Equation (30) is a variable related to the JCAL model by the inclusion of the dynamic bulk modulus () through Equation (9). The Young’s modulus (E) of the sample itself may be directly correlated using the relation between elastic constants from the three-dimensional classic elasticity theory (Equation (31)) [51]:
Considering that the Poisson’s ratio of the foams are approximately constant, Figure 16 was plotted to determine the influence of Young’s modulus (E) and density () in the sound absorption coefficient of a generic cellular solid. In Figure 16a, it is suggested that lower values of elastic modulus are useful to increase sound absorption. However, as the value of this constant increases, the plots tend to approximate the JCAL model (black plot—Figure 16). In fact, since as the sample becomes stiffer, it should approximate the JCAL model that considers the solid portion of the foam as rigid. The same behavior is observed in situations where the density is increased, according to Figure 16b.
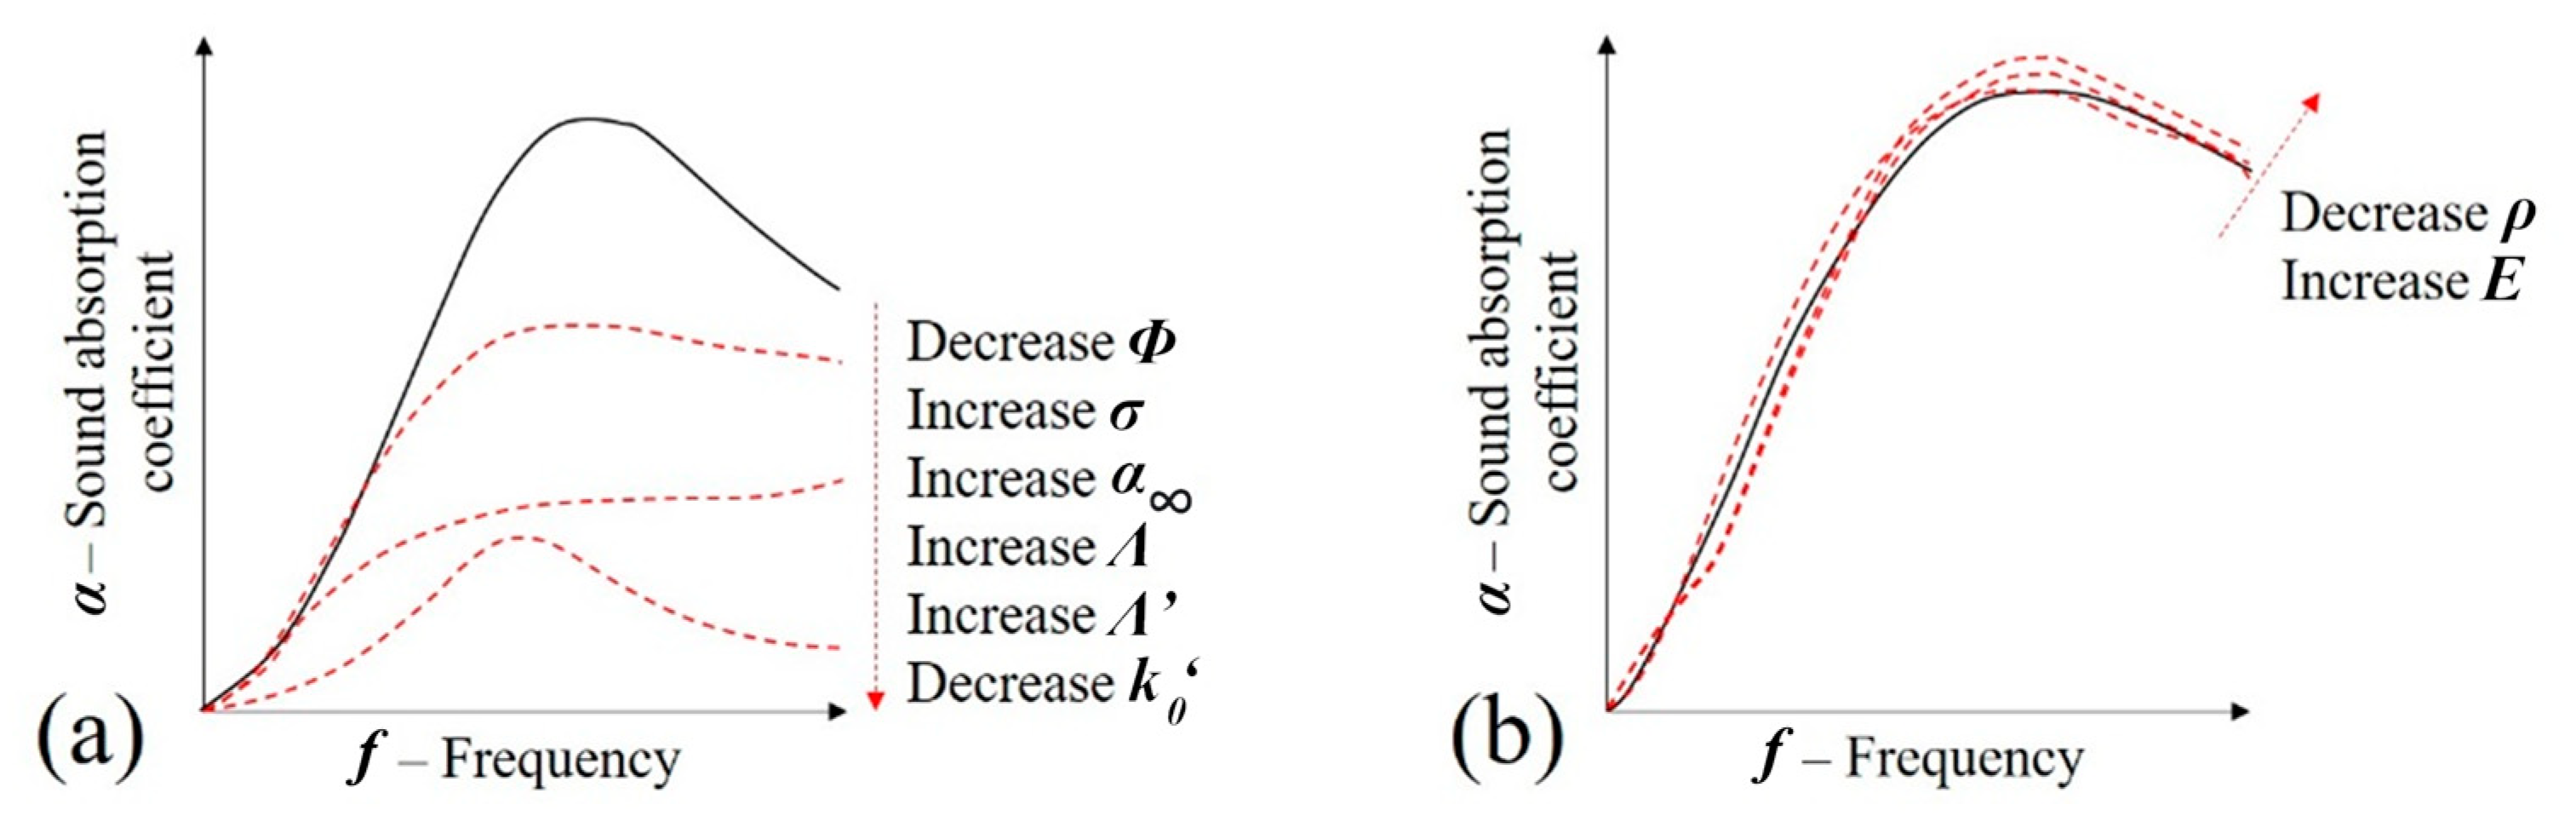
Figure 17 shows the combination of parameter variations that were analyzed according to what occurs in the samples when foams are introduced in the voids of the initial metallic lattice. In Figure 17a, it may be observed that the rigid interaction during the acoustic progressions that is predicted by the JCAL model implies a reduction of the sound absorption coefficient peak. Additionally, there is also a lowering of the sound absorption peak frequency. According to Figure 17b, a small increase in the sound absorption coefficient is also expected due to the poroelastic influence.
Overall, these predictions can describe the variation of the experimental results (Figure 17): (i) the reduction of the peak and its change in frequency that is observed when the foam is inserted are justified by the variations in JCAL parameters described in Figure 17a; (ii) the small variation between the samples with flexible and rigid foam samples is due to the change in poroelastic properties shown in Figure 17b.
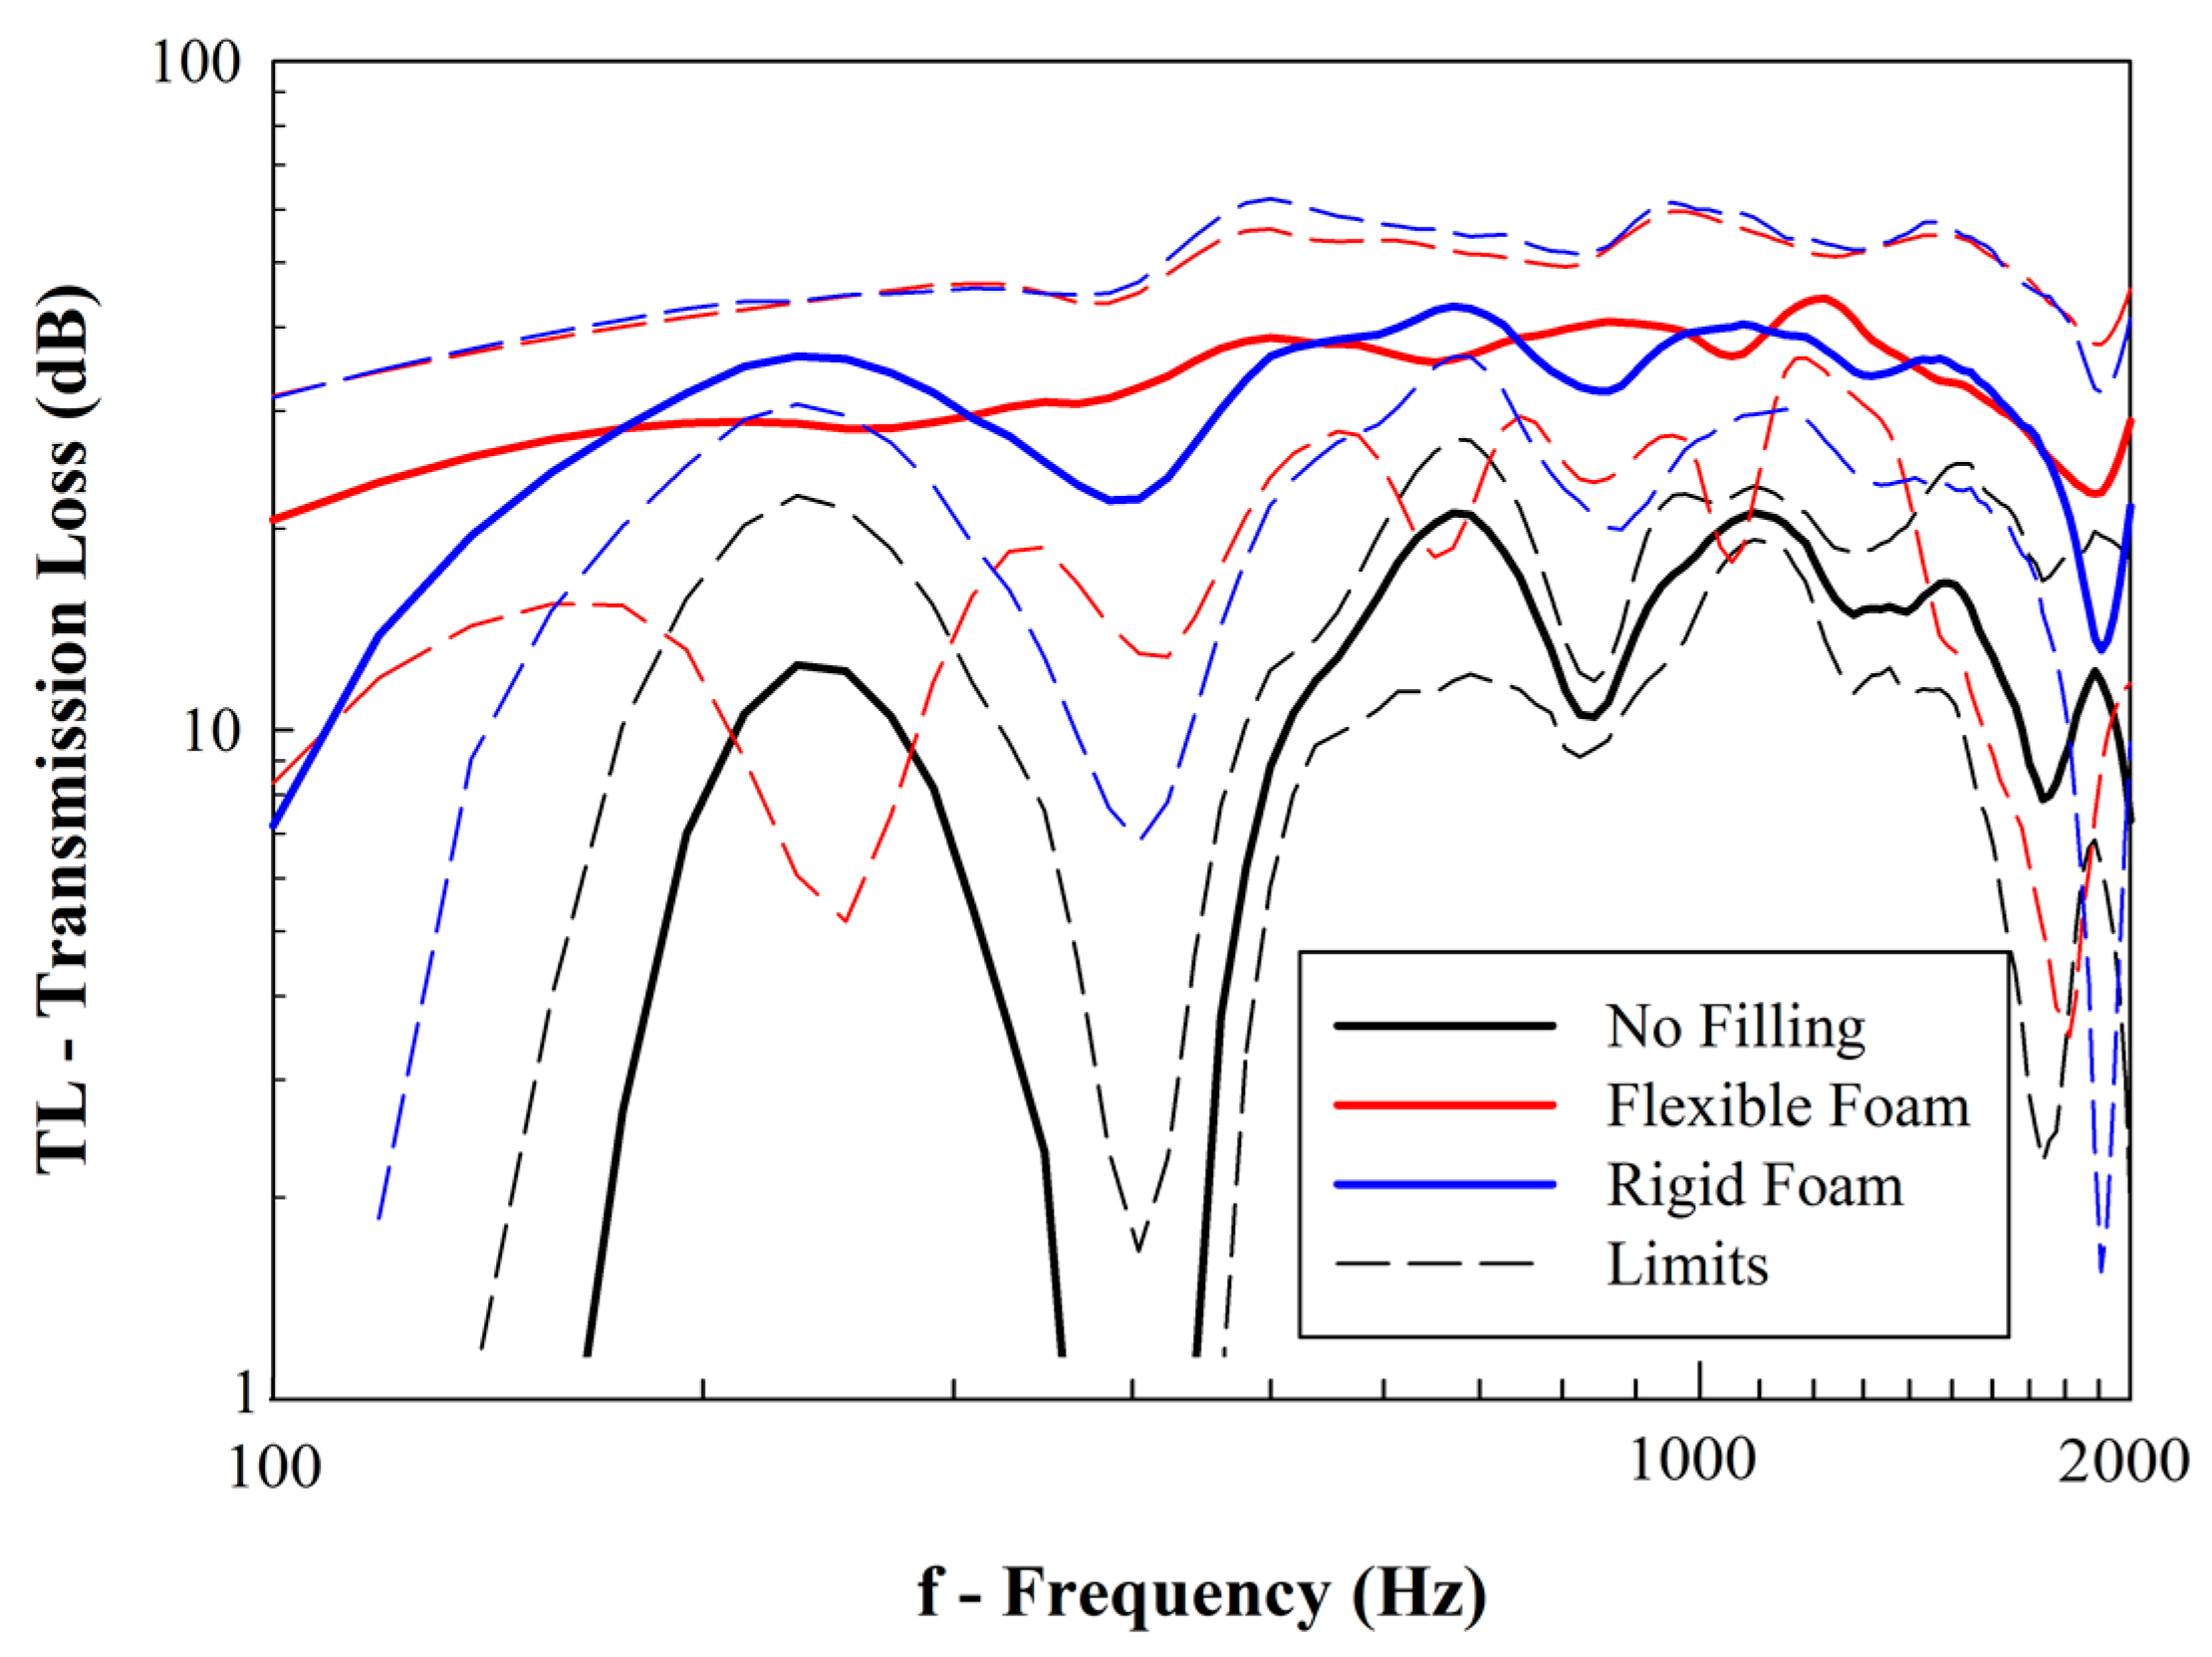
Figure 18 shows the experimental results concerning the transmission loss (TL) of the manufactured samples. It is shown that the filling of the samples with foam was able to successfully increase the transmission loss, i.e., reduce the propagation of acoustic noise by its damping. More important, it may be observed that there are frequencies (e.g., 100–150 Hz and ≈400 Hz) that the unfilled samples cannot damp the noise.
The transmissibility (T) of a cellular solid (i.e., porous media) may be described by Equation (32), in which L is the sample width, Υ(ω) and k(ω) are angular frequency-dependent variables [52]:
Such constants may be determined by Equations (33) and (34), using the dynamic compressibility β(ω), dynamic tortuosity α(ω), fluid density () and compressibility modulus of the fluid () [52]:
It may be observed that the referred variables are described by Equations (35) and (36) and that they may be determined using the sample porosity (), the high-frequency limit of the tortuosity (), viscous static permeability (), fluid viscosity () and Prandtl number (Pr) [29,52]:
According to Table 3 and Equations (32)–(36) and given that the impregnation of the samples with foam reduces the porosity (Φ), there is an increase in the values of tortuosity (i.e., and (). Additionally, there is an increase in the value of dynamic compressibility (β(ω)).
This elevation in the values of dynamic compressibility reduces the variable Υ(ω) while increasing k(ω). Thus, according to Equation (32), the foam-filled samples are expected to have lower values of transmissibility (T). According to Equation (37) [6], it is also expected that they have an enhanced ability to damp the propagation of acoustic noise and, thus, display higher values of transmission loss (TL) [53]. This is corroborated by the experimental presented in Figure 18:
Comparing the experimental results for both unfiled and foam-filled samples, it may be concluded that: (i) unfilled samples are better for sound absorption, especially in certain frequency ranges (Figure 10); and (ii) foam-filled samples, particularly with flexible foams, have more damping capacity and higher values of transmission loss for the tested frequency range (Figure 15).
4. Comparison with Other Materials
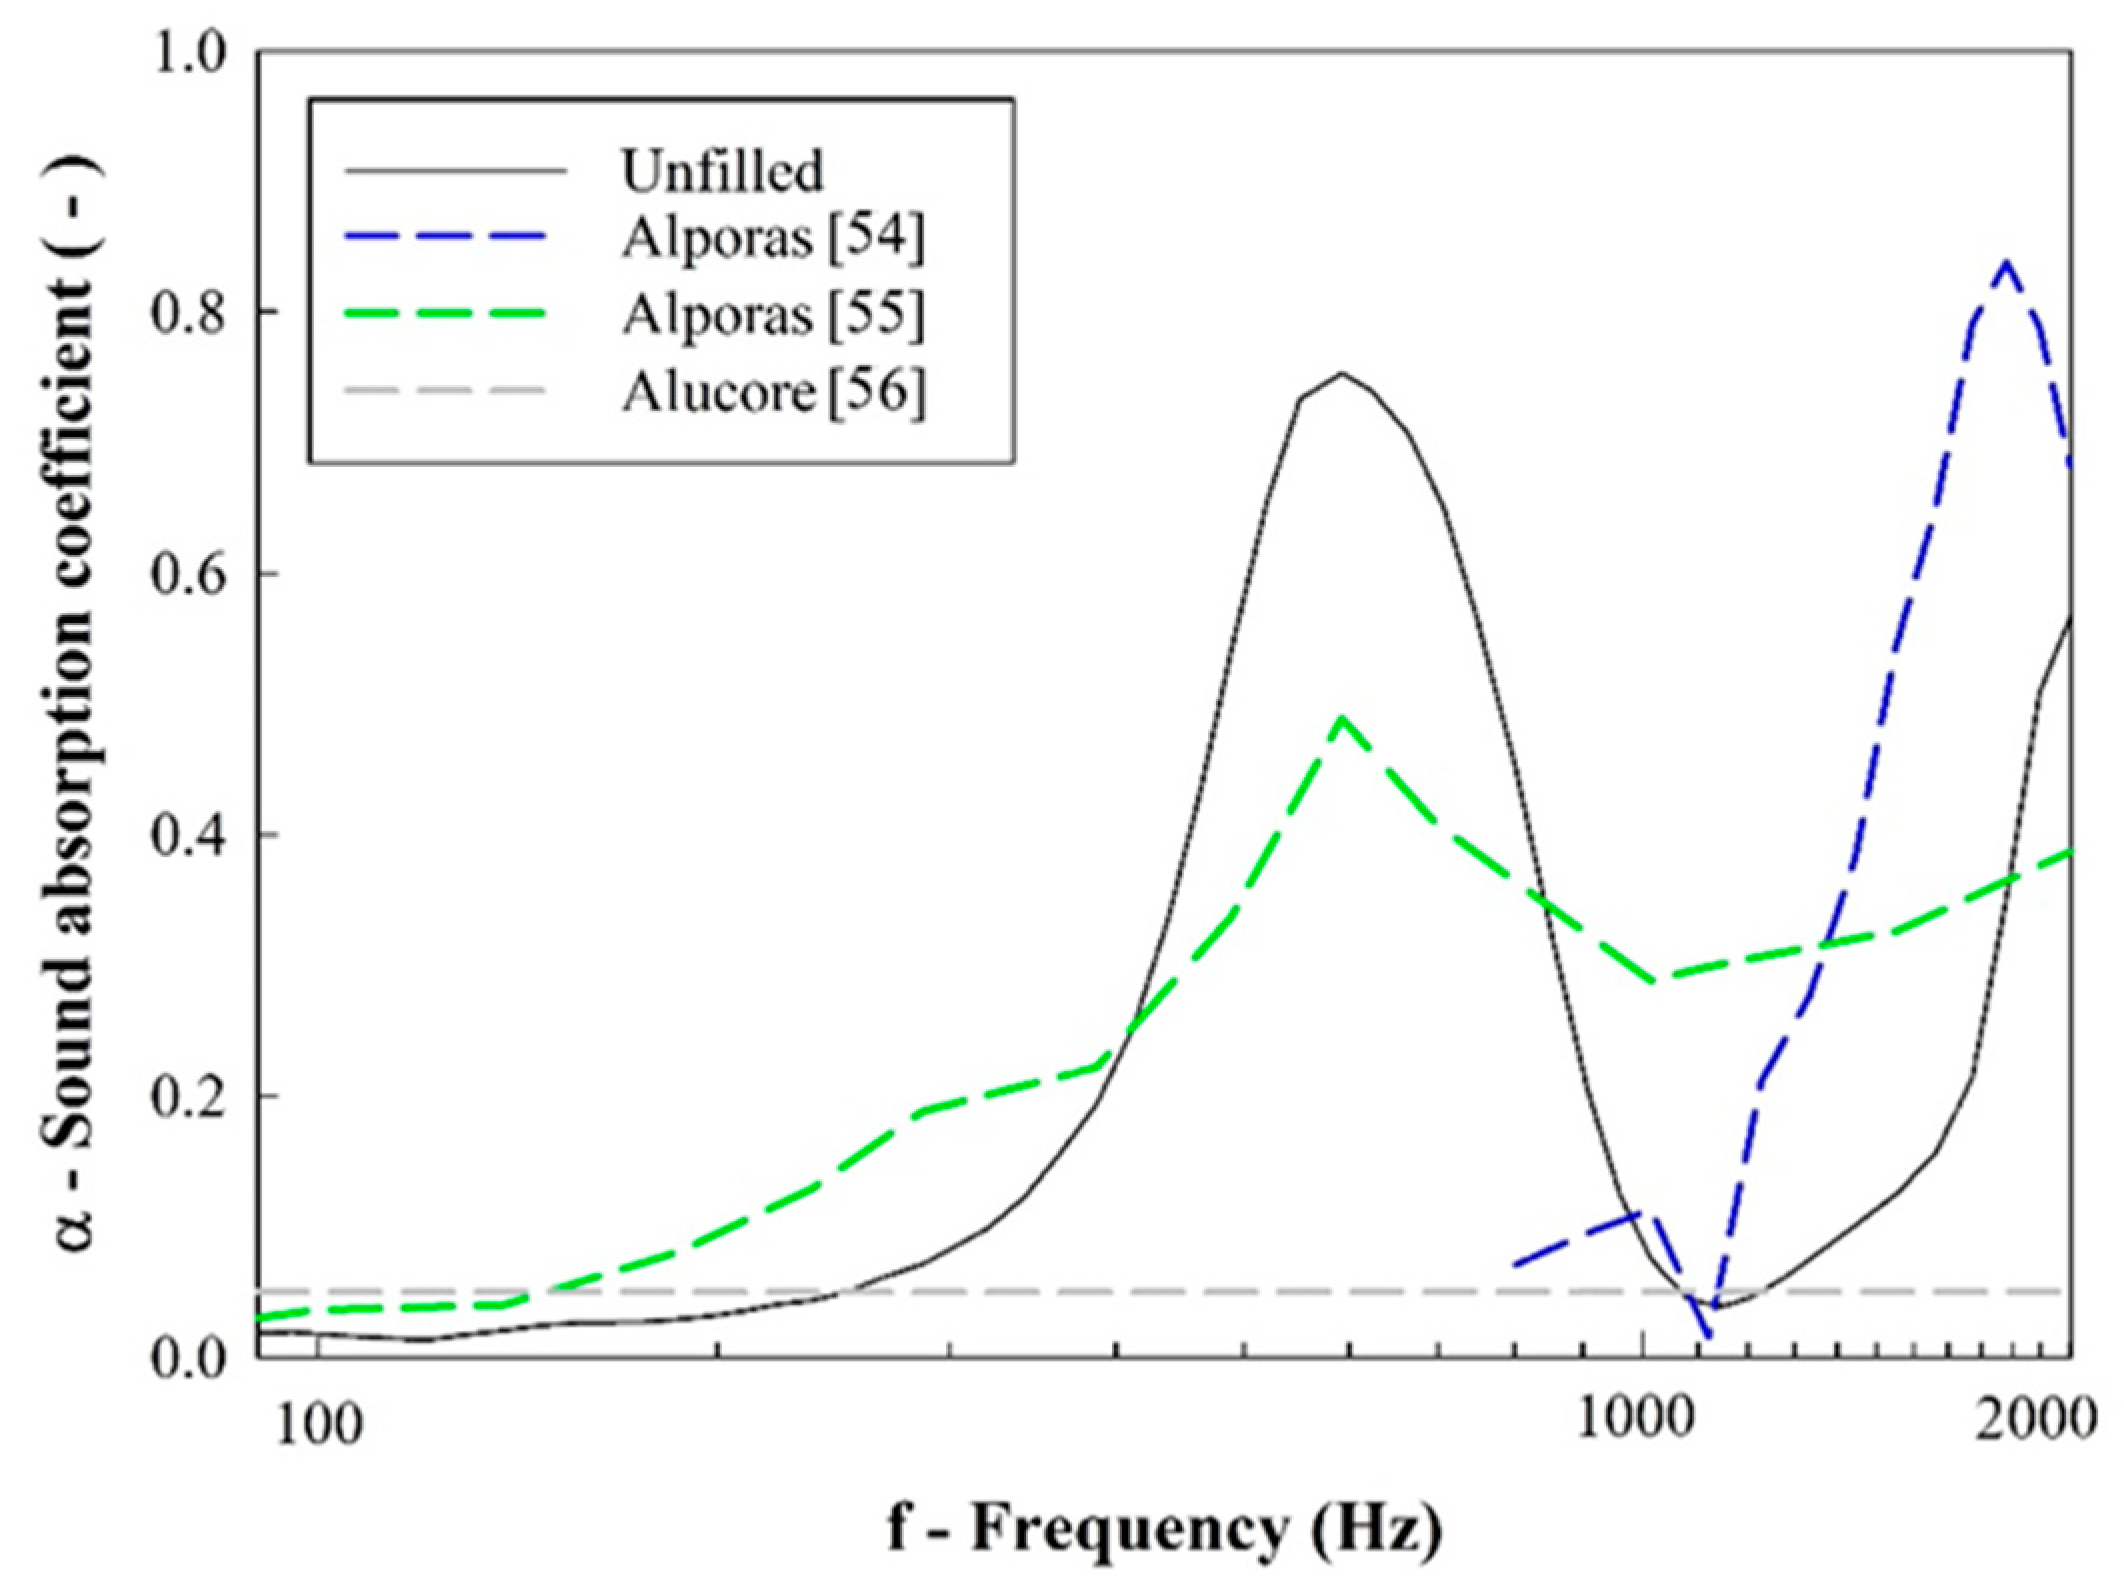
Having analyzed the acoustic properties of the designed cellular solids, it is interesting to compare their sound absorption and transmission loss with solutions currently available for use and reported in other studies. Relatively to the sound absorption coefficient (α), the developed cellular solids are compared with other aluminum foams [54,55,56] with approximate specific densities in Figure 19. Given that unfilled samples showed the most promising results, only this type of sample was chosen for comparison.
Other publications use unfilled low-density aluminum foams, and it is observed that their damping peak occurs at higher frequencies than the tested flexible foam sample. However, this agrees with the experimental result on unfilled samples. Recurring to Figure 19, it may be observed that the damping peak of unfilled samples has high sound absorption relative to other published solutions. Additionally, the peak is wider, suggesting that this absorption is distributed along a wider frequency range. Therefore, unfilled samples are suggested to be a good solution for application in which sound absorption is required.
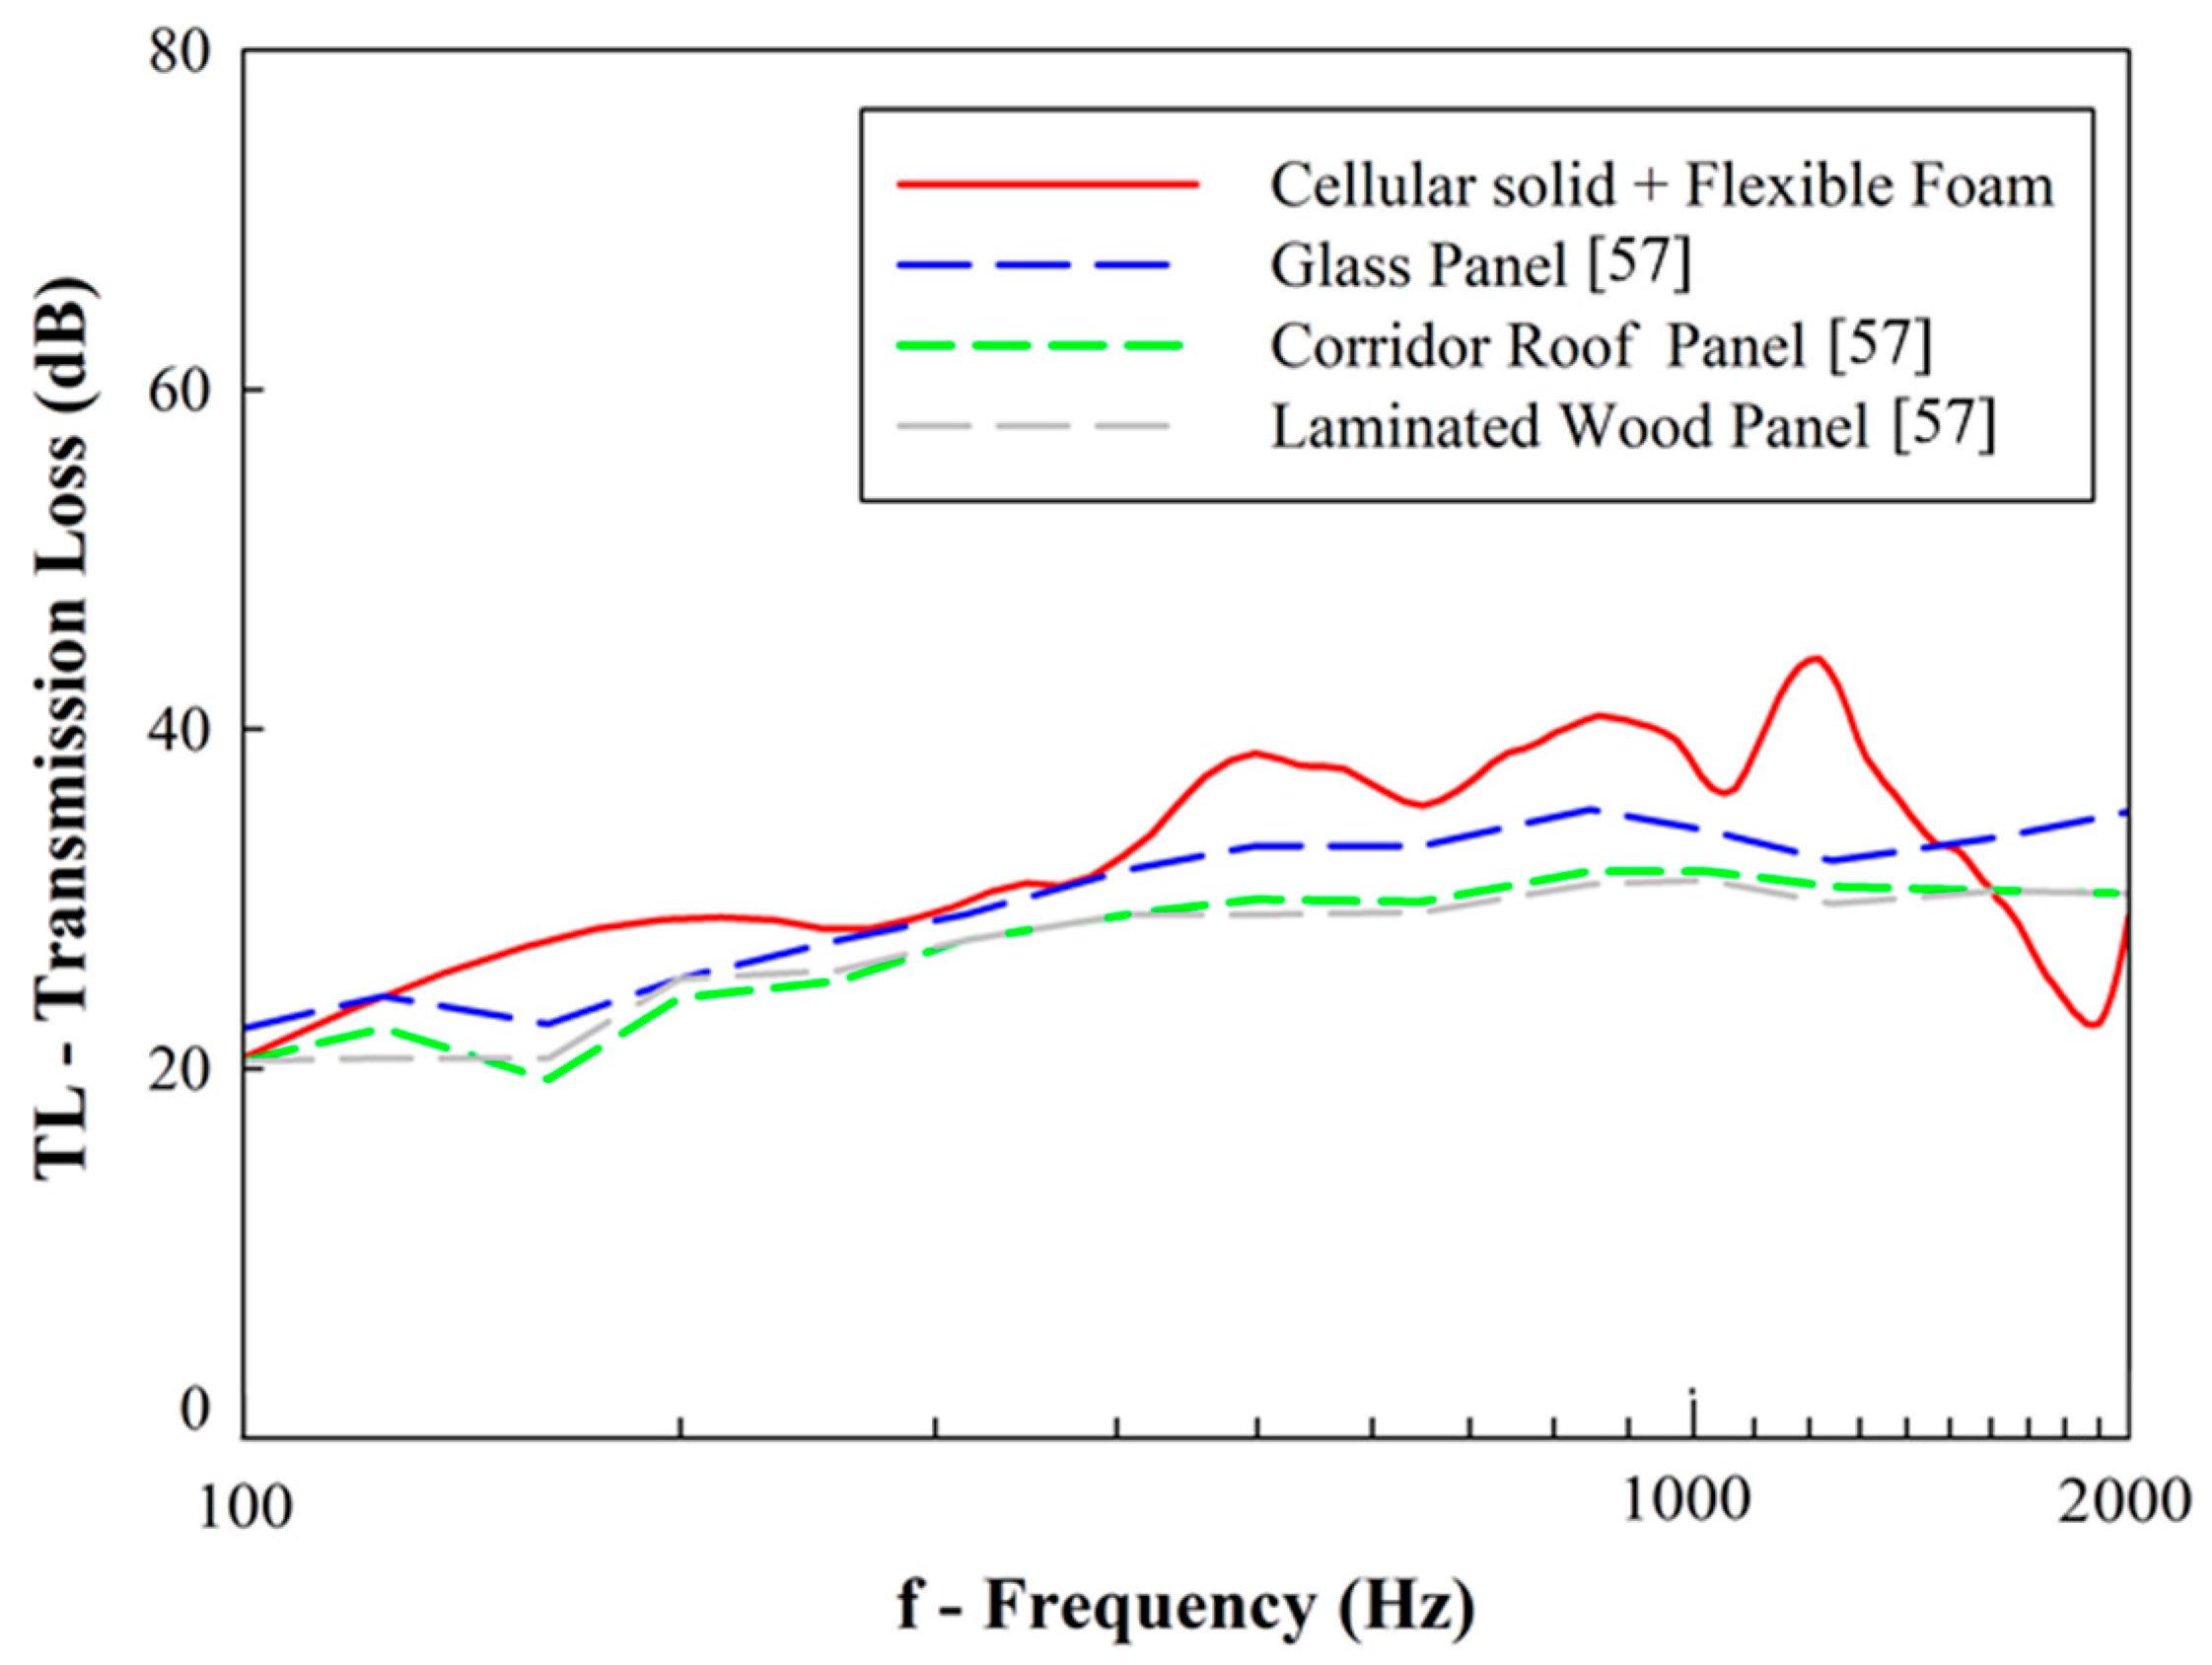
In terms of transmission loss (TL), Figure 20 compares the experimental results with other published works on other materials that are commonly used in train cabin fabrication [57]. Given that unfilled samples show low values of transmission loss, only flexible foam-filled samples were used for comparison purposes. According to these results, it may be observed that the designed composites show an overall higher transmission loss than the other current materials.
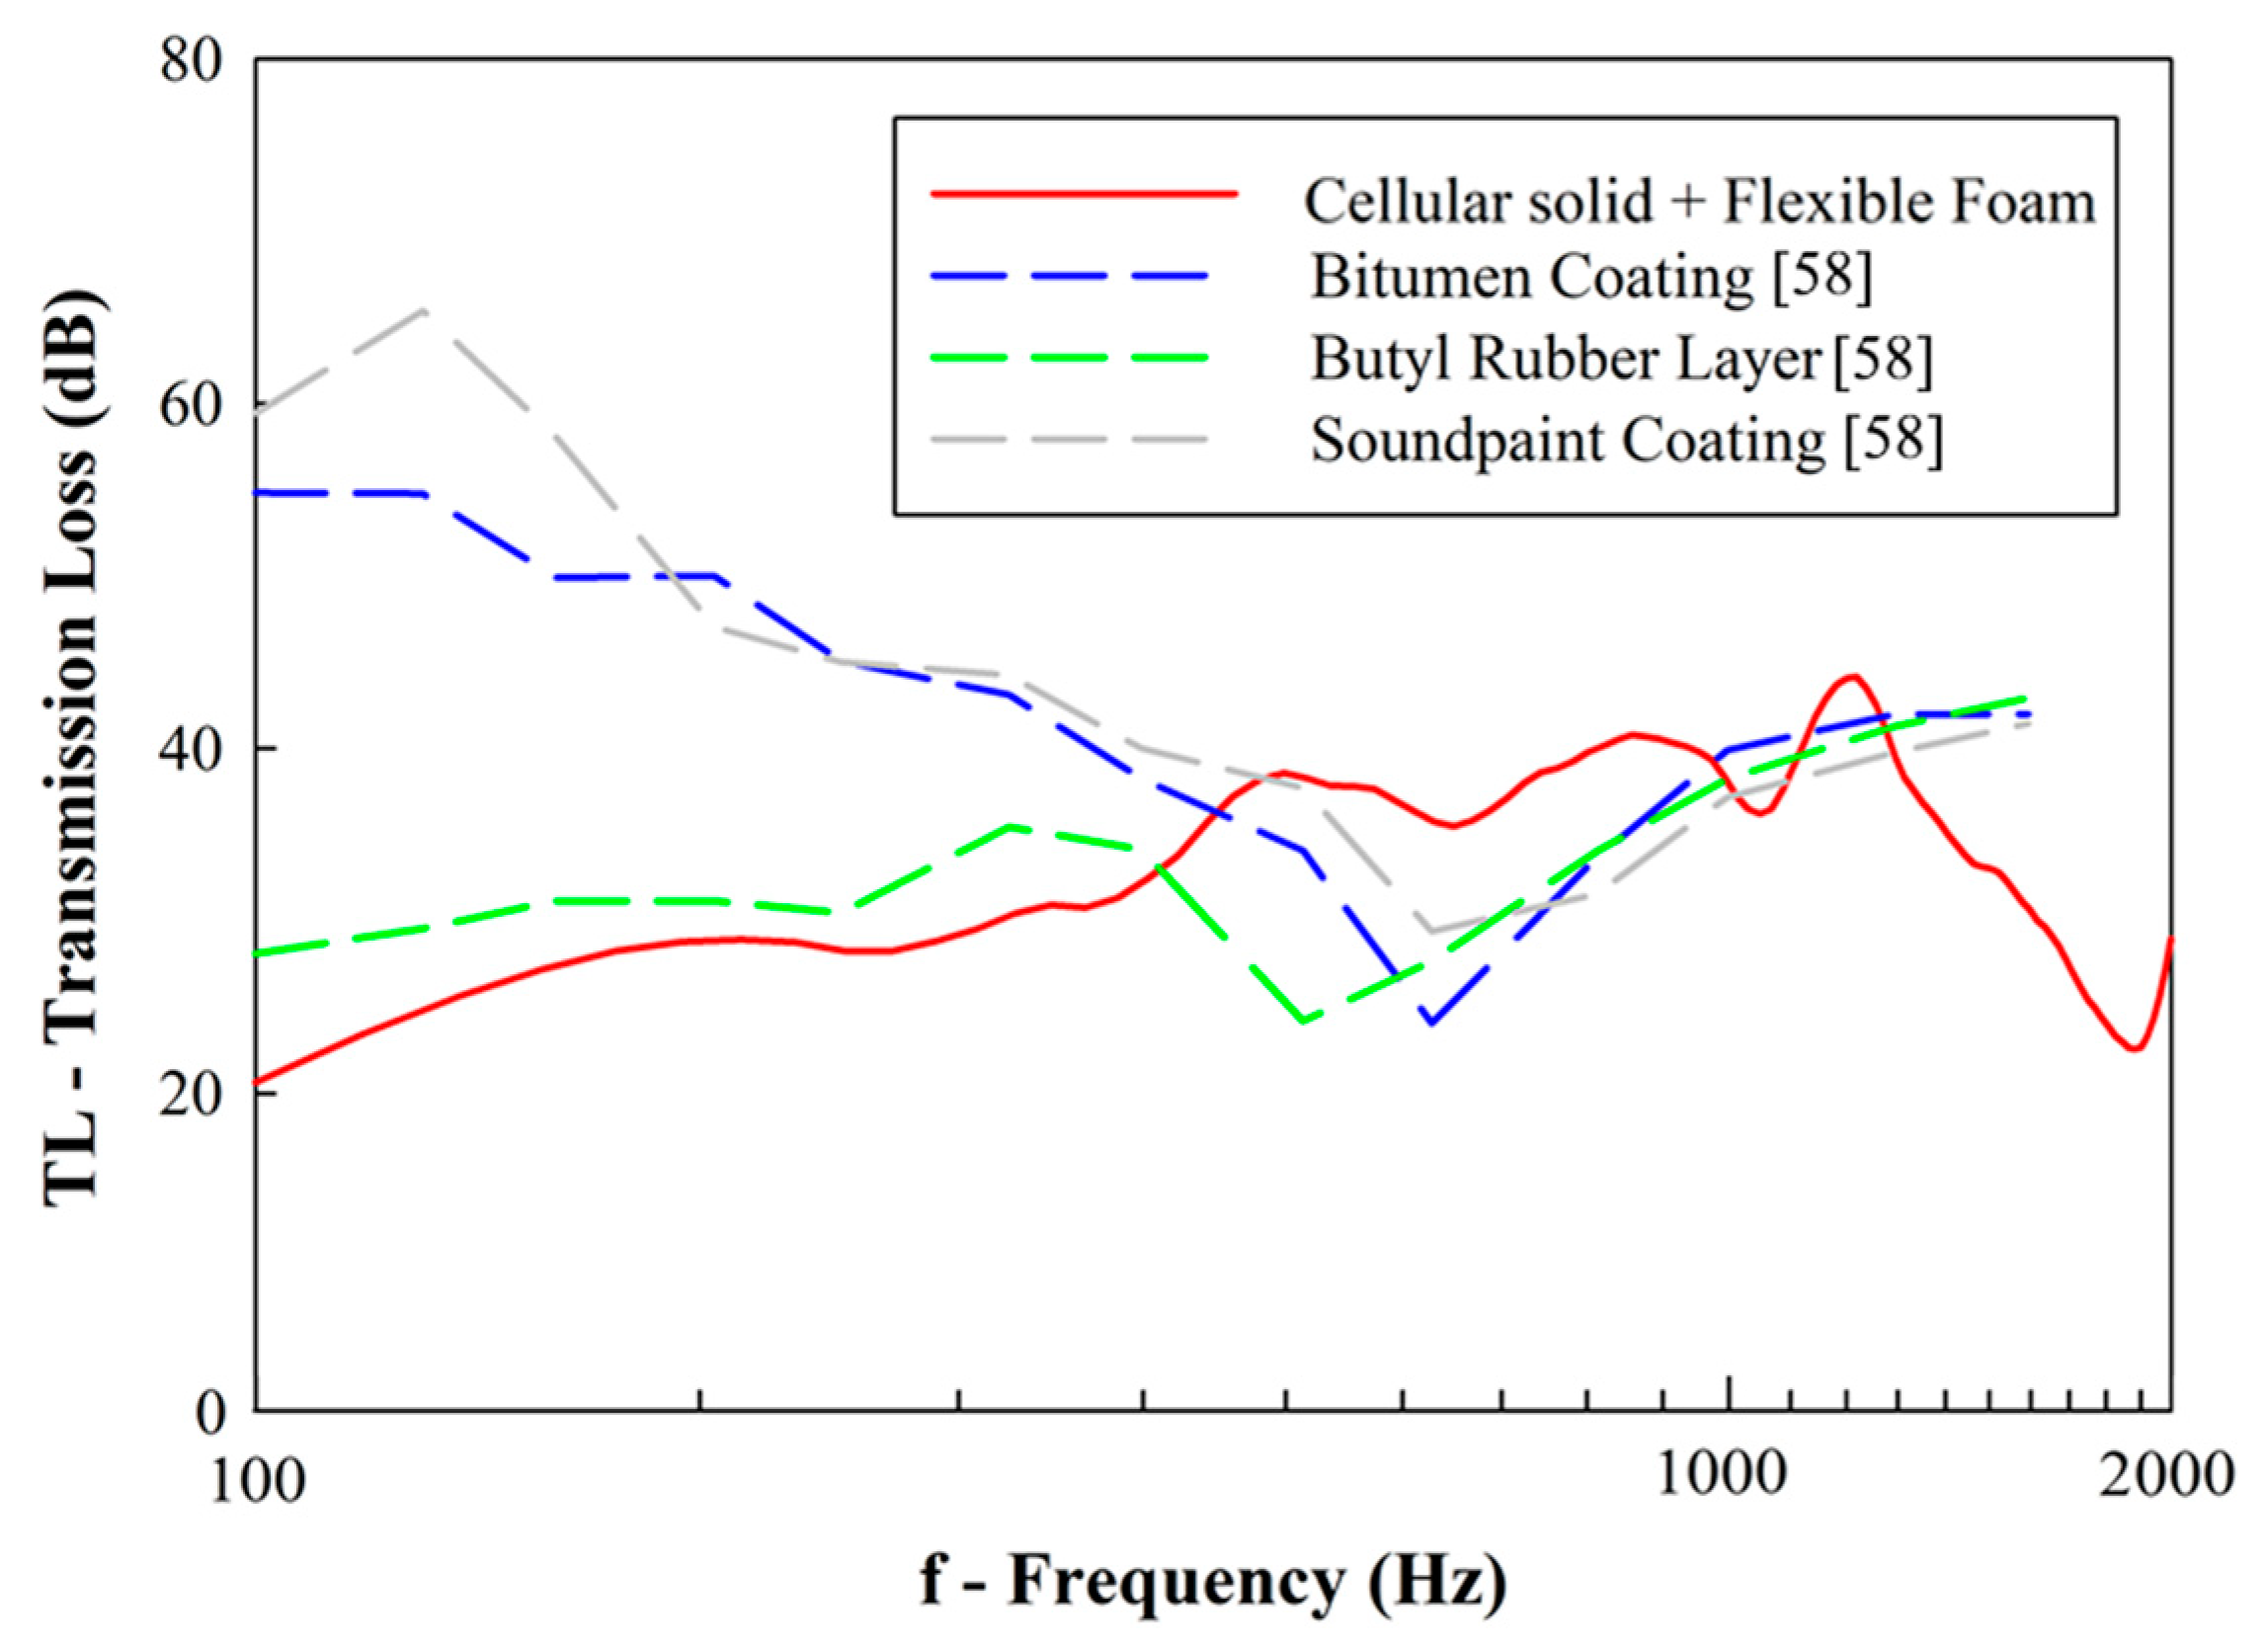
While the developed cellular solids are suggested to enhance the transmission loss relatively to current solutions, Figure 21 compares the experimental data with recently published solutions for noise-damping in railway vehicles [58].
From these results, it may be observed that using bitumen or soundpaint (water-based paint for noise-damping) coatings increases the values of transmission loss, especially in low frequencies. Butyl rubber layers display similar behavior to those shown by the cellular solids filled with foams. Thus, coatings seem an interesting solution to increase transmission loss. Due to this fact, it is suggested that the coupling of bitumen/sound paint coating with the manufactured cellular solids may be interesting to enhance the low-frequency transmission loss in future studies.
5. Conclusions
This study details the vibration, and acoustic properties of unfilled and PU impregnated open-cell non-stochastic cellular solids. According to the results, the following conclusions were established:
(i) Experimental vibration tests show that sample filling with polyurethane foams can successfully increase the damping capacity (i.e., damping ratio). Samples filled with flexible foam show higher values of damping ratio;
(ii) Acoustic tests using an impedance tube show that filling the samples with foam is beneficial to decrease noise propagation (i.e., increase transmission loss). However, unfilled samples display higher sound absorption values in a wider range of frequencies than foam-filled samples. This is mainly attributed to the lowering in porosity, increase in tortuosity and flow resistivity in the foam-filled cellular solids;
(iii) Comparing the acoustic properties of the designed cellular solids with current aluminum foams and materials that are used in train vehicle fabrication, they are suggested to be a promising solution to be used in this particular field. Recent approaches in sound dampening coatings may also be found beneficial for such a purpose. It is suggested that a future combination between the presented cellular solids and such coating may be a promising route to further decrease noise in railway applications;
Author Contributions
Conceptualization, V.H.C.; methodology, V.H.C.; validation, H.P. and J.M.; formal analysis, V.H.C., H.P. and J.M.; investigation, V.H.C.; resources, H.P. and J.M.; data curation, V.H.C.; writing—original draft preparation, V.H.C., H.P. and J.M.; writing—review and editing, V.H.C., H.P. and J.M.; visualization, H.P.; supervision, J.M.; project administration, H.P. and J.M.; funding acquisition, H.P. and J.M. All authors have read and agreed to the published version of the manuscript.
Funding
This work was supported by Fundação para a Ciência e a Tecnologia FCT under the research Doctoral Grant PD/BD/114096/2015, project UIDP/04077/2020 and UIDB/04436/2020, and Stimulus of Scientific Employment Application CEECIND/03991/2017.
Institutional Review Board Statement
Not applicable.
Informed Consent Statement
Not applicable.
Data Availability Statement
The raw/processed data required to reproduce these findings cannot be shared at this time as the data also forms part of an ongoing study.
Conflicts of Interest
The authors declare no conflict of interest. The funders had no role in the design of the study; in the collection, analyses, or interpretation of data; in the writing of the manuscript, or in the decision to publish the results.
Abbreviations
| Variable | Description |
| A | Area (m2) |
| C | Speed of sound (m/s) |
| Cp | Heat capacity (J/K) |
| E | Young’s modulus (Pa) |
| G | Shear modulus (Pa) |
| K | Compressibility modulus (Pa) |
| Dynamic bulk modulus (Pa) | |
| k | Thermal conductivity (W/(m·K)) |
| k0 | Viscous static permeability (m2) |
| k′0 | Static thermal permeability (m2) |
| P | Pressure (Pa) |
| T | Temperature (°C) |
| Transmissibility (dB) | |
| TL | Transmission loss (dB) |
| u | Particle velocity (m/s) |
| V | Volume (m3) |
| v | Fluid velocity (m/s) |
| x | Measurement position (m) |
| Z | Acoustic impedance (Pa∙s/m) |
| c | Characteristic impedance (Pa∙s/m) |
| Zi | Incident acoustic impedance (Pa∙s/m) |
| Zt | Transmitted acoustic impedance (Pa∙s/m) |
| α | Sound absorption coefficient (—) |
| Dynamic tortuosity (—) | |
| High-frequency limit tortuosity (—) | |
| β | Dynamic compressibility (Pa−1) |
| γ | Specific heat (J/(kg·°C)) |
| ξ | Damping ratio (—) |
| η | Dynamic viscosity (Pa∙s) |
| Λ | Viscous characteristic length (m) |
| Λ′ | Thermal characteristic length (m) |
| μ | Fluid viscosity (N∙s/m2) |
| ρ | Air density (kg/m3) |
| Dynamic density (kg/m3) | |
| ρ* | Apparent density (kg/m3) |
| ρ0 | Bulk density (kg/m3) |
| ρf | Fluid density (kg/m3) |
| σ | Airflow resistivity (N∙s/m4) |
| τ | Temperature inside cellular solid (°C) |
| ν | Poisson’s ratio (—) |
| Φ | Porosity (—) |
| ω | Angular frequency (rad/s) |
References
- Vos, P. Railway Noise in Europe; International Union of Railways: Paris, France, 2016. [Google Scholar]
- European Comission Rail Freight Noise Reduction; European Commission: Brussels, Belgium, 2015.
- Gaulon, C.; Pierre, J.; Derec, C.; Jaouen, L.; Bécot, F.-X.; Chevillotte, F.; Elias, F.; Drenckhan, W.; Leroy, V. Acoustic Absorption of Solid Foams with Thin Membranes. Appl. Phys. Lett. 2018, 112, 261904. [Google Scholar] [CrossRef] [Green Version]
- Hilyard, N.; Cunningham, A. Low Density Cellular Plastics: Physical Basis of Behaviour; Springer Science & Business Media: Berlin/Heidelberg, Germany, 2012; ISBN 94-011-1256-8. [Google Scholar]
- Deshmukh, S.; Ronge, H.; Ramamoorthy, S. Design of Periodic Foam Structures for Acoustic Applications: Concept, Parametric Study and Experimental Validation. Mater. Des. 2019, 175, 107830. [Google Scholar] [CrossRef]
- Qiu, S.; Li, S.; Wang, X.; Mao, D. Enhanced Transmission Loss through Lattice-Supported Micro-Membranes. Appl. Acoust. 2019, 153, 127–131. [Google Scholar] [CrossRef]
- Carneiro, V.H.; Puga, H.; Meireles, J. Positive, Zero and Negative Poisson’s Ratio Non-Stochastic Metallic Cellular Solids: Dependence between Static and Dynamic Mechanical Properties. Compos. Struct. 2019, 226, 111239. [Google Scholar] [CrossRef]
- Wang, R.; Shang, J.; Li, X.; Luo, Z.; Wu, W. Vibration and Damping Characteristics of 3D Printed Kagome Lattice with Viscoelastic Material Filling. Sci. Rep. 2018, 8, 9604. [Google Scholar] [CrossRef] [PubMed]
- Yuan, Z.; Rayess, N.; Dukhan, N. Modeling of the Mechanical Properties of a Polymer-Metal Foam Hybrid. Proc. Mater. Sci. 2014, 4, 215–219. [Google Scholar] [CrossRef] [Green Version]
- Duarte, I.; Krstulović-Opara, L.; Dias-de-Oliveira, J.; Vesenjak, M. Axial Crush Performance of Polymer-Aluminium Alloy Hybrid Foam Filled Tubes. Thin-Walled Struct. 2019, 138, 124–136. [Google Scholar] [CrossRef]
- Duarte, I.; Vesenjak, M.; Krstulović-Opara, L.; Ren, Z. Crush Performance of Multifunctional Hybrid Foams Based on an Aluminium Alloy Open-Cell Foam Skeleton. Polym. Test. 2018, 67, 246–256. [Google Scholar] [CrossRef]
- Carneiro, V.H.; Rawson, S.D.; Puga, H.; Meireles, J.; Withers, P.J. Additive Manufacturing Assisted Investment Casting: A Low-Cost Method to Fabricate Periodic Metallic Cellular Lattices. Addit. Manuf. 2020, 33, 101085. [Google Scholar] [CrossRef]
- Carneiro, V.H.; Rawson, S.D.; Puga, H.; Withers, P.J. Macro-, Meso- and Microstructural Characterization of Metallic Lattice Structures Manufactured by Additive Manufacturing Assisted Investment Casting. Sci. Rep. 2021, 11, 4974. [Google Scholar] [CrossRef] [PubMed]
- Xu, Y.; Li, Y.; Zhang, A.; Bao, J. Epoxy Foams with Tunable Acoustic Absorption Behavior. Mater. Lett. 2017, 194, 234–237. [Google Scholar] [CrossRef]
- Chen, S.; Jiang, Y.; Chen, J.; Wang, D. The Effects of Various Additive Components on the Sound Absorption Performances of Polyurethane Foams. Adv. Mater. Sci. Eng. 2015, 2015, 317561. [Google Scholar] [CrossRef] [Green Version]
- Verdejo, R.; Stämpfli, R.; Alvarez-Lainez, M.; Mourad, S.; Rodriguez-Perez, M.A.; Brühwiler, P.A.; Shaffer, M. Enhanced Acoustic Damping in Flexible Polyurethane Foams Filled with Carbon Nanotubes. Compos. Sci. Technol. 2009, 69, 1564–1569. [Google Scholar] [CrossRef]
- Carneiro, V.H.; Lopes, D.; Puga, H.; Meireles, J. Numerical Inverse Engineering as a Route to Determine the Dynamic Mechanical Properties of Metallic Cellular Solids. Mater. Sci. Eng. A 2020, 800, 140428. [Google Scholar] [CrossRef]
- da Silva, C.C.B.; Terashima, F.J.H.; Barbieri, N.; de Lima, K.F. Sound Absorption Coefficient Assessment of Sisal, Coconut Husk and Sugar Cane Fibers for Low Frequencies Based on Three Different Methods. Appl. Acoust. 2019, 156, 92–100. [Google Scholar] [CrossRef]
- Eerden, F.J.M.; de Bree, H.-E.; Tijdeman, H. Experiments with a New Acoustic Particle Velocity Sensor in an Impedance Tube. Sens. Actuators A Phys. 1998, 69, 126–133. [Google Scholar] [CrossRef]
- Justus, C.G.; Woodrum, A. Atmospheric Pressure, Density, Temperature and Wind Variations between 50 and 200 Km; Nasa: Washington, DC, USA, 1972. [Google Scholar]
- Kuttruff, H. Acoustics: An Introduction; CRC Press: Boca Raton, FL, USA, 2007; ISBN 0-203-97089-6. [Google Scholar]
- Cats, P.; Tijs, E.; Comesana, D.F. Exploration of the Differences between a Pressure-Velocity Based in Situ Absorption Measurement Method and the Standardized Reverberant Room Method; ASA: Montereal, Canada, 2013; Volume 19, p. 15140. [Google Scholar]
- Rodriguez-Fernandez, C.; Fernandez-Comesana, D. In-Situ Estimation of Sound Transmission Loss Using a Scanning Sound Intensity Pu Probe. In Proceedings of the Simpósio Acústica Vibrações, Coimbra, Portugal, 3 February 2017. [Google Scholar]
- Buiat, M. Comparison Calibration of Low-Cost Prototypes of Acoustic Pressure-Velocity Probes and Some Applicatino Case-Studies. Ph.D. Thesis, Università degli Studi di Ferrara, Ferrara, Italy, 2015. [Google Scholar]
- Tijs, E. Study and Development of an in Situ Acoustic Absorption Measurement Method. Ph.D. Thesis, University of Twente, Enschede, The Netherlands, 2013. [Google Scholar]
- Tiuc, A.E.; Nemeş, O.; Vermeşan, H.; Toma, A.C. New Sound Absorbent Composite Materials Based on Sawdust and Polyurethane Foam. Compos. Part B Eng. 2019, 165, 120–130. [Google Scholar] [CrossRef]
- Gwon, J.G.; Kim, S.K.; Kim, J.H. Sound Absorption Behavior of Flexible Polyurethane Foams with Distinct Cellular Structures. Mater. Des. 2016, 89, 448–454. [Google Scholar] [CrossRef]
- Allard, J.; Atalla, N. Propagation of Sound in Porous Media: Modelling Sound Absorbing Materials 2e; John Wiley & Sons: Hoboken, NJ, USA, 2009; ISBN 0-470-74734-X. [Google Scholar]
- Johnson, D.L.; Koplik, J.; Dashen, R. Theory of Dynamic Permeability and Tortuosity in Fluid-Saturated Porous Media. J. Fluid Mechan. 1987, 176, 379–402. [Google Scholar] [CrossRef]
- Lafarge, D.; Lemarinier, P.; Allard, J.F.; Tarnow, V. Dynamic Compressibility of Air in Porous Structures at Audible Frequencies. J. Acoust. Soc. Am. 1997, 102, 1995–2006. [Google Scholar] [CrossRef] [Green Version]
- Bruneau, M.; Potel, C. Materials and Acoustics Handbook; Wiley Online Library: Hoboken, NJ, USA, 2009; ISBN 1-84821-074-4. [Google Scholar]
- Chevillotte, F.; Perrot, C. Effect of the Three-Dimensional Microstructure on the Sound Absorption of Foams: A Parametric Study. J. Acoust. Soc. Am. 2017, 142, 1130–1140. [Google Scholar] [CrossRef]
- Trinh, V.H.; Perrot, C.; Langlois, V.; Pitois, O.; Khidas, Y. Achievement of Acoustical Properties of Foam Materials by Tuning Membrane Level: Elaborations, Models and Experiments. arXiv 2017, arXiv:1712.03849. [Google Scholar]
- Panneton, R.; Olny, X. Acoustical Determination of the Parameters Governing Viscous Dissipation in Porous Media. J. Acoust. Soc. Am. 2006, 119, 2027–2040. [Google Scholar] [CrossRef] [PubMed]
- Beranek, L.L. Acoustic Impedance of Porous Materials. J. Acoust. Soc. Am. 1942, 13, 248–260. [Google Scholar] [CrossRef]
- Wang, X.; Lu, T.J. Optimized Acoustic Properties of Cellular Solids. J. Acoust. Soc. Am. 1999, 106, 756–765. [Google Scholar] [CrossRef]
- Knapen, E.; Lanoye, R.; Vermeir, G.; Lauriks, W.; Van Gemert, D. Acoustic Properties of Sound Absorbing, Polymer-Modified Porous Cement Mortars. In Proceedings of the MSR VI, Karlsruhe, Germany, 15–18 September 2003; pp. 347–358. [Google Scholar]
- Cao, L.; Fu, Q.; Si, Y.; Ding, B.; Yu, J. Porous Materials for Sound Absorption. Compos. Commun. 2018, 10, 25–35. [Google Scholar] [CrossRef]
- Whitaker, S. Flow in Porous Media I: A Theoretical Derivation of Darcy’s Law. Transp. Porous Media 1986, 1, 3–25. [Google Scholar] [CrossRef]
- Delany, M.; Bazley, E. Acoustical Properties of Fibrous Absorbent Materials. Appl. Acoust. 1970, 3, 105–116. [Google Scholar] [CrossRef]
- Pisani, L. Simple Expression for the Tortuosity of Porous Media. Transp. Porous Media 2011, 88, 193–203. [Google Scholar] [CrossRef]
- Liu, Z.; Fard, M.; Jazar, R. Development of an Acoustic Material Database for Vehicle Interior Trims; SAE Technical Paper; SAE: Warrendale, PA, USA, 2015. [Google Scholar]
- Hoang, M.T.; Bonnet, G.; Perrot, C. Multi-Scale Acoustics of Partially Open Cell Poroelastic Foams; ASA: Montereal, Canada, 2013; Volume 19, p. 65013. [Google Scholar]
- Leclaire, P.; Kelders, L.; Lauriks, W.; Melon, M.; Brown, N.; Castagnede, B. Determination of the Viscous and Thermal Characteristic Lengths of Plastic Foams by Ultrasonic Measurements in Helium and Air. J. Appl. Phys. 1996, 80, 2009–2012. [Google Scholar] [CrossRef] [Green Version]
- Olny, X.; Panneton, R. Acoustical Determination of the Parameters Governing Thermal Dissipation in Porous Media. J. Acoust. Soc. Am. 2008, 123, 814–824. [Google Scholar] [CrossRef]
- Biot, M.A. Theory of Propagation of Elastic Waves in a Fluid-Saturated Porous Solid. I. Low-Frequency Range. J. Acoust. Soc. Am. 1956, 28, 168–178. [Google Scholar] [CrossRef]
- Biot, M.A. Theory of Propagation of Elastic Waves in a Fluid-Saturated Porous Solid. II. Higher Frequency Range. J. Acoust. Soc. Am. 1956, 28, 179–191. [Google Scholar] [CrossRef]
- Dib, L.; Bouhedja, S.; Amrani, H. Mechanical Parameters Effects on Acoustic Absorption at Polymer Foam. Adv. Mater. Sci. Eng. 2015, 2015, 896035. [Google Scholar] [CrossRef] [Green Version]
- Plona, T.J. Observation of a Second Bulk Compressional Wave in a Porous Medium at Ultrasonic Frequencies. Appl. Phys. Lett. 1980, 36, 259–261. [Google Scholar] [CrossRef] [Green Version]
- Bécot, F.-X.; Jaouen, L. An Alternative Biot’s Formulation for Dissipative Porous Media with Skeleton Deformation. J. Acoust. Soc. Am. 2013, 134, 4801–4807. [Google Scholar] [CrossRef] [PubMed] [Green Version]
- Fung, Y. Foundations of Solid Mechanics; Prentice Hall: Englewood Cliffs, NJ, USA, 1965. [Google Scholar]
- Reyhanoglu, M. Computational and Experimental Studies of Acoustic Waves; BoD–Books on Demand: Zagreb, Croatia, 2018; ISBN 953-51-3715-8. [Google Scholar]
- Yahya, I. Analytical Expression for Sound Transmission Loss Calculation: An Improvement to the Existing Method after Singh and Katra. Adv. Acoust. Vib. 2010, 2009, 574604. [Google Scholar] [CrossRef]
- Ashby, M.F.; Evans, T.; Fleck, N.A.; Hutchinson, J.; Wadley, H.; Gibson, L. Metal Foams: A Design Guide; Elsevier: New York, NY, USA, 2000; ISBN 0-08-051146-5. [Google Scholar]
- Miyoshi, T.; Itoh, M.; Akiyama, S.; Kitahara, A. Aluminum foam, “ALPORAS”: The Production Process, Properties and Applications. MRS Online Proc. Libr. Arch. 1998, 521, 133–138. [Google Scholar] [CrossRef]
- Lu, T.J.; Hess, A.; Ashby, M.F. Sound Absorption in Metallic Foams. J. Appl. Phys. 1999, 85, 7528–7539. [Google Scholar] [CrossRef]
- Dai, W.; Zheng, X.; Luo, L.; Hao, Z.; Qiu, Y. Prediction of High-Speed Train Full-Spectrum Interior Noise Using Statistical Vibration and Acoustic Energy Flow. Appl. Acoust. 2019, 145, 205–219. [Google Scholar] [CrossRef]
- Fan, R.; Meng, G.; Yang, J.; He, C. Experimental Study of the Effect of Viscoelastic Damping Materials on Noise and Vibration Reduction within Railway Vehicles. J. Sound Vibr. 2009, 319, 58–76. [Google Scholar] [CrossRef]
Figure 1.
Aluminum cellular lattice: (a) CAD model and (b) cast sample.

Figure 2.
Sample foaming: (a) initial sample—t = 0 s; (b) pouring—t = 20 s; (c–e) detail of foam filling the interior of the sample—t = 30 s, 32 s and 34 s.
Figure 2.
Sample foaming: (a) initial sample—t = 0 s; (b) pouring—t = 20 s; (c–e) detail of foam filling the interior of the sample—t = 30 s, 32 s and 34 s.

Figure 3.
Detail of impedance tube and sample assembly for sound absorption testing.

Figure 4.
Detail of incident and reflected waves during sound absorption testing.

Figure 5.
Detail of impedance tube assembly for transmission loss testing.

Figure 6.
Detail of incident reflected and transmitted waves during transmission loss testing.

Figure 7.
Sample frequency response function (FRF) from the vibration testing.

Figure 8.
Average damping ratios (ξ) from the vibration testing.

Figure 9.
Noise progression: (a) external transmission and (b) internal reflection.

Figure 10.
Results from sound absorption coefficient (solid and dashed lines represent, respectively, the average and maximum/minimum values).
Figure 10.
Results from sound absorption coefficient (solid and dashed lines represent, respectively, the average and maximum/minimum values).

Figure 11.
Results from acoustic impedance (solid and dashed lines represent, respectively, the average and maximum/minimum values).
Figure 11.
Results from acoustic impedance (solid and dashed lines represent, respectively, the average and maximum/minimum values).

Figure 12.
JCAL model in (a) unfilled and (b) foam-filled samples.

Figure 13.
Influence of visco-inertial parameters in the sound absorption coefficient of porous media (JCAL model): (a) Φ—porosity; and (b) σ—air flow resistivity.
Figure 13.
Influence of visco-inertial parameters in the sound absorption coefficient of porous media (JCAL model): (a) Φ—porosity; and (b) σ—air flow resistivity.

Figure 14.
Influence of visco-inertial parameters in the sound absorption coefficient of porous media (JCAL model): (a) —high-frequency limit of the tortuosity; and (b) Λ—viscous characteristic length.
Figure 14.
Influence of visco-inertial parameters in the sound absorption coefficient of porous media (JCAL model): (a) —high-frequency limit of the tortuosity; and (b) Λ—viscous characteristic length.

Figure 15.
Influence of visco-thermal parameters in the sound absorption coefficient of porous media (JCAL model): (a) Λ′—thermal characteristic length; and (b) k′0—static thermal permeability.
Figure 15.
Influence of visco-thermal parameters in the sound absorption coefficient of porous media (JCAL model): (a) Λ′—thermal characteristic length; and (b) k′0—static thermal permeability.

Figure 16.
Influence of changing poroelasticity parameters in the sound absorption coefficient of a generic porous media: (a) E—elastic modulus and (b) ρ—density.
Figure 16.
Influence of changing poroelasticity parameters in the sound absorption coefficient of a generic porous media: (a) E—elastic modulus and (b) ρ—density.

Figure 17.
Combination of changing parameters in the sound absorption of porous media due to the effect of (a) rigid structure (JCAL model) and (b) poroelasticity (Biot’s theory).
Figure 17.
Combination of changing parameters in the sound absorption of porous media due to the effect of (a) rigid structure (JCAL model) and (b) poroelasticity (Biot’s theory).

Figure 18.
Results from acoustic transmission loss (solid and dashed lines represent, respectively, the average and maximum/minimum values).
Figure 18.
Results from acoustic transmission loss (solid and dashed lines represent, respectively, the average and maximum/minimum values).

Figure 19.
Sound absorption coefficient comparison: designed cellular solids vs. other Al foams.

Figure 20.
Transmission loss comparison: designed cellular solids vs. materials used in train vehicle fabrication.
Figure 20.
Transmission loss comparison: designed cellular solids vs. materials used in train vehicle fabrication.

Figure 21.
Transmission loss comparison: designed cellular solids vs. other suggested solutions for noise-damping.
Figure 21.
Transmission loss comparison: designed cellular solids vs. other suggested solutions for noise-damping.


Table 1.
Proportion of polyurethane foam reagents.
| Foam | Isocyanate/Polyol Ratio | Manufacturer |
|---|---|---|
| Rigid | 1:1 | Cronodur Foam 100 |
| Flexible | 1:2 | Cronodur Foam Flex |
Table 2.
General characteristics of the manufactured foams.
| Foam | Flexible | Rigid |
|---|---|---|
| Optical microscopy (10×) |  |  |
| Apparent density (kg/m3) | 44.6 | 37.2 |
Table 3.
Proportion of polyurethane foam reagents (note: ↑—increase; ↓—decrease).
| Variable | Φ | ||||||
|---|---|---|---|---|---|---|---|
| Change |
Publisher’s Note: MDPI stays neutral with regard to jurisdictional claims in published maps and institutional affiliations. |
© 2021 by the authors. Licensee MDPI, Basel, Switzerland. This article is an open access article distributed under the terms and conditions of the Creative Commons Attribution (CC BY) license (https://creativecommons.org/licenses/by/4.0/).
Share and Cite
MDPI and ACS Style
Carneiro, V.H.; Puga, H.; Meireles, J. Vibration Damping and Acoustic Behavior of PU-Filled Non-Stochastic Aluminum Cellular Solids. Metals 2021, 11, 725. https://doi.org/10.3390/met11050725
AMA Style
Carneiro VH, Puga H, Meireles J. Vibration Damping and Acoustic Behavior of PU-Filled Non-Stochastic Aluminum Cellular Solids. Metals. 2021; 11(5):725. https://doi.org/10.3390/met11050725
Chicago/Turabian StyleCarneiro, Vitor Hugo, Hélder Puga, and José Meireles. 2021. "Vibration Damping and Acoustic Behavior of PU-Filled Non-Stochastic Aluminum Cellular Solids" Metals 11, no. 5: 725. https://doi.org/10.3390/met11050725
Note that from the first issue of 2016, this journal uses article numbers instead of page numbers. See further details here.