1. Introduction
In general, metal matrix composite (MMC) materials are fabricated by mixing two or more micro-level constituents that are not soluble and varying in material composition. The hard phase of these materials may embed in a soft phase or vice versa during the fabrication of composites. Usually, the strength and modulus of the composite materials are based on the bonding of the matrix (soft phase) and reinforcement (hard phase) materials. Particularly in structural applications, lighter metallic materials like aluminum, nickel, magnesium, titanium, etc. are being used as a matrix material, and these materials are giving support to the reinforcement materials. In addition to the structural properties, the specific mechanical, thermal, and physical properties of metal matrix composite materials mainly depend on the category of reinforcement materials. The MMCs consist of a metallic matrix material such as aluminum, copper, ferrous, magnesium, etc., with an evenly dispersed ceramic reinforcement in the form of carbides, nitrides, andoxides, or metallic phase materials like lead, molybdenum, tungsten, etc.
The preferable base metal for the preparation of MMCs was aluminum and its alloys [
1]. Applications like the fabrication of different components of aerospace vehicles, automobiles, etc. have been carried out using aluminum-based MMCs [
2]. More research works have been carried out in recent years on the mechanical characterization of MMCs prepared via ceramic particles reinforcement with aluminum and its alloys. Ceramic particles such as silicon carbide and alumina were utilized as a reinforcement material in most of the studies. However, studies related to B4C reinforced composites are seldom found. Since the properties like stiffness and hardness of B4C are excellent, along with the minor variation in density between B4C and aluminum/Al-based alloys, it makes B4C an unavoidable reinforcement material [
3]. Fly ash is another option as reinforcement to fabricate aluminum alloy based MMCs since it has good wear resistance. Furthermore, the excellent damping capacity, low density, better abrasive resistance, and low cost [
4] were the desirable properties to opt fly ash as a reinforcement. In addition, the availability of fly ash is huge, since it is the by-product while burning coal in thermal power plants. Therefore, the MMCs with the combination of fly ash and Al-based alloys are used to fabricate the automobile body and engine components.
The manufacturing industries have practiced several fabrication methodologies such as squeeze casting, stir casting, powder metallurgy and spray deposition, etc. [
5]. Therefore, selecting the appropriate manufacturing process concerning the requirement will be helpful to fabricate MMCs effectively and economically. Among the several manufacturing technologies, stir casting is one of the well-established processes for the fabrication of MMCs due to their operational flexibility and cost-effectiveness. Furthermore, the high-volume production of MMCs is possible through lower particle volume of reinforcements [
6]. On the other hand, the traditional machining methods are not good enough to machine the MMCs due to the extreme abrasive characteristics of the reinforced materials [
7,
8,
9,
10]. Hence, in this circumstance, alternative methods like non-traditional machining processes, namely abrasive water jet machining (AWM), electrical discharge machining (EDM), wire electrical discharge machining (WEDM), laser beam machining (LBM), etc., can be used [
11]. However, LBM and AWM were not advisable due to high process cost and poor quality [
12]. Furthermore, compared with EDM, WEDM outperformed while machining complex shapes on MMCs with relatively less cost [
13]. In WEDM, the surface layer of the workpiece material is eradicated using a sequence of sparks produced between the workpiece and electrode. The workpiece and electrode are kept separately and are entirely immersed in dielectric liquid [
14]. While machining through WEDM, electrical conductivity is the primary factor for machining materials [
15,
16,
17,
18].
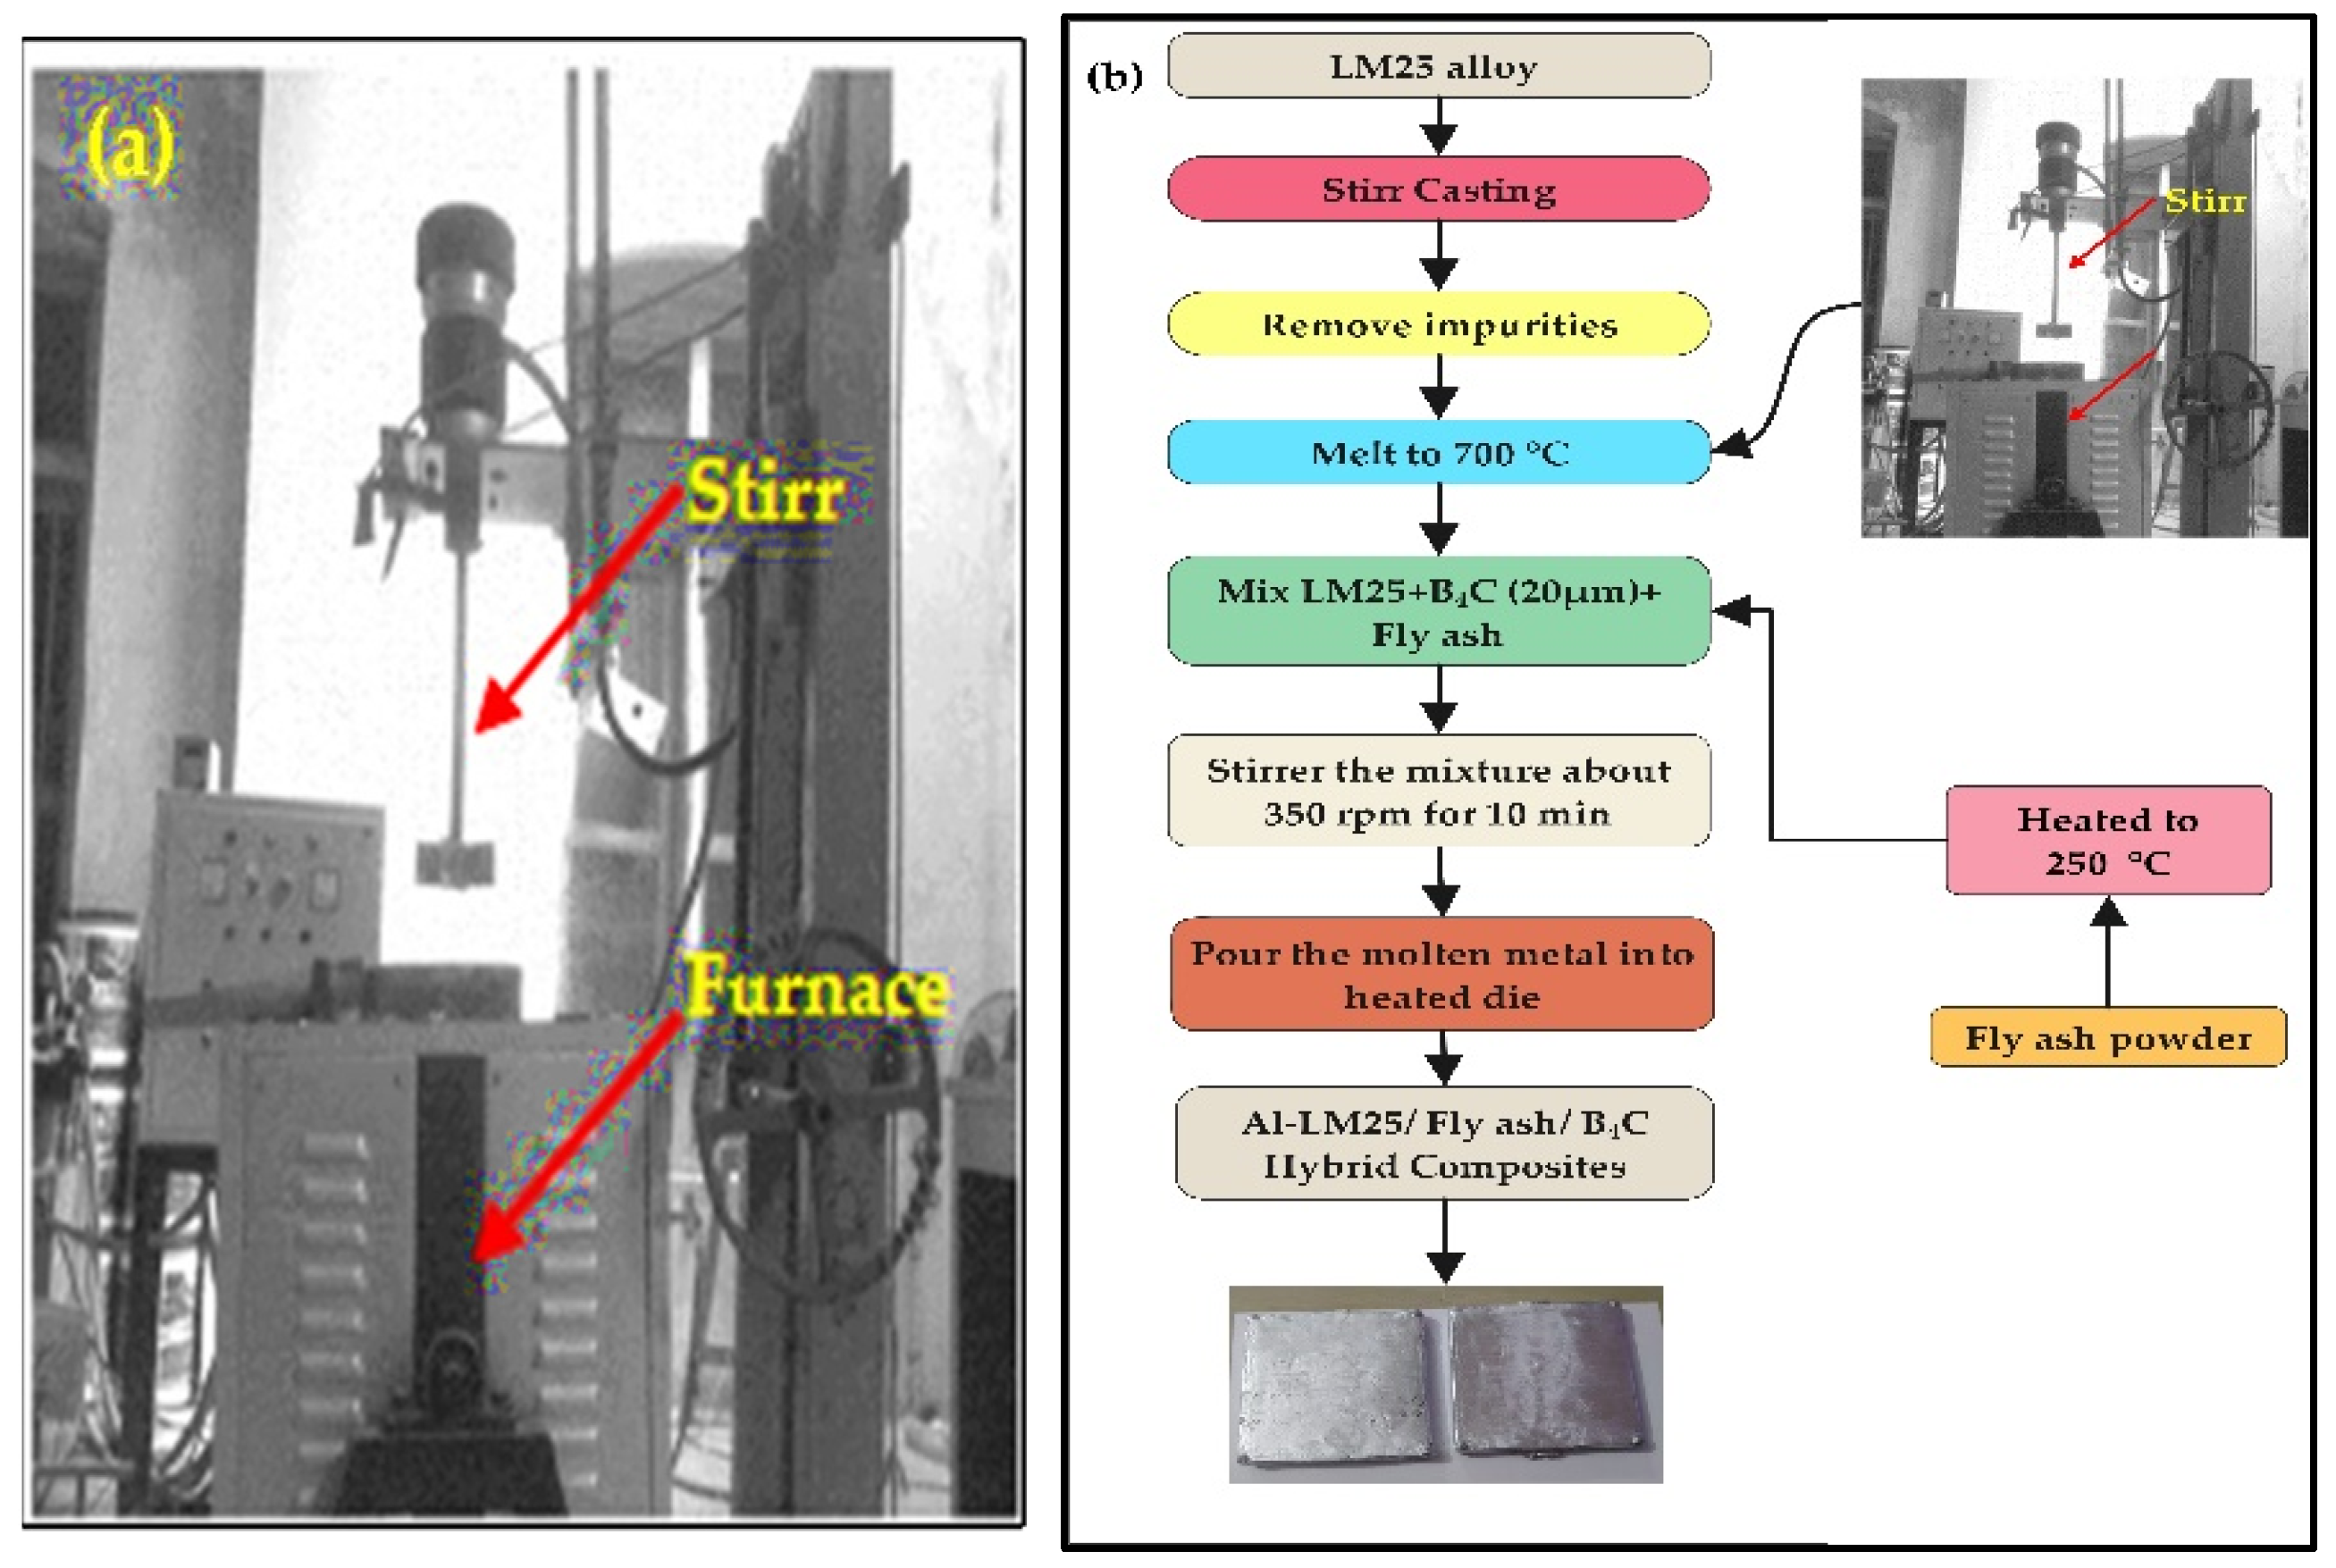
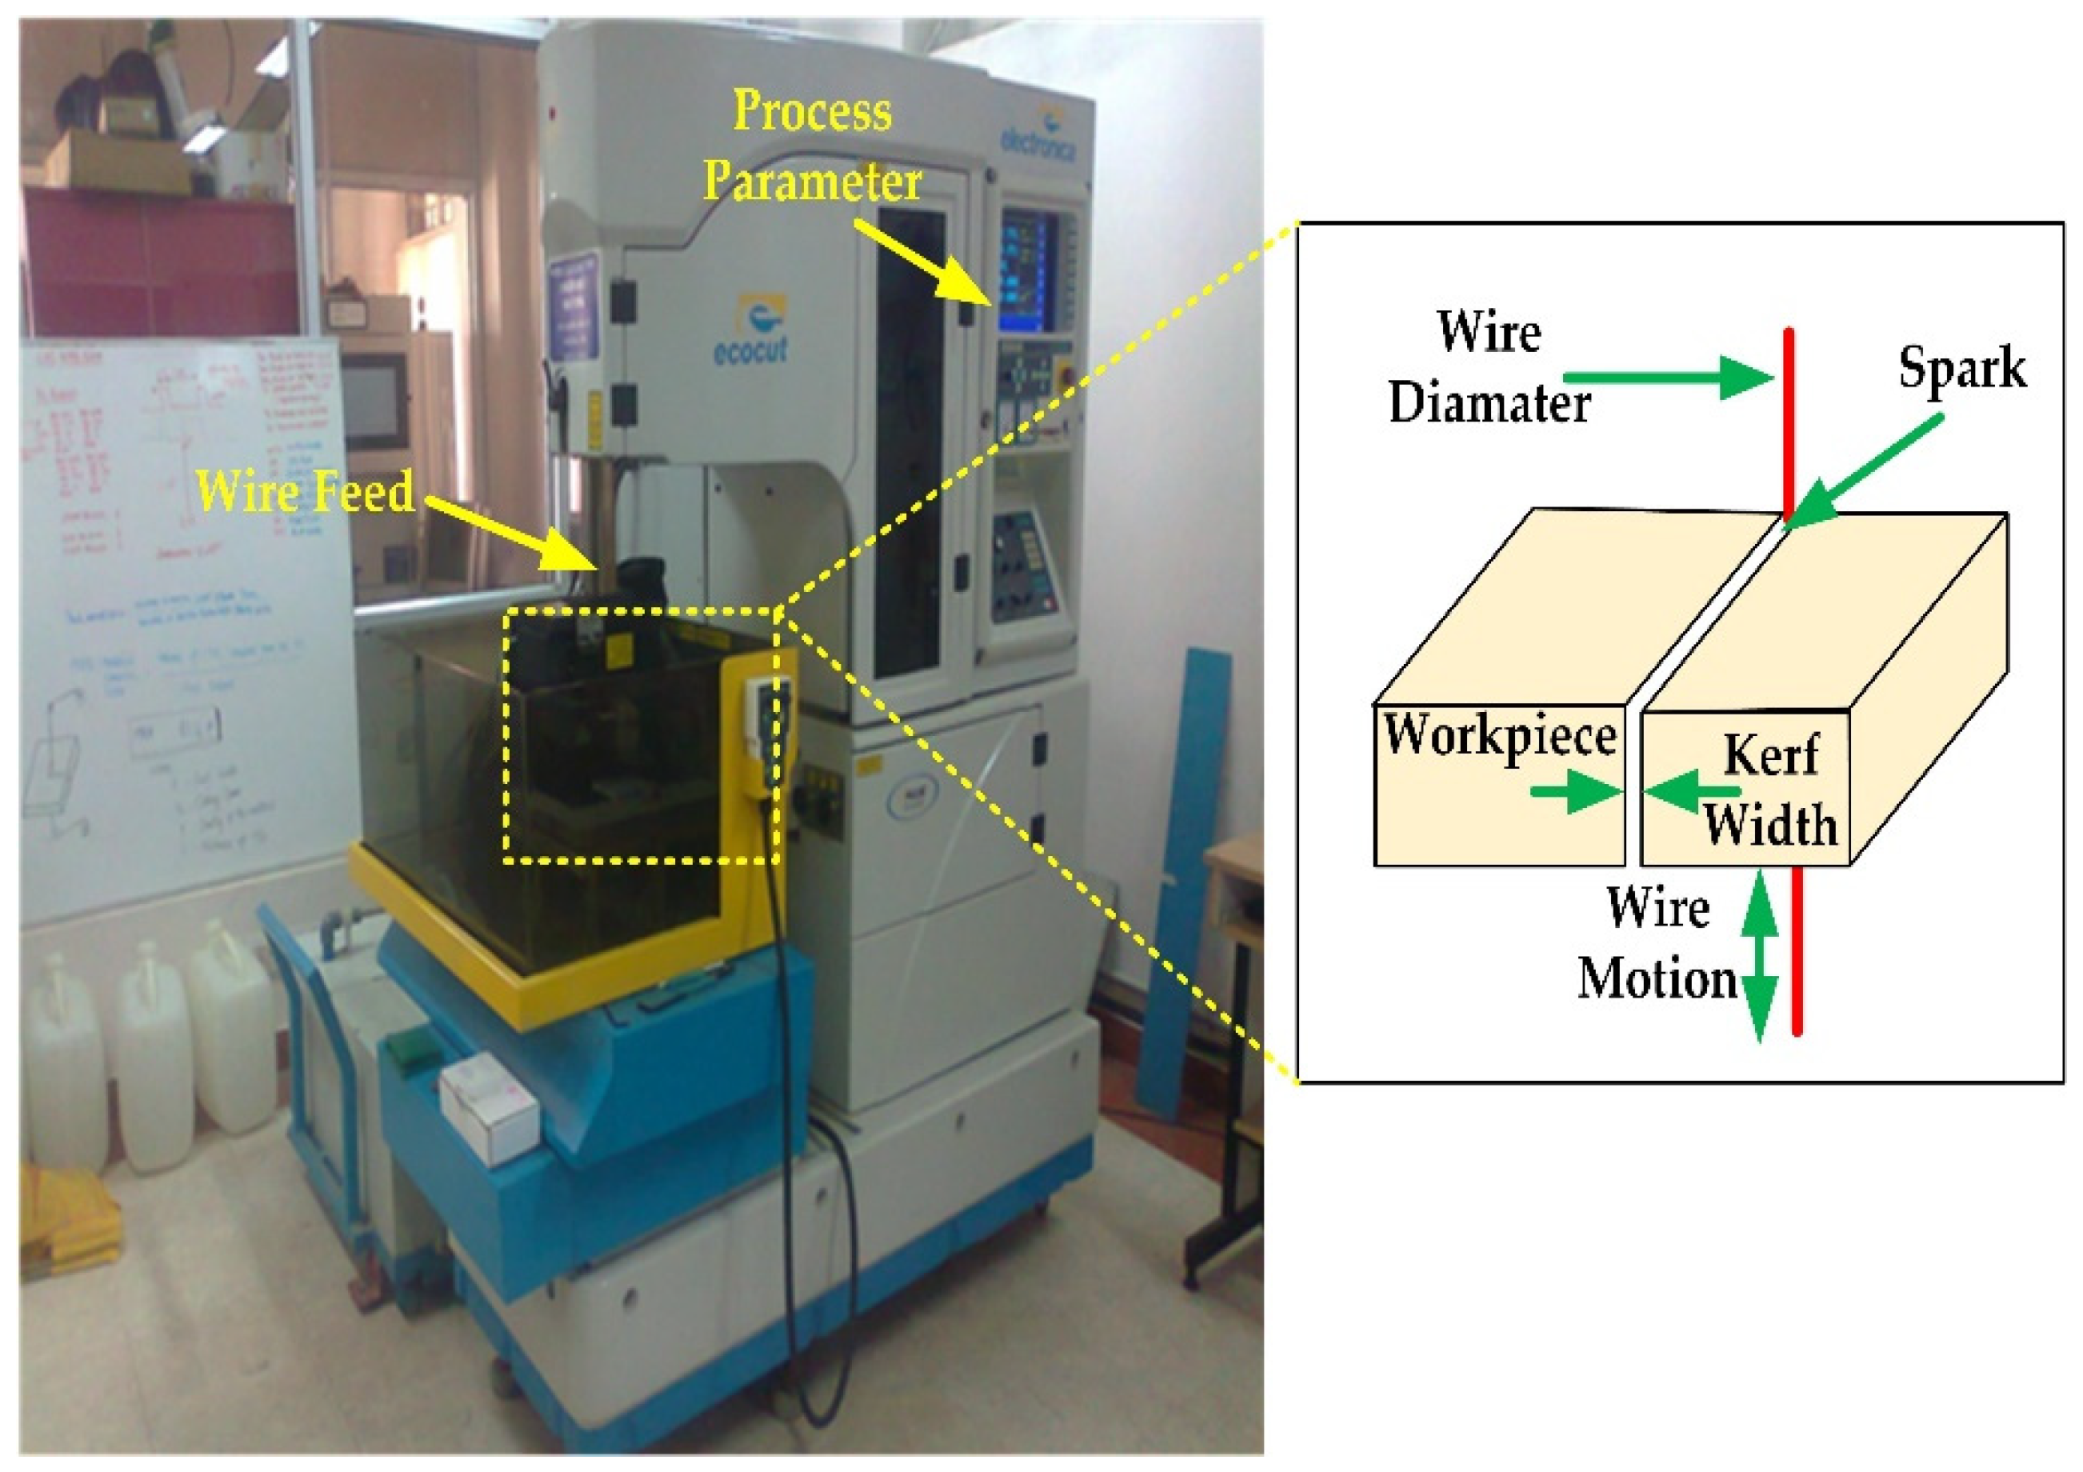
For improved machining performance, it is necessary to select the optimal values for various process parameters of EDM. Researchers have successfully implemented several mathematical approaches such as grey relational analysis, Pareto optimality, desirability function, simulated annealing, etc., [
19] for selecting the optimal parameters. The stir casting method was used to fabricate the aluminum (LM25)/fly ash/B4C hybrid composites in this work. Three different specimens were prepared by varying weight percentages of the compositions of hybrid composites. The WEDM method was used to test the machinability of the prepared specimens. The machining processes were executed based on the model by the design of experiments. However, the optimal input process parameters to simultaneously minimize the SR and maximize the VRR were identified using the Grass–Hooper optimization (GHO) algorithm, particle swarm optimization algorithm (PSO), and moth-flame optimization (MFO) algorithms. The details about the experimental work and further analysis are presented in the next section.
Author Contributions
Conceptualization, N.L.; Methodology, N.L., M.S., and D.R.; Experimental design, N.L., M.S., and D.R.; Experimental setup, N.L.; Measurements, N.L., M.S., and D.R.; Investigation, N.L., M.S., and D.R.; Resources, N.L., M.S., and D.R.; Visualization, N.L., M.S., and D.R.; Writing—Original Draft Preparation, N.L., M.S., G.S., D.R., V.S., M.K.G., T.M., and D.Y.P.; Writing—Review & Editing, N.L., M.S., G.S., D.R., V.S., M.K.G., T.M., and D.Y.P.; Supervision, N.L. and M.K.G.; Project administration, N.L. and M.K.G.; Funding acquisition, M.K.G., T.M., and D.Y.P. All authors have read and agreed to the published version of the manuscript.
Funding
This research received no external funding.
Institutional Review Board Statement
Not applicable.
Informed Consent Statement
Not applicable.
Data Availability Statement
Not applicable.
Conflicts of Interest
There are no conflicts of interest.
References
- McDanels, D.L. Analysis of stress-strain, fracture, and ductility behavior of aluminum matrix composites containing discon-tinuous silicon carbide reinforcement. Metall. Trans. A 1985, 16, 1105–1115. [Google Scholar] [CrossRef]
- Ralph, B.; Yuen, H.C.; Lee, W.B. The processing of metal matrix composites—an overview. J. Mater. Process. Technol. 1997, 63, 339–353. [Google Scholar] [CrossRef]
- Ramnath, B.V.; Elanchezhian, C.; Annamalai, R.M.; Aravind, S.; Atreya, T.S.; Vignesh, V.; Subramanian, C. Aluminium metal matrix composites–a review. Rev. Adv. Mater. Sci. 2014, 38, 55–60. [Google Scholar]
- Prakash, J.; Moorthy, T.; Peter, J.M. Experimental Investigations on Machinability of Aluminium Alloy (A413)/Flyash/B4C Hybrid Composites Using Wire EDM. Procedia Eng. 2013, 64, 1344–1353. [Google Scholar] [CrossRef] [Green Version]
- Kuş, A.; Motorcu, A.R.; Ekici, E. Wire Electrical Discharge Machining of a Hybrid Composite: Evaluation of Kerf Width and Surface Roughness. Univ. J. Fac. Eng. 2016, 21, 245. [Google Scholar] [CrossRef]
- Vetrivel, K.P.; Subramanian, R.; Vinoth, K.S. An Analysis on Process Control of Machining in Electrical Discharge Machine by Hybrid Composites using DoE. Int. J. Control Theory Appl. 2016, 9, 2611–2619. [Google Scholar]
- Chou, Y.K.; Liu, J. CVD diamond tool performance in metal matrix composite machining. Surf. Coat. Technol. 2005, 200, 1872–1878. [Google Scholar] [CrossRef]
- Iwai, Y.; Honda, T.; Miyajima, T.; Iwasaki, Y.; Surappa, M.; Xu, J. Dry sliding wear behavior of Al2O3 fiber reinforced aluminum composites. Compos. Sci. Technol. 2000, 60, 1781–1789. [Google Scholar] [CrossRef]
- Hu, H.; Lavernia, E.; Harrigan, W.; Kajuch, J.; Nutt, S. Microstructural investigation on B4C/Al-7093 composite. Mater. Sci. Eng. A 2001, 297, 94–104. [Google Scholar] [CrossRef]
- Ciftci, I.; Turker, M.; Seker, U. Evaluation of tool wear when machining SiCp-reinforced Al-2014 alloy matrix composites. Mater. Design 2004, 25, 251–255. [Google Scholar] [CrossRef]
- Puhan, D.; Mahapatra, S.S.; Sahu, J.; Das, L. A hybrid approach for multi-response optimization of non-conventional ma-chining on AlSiCp MMC. Measurement 2013, 46, 3581–3592. [Google Scholar] [CrossRef]
- Lau, W.; Yue, T.M.; Lee, T.; Lee, W.B. Un-conventional machining of composite materials. J. Mater. Process. Technol. 1995, 48, 199–205. [Google Scholar] [CrossRef]
- Garg, R.K.; Singh, K.K.; Sachdeva, A.; Sharma, V.S.; Ojha, K.; Singh, S. Review of research work in sinking EDM and WEDM on metal matrix composite materials. Int. J. Adv. Manuf. Technol. 2010, 50, 611–624. [Google Scholar] [CrossRef]
- Singh, H.; Garg, R. Effects of process parameters on material removal rate in WEDM. J. Achiev. Mater. Manuf. Eng. 2009, 32, 70–74. [Google Scholar]
- Lahane, S.D.; Rodge, M.K.; Sharma, S.B. Multi-response optimization of Wire-EDM process using principal component anal-ysis. J. Eng. 2012, 2, 38–47. [Google Scholar]
- Chandrashekarappa, M.P.G.; Kumar, S.; Jagadish, J.; Pimenov, D.; Giasin, K. Experimental Analysis and Optimization of EDM Parameters on HcHcr Steel in Context with Different Electrodes and Dielectric Fluids Using Hybrid Taguchi-Based PCA-Utility and CRITIC-Utility Approaches. Metals 2021, 11, 419. [Google Scholar] [CrossRef]
- Prakash, C.; Singh, S.; Pruncu, C.I.; Mishra, V.; Królczyk, G.; Pimenov, D.Y.; Pramanik, A. Surface Modification of Ti-6Al-4V Alloy by Electrical Discharge Coating Process Using Partially Sintered Ti-Nb Electrode. Materials 2019, 12, 1006. [Google Scholar] [CrossRef] [Green Version]
- Aggarwal, V.; Pruncu, C.I.; Singh, J.; Sharma, S.; Pimenov, D.Y. Empirical Investigations during WEDM of Ni-27Cu-3.15Al-2Fe-1.5Mn Based Superalloy for High Temperature Corrosion Resistance Applications. Materials 2020, 13, 3470. [Google Scholar] [CrossRef]
- Sen, B.; Hussain, S.A.I.; Das Gupta, A.; Gupta, M.K.; Pimenov, D.Y.; Mikołajczyk, T. Application of Type-2 Fuzzy AHP-ARAS for Selecting Optimal WEDM Parameters. Metals 2020, 11, 42. [Google Scholar] [CrossRef]
- Mirjalili, S.Z.; Mirjalili, S.; Saremi, S.; Faris, H.; Aljarah, I. Grasshopper optimization algorithm for multi-objective optimization problems. Appl. Intell. 2018, 48, 805–820. [Google Scholar] [CrossRef]
- Saremi, S.; Mirjalili, S.; Lewis, A. Grasshopper Optimisation Algorithm: Theory and application. Adv. Eng. Softw. 2017, 105, 30–47. [Google Scholar] [CrossRef] [Green Version]
- Lmalghan, R.; Rao, K.M.C.; Arunkumar, S.; Shrikantha, S.R.; Herbert, M.A. Machining Parameters Optimization of AA6061 Using Response Surface Methodology and Particle Swarm Optimization. Int. J. Precis. Eng. Manuf. 2018, 19, 695–704. [Google Scholar] [CrossRef]
- Mirjalili, S. Moth-flame optimization algorithm: A novel nature-inspired heuristic paradigm. Knowl. Based Syst. 2015, 89, 228–249. [Google Scholar] [CrossRef]
- Khalilpourazari, S.; Naderi, B.; Khalilpourazary, S. Multi-objective stochastic fractal search: A powerful algorithm for solving complex multi-objective optimization problems. Soft Comput. 2020, 24, 3037–3066. [Google Scholar] [CrossRef]
- Alduroobi, A.A.A.; Ubaid, A.M.; Tawfiq, M.A.; Elias, R.R. Wire EDM process optimization for machining AISI 1045 steel by use of Taguchi method, artificial neural network and analysis of variances. Int. J. Syst. Assur. Eng. Manag. 2020, 11, 1314–1338. [Google Scholar] [CrossRef]
- Gopalakannan, S.; Senthilvelan, T. Application of response surface method on machining of Al–SiC nanocomposites. Meas-urement 2013, 46, 2705–2715. [Google Scholar] [CrossRef]
- Modi, M.; Agarwal, G. Effect of aluminium and chromium powder mixed dielectric fluid on electrical discharge machining effectiveness. Adv. Prod. Eng. Manag. 2019, 14, 323–332. [Google Scholar] [CrossRef] [Green Version]
- Gaikwad, M.U.; Jatti, V.S. Investigation and Optimization of Process Parameters in Electrical Discharge Machining (EDM) Process for NiTi 60. Mater. Res. Express 2019, 6, 065707. [Google Scholar] [CrossRef]
- Świercz, R.; Oniszczuk-Świercz, D.; Chmielewski, T. Multi-Response Optimization of Electrical Discharge Machining Using the Desirability Function. Micromachines 2019, 10, 72. [Google Scholar] [CrossRef] [PubMed] [Green Version]
- VinothKumar, S.; Pradeep Kumar, M. Machining process parameter and surface integrity in conventional EDM and cryogenic EDM of Al-SiCp MMC. J. Manuf. Process. 2015, 20, 70–78. [Google Scholar] [CrossRef]
- VinothKumar, S.; Pradeep Kumar, M. Experimental investigation of the process parameter on AISI D2 tool steel under cryogenic cooling electrode in EDM process. J. Mech. Sci. Technol. 2015, 29, 3865–3871. [Google Scholar]
- VinothKumar, S.; Pradeep Kumar, M. Optimization of cryogenic cooled EDM machining process parameters using grey rela-tional analysis. J. Mech. Sci. Technol. 2014, 28, 3777–3784. [Google Scholar]
Figure 1.
(a) Stir casting process setup. (b) Flow chart of Al-LM25/fly ash/B4C hybrid composites.
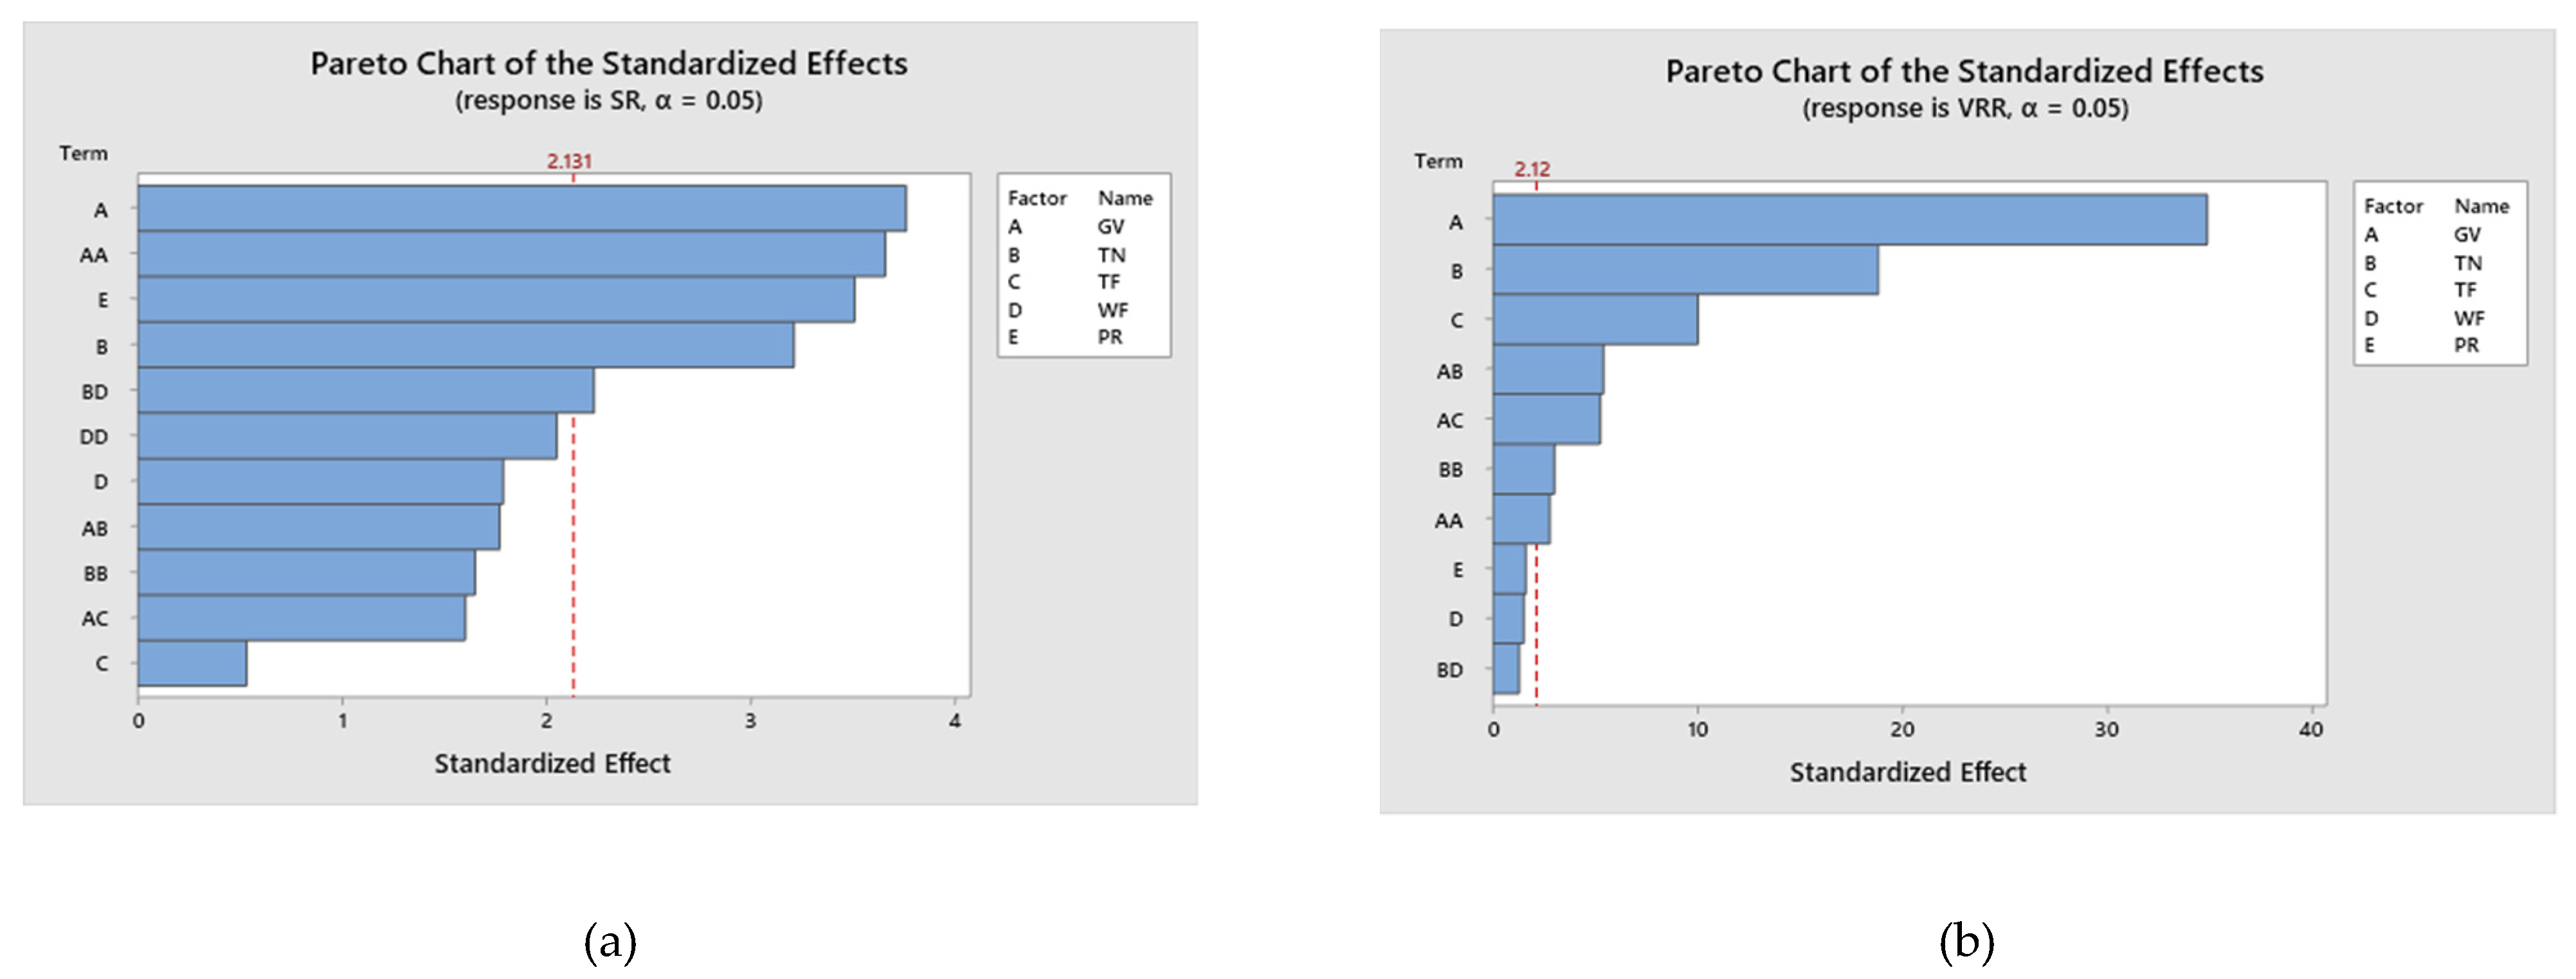
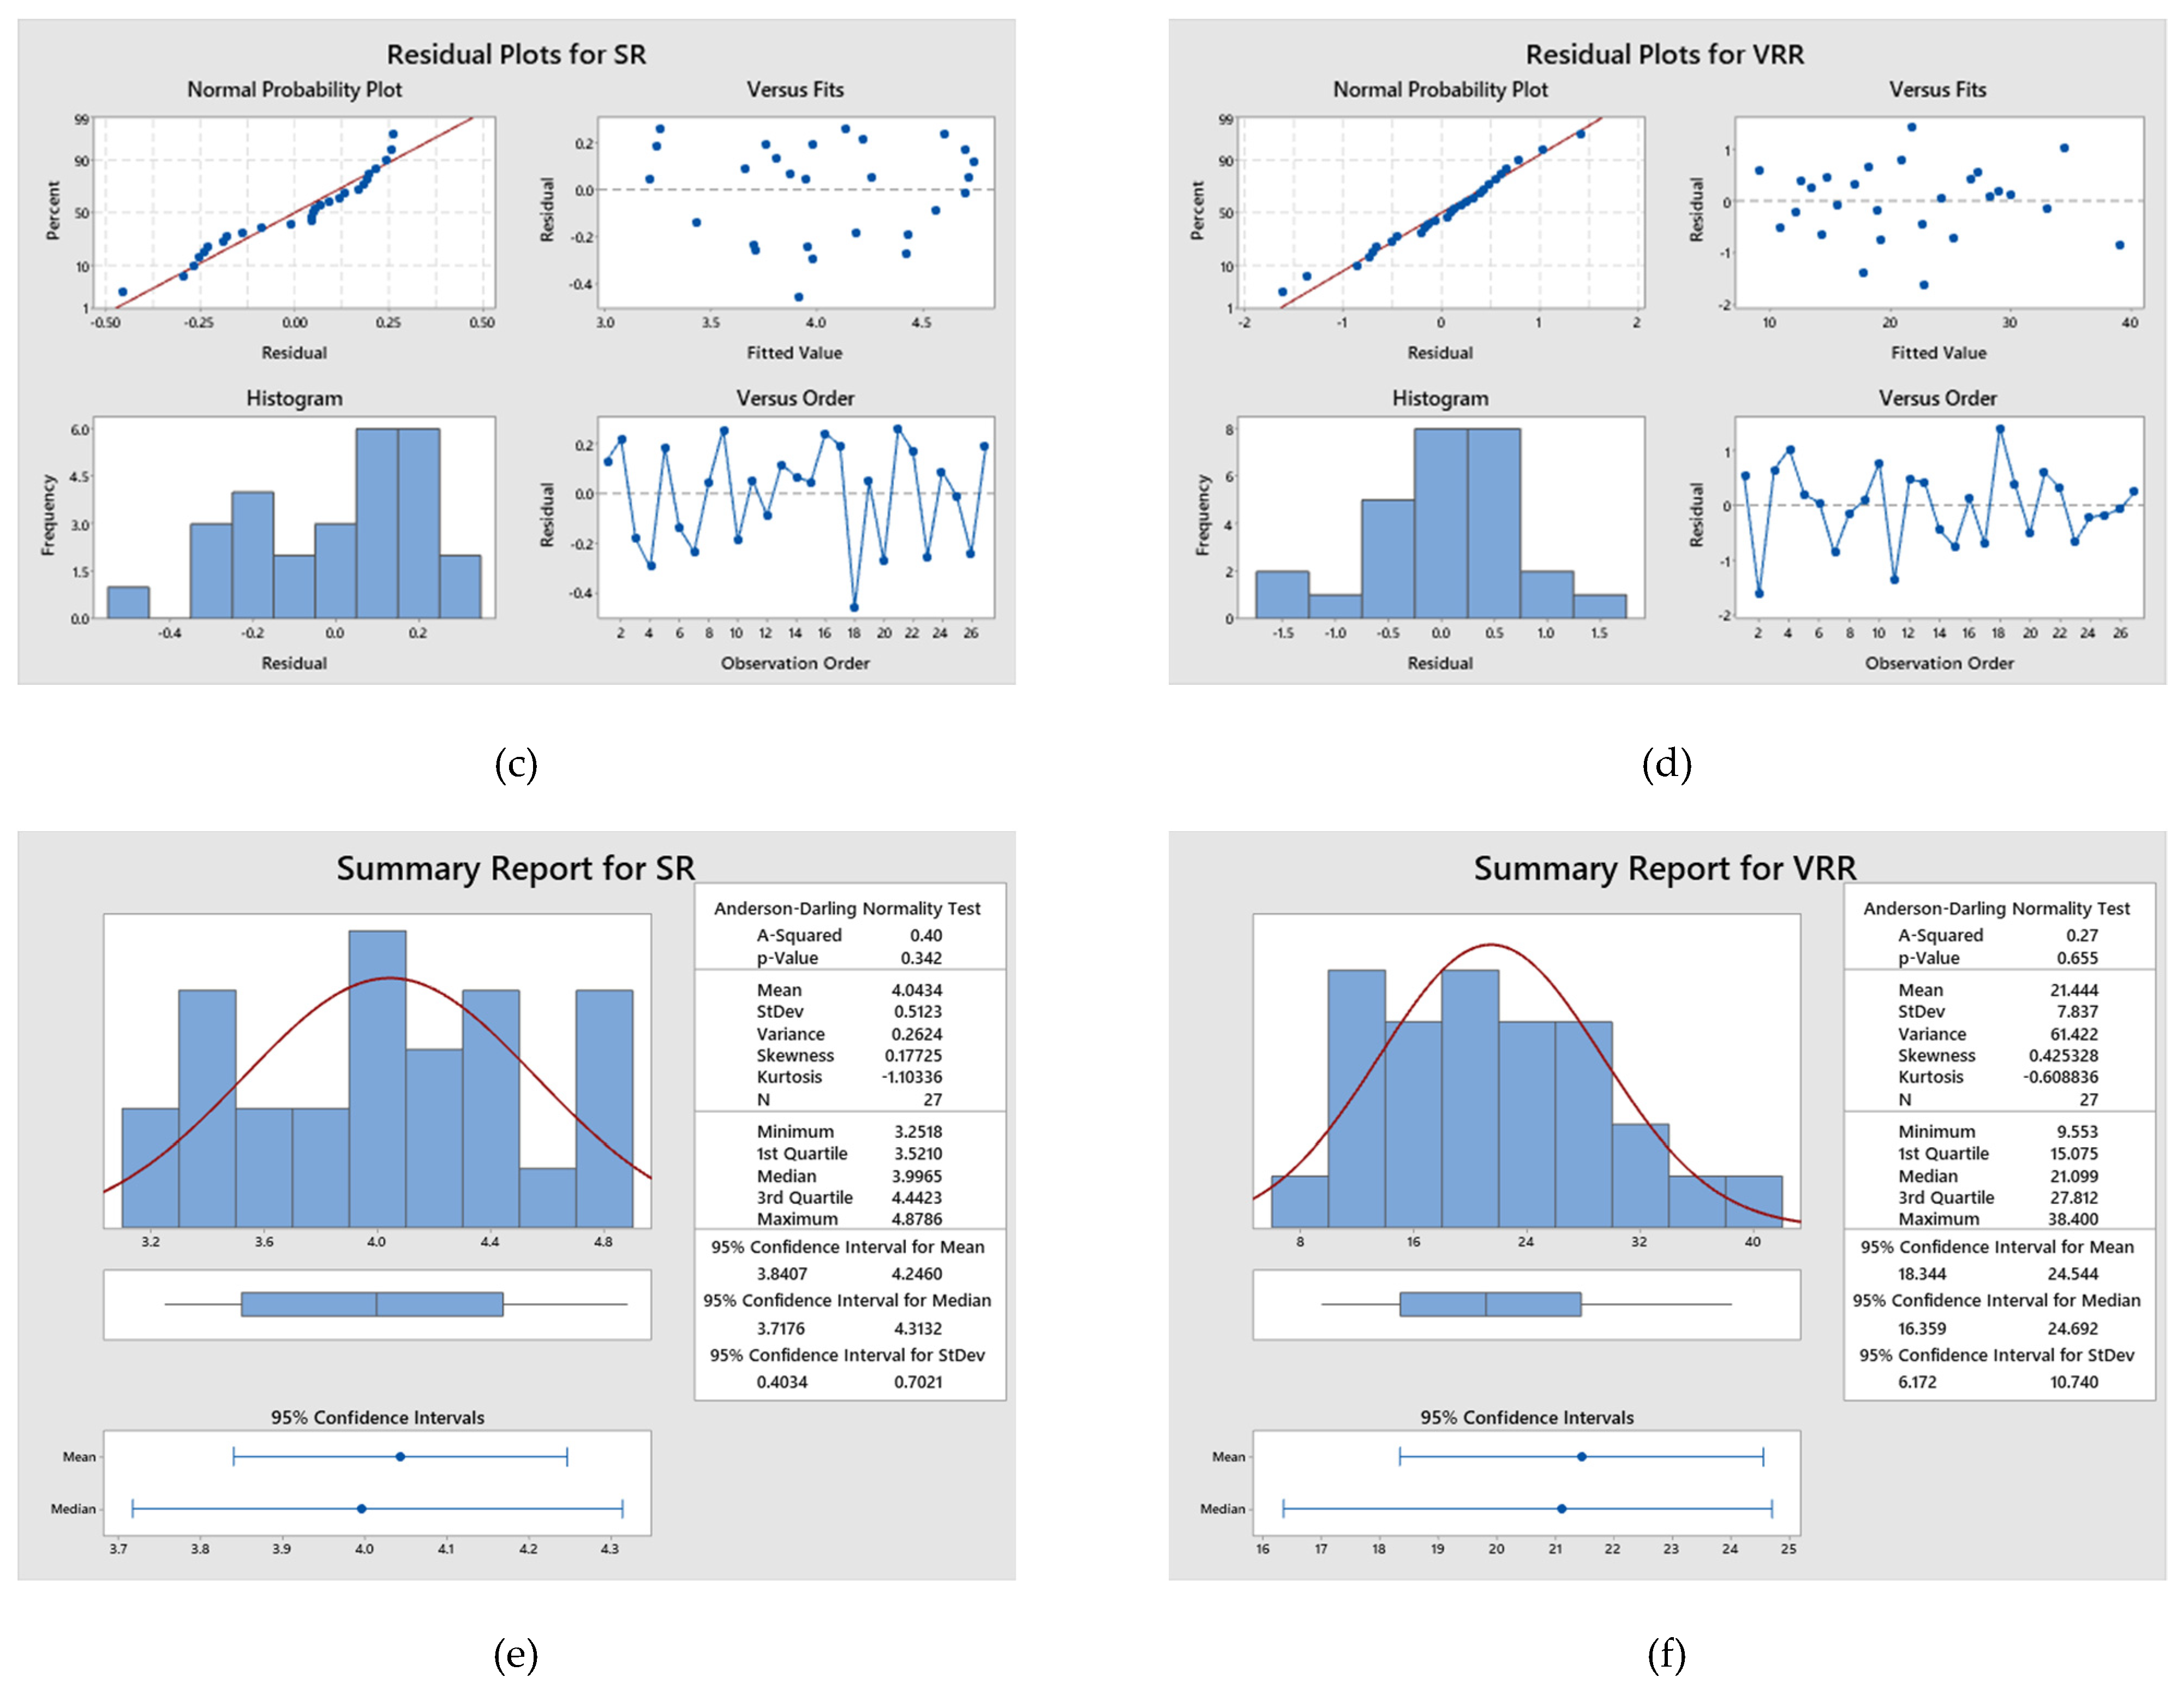
Figure 3.
(a–f) Statistical analyses of SR and VRR.
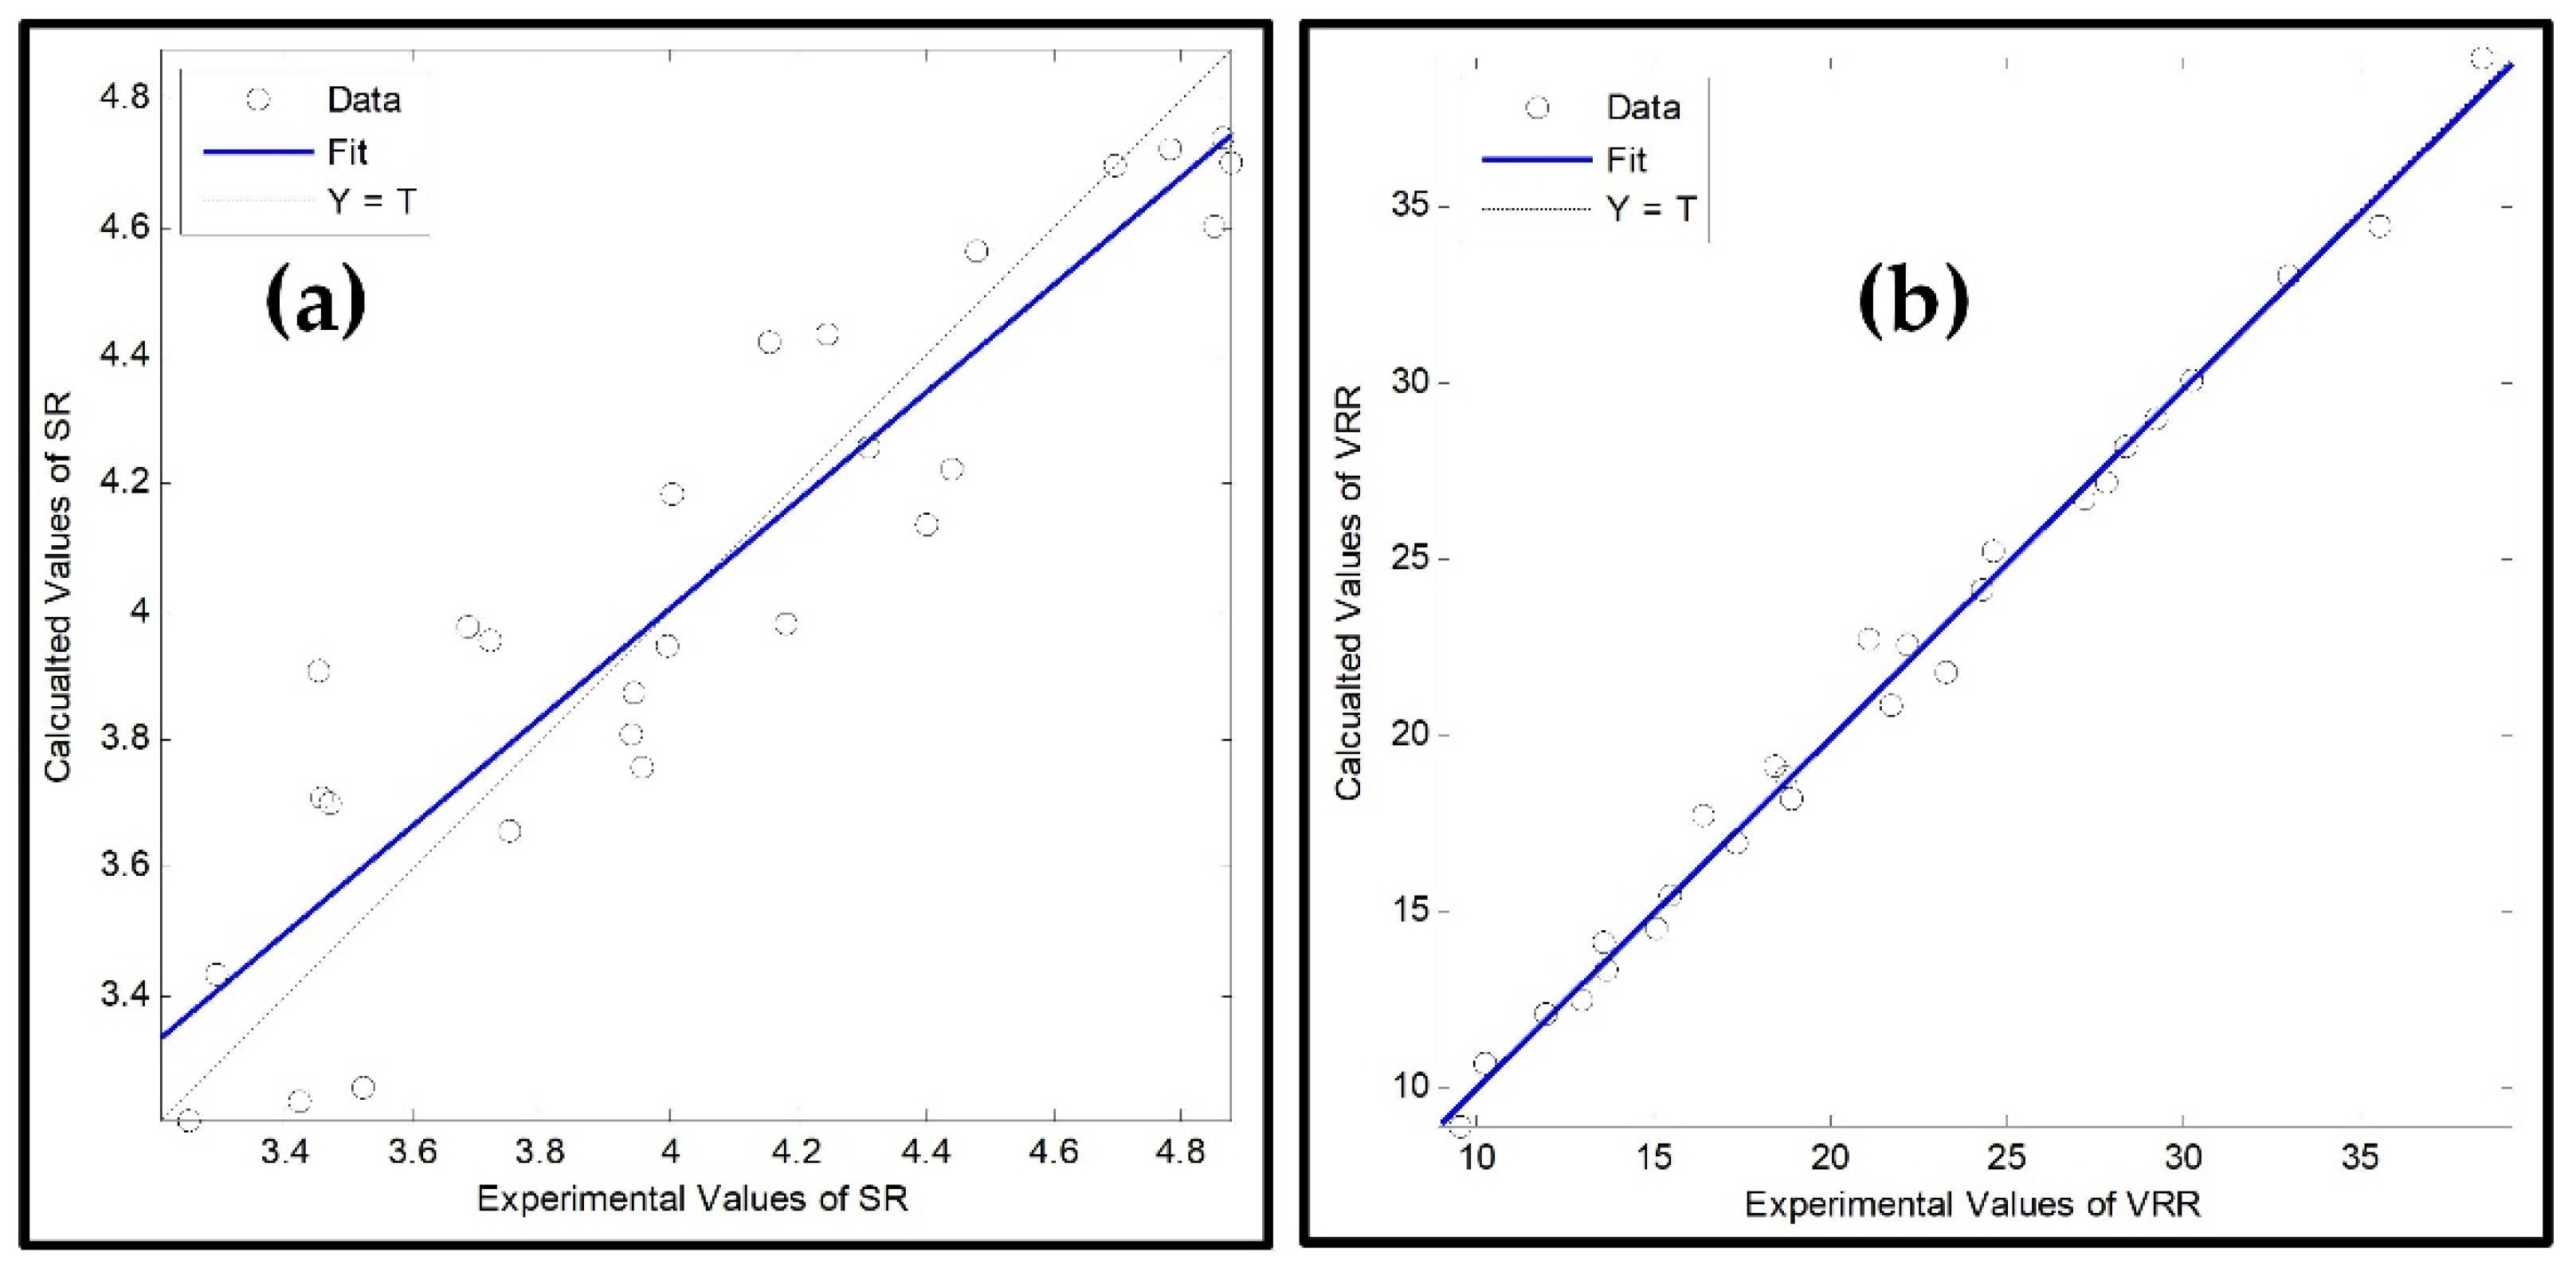
Figure 4.
Experimental vs calculated values of (a) SR and (b) VRR using MLRM.
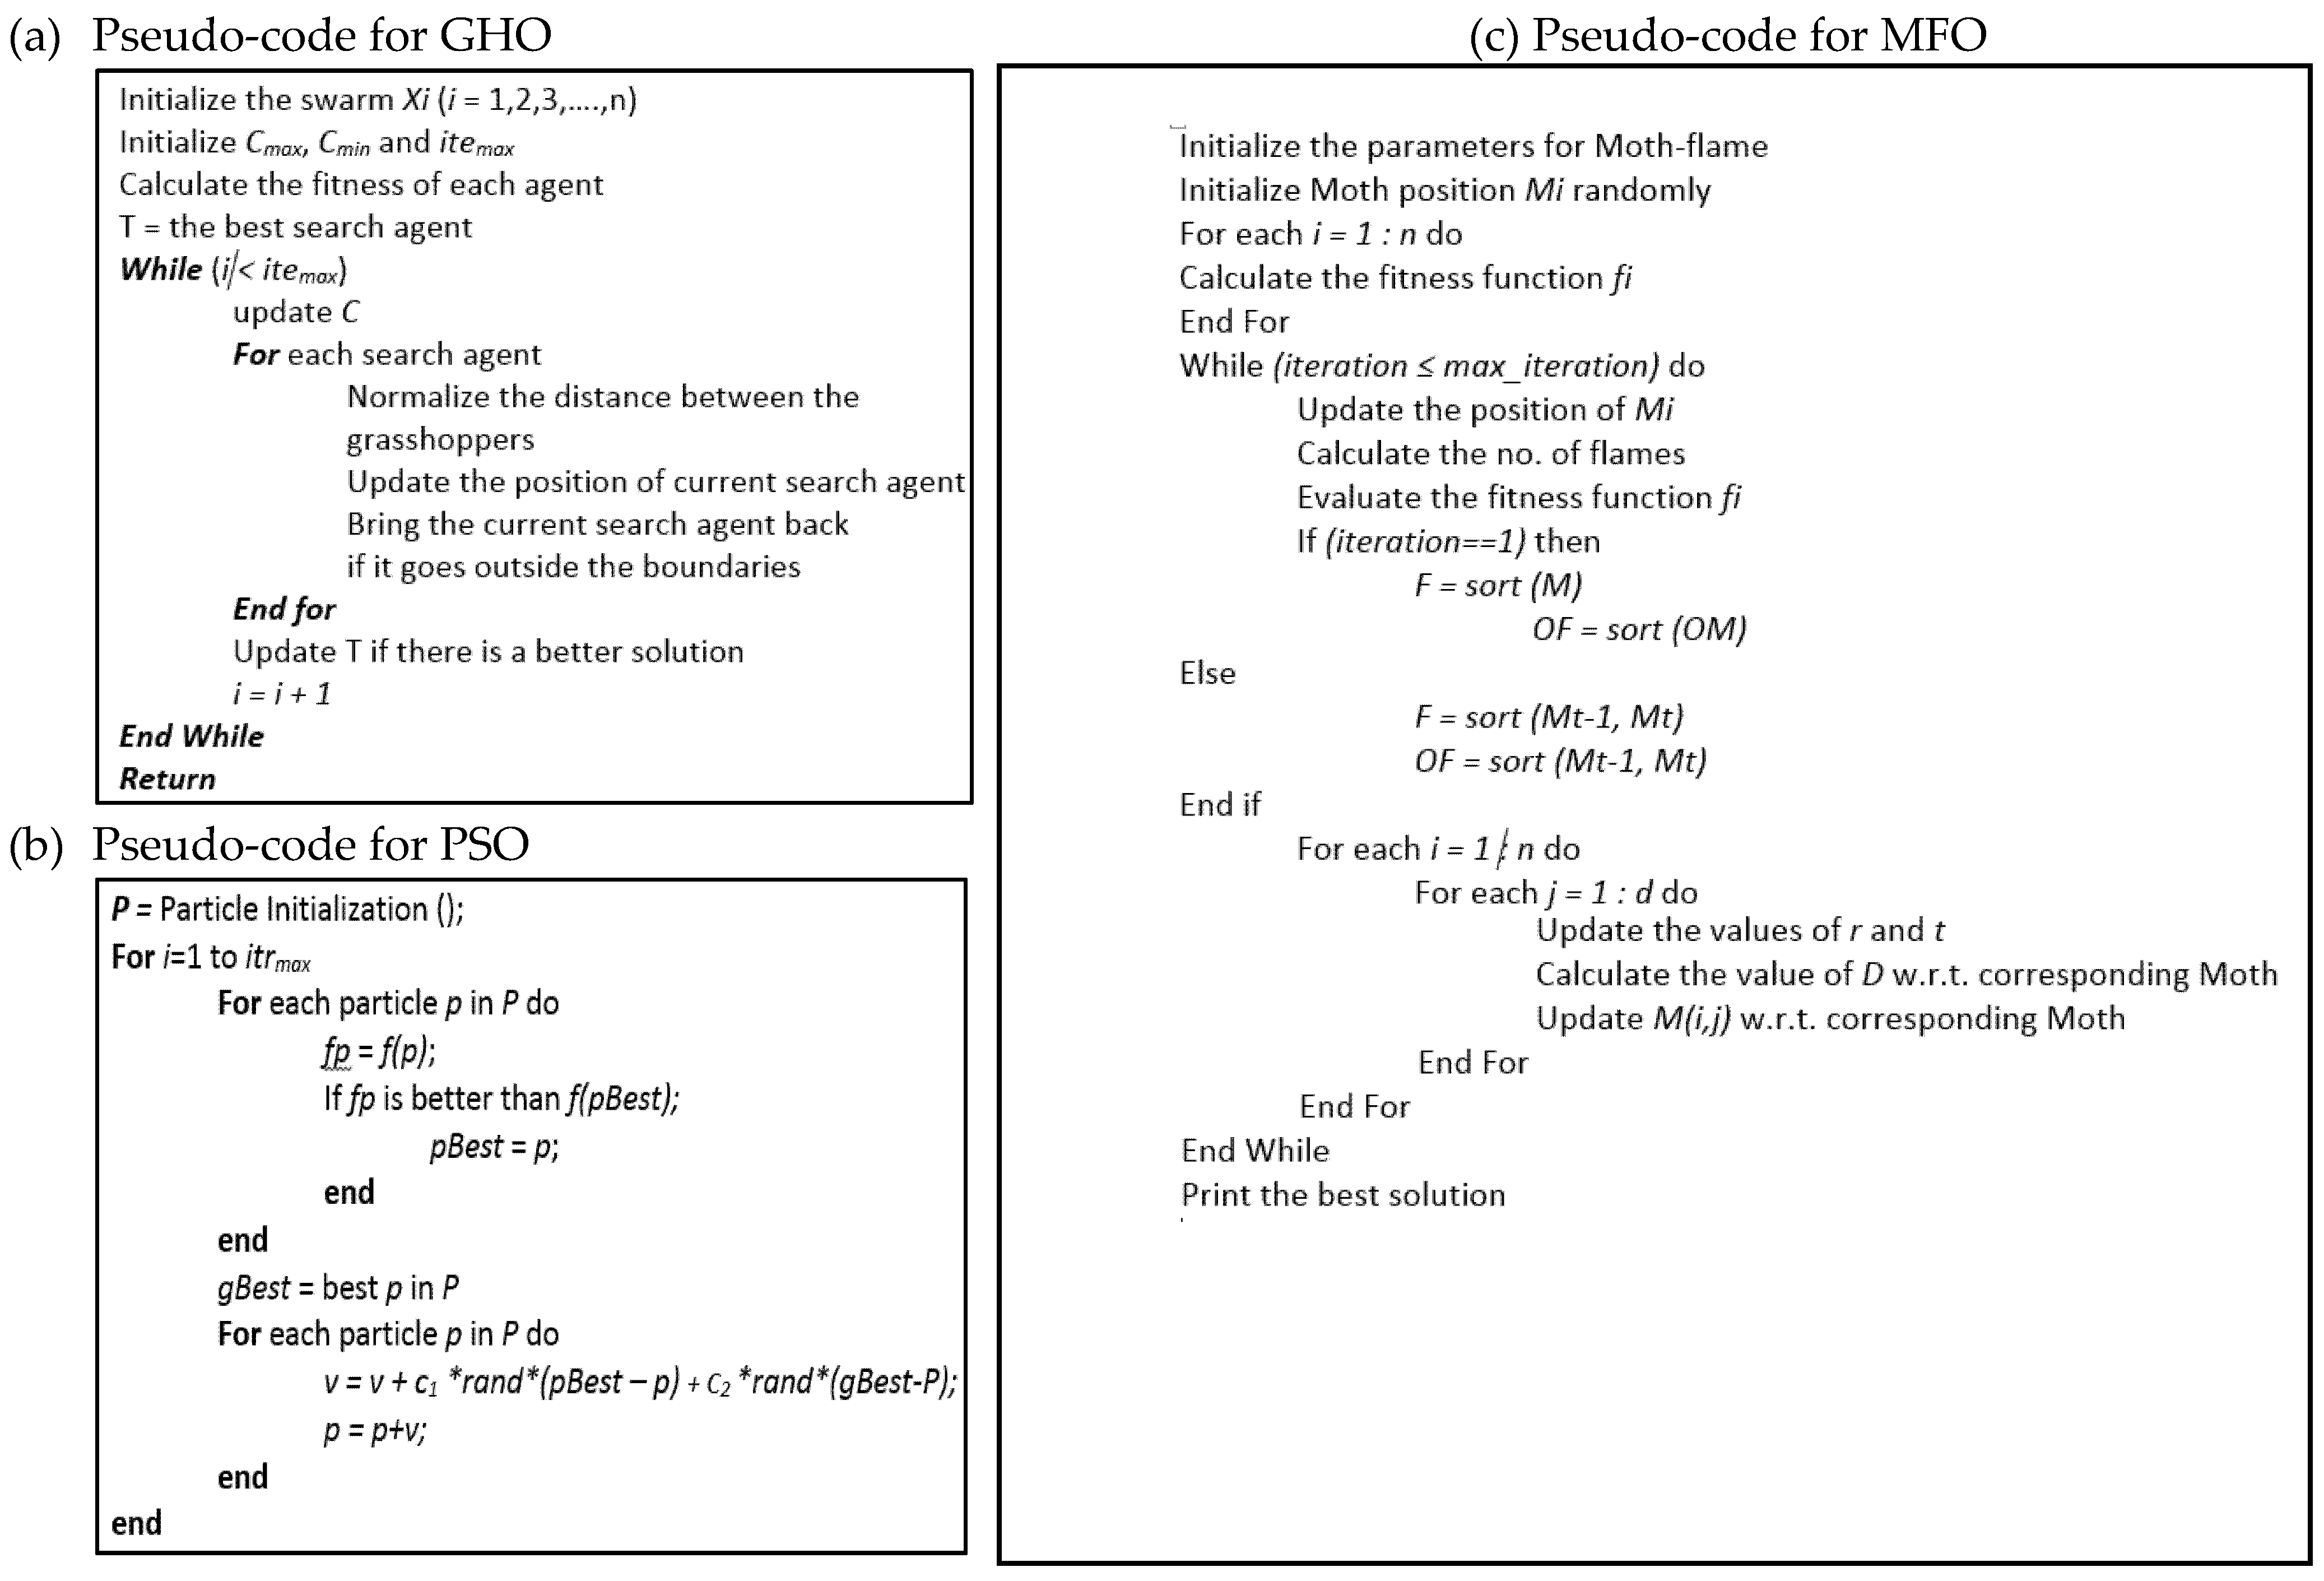
Figure 5.
Pseudo-code (a) GHO, (b) PSO, (c) MFO.
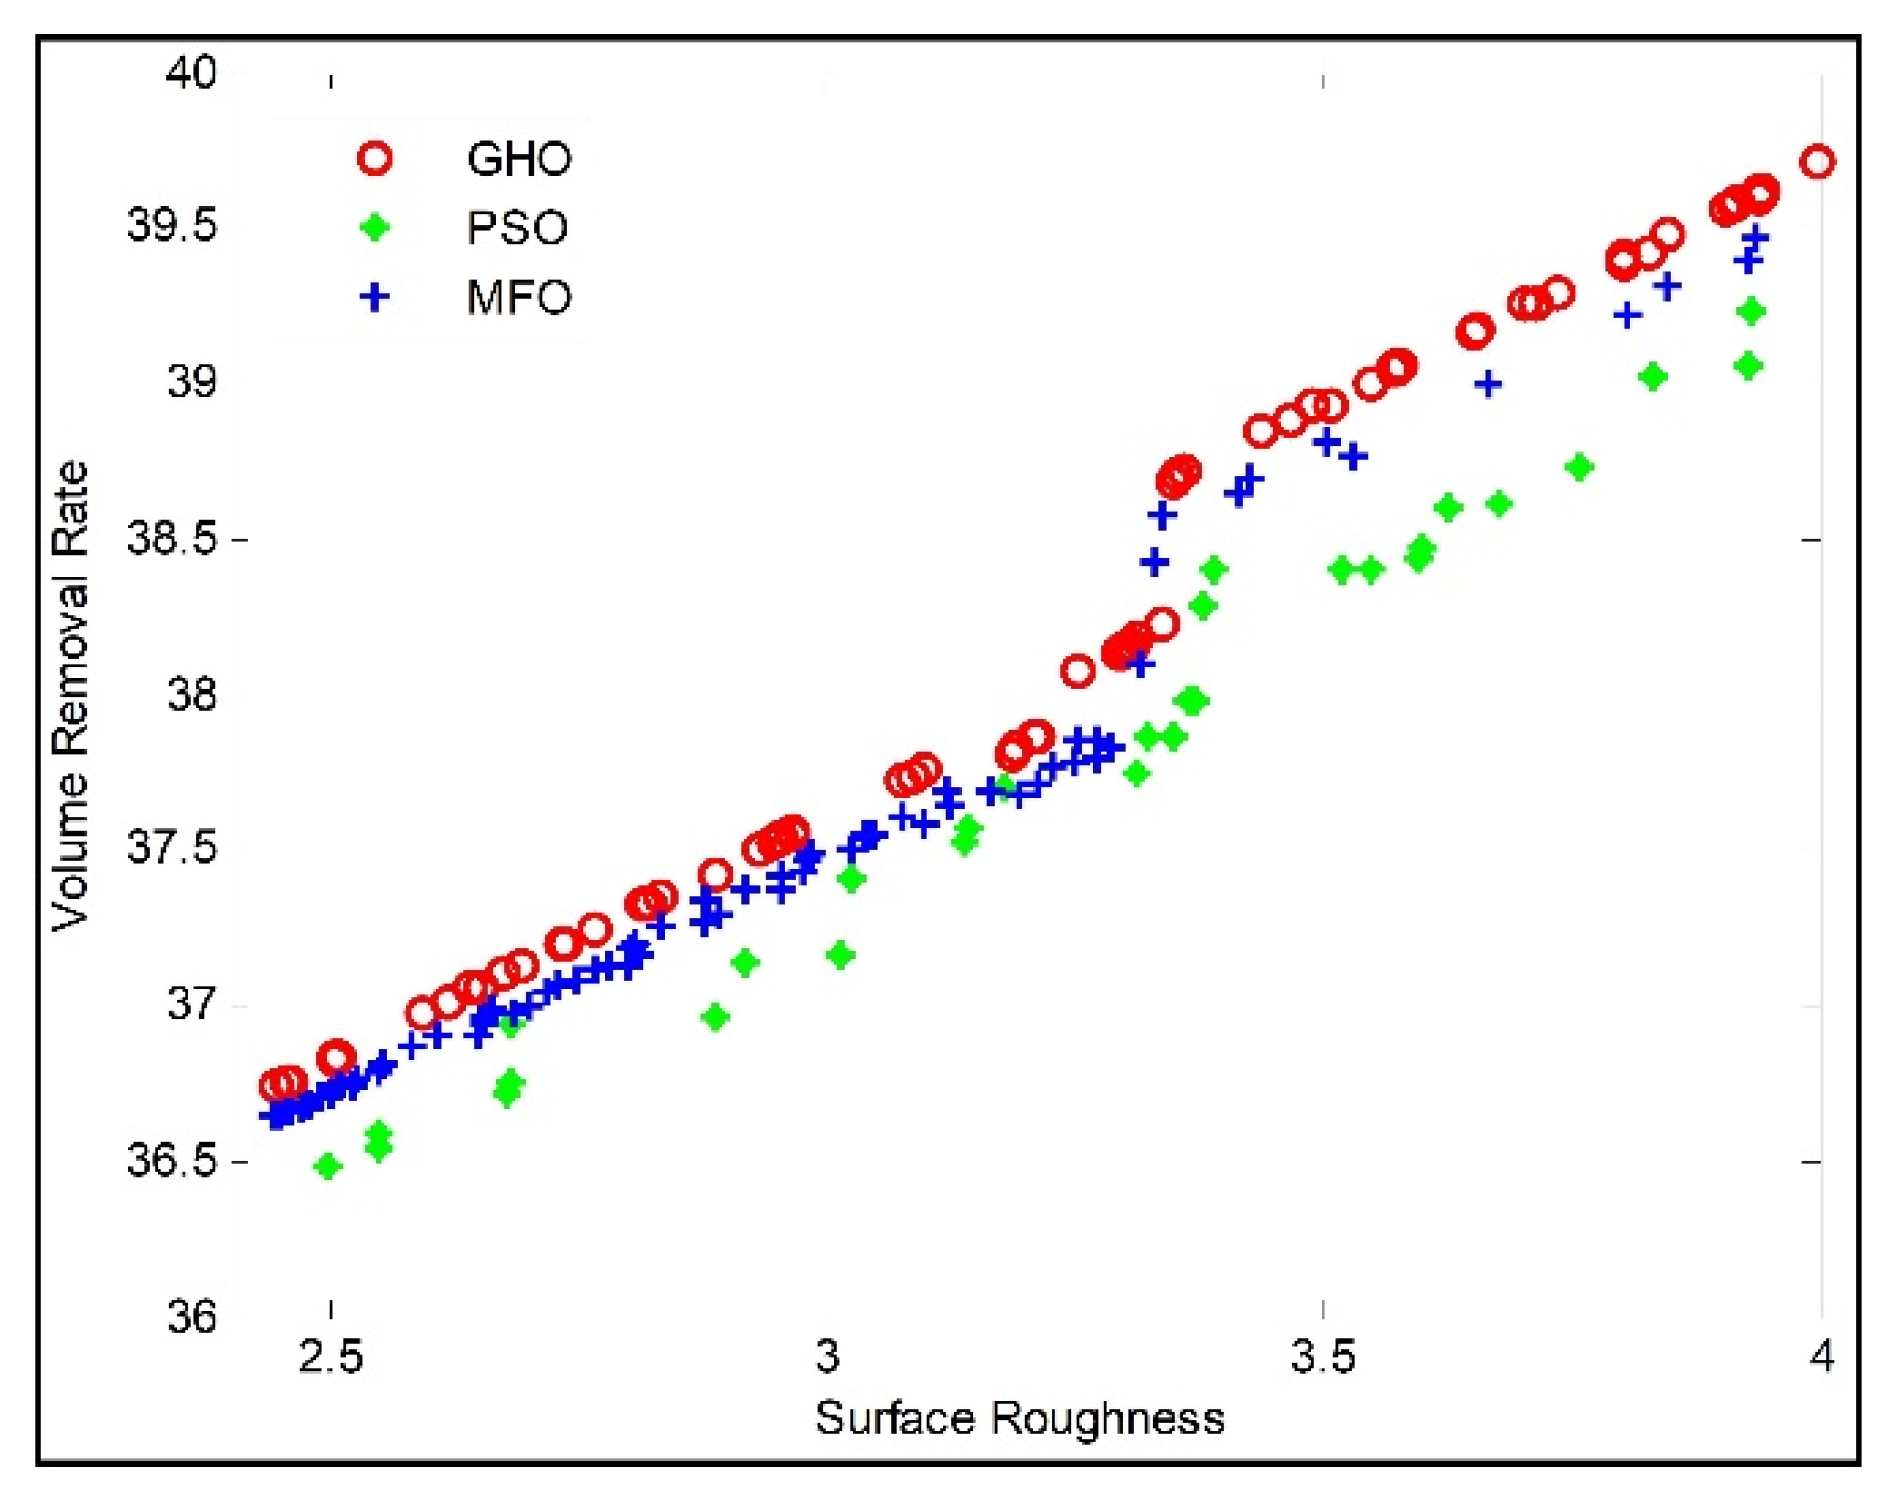
Figure 6.
Pareto front diagram for SR vs. VRR.
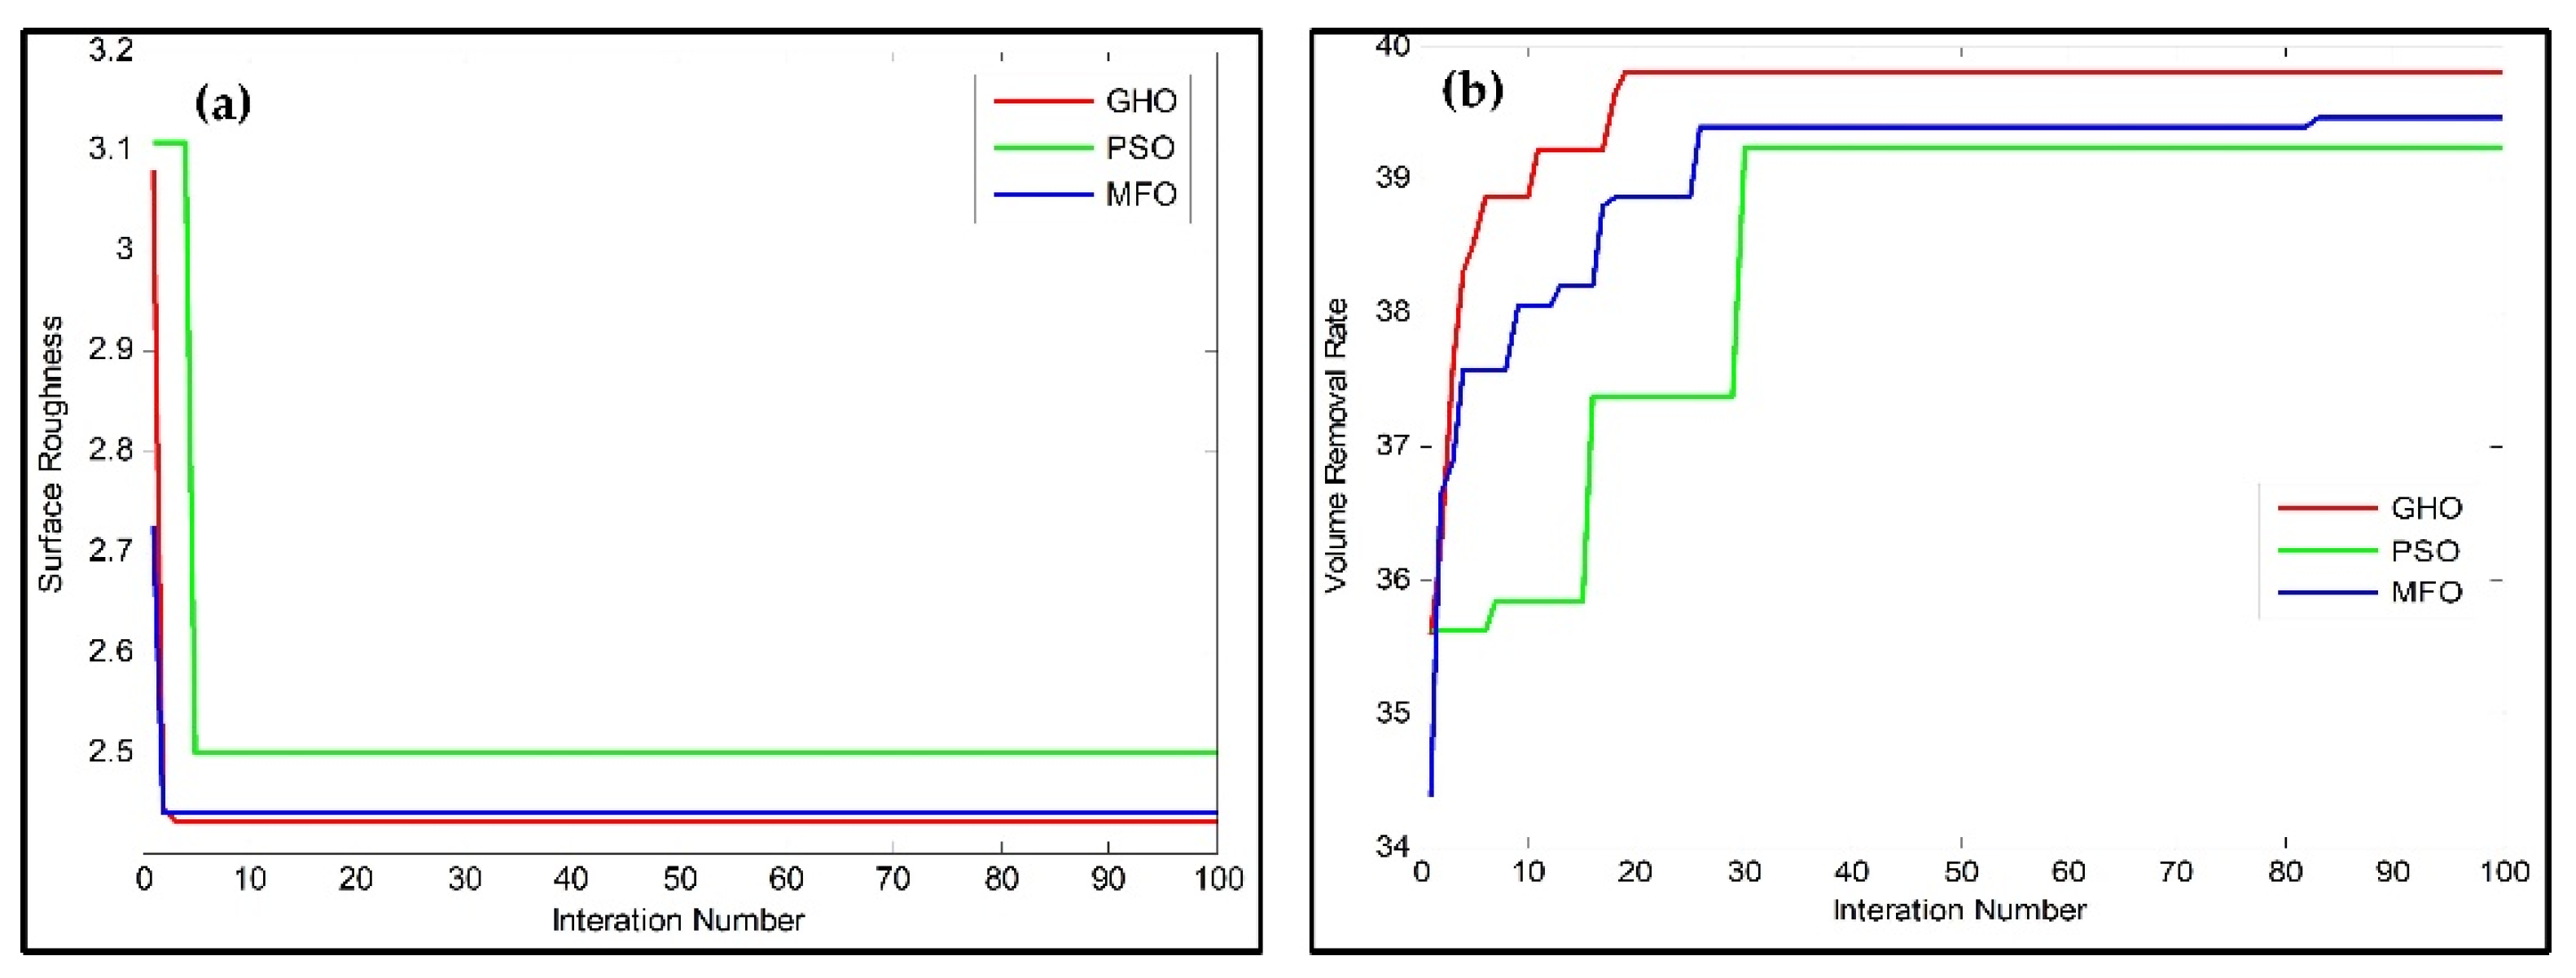
Figure 7.
Convergence plot for (a) SR and (b) VRR.
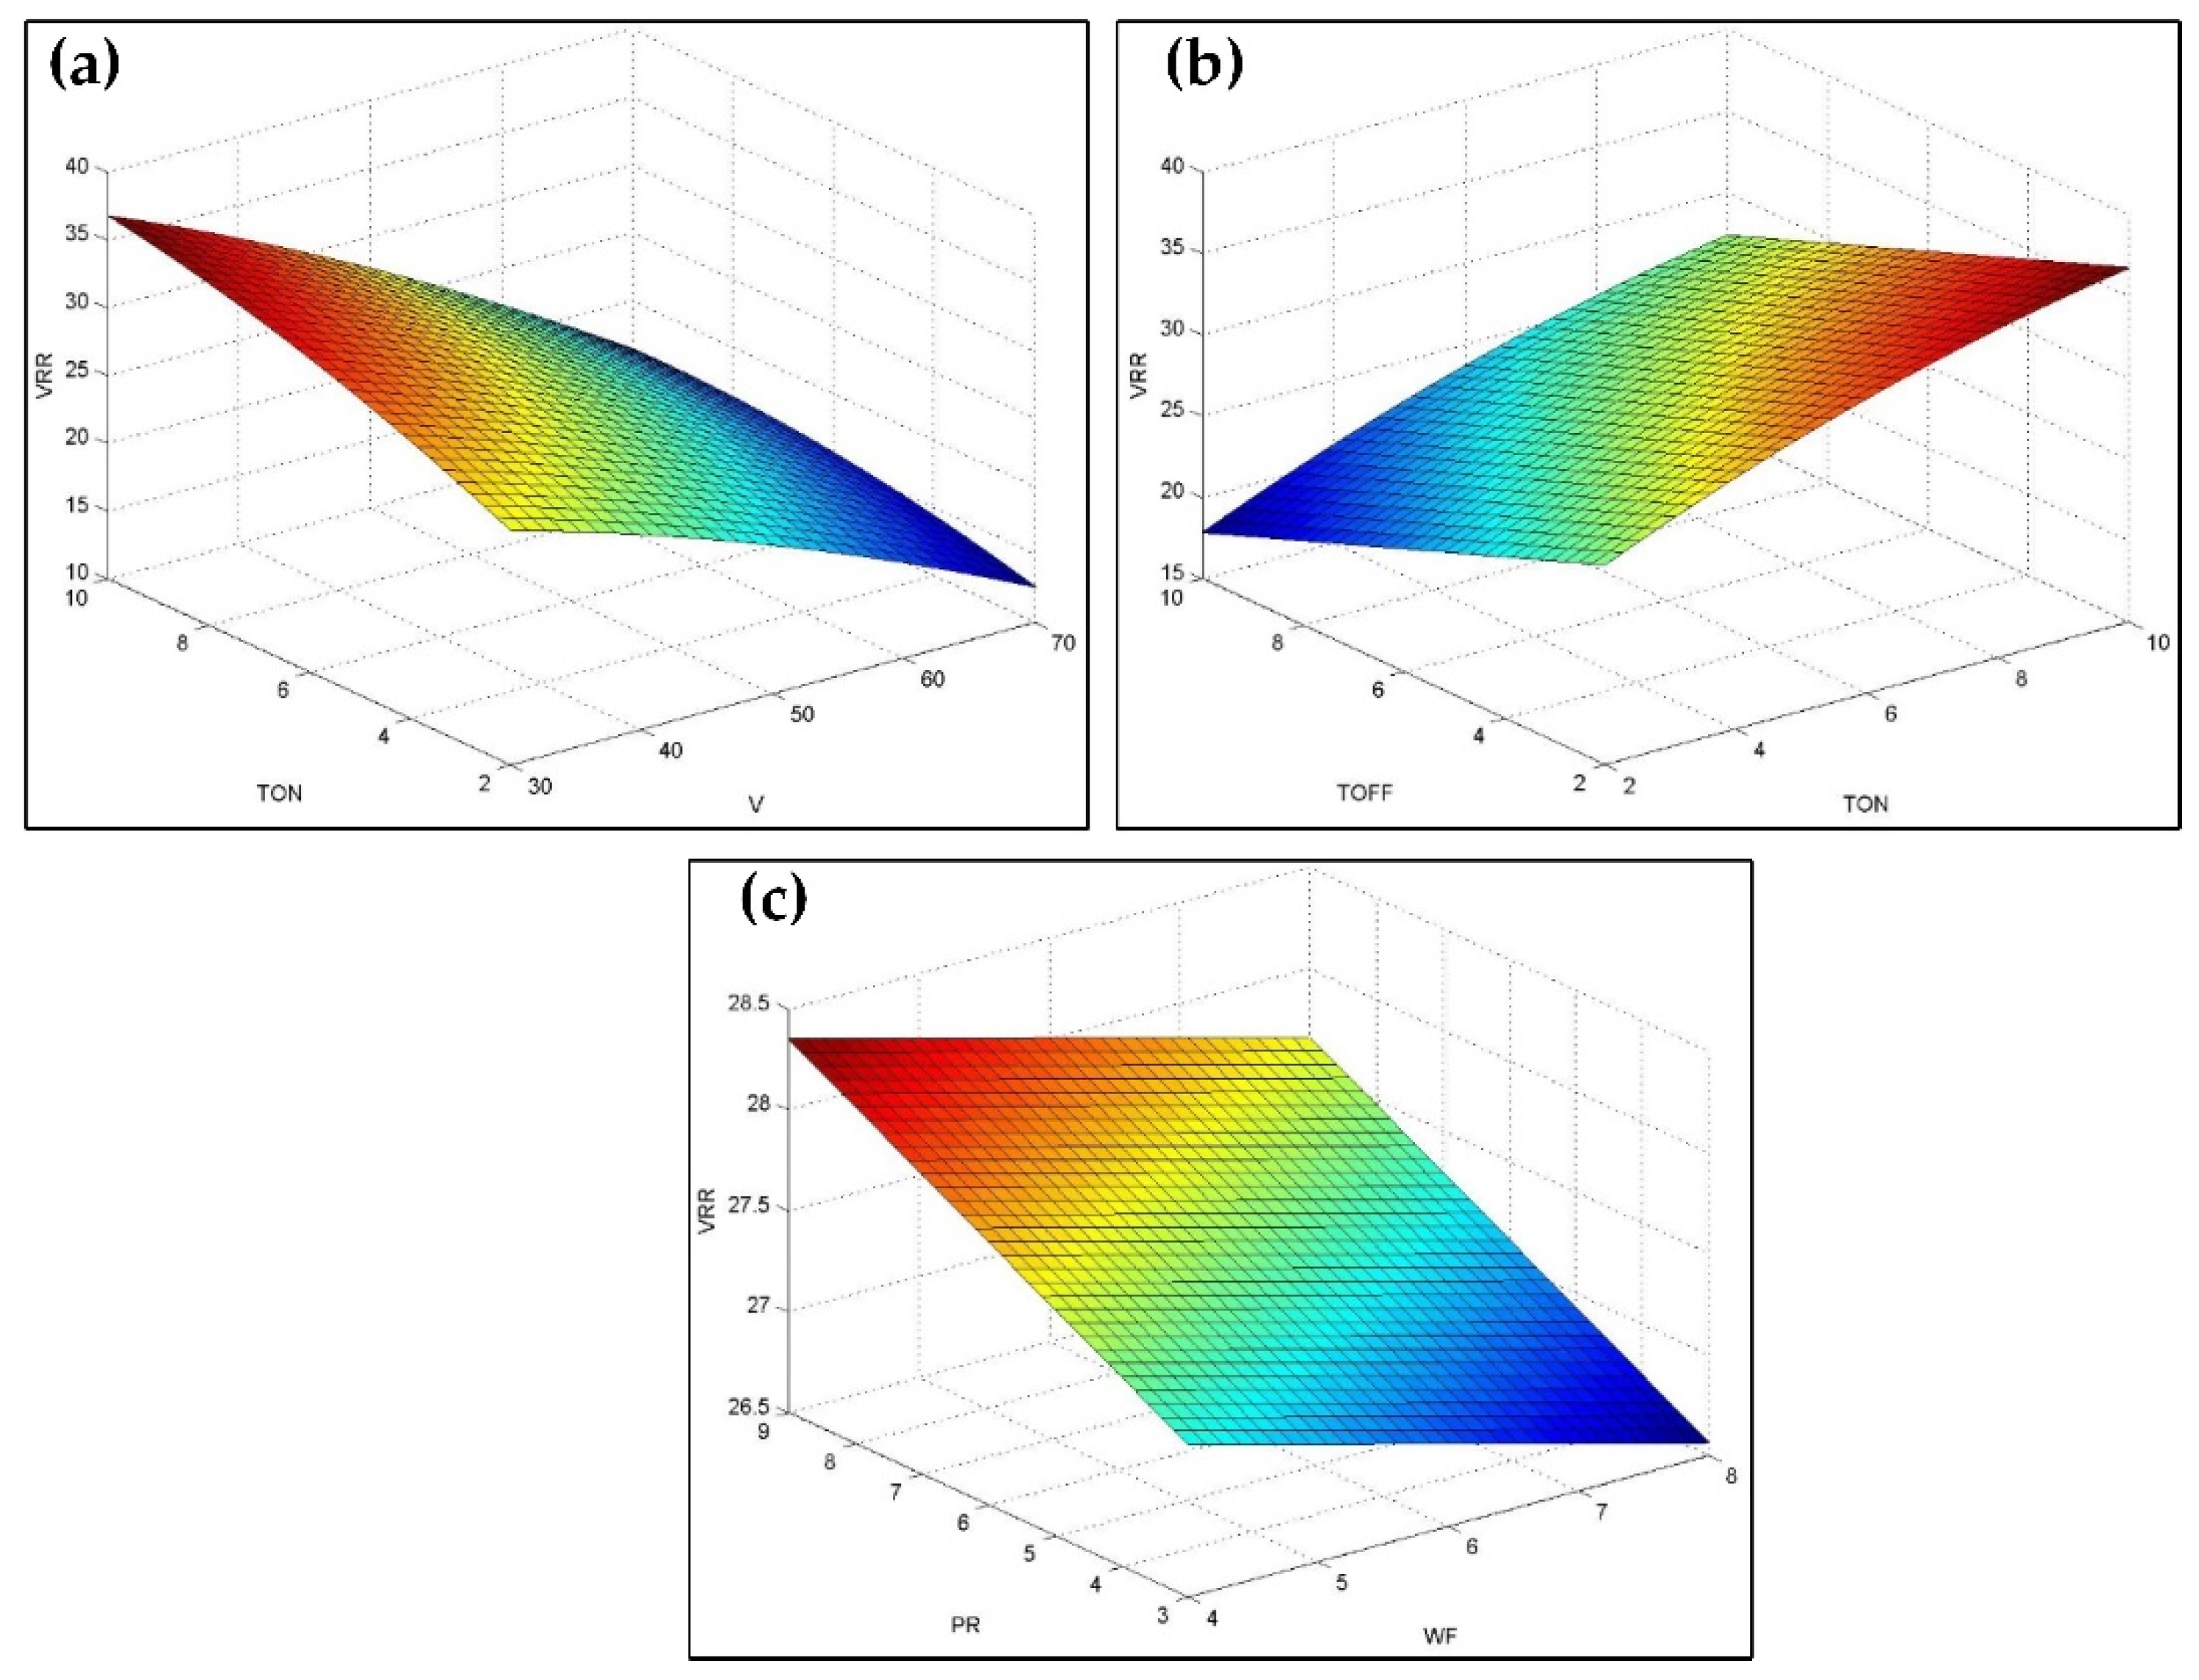
Figure 8.
(a–c) Influence of WEDM parameters on volume removal rate.
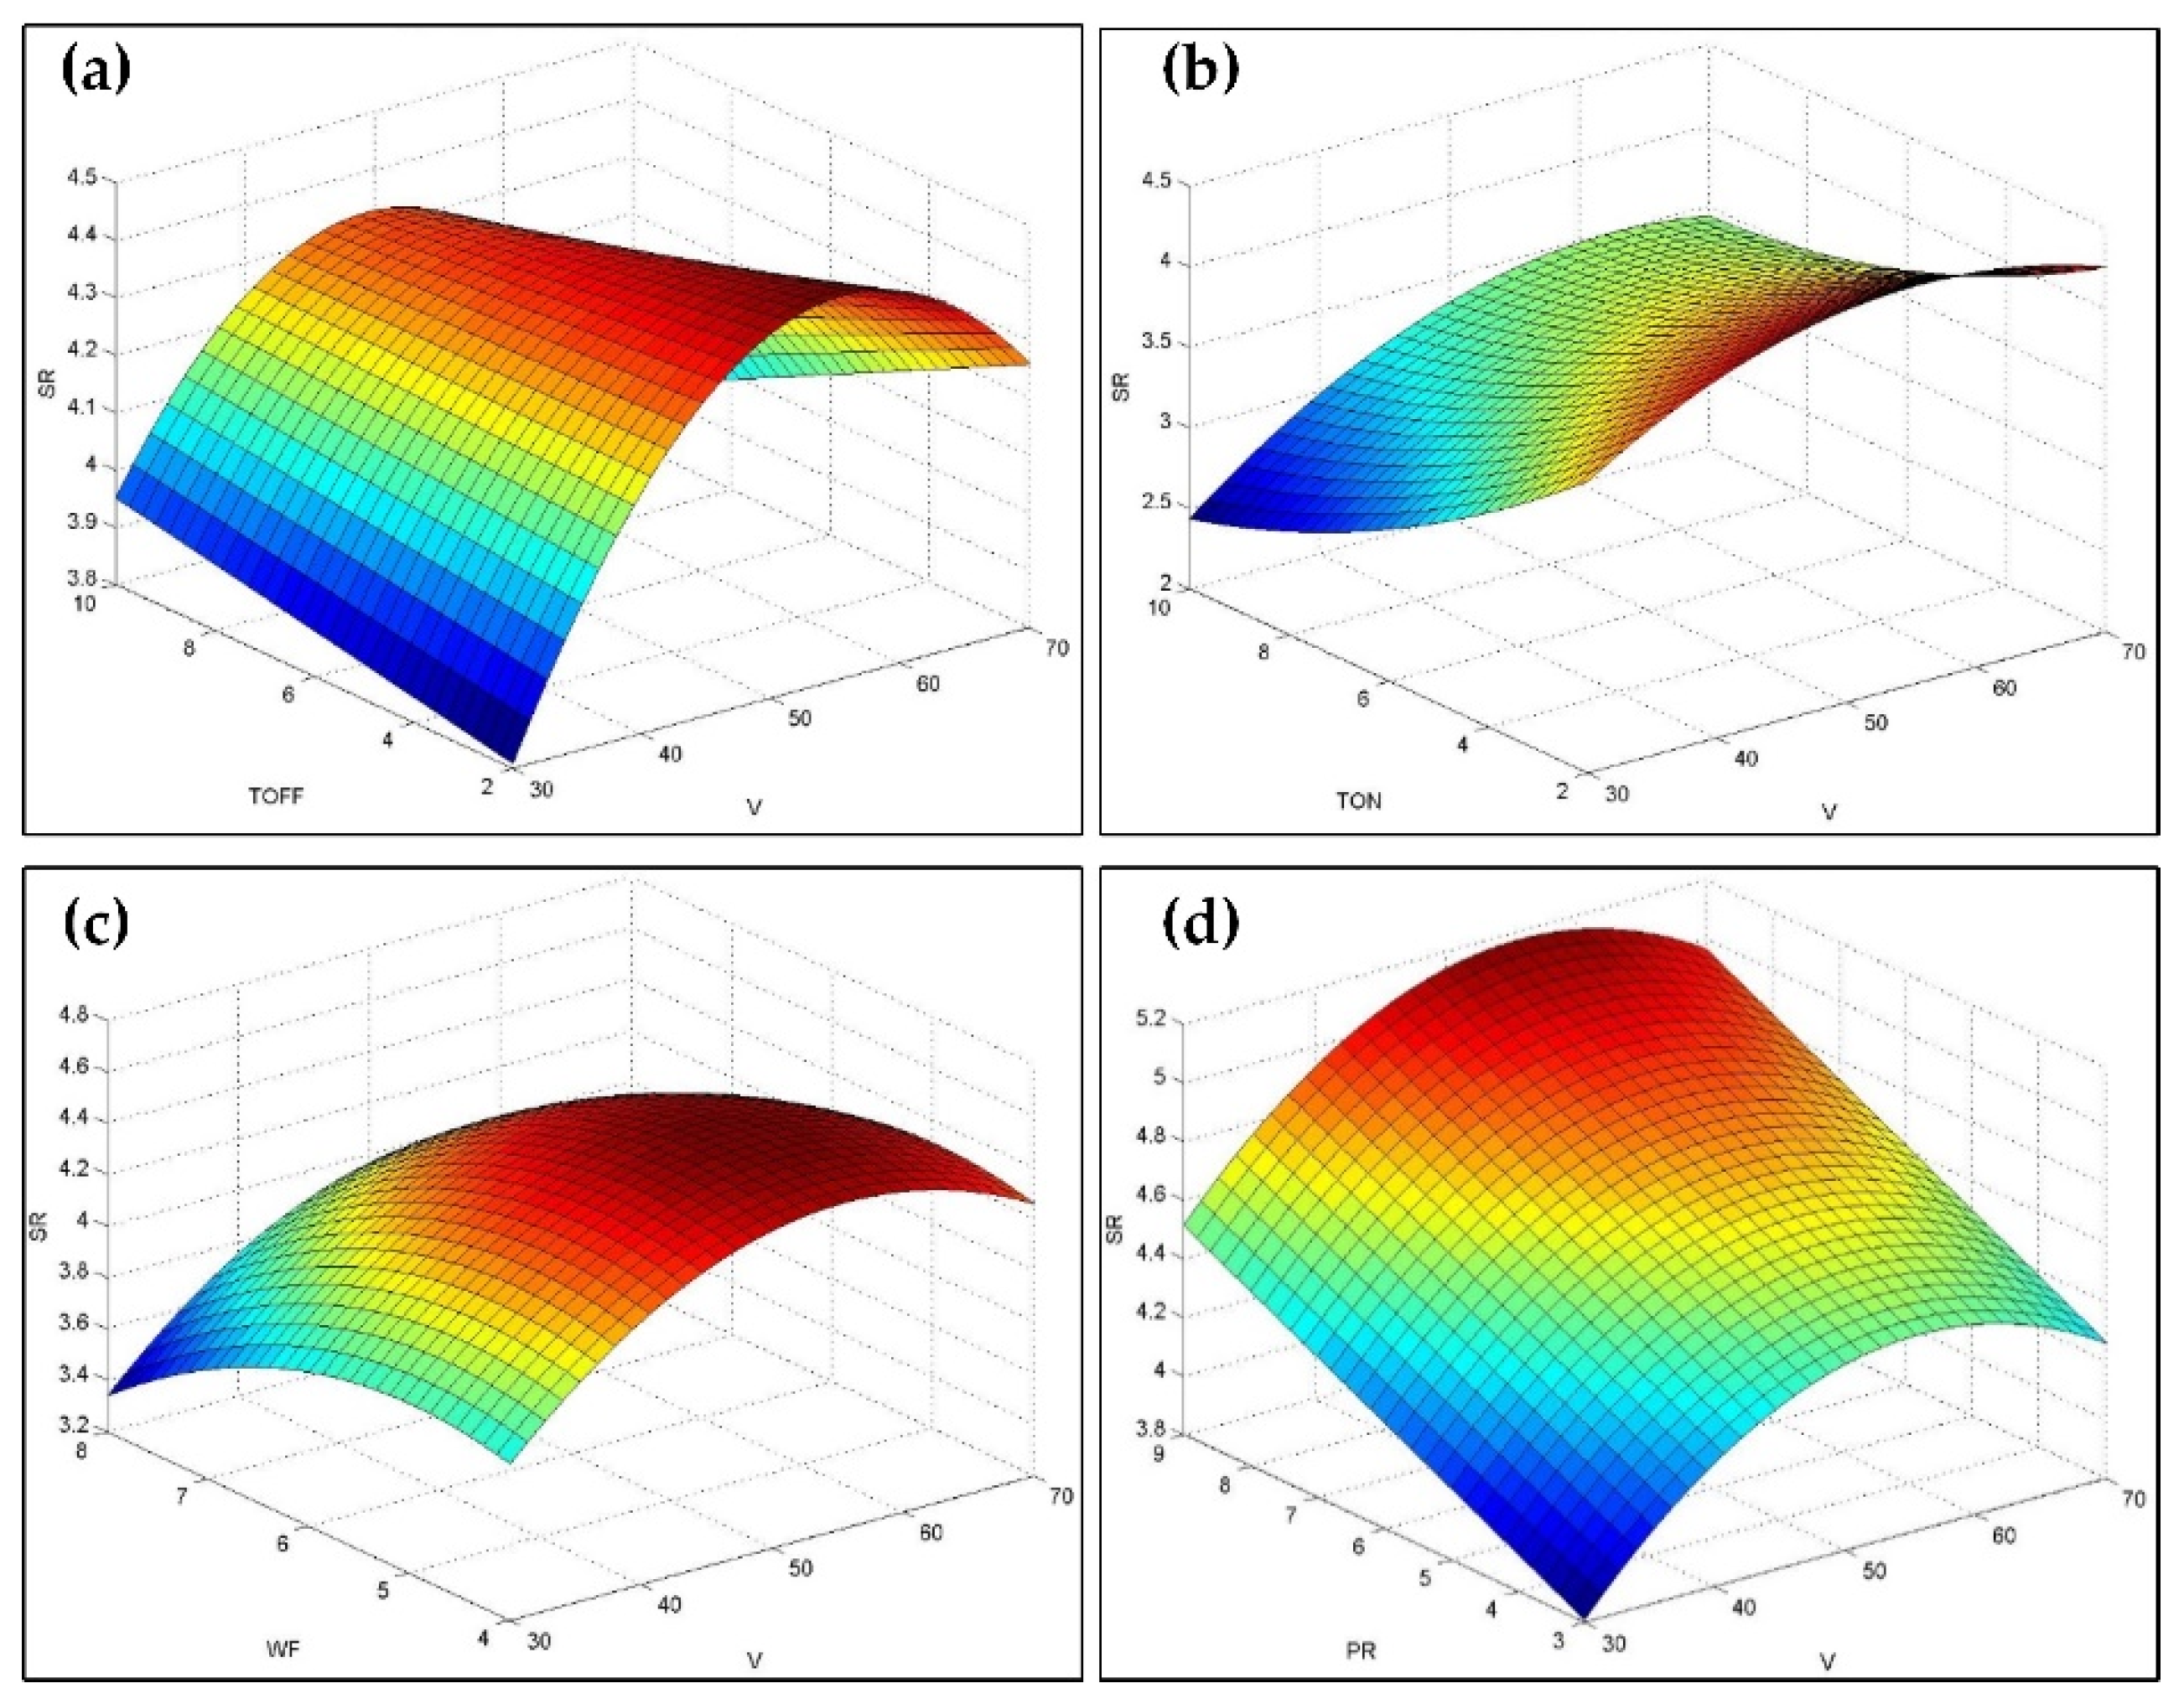
Figure 9.
(a–d). Influence of WEDM parameters on surface roughness.
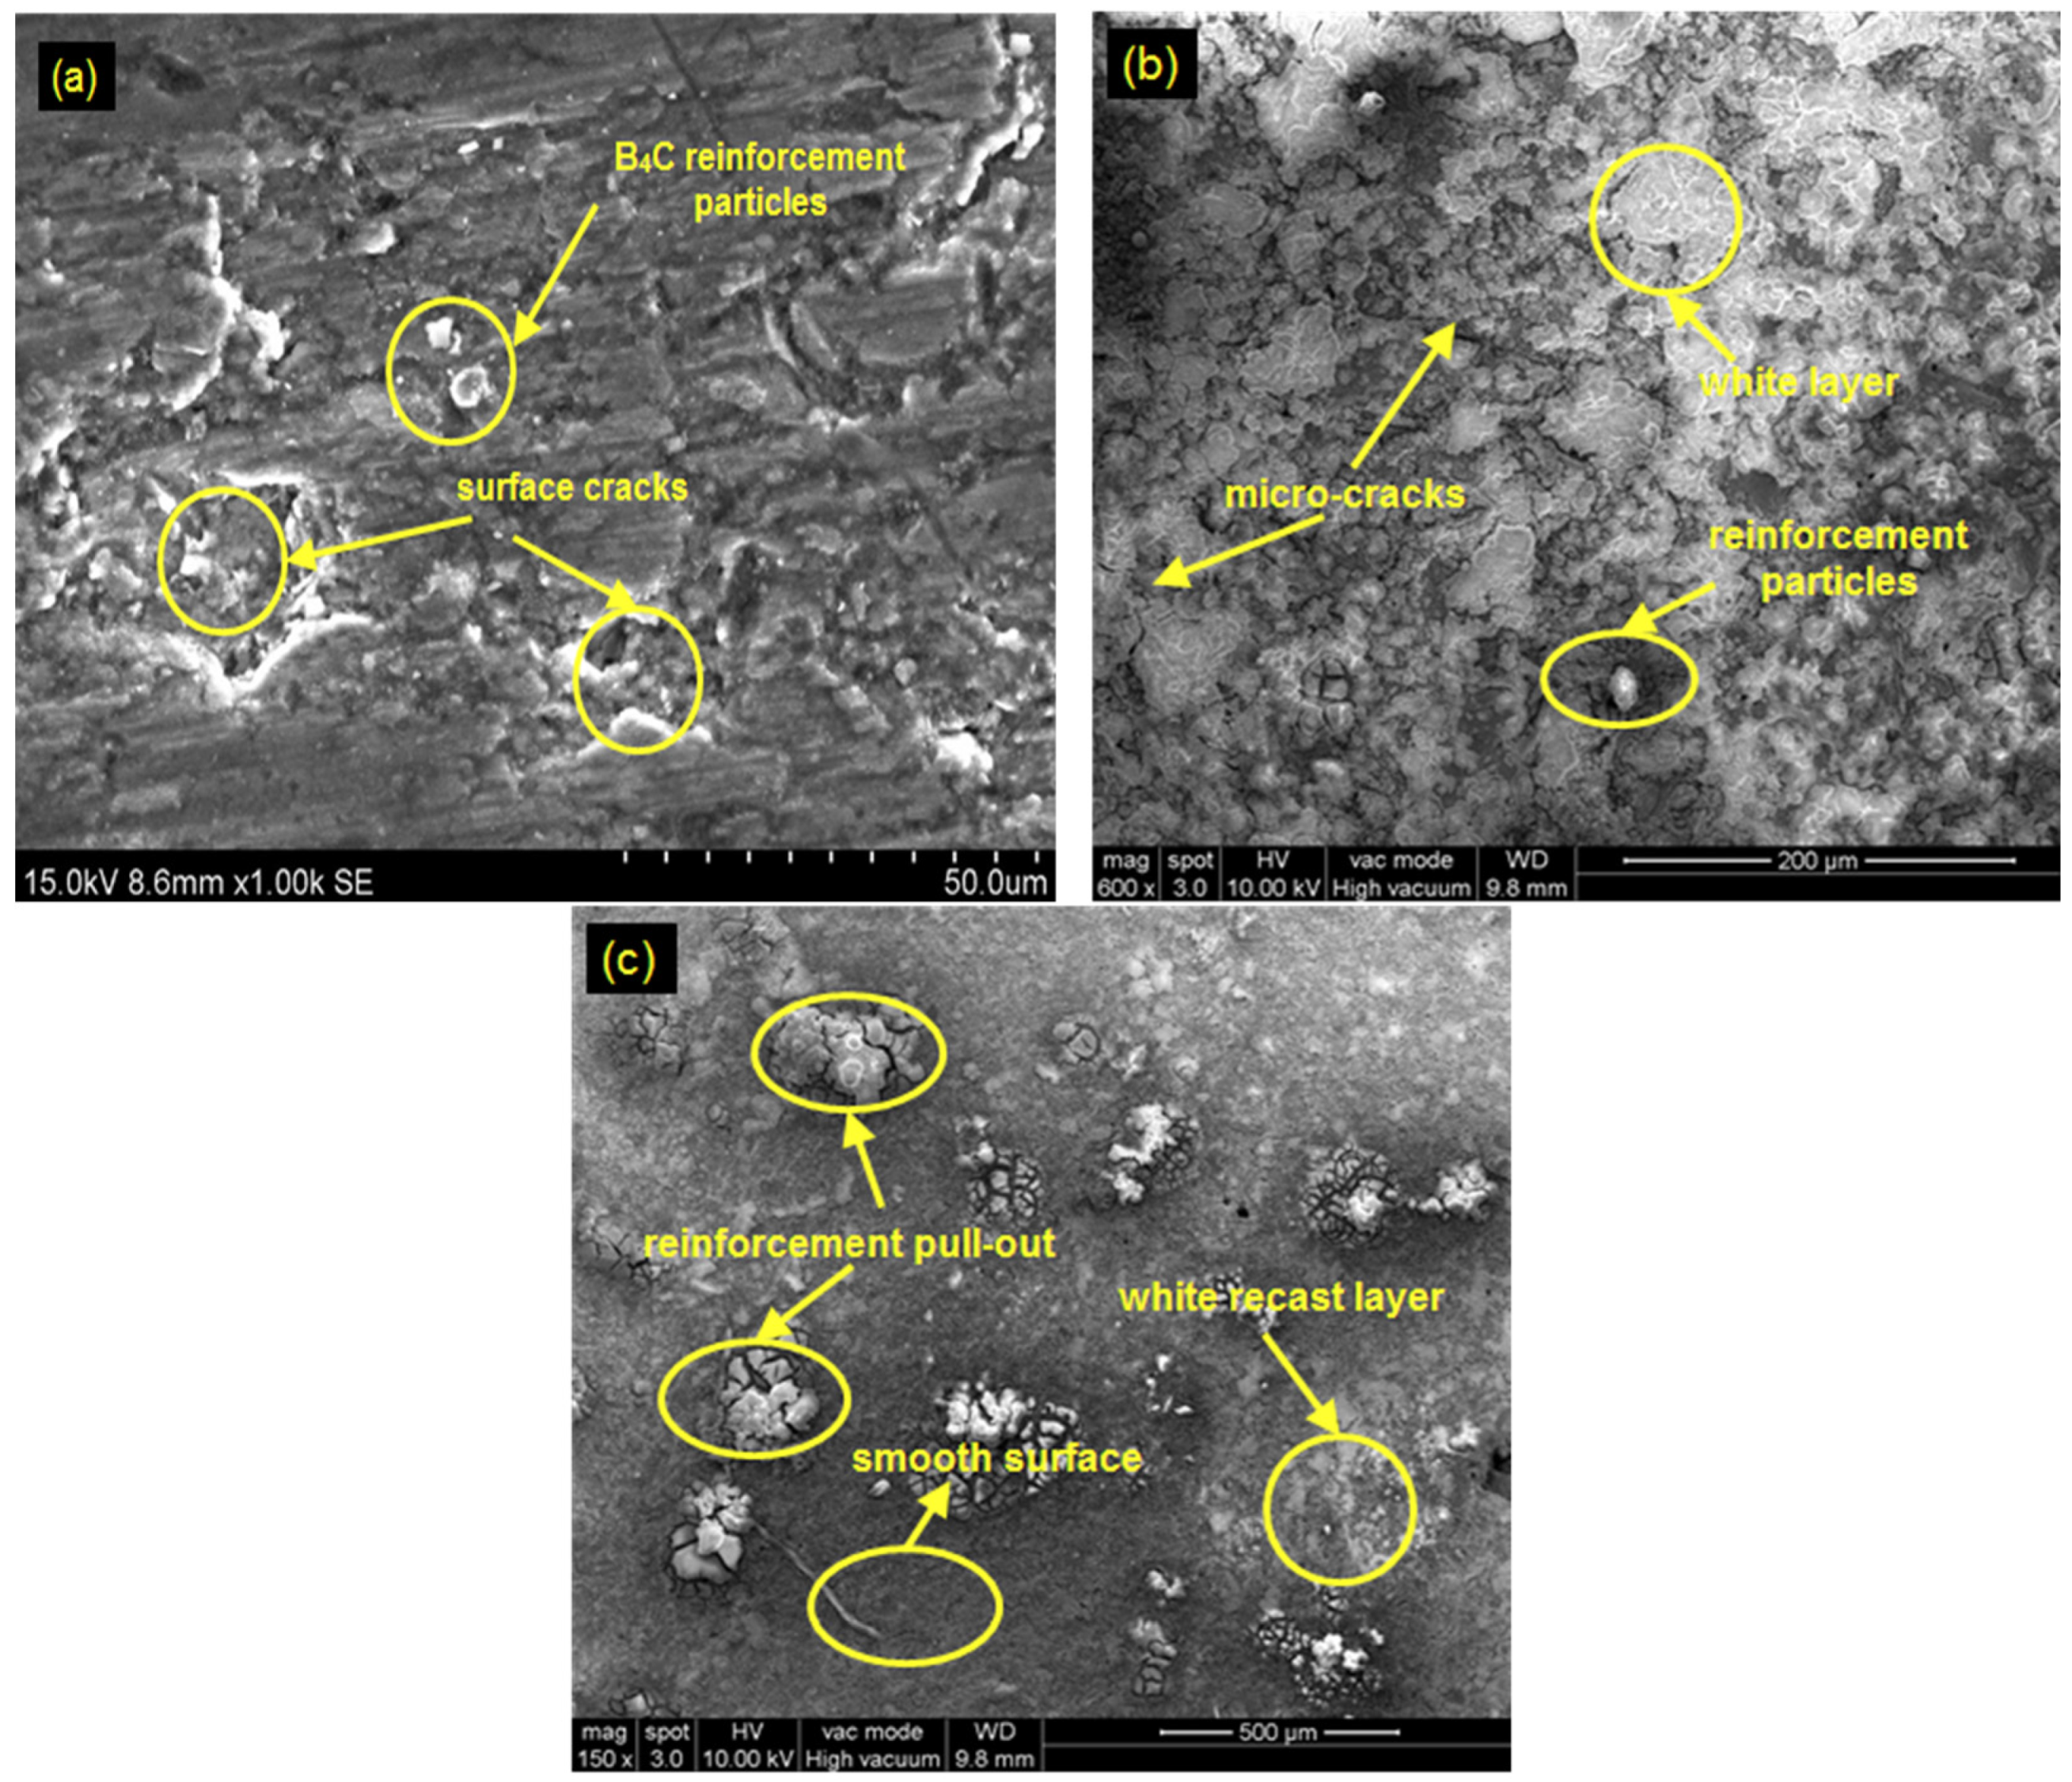
Figure 10.
SEM micrograph of WEDM machined composite surface at a cutting condition of (a) 70 V gap voltage and 9 wt% of B4C reinforcement; (b) 30 V gap voltage and 10 μs pulse-on time; (c) 29.89 V gap voltage, 9.79 μs pulse-on time, 1.97 μs pulse-off time, 3.98 m/min wire feed, and 3.03 wt% of B4C reinforcement.
Table 1.
Chemical composition of LM25 alloy.
| Contents | Si | Fe | Mg | Mn | Ti | Cu | Ni | Zn | Pb | Al |
|---|
| Composition in (%) | 7.5 | 0.5 | 0.6 | 0.3 | 0.2 | 0.1 | 0.1 | 0.1 | 0.1 | Balance |
Table 2.
Chemical composition of fly ash.
| Contents | Oxides | Si | Al | Fe | Ti | K | Ca | Loss in Ignition |
|---|
| Composition in (%) | 38.88 | 26.43 | 16.73 | 3.8 | 1.4 | 0.99 | 0.5 | Balance |
Table 3.
Weight compositions of hybrid composites.
| Weight Percentage of Reinforcements | Composition |
|---|
| 3% | LM25 alloy + 1.5% Fly ash + 1.5% B4C |
| 6% | LM25 alloy + 3% Fly ash + 3% B4C |
| 9% | LM25 alloy + 4.5% Fly ash + 4.5% B4C |
Table 4.
Specification of WEDM machine tool parameters.
| Machine Tool Parameters | Specification |
|---|
| Cutting tool | Brass wire (Diameter 250 Microns) |
| Workpiece size | 100 mm × 100 mm × 10 mm |
| Max. workpiece weight | 200 kg (workpiece height 150 mm) |
| Dielectric fluid | Deionized water |
| Conductivity of dielectric | 15–20 mho |
| Number of axes controlled | 5 Axis AC Servo Motor |
| Wire feed | Servo feed |
Table 5.
Levels of the machining process control parameters.
| Parameter | Symbol | Unit | Levels |
|---|
| 1 | 2 | 3 |
|---|
| Gap voltage (GV) | A | Volts | 30 | 50 | 70 |
| Pulse-on time (TN) | B | Micro seconds | 2 | 6 | 10 |
| Pulse-off time (TF) | C | Micro seconds | 2 | 6 | 10 |
| Wire feed (WF) | D | m/min | 4 | 6 | 8 |
| Percentage of reinforcement (PR) | E | % | 3 | 6 | 9 |
Table 6.
Experimental observation and evaluated results.
| Exp. No. | V | TN | TF | WF | PR | SR | VRR |
|---|
| A | B | C | D | E |
|---|
| 1 | 30 | 2 | 2 | 4 | 3 | 3.9422 | 27.812 |
| 2 | 30 | 2 | 6 | 6 | 6 | 4.4423 | 21.099 |
| 3 | 30 | 2 | 10 | 8 | 9 | 4.0059 | 18.860 |
| 4 | 30 | 6 | 2 | 6 | 9 | 3.6863 | 35.556 |
| 5 | 30 | 6 | 6 | 8 | 3 | 3.4239 | 29.230 |
| 6 | 30 | 6 | 10 | 4 | 6 | 3.2950 | 24.249 |
| 7 | 30 | 10 | 2 | 8 | 6 | 3.4722 | 38.400 |
| 8 | 30 | 10 | 6 | 4 | 9 | 3.2518 | 32.960 |
| 9 | 30 | 10 | 10 | 6 | 3 | 3.5210 | 28.370 |
| 10 | 50 | 2 | 2 | 4 | 3 | 4.2472 | 21.712 |
| 11 | 50 | 2 | 6 | 6 | 6 | 4.7826 | 16.388 |
| 12 | 50 | 2 | 10 | 8 | 9 | 4.4781 | 15.075 |
| 13 | 50 | 6 | 2 | 6 | 9 | 4.8644 | 27.211 |
| 14 | 50 | 6 | 6 | 8 | 3 | 3.9459 | 22.196 |
| 15 | 50 | 6 | 10 | 4 | 6 | 3.9965 | 18.443 |
| 16 | 50 | 10 | 2 | 8 | 6 | 4.8497 | 30.236 |
| 17 | 50 | 10 | 6 | 4 | 9 | 4.1811 | 24.615 |
| 18 | 50 | 10 | 10 | 6 | 3 | 3.4539 | 23.274 |
| 19 | 70 | 2 | 2 | 4 | 3 | 4.3104 | 12.942 |
| 20 | 70 | 2 | 6 | 6 | 6 | 4.1547 | 10.235 |
| 21 | 70 | 2 | 10 | 8 | 9 | 4.4036 | 09.553 |
| 22 | 70 | 6 | 2 | 6 | 9 | 4.8786 | 17.305 |
| 23 | 70 | 6 | 6 | 8 | 3 | 3.4595 | 13.551 |
| 24 | 70 | 6 | 10 | 4 | 6 | 3.7516 | 11.914 |
| 25 | 70 | 10 | 2 | 8 | 6 | 4.6963 | 18.743 |
| 26 | 70 | 10 | 6 | 4 | 9 | 3.7186 | 15.419 |
| 27 | 70 | 10 | 10 | 6 | 3 | 3.9576 | 13.635 |
Table 7.
ANOVA for SR.
| Source | DF | Adj SS | Adj MS | F-Value | p-Value |
|---|
| Model | 11 | 5.74041 | 0.52186 | 7.23 | 0.000 |
| Linear | 5 | 3.67652 | 0.73530 | 10.18 | 0.000 |
| GV | 1 | 1.02259 | 1.02259 | 14.16 | 0.002 |
| TN | 1 | 0.74615 | 0.74615 | 10.33 | 0.006 |
| TF | 1 | 0.02062 | 0.02062 | 0.29 | 0.601 |
| WF | 1 | 0.23136 | 0.23136 | 3.20 | 0.094 |
| PR | 1 | 0.88973 | 0.88973 | 12.32 | 0.003 |
| Square | 3 | 1.46905 | 0.48968 | 6.78 | 0.004 |
| GV × GV | 1 | 0.96729 | 0.96729 | 13.40 | 0.002 |
| TN × TN | 1 | 0.19751 | 0.19751 | 2.74 | 0.119 |
| WF × WF | 1 | 0.30425 | 0.30425 | 4.21 | 0.058 |
| 2-Way Interaction | 3 | 0.77329 | 0.25776 | 3.57 | 0.040 |
| GV × TN | 1 | 0.22666 | 0.22666 | 3.14 | 0.097 |
| GV × TF | 1 | 0.18593 | 0.18593 | 2.58 | 0.129 |
| TN × WF | 1 | 0.36071 | 0.36071 | 5.00 | 0.041 |
| Error | 15 | 1.08302 | 0.07220 | - | - |
| Total | 26 | 6.82343 | - | - | - |
Table 8.
ANOVA for VRR.
| Source | DF | Adj SS | Adj MS | F-Value | p-Value |
|---|
| Model | 10 | 1583.99 | 158.399 | 195.35 | 0.000 |
| Linear | 5 | 1431.33 | 286.265 | 353.05 | 0.000 |
| GV | 1 | 986.26 | 986.257 | 1216.34 | 0.000 |
| TN | 1 | 287.81 | 287.808 | 354.95 | 0.000 |
| TF | 1 | 81.40 | 81.401 | 100.39 | 0.000 |
| WF | 1 | 1.85 | 1.855 | 2.29 | 0.150 |
| PR | 1 | 2.16 | 2.157 | 2.66 | 0.122 |
| Square | 2 | 13.71 | 6.855 | 8.45 | 0.003 |
| GV × GV | 1 | 6.32 | 6.315 | 7.79 | 0.013 |
| TN × TN | 1 | 7.39 | 7.394 | 9.12 | 0.008 |
| 2-Way Interaction | 3 | 47.54 | 15.846 | 19.54 | 0.000 |
| GV × TN | 1 | 23.78 | 23.778 | 29.33 | 0.000 |
| GV × TF | 1 | 22.42 | 22.416 | 27.65 | 0.000 |
| TN × WF | 1 | 1.34 | 1.343 | 1.66 | 0.216 |
| Error | 16 | 12.97 | 0.811 | - | - |
| Total | 26 | 1596.96 | - | - | - |
Table 9.
Parameters and its values used in GHO, PSO, and MFO algorithms.
| GHO Algorithm | PSO Algorithm | MFO Algorithm |
|---|
| Parameter | Value | Parameter | Value | Parameter | Value |
|---|
| Intensity of attraction (f) | 0.5 | Learning factors
(C1 & C2) | 2 & 2 | Position of moth close to the flame (t) | −1 to −2 |
| Attractive length scale (l) | 1.5 | Inertia weight (ω) | 0.6 | Update mechanism | Logarithmic spiral |
| No. of Grasshopper (N) | 30 | Particle size (N) | 30 | No. of moths (N) | 30 |
| Maximum & minimum decreasing coefficient (cmin) | 1.0 & 0.00001 | | | | |
| No. of iterations (nitr) | 100 | No. of iterations (nitr) | 100 | No. of iterations (nitr) | 100 |
Table 10.
Optimized parameters and its responses.
| Algorithm | GV | TN | TF | WF | PR | SR | VRR |
|---|
| GHO | 29.89 | 9.7900 | 1.97 | 3.98 | 3.03 | 36.6650 | 2.4356 |
| PSO | 30.40 | 9.8500 | 2.08 | 4.07 | 2.96 | 36.3990 | 2.4971 |
| MFO | 31.04 | 9.9171 | 1.86 | 3.82 | 3.25 | 36.3686 | 2.4484 |
Table 11.
Statistical performance of algorithms.
| Statistics | GHO | PSO | MFO |
|---|
| IGD | SP | IGD | SP | IGD | SP |
|---|
| Min | 0.1609 | 3.0701 | 0.1164 | 2.4904 | 0.1129 | 2.6311 |
| Max | 0.2530 | 3.5689 | 0.3475 | 4.8051 | 0.2715 | 3.8328 |
| Mean | 0.1932 | 3.2897 | 0.1999 | 3.4751 | 0.2008 | 3.4047 |
| Median | 0.1896 | 3.2943 | 0.1859 | 3.3203 | 0.1922 | 3.4725 |
| Standard Deviation | 0.0230 | 0.1293 | 0.0546 | 0.6476 | 0.0437 | 0.2945 |
Table 12.
Results of the confirmation experiments.
| Parameter | VRR (mm3/min) | SR (microns) |
|---|
| Level | Value | GHO
Algorithm | Experimental
Value | % of
Deviation | GHO
Algorithm | Experimental Value | % of
Deviation |
|---|
| GV | 29.89 | 36.6650 | 35.873 | | 2.4356 | 2.4748 | |
| TN | 9.79 | | |
| TF | 1.97 | 2.16 | −1.61 |
| WF | 3.98 | | |
| PR | 3.03 | | |
| Publisher’s Note: MDPI stays neutral with regard to jurisdictional claims in published maps and institutional affiliations. |
© 2021 by the authors. Licensee MDPI, Basel, Switzerland. This article is an open access article distributed under the terms and conditions of the Creative Commons Attribution (CC BY) license (https://creativecommons.org/licenses/by/4.0/).


 ,
, 


