Determination of Hot Stamping Friction Coefficient of 7075 Aluminum

1
Key Laboratory of Automobile Materials, Ministry of Education and College of Materials Science and Engineering, Jilin University, Changchun 130025, China
2
Rolling Forging Research Institute, Jilin University, Changchun 130025, China
3
Superplastic and Plastic Institute, Jilin University, Changchun 130025, China
*
Author to whom correspondence should be addressed.
Metals 2021, 11(7), 1111; https://doi.org/10.3390/met11071111
Submission received: 8 June 2021
/
Revised: 2 July 2021
/
Accepted: 9 July 2021
/
Published: 12 July 2021
Abstract
:Aluminum alloy hot stamping technology can improve the formability of materials and obtain parts with high dimensional accuracy. Friction behavior in the hot stamping process is very important for forming quality. Accurate friction coefficient is helpful to improve the prediction accuracy of forming defects. It is hard to obtain the friction coefficient by simple experiments due to the complicated thermal–mechanical coupling and contact conditions during the hot stamping of aluminum alloys. In order to explore the effect of friction behavior on forming quality, hot stamping experiments of 7075 aluminum alloy U-shaped parts with different lubricants were carried out. The influence of different lubricants on the force–displacement curve, material inflow, surface appearance, and thickness distribution of the formed part was analyzed. The results showed that a good lubrication effect could be obtained with the molybdenum disulfide lubricant. The friction coefficient under different lubrication conditions was obtained by using the inverse problem optimization method. Compared with the experimental results, the determined friction coefficients could accurately predict the force–displacement curves and the thickness distributions of formed parts under different lubrication conditions.
1. Introduction
Automobile lightweight is one of the most important aims to reduce fuel consumption and air pollution [1]. A good candidate for body lightweight is 7075 aluminum alloy which exhibits high specific strength, strong impact resistance, and good corrosion resistance [2]. However, the formability of 7075 aluminum alloy in T6 condition is poor at room temperature and it is difficult to form complex parts [3,4]. The hot stamping technology of aluminum alloys can be used to improve the formability of materials, overcome the springback of parts, and enhance the forming accuracy [5].
The hot stamping of aluminum alloys is a complicated thermal–mechanical coupling process and friction behavior is the key factor influencing forming quality and die life [6]. Poor friction condition will make the 7075 aluminum alloy adhere to the surfaces of tools and lead to galling and cracking defects [7]. Using lubricant or die surface coating are effective methods to reduce the friction during the forming process. Liu et al. [8] have studied the importance of lubricant in hot forming through experiment and finite element simulation. The results indicate that lubricant can effectively reduce the fracture and galling of formed parts. Marzouki et al. [9] have carried out the pin-disk friction experiment at 400 °C and investigated the effectiveness of different tool coatings in hot stamping.
To obtain the friction coefficient at high temperature, some researchers developed sliding friction and wear tester. Yanagida et al. [10] performed a sliding friction test to obtain the friction coefficient of hot forming. Ghiotti et al. [11] evaluated the influence of the material thermal treatment on the adhesive in AA7075 hot stamping. Solid graphite lubrication was investigated for both the solubilized and the T6 material conditions by means of strip drawing tests in the temperature range 200–450 °C varying the normal contact pressure up to 10 MPa and the sliding velocity up to 50 mm/s. The results showed that the friction coefficient presents an initial decrease as the temperature increases, followed by adhesion phenomena at the highest temperatures with material transfer to the dies. Zaba et al. [12] studied the abrasive wear resistance 2024 aluminum alloy strips under friction conditions involving various lubricants. The results allowed for predicting set lubricant-material for tools which can be applied to sheet metal made of aluminum alloy 2024. The sliding friction experiment can obtain the friction coefficient under different temperatures and pressures. However, the sliding friction test didn’t consider the deformation process of the materials and could not accurately obtain the friction coefficient in the actual hot forming process.
In this work, hot stamping experiments of 7075 aluminum alloy U-shaped parts with different lubricants were carried out. The influence of different lubricants on the force–displacement curve, material inflow, surface appearance, and thickness distribution of the formed part was analyzed. The friction coefficients under different lubrication conditions were obtained by using an inverse problem optimization method.
2. Materials and Methods
2.1. Materials
The material used in this study is 7075 aluminum alloy with a thickness of 2 mm produced by Southwest Aluminum Co., Ltd. (Chongqing, China). The chemical composition of it is shown in Table 1.
2.2. Hot Tensile Test
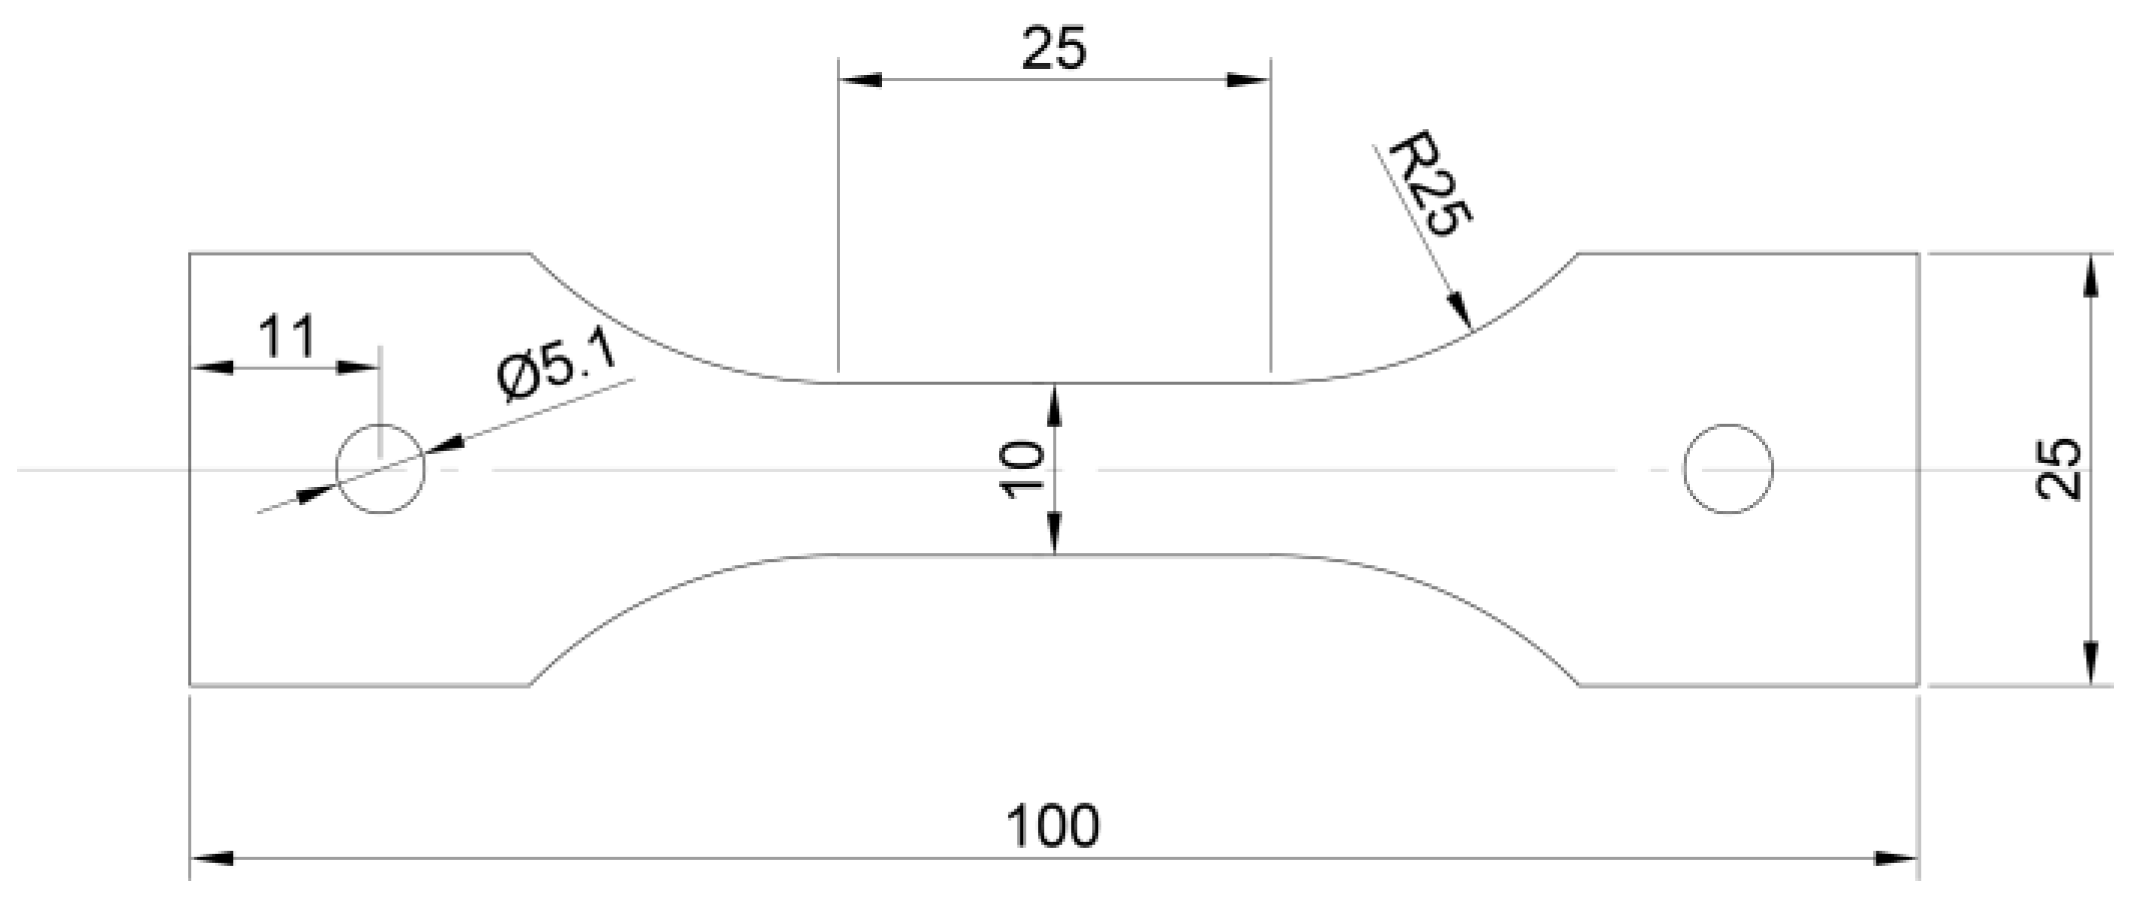
The tensile specimens were heated to 480 °C at the heating rate of 20 °C/s and kept for 60 s by Gleeble 1500D thermal simulator (DSI Company, Poestenkill, NY, USA). Then, the specimens were cooled at 15 °C/s to 300 °C, 350 °C, 400 °C and 450 °C respectively, and hot tensile tests were carried out at strain rates of 0.01 s−1, 0.1 s−1 and 1.0 s−1. Each condition was repeated three times. The geometry of the tensile specimen is shown in Figure 1.
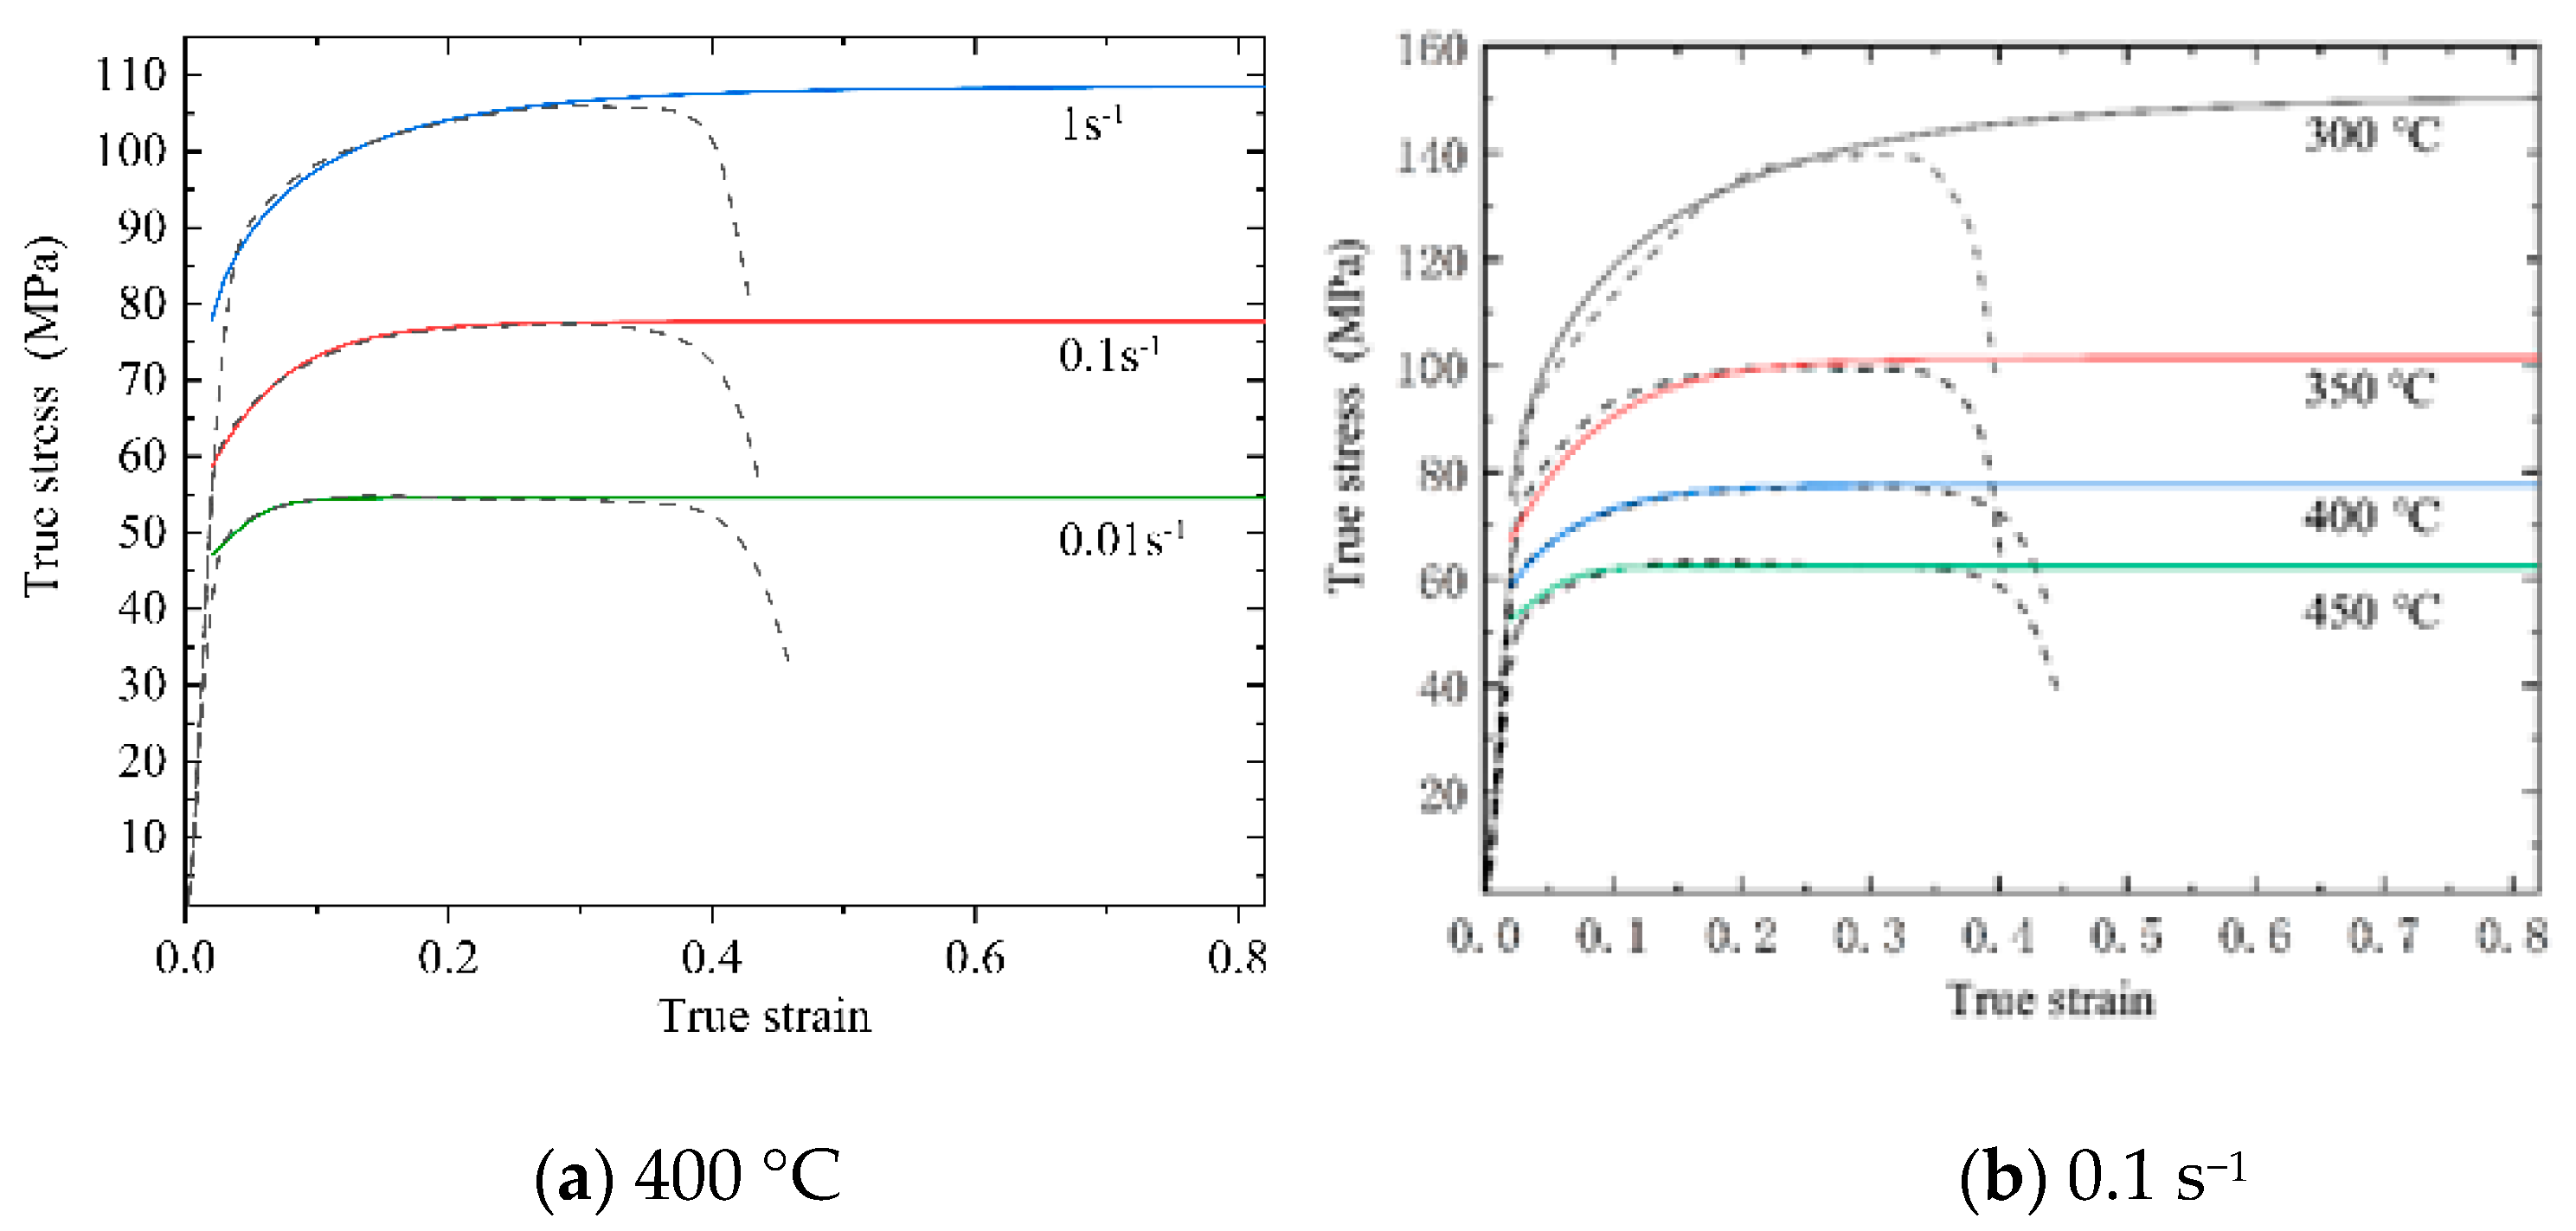
The Hockett–Sherby model [13] was used to extend the stress–strain curves. The Hockett–Sherby model is shown in Equation (1):
Figure 2 shows the experimental and predicted true stress–strain curves at different temperatures and strain rates. The flow stress increases gradually with the strain rate increasing at 400 °C, shown in Figure 2a. The main reason is that the higher strain rate easily produces the accumulation of dislocations, increasing the deformation resistance of the material. When the strain rate is 0.1 s−1, the flow stress reduces with the deformation temperature rising, shown in Figure 2b. At 300 °C, the strain hardening effect dominates. When the temperature is above 350 °C, the softening effect of the material is increasingly apparent, and at this time the recovery softening and strain hardening are in dynamic equilibrium.
In order to obtain the anisotropy of the material, tensile tests were conducted at the temperature of 400 °C and the strain rate of 0.01 s−1 on the specimens with the rolling direction of 0°, 45° and 90°. Three experiments were repeated under each condition, and the average value was taken. The anisotropy coefficient r can be defined by Equation (2):
where and are the plastic increments in the width and thickness directions of the tensile specimen.
2.3. Hot Stamping Experiment of U-Shaped Parts
The 7075 aluminum alloy blank was put in the furnace for solid solution treatment at 480 °C with 30 min. The blank was then quickly transferred to the forming tools by manual operation, and the transfer process was about 6–8 s. The transferred blank was formed at 400 °C and quenched for 8 s after forming, and the holding pressure was set to 25 MPa. Finally, the artificial aging was conducted at 120 °C with 24 h.
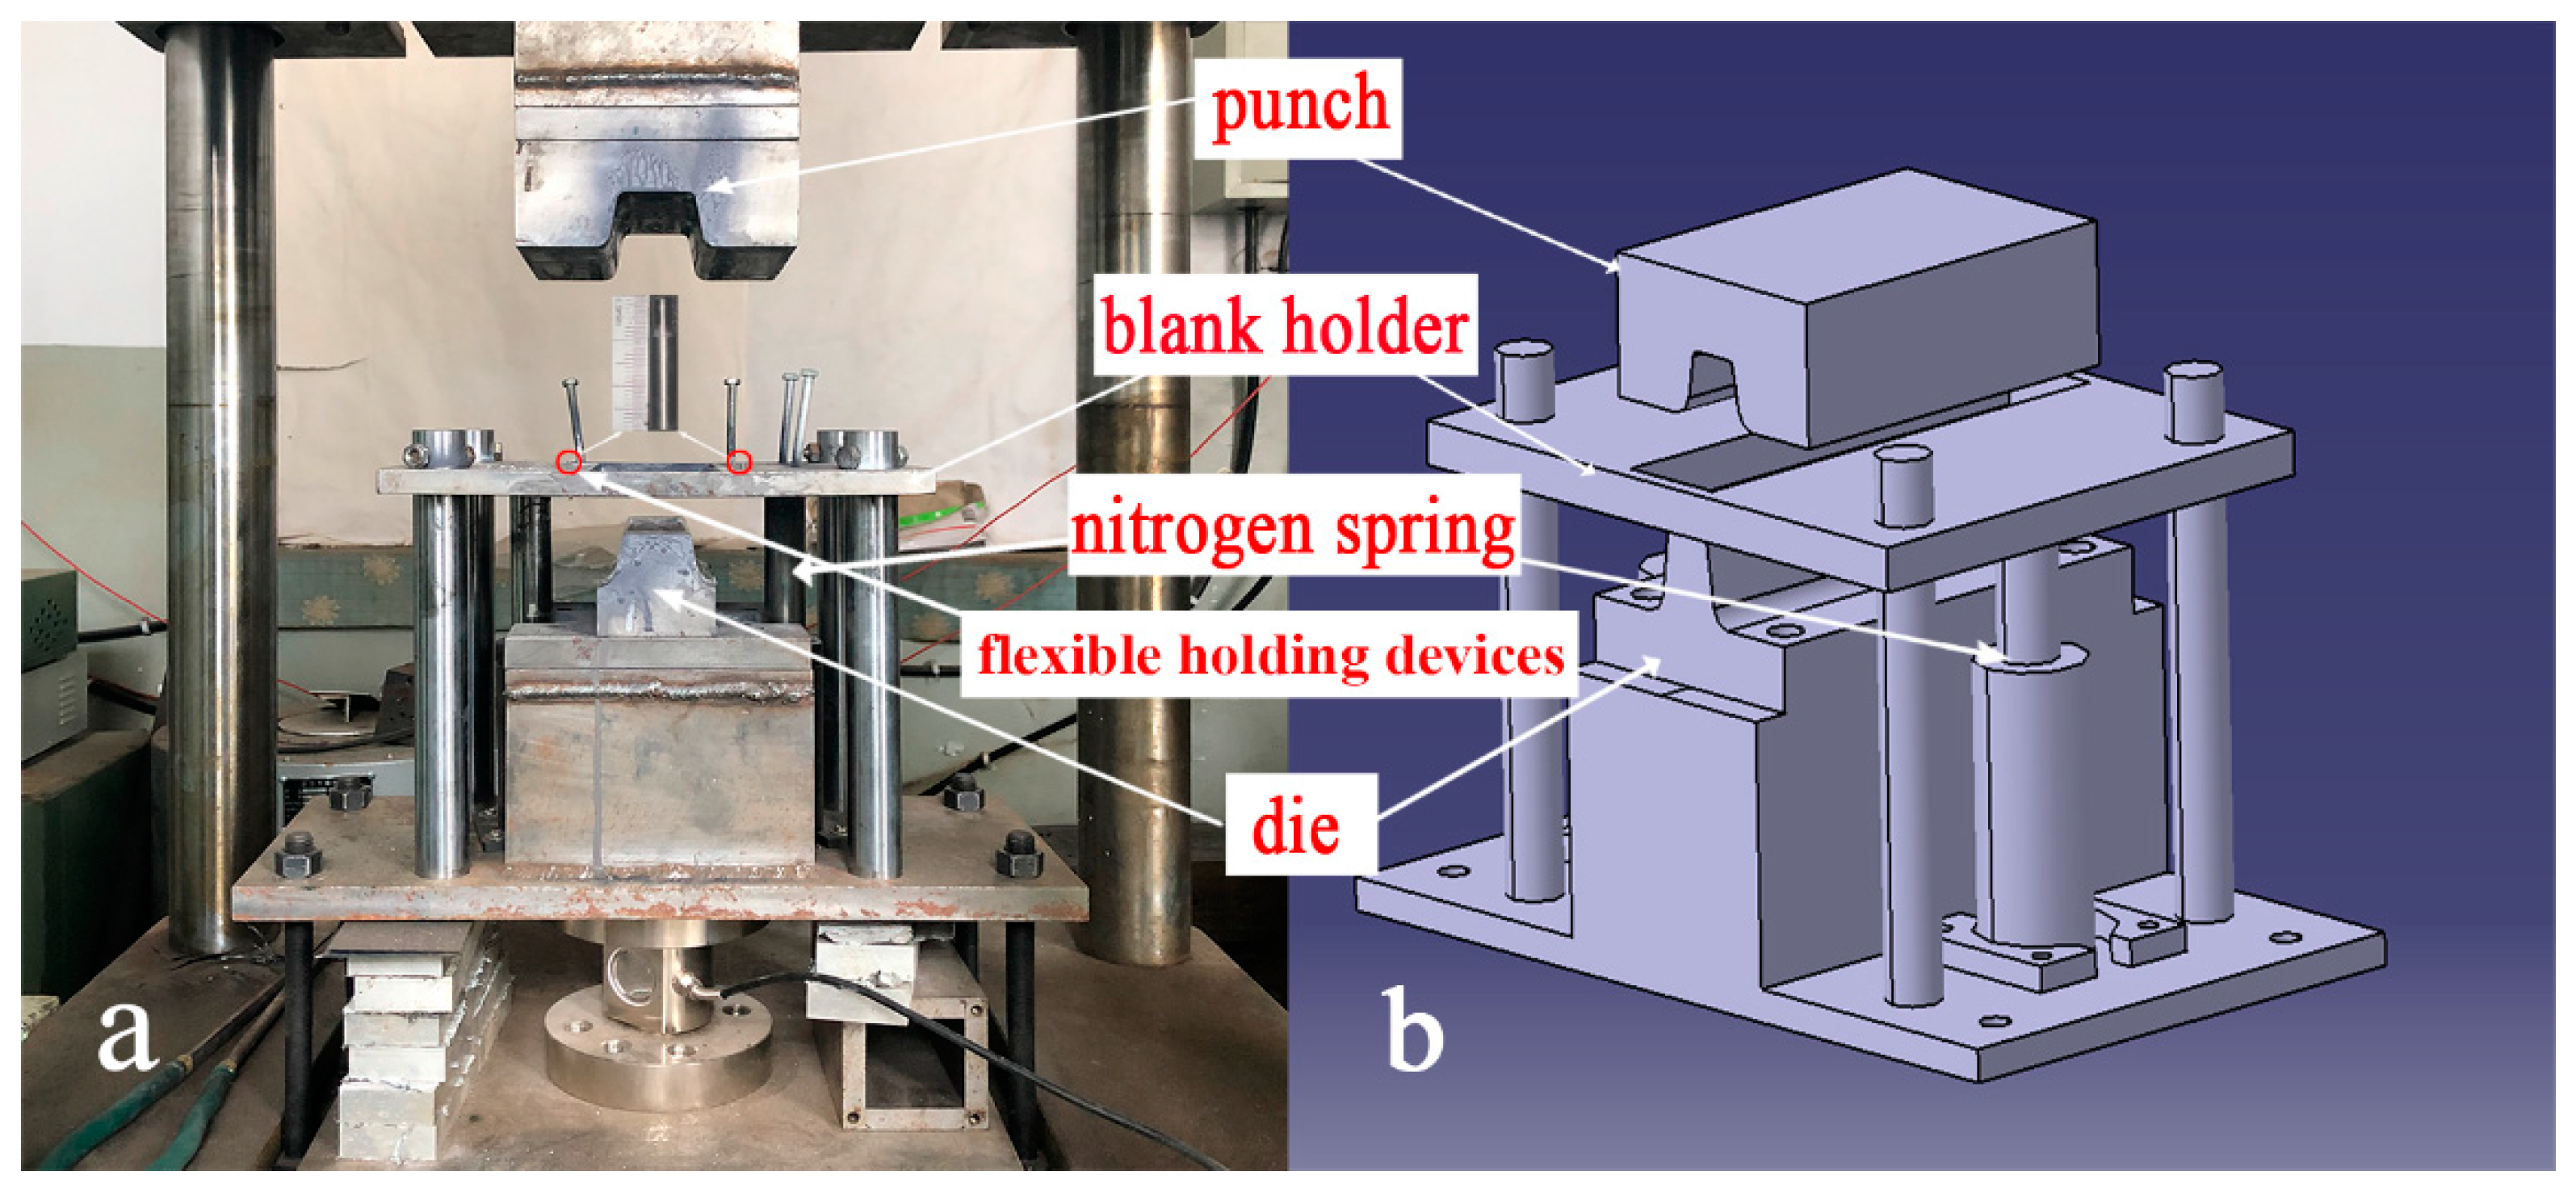
Figure 3 shows the set-up of the U-shaped tools used in the experiment. It is composed of a die, punch, blank holder, and two nitrogen springs. The temperature of the die, punch, and blank holder is 25 °C. There are no cooling channels in the die, punch, and blank holder due to the interval of 30 min between the two experiments. The nitrogen spring has a compression length of 100 mm, an initial force of 7400 N, and a terminal force of 11,900 N. In order to prevent the heat loss caused by the contact between the binder and the blank, four flexible holding devices were put on the blank holder.
U-shaped part hot stamping experiments were conducted with no lubricant, boron nitride lubricant (JD-3028), graphite lubricant (CRC-03094), and molybdenum disulfide lubricant (CRC-32660). The lubricant was sprayed on the surfaces of tools and the blank respectively, and the last remaining lubricant on the tools was cleaned with ethanol when the lubricant was changed each time.
3. Establishment of Finite Element Model
3.1. YLD2000-2D Yield Model
Considering the influence of anisotropy on forming, YLD2000-2D yield model [14,15,16] was used. The yield function of YLD2000-2D is written as:
where φ′ and φ″ are written as:
where Xi′ and Xi″ are the principal values of the linearly transformed stress tensors, X′ and X″, which are written as:
where “:” denotes the doubled contracted product between two tensors. The fourth-order linear stress transformation tensors are L′ and L″ and can be reduced for plane-stress loading to:
and are defined as:
Yield stress σ0, σ45, σ90 and anisotropic coefficient r0, r45, r90 in three directions of uniaxial tensile test are needed to determine the eight parameters αi of YLD2000-2D model. In addition to the uniaxial tensile tests, the equal-biaxial tensile yield stress and r-value can be calculated using through-thickness compression tests to calibrate the equal-biaxial tensile region of anisotropic yield functions. In this work, we did not conduct the equal-biaxial tensile test. and can be approximately expressed by uniaxial tensile results, as shown in Equations (12) and (13):
3.2. Finite Element Simulation of Hot Forming of U-Shaped Parts
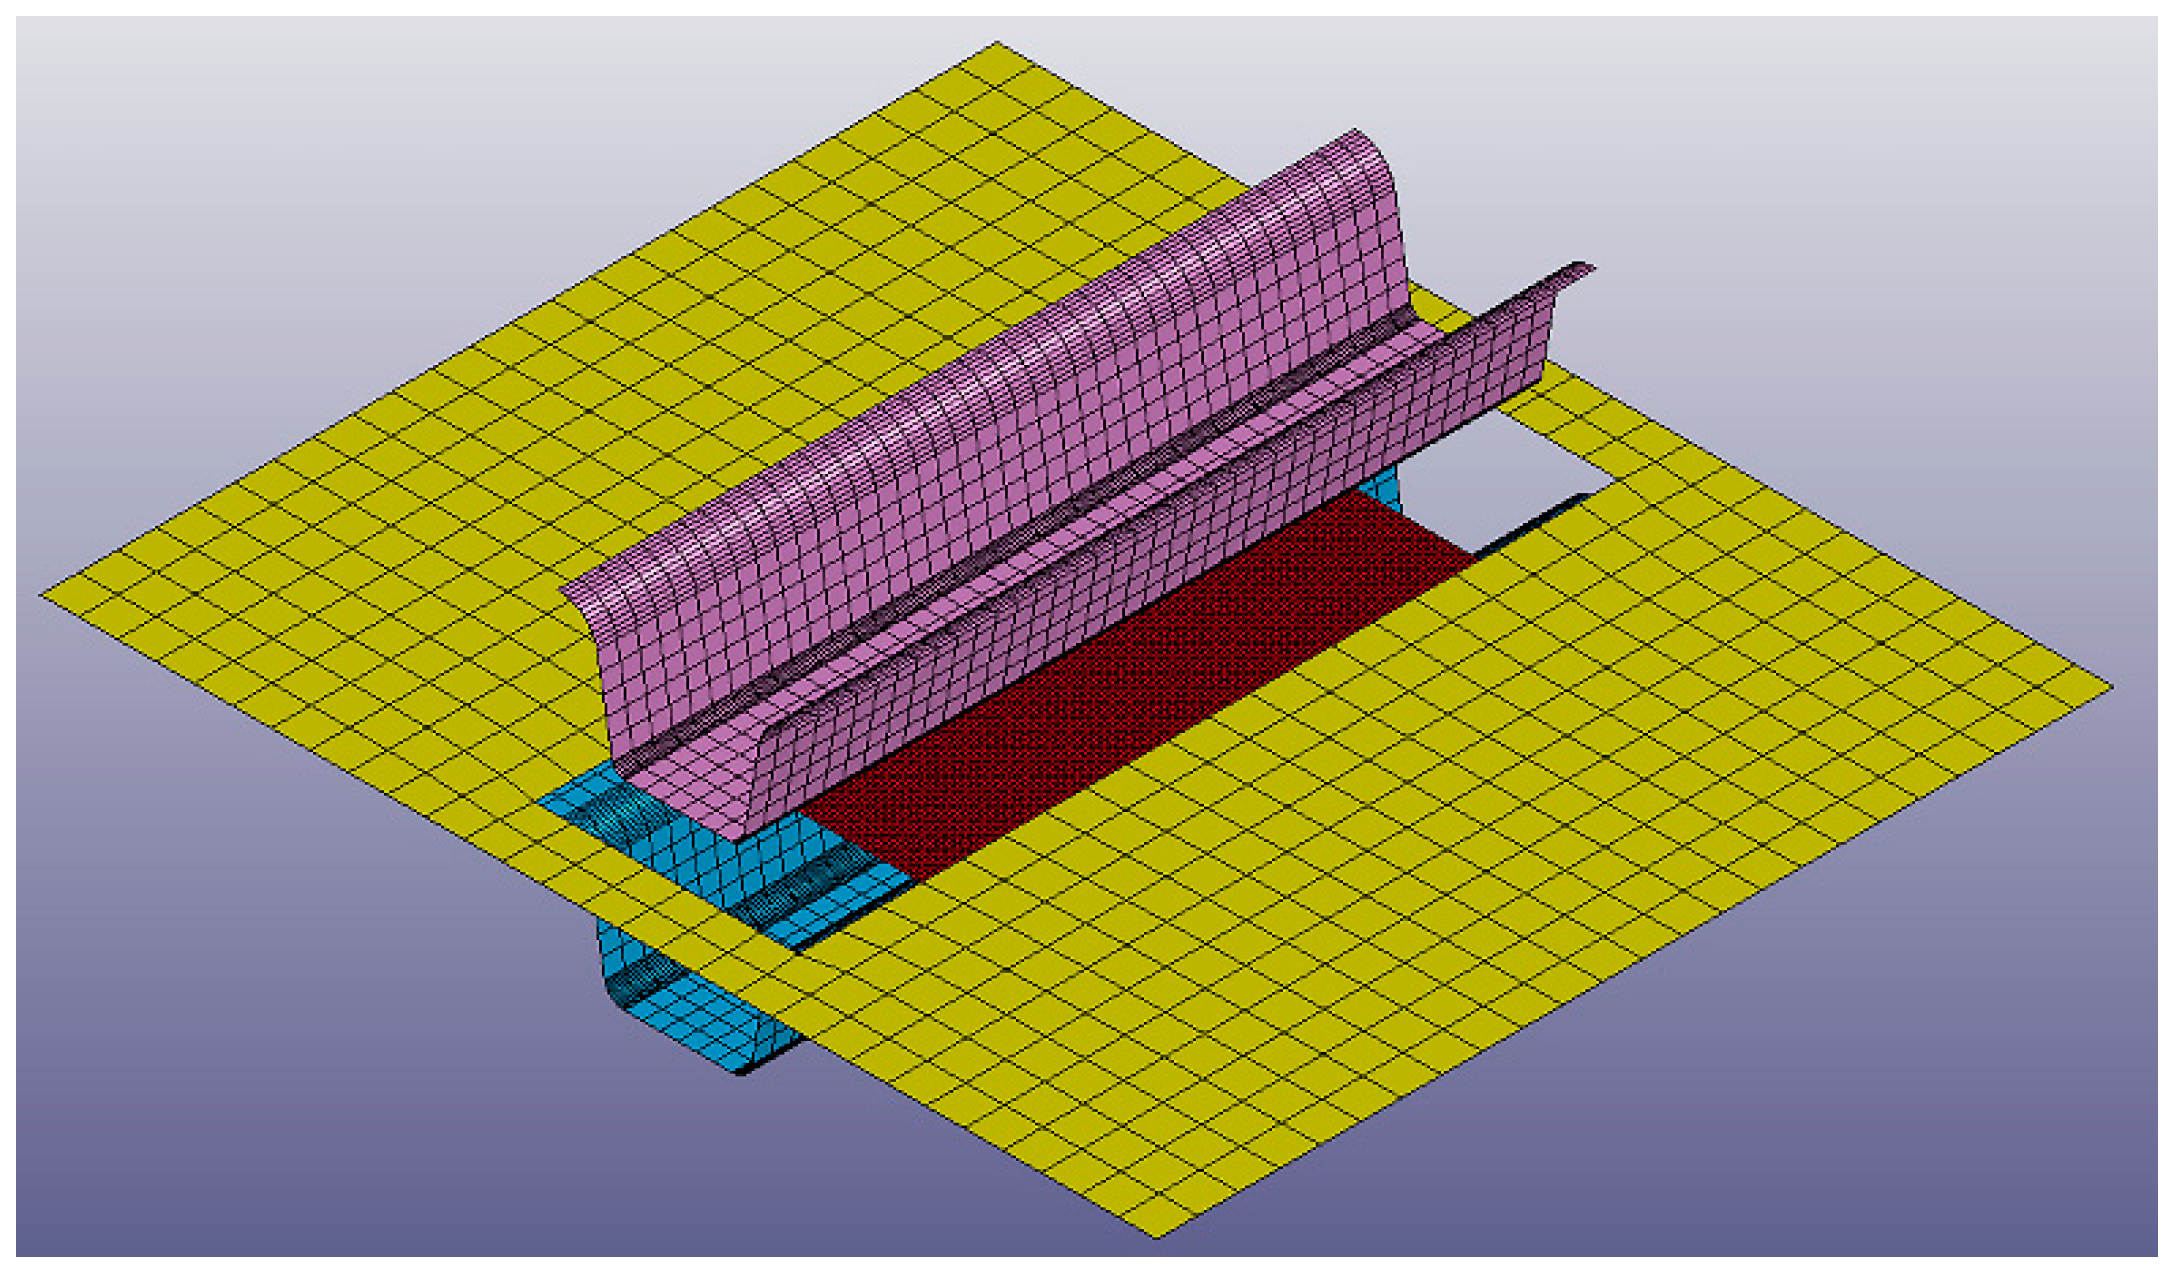
LS-DYNA was used to simulate the hot forming of U-shaped part. The shell element was used to mesh the tools and the blank, as shown in Figure 5. The element number of the blank and tools is 19,380 and 5250, respectively. The physical and thermal parameters of the blank and tools are shown in Table 4.
4. Reverse Optimization of Friction Coefficient
The principle of reverse optimization of friction coefficient is to calibrate the friction coefficient by comparing and optimizing the experimental and predicted forming force–displacement curve.
Friction coefficient reverse optimization is as follows:
- (1)
- The initial values of static friction coefficient (FS) and dynamic friction coefficient (FD) were set as 0.3, and the variation range was set between 0 and 0.8.
- (2)
- The forming force–displacement curve obtained from FE simulation was compared with the experimental result, and the error δ was set as the square sum of the difference between the simulated and experimental forming forces, as shown in Equation (14):
The calibrated friction coefficients under different lubrication conditions are shown in Table 5. It can be seen that the friction coefficient is greatly reduced by using lubricant.
5. Results and Discussion
5.1. Force–Displacement Curve under Different Lubrication Conditions
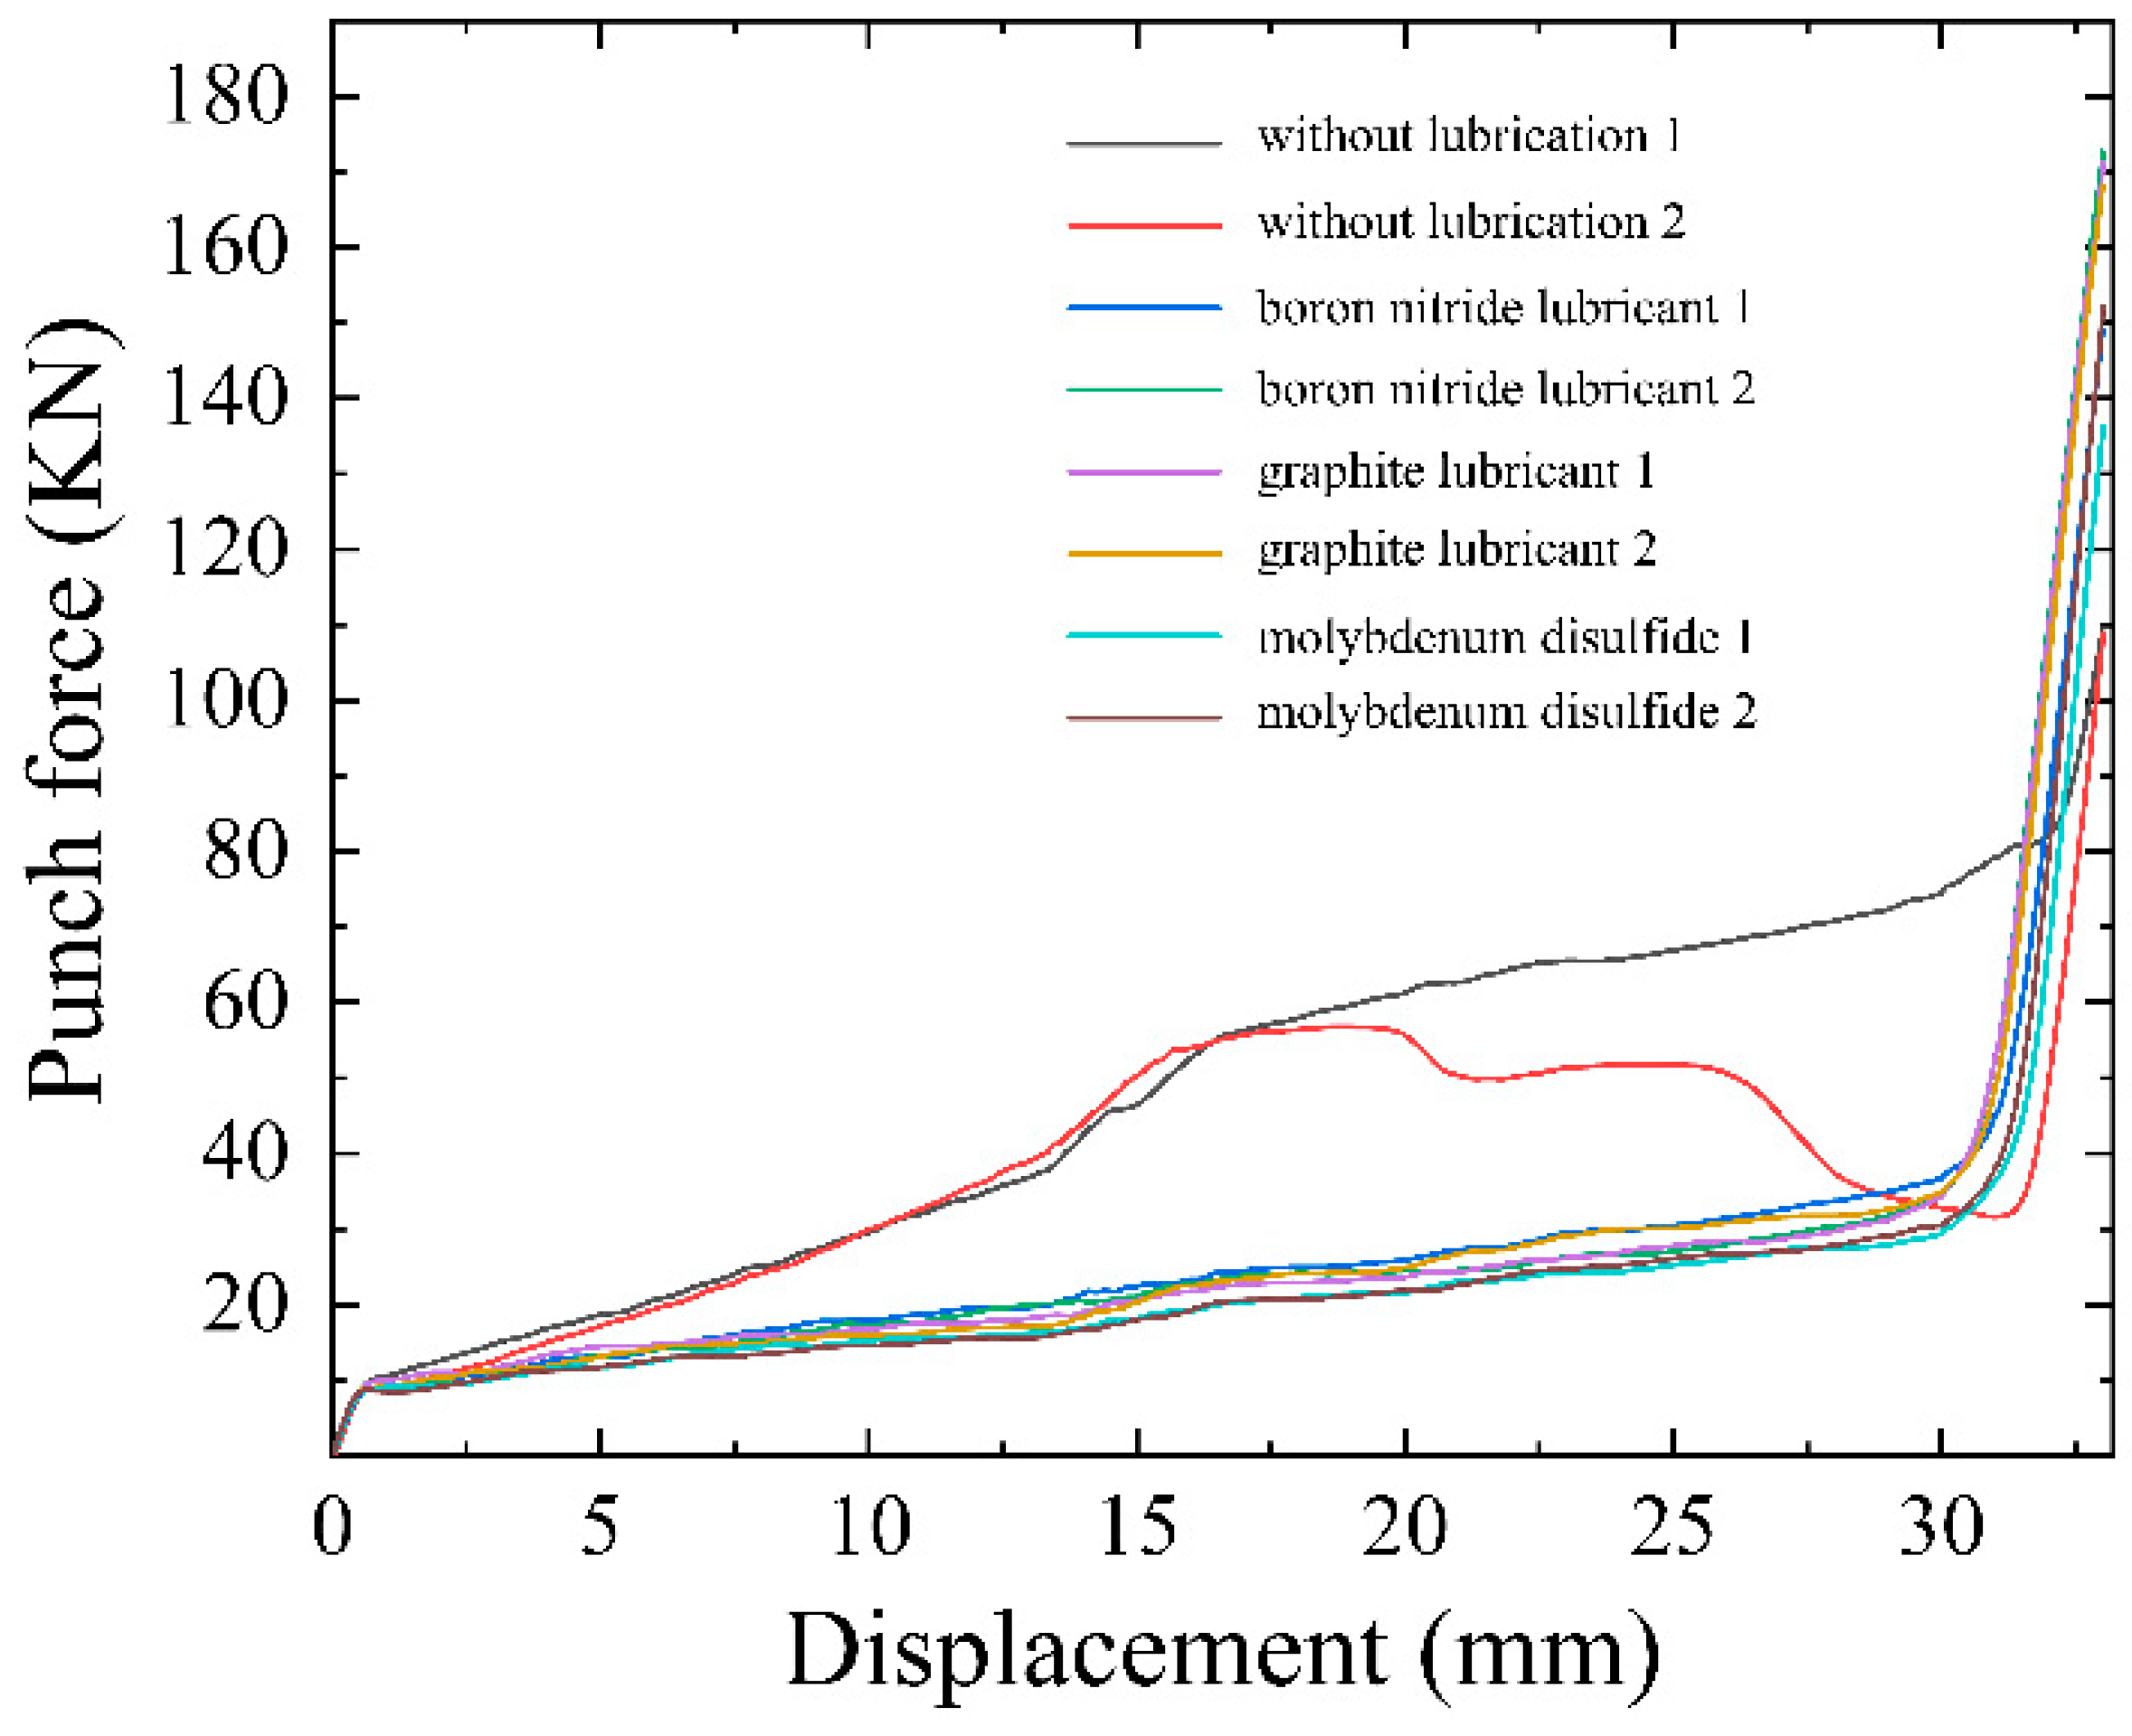
Figure 6 displays the force–displacement curves of different lubrication conditions. Two experiments were conducted for each lubricant condition. The force–displacement curves with the same lubrication agree well except for no lubricant conditions. It can be seen that the forming force without lubrication is larger, and the value is 66.9 KN and 51.7 KN respectively when the die stroke is 25 mm. The forming force of the second part without lubrication decreases rapidly after the die stroke is 20 mm, which indicates that the material is cracked. However, the forming force decreases obviously after spraying lubricants. When the die stroke is 25 mm, the forming force is 30.5 KN and 27.1 KN with boron nitride lubricant and 27.8 KN and 30.1 KN with graphite lubricant. The difference of forming force between the two lubricants is small. The minimum forming force of 25.3 KN and 26.1 KN is obtained with molybdenum disulfide.
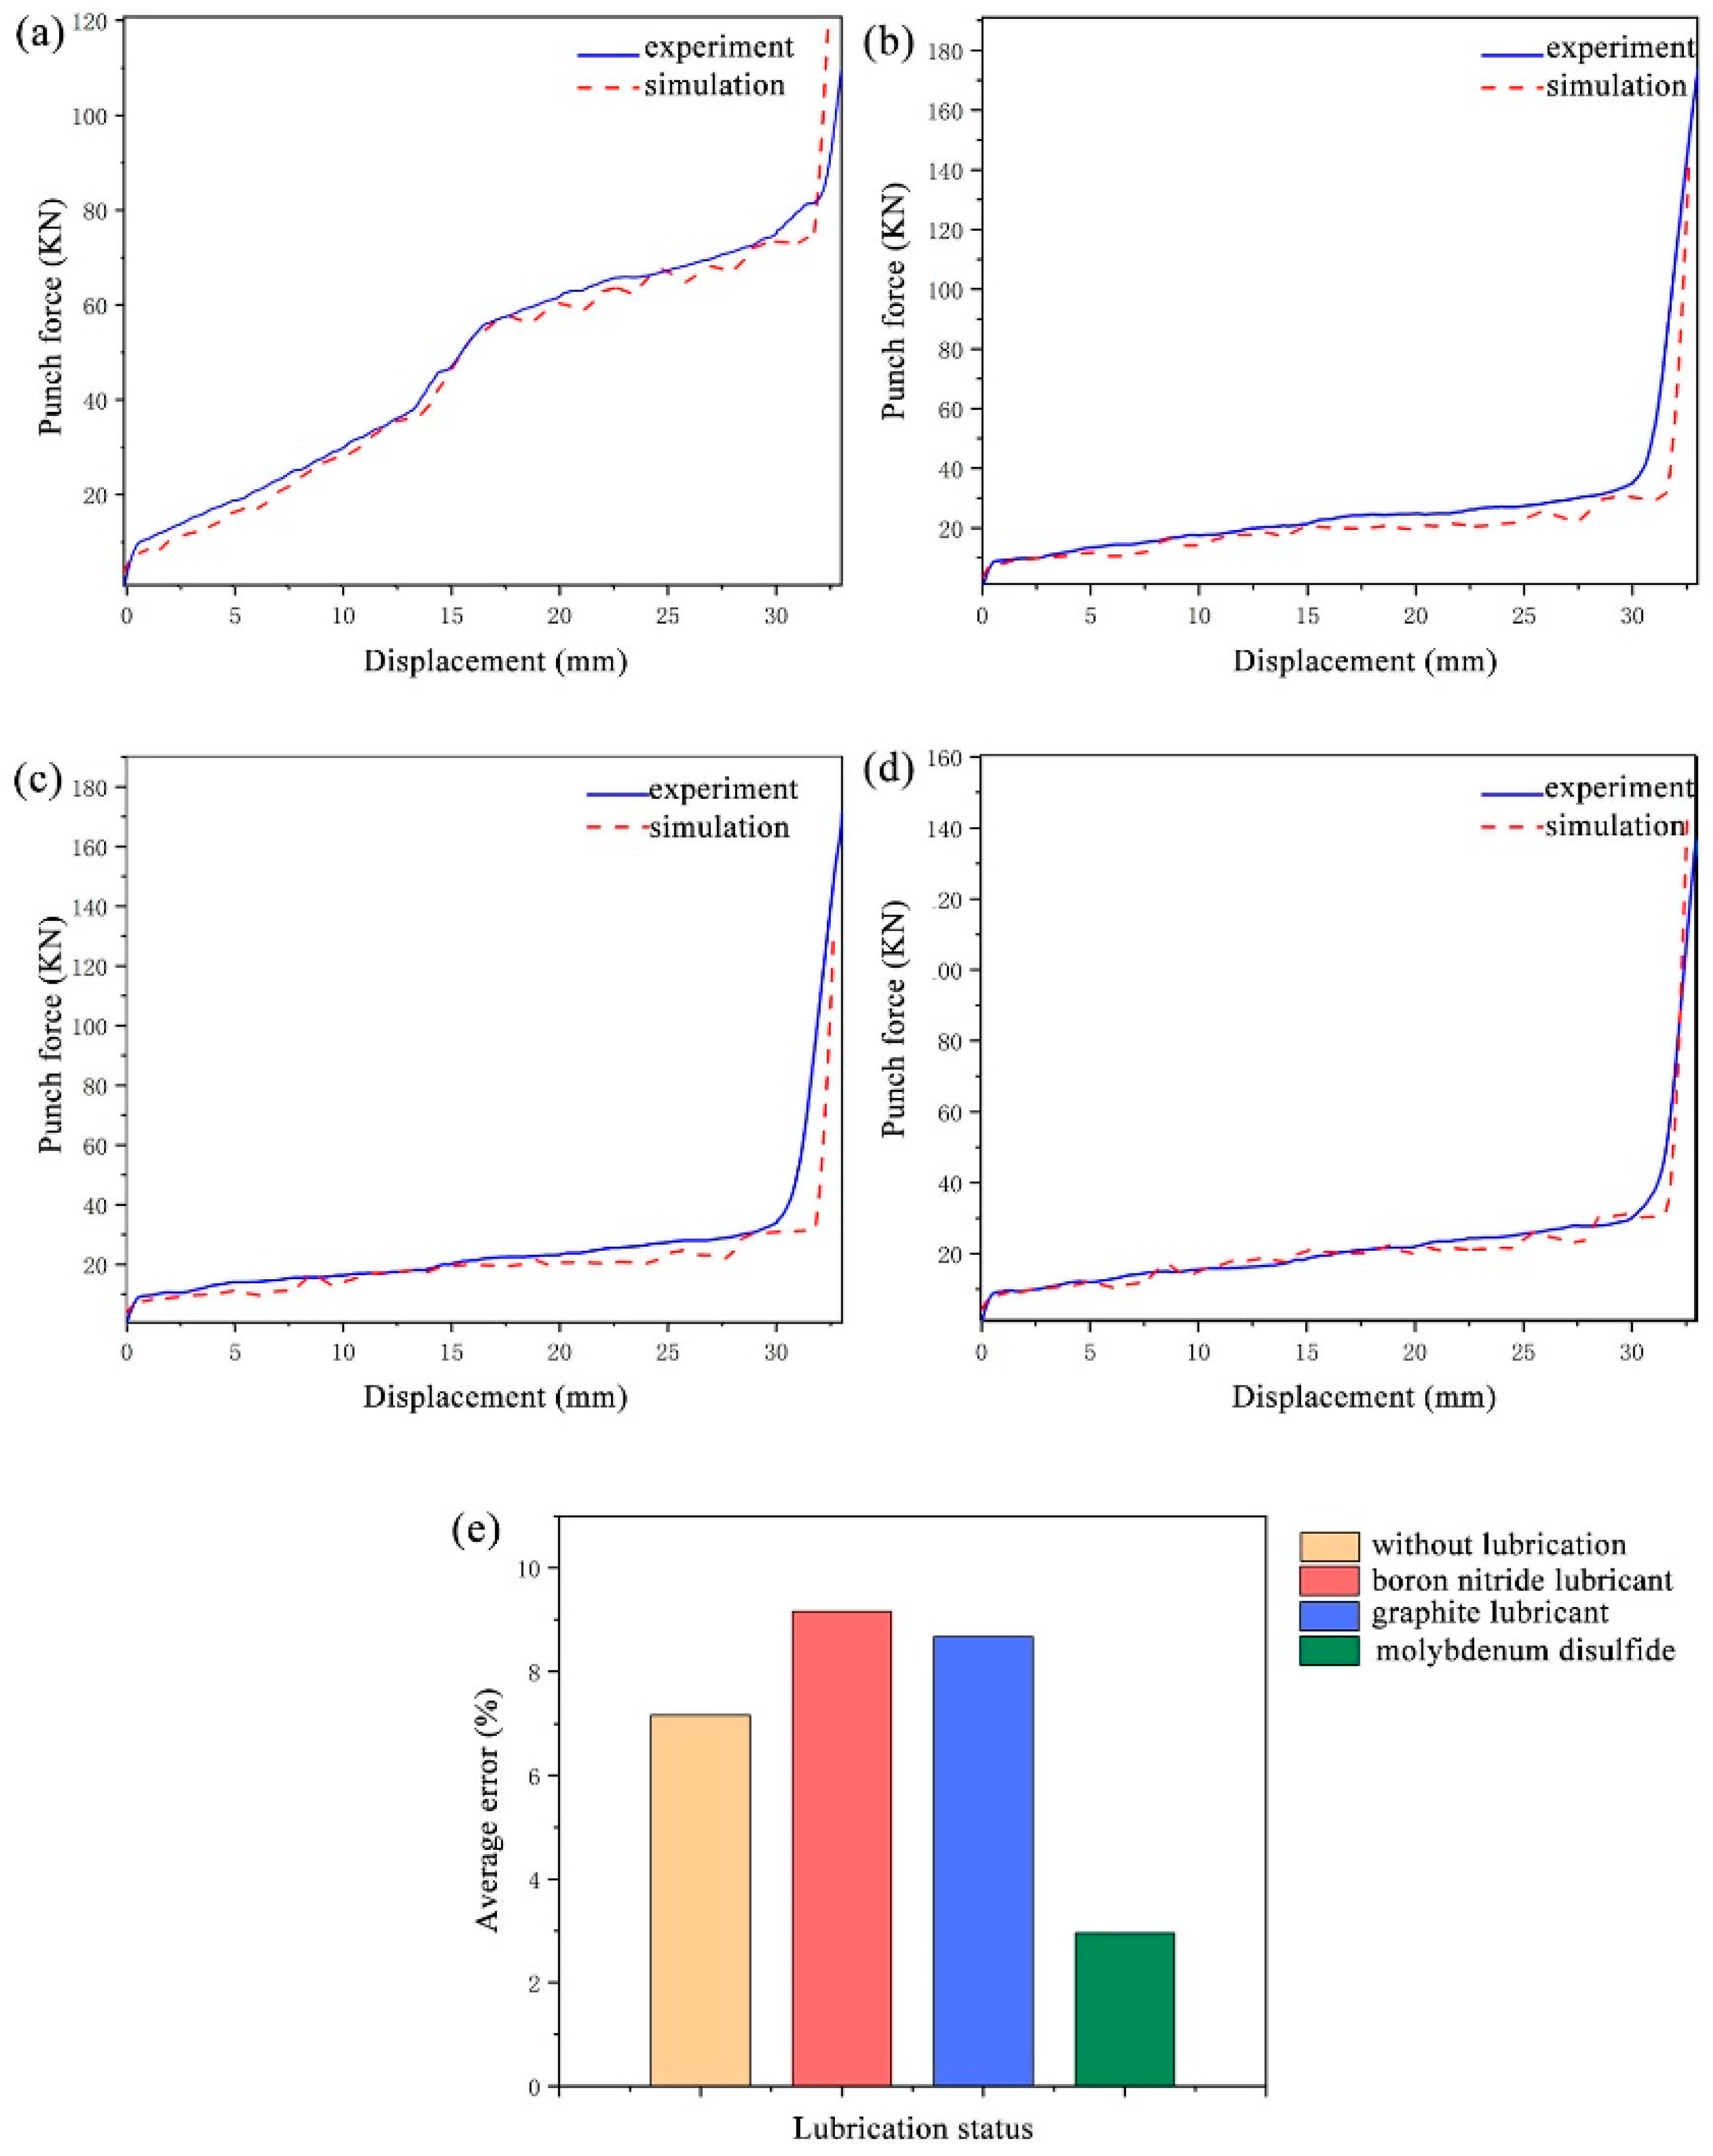
The determined optimal friction coefficient was used to analyze and predict the forming forces and its comparison with the experimental results is shown in Figure 7. The error of the prediction is less than 10%. The simulation results of the whole forming process are in good agreement with the experimental results. There is a larger error near the end of forming due to the larger holding force.
5.2. Surface Quality under Different Lubrication Conditions
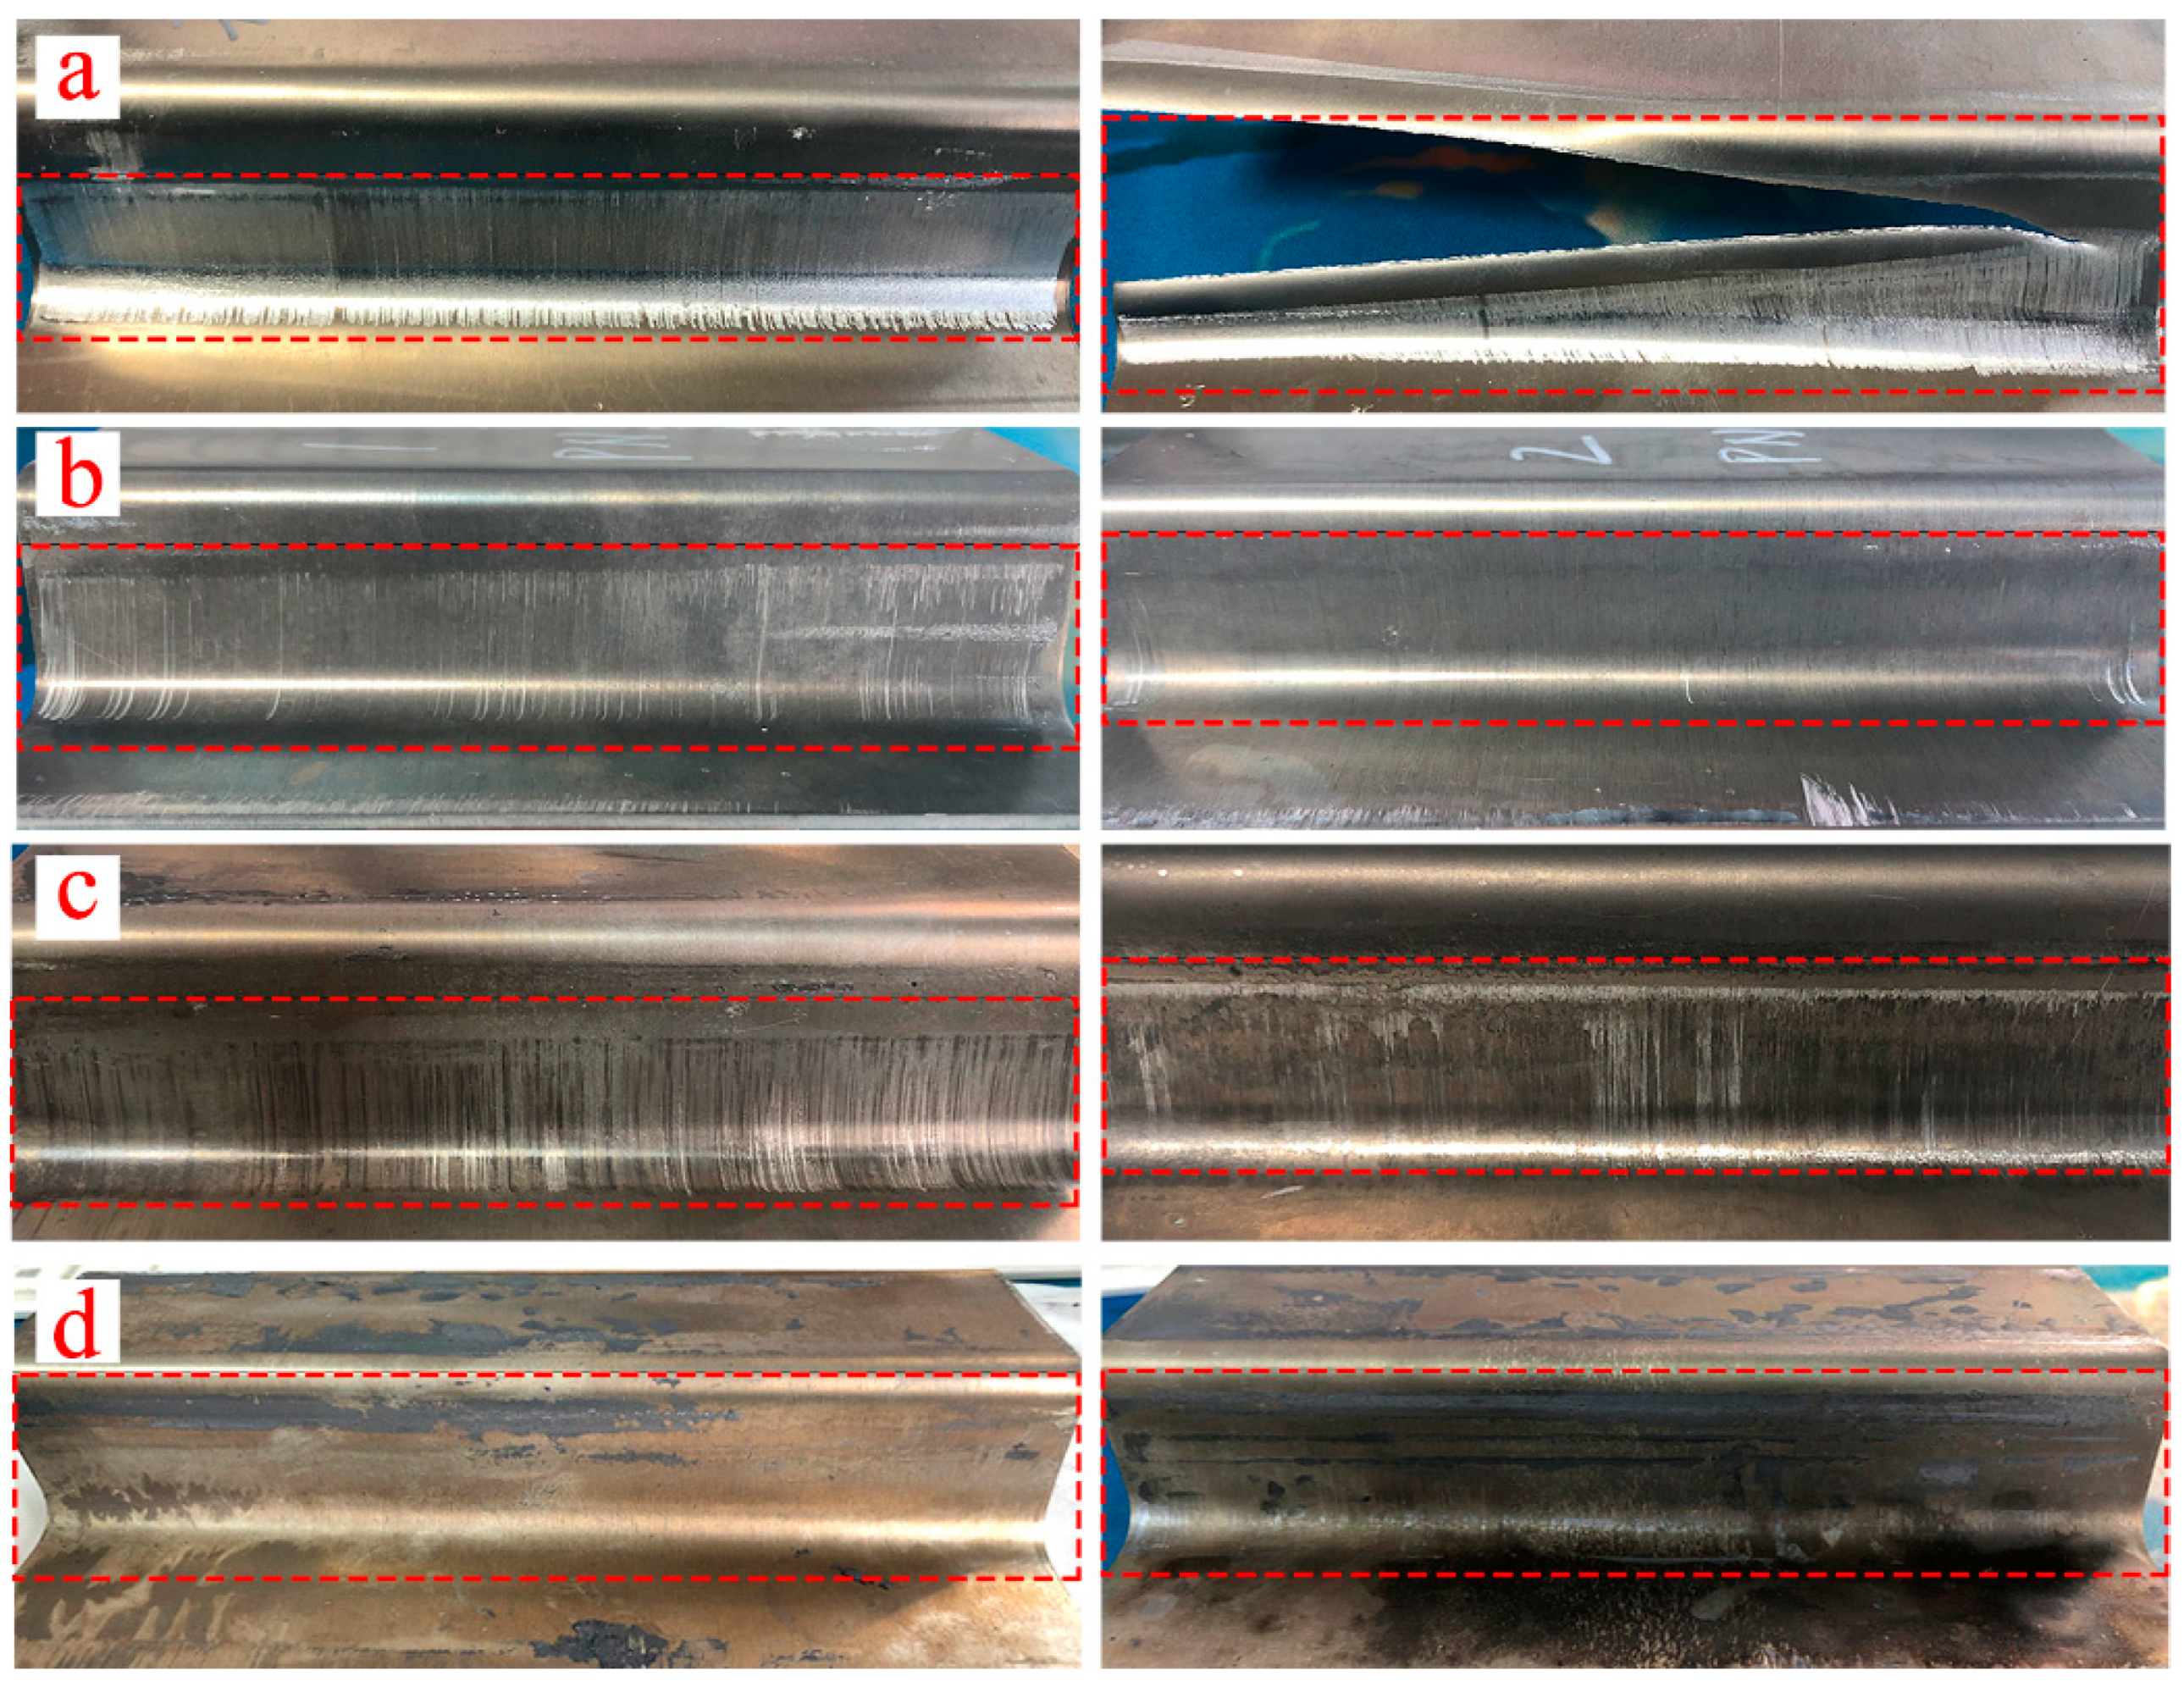
Figure 8 shows the surface morphology of U-shaped part under different lubrication conditions. It can be seen from Figure 8a that one formed part without lubricant has serious scratches at the corner and side wall, while the other part without lubricant has serious cracks during the forming process. The formed parts with boron nitride lubricant have no obvious scratches and cracks, as shown in Figure 8b. There are a few scratches on the side wall and the corner of formed parts using graphite lubricant (Figure 8c). The formed parts with molybdenum disulfide lubricant have no scratch, as shown in Figure 8d. The morphology of the parts show that the lubricating effect of molybdenum disulfide lubricant is better than that of graphite lubricant and boron nitride lubricant.
5.3. Thickness Distribution under Different Lubrication Conditions
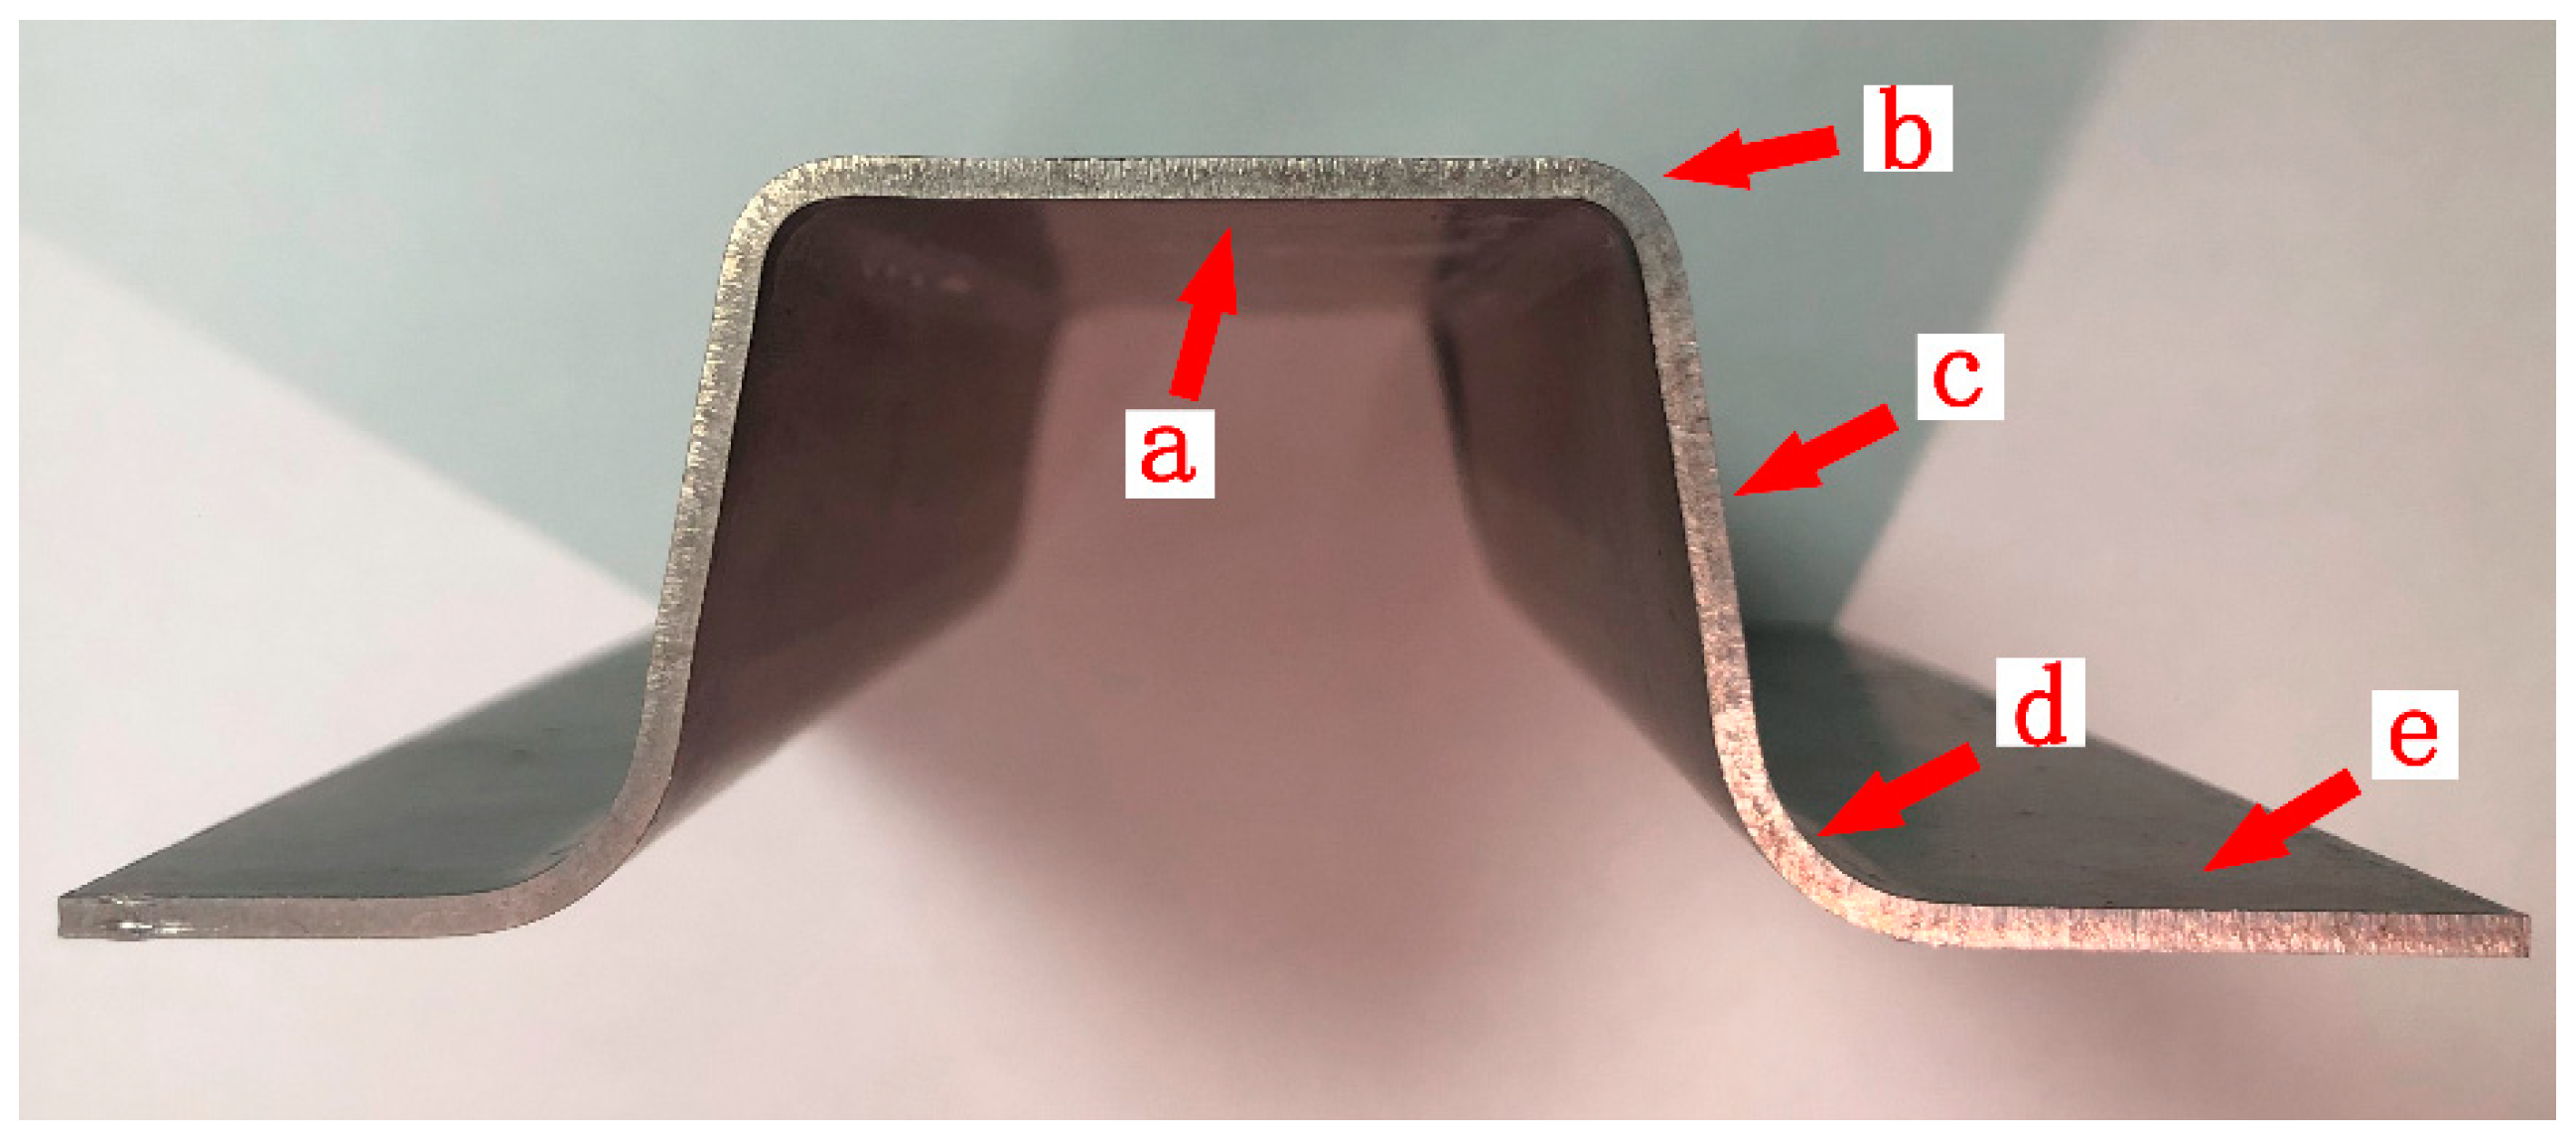
The positions for the thickness measurement on the formed part are shown in Figure 9. The average value of 5 measurements for each position was obtained with spiral micrometer, and the results are shown in Table 6. The thinning of the formed parts is in the punch corner (b), side wall (c), and the die corner (d). There is little thickness change in top surface (a) and flange (e). This is because the deformation of the material during the forming process was concentrated in the corner and side wall areas under the action of the blank holder, and the corner and side wall area was thinned due to the action of friction.
The predicted thickness distribution was basically consistent with the experimental results (Table 6), which indicates that the determined friction coefficient can accurately predict the experimental situation.
5.4. Material Inflow under Different Lubrication Conditions
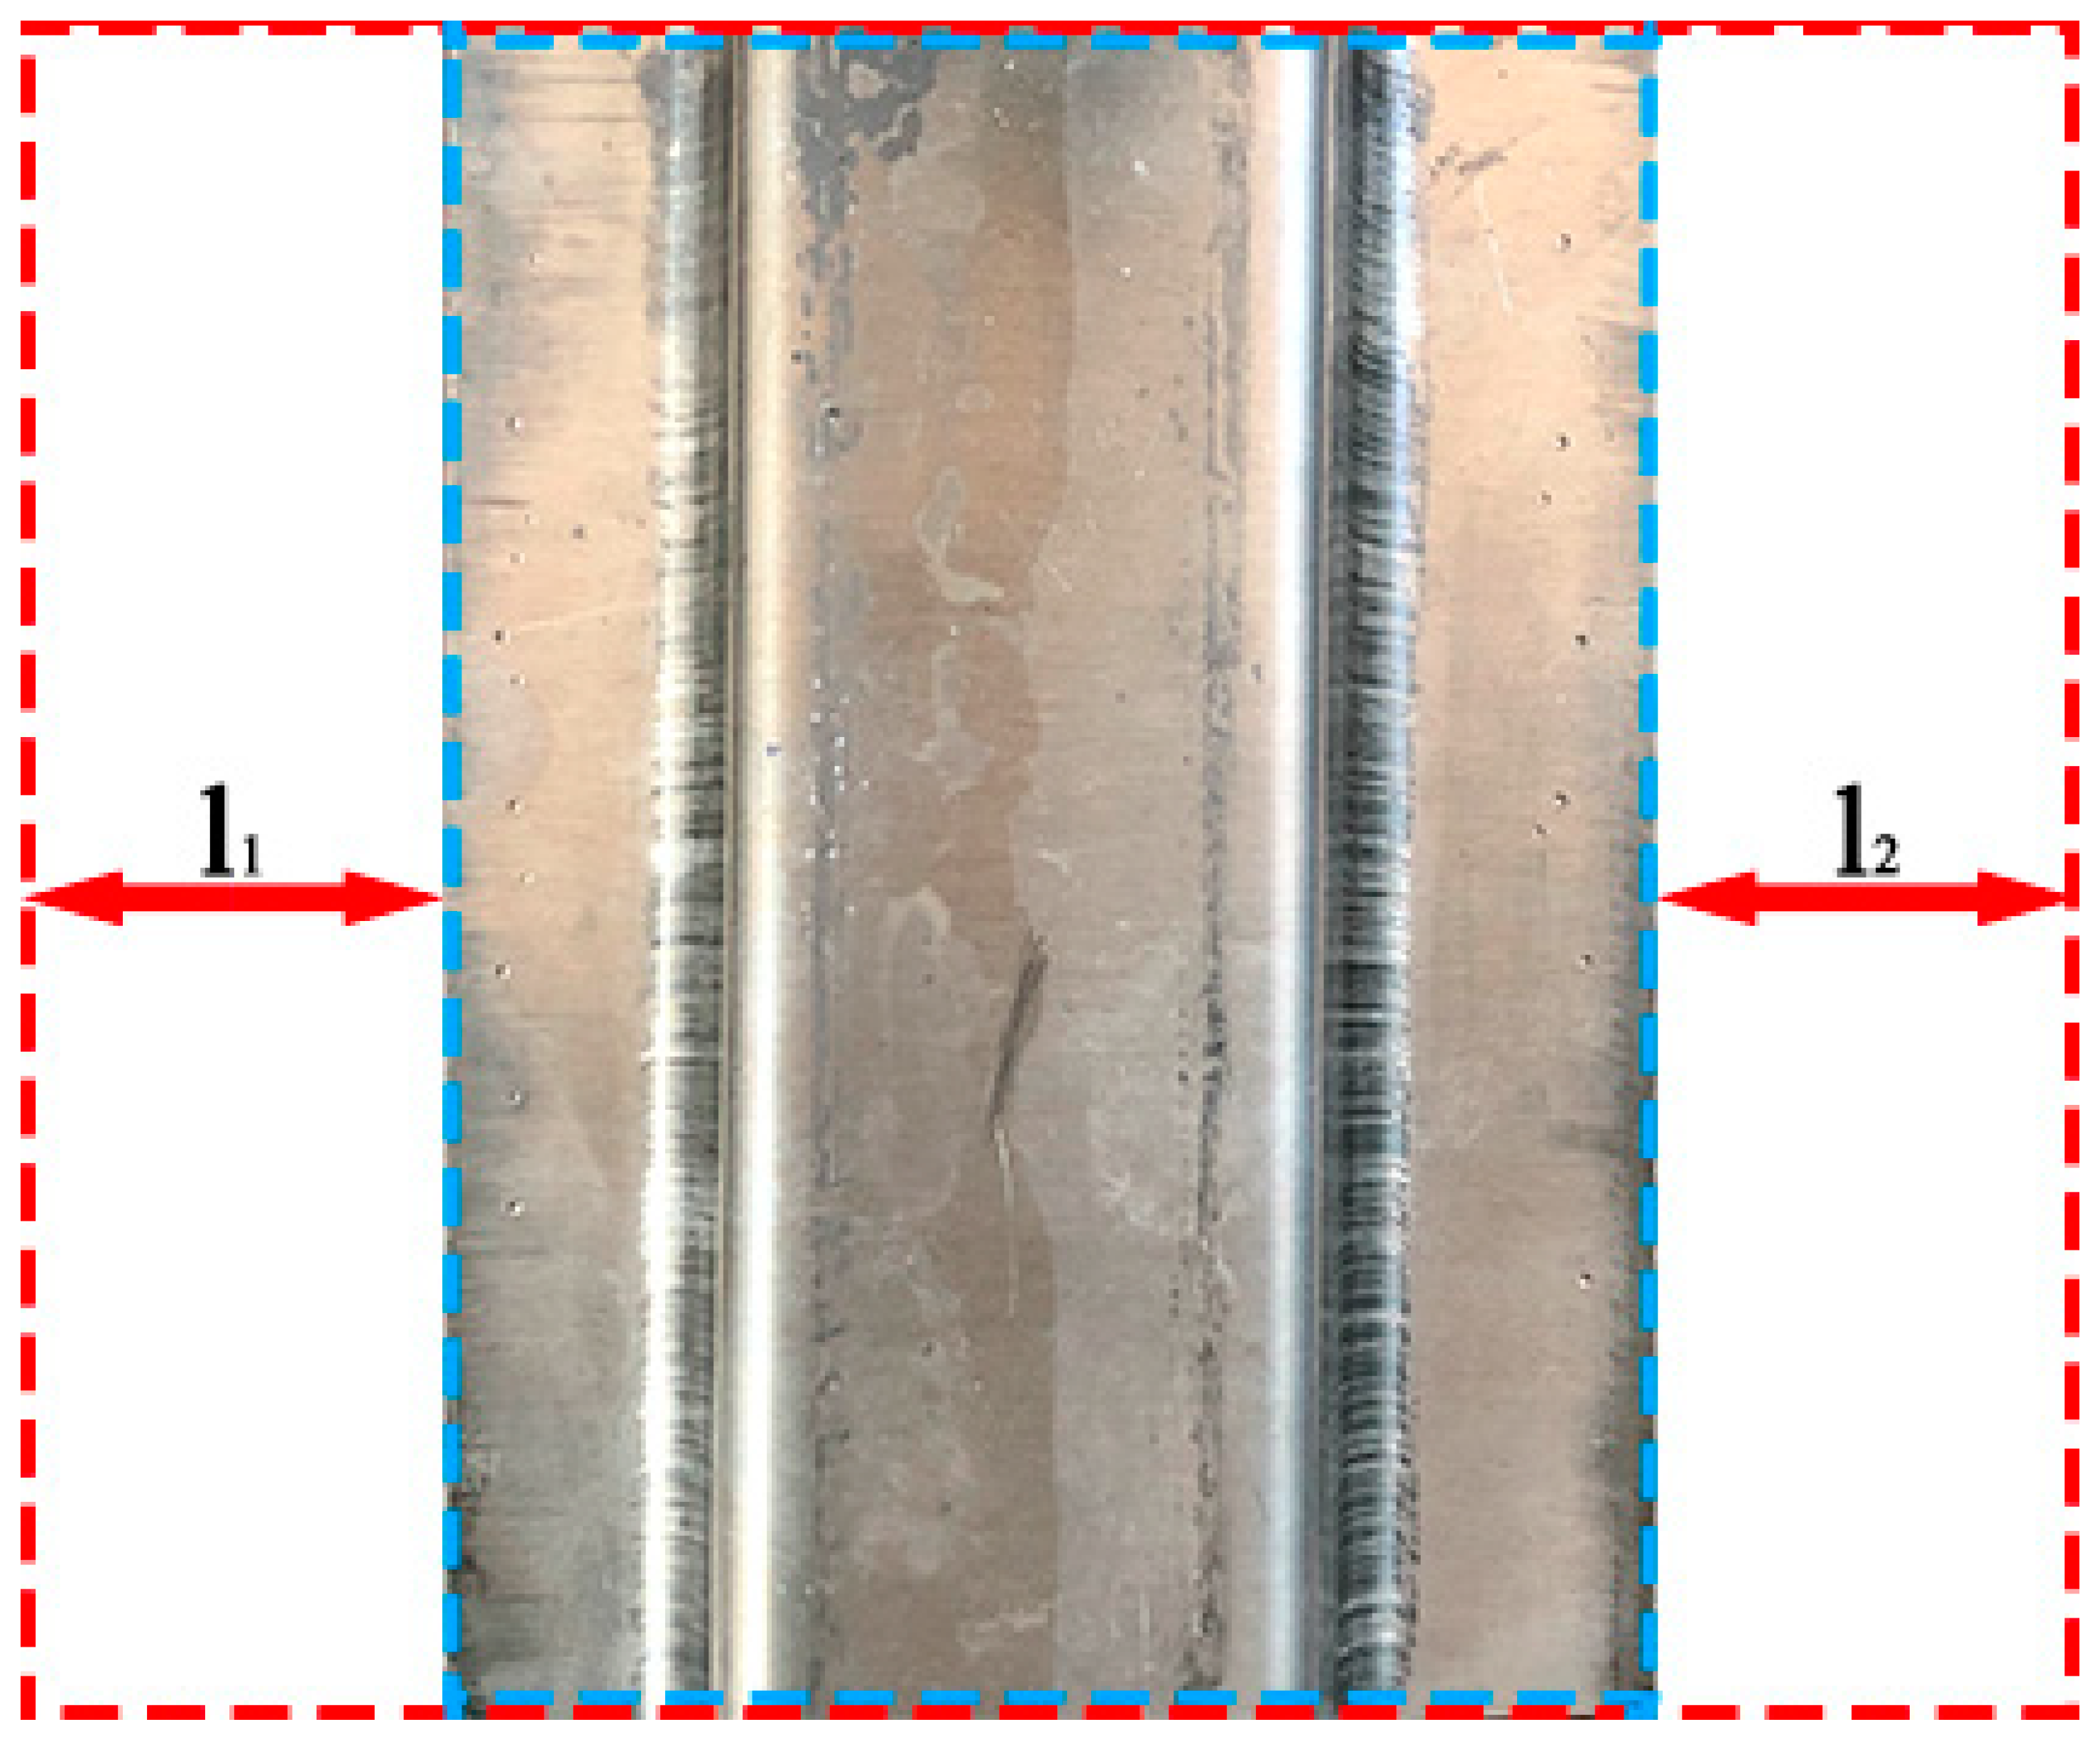
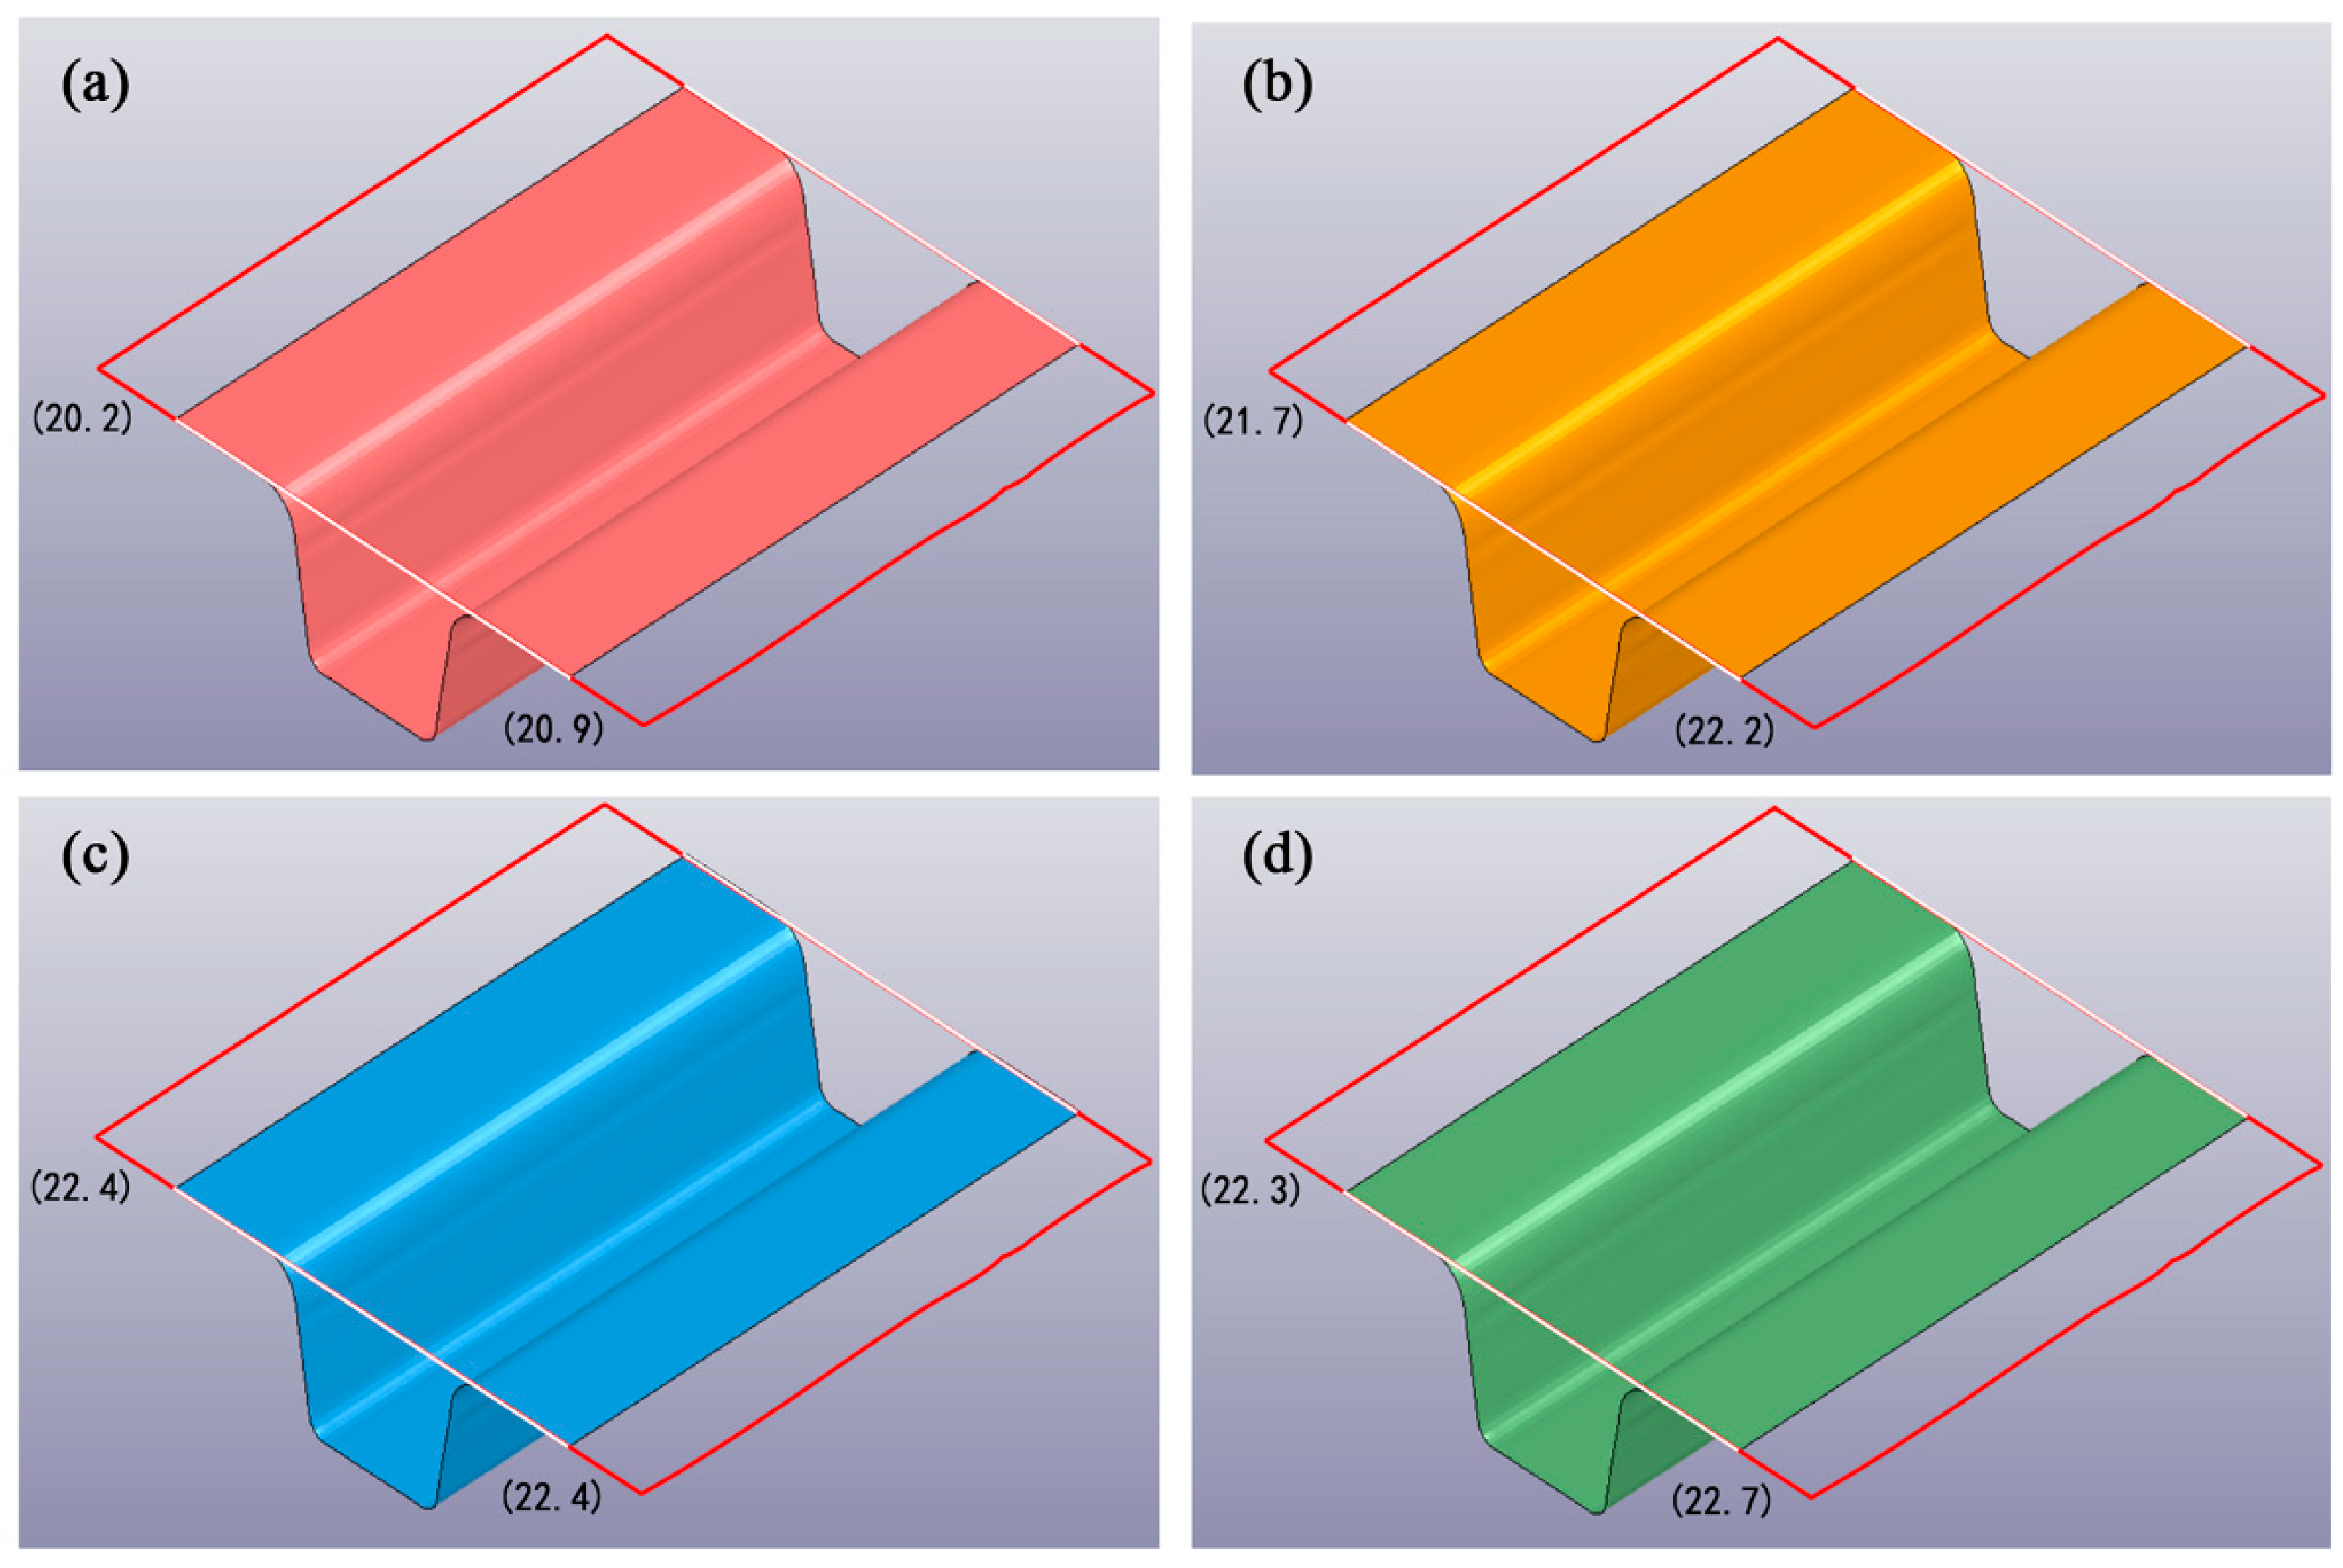
A good lubrication condition can make the material have a greater inflow in the forming process [17]. Figure 10 shows the measurement of material inflow after forming. Five measurements were carried out at different positions, and the average inflow l1 and l2 were calculated. The sheet flows with different lubricants are shown in Figure 11. It can be seen that the inflows of formed part with molybdenum disulfide lubricant are the largest, which is 22.3 mm and 22.7 mm respectively, followed the part with graphite lubricant, which is 22.4 mm and 22.4 mm respectively, and the inflow of boron nitride parts is 21.7 mm and 22.2 mm respectively. The material inflow of no lubricant part is the smallest, which is 20.2 mm and 20.9 mm, respectively.
6. Conclusions
Hot stamping experiments of 7075 aluminum alloy U-shaped parts were carried out with different lubricants, and the effects of different lubricants on forming quality were investigated. The results are as follows:
(1) Without lubricants, the forming force was large, and the parts were easy to crack in the forming process. The use of lubricants could significantly reduce the forming force. Compared with graphite and boron nitride lubricant, molybdenum disulfide lubricant had better lubrication effect on hot stamping of 7075 aluminum alloy.
(2) The friction coefficients under different lubrication conditions were determined by finite element simulation and inverse problem optimization method. By comparing the experimental and simulated results of forming force, thickness distribution, and material inflow, the FEM reverse optimization method could effectively determine the friction coefficient of 7075 aluminum alloy hot forming process.
Author Contributions
X.L. helped perform the analysis with constructive discussions and wrote the manuscript; X.Y. performed the experiments; Z.Z. contributed to the conception of the study; M.R. performed the data analyses; H.J. conducted numerical simulation. All authors have read and agreed to the published version of the manuscript.
Funding
This research was funded by Natural Science Foundation of Jilin Province of China, grant number 20200201056JC.
Institutional Review Board Statement
Not applicable.
Informed Consent Statement
Not applicable.
Data Availability Statement
Not applicable.
Conflicts of Interest
The authors declare no conflict of interest.
References
- Ma, J.; Xu, X.; Zhao, C.; Yan, P. Analysis of characteristics of air pollution during the large-scale smog period in China. J. Hunan Univ. Sci. Technol. 2013, 28, 104–110. [Google Scholar]
- Moon, C.; Thuillier, S.; Lee, J.; Lee, M.-G. Mechanical properties of solution heat treated Al-Zn-Mg-Cu (7075) alloy under different cooling conditions: Analysis with full field measurement and finite element modeling. J. Alloys Compd. 2021, 856, 158–180. [Google Scholar] [CrossRef]
- Chegini, M.; Fallahi, A.; Shaeri, M. Effect of equal channel angular pressing (ECAP) on wear behavior of Al-7075 alloy. Procedia Mater. Sci. 2015, 11, 147–161. [Google Scholar] [CrossRef] [Green Version]
- Huttunen-Saarivirta, E.; Kilpi, L.; Hakala, T.J.; Metsäjoki, J.; Ronkainen, H. Insights into the behaviour of tool steel-aluminium alloy tribo-pair at different temperatures. Tribol. Int. 2018, 119, 567–584. [Google Scholar] [CrossRef]
- Garrett, R.; Lin, J.; Dean, T. Solution heat treatment and cold die quenching in forming AA 6xxx sheet components: Feasibility study. Adv. Mater. Res. 2005, 522, 673–680. [Google Scholar] [CrossRef]
- Kondratiuk, J.; Kuhn, P. Tribological investigation on friction and wear behaviour of coatings for hot sheet metal forming. Wear 2011, 270, 839–849. [Google Scholar] [CrossRef]
- Yang, X.; Zhang, Q.; Zheng, Y.; Liu, X.; Politis, D.J.; El Fakir, O.; Wang, L. Investigation of the friction coefficient evolution and lubricant breakdown behaviour of AA7075 aluminium alloy forming processes at elevated temperatures. Int. J. Extrem. Manuf. 2021, 3, 8–47. [Google Scholar] [CrossRef]
- Liu, Y.; Zhu, Z.; Wang, Z.; Zhu, B.; Wang, Y.; Zhang, Y. Flow and friction behaviors of 6061 aluminum alloy at elevated temperatures and hot stamping of a B-pillar. Int. J. Adv. Manuf. Technol. 2018, 96, 4063–4083. [Google Scholar] [CrossRef]
- Marzouki, M.; Kowandy, C.; Richard, C. Experimental simulation of tool/product interface during hot drawing. Wear 2007, 262, 235–241. [Google Scholar] [CrossRef]
- Li, G.; Long, X.; Yang, P.; Zhongkai, L. Advance on friction of stamping forming. Int. J. Adv. Manuf. Technol. 2018, 96, 21–38. [Google Scholar] [CrossRef]
- Ghiotti, A.; Simonetto, E.; Bruschi, S. Influence of process parameters on tribological behavior of 7075 in hot stamping. Wear 2019, 426–427, 348–356. [Google Scholar] [CrossRef]
- Żaba, K.; Kita, P.; Nowosielski, M.; Kwiatkowski, M.; Madej, M. Influence of lubricants on wear resistance of aluminium alloy strips series 2XXX. Arch. Metall. Mater. 2015, 60, 1833–1837. [Google Scholar] [CrossRef] [Green Version]
- Mulder, J.; Vegter, H.; Aretz, H.; Keller, S.; Boogaard, A.V.D. Accurate determination of flow curves using the bulge test with optical measuring systems. J. Mater. Process. Technol. 2015, 226, 169–187. [Google Scholar] [CrossRef]
- Williams, P. Studies in Large Plastic Flow and Fracture: With Special Emphasis on the Effects of Hydrostatic Pressure; Harvard University Press: Cambridge, MA, USA, 1964. [Google Scholar]
- Barlat, F.; Becker, R.; Hayashida, Y.; Maeda, Y.; Yanagawa, M.; Chung, K.; Brem, J.C.; Lege, D.J.; Matsui, K.; Murtha, S.J.; et al. Yielding description for solution strengthened aluminum alloys. Int. J. Plast. 1997, 13, 385–401. [Google Scholar] [CrossRef]
- Barlat, F.; Becker, R.C.; Hayashida, Y.; Maeda, Y.; Yanagawa, M.; Chung, K.; Brem, J.C.; Lege, D.J.; Matsui, K.; Murtha, S.J.; et al. Plane stress yield function for aluminum alloy sheets—Part 1: Theory. Int. J. Plast. 2003, 19, 1297–1319. [Google Scholar] [CrossRef]
- Barlat, F.; Maeda, Y.; Chung, K.; Yanagawa, M.; Brem, J.; Hayashida, Y.; Lege, D.; Matsui, K.; Murtha, S.; Hattori, S.; et al. Yield function development for aluminum alloy sheets. J. Mech. Phys. Solids 1997, 45, 1727–1763. [Google Scholar] [CrossRef]
Figure 1.
Geometry of the tensile specimen (mm).

Figure 2.
True stress-strain curves of different strain rates (a) and temperatures (b).

Figure 3.
Set up of the U-shaped tools (a) Physical picture; (b) 3D model.

Figure 4.
YLD2000-2d yield trajectory of 7075 aluminum alloy.

Figure 5.
Mesh model.

Figure 6.
Force–displacement curves under different lubrication conditions.

Figure 7.
Comparison of experimental and predicted force–displacement curves. (a) No lubrication; (b) Boron nitride lubricant; (c) Graphite lubricant; (d) Molybdenum disulfide lubricant; (e) Curve fitting error.
Figure 7.
Comparison of experimental and predicted force–displacement curves. (a) No lubrication; (b) Boron nitride lubricant; (c) Graphite lubricant; (d) Molybdenum disulfide lubricant; (e) Curve fitting error.

Figure 8.
U-shaped parts of different lubrication conditions: (a) No lubricant; (b) Boron nitride lubricant; (c) Graphite lubricant; (d) Molybdenum disulfide lubricant.
Figure 8.
U-shaped parts of different lubrication conditions: (a) No lubricant; (b) Boron nitride lubricant; (c) Graphite lubricant; (d) Molybdenum disulfide lubricant.

Figure 9.
Thickness measurement position.

Figure 10.
Measurement of material inflow after forming (red line is initial blank outline, blue line is the boundary outline formed part). l1, l2: material inflow.
Figure 10.
Measurement of material inflow after forming (red line is initial blank outline, blue line is the boundary outline formed part). l1, l2: material inflow.

Figure 11.
Material inflow of formed parts with different lubrication conditions (mm): (a) No lubricant; (b) Boron nitride lubricant; (c) Graphite lubricant; (d) Molybdenum disulfide lubricant.
Figure 11.
Material inflow of formed parts with different lubrication conditions (mm): (a) No lubricant; (b) Boron nitride lubricant; (c) Graphite lubricant; (d) Molybdenum disulfide lubricant.


Table 1.
Chemical composition of 7075 aluminum alloy (from the supplier).
| Element | Si | Fe | Cu | Mn | Mg | Cr | Zn | Ti | Al |
|---|---|---|---|---|---|---|---|---|---|
| Wt.% | <0.4 | <0.5 | 1.2–2.0 | <0.3 | 2.1–2.9 | 0.18–0.28 | 5.1–6.1 | <0.20 | Balance |
Table 2.
Anisotropy coefficient (r) and yield strength (σyld) at 400 °C.
| Sampling Direction | ||
|---|---|---|
| 0° | 45 | 0.69 |
| 45° | 45 | 0.81 |
| 90° | 46 | 0.81 |
Table 3.
YLD2000-2d yield criterion parameters of 7075 aluminum alloy.
| 0.969 | 0.979 | 0.979 | 0.998 | 1.017 | 1.000 | 0.998 | 1.052 | 8 | |
Table 4.
Physical and thermal parameters of the blank and tools (400 °C).
| Material | ρ (kg/m3) | E (GPa) | ν | Cp (J/kg·K) | W (W/m·K) |
|---|---|---|---|---|---|
| H13 | 7880 | 210 | 0.30 | 460 | 24 |
| 7075 | 2810 | 70 | 0.33 | 1128 | 143 |
Table 5.
Calibrated friction coefficient FS and FD.
| Lubrication Condition | Static Friction Coefficient (FS) | Dynamic Friction Coefficient (FD) |
|---|---|---|
| No Lubricant | 0.450 | 0.290 |
| boron nitride | 0.163 | 0.143 |
| graphite | 0.154 | 0.140 |
| molybdenum disulfide | 0.144 | 0.138 |
Table 6.
Average thickness distribution of parts for experiments and simulations (mm).
| lubricant | Results | Top Surface | Punch Corner | Side Wall | Die Corner | Flange |
|---|---|---|---|---|---|---|
| Non-lubricant | simulation | 2.000 | 1.881 | 1.905 | 1.893 | 2.000 |
| experiment | 2.000 | 1.880 | 1.900 | 1.890 | 2.000 | |
| Boron nitride | simulation | 2.000 | 1.932 | 1.939 | 1.941 | 2.000 |
| experiment | 2.000 | 1.930 | 1.940 | 1.940 | 2.000 | |
| Graphite | simulation | 2.000 | 1.938 | 1.961 | 1.952 | 2.000 |
| experiment | 2.000 | 1.940 | 1.960 | 1.950 | 2.000 | |
| Molybdenum disulfide | simulation | 2.000 | 1.973 | 1.971 | 1.962 | 2.000 |
| experiment | 2.000 | 1.960 | 1.970 | 1.960 | 2.000 |
Publisher’s Note: MDPI stays neutral with regard to jurisdictional claims in published maps and institutional affiliations. |
© 2021 by the authors. Licensee MDPI, Basel, Switzerland. This article is an open access article distributed under the terms and conditions of the Creative Commons Attribution (CC BY) license (https://creativecommons.org/licenses/by/4.0/).
Share and Cite
MDPI and ACS Style
Li, X.; Yan, X.; Zhang, Z.; Ren, M.; Jia, H. Determination of Hot Stamping Friction Coefficient of 7075 Aluminum. Metals 2021, 11, 1111. https://doi.org/10.3390/met11071111
AMA Style
Li X, Yan X, Zhang Z, Ren M, Jia H. Determination of Hot Stamping Friction Coefficient of 7075 Aluminum. Metals. 2021; 11(7):1111. https://doi.org/10.3390/met11071111
Chicago/Turabian StyleLi, Xiangji, Xu Yan, Zhiqiang Zhang, Mingwen Ren, and Hongjie Jia. 2021. "Determination of Hot Stamping Friction Coefficient of 7075 Aluminum" Metals 11, no. 7: 1111. https://doi.org/10.3390/met11071111
Note that from the first issue of 2016, this journal uses article numbers instead of page numbers. See further details here.