Effect of Microstructure on Post-Rolling Induction Treatment in a Low C Ti-Mo Microalloyed Steel


1
CEIT, Materials and Manufacturing Division, 20018 San Sebastian, Basque Country, Spain
2
Universidad de Navarra, Tecnun, Mechanical and Materials Engineering Department, 20018 San Sebastian, Basque Country, Spain
*
Author to whom correspondence should be addressed.
Metals 2018, 8(9), 694; https://doi.org/10.3390/met8090694
Submission received: 18 July 2018
/
Revised: 30 August 2018
/
Accepted: 1 September 2018
/
Published: 4 September 2018
(This article belongs to the Special Issue Advances in Microalloyed Steels)
Abstract
:Cost-effective advanced design concepts are becoming more common in the production of thick plates in order to meet demanding market requirements. Accordingly, precipitation strengthening mechanisms are extensively employed in thin strip products, because they enhance the final properties by using a coiling optimization strategy. Nevertheless, and specifically for thick plate production, the formation of effective precipitation during continuous cooling after hot rolling is more challenging. With the aim of gaining further knowledge about this strengthening mechanism, plate hot rolling conditions were reproduced in low carbon Ti-Mo microalloyed steel through laboratory simulation tests to generate different hot-rolled microstructures. Subsequently, a rapid heating process was applied in order to simulate induction heat treatment conditions. The results indicated that the nature of the matrix microstructure (i.e., ferrite, bainite) affects the achieved precipitation hardening, while the balance between strength and toughness depends on the hot-rolled microstructure.
1. Introduction
In the recent years, suitable thermomechanical sequences combined with advanced microalloying concepts have been developed to fulfill the demanding market requirements in terms of tensile and toughness properties. The addition of microalloying elements, such as Nb, Mo, Ti and V ensures the improvement of final mechanical properties. For the conventional High Strength Low Alloy (HSLA) steels, yield strength values of approximately 400–500 MPa can be achieved through a combination of strengthening contributions from solid solution, grain size, dislocation density and fine precipitation properties [1,2]. However, the hardening due to fine precipitation is not relevant for conventional HSLA steels. In recent years, combinations of Ti and Mo have been proposed for when higher yield strength values are required (higher than 700 MPa). Ti-Mo microalloyed steels offer excellent tensile properties and ductility balance, due to the formation of nanometer-sized carbides in the ferritic soft matrix [3]. A strategy for effective precipitation during cooling can promote an enhancement of approximately 300 MPa [4,5]. Therefore, significant effort has been dedicated to optimizing the cooling strategy, which ensures the formation of fine precipitates with a considerable hardening effect. Several works have investigated the influence of coiling strategies in the final tensile properties for thin strip products with the aim of selecting a coiling temperature that promotes additional precipitation hardening [2,5,6]. Conversely, the formation of fine precipitates during continuous cooling after plate hot rolling is not as effective as in coiled products [7]. In the current study, in order to take advantage of the microalloying elements that are available after hot rolling and cooling steps, a post-hot rolling induction heat treatment cycle after hot rolling is proposed for different microstructures. Even though the tensile property improvement caused by induction heat treatment for bainitic microstructures is clear, the benefits of using induction heating for ferritic microstructures is still unknown [8,9,10]. For the purpose of generating different pre-treatment microstructures (ferritic, ferritic/bainitic, and bainitic), the reproduction of plate hot rolling was carried out by plane compression tests. Finally, induction heat treatment was simulated for each microstructure. Specimens for tensile and Charpy tests were machined for each condition. This allowed us to conclude that a considerable strengthening contribution occurs after induction heat treatment for pre-treatment microstructures that is associated with the formation of nanosized precipitates during heat treatment. In the current analysis, the interactions between microstructure, tensile properties, and induction heating were evaluated. Furthermore, the influence of the mentioned tensile property enhancement on toughness properties was also studied for ferritic and bainitic microstructure types obtained before induction treatment.
2. Materials and Methods
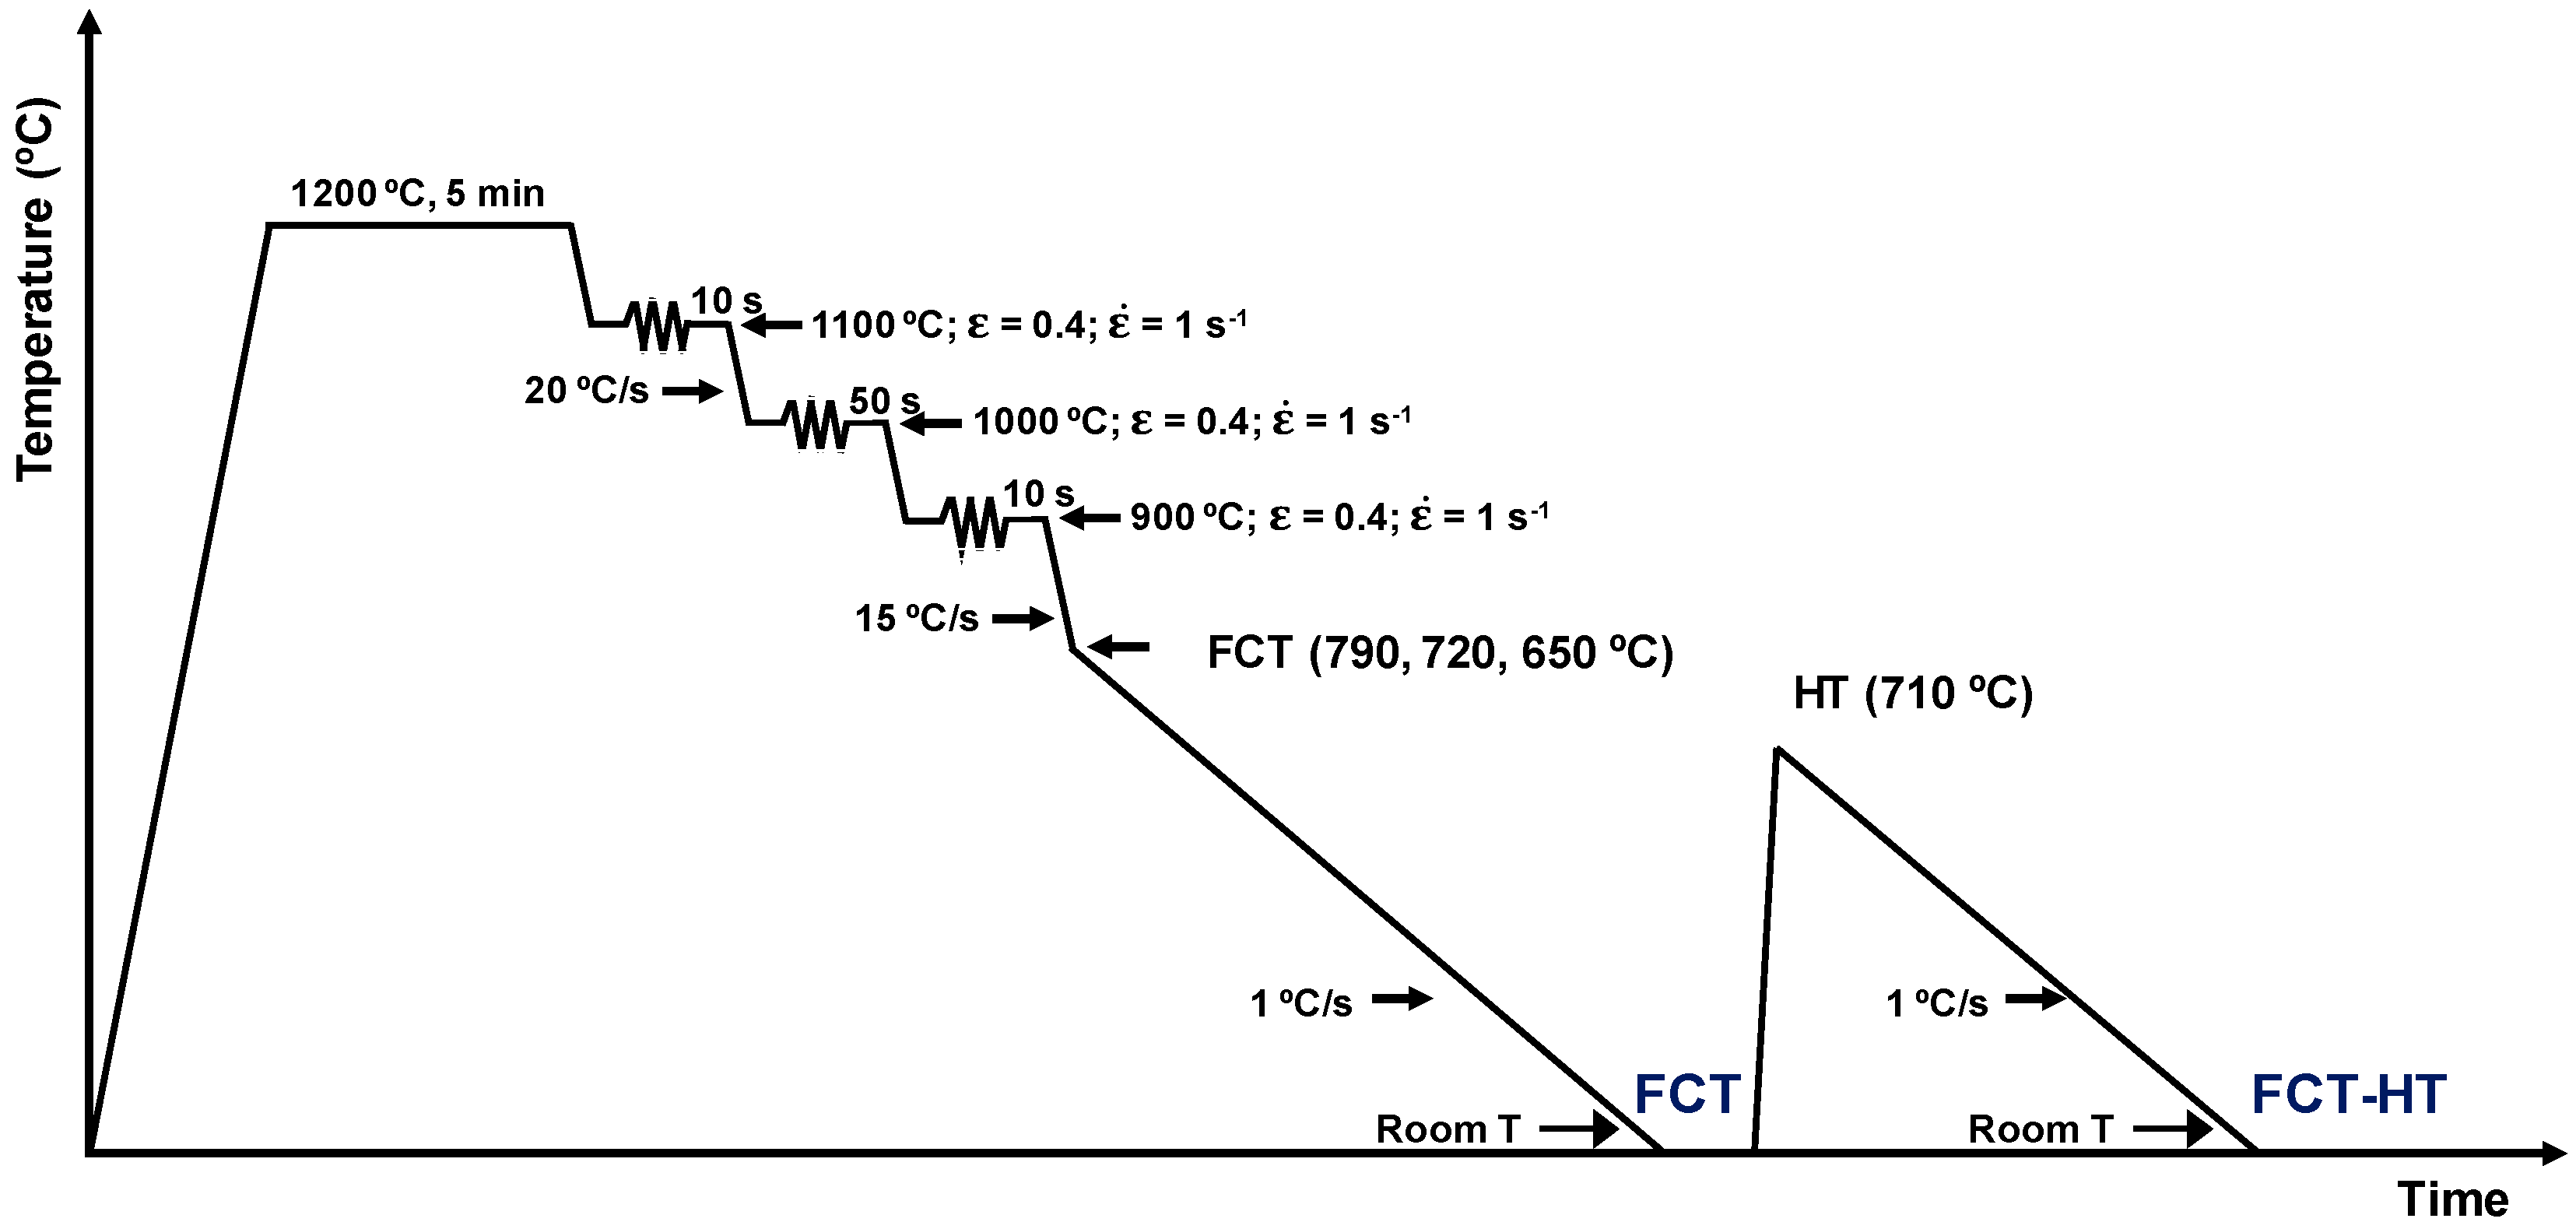
In the current study, a low carbon steel microalloyed with titanium and molybdenum is selected. Its chemical composition is shown in Table 1. Plane strain compression tests were carried out following the thermomechanical schedule presented in Figure 1. The cycle included a reheating step of 5 min at 1200 °C, followed by a multipass deformation sequence. The first two deformations (ε = 0.4) were applied at 1100 and 1000 °C, with the aim of obtaining a fine recrystallized austenite. Then, a deformation was applied at 900 °C (ε = 0.4), below the non-recrystallization temperature, in order to ensure the accumulation of deformation in the austenite before transformation. Next, the specimens were cooled down at a rate of 15 °C/s to temperatures designated as the “Fast Cooling Temperatures” (FCTs; 790, 720, and 650 °C) with the purpose of generating different types of microstructures (ferritic, ferritic/bainitic, and bainitic, respectively). Then, the samples were cooled down slowly to room temperature at 1 °C/s. After the simulation of plate hot rolling, an induction heat treatment was applied by fast heating up to a treatment temperature of 710 °C with no holding time. Finally, the samples were cooled down to room temperature at 1 °C/s. The samples obtained after the plate hot rolling simulation (without heat treatment) were designated as FCT, while the induction heated specimens were designated as FCT-HT.
In the plane compression specimens, the strain was heterogeneously distributed throughout the thickness owing to friction and sample geometry. In order to minimize the strain gradients, the characterization of the microstructure was performed at the central parts of the plane compression specimens [11]. In addition to the microstructural sample, specimens for tensile and Charpy tests were machined for each condition. The general microstructural characterization was performed by optical microscopy (OM, LEICA DMI5000 M, Leica Microsystems, Wetzlar, Germany) after etching in 2% Nital. More detailed analyses of microstructural features were carried out by field-emission gun scanning electron microscopy (FEGSEM, JEOL JSM-7000F, JEOL Ltd., Tokyo, Japan). In order to quantify the crystallographic unit size and evaluate dislocation densities, electron backscattered diffraction (EBSD) analysis was performed under each condition by means of a Philips XL 30CP SEM with W filament (TexSEM Laboratories, Draper, UT, USA). The EBSD sample preparation was based on a polishing down to 1 µm (using diamond liquids of 6, 3 and 1 µm), followed by a final polishing using colloidal silica. A step size of 0.4 µm was employed in the EBSD analysis, and an area of 200 × 200 µm2 was scanned. TSL OIMTM Analysis 5.31TM software (EDAX, Mahwah, NJ, USA) was used for data processing. Finally, the study of fine precipitates was carried out by transmission electron microscopy (TEM, JEOL 2100, JEOL Ltd., Tokyo, Japan), characterized by a voltage of 200 kV and a thermionic filament of LaB6. In order to obtain accurate information regarding fine precipitation, several electropolished thin foils were characterized for each condition. Precipitate size measurement was performed based on at least 25 TEM images and resulting in the formation of a number of precipitates between 120 and 600, depending on the precipitate density for each case.
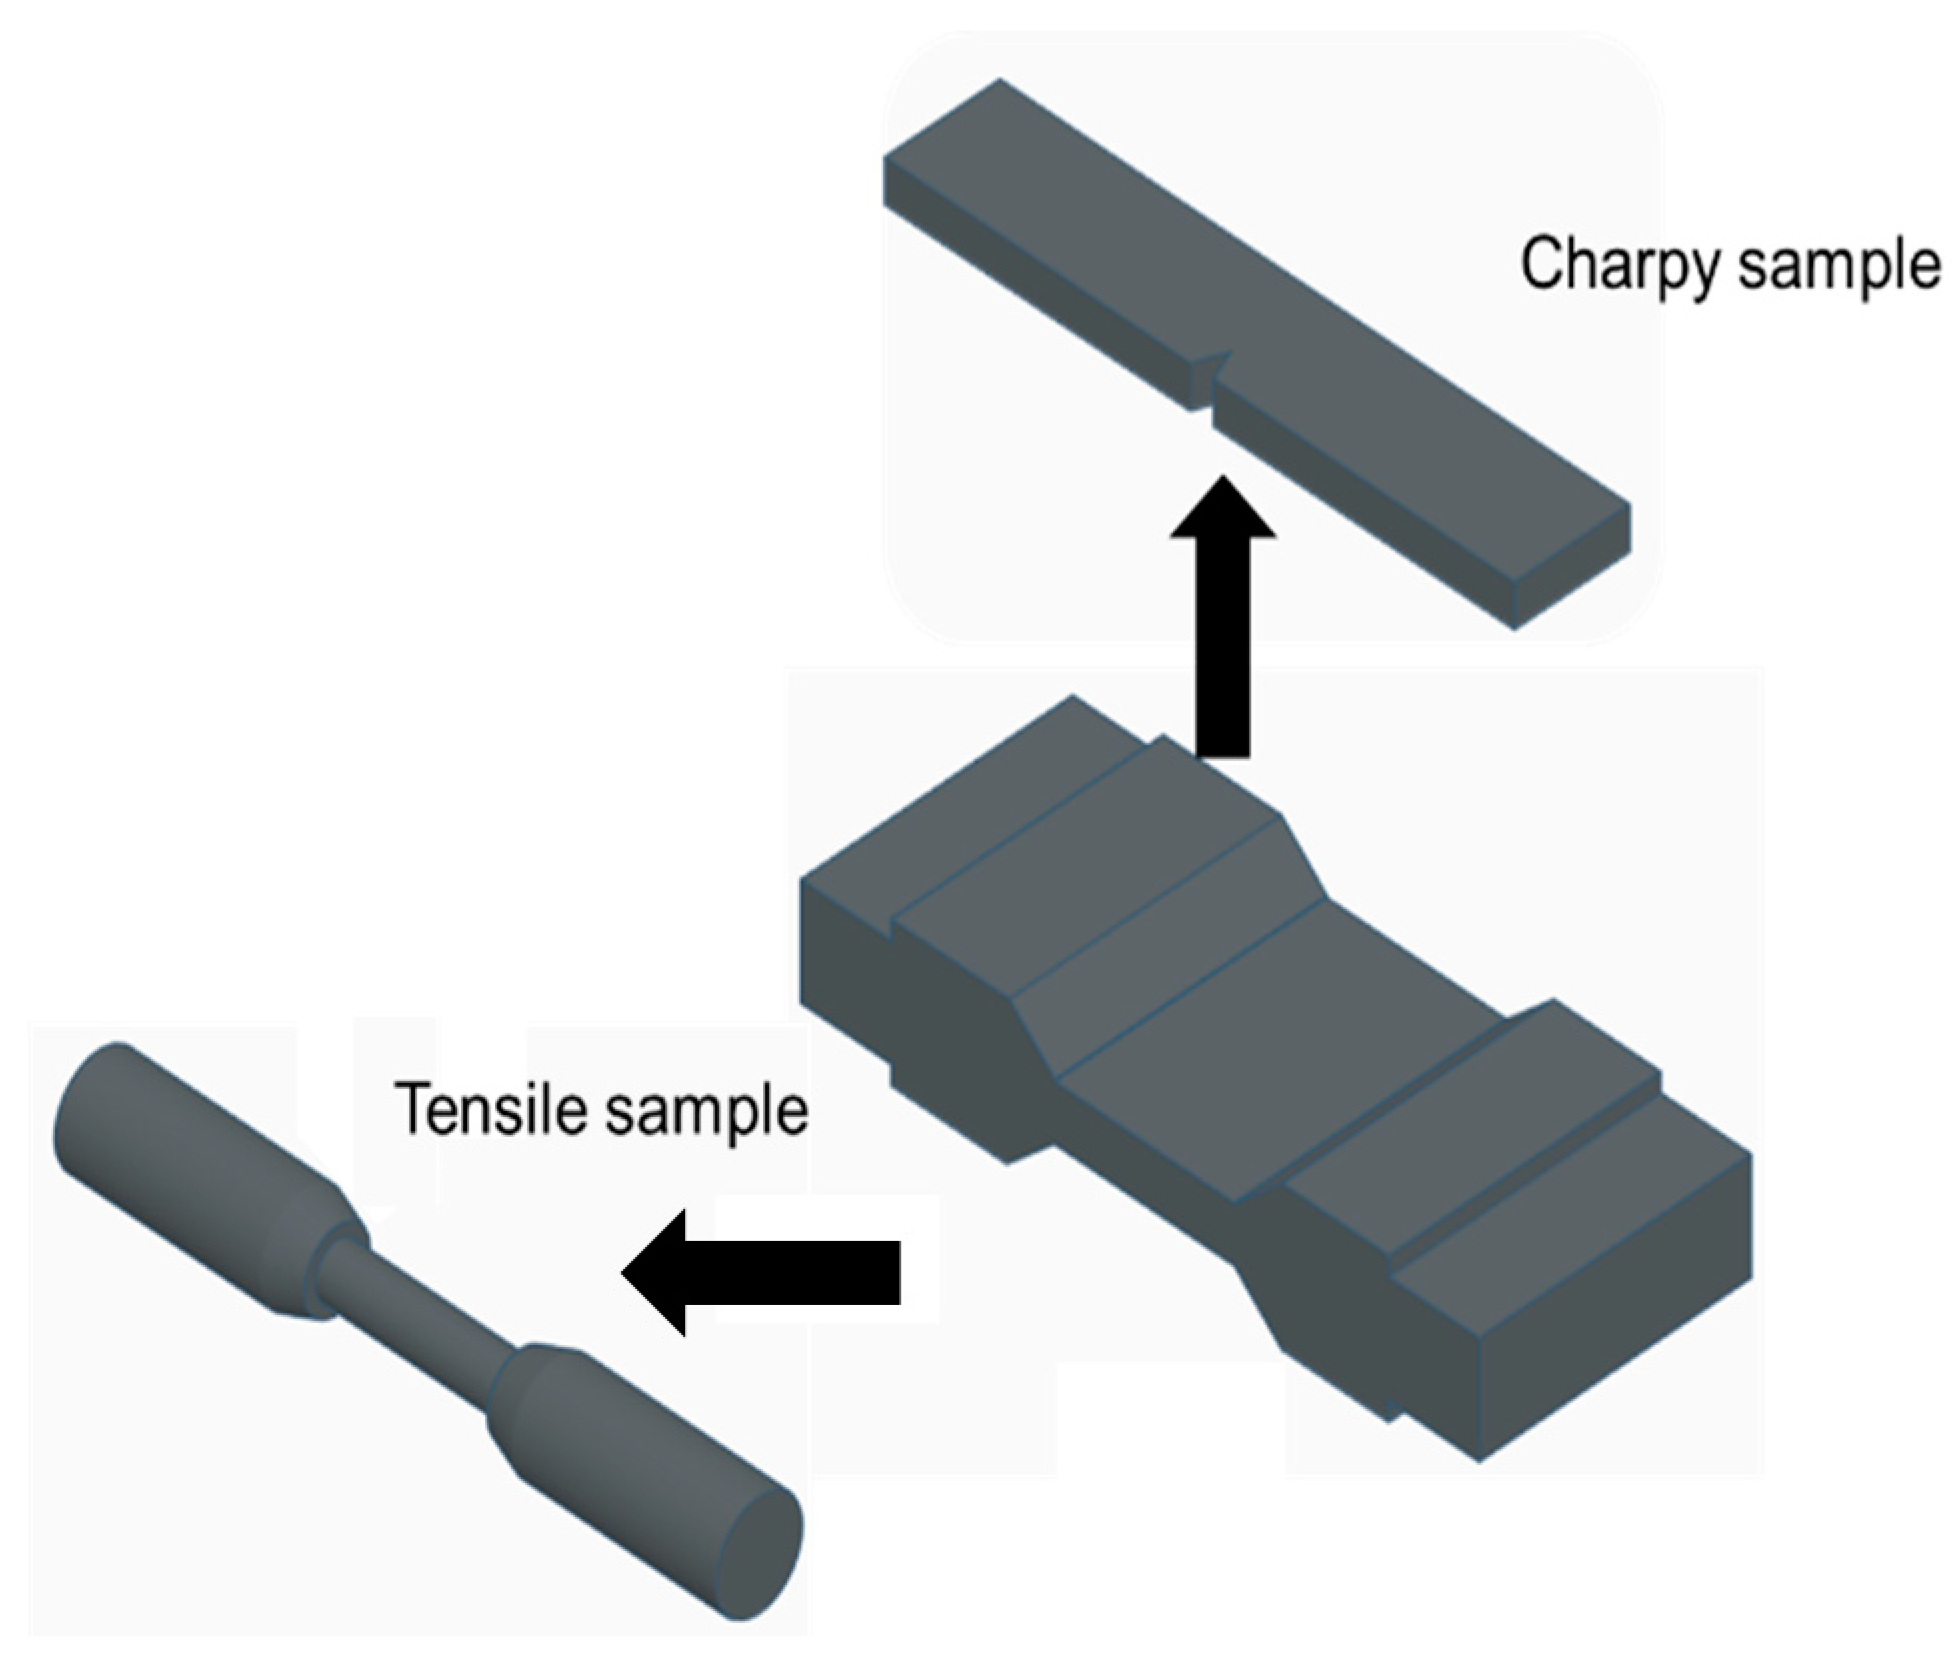
Besides the characterization of the central part of the plane compression sample, two cylindrical tensile specimens (4 mm in diameter and a gauge length of 17 mm) were also machined under each condition (Schematics are shown in Figure 2). The 2% proof stress and the tensile strength were calculated as the average of two tensile tests for each condition. The tensile tests were carried out at room temperature, on an Instron testing machine (Instron, Grove City, PA, USA). In these tests, a strain rate of 10−3 s−1 was employed. Furthermore, Charpy tests were carried out (Tinius Olsen Model Impact 104 pendulum impact tester, Horsham, PA, USA), after machining sub-size Charpy specimens (~4 × 10 × 55 mm3) from compression specimens. The impact transition curves were defined in accordance with the modified hyperbolic tangent fitting algorithm reported by Wallin [12].
3. Results and Discussion
In the following sections, tensile property characterization is shown, followed by an exhaustive microstructural analysis in terms of microstructure morphology, grain size, dislocation density, and fine precipitation. In order to gain a better understanding of the benefits of applying induction technologies, an analysis of the contributing factors of the different strengthening mechanisms on tensile properties is presented. Finally, the effects of tensile property modification on the toughness properties are evaluated.
3.1. Tensile Properties
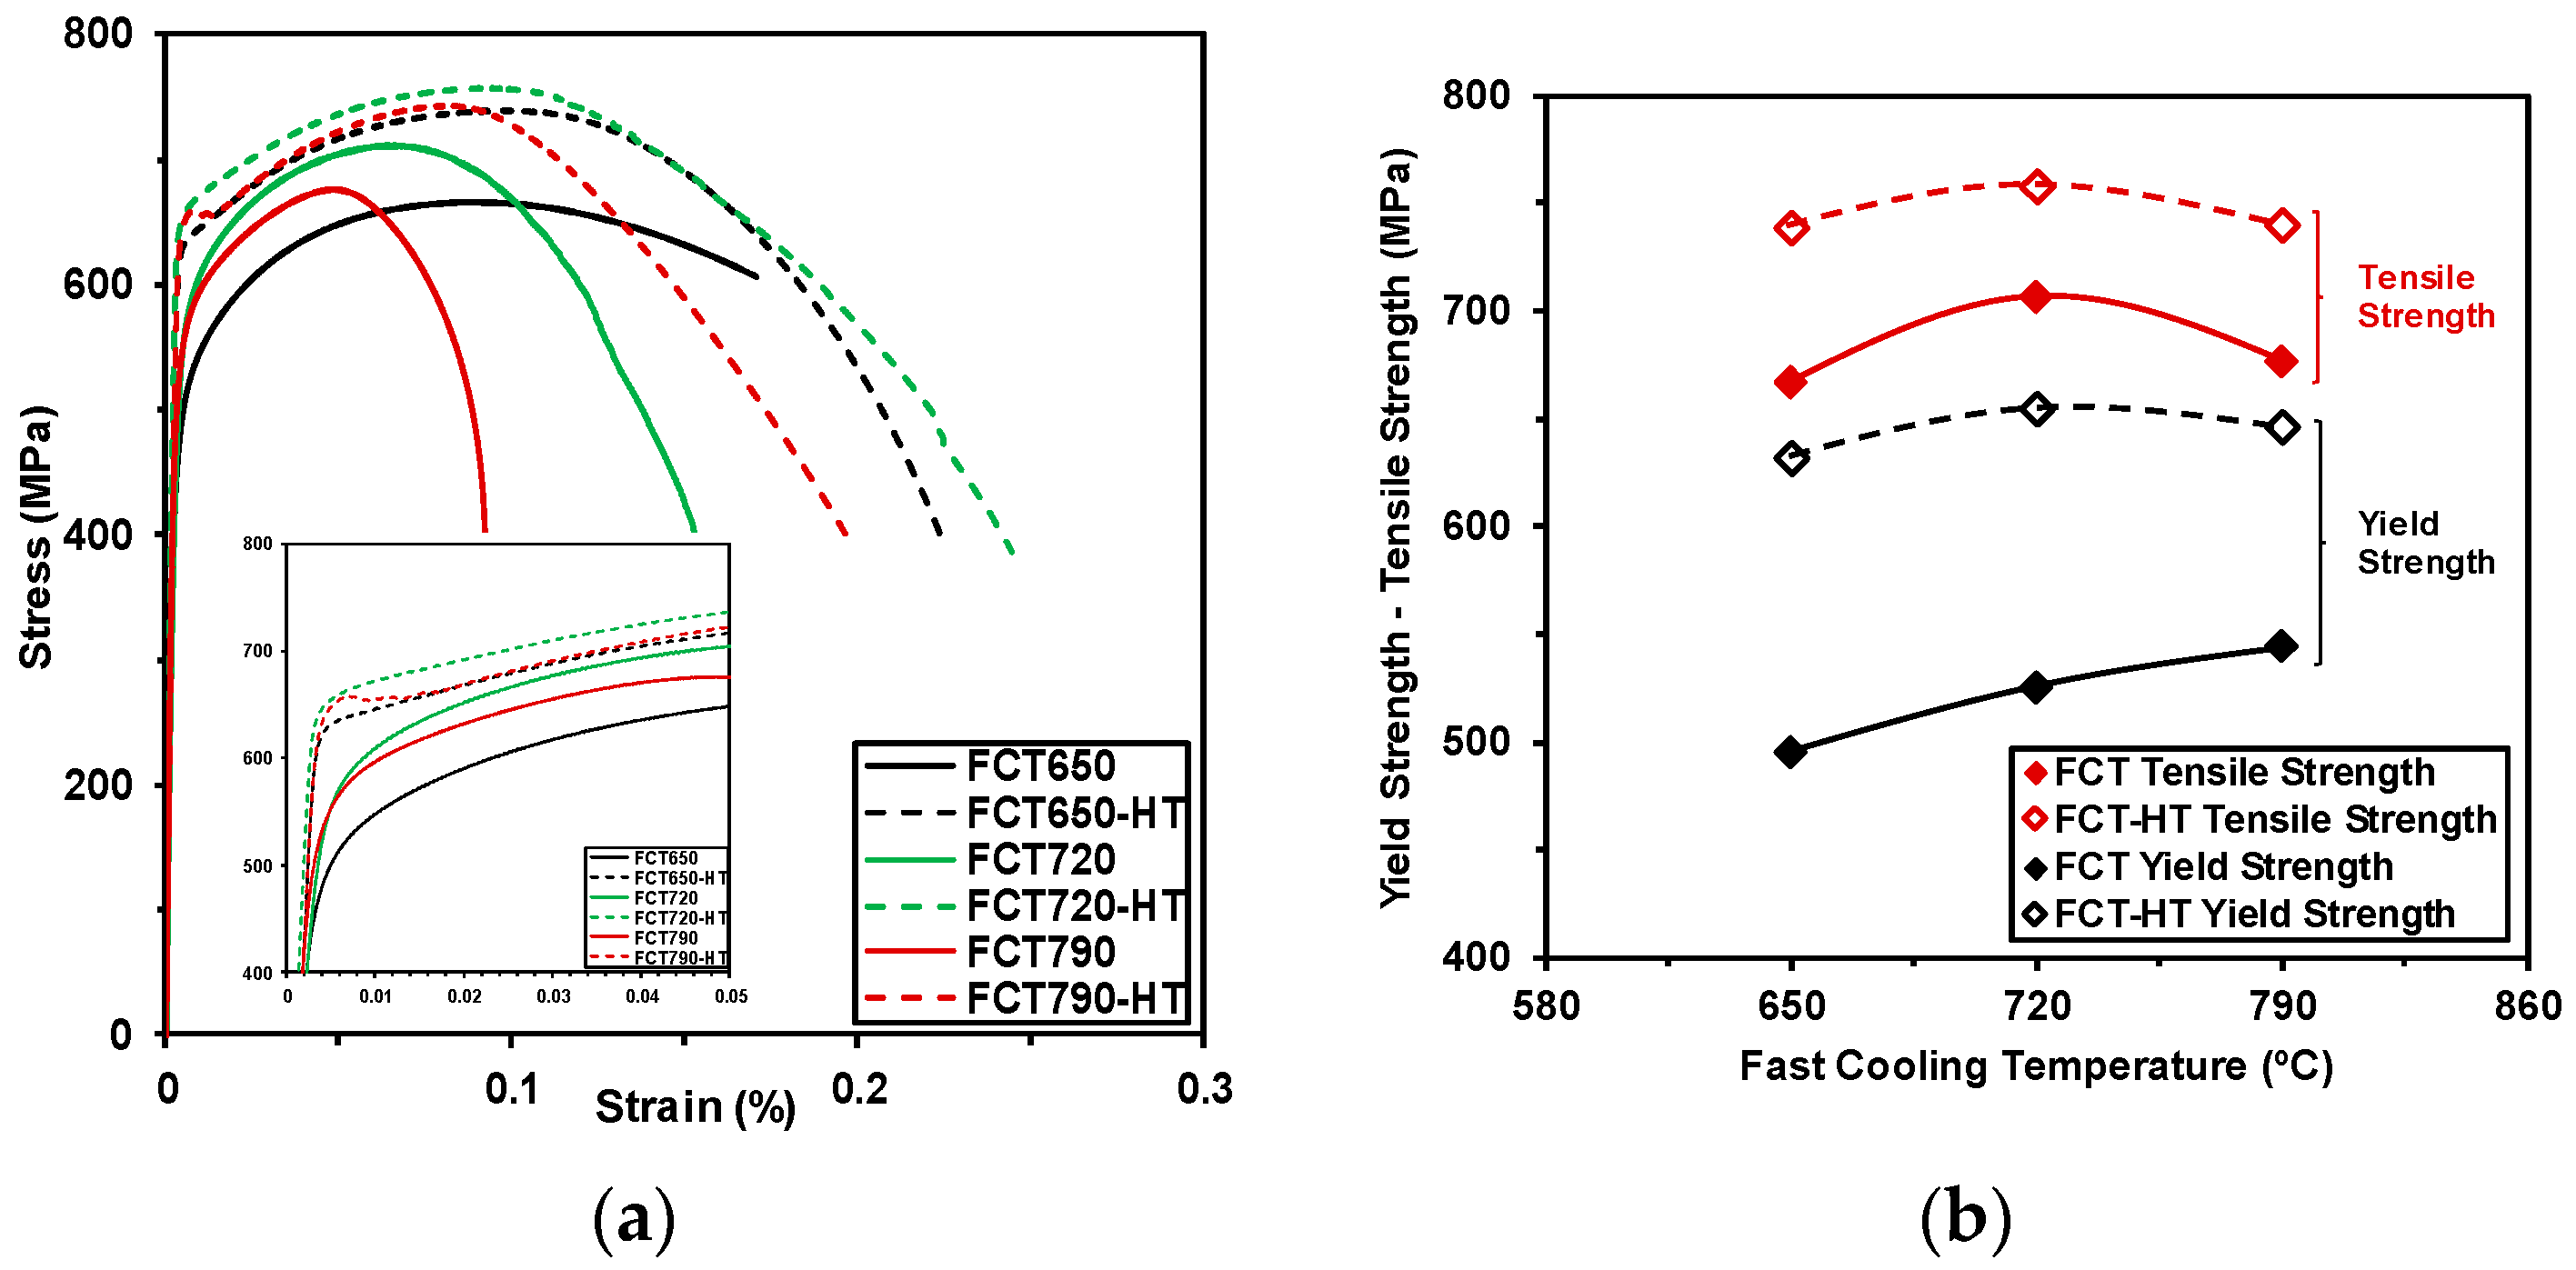
Tensile tests were performed for all the conditions before and after induction heat treatment. Figure 3a shows the stress-strain curves obtained for all the Fast Cooling Temperatures (FCTs). The stress-strain curves correspond to the samples without treatment, as well as the induction heated samples. Regarding the curves corresponding to the samples obtained before heat treatment, the results plotted in Figure 3a suggest that the modification of FCT has a considerable effect on tensile behavior. Tensile property improvement was observed as the Fast Cooling Temperature increased. In terms of the influence of the induction heat treatment, a clear tensile property improvement is observed after induction heating. This trend was seen for all of the FCTs. Higher yield strength and tensile strength values were measured in the induction heated samples in comparison to the specimens without heat treatment.
Concerning the shape of the stress-strain curve, the curves obtained in the non-heated samples showed continuous yielding behavior. As will be shown later, for the FCT790 condition, this behavior could be due to the formation of martensite/austenite (MA) islands within a ferritic matrix. This trend is in agreement with previously published studies [5]. The increment of the concentration of secondary phases leads to the increment of mobile dislocations located in the boundaries between the MA constituent and ferritic soft grains [13]. For the lowest, FCT650, a continuous shape was also noticed, which is associated with the formation of more bainitic phases. Conversely, a slightly different trend was distinguished when the tensile curves corresponding to the FCT-HT samples were analyzed. The curve obtained from the FCT790-HT condition exhibits a discontinuous behavior that is characteristic of ferritic-pearlitic microstructures. This is attributed to the modification of the secondary phase from MA islands to cementite. This aspect is analyzed in detail in the following section.
The yield and tensile strength values obtained from the stress-strain curves are plotted in Figure 3b as a function of the Fast Cooling Temperature. Tensile properties corresponding to the samples obtained before (FCT) and after induction heat treatment (FCT-HT) are shown in Figure 3b. Besides YS and TS values, the elongation and area reduction measurements are listed in Table 2. Looking at the results obtained in the samples without heat treatment, the increment of FCT from 650 to 790 °C promoted an increase in yield strength. Yield strength values of 495, 525 and 544 MPa were obtained, for FCT650, FCT720 and FCT790, respectively. Conversely, no significant effect of FCT on tensile strength values was noticed. Similar TS values were measured over the entire range of Fast Cooling Temperatures.
As mentioned previously, the induction heat treatment has considerable effects on tensile properties. Higher yield strength and tensile strength values were clearly observed after rapid heating. These improvements were observed for every Fast Cooling Temperature. The results shown in Figure 3b suggest that the observed improvement is more relevant for the yield strength. Enhancements of yield strength of 102, 129 and 137 MPa were promoted through the application of induction heating, for a FCTs of 790, 720 and 650 °C, respectively. The increment caused by induction treatment was shown to vary depending on the Fast Cooling Temperature and, therefore, the resulting microstructure (ferrite or bainite). A more relevant yield strength improvement due to induction heating was reached as the FCT decreased. Even though the benefits of induction heating were shown to be more important in terms of yield strength, tensile strength is also improved after applying a fast heating up to 710 °C. For example, by using a Fast Cooling Temperature of 720 °C, a TS values of 707 and 758 MPa were measured for the FCT720 and FCT720-HT samples, respectively.
Regarding the effect of FCT on the tensile behavior of the heated samples, it was observed that FCT does not affect tensile properties noticeably. YS and TS values remained approximately constant across the entire range of Fast Cooling Temperatures. Close yield strength values of 646 and 632 MPa were obtained, decreasing the FCT from 790 to 650 °C. Therefore, it was possible to attain similar tensile properties for the different microstructures after applying the induction heating process.
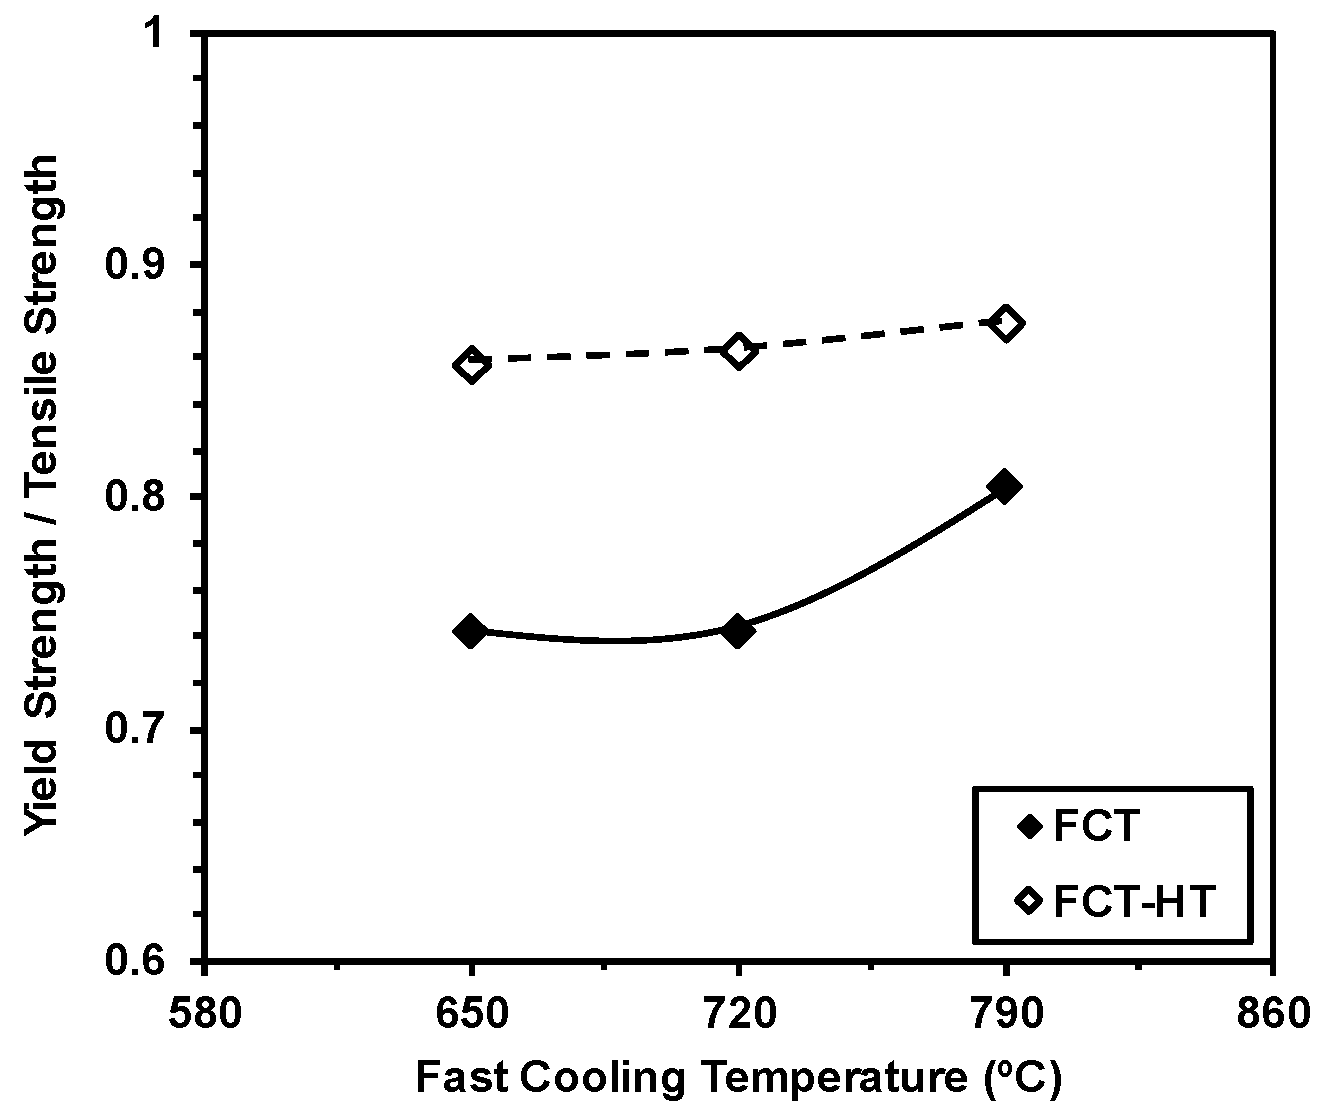
Figure 4 shows the yield to tensile strength ratio as a function of the FCT for the samples prior to induction treatment and for the heated samples. The YS/TS ratio ranged between 0.74 and 0.87, which is in line with previously reported values for low carbon microalloyed steels [1]. In both the FCT and FCT-HT conditions, the YS/TS ratio increased as the FCT increased from 650 to 790 °C, and the increment was more relevant for the samples without induction heat treatment. This trend is attributed mostly to the improvement in yield strength that was observed after the increment in FCT. Regarding the effect of the induction treatment, when a Fast Cooling Temperature of 720 °C was used, the yield to tensile strength ratio increased considerably from 0.74 to 0.86 after applying the heat treatment. This significant increment in the YS/TS ratio can be explained by several factors—the modification of the microstructure and strengthening due to fine precipitation—which contribute more significantly to YS than to TS.
3.2. Microstructural Features and Unit Sizes
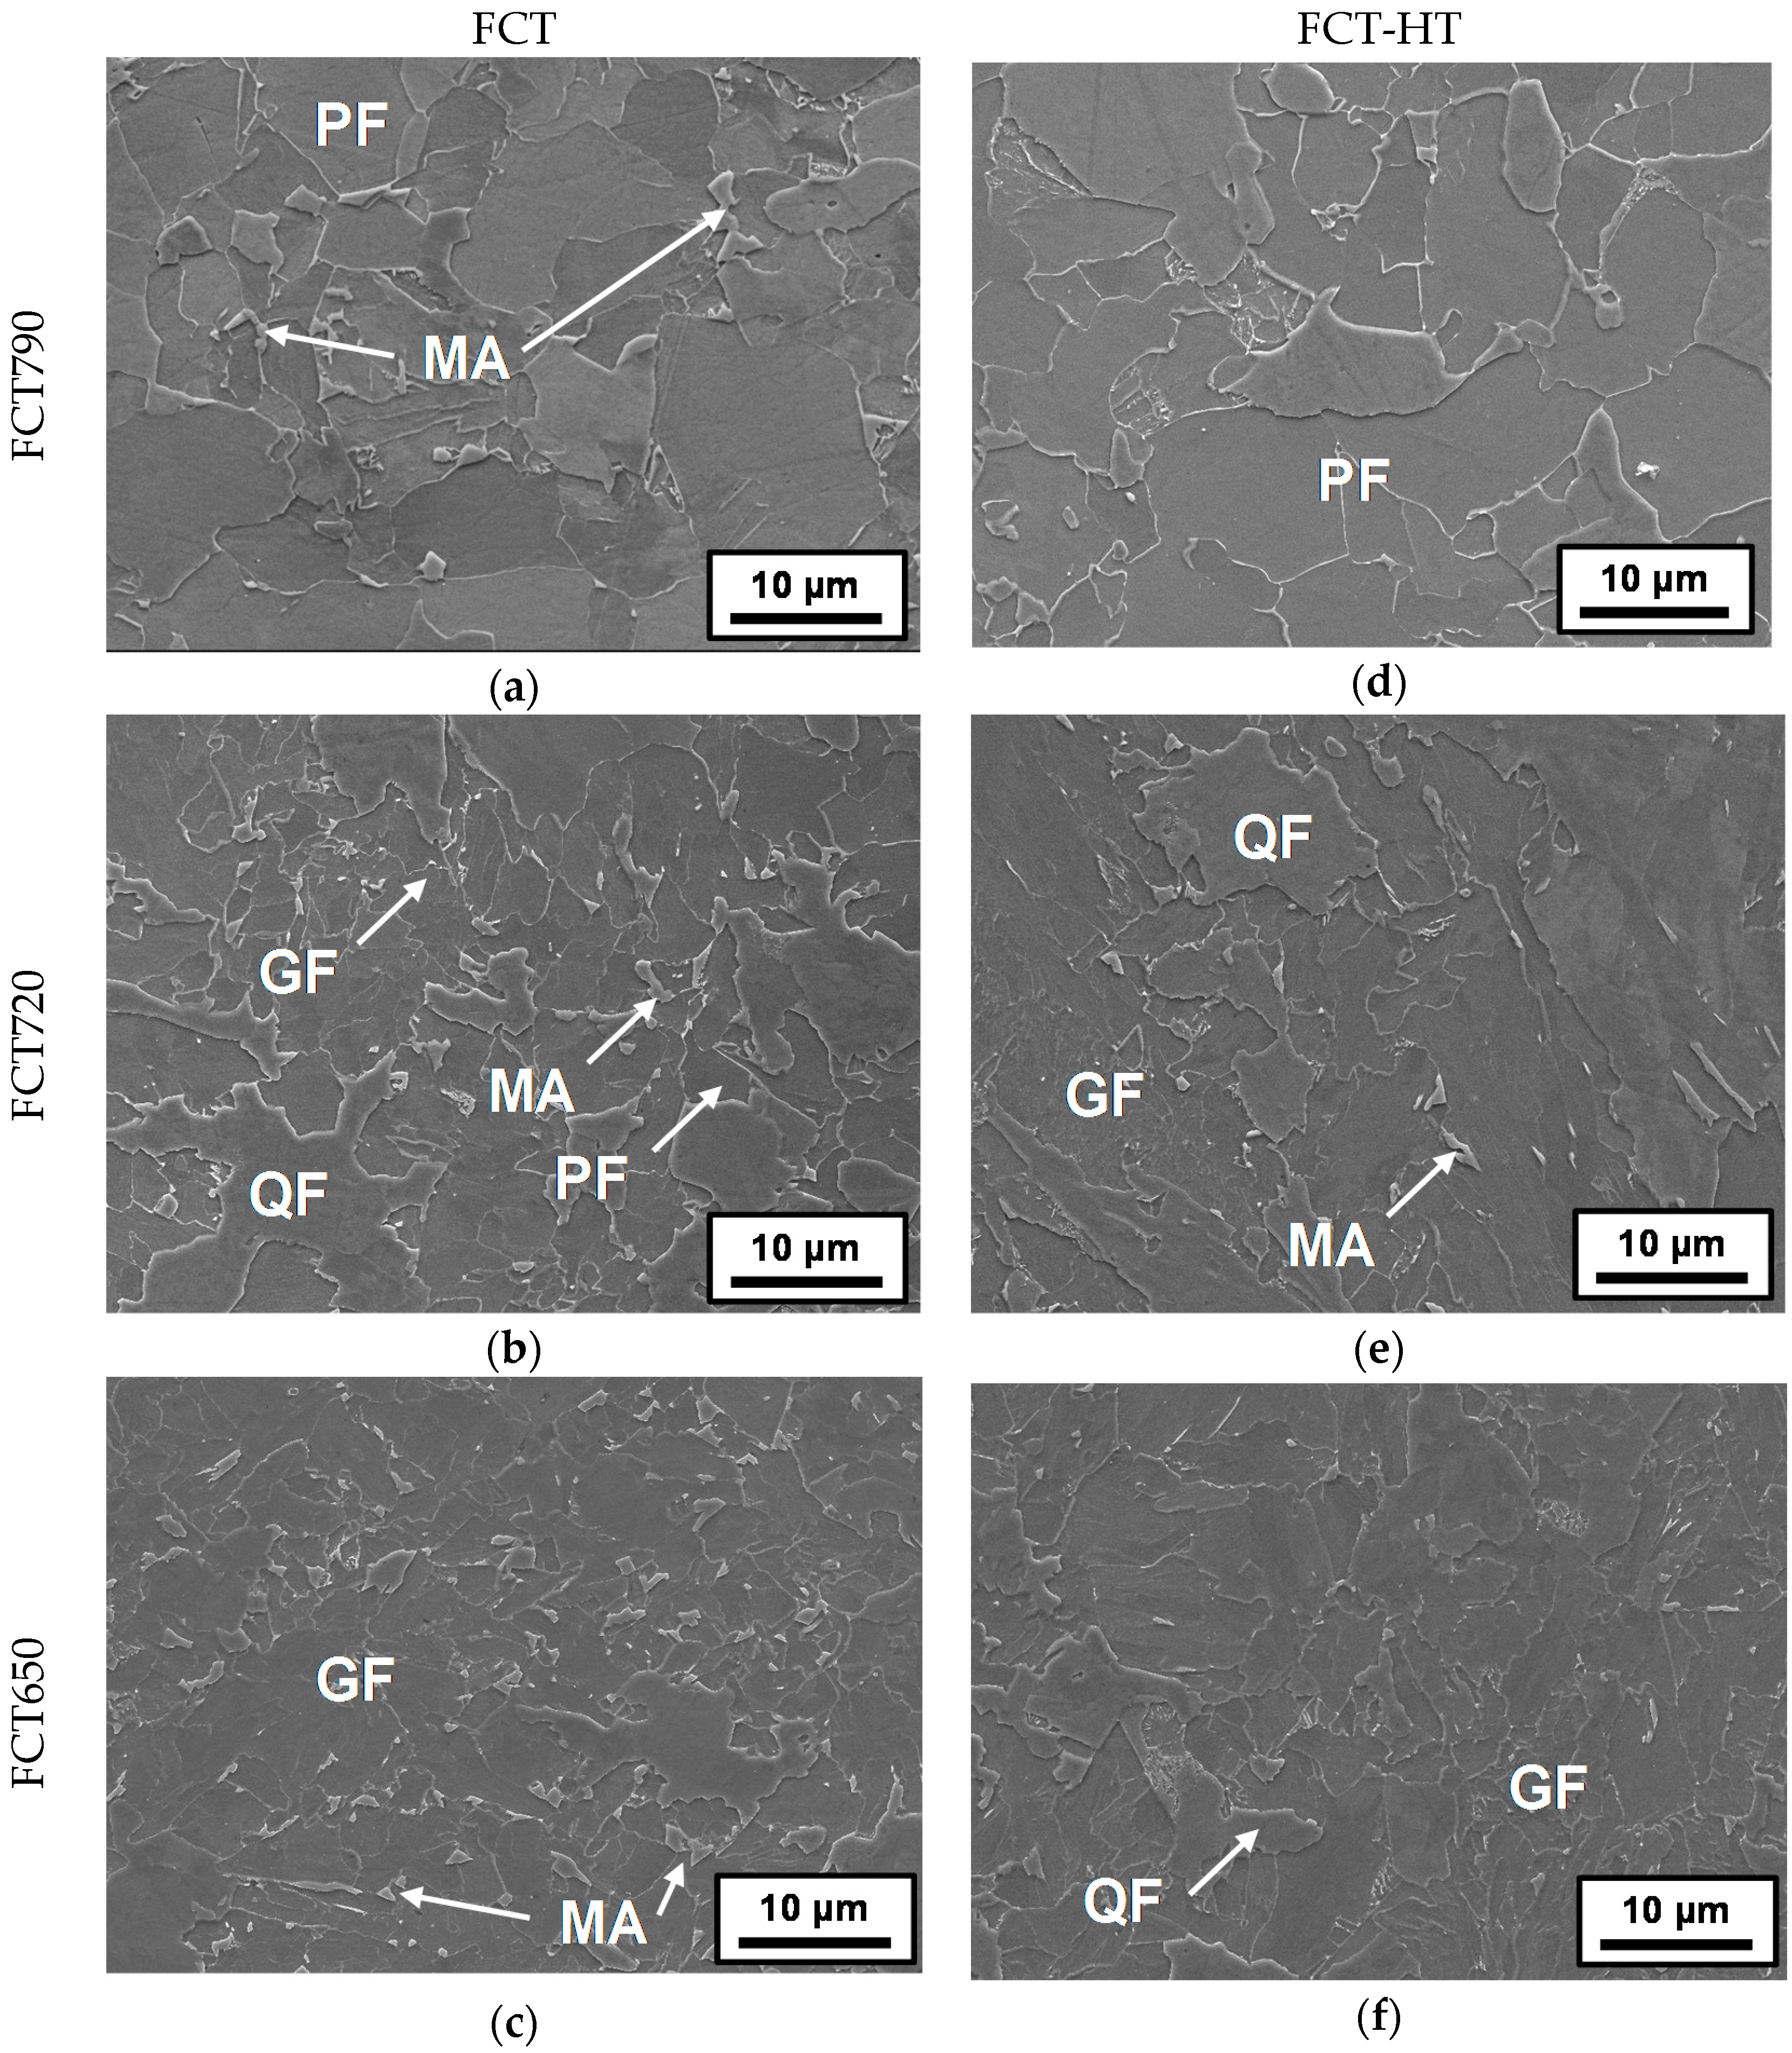
In order to understand the reasons for the observed improvement caused by induction heat treatment, a detailed microstructural characterization based on grain size, dislocation density, and precipitation was performed. In Figure 5, FEG-SEM micrographs related to the different FCTs (790, 720, and 650 °C) are presented. Figure 5a–c show the microstructures formed before (FCT samples) induction treatment, while Figure 5d–f illustrate the microstructural features of the samples obtained after rapid heating (FCT-HT samples). In the current work, the ISIJ Bainite Committee classification was used to designate the observed phases [14]. By analyzing the microstructures obtained after the continuous cooling to room temperature (FCT samples), completely different transformation products were distinguished depending on the FCT. For the highest FCT of 790 °C, mainly a ferritic microstructure was observed, in conjunction with martensite–austenite (MA) islands. When an intermediate FCT was applied (720 °C), the microstructure was composed of PF (polygonal ferrite), QF (quasipolygonal ferrite), GF (granular ferrite) and MA islands. For the lowest FCT, a mixture between the QF, GF, and MA islands was detected. The micrographs shown in Figure 5 clearly exhibit that microstructural refinement can be achieved by decreasing the Fast Cooling Temperature.
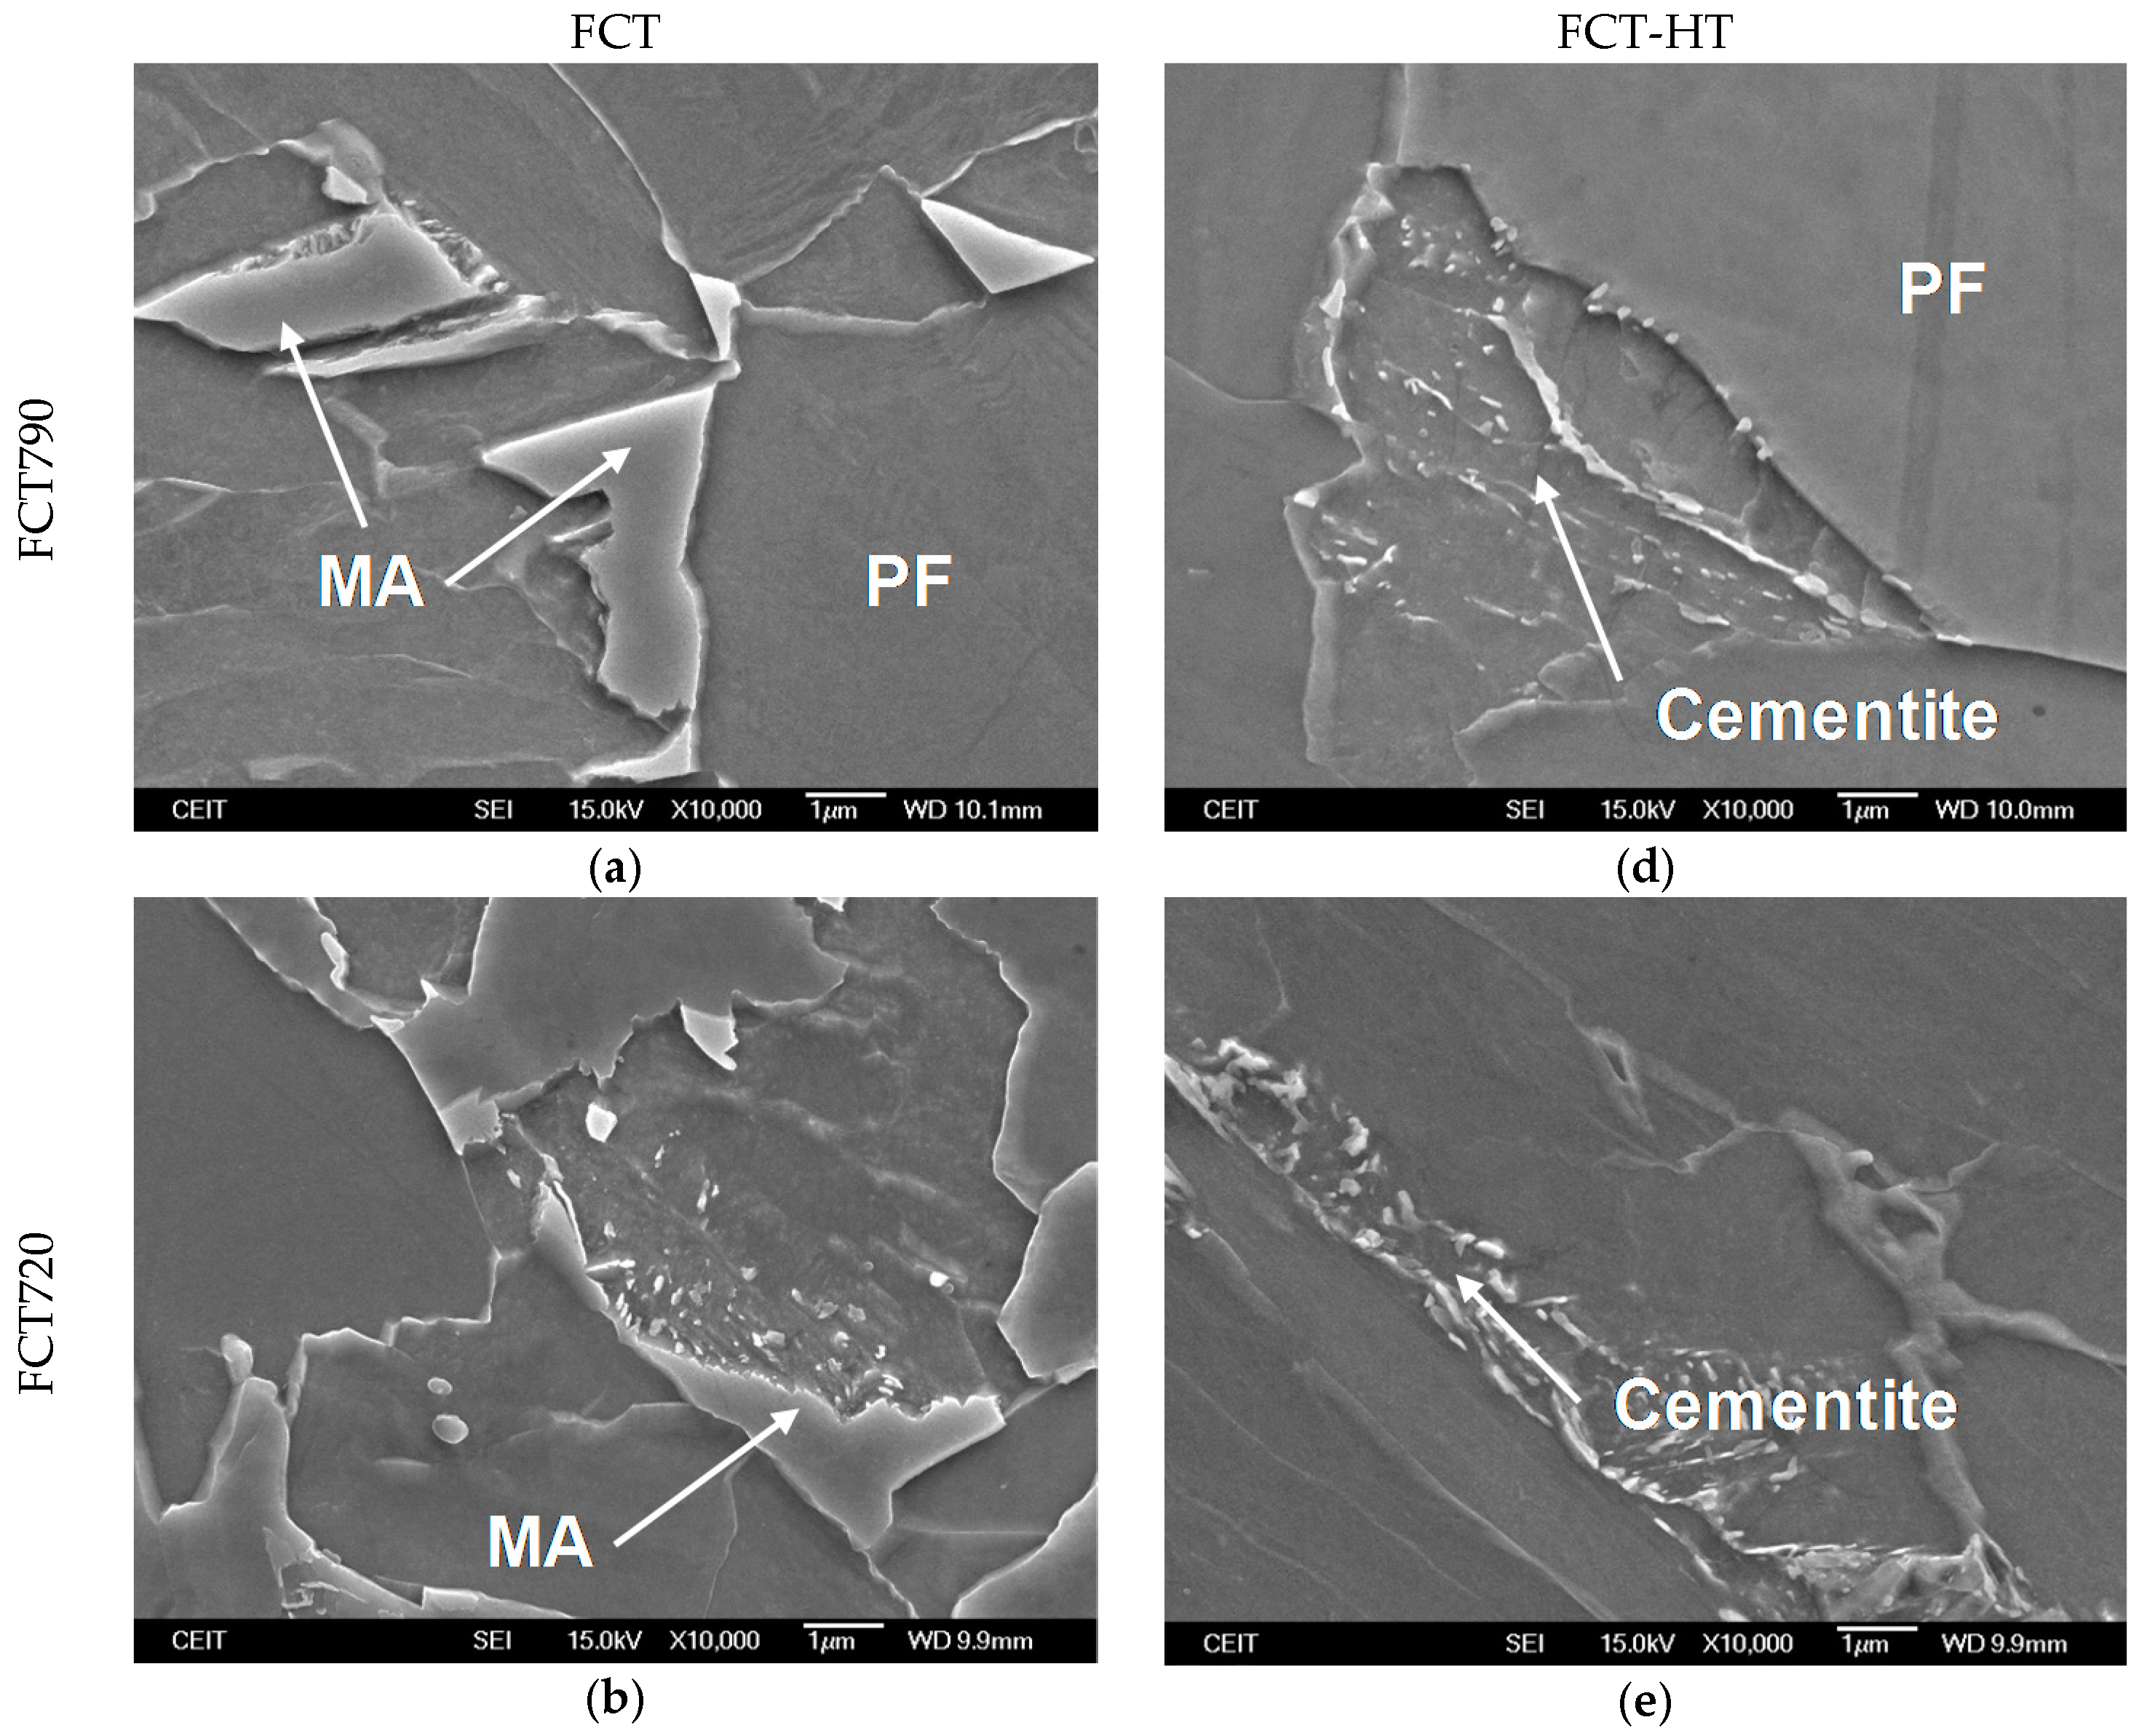
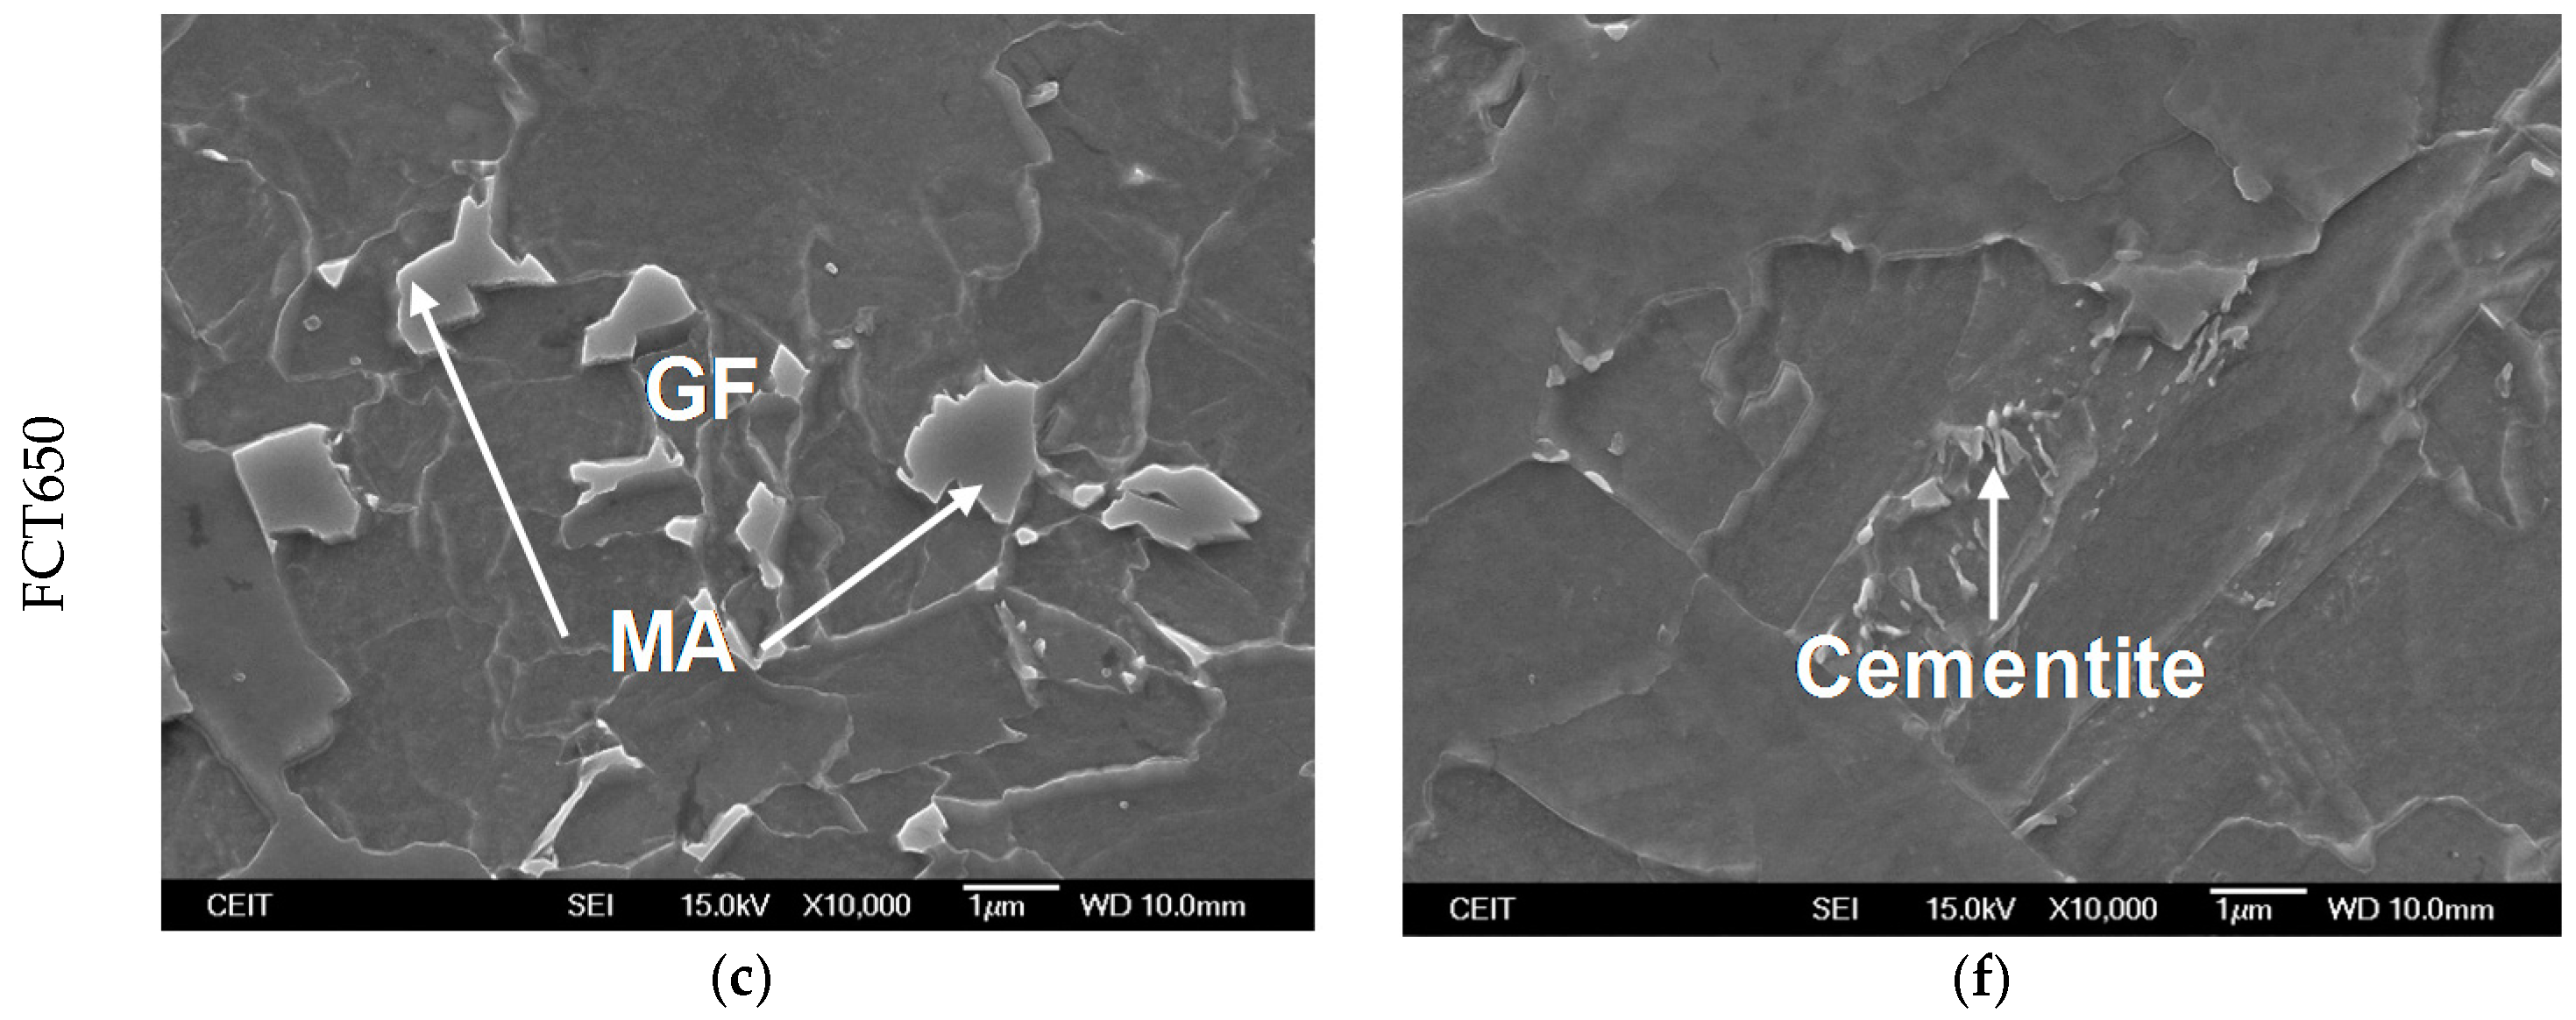
When the microstructures obtained before and after induction treatment were compared, optical microscopy suggested that induction heating does not significantly modify the resulting microstructures. No considerable microstructural changes were observed during induction heat treatment. Either way, a more detailed analysis of secondary phases was required due to the presence of complex transformation products. In Figure 6, several FEGSEM micrographs obtained after FCTs of 790 °C (a,b), 720 °C (c,d), and 650 °C (e,f) can be compared. For the FCT790 condition, the images show that the secondary phase morphology was strongly modified during induction treatment. Prior to heat treatment, martensite–austenite (MA) islands were observed as the secondary phase, whereas in the induction heated sample, cementite particles were detected instead of MA islands. Similar phenomena can be noticed for the lowest Fast Cooling Temperature. Partial dissolution of the MA islands formed before treatment occurred during induction heat treatment, which is in line with previously published studies [9,15]. Xie et al. [15] claimed that after conventional tempering, the MA islands decomposed, and cementite was formed. Furthermore, they concluded that an increment in the tempering temperature promotes more relevant MA decomposition with smaller cementite particles, ensuring a significant enhancement of toughness properties. This modification also affects tensile curves, as observed in Figure 3b. The dissolution of MA islands affected the shape modification of tensile curves in the FCT790 condition, changing from a continuous yielding to a discontinuous one.
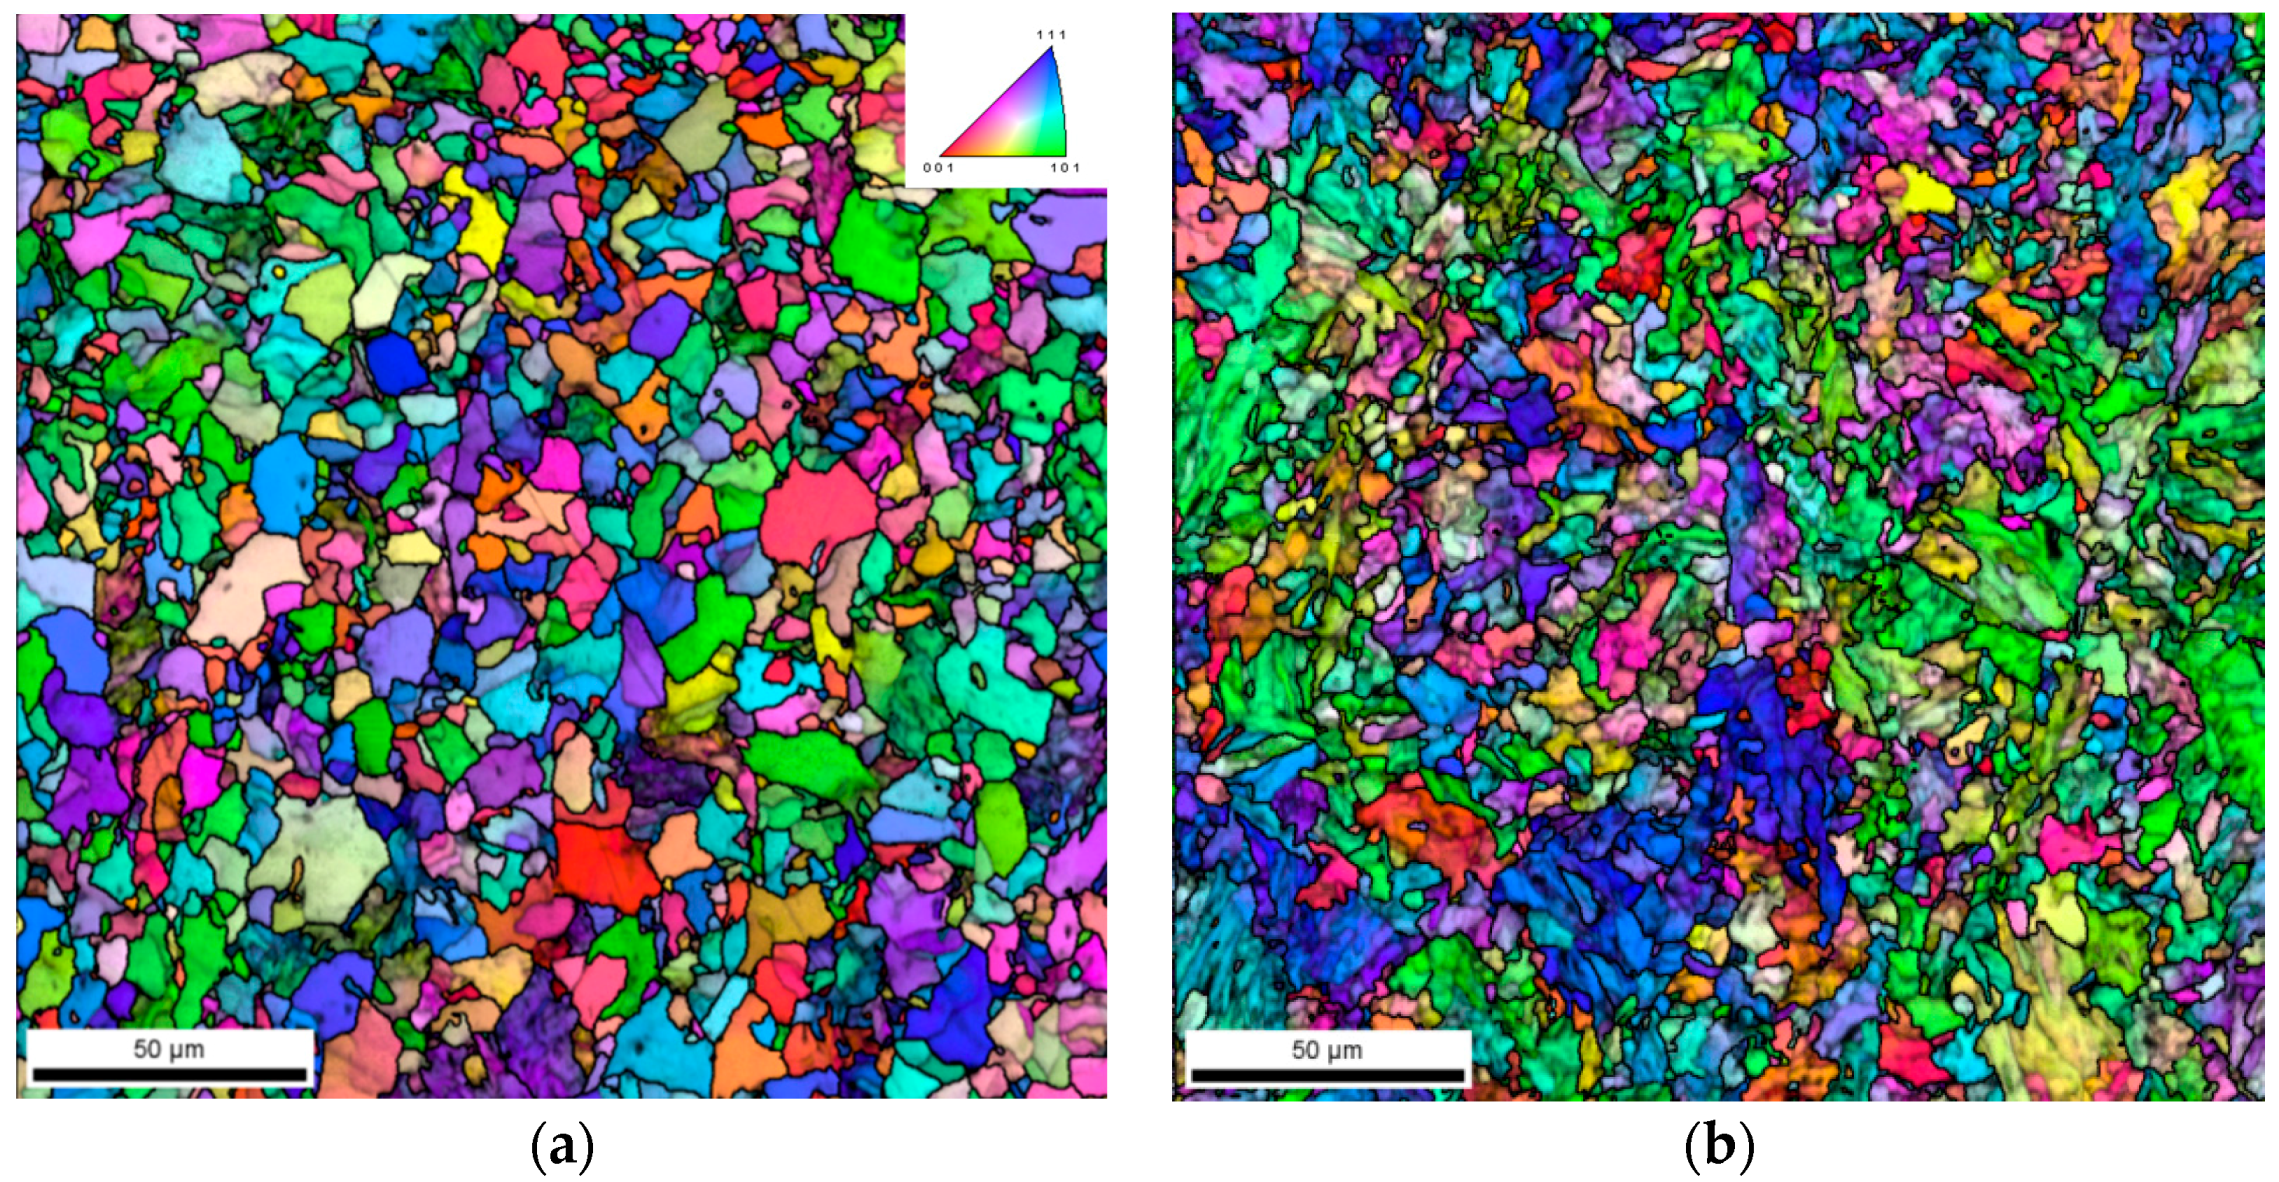
In order to resolve microstructural features that cannot be suitably resolved by conventional characterization procedures, such as optical and FEGSEM microscopy, an additional crystallographic characterization by means of EBSD technique was performed for all cases. As an example, Figure 7 presents EBSD maps corresponding to FCT790 and FCT650 conditions. To obtain further information concerning the phase morphology for each type of microstructure, the image quality and inverse pole figure are superimposed in both cases. By analyzing the results shown in Figure 7, completely different EBSD maps can be observed. When a high FCT is applied, polygonal ferrite grains were distinguished, whilst after a low FCT, non-polygonal, bainitic morphologies were detected. Moreover, a more pronounced substructure was shown for the FCT650 sample, a characteristic of mainly bainitic microstructures. In addition, the microstructural refinement due to FCT reduction was clearly evident. A significantly finer microstructure was achieved for the lowest FCT of 650 °C.
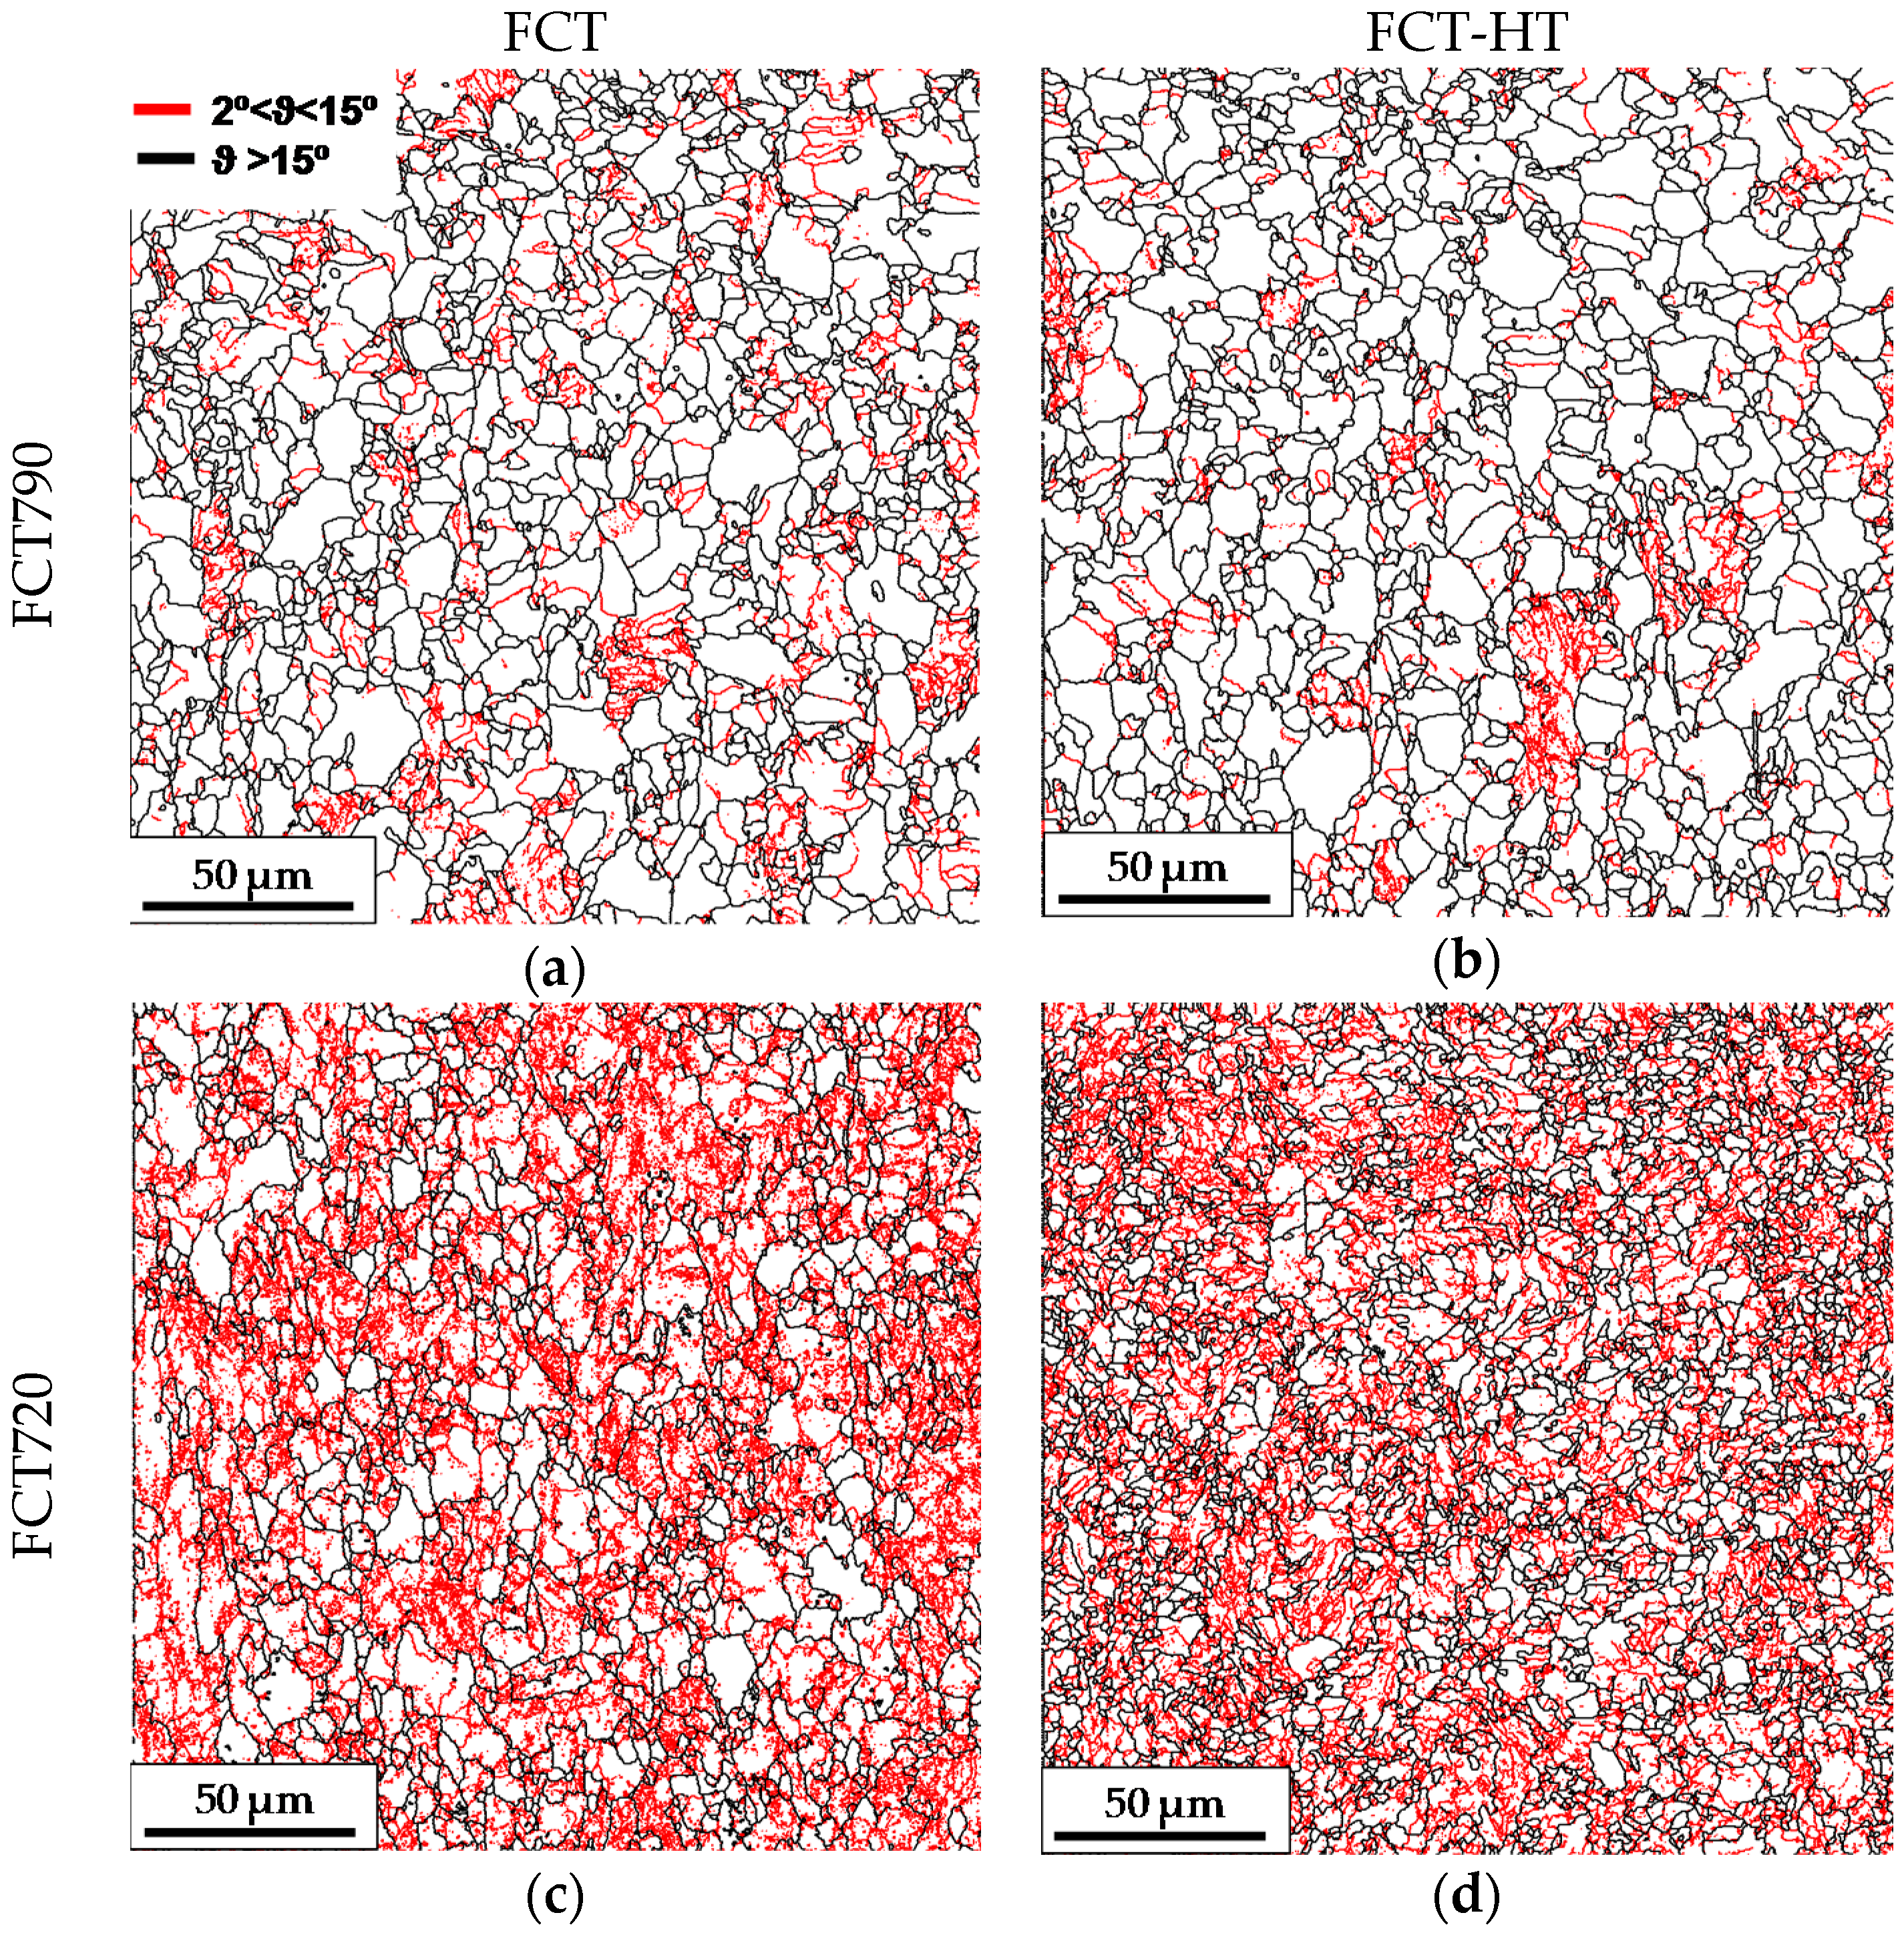
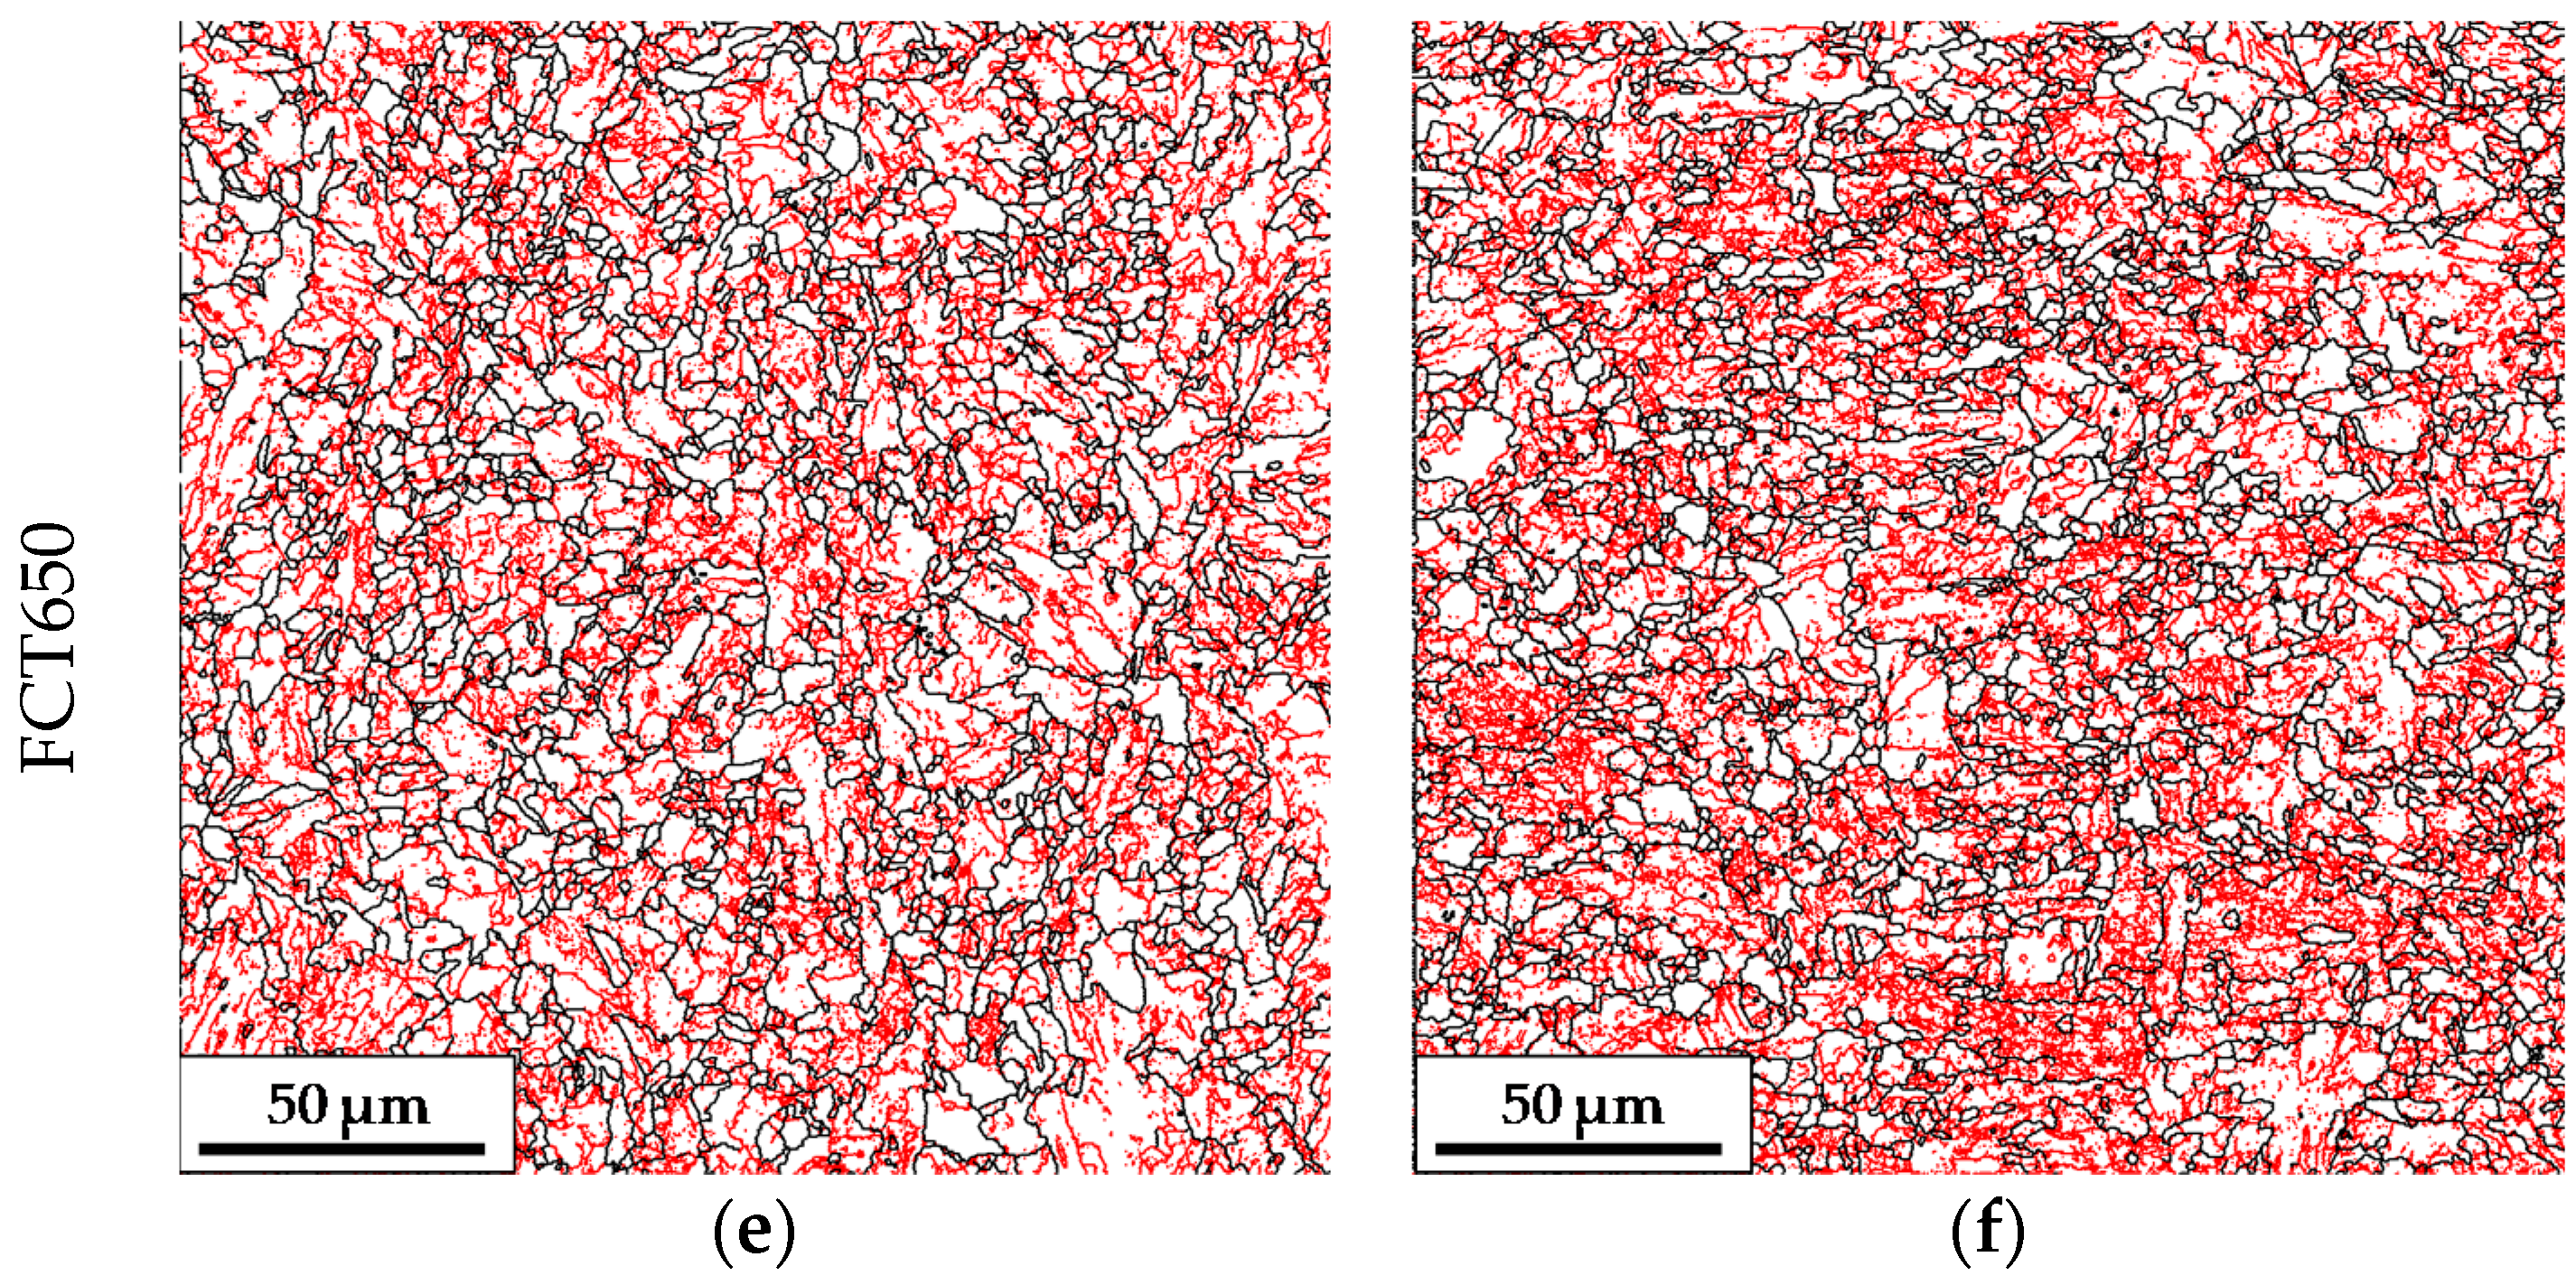
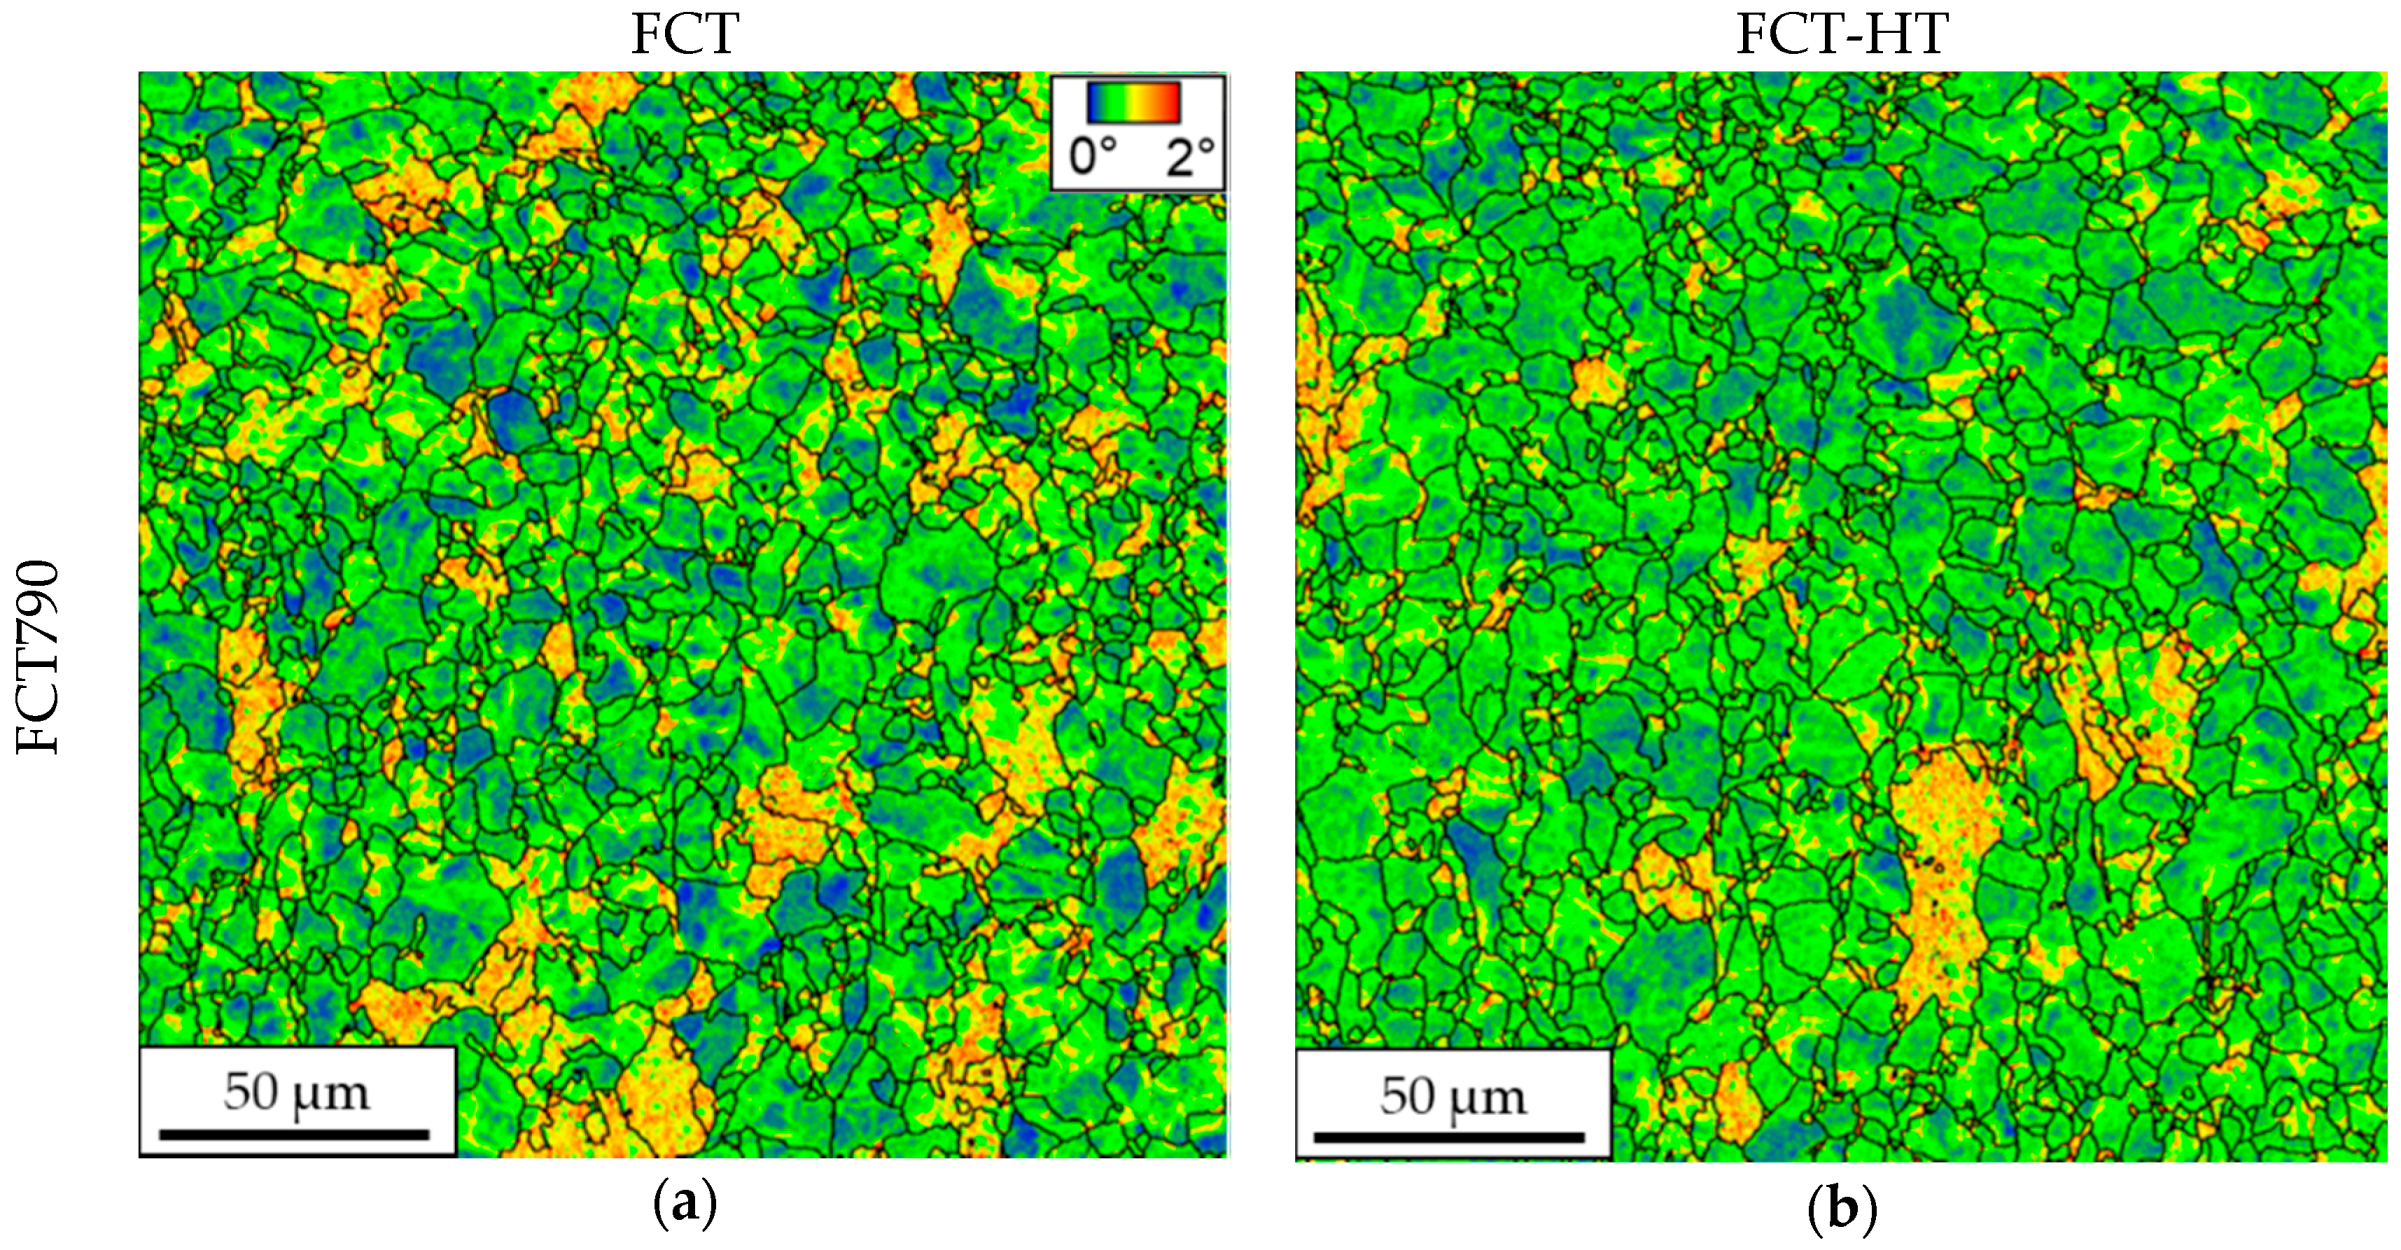
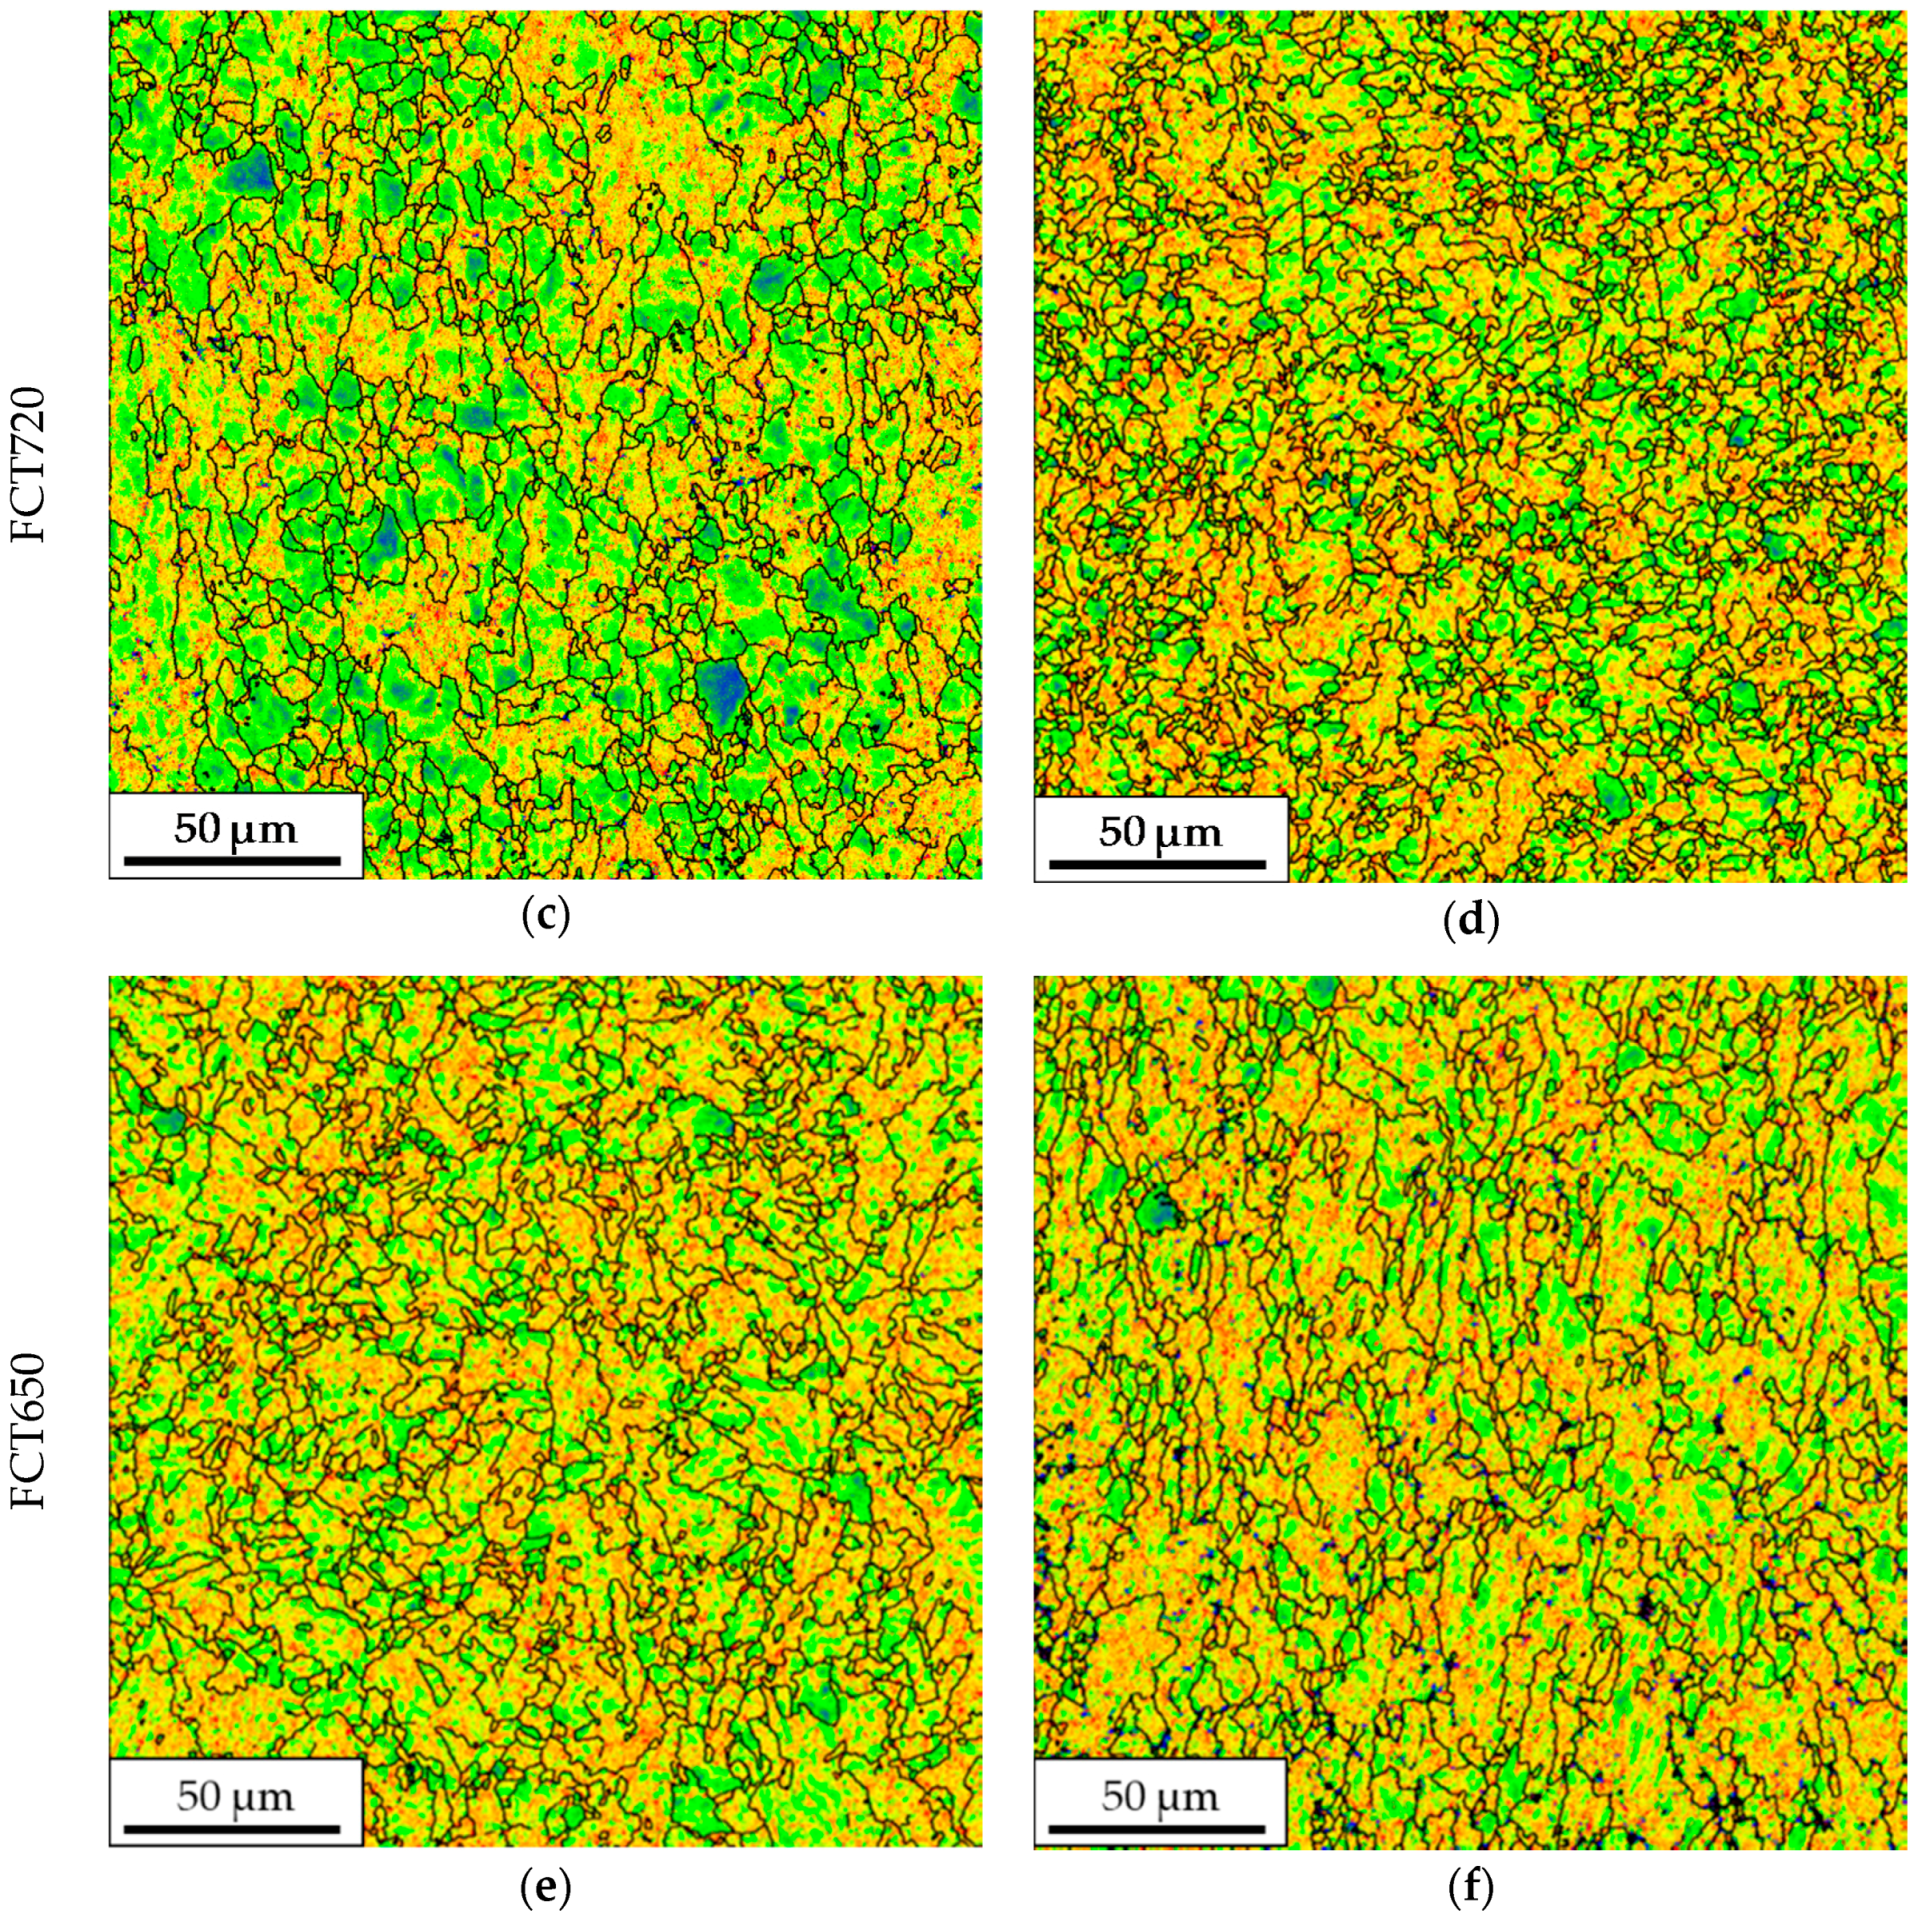
In the current work, low and high angle misorientation unit sizes were measured [16], considering 2° and 15° misorientation criteria, respectively. In the grain boundary maps, low and high angle boundaries are shown with red and black lines, respectively. Low angle boundaries are supposed to contribute to tensile properties owing to their opposition to dislocation movement, while high angle boundaries are assumed to be suitable for controlling crack propagation. Figure 8 illustrates several grain boundary maps for different types of microstructures (ferrite, ferrite/bainite, and bainite, for FCT790, FCT720, and FCT650, respectively). As expected, the variation in the Fast Cooling Temperature noticeably affected the microstructure morphology. When FCT decreased more, non-polygonal transformation products were detected and this was reflected in an increase in the content of low angle boundaries drawn in red. Moreover, finer microstructures were observed as the FCT decreased, which were associated with the formation of more bainitic phases. When the EBSD maps drawn for the samples obtained before and after induction treatment were compared, no significant differences were observed between the different types of microstructure (ferrite, ferrite/bainite, and bainite).
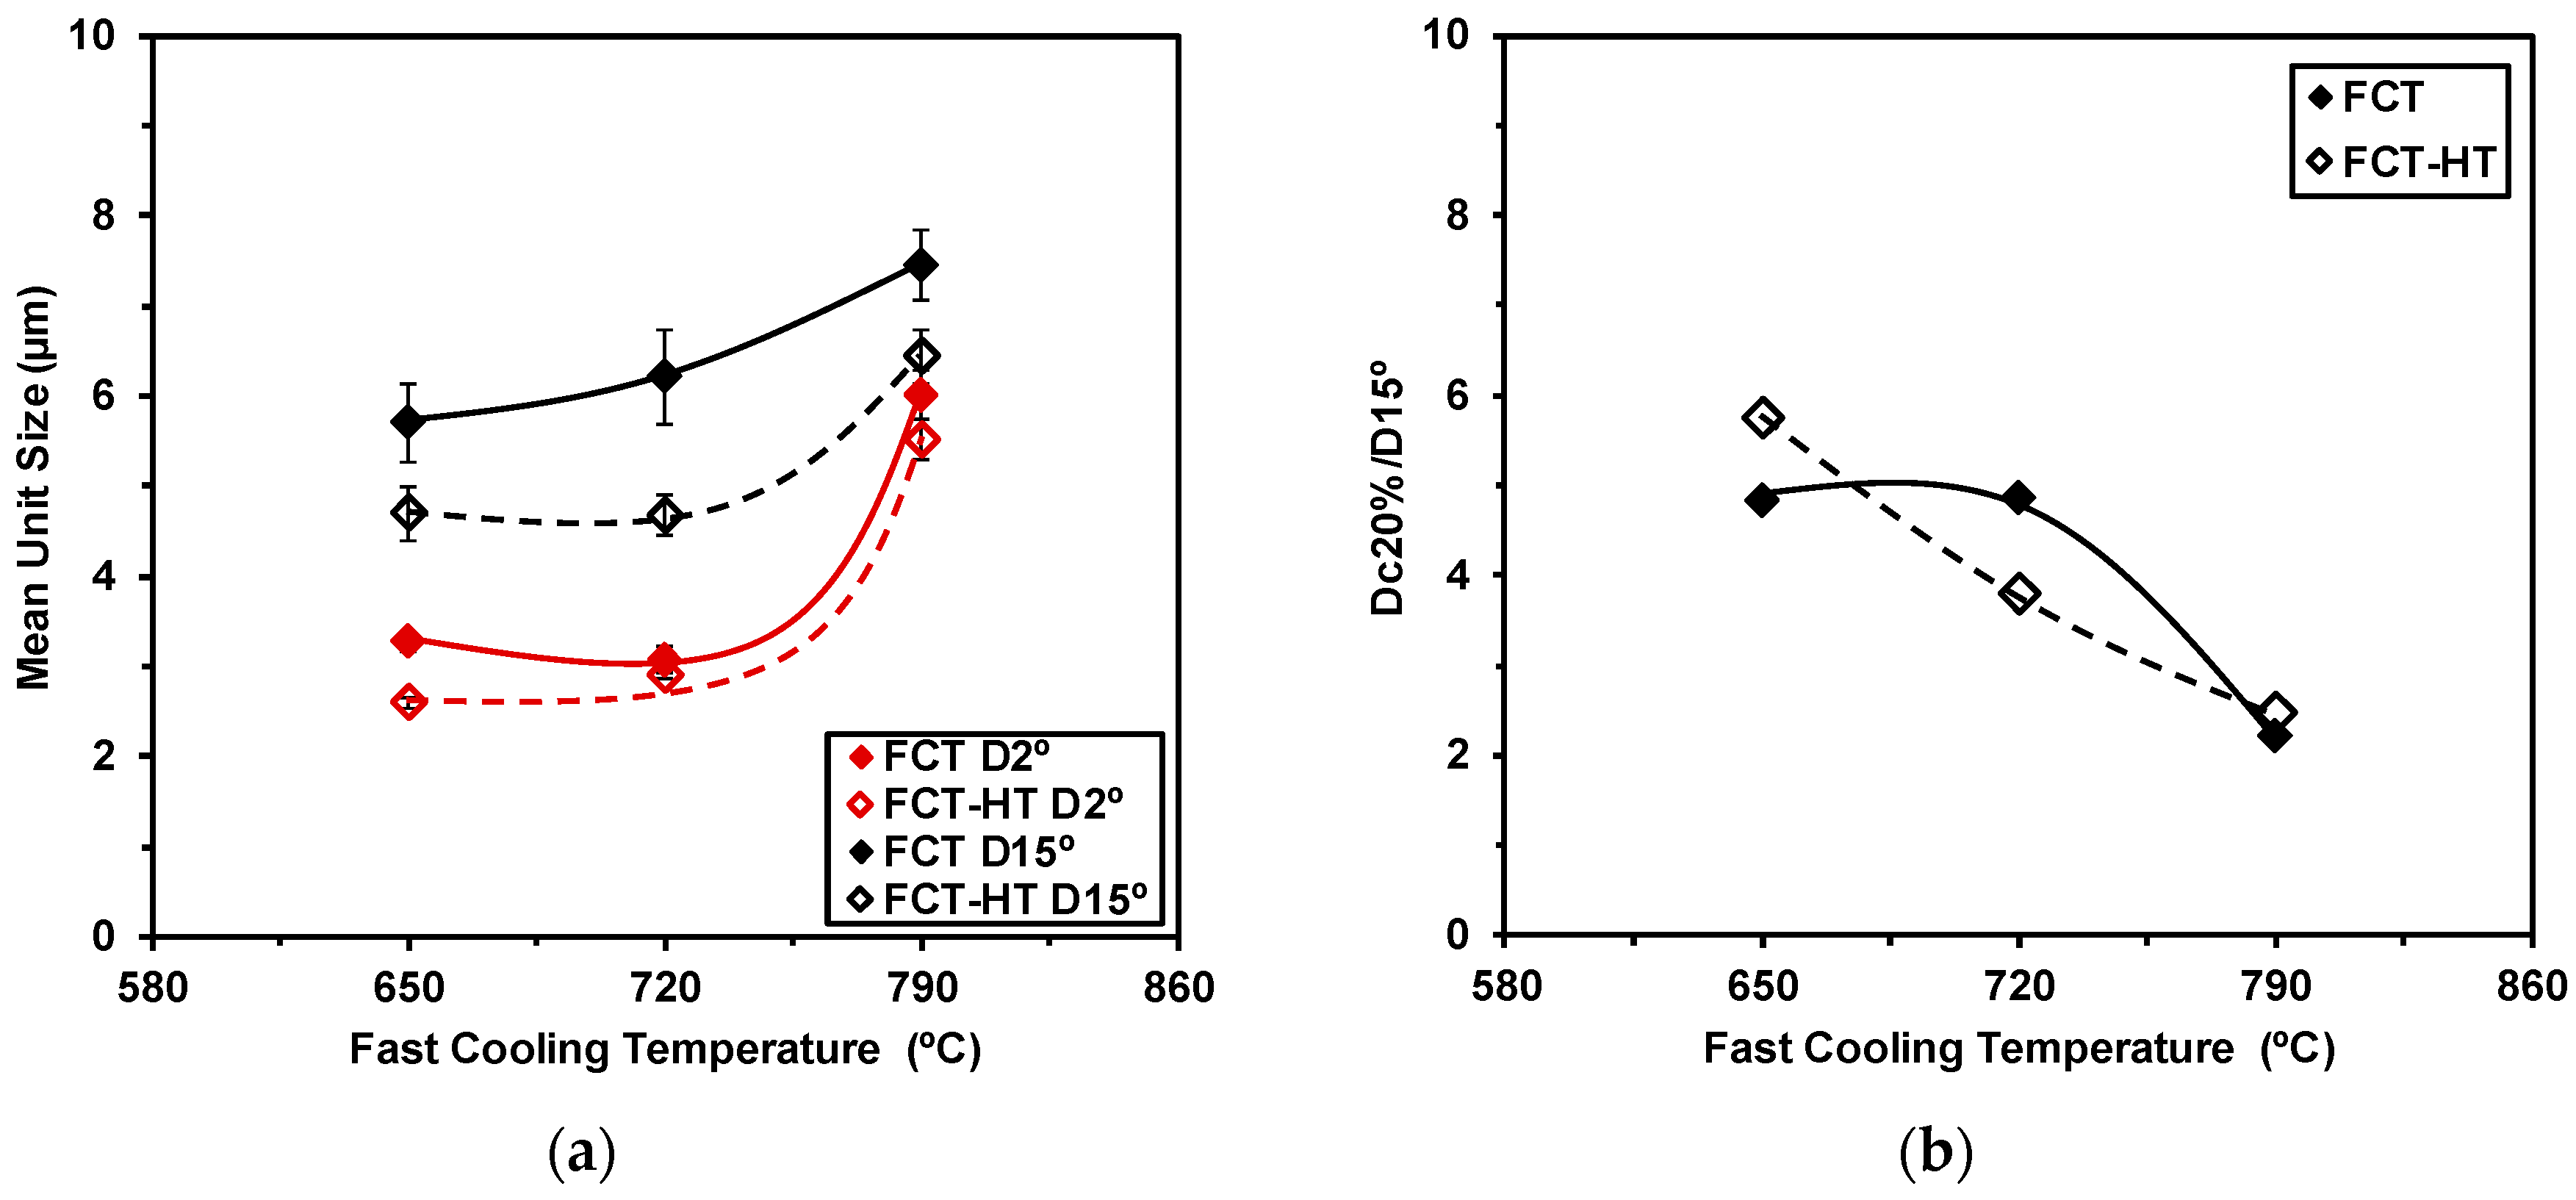
In Figure 9a, the effect of the Fast Cooling Temperature on the mean unit size was evaluated for both low and high angle misorientation criteria. The trends suggest that the reduction of FCT from 790 to 720 °C ensures microstructural refinement (considering both misorientation criteria). Taking into account high angle misorientation criteria, the mean unit size decreased from 6 to 2.9 µm when the FCT reduced from 790 to 720 °C. This behavior could be attributed to the modification of the microstructure from mainly ferritic phases to mixtures between polygonal ferrite and bainitic phases, such as quasipolygonal ferrite (QF) and granular ferrite (GF). Nevertheless, similar mean unit sizes were measured for FCTs of 720 °C and 650 °C.
Besides the evaluation of the influence of FCT on crystallographic unit sizes, an analysis of the potential of induction heating on the mean unit size was also carried out. Taking into account the low angle misorientation criterion, no significant variation in the mean unit size was observed. Similar mean unit sizes were measured prior to and after induction treatment. However, when the high angle misorientation criterion was analyzed, finer microstructures were measured after induction heat treatment. This trend was observed for every Fast Cooling Temperature. For example, mean grain sizes (considering the high angle misorientation criteria) of 6.21 and 4.67 µm were measured for the FCT720 and FCT720-HT samples, respectively. This effect could be related to the abovementioned decomposition of the secondary phases during rapid heating (see Figure 6).
In addition to analyzing the evolution of the mean grain size, an evaluation of microstructural heterogeneity was carried out. For that purpose, the ratio between the 20% critical grain size (Dc20%) and the high angle mean grain size (D15°) was estimated and plotted as a function of FCT in Figure 9b. In a grain size distribution, Dc20% is known as the cutoff grain size at the 80% area fraction and is able to evaluate the length of the grain size distribution tail [17]. Given that the presence of coarse grains affects the toughness properties, the evaluation of heterogeneity is crucial. Looking at Figure 9b, a clear effect of the microstructure on Dc20%/D15° can be observed. An increment in the Dc20%/D15° value occurred as the FCT decreased from 790 to 650 °C. This could be associated with the formation of more bainitic phases when a low Fast Cooling Temperature was used [18,19]. Nevertheless, no significant effect of rapid heating on heterogeneity was observed when the FCT and FCT-HT results were compared. Similarly, the Dc20%/D15° ratio was measured before and after induction treatment.
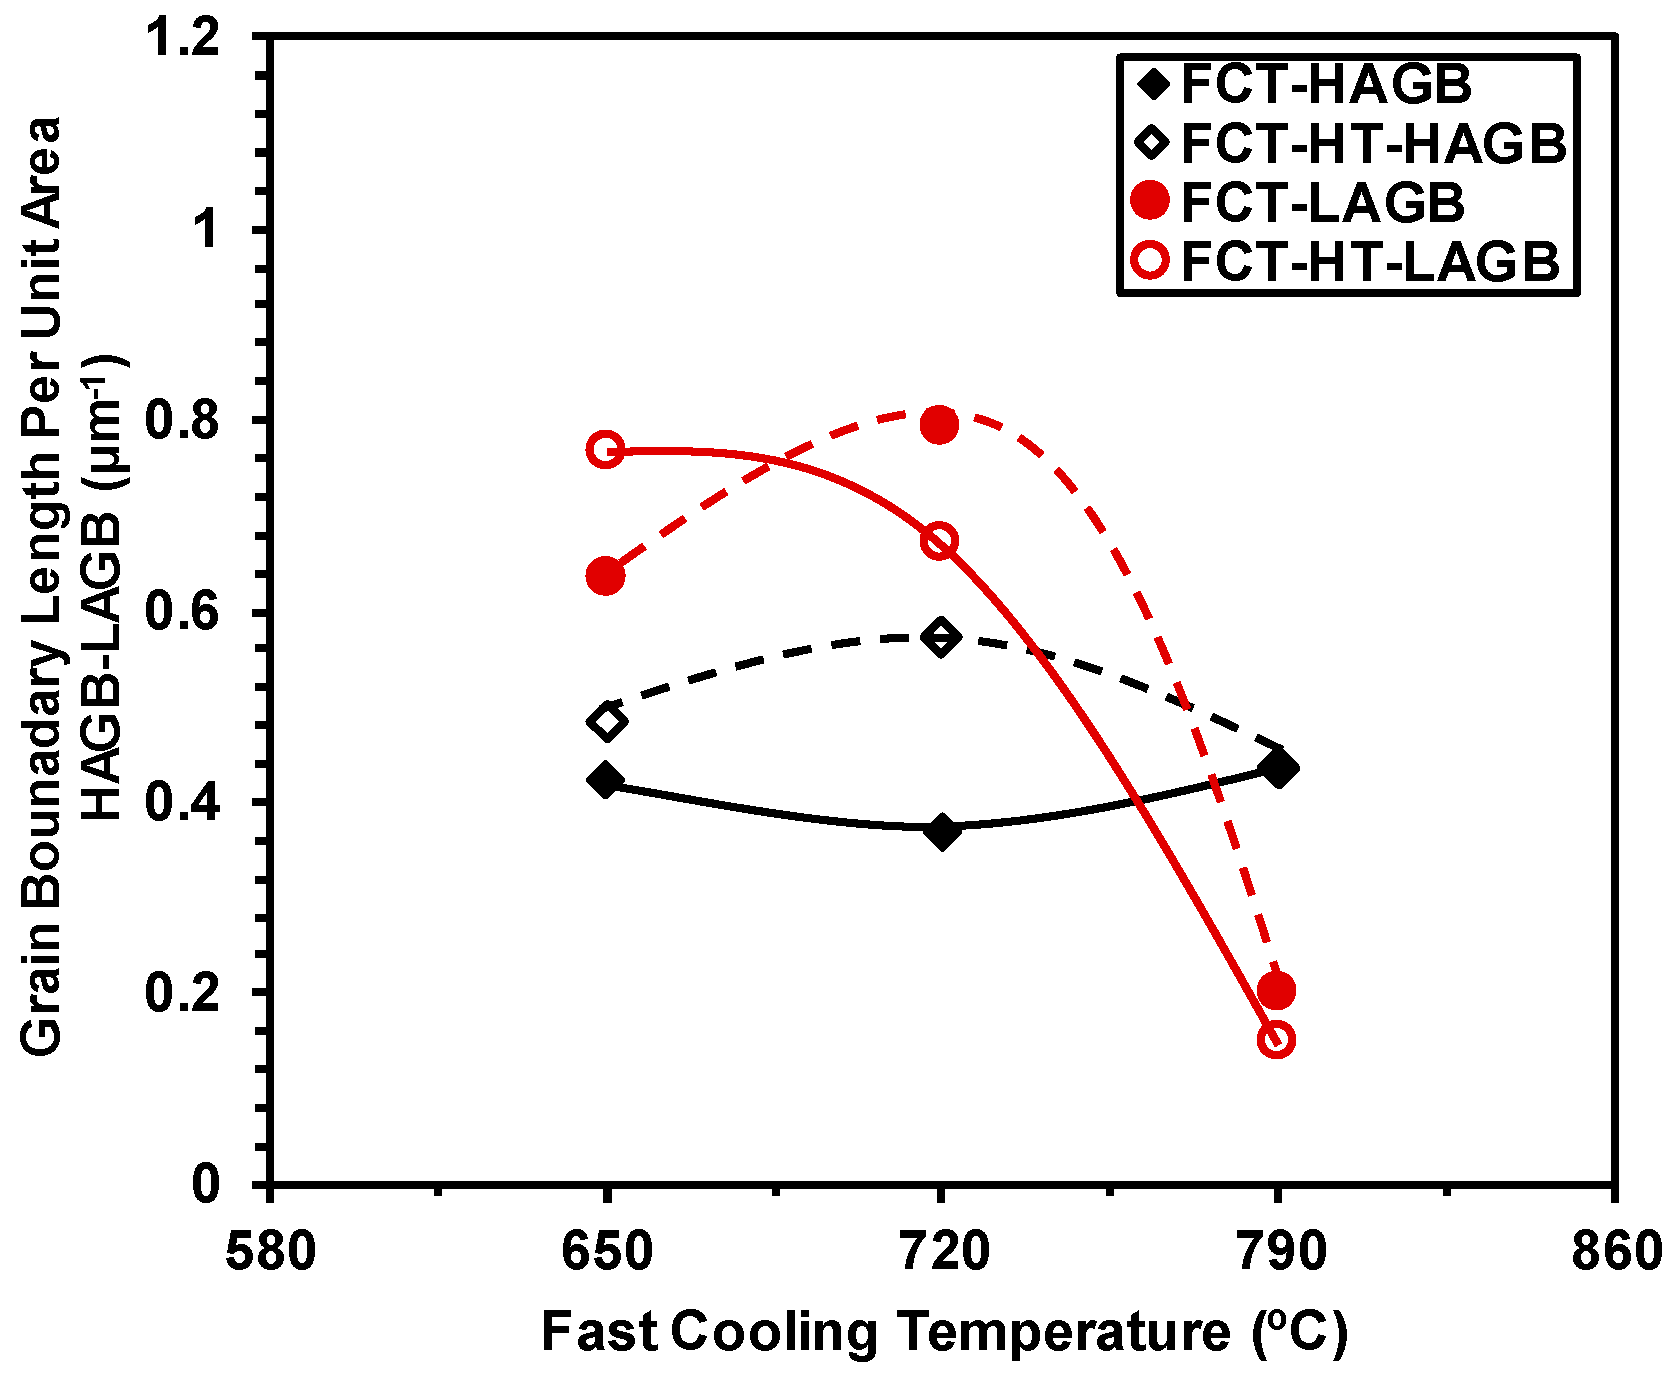
To further understand the differences observed in Figure 9a, an evaluation of the effect of induction treatment on the density of high and low boundaries was performed. For that purpose, the grain boundary lengths per unit area for both high angle (HAGB) and low angle (LAGB) grain boundaries were calculated. High and low angle grain boundary lengths per unit area are plotted for all of the FCT and FCT-HT conditions in Figure 10. Regarding the low angle boundary length, no clear effect of fast heating was observed. This trend could explain the similar mean unit size measured for low angle boundaries before and after induction heat treatment (see Figure 9a). Huang et al. [20] also observed a negligible effect of recovery in bainitic microstructures during tempering. Conversely, for high angle boundaries, higher grain boundary lengths were estimated after HT, reflecting that a higher density of HAGB was obtained. The decomposition of MA islands during induction treatment can cause the formation of new fine grains, leading to an increment of high angle boundaries and a refinement of mean unit sizes (considering boundaries higher than 15°) after rapid heating (see Figure 9a).
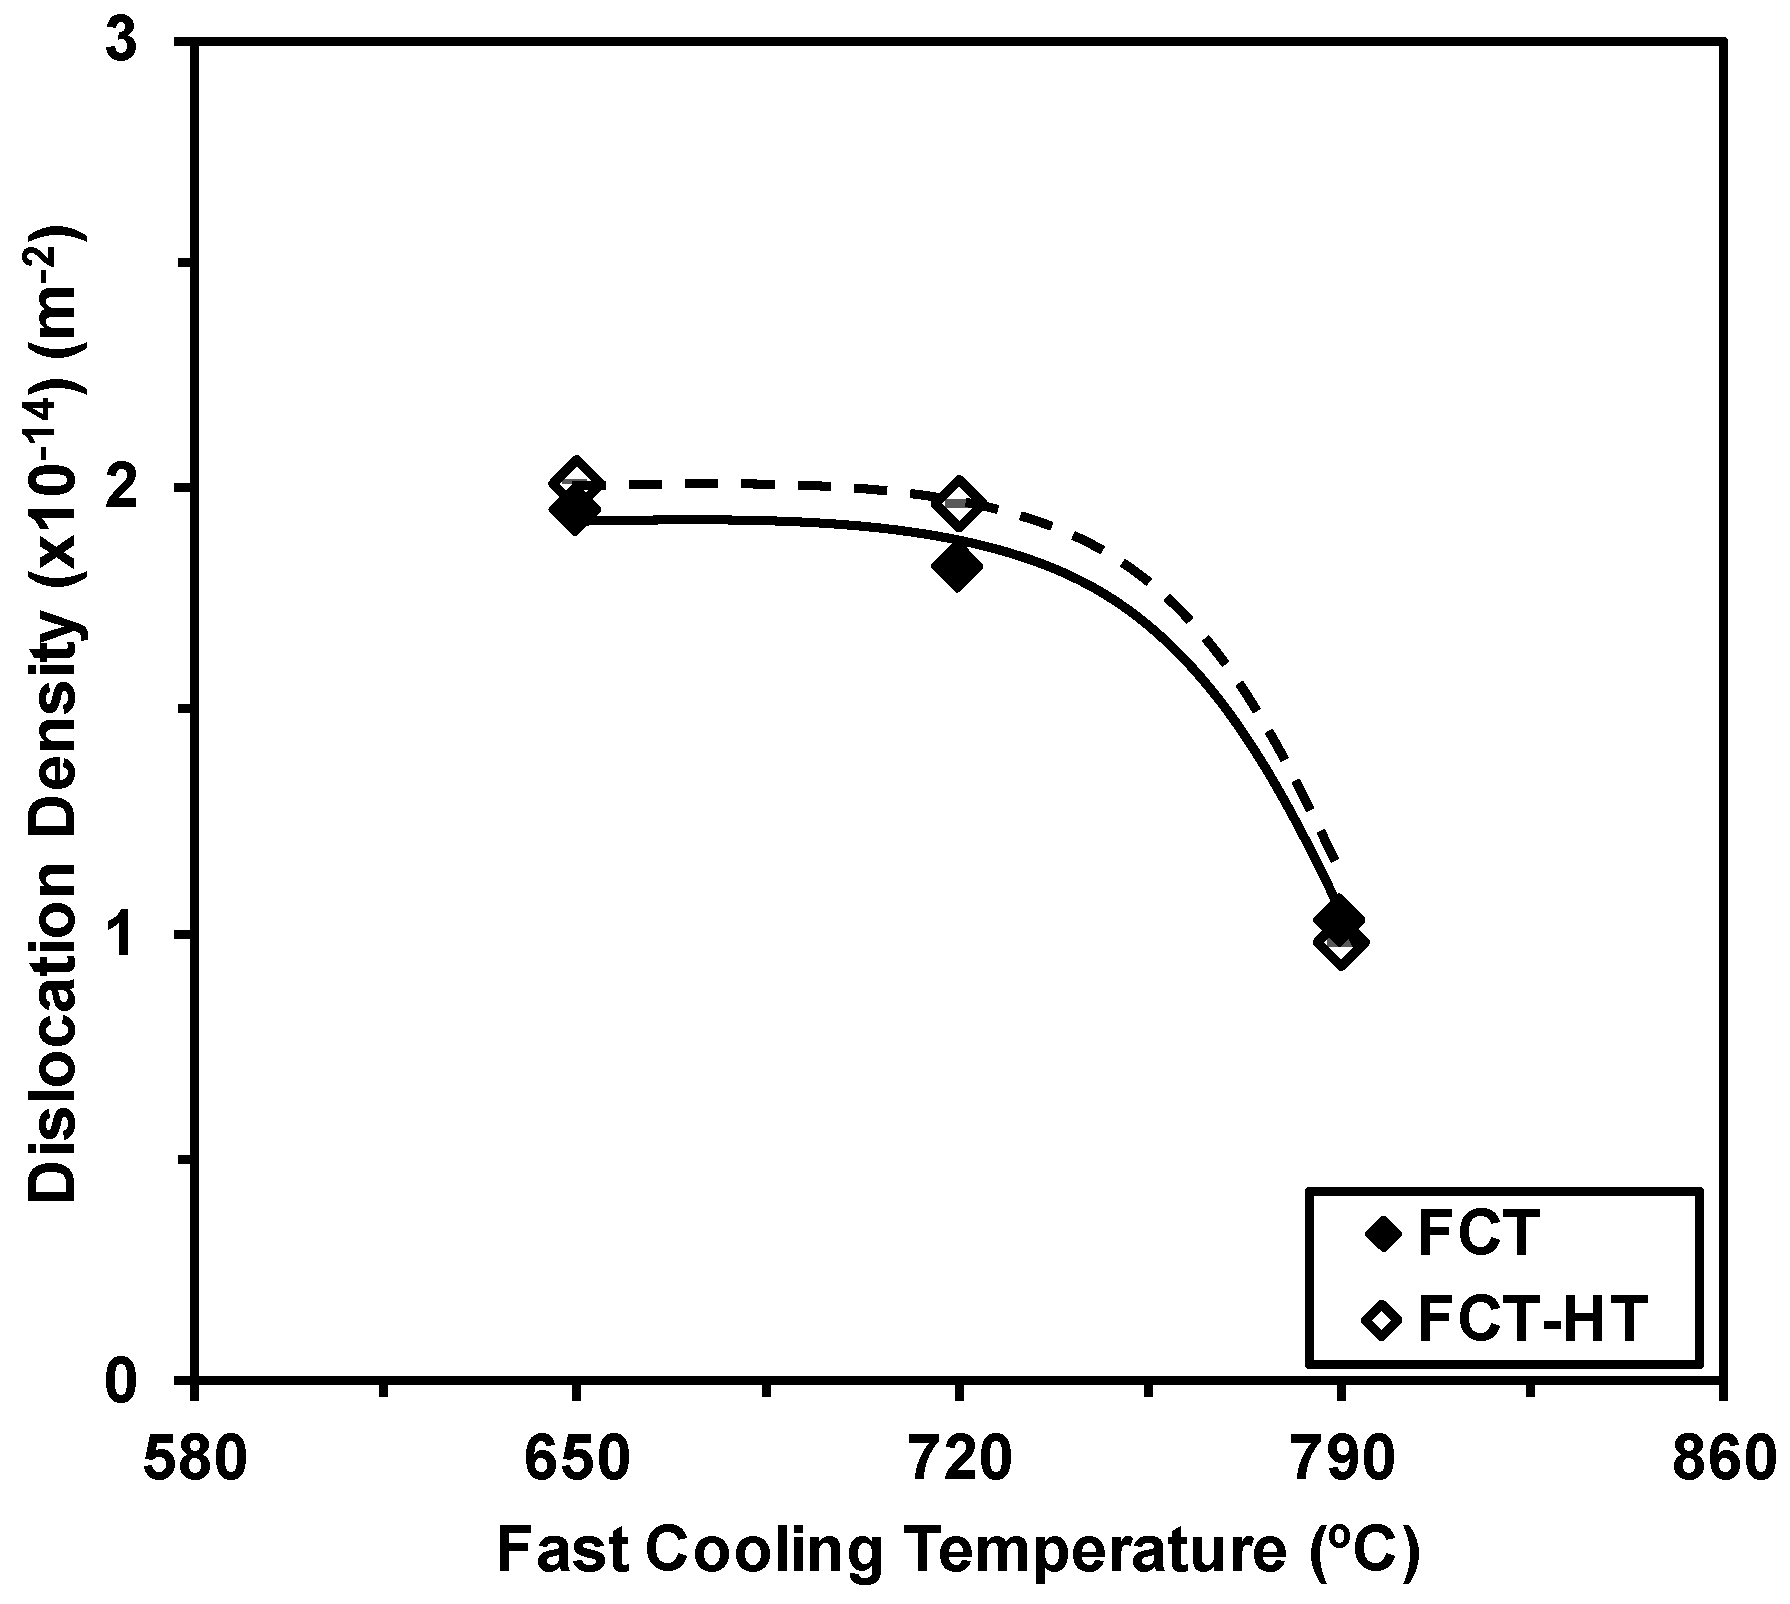
From the EBSD analyses and using ϑ as the Kernel Average Misorientation (KAM) parameter, dislocation density was estimated for the different conditions. A deeper description of the followed methodology was shown in recent works [10,21]. For that purpose, in Figure 11a,c,e Kernel maps corresponding to FCT790, FCT720, and FCT650 (without heat treatment) are compared. Additionally, in Figure 11b,d,f, images corresponding to the HT samples are shown. Regarding the Fast Cooling Temperature, the lower FCT caused an increment in the dislocation density. The formation of more bainitic phases in the lowest FCT resulted in higher ϑ values. No considerable effect of induction treatment was observed when kernel maps obtained from the samples without and after heat treatment were compared. This trend was observed in both ferritic and bainitic microstructures. For example, ϑ values of 1.06 and 1.09° were quantified for FCT790 and FCT790-HT conditions, respectively (leading to dislocation density, ρ, values of 1.95·1014 m−2 and 2·1014 m−2).
In Figure 12, dislocation density measurements are represented as a function of the Fast Cooling Temperature for both FCT and FCT-HT conditions. Dislocation density values varied from 0.98·1014 m−2 to 2·1014 m−2 depending on the FCT and the applied cycle. When the FCT decreased from 790 to 720 °C, the formation of more bainitic microstructures with higher dislocation densities was shown (ρ increased from 1.03·1014 m−2 to 1.82·1014 m−2). However, the dislocation density remained nearly constant for FCT720 and FCT650. As mentioned previously, induction heating does not considerably affect the dislocation density, and similar values were quantified for the samples obtained before and after the rapid heating step. Therefore, it can be concluded that there is a lack of microstructural variation in terms of dislocation density during induction heat treatment for the entire range of Fast Cooling Temperatures (for every microstructure). Similar behavior has already been reported in other studies [20], in which no effect of tempering on dislocation density was observed for mainly granular bainitic microstructures.
3.3. Precipitation Analysis
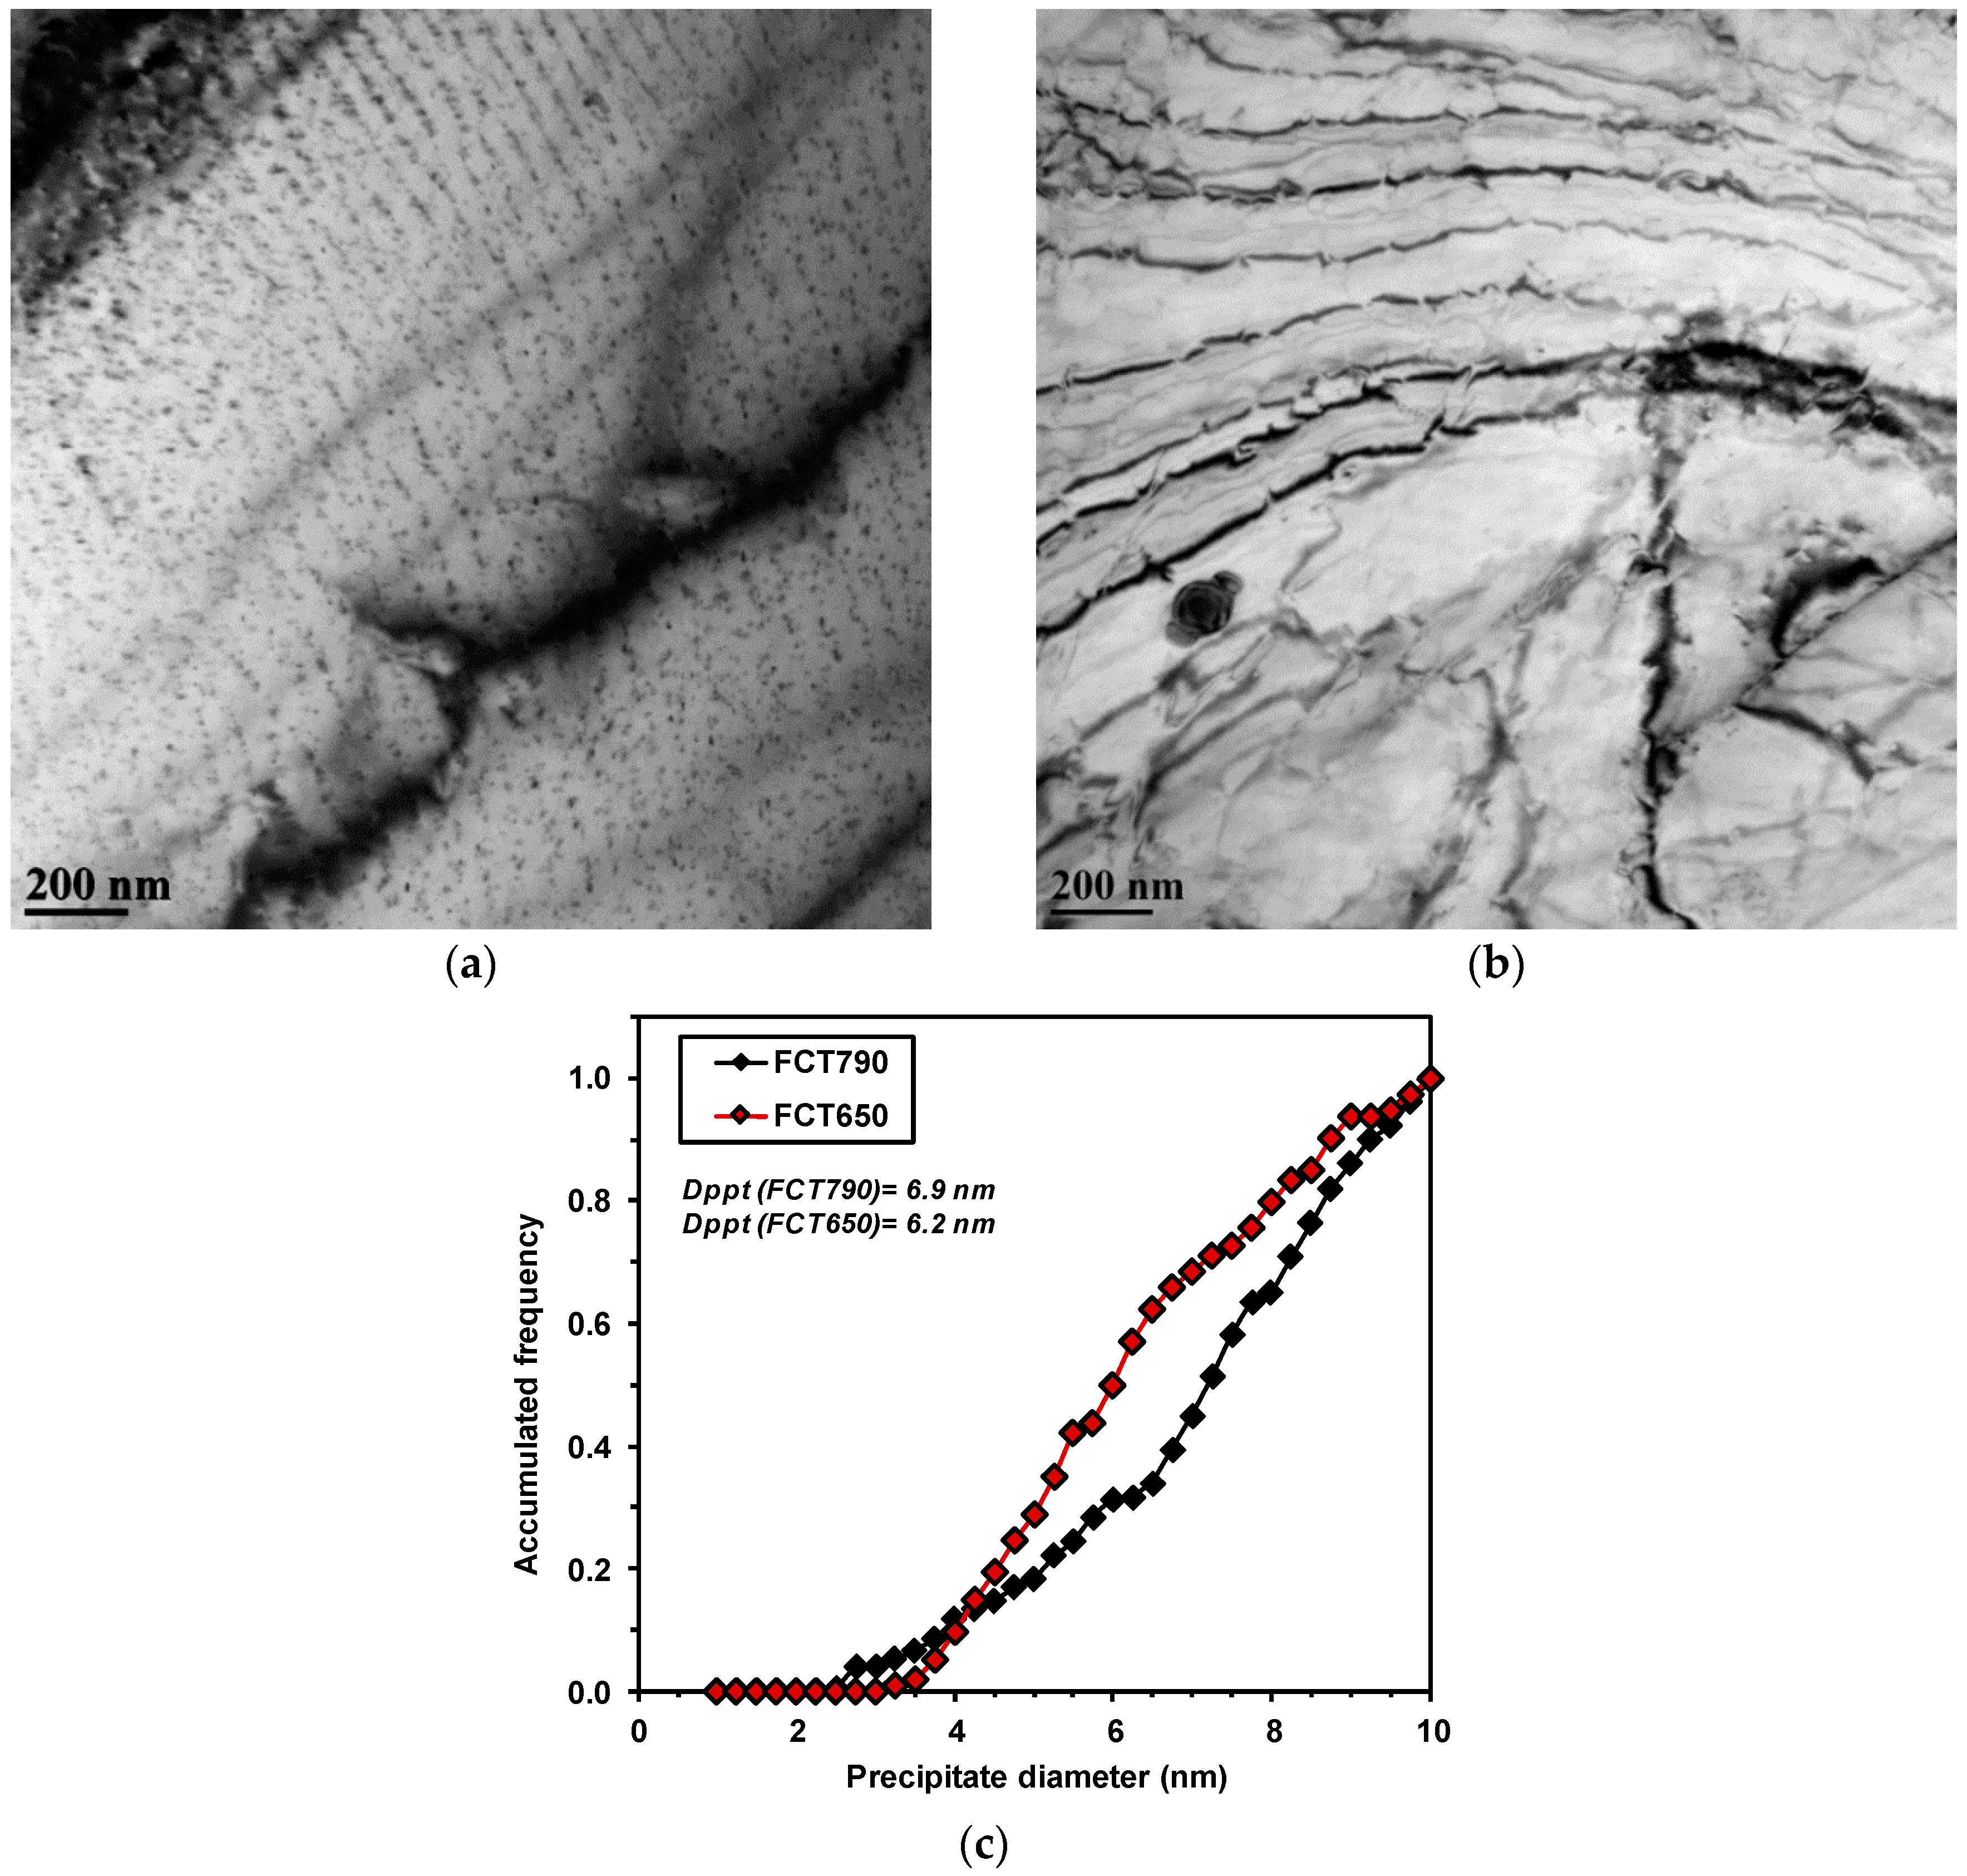
In order to evaluate the effect of FCT on precipitation as well as the influence of induction heat treatment, samples obtained before and after heat treatment were analyzed by TEM. Regarding the effect of the Fast Cooling Temperature and, therefore, the resulting microstructures, Figure 13a,b show the TEM micrographs corresponding to FCT790 and FCT650. From comparing both images, it is evident that FCT significantly modifies the precipitation taking place during continuous cooling after hot rolling [22]. When a high FCT of 790 °C is applied, interphase precipitation was clearly observed, while in the lowest FCT of 650 °C, low density of fine precipitates was detected. Therefore, the increment of FCT promotes the formation of a higher fraction of fine precipitates, ensuring a more pronounced strengthening contribution due to fine precipitation [23]. EDS analyses showed that the precipitates were Ti- and Mo-containing carbides [24]. It has been reported that the considerable strengthening effect observed in Ti–Mo microalloyed steels is attributed to the superior coarsening resistance of the (Ti, Mo)C carbide as compared to other carbides, such as TiC and (Ti, Nb)C [4]. In order to evaluate the hardening associated with the presence of fine particles, the precipitate size was measured for both FCT790 and FCT650 conditions, and the results are shown in Figure 13a,b. To quantify of precipitate size, particles smaller than 10 nm were taken into account, as they are supposed to be more efficient in terms of precipitation hardening. In Figure 13c, the precipitate size distributions (in terms of accumulated frequency) are presented for both FCTs. The results suggest that slightly finer precipitates formed as the FCT decreased. Mean precipitate sizes (Dppt) of 6.9 and 6.2 nm were quantified for FCT790 and FCT650 samples, respectively. Nevertheless, as mentioned previously, noticeably higher precipitate concentrations were distinguished for the FCT of 790 °C compared to 650 °C (see Figure 13a,b). In Ti–Mo microalloyed steels, the important contribution of fine precipitation has already been reported in several studies, and not just for plate hot rolling. In thin strip products, significant precipitation hardening can be achieved through an adequate coiling strategy [2,5,25].
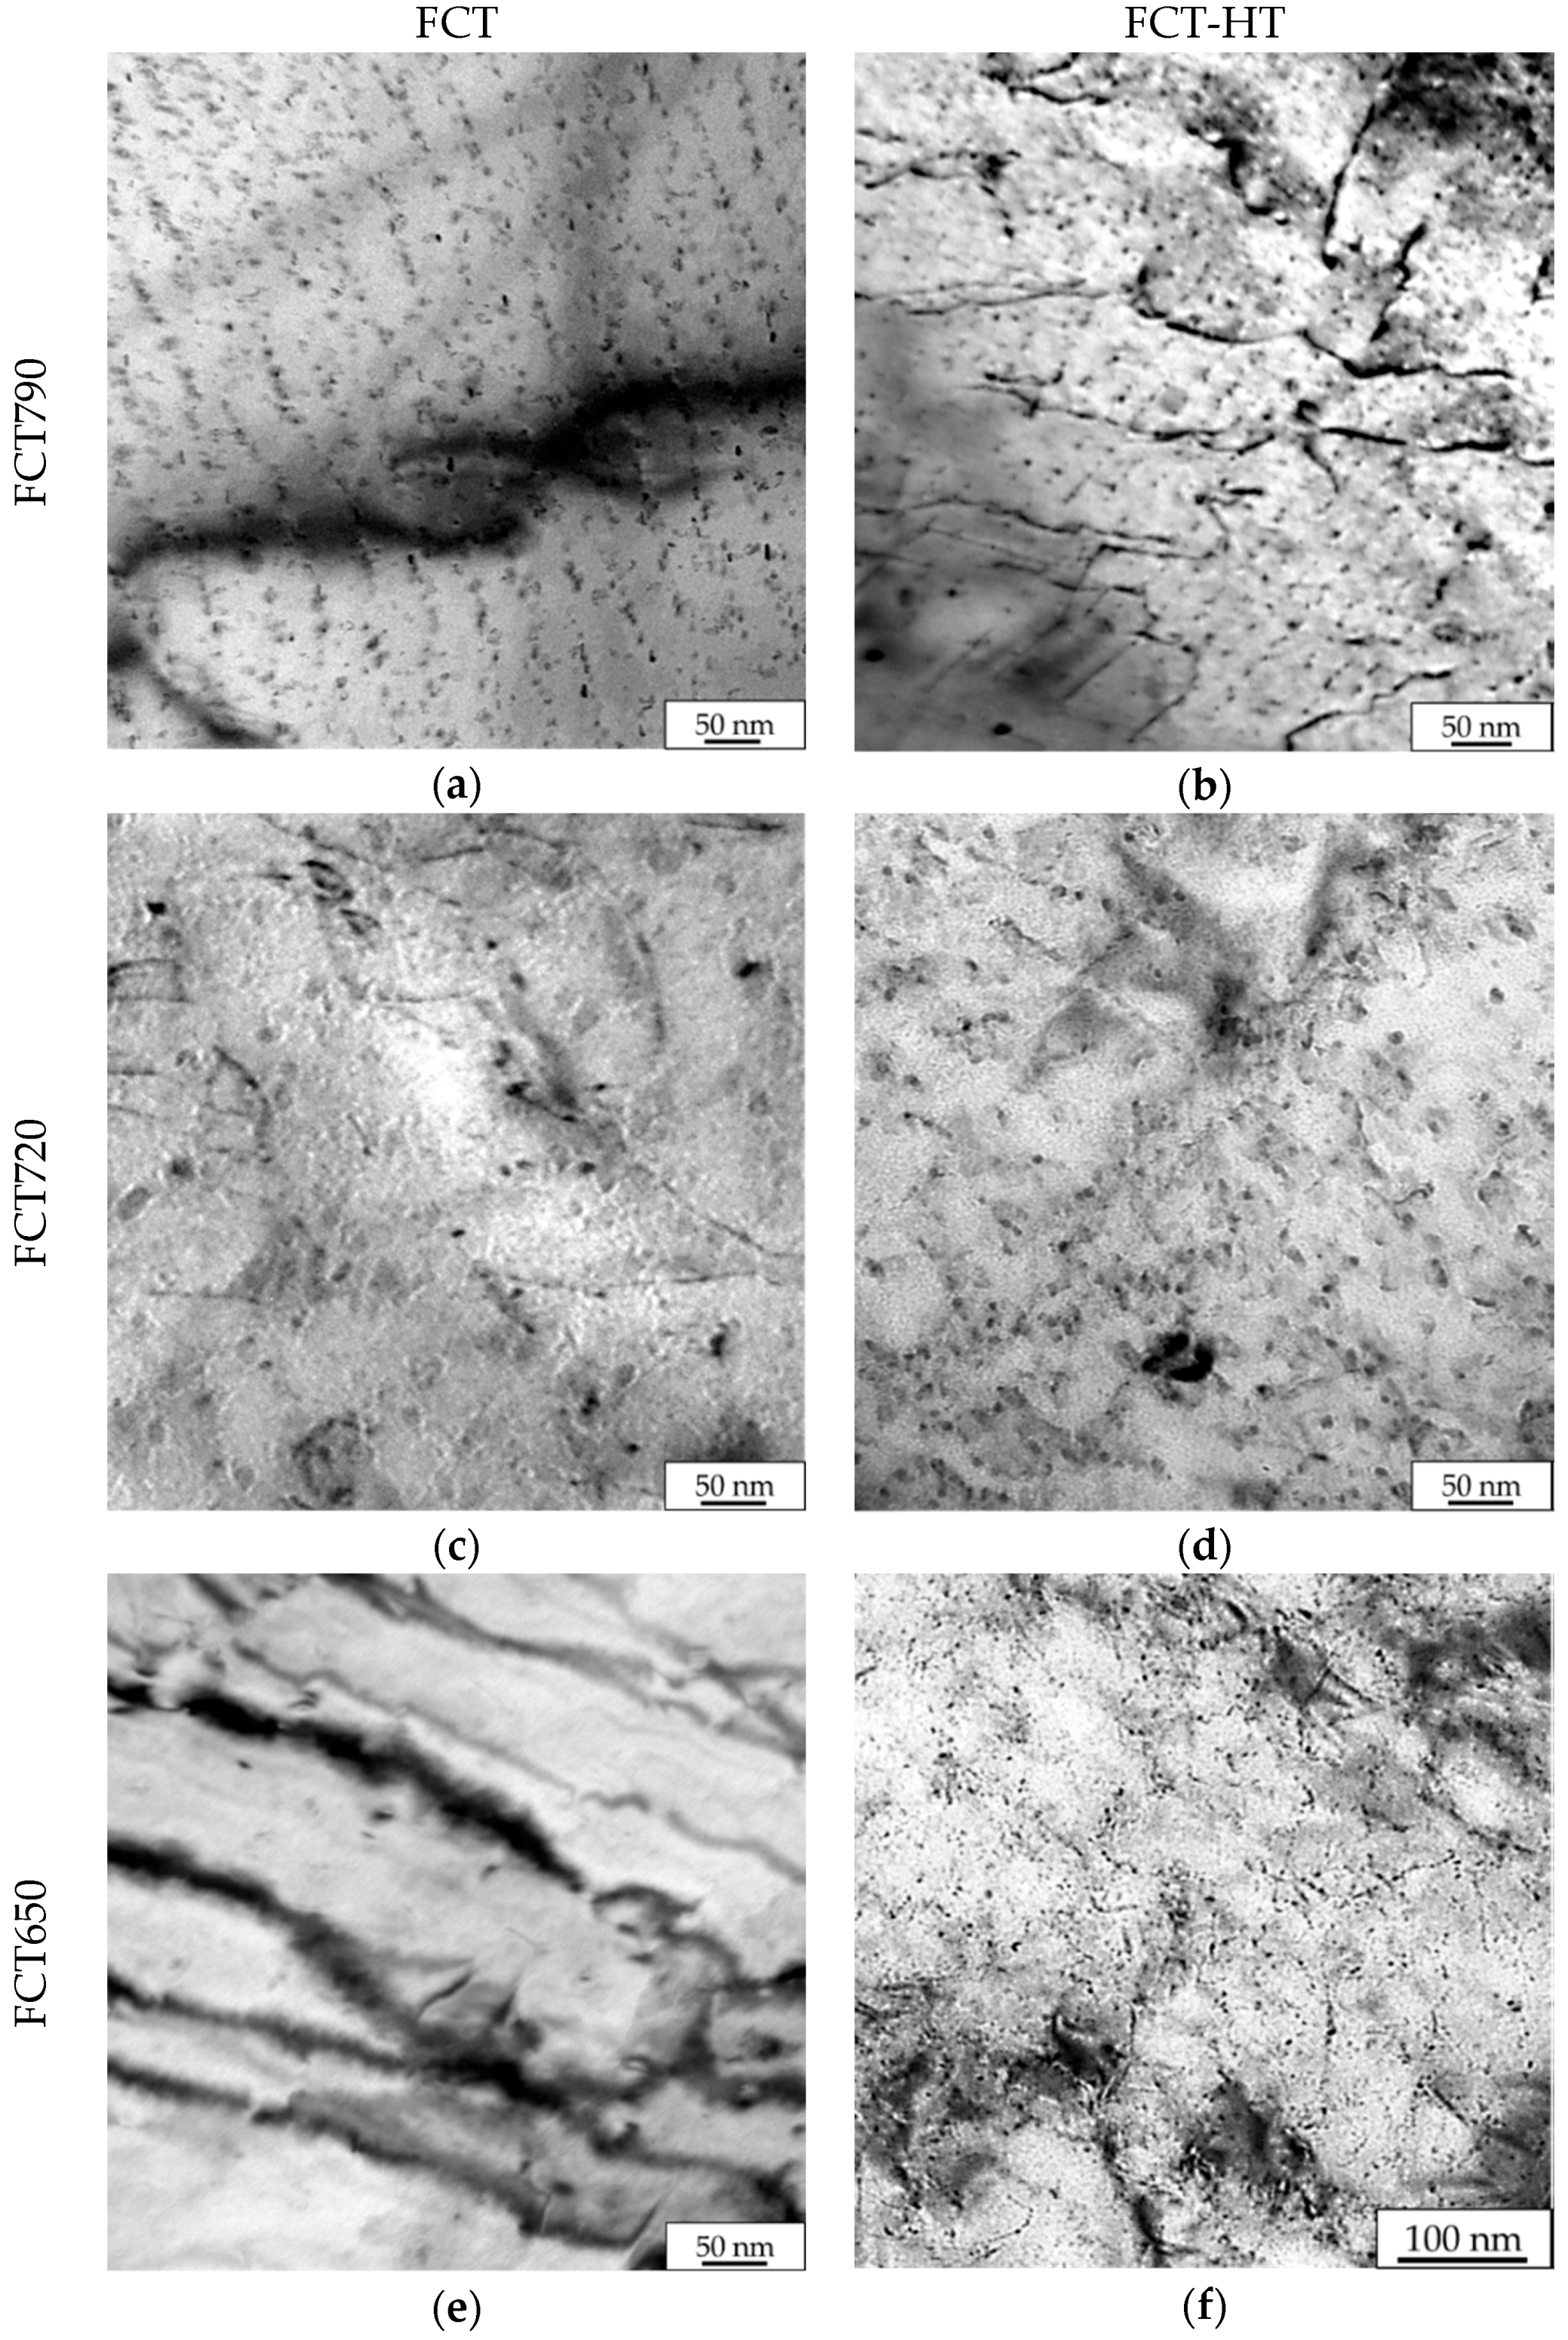
Figure 14a–c show TEM micrographs at high magnifications in relation to the specimens obtained before heat treatment and the different Fast Cooling Temperatures. Moreover, in Figure 14d–f, the images corresponding to the heated samples are included for each FCT. By analyzing the micrographs corresponding to the samples without HT, as observed previously, the analysis using TEM suggests that the modification of FCT affects the size and the density of fine precipitates. As observed in Figure 13, for the highest FCTs (790 °C), the formation of aligned precipitates (interphase precipitation) was confirmed. However, at the intermediate FCT of 720 °C, random precipitation was clearly observed. When the lowest FCT of 650 °C was used, low precipitate fractions were shown. Therefore, lower precipitate densities were detected with a decreasing FCT. This could justify the yield strength enhancement that was previously observed when the FCT increased from 650 to 790 °C (see Figure 3).
Concerning the effect of induction heating on the strengthening due to precipitation, significantly higher precipitate densities were observed in the heated specimens than in the samples without heat treatment. In addition to interphase precipitates, random precipitates were observed in the ferritic microstructure obtained in the FCT790-HT condition. After an intermediate FCT of 720 °C, a higher density of fine precipitates was observed in the heated sample than in the sample obtained prior to heat treatment. Nevertheless, when a mainly bainitic microstructure formed at FCT650, the induction treatment promoted the formation of a more relevant precipitation. A higher precipitate concentration was observed in the FCT-HT sample compared to the FCT condition [9,15].
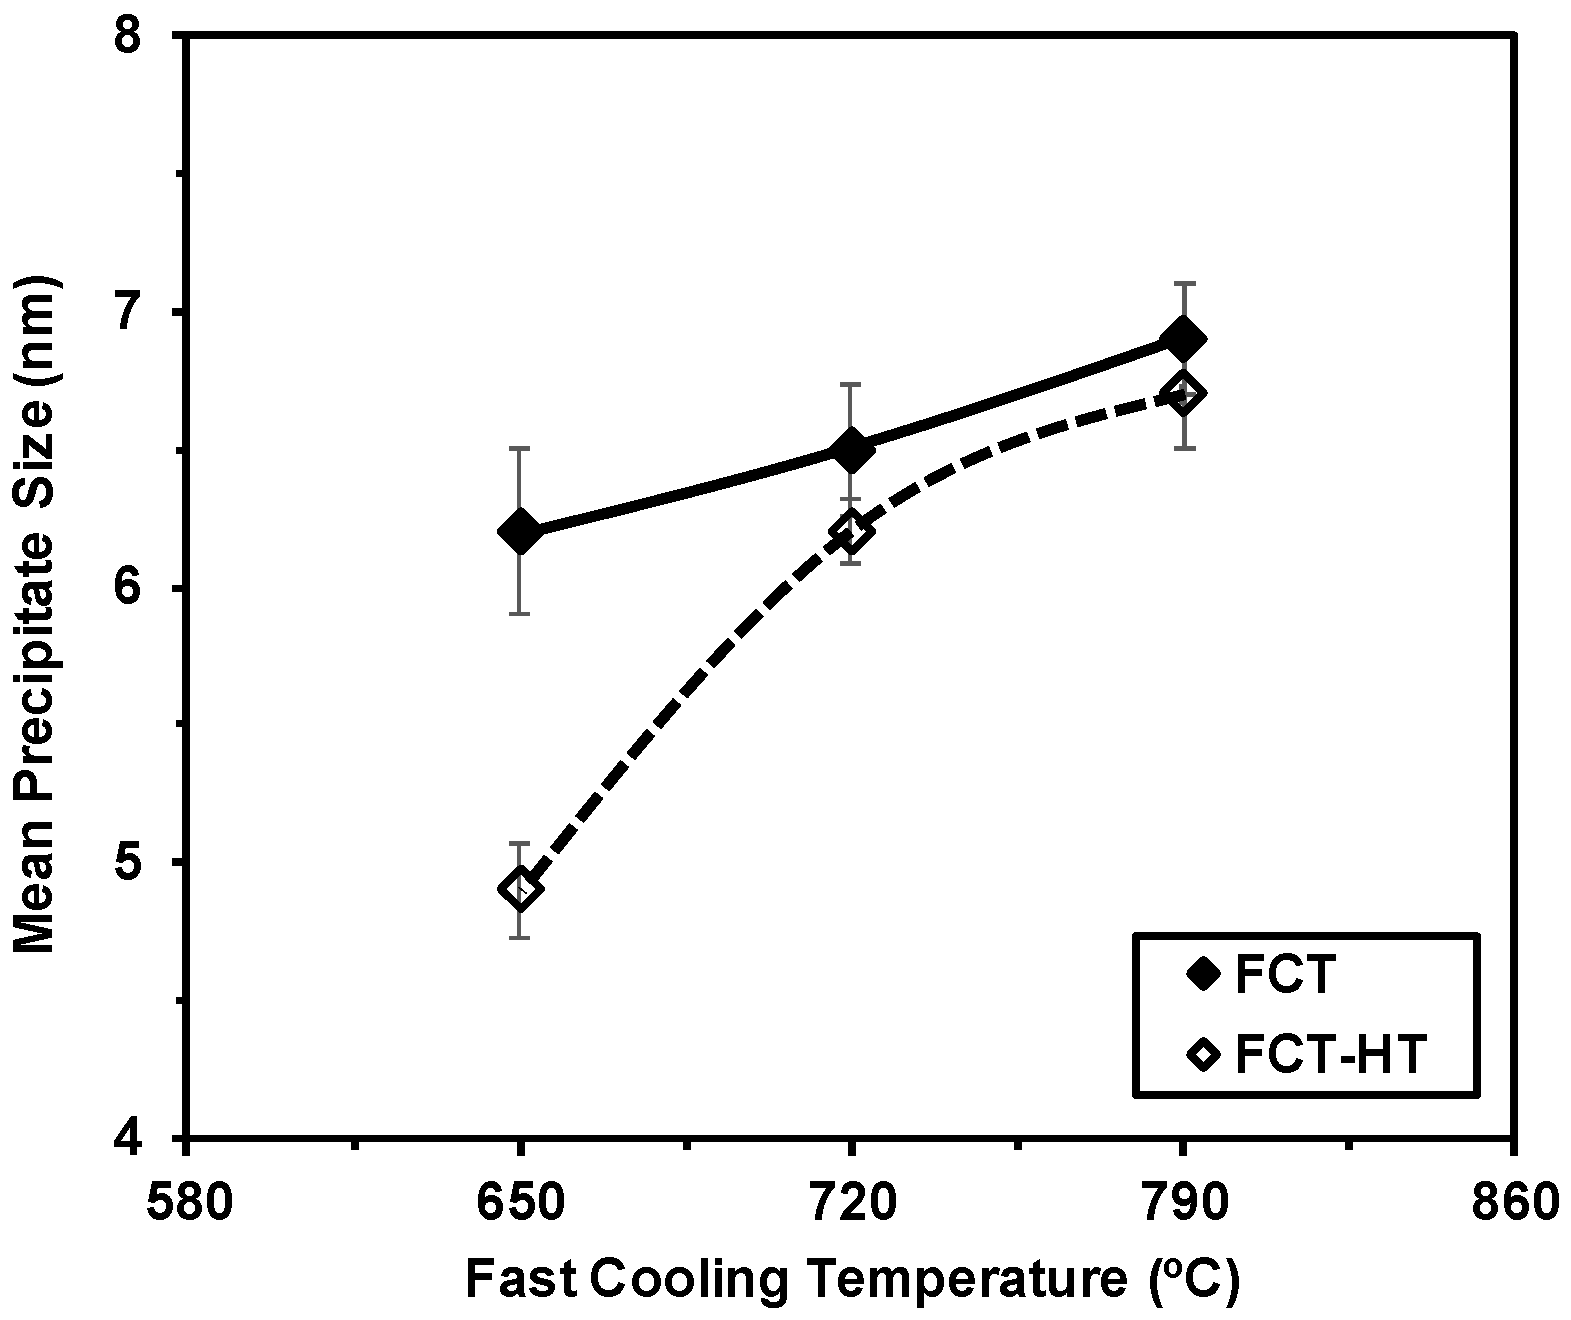
Quantification of the mean precipitate sizes was performed for all of the generated microstructures. In Figure 15, the evolution of the mean precipitate size as a function of the Fast Cooling Temperature was plotted for both FCT and FCT-HT conditions. In terms of the effect of FCT, as mentioned before, slightly fine mean precipitate sizes were achieved as the FCT decreased. Similar trends were observed for the samples obtained before and after induction treatment. The results shown in Figure 15 suggest that rapid heating led to the formation of finer precipitates, mainly in the bainitic matrix formed at the lowest FCT of 650 °C. Therefore, finer precipitates were formed during rapid heating mainly for the FCT650 condition. For example, for the FCT of 650 °C, Dppt values of 6.2 and 4.9 nm were measured for the FCT and FCT-HT conditions. In addition to the precipitate refinement, for both the ferritic and bainitic matrices, a higher concentration of fine precipitates was detected after heat treatment, ensuring a higher strengthening contribution owing to precipitation (see TEM micrographs shown in Figure 14).
3.4. Interactions between Microstructure and Tensile Properties
In the current work, the yield strength was estimated according to Equation (1), in which a linear sum of the different strengthening contributions was considered (solid solution, grain size, dislocation density, presence of MA islands, and precipitation):
Given the limitations in the estimation of an accurate precipitate volume fraction, the term related to fine precipitation was estimated by subtracting the hardening due to the rest of the contributions from the experimental yield strength values. A more detailed explanation of the approaches as well as the methodology followed are be found in references [5,10].
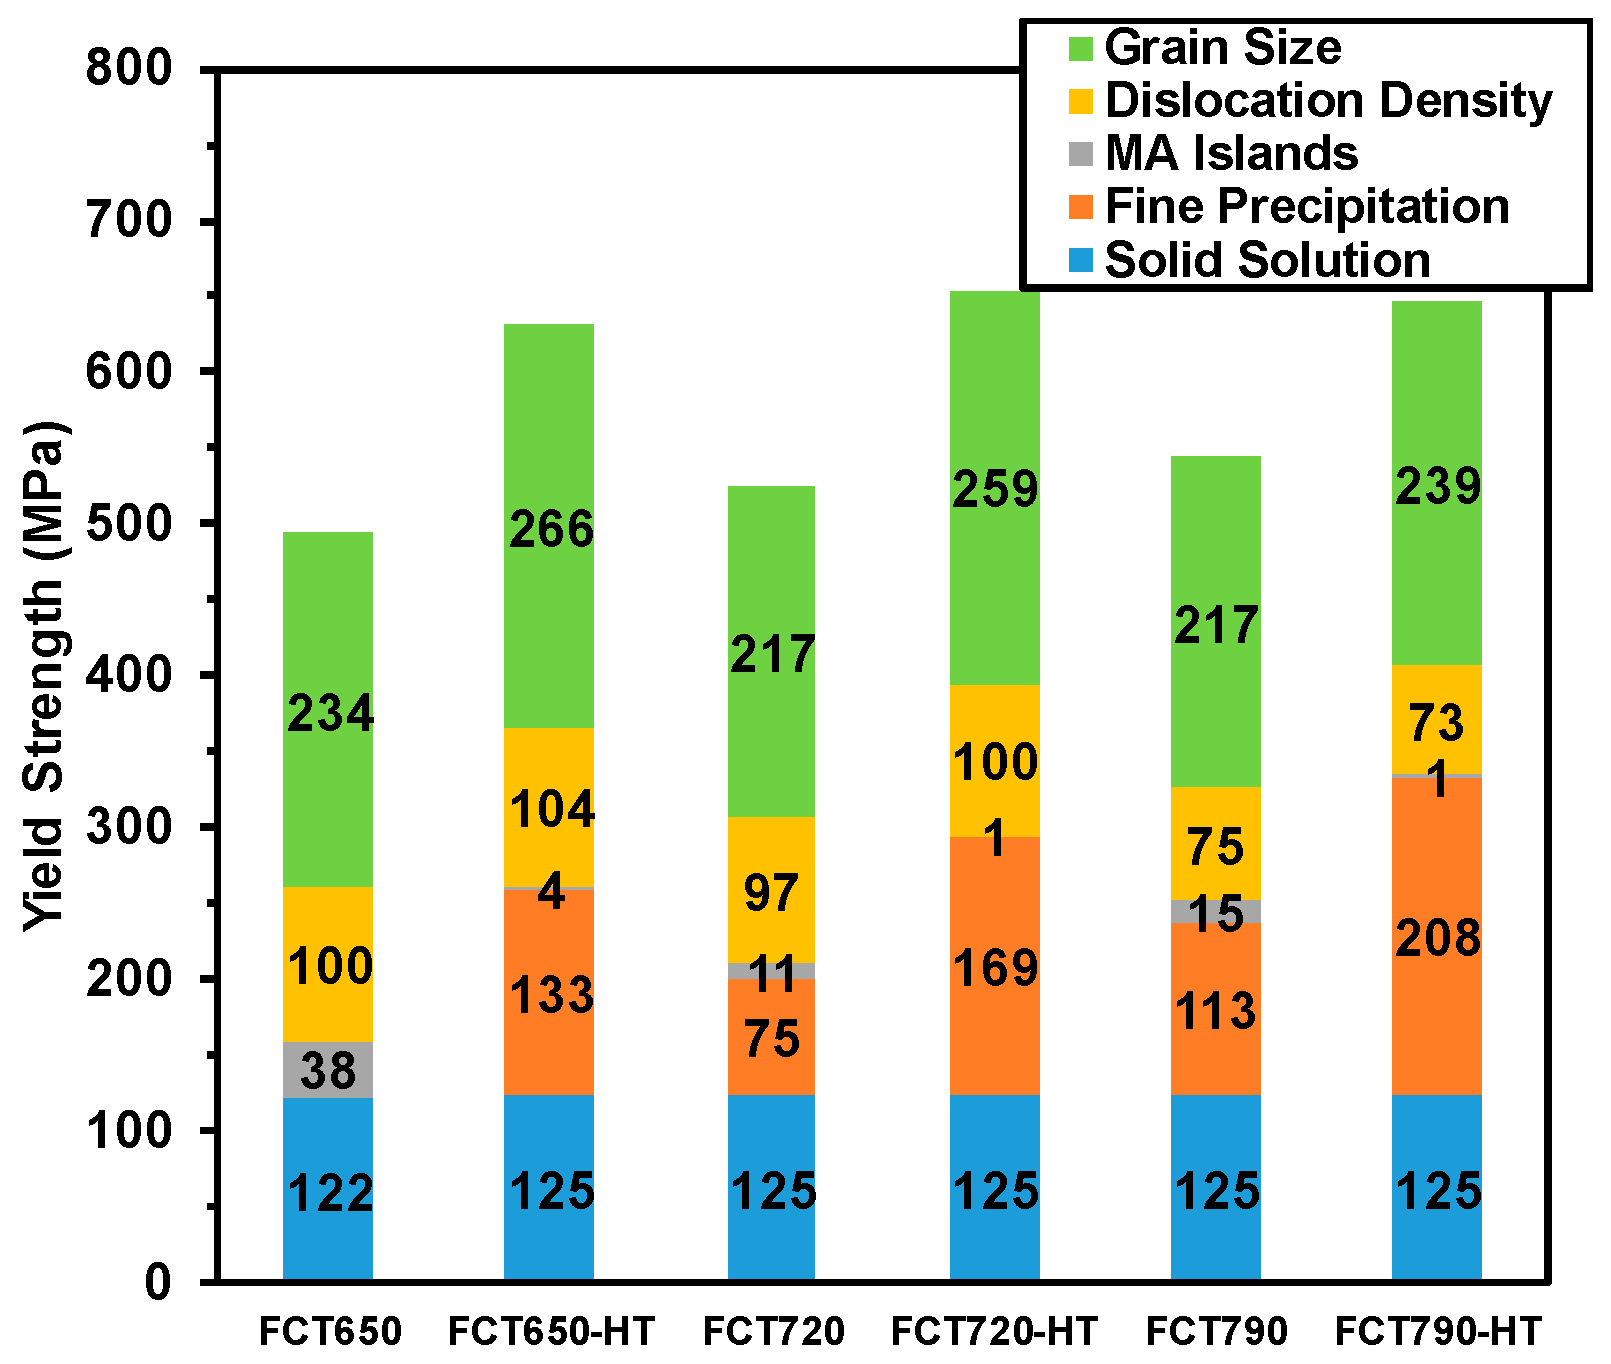
In Figure 16, the contribution of the different hardening mechanisms is plotted for all the microstructures obtained from the different FCTs. Figure 16 indicates that the most important strengthening mechanism is the grain size. The analysis of the results concerning the samples without rapid heating showed that higher grain size contributions were measured as the FCT decreased. The formation of more bainitic matrices implies an increment in the term related to the dislocation density. Higher contributions for dislocation strengthening were achieved as the FCT decreased. The results plotted in Figure 16 also suggest that higher precipitate contributions were measured for the highest FCT of 790 °C. Precipitation hardening values of 113, 75, and 0 MPa was calculated for FCT790, FCT720, and FCT650, respectively. This is in line with the previously shown precipitation characterization, in which a higher precipitate density was detected in FCT790 compared to in the FCT720 and FCT650 conditions.
The data plotted in Figure 16 facilitates an evaluation of the influence of induction treatment on the strengthening mechanisms. Regarding the contribution related to grain size, slightly higher terms were estimated after rapid heating for every FCT and microstructure. This can be explained by the partial decomposition of the formed MA islands that takes place during heat treatment. However, no significant effect of heat treatment on dislocation density was detected. Similar dislocation density terms were estimated before and after HT. On the other hand, fast heating led to the reduction of the strengthening caused by MA islands, due to the partial dissolution of the secondary phase that occurs during treatment. In terms of the influence of heat treatment on precipitation, a higher hardening effect due to fine precipitates is estimated after induction treatment. When mainly ferritic phases are predominant (HT790), strengthening due to fine precipitation improved by about 95 MPa after induction treatment. Nevertheless, when more bainitic microstructures formed (HT650), an increment of yield strength of approximately 133 MPa was achieved through rapid heating. Therefore, it can be claimed that tensile property enhancement is more pronounced for bainitic microstructures than for ferritic microstructures. The high dislocation density that is typical of bainitic microstructures offered nucleation sites for precipitate to form during the fast heating.
3.5. Effect of Induction Strengthening on Toughness Properties
The improvement in tensile properties can impair toughness properties, mainly when precipitation hardening is the mechanism behind the strengthening. Therefore, an evaluation of the link between induction heating, microstructural parameters, and impact properties was carried out. Additionally, the effect of the initial microstructure morphology (ferritic or bainitic) on toughness property impairment was evaluated.
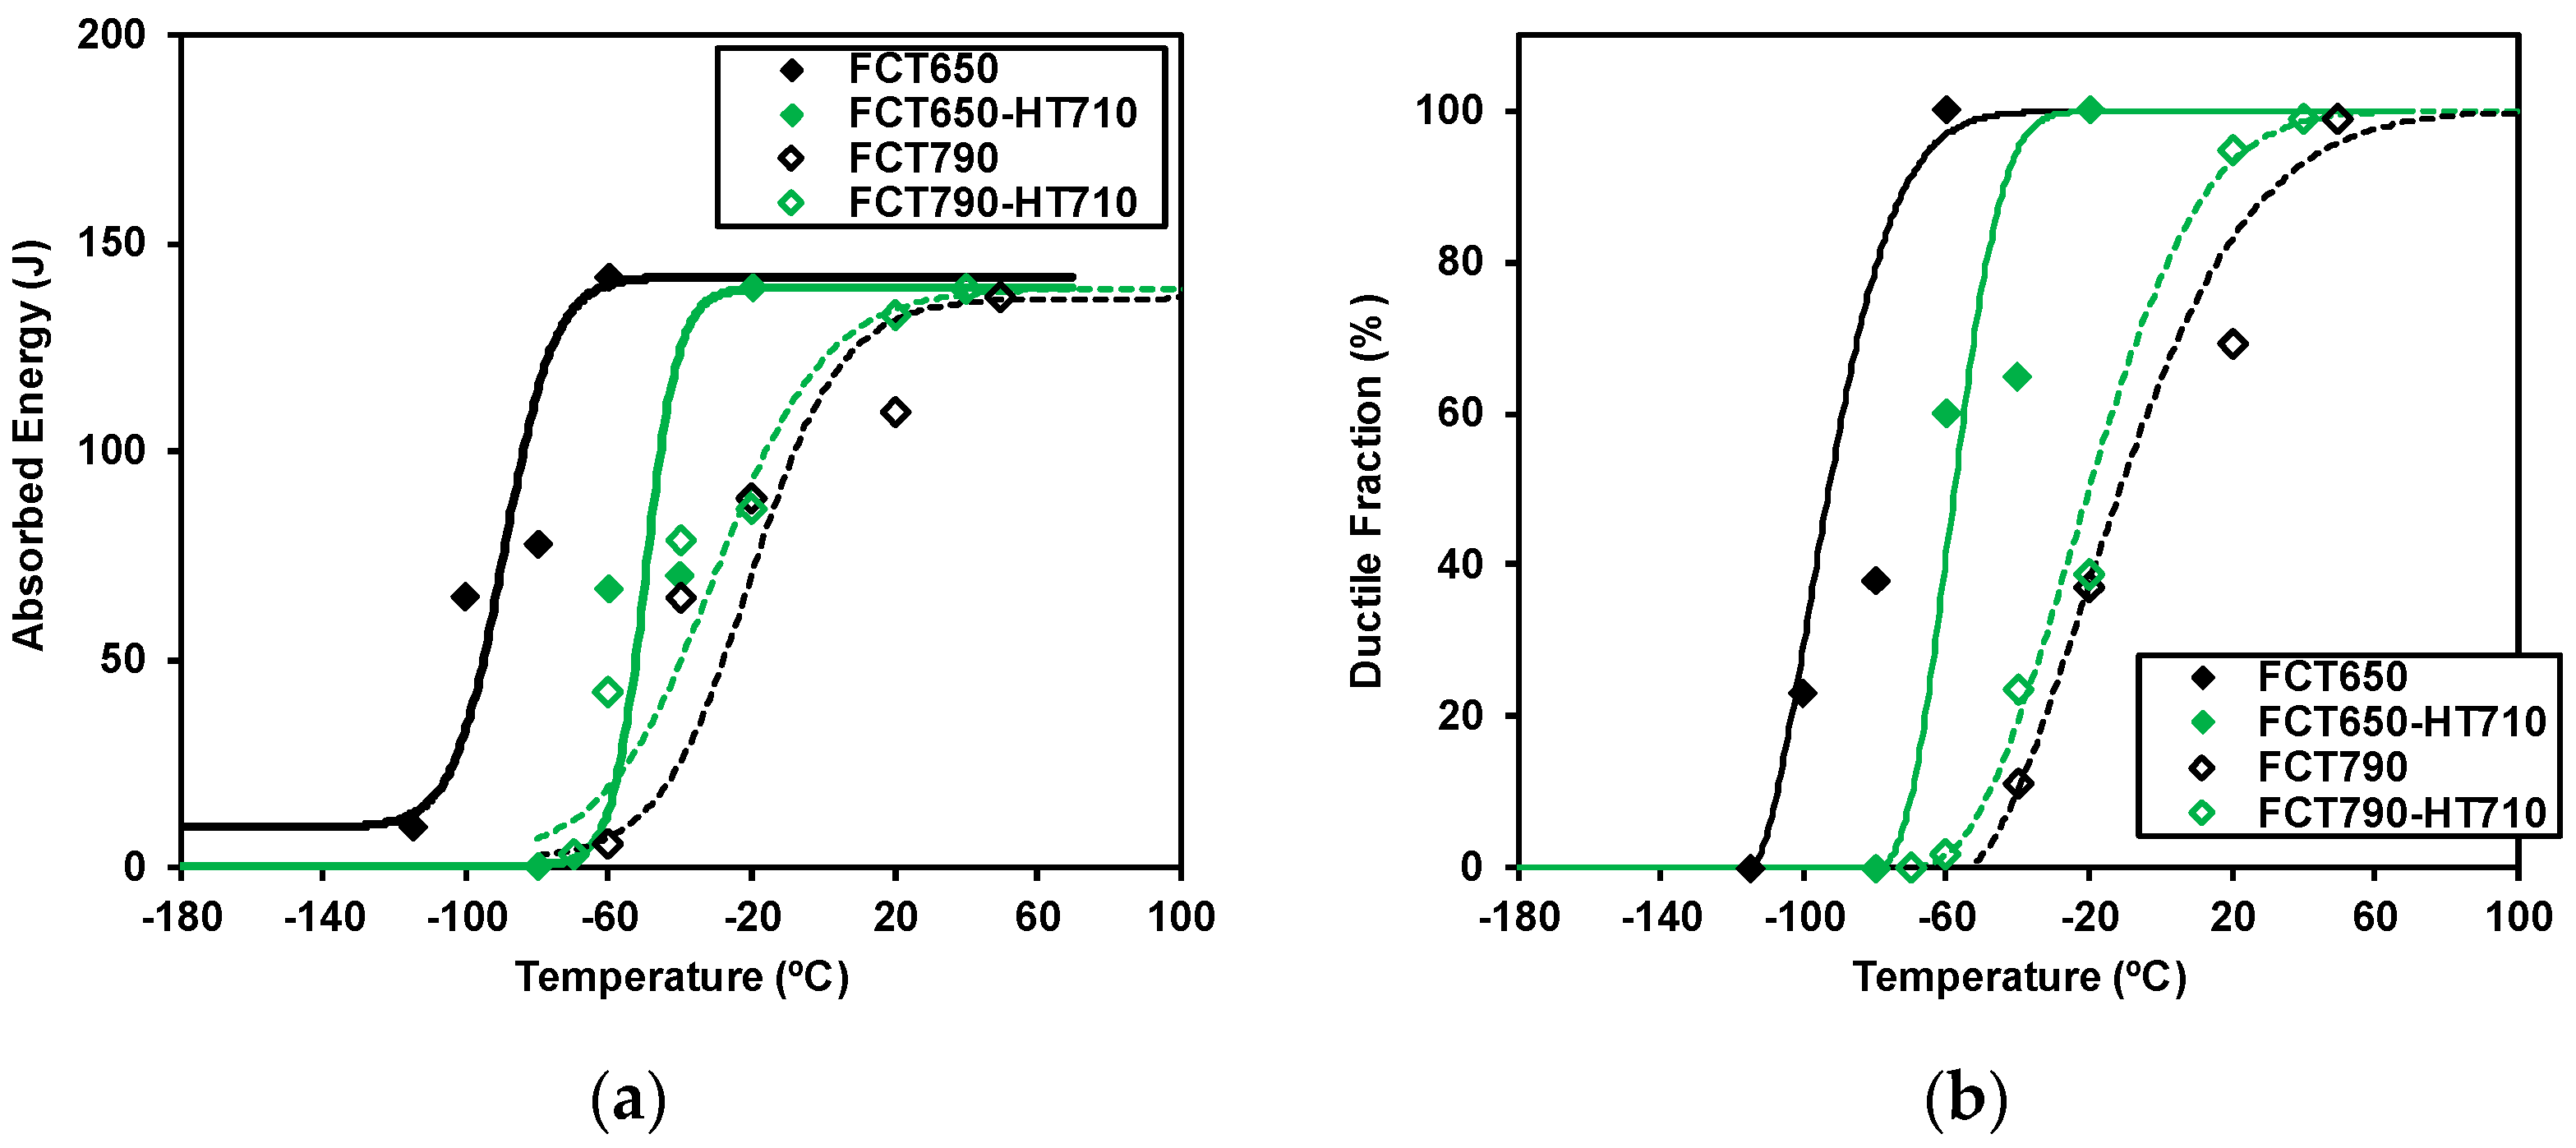
In the current work, Charpy tests were performed for the two extreme conditions of FCT790 and FCT650. In Figure 17, the Charpy curves obtained for the microstructures without treatment and treated samples are shown for both microstructure types (ferritic and bainitic in FCT790 and FCT650). In Figure 17a, the absorbed energy is plotted for the mentioned conditions, while Figure 17b shows the ductile fraction as a function of the test temperature.
Concerning the microstructures obtained before induction treatment (FCT samples), the results plotted in Figure 17a suggest that the initial microstructure strongly affects impact properties. Considerably lower impact transition temperatures were obtained when a low Fast Cooling Temperature of 650 °C was applied. Therefore, the formation of more bainitic phases in the FCT650 condition promotes the enhancement of toughness properties. The observed deterioration in toughness behavior in the FCT790 sample can be attributed mainly to the formation of coarser microstructures, the presence of MA islands, as well as the formation of a high density of fine precipitates (see the interphase precipitation shown in Figure 14a). This observation was also confirmed by the evolution of the ductile fraction presented in Figure 17b.
Regarding the influence of heat treatment on toughness properties, different trends were observed depending on the Fast Cooling Temperature and consequently, the initial microstructure type. For the mainly ferritic microstructure formed in FCT790, rapid heating did not significantly affect Charpy curves. Similarly, the absorbed energy evolution was clearly observed for both FCT790 and FCT790-HT conditions. Nevertheless, when bainite was the predominant phase in the microstructure prior to induction treatment (using a lower FCT of 650 °C), a considerable deterioration in toughness was observed. The impact transition curve (absorbed energy and ductile fraction, in Figure 17a,b, respectively) shifted to higher temperatures. This could be associated with the tensile property improvement mainly due to precipitation strengthening by the induction heat treatment in bainitic microstructures. Therefore, the fine precipitation that takes place during induction treatment could damage toughness properties. Therefore, the impact property impairment caused by rapid heating was more pronounced for the bainitic matrix compared to the mainly ferritic microstructures.
In a recent study, the proposed empirical DBTT (50% ductile–brittle appearance transition temperature) equation (Equation (2)) was extended from Nb and Nb-Mo microalloyed steel to Ti-Mo microalloyed steel [5], where a considerably higher contribution of fine precipitation and dislocation density was observed.
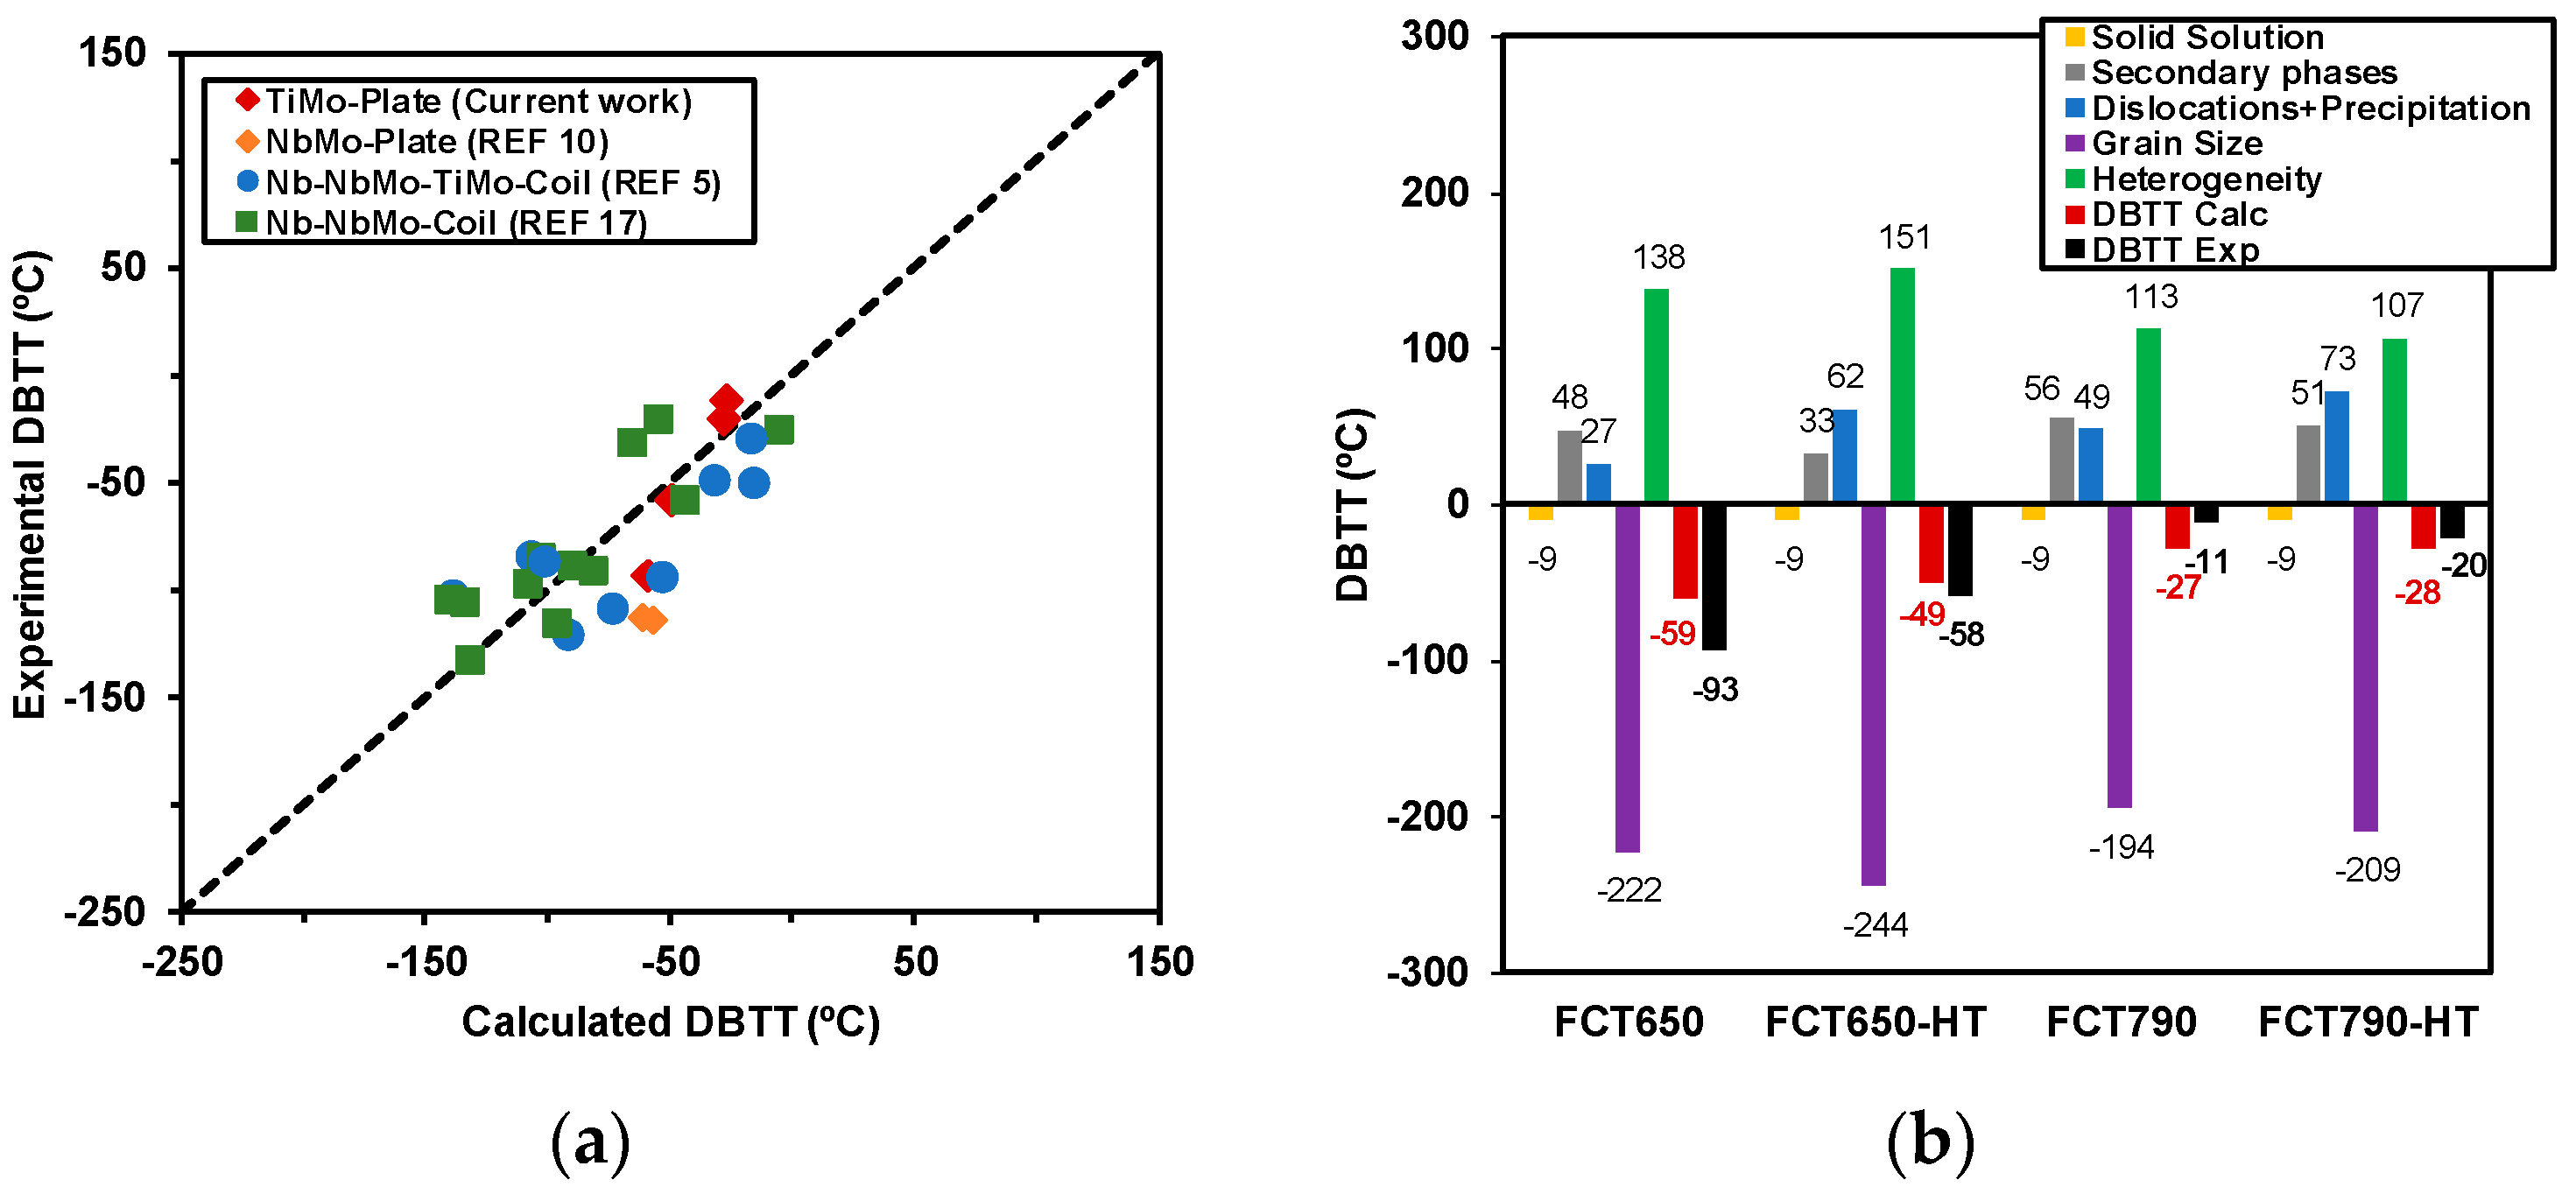
Hardening due to solid solution is included in the first two terms. Nitrogen is assumed to be zero, due to the hyperstoichiometric composition of Ti–Mo steel. The contribution of the secondary phase is considered through the fraction of pearlite and MA islands, as well as the size of the MA islands (DMA). The evaluation of heterogeneity is introduced by including the Dc20%/D15° factor, reported in Figure 9b. Figure 18a shows the comparison between the experimental DBTT and the estimated DBTT values obtained from Equation (2) for all of the conditions shown in Figure 17. In addition, the results obtained in previously published works [5,10,17] have been included in Figure 18a. The comparison presented in Figure 18a suggests that a reasonable estimation of DBTT values can be reached using Equation (2) for all the conditions analyzed in the current work.
By using Equation (2), the estimation of individual contributions can be estimated. In Figure 18b, the contribution of each microstructural parameter is plotted for all of the conditions (FCT650, FCT650-HT, FCT790 and FCT790-HT). Besides the individual contributions to DBTT, the calculated DBTT value from Equation (2) is represented in the graph. The results showed that the term related to grain size together with the compositions are the only mechanisms that ensure an improvement in toughness properties. Moreover, the contribution related to grain size is the most relevant term of all the conditions. The terms associated with secondary phases varied significantly depending on the condition. Slightly higher secondary phase contributions were estimated for ferritic microstructures (FCT of 790 °C) than for bainitic microstructures. Concerning the effect of induction treatment, when a low Fast Cooling Temperature of 650 °C was used, a lowering of the secondary phase term was observed after rapid heating. This could be associated with the abovementioned decomposition of the secondary phase during induction treatment. Regarding Δσy (fine precipitation + dislocation density), it is clear that the detrimental effect of Δσy was more pronounced under FCT-HT conditions than under FCT conditions. In this case, the main mechanism that worsens transition temperatures is fine precipitation. For example, the contributions of Δσy were about 27 and 62 °C, in the FCT650 and FCT650-HT conditions, respectively. Finally, the term due to heterogeneity is relevant under all conditions, varying from 107 to 138 °C. As observed in Figure 18b, slightly higher terms were estimated when bainitic phases were predominant (FCT of 650 °C) compared to mainly ferritic microstructures (FCT of 790 °C).
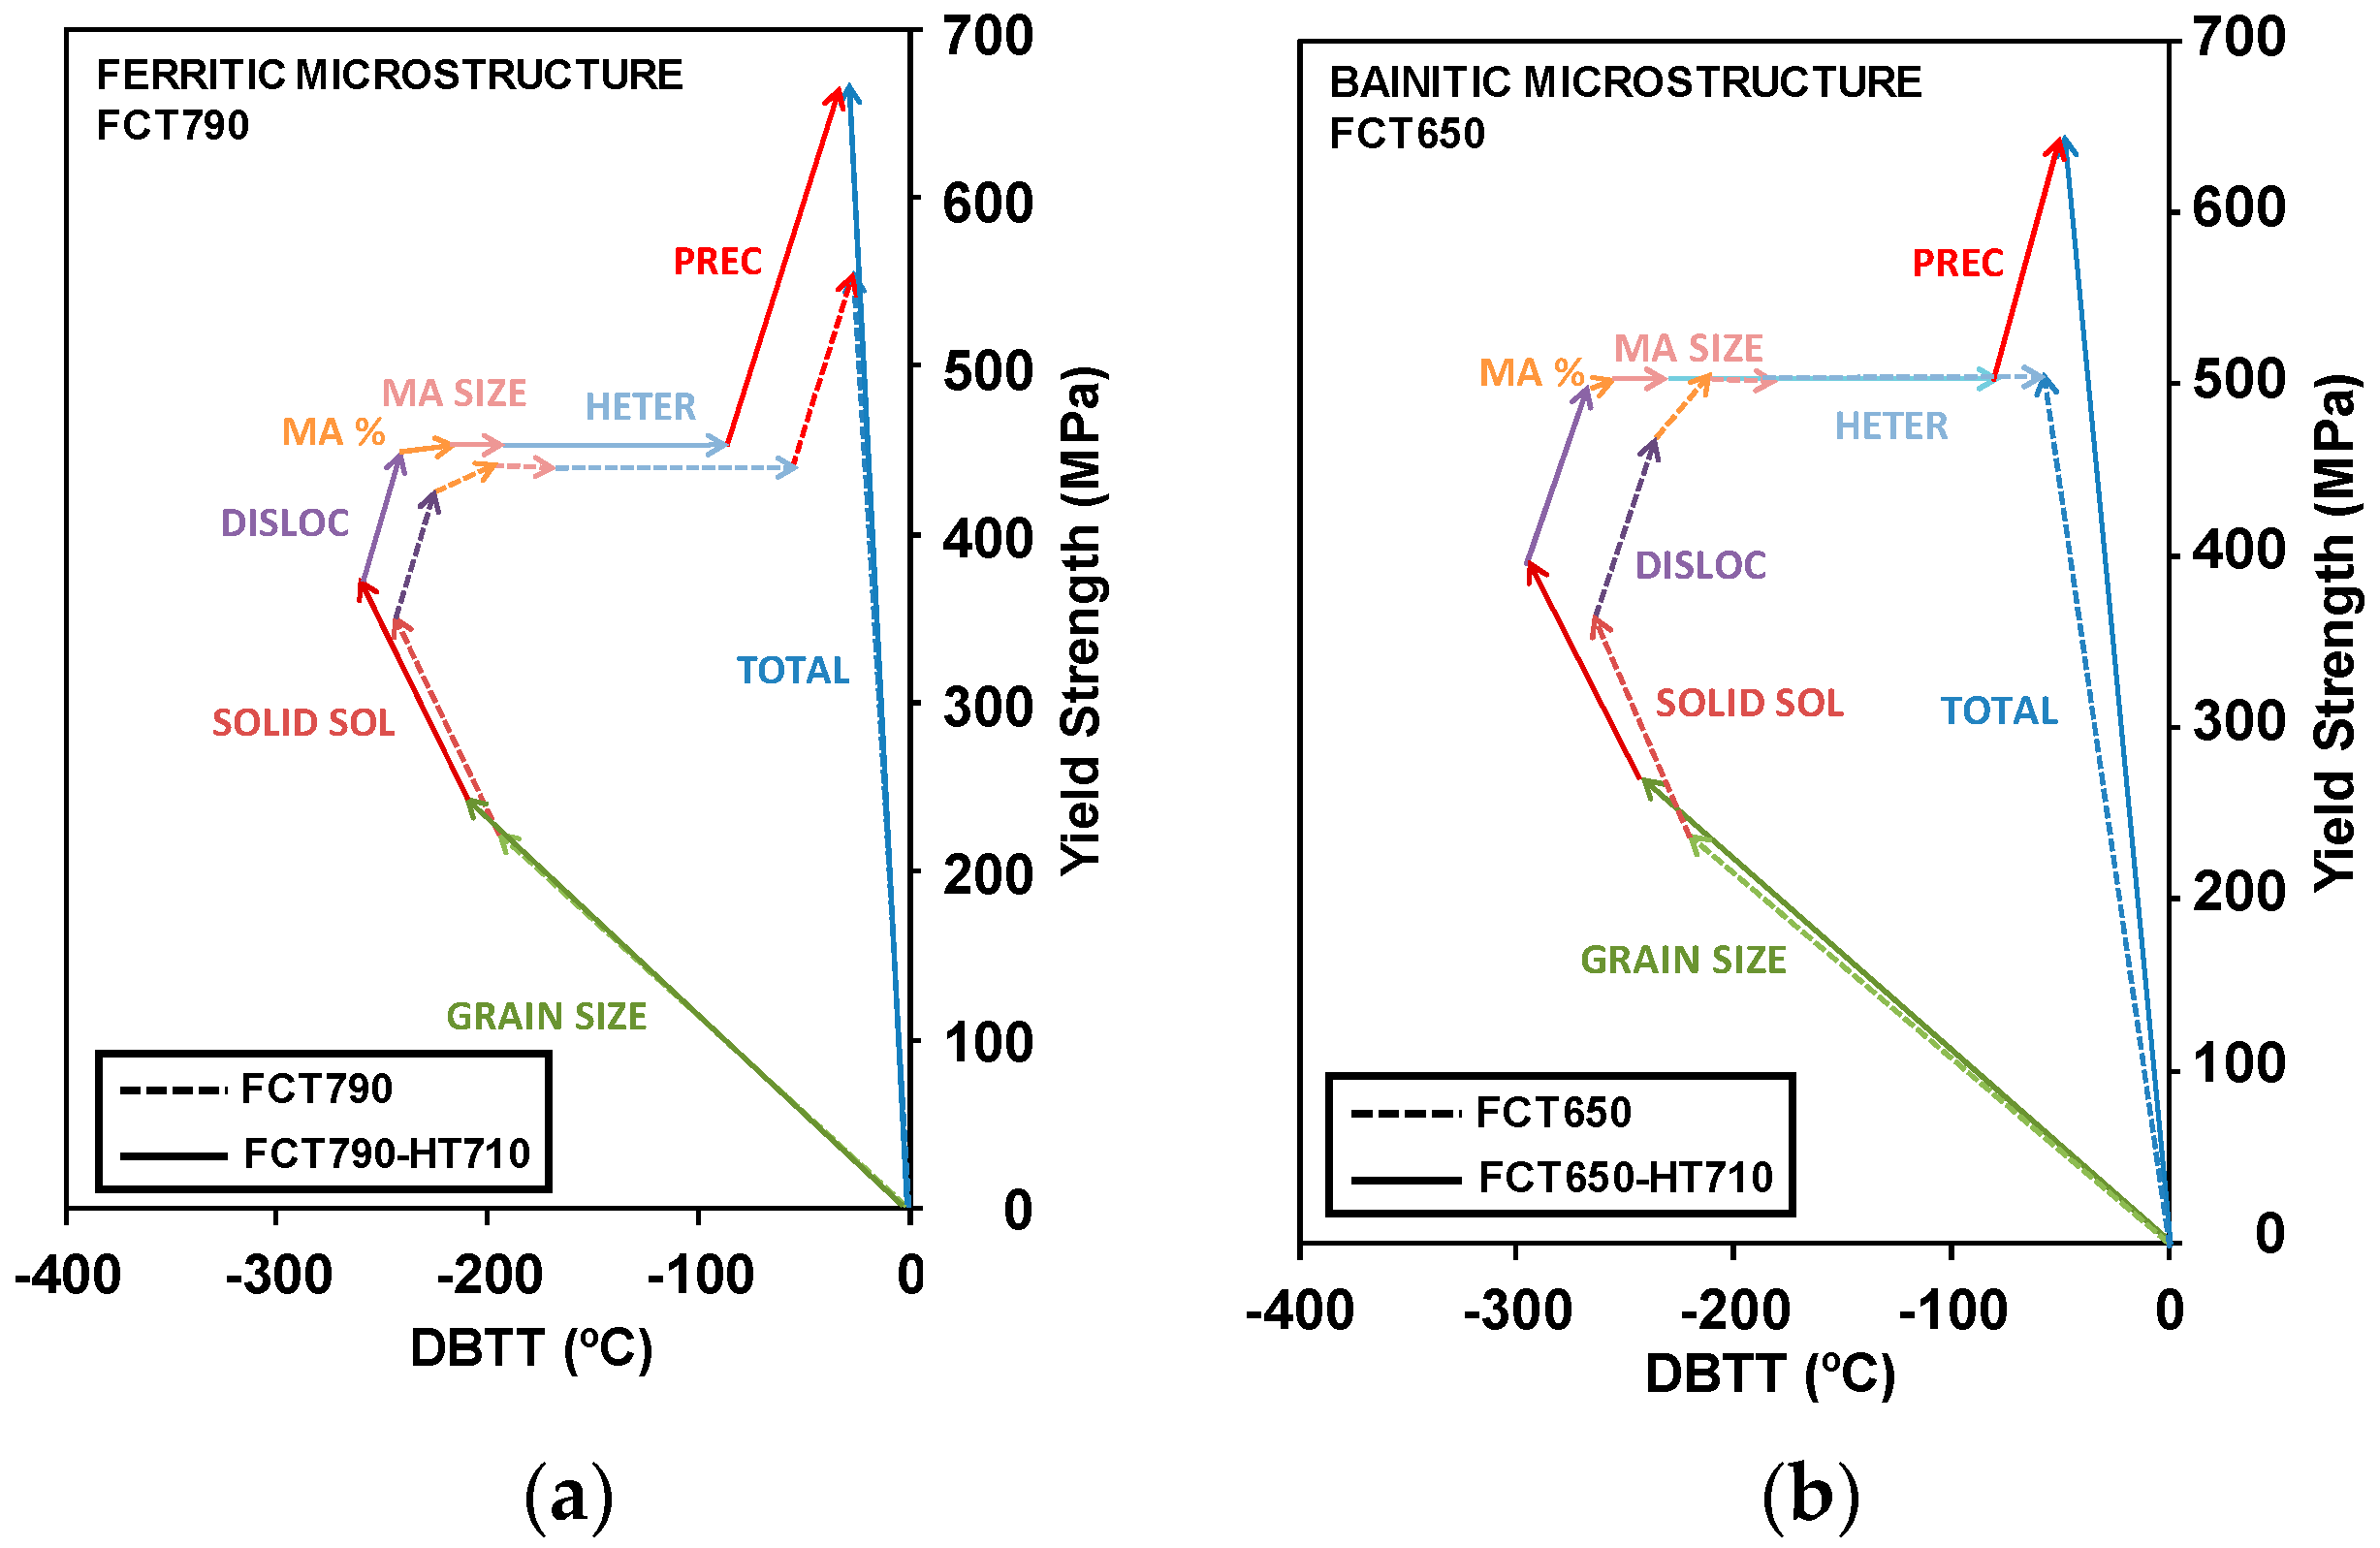
To further evaluate the influence of the different metallurgical parameters, such as solid solution, secondary phase, dislocation, precipitation, grain size and heterogeneity, on yield strength and DBTT values, the vector diagram proposed by Gladman [26] was built. These diagrams summarize the different strengthening strategies that can be followed in the industry to achieve the required mechanical properties and to evaluate the balance between strength and toughness. The strengthening/embrittlement terms related to ach mechanism and the sum of all the contributions are represented in Figure 19. Figure 19a,b show the effect of induction treatment for both the ferritic (FCT790) and bainitic (FCT650) microstructures. The dotted lines are related to the microstructures without rapid heating, whereas continuous line vectors consider the contributions associated with treated microstructures. These diagrams summarize the different strategies and strengthening patterns that can be followed in industry to achieve the required mechanical properties and to evaluate the balance between strength and toughness. The differences between the samples before and after induction treatment that have already been highlighted are confirmed in the charts, such as the microstructural refinement effect, second phase dissolution, and/or heterogeneity. However, definitely, the effect of precipitation strengthening after rapid heating is the most relevant for both types of microstructures to achieve higher strengthening levels with a relatively low toughness impairment.
4. Conclusions
The suitability of titanium–molybdenum microalloyed steels for post-rolling induction strengthening was confirmed. This strengthening is relevant both for ferritic and bainitic microstructures. Additional precipitation strengthening was achieved through the formation of fine nanosized precipitates during induction heat treatment. The results suggest that tensile property improvement caused by induction treatment is more relevant in bainitic microstructures compared to ferritic microstructures. This fact can be attributed to the higher dislocation density of the bainitic microstructure that provides more nucleation sites for carbides to form during induction treatment. No significant microstructural changes were observed in terms of grain size and dislocation density after induction heating.
Author Contributions
G.L. carried out the experiments; N.I. analyzed the data and wrote the manuscript; J.M.R.-I. supervised the results and edited the manuscript; P.U. managed the project and edited the manuscript.
Funding
This research was partially funded by Eusko Jaurlaritza (Basque Government). Grant number: PI-2014-1-129.
Conflicts of Interest
The authors declare no conflict of interest.
Nomenclature
| σy | Yield Strength |
| σ0 | Lattice friction stress |
| σss | Strengthening contribution due to solid solution |
| σgs | Strengthening contribution due to grain size |
| σρ | Strengthening contribution due to dislocations |
| σppt | Strengthening contribution due to precipitation |
| σMA | Strengthening contribution due to MA islands |
| D2° | Mean unit size using the 2° high angle boundary criterion |
| D15° | Mean unit size using the 15° high angle boundary criterion |
| Dc20% | 20% critical grain size |
| ϑ | Kernel average misorientation |
| ρ | Dislocation density |
| Dppt | Mean precipitate size |
| Mn | Manganese content (wt%) |
| Si | Silicon content (wt%) |
| Nfree | Free nitrogen (wt%) |
| pct pearlite | Volume fraction of pearlite |
| pct MA | Volume fraction of MA islands |
| DMA | MA island mean size |
| Δσy | Yield strength increment due to dislocation and precipitation strengthening (σρ + σppt)) |
References
- Isasti, N.; Jorge-Badiola, D.; Taheri, M.L.; Uranga, P. Microstructural Features Controlling Mechanical Properties in Nb-Mo Microalloyed Steels. Part I: Yield Strength. Metall. Mater. Trans. A 2014, 45A, 4960–4971. [Google Scholar] [CrossRef]
- Lee, W.B.; Hong, S.G.; Park, C.G.; Park, S.H. Carbide precipitation and high-temperature strength of hot-rolled high-strength, low-alloy steels containing Nb and Mo. Metall. Mater. Trans. A 2002, 33A, 1689–1698. [Google Scholar] [CrossRef]
- Funakawa, Y.; Shiozaki, T.; Tomita, K.; Yamamoto, T.; Maeda, E. Development of High Strength Hot-rolled Sheet Steel Consisting of Ferrite and Nanometer-sized Carbides. ISIJ Int. 2004, 44, 1945–1951. [Google Scholar] [CrossRef]
- Chen, C.Y.; Yen, H.W.; Kao, F.H.; Li, W.C.; Huang, C.Y.; Yang, J.R.; Wang, S.H. Precipitation hardening of high-strength low-alloy steels by nanometer-sized carbides. Mater. Sci. Eng. A 2009, 499, 162–166. [Google Scholar] [CrossRef]
- Larzabal, G.; Isasti, N.; Rodriguez-Ibabe, J.M.; Uranga, P. Evaluating Strengthening and Impact Toughness Mechanisms for Ferritic and Bainitic Microstructures in Nb, Nb-Mo and Ti-Mo Microalloyed Steels. Metals 2017, 7, 65. [Google Scholar] [CrossRef]
- Huang, Y.; Zhao, A.; Wang, X.; Wang, X.; Yang, J.; Han, J.; Yang, F. A High-Strength High-Ductility Ti- and Mo-Bearing Ferritic Steel. Metall. Mater. Trans. A 2016, 47A, 450–460. [Google Scholar] [CrossRef]
- Cheng, L.; Cai, Q.-W.; Xie, B.-S.; Ning, Z.; Zhou, X.-C.; Li, G.-S. Relationships among microstructure, precipitation and mechanical properties in different depths of Ti–Mo low carbon low alloy steel plate. Mater. Sci. Eng. A 2016, 651, 185–191. [Google Scholar] [CrossRef]
- Xie, Z.J.; Fang, Y.P.; Han, G.; Guo, H.; Misra, R.D.K.; Shang, C.J. Structure–property relationship in a 960 MPa grade ultrahigh strength low carbon niobium–vanadium microalloyed steel: The significance of high frequency induction tempering. Mater. Sci. Eng. A 2014, 618, 112–117. [Google Scholar] [CrossRef]
- Larzabal, G.; Isasti, N.; Pereda, B.; Rodriguez-Ibabe, J.M.; Uranga, P. Precipitation Strengthening by Induction Treatment in High Strength Low Carbon Microalloyed Hot Rolled Plates. In Proceedings of the Materials Science and Technology 2016 Conference, Salt Lake City, UT, USA, 23–27 October 2016; pp. 499–507. [Google Scholar]
- Larzabal, G.; Isasti, N.; Rodriguez-Ibabe, J.M.; Uranga, P. Precipitation Strengthening by Induction Treatment, in High Strength Low Carbon Microalloyed Hot-Rolled Plates. Metall. Mater. Trans. A 2018, 49A, 946–961. [Google Scholar] [CrossRef]
- Uranga, P.; Gutiérrez, I.; López, B. Determination of recrystallization kinetics from plane strain compression tests. Mater. Sci. Eng. A 2013, 578, 174–180. [Google Scholar] [CrossRef]
- Wallin, K. Modified Tank Fitting Algorithm for Charpy Impact Data; Research Seminar on Economical and Safe Application of Modern Steels for Pressure Vessels: Aachen, Germany, 2003. [Google Scholar]
- Kim, Y.M.; Kim, S.K.; Lim, Y.J.; Kim, N.J. Effect of Microstructure on the Yield Ratio and Low Temperature Toughness of Linepipe Steels. ISIJ Int. 2002, 42, 1571–1577. [Google Scholar] [CrossRef]
- Araki, T.; Kozasu, I.; Tankechi, H.; Shibata, K.; Enomoto, M.; Tamehiro, H. Atlas for Bainitic Microstructures; ISIJ: Tokyo, Japan, 1992; Volume 1. [Google Scholar]
- Xie, Z.J.; Ma, X.P.; Shang, C.J.; Wang, X.M.; Subramanian, S.V. Nano-sized precipitation and properties of a low carbon niobium micro-alloyed bainitic steel. Mater. Sci. Eng. A 2015, 641, 37–44. [Google Scholar] [CrossRef]
- Iza-Mendia, A.; Gutiérrez, I. Generalization of the existing relations between microstructure and yield stress from ferrite-pearlite to high strength steels. Mater. Sci. Eng. A 2013, 561, 40–51. [Google Scholar] [CrossRef]
- Isasti, N.; Jorge-Badiola, D.; Taheri, M.L.; Uranga, P. Microstructural Features Controlling Mechanical Properties in Nb-Mo Microalloyed Steels. Part II: Impact Toughness. Metall. Mater. Trans. A 2014, 45, 4972–4982. [Google Scholar] [CrossRef]
- Olasolo, M.; Uranga, P.; Rodriguez-Ibabe, J.M.; López, B. Effect of austenite microstructure and cooling rate on transformation characteristics in a low carbon Nb–V microalloyed steel. Mater. Sci. Eng. A 2011, 528, 2559–2569. [Google Scholar] [CrossRef]
- Isasti, N.; Jorge-Badiola, D.; Taheri, M.L.; López, B.; Uranga, P. Effect of Composition and Deformation on Coarse-Grained Austenite Transformation in Nb-Mo Microalloyed Steels. Metall. Mater. Trans. A 2011, 42A, 3729–3742. [Google Scholar] [CrossRef]
- Huang, B.M.; Yang, J.R.; Yen, H.W.; Hsu, C.H.; Huang, C.Y.; Mohrbacher, H. Secondary hardened bainite. Mater. Sci. Technol. 2014, 30, 1014–1023. [Google Scholar] [CrossRef]
- Calcagnotto, M.; Ponge, D.; Demir, E.; Raabe, D. Orientation gradients and geometrically necessary dislocations in ultrafine grained dual-phase steels studied by 2D and 3D EBSD. Mater. Sci. Eng. A 2010, 257, 2738–2746. [Google Scholar] [CrossRef]
- Chen, C.Y.; Yang, J.R.; Chen, C.C.; Chen, S.F. Microstructural characterization and strengthening behavior of nanometer sized carbides in Ti–Mo microalloyed steels during continuous cooling process. Mater. Charact. 2016, 114, 18–29. [Google Scholar] [CrossRef]
- Bu, F.Z.; Wang, X.M.; Yang, S.W.; Shang, C.J.; Misra, R.D.K. Contribution of interphase precipitation on yield strength in thermomechanically simulated Ti–Nb and Ti–Nb–Mo microalloyed steels. Mater. Sci. Eng. A 2015, 620, 22–29. [Google Scholar] [CrossRef]
- Larzabal, G. Efecto de los Parámetros de Laminación y Post-Tratamiento Térmico por Inducción en la Mejora de Propiedades Mecánicas de Aceros Microaleados. Ph.D. Thesis, Universidad de Navarra, San Sebastian, Spain, 2017. [Google Scholar]
- Sanz, L.; Pereda, B.; López, B. Effect of thermomechanical treatment and coiling temperature on the strengthening mechanisms of low carbon steels microalloyed with Nb. Mater. Sci. Eng. A 2017, 685, 377–390. [Google Scholar] [CrossRef]
- Gladman, T. The Physical Metallurgy of Microalloyed Steels, 2nd ed.; The Institute of Materials: London, UK, 1997; pp. 62–68. [Google Scholar]
Figure 1.
Schematic of the thermomechanical schedule performed in the plane strain compression machine.
Figure 1.
Schematic of the thermomechanical schedule performed in the plane strain compression machine.

Figure 2.
Schematics of the mechanical property sample extraction from the plane strain compression sample.
Figure 2.
Schematics of the mechanical property sample extraction from the plane strain compression sample.

Figure 3.
(a) Engineering tensile curves obtained for all of the Fast Cooling Temperatures (FCTs). Tensile curves measured before (FCT) and after induction heat treatment (FCT-HT) have been included. (b) Evolution of yield strength and tensile strength as a function of the Fast Cooling Temperature (samples obtained before and after induction treatment).

Figure 4.
Evaluation of the effect of the induction heat treatment and the FCT on the yield/tensile strength ratio.
Figure 4.
Evaluation of the effect of the induction heat treatment and the FCT on the yield/tensile strength ratio.

Figure 5.
FEGSEM (field-emission gun scanning electron microscopy) micrographs corresponding to every Fast Cooling Temperature and both (a–c) FCT and (d–f) FCT-HT samples: (a,d) FCT790, (b,e) FCT720 and (c,f) FCT650.
Figure 5.
FEGSEM (field-emission gun scanning electron microscopy) micrographs corresponding to every Fast Cooling Temperature and both (a–c) FCT and (d–f) FCT-HT samples: (a,d) FCT790, (b,e) FCT720 and (c,f) FCT650.

Figure 6.
FEGSEM micrographs (higher magnifications) corresponding to every Fast Cooling Temperature and both (a–c) FCT and (d–f) FCT-HT samples: (a,d) FCT790, (b,e) FCT720 and (c,f) FCT650.
Figure 6.
FEGSEM micrographs (higher magnifications) corresponding to every Fast Cooling Temperature and both (a–c) FCT and (d–f) FCT-HT samples: (a,d) FCT790, (b,e) FCT720 and (c,f) FCT650.


Figure 7.
Image quality and inverse pole figure (IPF) maps corresponding to the samples without induction heat treatment: (a) FCT790 and (b) FCT650.
Figure 7.
Image quality and inverse pole figure (IPF) maps corresponding to the samples without induction heat treatment: (a) FCT790 and (b) FCT650.

Figure 8.
Grain boundary maps (red lines between 2° and 15°, black lines > 15°) corresponding to the samples obtained before (FCT in (a,c,e)) and after induction treatment (FCT-HT in (b,d,f)) and under different conditions: (a,b) FCT790 and (c,d) FCT720 and (e,f) FCT650.
Figure 8.
Grain boundary maps (red lines between 2° and 15°, black lines > 15°) corresponding to the samples obtained before (FCT in (a,c,e)) and after induction treatment (FCT-HT in (b,d,f)) and under different conditions: (a,b) FCT790 and (c,d) FCT720 and (e,f) FCT650.


Figure 9.
(a) Influence of the Fast Cooling Temperature and the induction heat treatment on the average unit size, using different threshold misorientation criteria: low angle (2°) and high angle (15°) boundaries. (b) Effect of FCT on the on Dc20%/D15°.
Figure 9.
(a) Influence of the Fast Cooling Temperature and the induction heat treatment on the average unit size, using different threshold misorientation criteria: low angle (2°) and high angle (15°) boundaries. (b) Effect of FCT on the on Dc20%/D15°.

Figure 10.
Grain boundary length per unit area as a function of the FCT. Results concerning high and low angle grain boundaries (HAGB and LAGB) are included.
Figure 10.
Grain boundary length per unit area as a function of the FCT. Results concerning high and low angle grain boundaries (HAGB and LAGB) are included.

Figure 11.
Kernel maps corresponding to the samples obtained before (FCT in (a,c,e)) and after induction treatment (FCT-HT in (b,d,f)) at different conditions: (a,b) FCT790 and (c,d) FCT720 and (e,f) FCT650.
Figure 11.
Kernel maps corresponding to the samples obtained before (FCT in (a,c,e)) and after induction treatment (FCT-HT in (b,d,f)) at different conditions: (a,b) FCT790 and (c,d) FCT720 and (e,f) FCT650.


Figure 12.
Influence of Fast Cooling Temperatures and induction heat treatment on dislocation density.
Figure 12.
Influence of Fast Cooling Temperatures and induction heat treatment on dislocation density.

Figure 13.
Thin foil TEM micrographs for the samples without induction treatment: (a) FCT790 and (b) FCT650. (c) Influence of the Fast Cooling Temperature on the precipitate size distribution (representing accumulated frequency).
Figure 13.
Thin foil TEM micrographs for the samples without induction treatment: (a) FCT790 and (b) FCT650. (c) Influence of the Fast Cooling Temperature on the precipitate size distribution (representing accumulated frequency).

Figure 14.
Thin foil TEM micrographs for the entire range of Fast Cooling Temperatures and both (a,c,e) FCT and (b,d,f) FCT-HT conditions: (a,b) FCT790, (c,d) FCT720 and (e,f) FCT650.
Figure 14.
Thin foil TEM micrographs for the entire range of Fast Cooling Temperatures and both (a,c,e) FCT and (b,d,f) FCT-HT conditions: (a,b) FCT790, (c,d) FCT720 and (e,f) FCT650.

Figure 15.
Mean precipitate sizes (Dppt) as a function of FCT. Measurements carried out in the FCT and FCT-HT samples have been included.
Figure 15.
Mean precipitate sizes (Dppt) as a function of FCT. Measurements carried out in the FCT and FCT-HT samples have been included.

Figure 16.
Individual strengthening contributions (grain size, dislocations, MA islands, precipitation and composition) for every microstructure (ferrite, ferrite/bainite and bainite, for FCT790, FCT720 and FCT650, respectively) and the samples obtained before (FCT) and after (FCT-HT) induction heat treatment.

Figure 17.
Comparison between Charpy curves corresponding to FCT650, FCT650-HT, FCT790 and FCT790-HT: (a) absorbed energy and (b) ductile fraction as a function of the test temperature.
Figure 17.
Comparison between Charpy curves corresponding to FCT650, FCT650-HT, FCT790 and FCT790-HT: (a) absorbed energy and (b) ductile fraction as a function of the test temperature.

Figure 18.
(a) Comparison between experimental and calculated DBTT values predicted by Equation (2). The data reported by Isasti et al. [17] and Larzabal et al. [5,10] have been included in the graph. (b) Estimated contributions (solid solution, secondary phases, dislocation + precipitation, grain size and heterogeneity) to the DBTT for every condition and comparison with experimental values.

Figure 19.
Relative contribution of each metallurgical parameter (grain size, solid solution, dislocations, martensite/austenite (MA) fraction, MA size, heterogeneity and precipitation) on both strength and toughness properties. FCT and FCT-HT conditions are compared for both types of microstructures: (a) ferritic in FCT790 and (b) bainitic in FCT650.


Table 1.
Chemical compositions of the steels (weight percent).
| Steel | C | Mn | Si | P | S | Ti | Mo | Al | N |
|---|---|---|---|---|---|---|---|---|---|
| Ti-Mo | 0.048 | 1.61 | 0.20 | 0.020 | 0.006 | 0.09 | 0.20 | 0.02 | 0.0040 |
Table 2.
Yield strength (YS), tensile strength (TS), elongation (%), and area reduction (%) values for the all of the conditions: FCT650, FCT650-HT, FCT720, FCT720-HT, FCT790, and FCT790-HT.
Table 2.
Yield strength (YS), tensile strength (TS), elongation (%), and area reduction (%) values for the all of the conditions: FCT650, FCT650-HT, FCT720, FCT720-HT, FCT790, and FCT790-HT.
| Condition | Yield Strength (MPa) | Tensile Strength (MPa) | Elongation (%) | Area Reduction (%) |
|---|---|---|---|---|
| FCT650 | 495 ± 3 | 667 ± 3 | 25 ± 2 | 79 ± 0 |
| FCT650-HT | 632 ± 1 | 738 ± 2 | 22 ± 0 | 76 ± 0 |
| FCT720 | 525 ± 1 | 707 ± 3 | 19 ± 1 | 79 ± 1 |
| FCT720-HT | 654 ± 4 | 758 ± 1 | 27 ± 0 | 80 ± 1 |
| FCT790 | 544 ± 0 | 676 ± 0 | 20 ± 0 | 77 ± 0 |
| FCT790-HT | 646 ± 3 | 739 ± 4 | 25 ± 1 | 80 ± 1 |
© 2018 by the authors. Licensee MDPI, Basel, Switzerland. This article is an open access article distributed under the terms and conditions of the Creative Commons Attribution (CC BY) license (http://creativecommons.org/licenses/by/4.0/).
Share and Cite
MDPI and ACS Style
Larzabal, G.; Isasti, N.; Rodriguez-Ibabe, J.M.; Uranga, P. Effect of Microstructure on Post-Rolling Induction Treatment in a Low C Ti-Mo Microalloyed Steel. Metals 2018, 8, 694. https://doi.org/10.3390/met8090694
AMA Style
Larzabal G, Isasti N, Rodriguez-Ibabe JM, Uranga P. Effect of Microstructure on Post-Rolling Induction Treatment in a Low C Ti-Mo Microalloyed Steel. Metals. 2018; 8(9):694. https://doi.org/10.3390/met8090694
Chicago/Turabian StyleLarzabal, Gorka, Nerea Isasti, Jose M. Rodriguez-Ibabe, and Pello Uranga. 2018. "Effect of Microstructure on Post-Rolling Induction Treatment in a Low C Ti-Mo Microalloyed Steel" Metals 8, no. 9: 694. https://doi.org/10.3390/met8090694
Note that from the first issue of 2016, this journal uses article numbers instead of page numbers. See further details here.