Effect of Ti(C, N) Particle on the Impact Toughness of B-Microalloyed Steel

1
State Key Laboratory of Advanced Metallurgy, University of Science and Technology Beijing, Xueyuan Road No. 30, Beijing 100083, China
2
Technology Center of special steel branch, Zenith Steel Co., Ltd., Zhongwu Road No. 1, Changzhou 213011, China
*
Author to whom correspondence should be addressed.
Metals 2018, 8(11), 868; https://doi.org/10.3390/met8110868
Submission received: 27 September 2018
/
Revised: 19 October 2018
/
Accepted: 22 October 2018
/
Published: 24 October 2018
Abstract
:Simultaneously improving the toughness and strength of B-microalloyed steel by adding microalloying elements (Nb, V, Ti) has been an extensively usedmethod for researchers. However, coarse Ti(C, N) particle will precipitate during solidification with inappropriate Ti content addition, resulting in poor impact toughness. The effect of the size, number density, and location of Ti(C, N) particle on the impact toughness of B-microalloyed steel with various Ti/N ratios was investigated. Coarse Ti(C, N) particles were investigated to act as the cleavage fracture initiation sites, by using scanning electron microscopy (SEM) analysis. When more coarse Ti(C, N) inclusions were located in ferrite instead of pearlite, the impact toughness of steel with ferrite–pearlite microstructure was lower. Meanwhile, when the size or the number density of Ti(C, N) inclusions was larger, the impact toughness was adversely affected. Normalizing treatment helps to improve the impact property of B-microalloyed steel, owing to the location of Ti(C, N) particles being partly changed from ferrite to pearlite. The formation mechanism of coarse Ti(C, N) particles was calculated by the thermodynamic software Factsage 7.1 and Thermo-Calc. The Ti(C, N) particles formed during the solidification of molten steel, and the N-rich Ti(C, N) phase precipitated first and, then, followed by the C-rich Ti(C, N) phase. Decreasing the Ti and N content is an effective way to inhibit the formation of coarse Ti(C, N) inclusions.
1. Introduction
It has been widely recognized, for microalloyed steel, that long service life can frequently be accompanied by high toughness and high strength. Over the past years, several studies [1,2,3] have been conducted that the addition of microalloying elements, such as niobium, vanadium, titanium, and boron, can observably improve the service performance of steels due to the grain refinement by pinning the austenite grain boundaries (typically the fine TiN particles because of their strong high-temperature stability) [4].
In the boron-containing steel, Ti element is added to tie up N and C elements to avoid the formation of BN phase [5] and, then, more available boron would segregate to the austenite grain boundaries to suppress the γ–α transformation, which would dramatically improve the hardenability of boron-containing steel [6]. Furthermore, fine TiN particles can effectively refine grain by inhabiting the grain growth at high temperature or acting as the nucleation core of ferrite phase, especially for the heat-effected-zone (HAZ) during the welding process [7,8,9]. However, high Ti content in molten steel easily promotes the formation of coarse TiN inclusions with the size as large as microns during solidification, causing the cleavage fracture of microalloyed steels [10,11,12,13]. Shen [14] argued that a complete boron hardenability effect is obtained with the Ti/N ratio between 2.9 and 3.4, and the higher the [Ti][N] product is, the larger the driving force is to form the TiN particle. Therefore, the strict control of Ti and N content in steel significantly influences the impact toughness of boron-containing steel. Many researchers [15,16,17] reach an agreement that grain size control is optimized at the Ti/N ratio in molten steel close to 2, resulting in better impact toughness. In addition, the impact toughness of microalloyed steel is also associated with the Ti content and N content [18], Ti/N ratio [12], number density of TiN particles [19], and the size of TiN particles [20].
However, the relationship between the location of Ti(C, N) particles and impact toughness of B-microalloyed steel has not been mentioned. There is little work conducted to focus on the effect of normalizing treatment on the nature of coarse Ti(C, N) particles. Aimed at clarifying these issues, in this study, two experimental materials with different Ti/N ratios were used to clarify the effect of the nature of Ti(C, N) particles on the impact toughness of B-microalloyed steels.
2. Materials and Methods
The experimental samples were taken from industrial trials. The production process of experimental materials was as follows: electric arc furnace (EAF)–ladle furnace (LF)–vacuum degassing (VD)–continuous casting (CC)–hot rolling (the beginning rolling temperature was about 910 °C, and the temperature on cold bed was about 810 °C). Different amounts of Fe–Ti alloy were added into molten steel during LF refining process. The steel samplings were taken at the hot-rolled bar. The chemical compositions were identified at the National Analysis Center for Iron & Steel (NCS Testing Technology Co., Ltd., Beijing, China), according to the national standards of China. The results were shown in Table 1. The Ti/N ratio of steel 1 was 7.4, higher than steel 2 (4.6), as shown in Table 1.
The transverse Charpy U-notch (CUN) and tensile testing samples were taken from the hot-rolled rods at the center. The testing temperature was room temperature, and the results were the average value of 6 specimens. In order to further improve the impact toughness of steel 1, the hot-rolled bar was heat-treated at 890 °C for 45 min, and then air cooled to room temperature (defined as steel 1-890). The matrix microstructure of the samples was investigated with optical microscope (OM) (DM4M, Leica Co., Wetzlar, Germany) after being corroded with alcohol solution containing 4% acid (volume fraction). ImageJ software (ImageJ 1.47v, National Institutes of Health, Bethesda, MD, USA) was used to measure the grain size with a mean linear intercept method and area percentage of ferrite. The fracture surface investigations of CUN samples were conducted with scanning electron microscopy (SEM) (FEI Quanta-250, FEI Corporation, Hillsboro, OR, USA) equipped with energy dispersive spectrometer (EDS) (XFlash 5030, Bruker Nano GmbH, Berlin, Germany). Non-metallic inclusions were partially extracted from the steel samples using a non-aqueous electrolysis method, and their 3D-morphologies were observed with the SEM and EDS. The electrolyte was composed of 1% tetramethylammonium chloride, 10% acetylacetone, and 89% methanol (value fraction). The electrolysis voltage was 6 V, and the electrolysis time was 300 s. The number density and size of particles were analyzed with automatic inclusion analysis system (EVO18-INCA steel, ZEISS Co. Ltd., Oberkochen, Germany). Thermodynamic software Factsage 7.1 (Thermfact Ltd., Montreal, QC, Canada and GTT-Technologies, Aachen, Germany) with the FSstel and FToxid database and Thermo-Calc (Thermo-Calc 2017a, Foundation of Computational Thermodynamics (STT), Stockholm, Sweden) with the TCFE7 database were used to calculate the formation mechanism of Ti(C, N) inclusion during solidification.
3. Results
3.1. Fracture Surface Investigation
The mechanical properties of testing samples are shown in Table 2. As shown in Table 2, the CUN-absorbed energy of steel 1 is only 18 J, and the CUN-absorbed energy of steel 2 is 60 J. However, the CUN-absorbed energy of steel 1 increased from 18 J to 54 J after the heat treatment. The yield strength and tensile strength of steel 2 and steel 1-890 are all lower than steel 1, but the reduction of area and CUV energy of steel 2 and steel 1-890 are all larger than steel 1, indicating that the plasticity and toughness of steel 1 are enhanced after heat treatment.
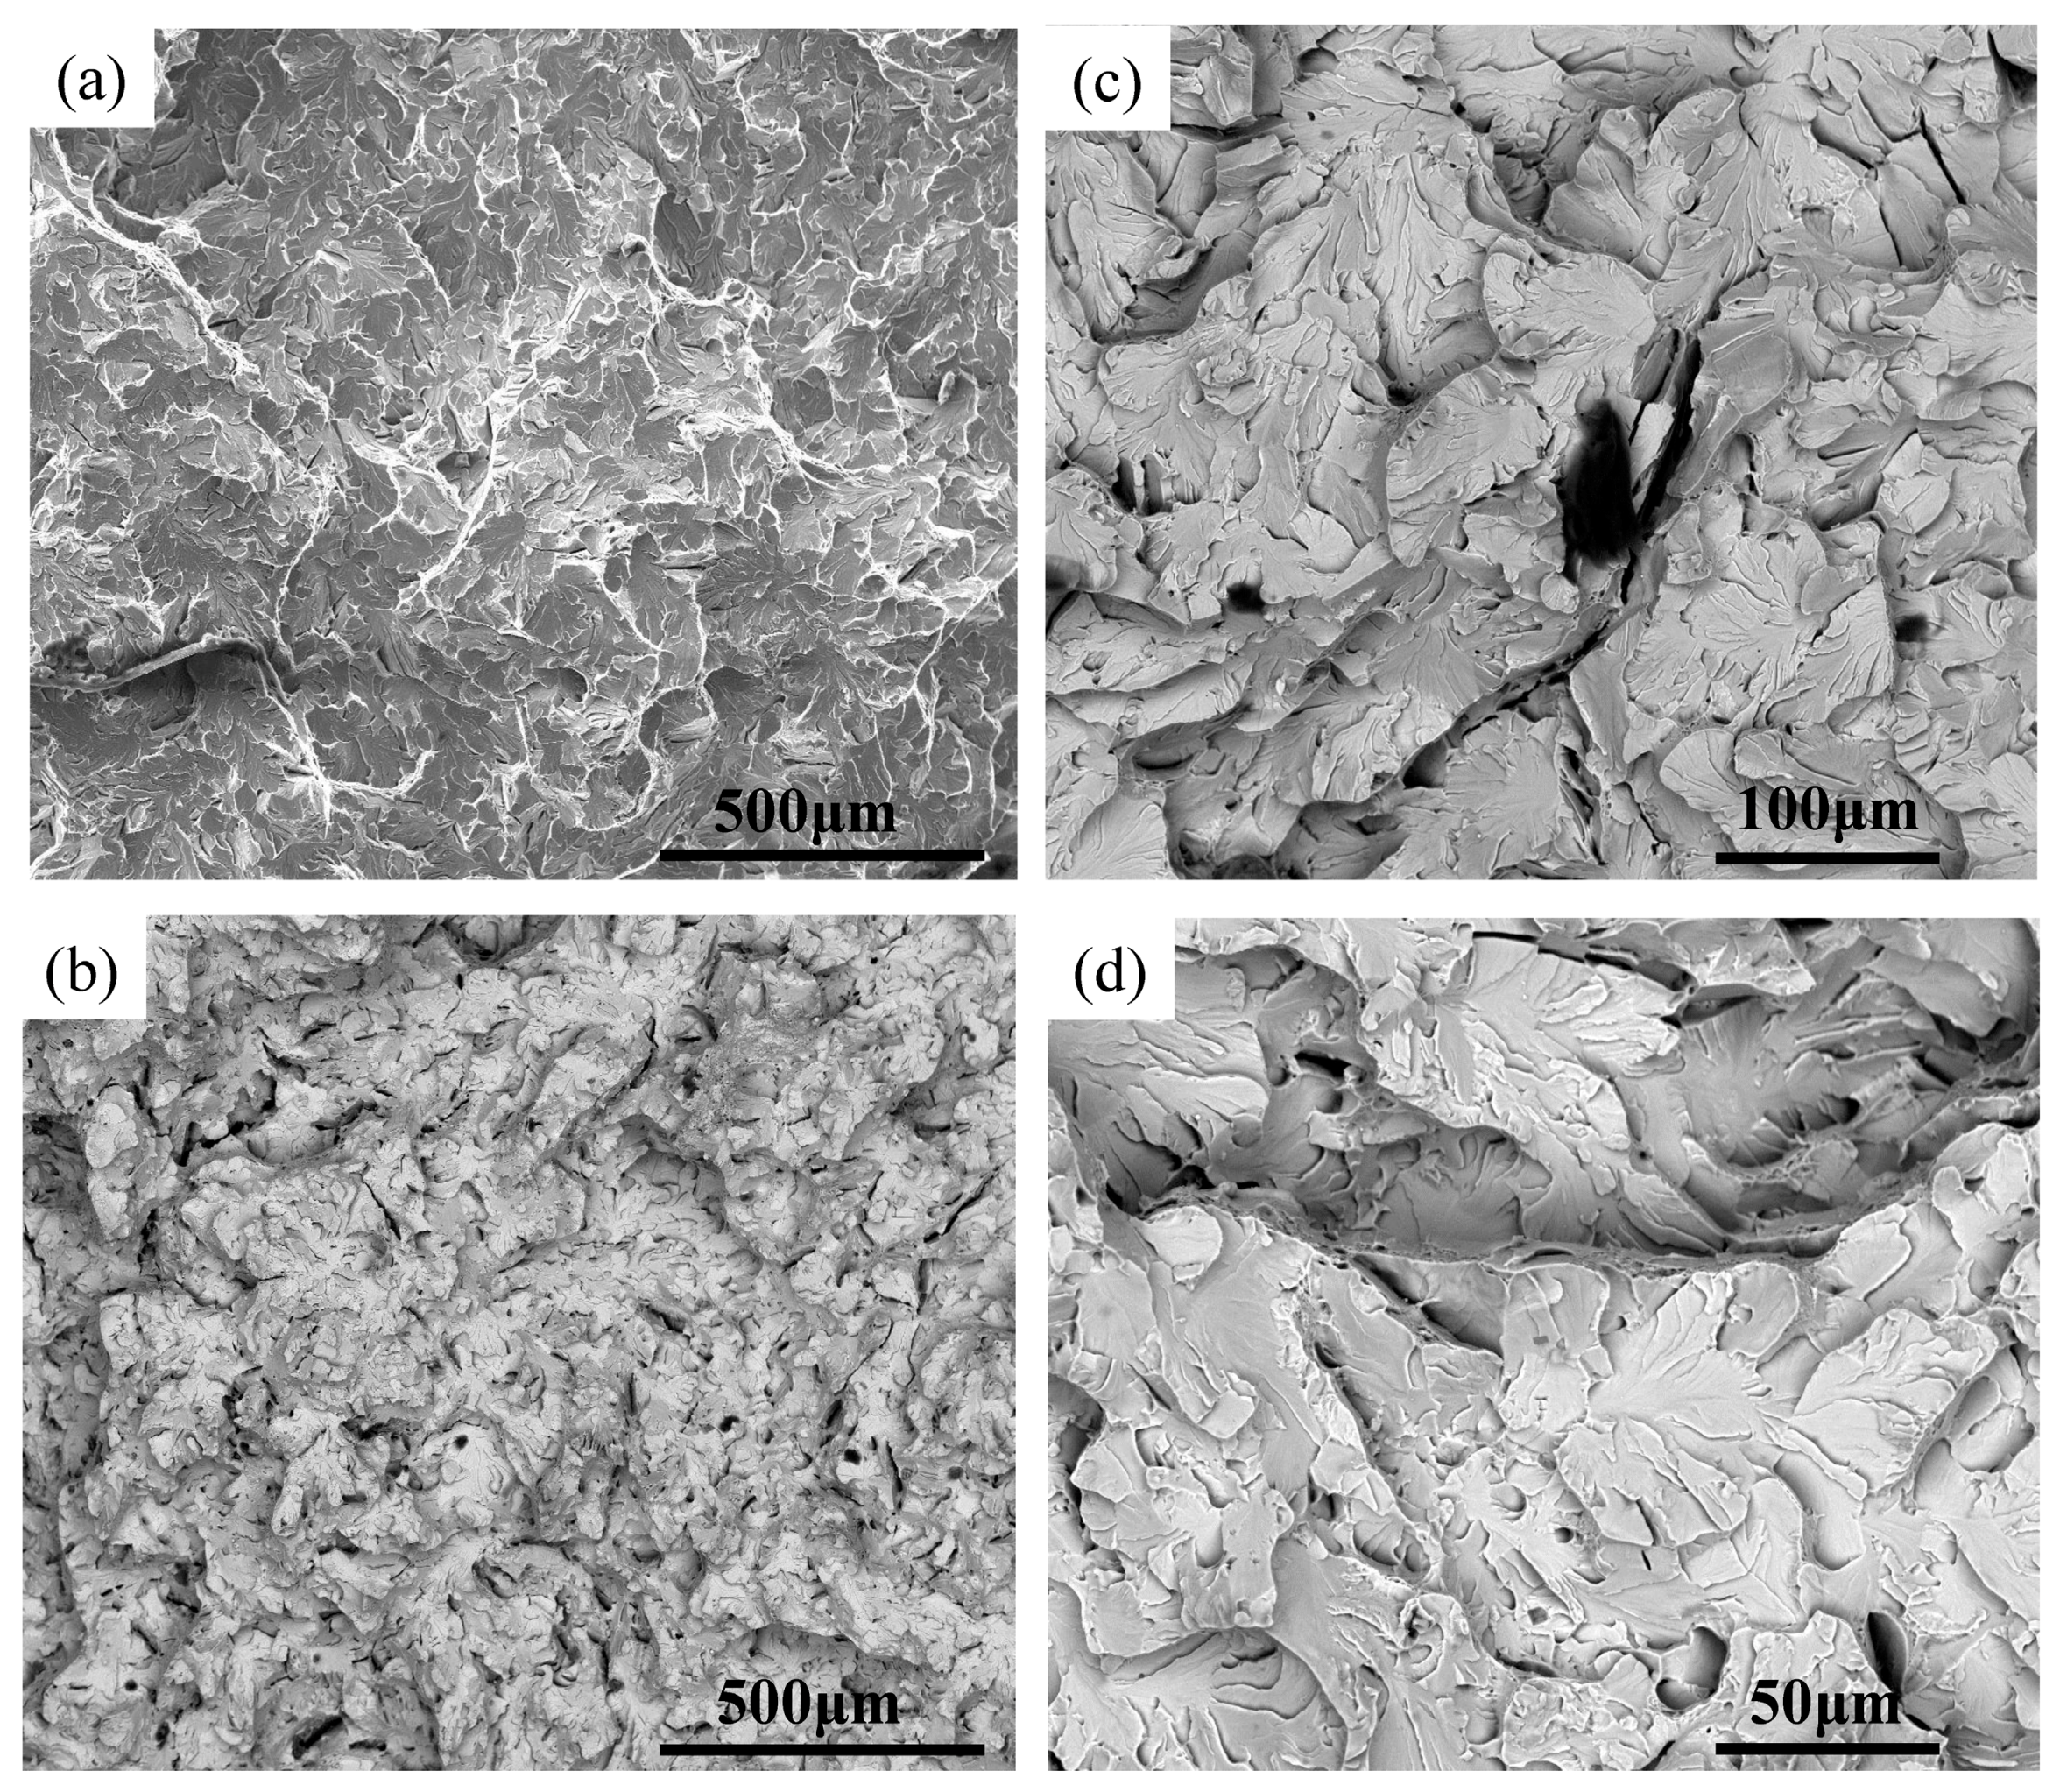
First of all, we studied the reasons for the lowest CUN-absorbed energy of steel 1. The fracture surface of steel 1 and steel 1-890 were investigated with SEM and EDS, as shown in Figure 1. It is a typical cleavage fracture for steel 1. The brittle fracture area is composed of large fracture facets, and there are often identifiable fracture initiation sites (FIS) that cause final failure of the specimen. It is also brittle fracture for steel 1-890, as shown in Figure 1b,d. However, there is no obvious tearing stripes at low magnification image compared with steel 1 and a certain amount of plastic deformation zone were found.
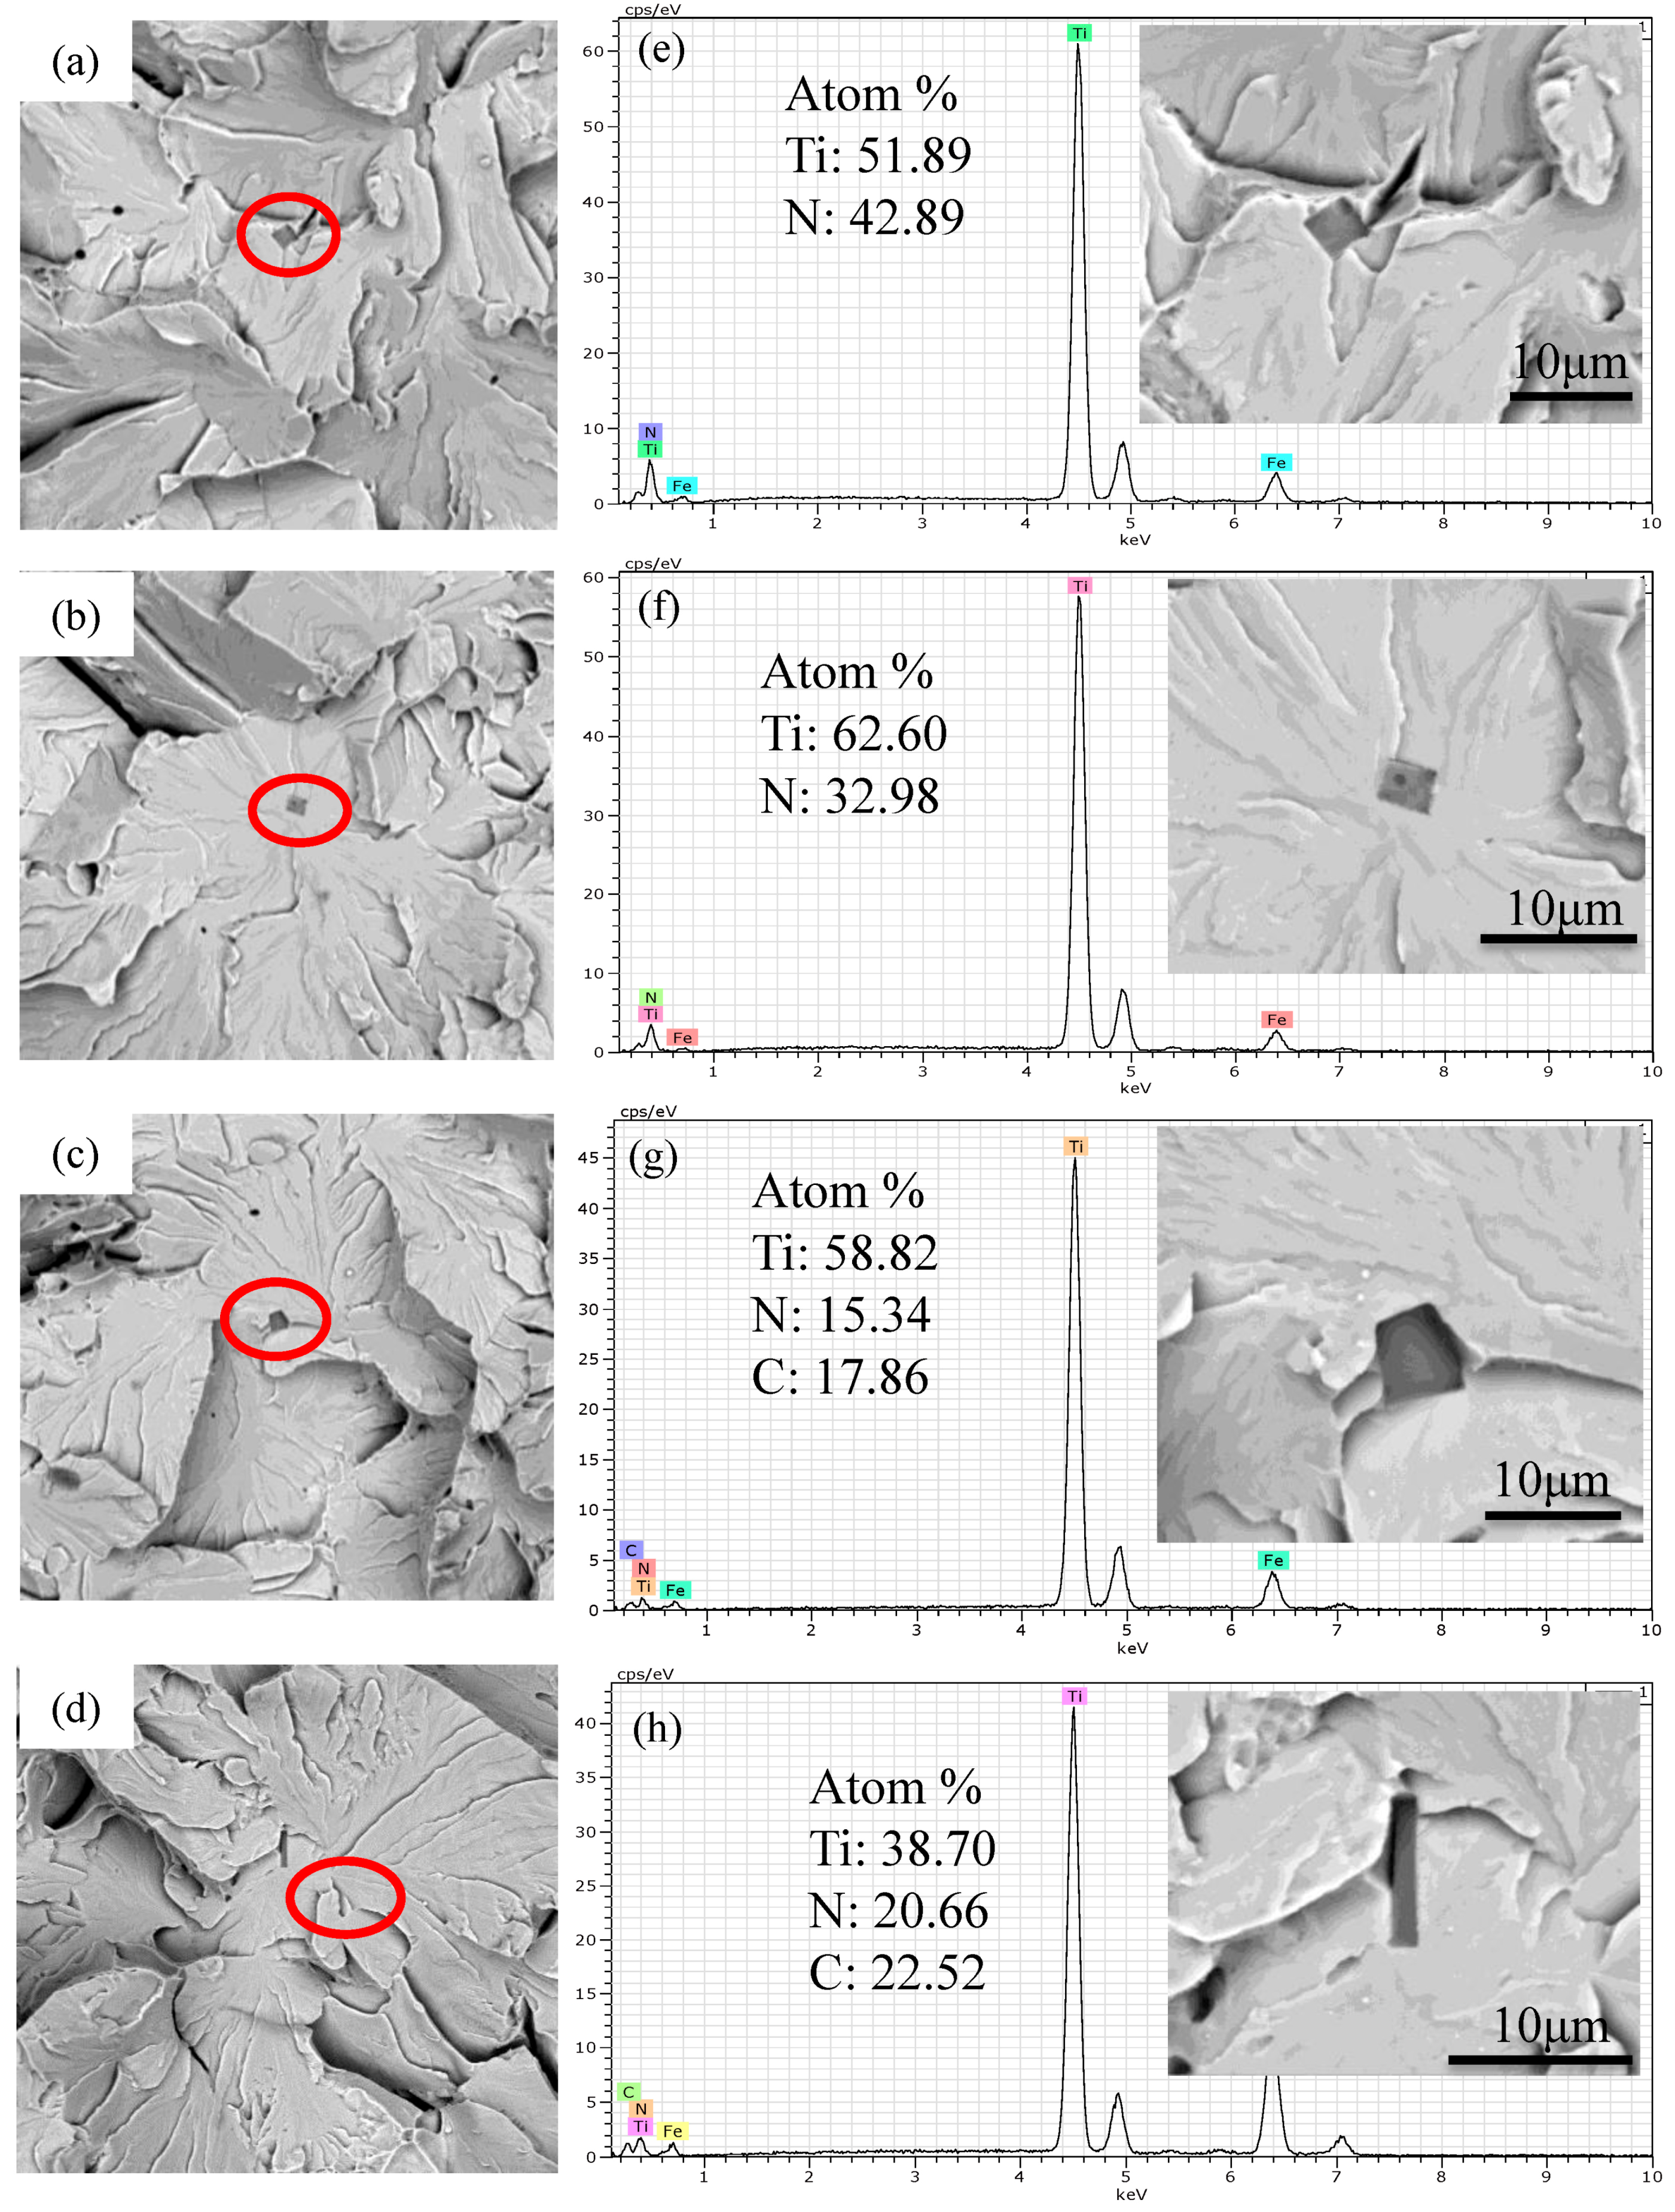
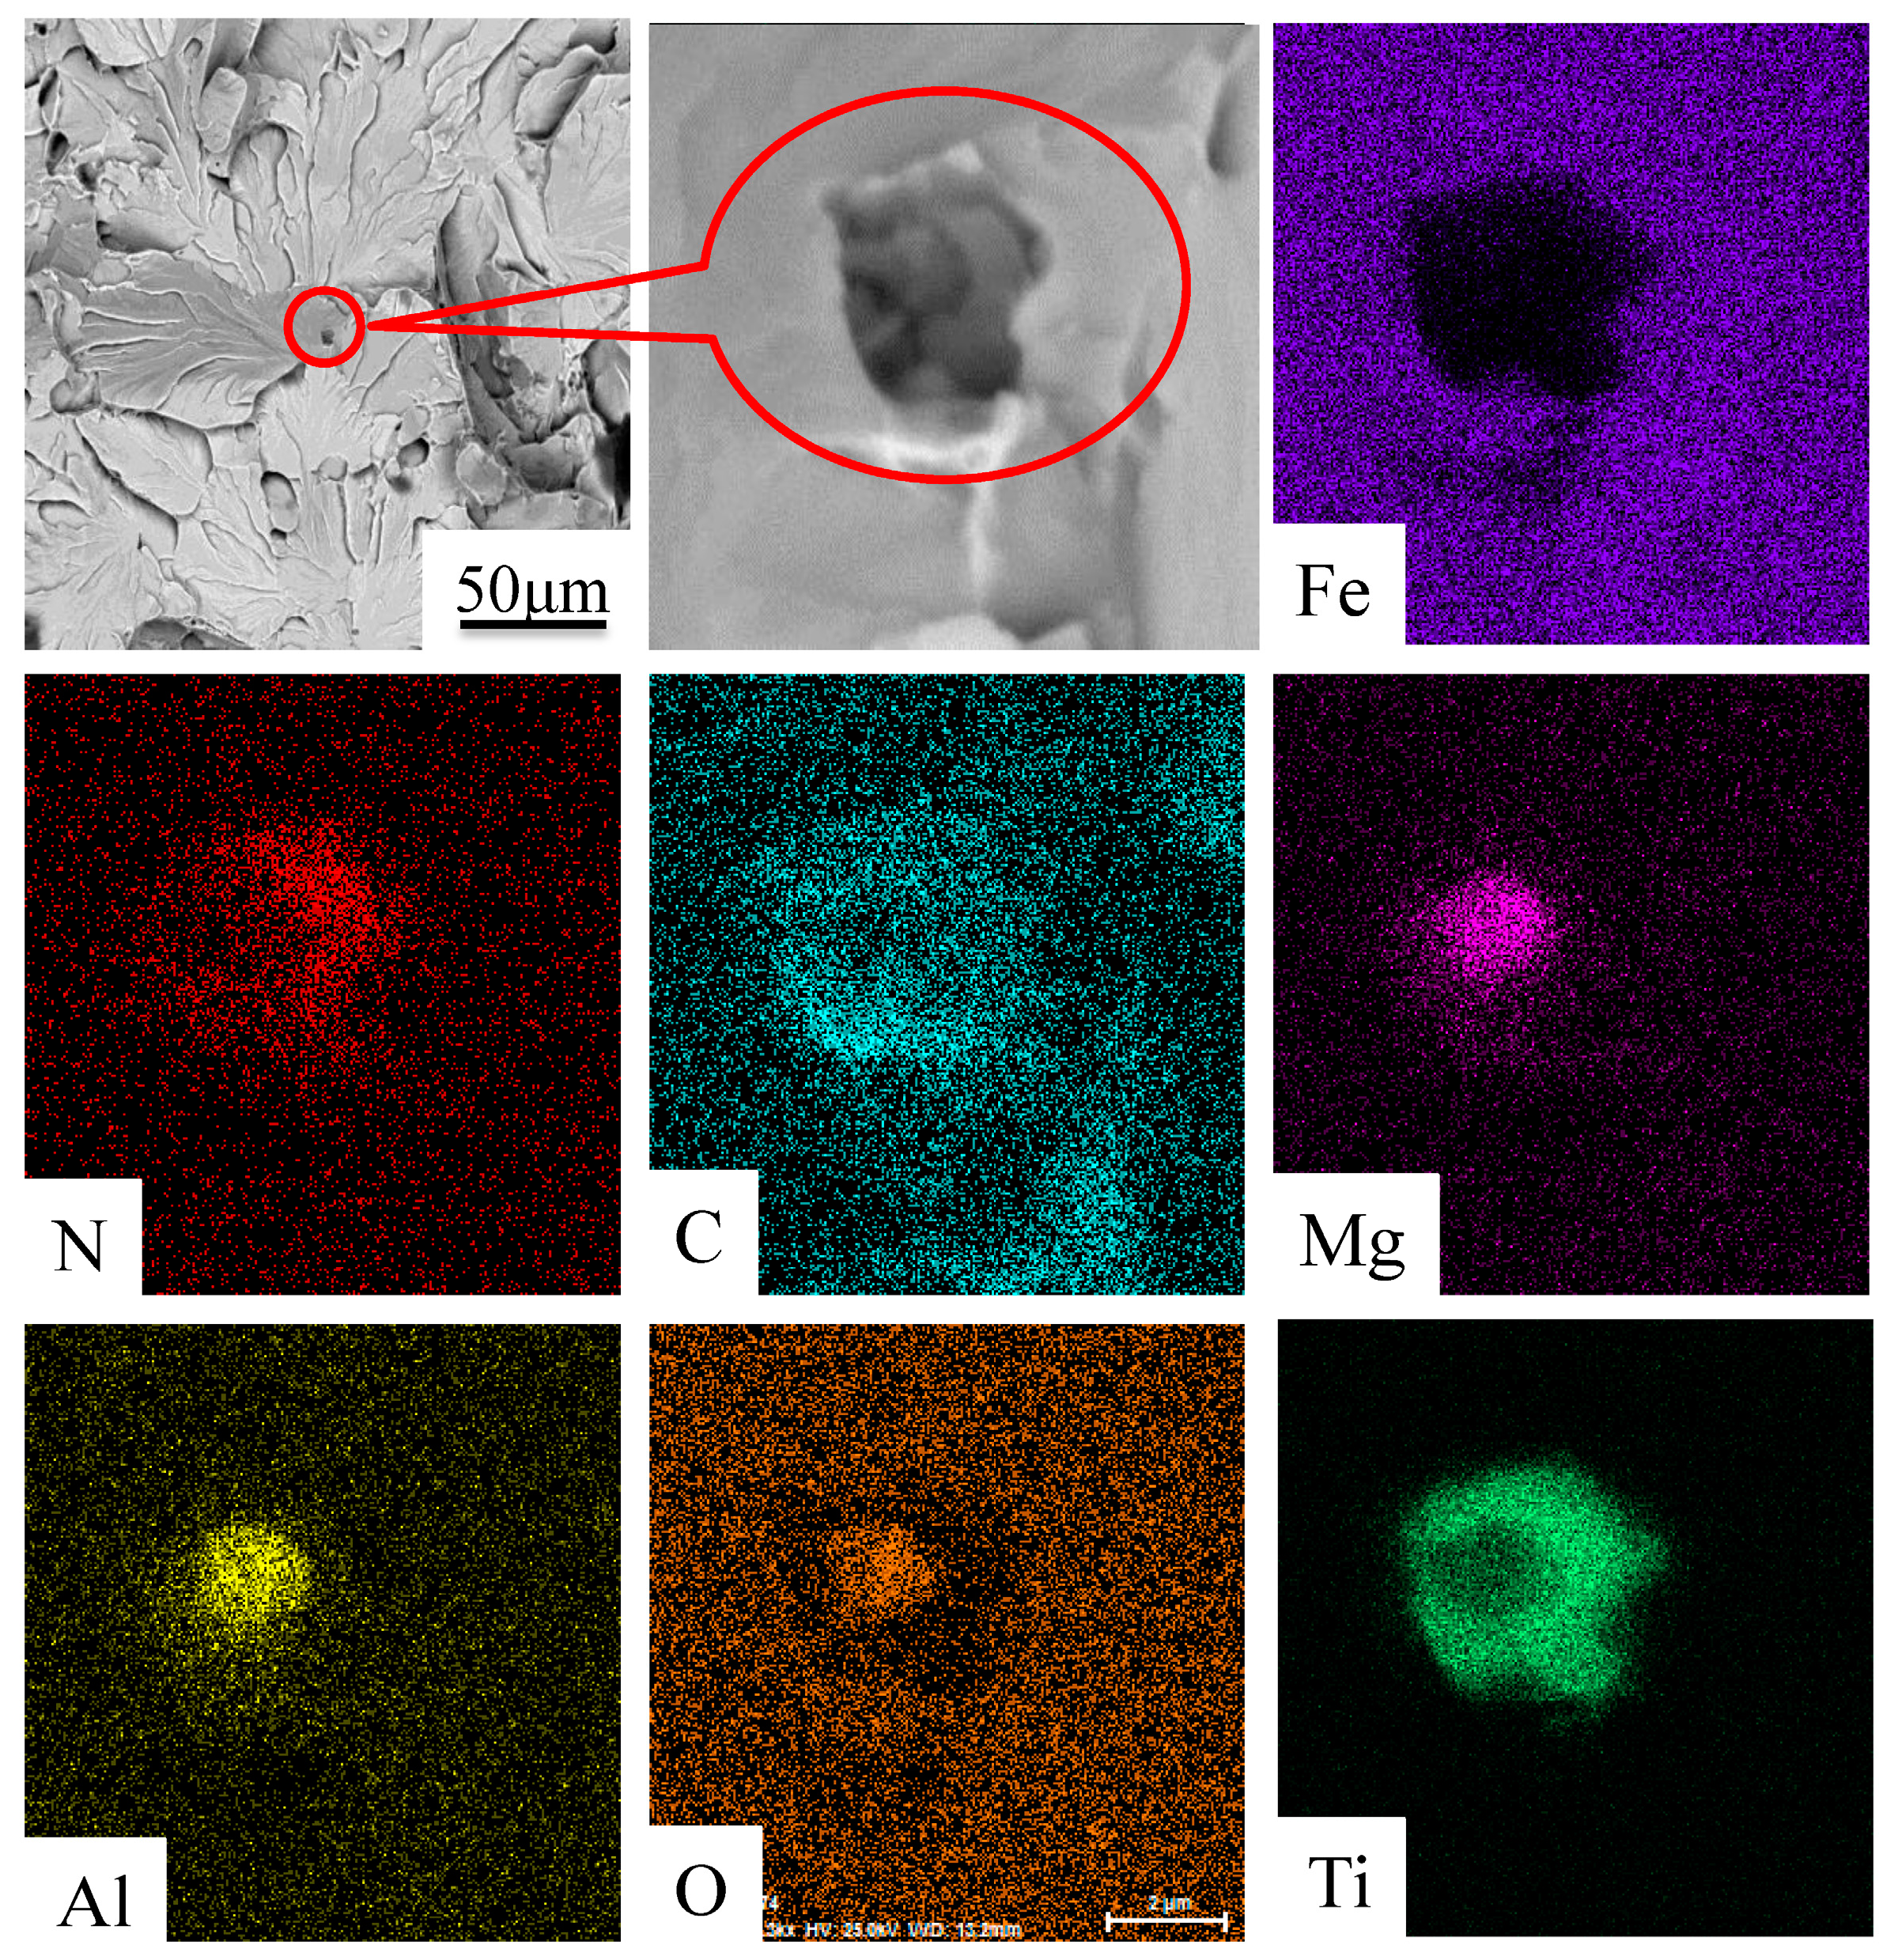
In order to identify the location of the origin of cleavage fracture, the fracture facets were magnified step by step, while taking more care on the field of view. The FIS is located on the center that the river lines pointed by tracing the path of river lines on the field of view. A coarse Ti(C, N) inclusion, several microns in size, was found at the center. Figure 2 shows the discovery process and chemical compositions of Ti(C, N) particle. The morphology of Ti(C, N) inclusion is square, and the square corners act as the origin of river lines. Following the tracks of river lines, some multi-layer inclusions were also found, as shown in Figure 3. The elements in nucleation core are Mg, Al, and O surrounded with Ti, C, and N outer layer, which indicates that MgAl2O4 acts as the heterogeneous nucleation core of coarse Ti(C, N) particle. In summary, the coarse Ti(C, N) particle is the direct cause for the poor impact properties of steel 1.
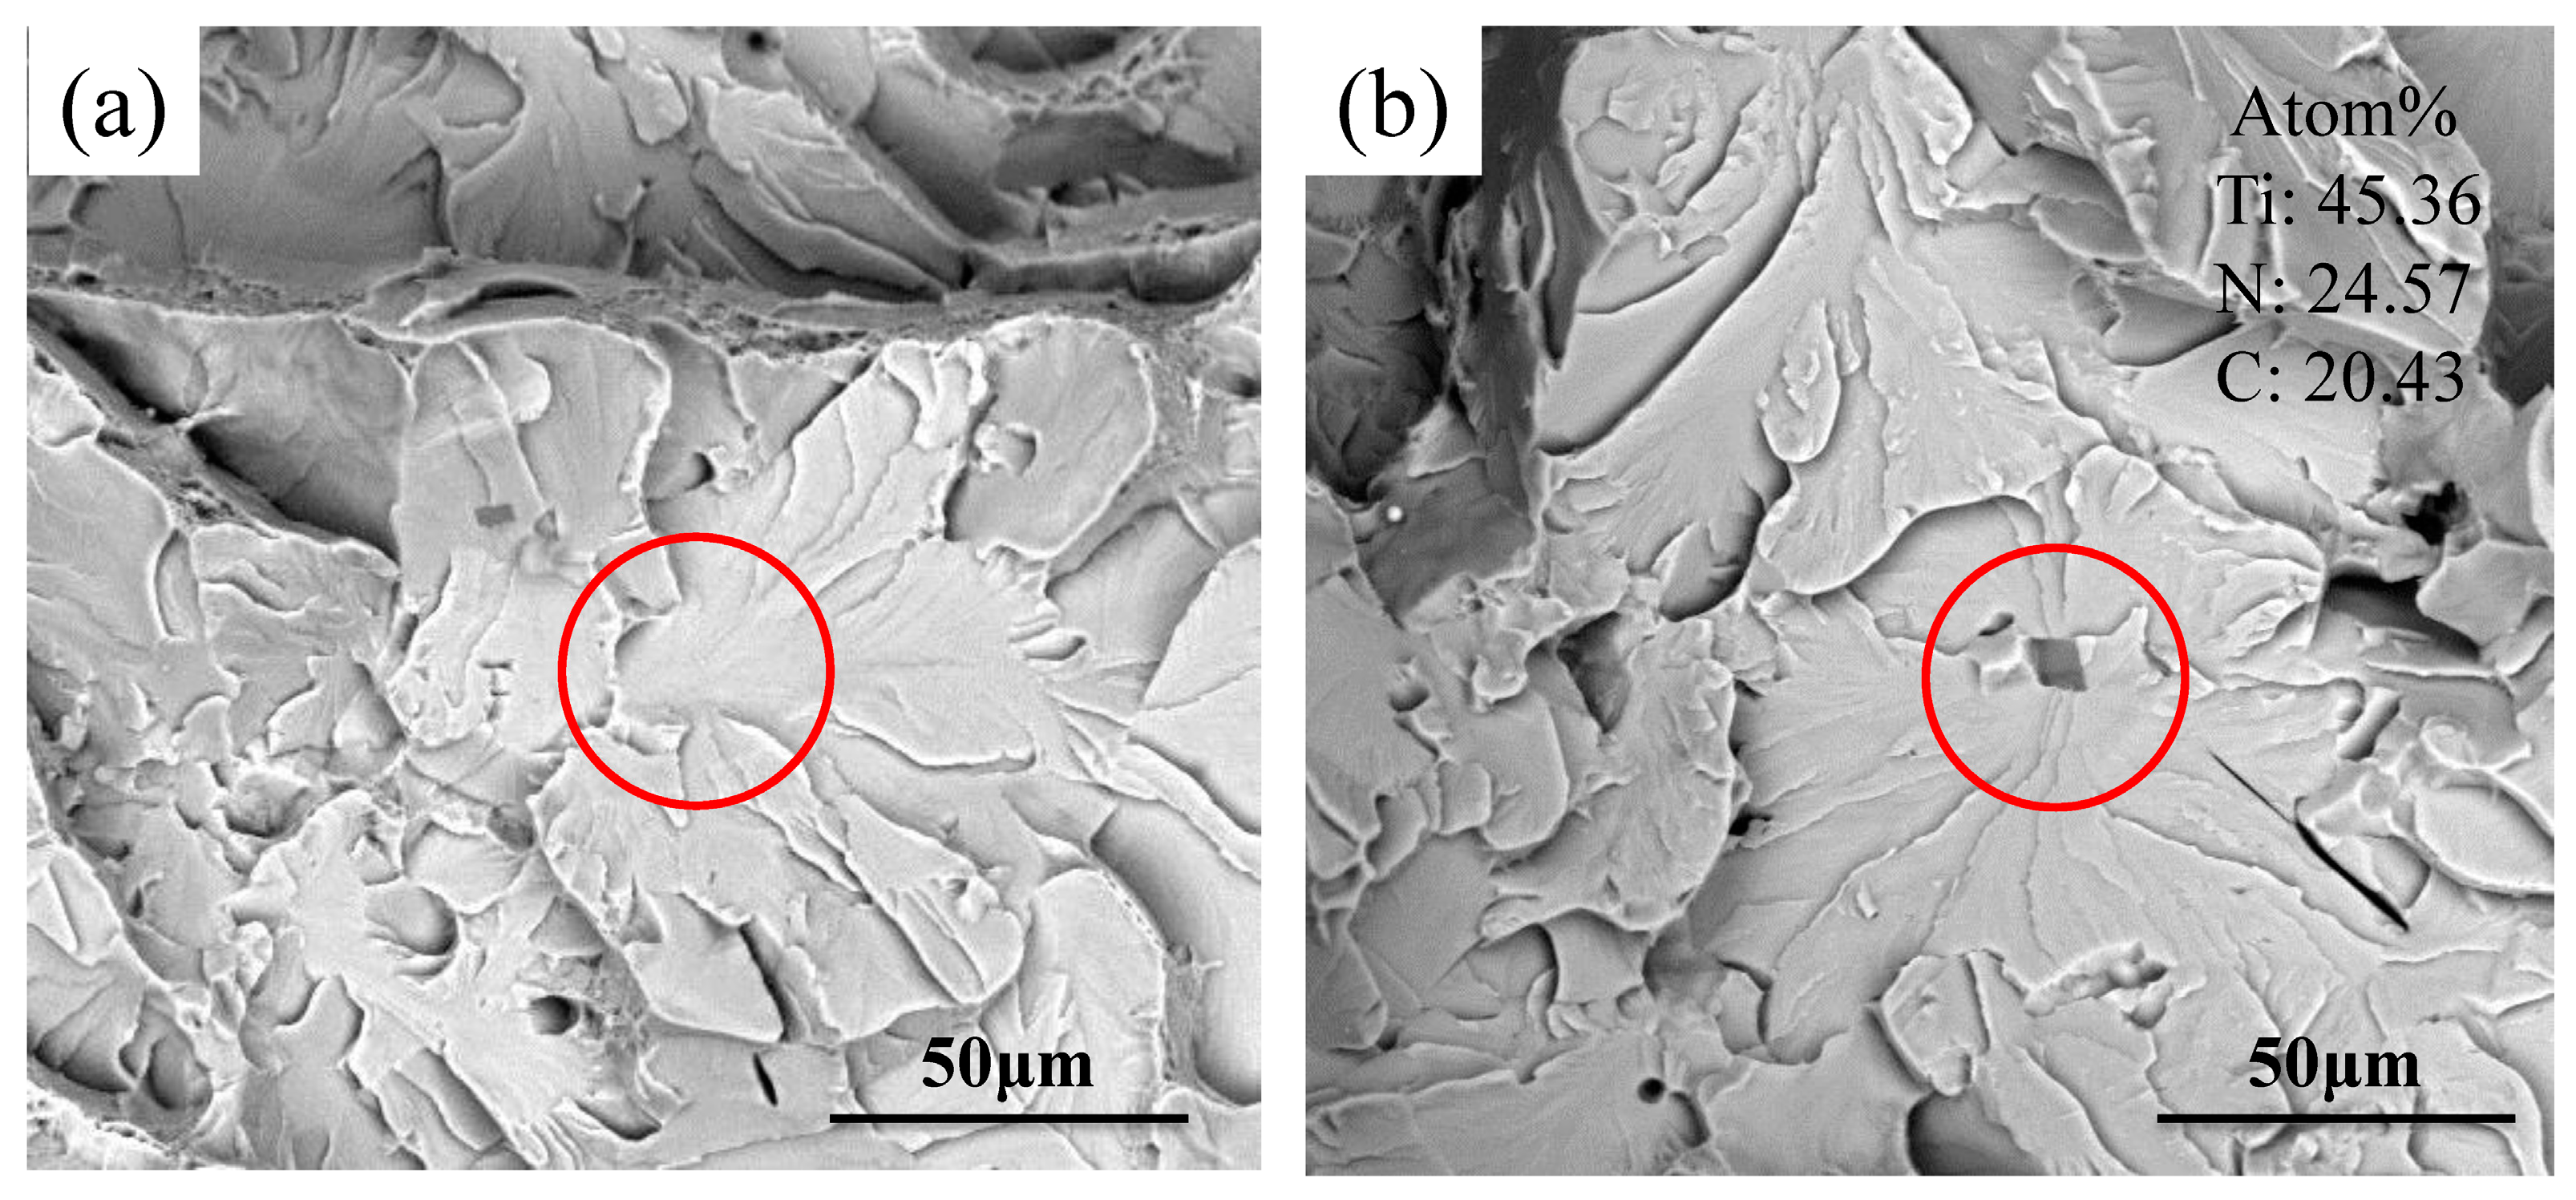
The FIS number density in steel 1-890 was obviously less than steel 1, as shown in Figure 1b. We found nothing at the center of the river lines at the most time, as shown in Figure 4a. Few clearly identifiable FIS initiated by Ti(C, N) particle were been found in steel 1-890, as shown in Figure 4b, which means the Ti(C, N) particles have little influence on the cleavage fracture of steel 1-890. The heat treatment obviously decreases the harm of coarse Ti(C, N) particle on the impact property of steel 1.
3.2. Metallographic Structure
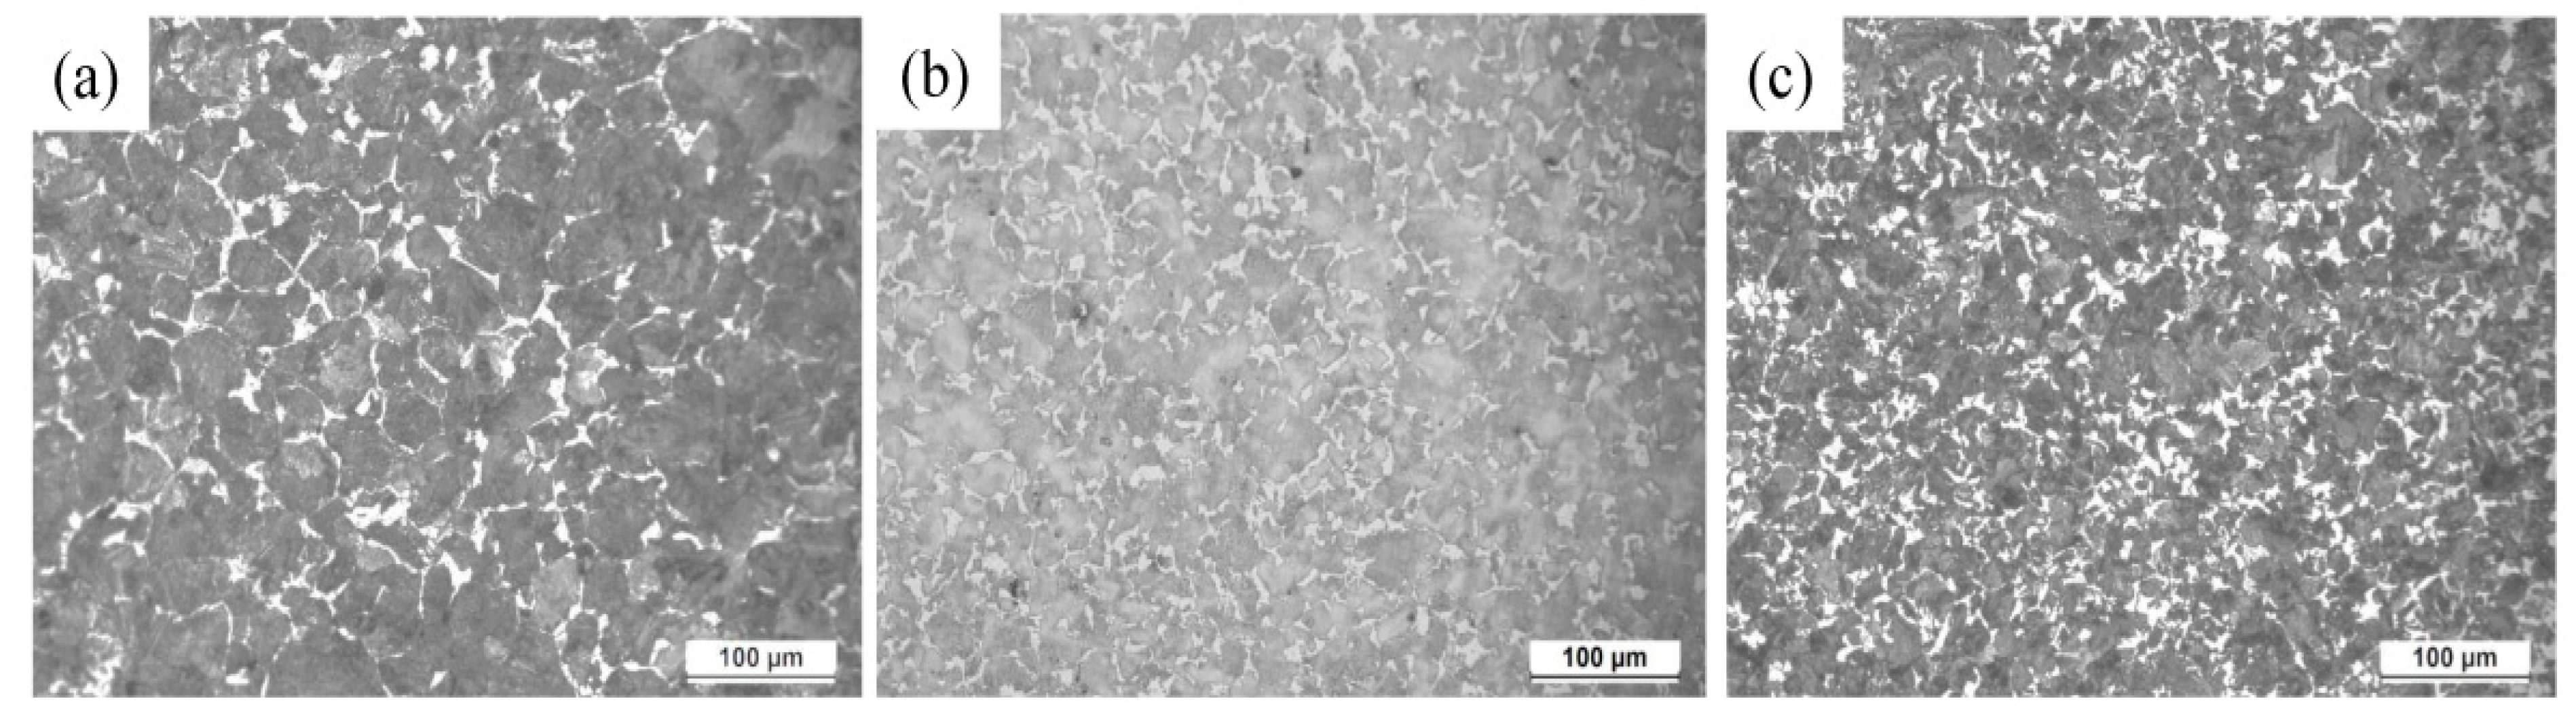
The matrix microstructures of steel 1, steel 2, and steel 1-890 are ferrite and pearlite, as shown in Figure 5. The white net-like structures are grain boundary ferrite (GBF), and the black structures are pearlite. In order to further illustrate the distribution features of matrix microstructure in samples, ImageJ software was used to calculate the grain size and area percentage of ferrite. The results are shown in Table 3. The grain size of steel 1 is larger than steel 2, and the area percentage of ferrite in steel 2 is more than steel 1. After the normalizing treatment, the grain size decreases from 39.1 to 28.1 μm, and the area percentage of ferrite increases from 7.1 to 12.9%. The distribution uniformity of ferrite in experimental materials are basically the same for steel 1 and steel 2, but it is more homogenous for steel 1-890, according to the standard deviation in Table 3. Grain size and the area percentage of ferrite have great influence on the impact toughness of microalloyed steel. The larger the grain size [21] and the lower the area percentage of ferrite [22,23,24], the worse the impact toughness is, which agrees well with the results in Table 2.
3.3. Morphologies of Inclusions in Samples
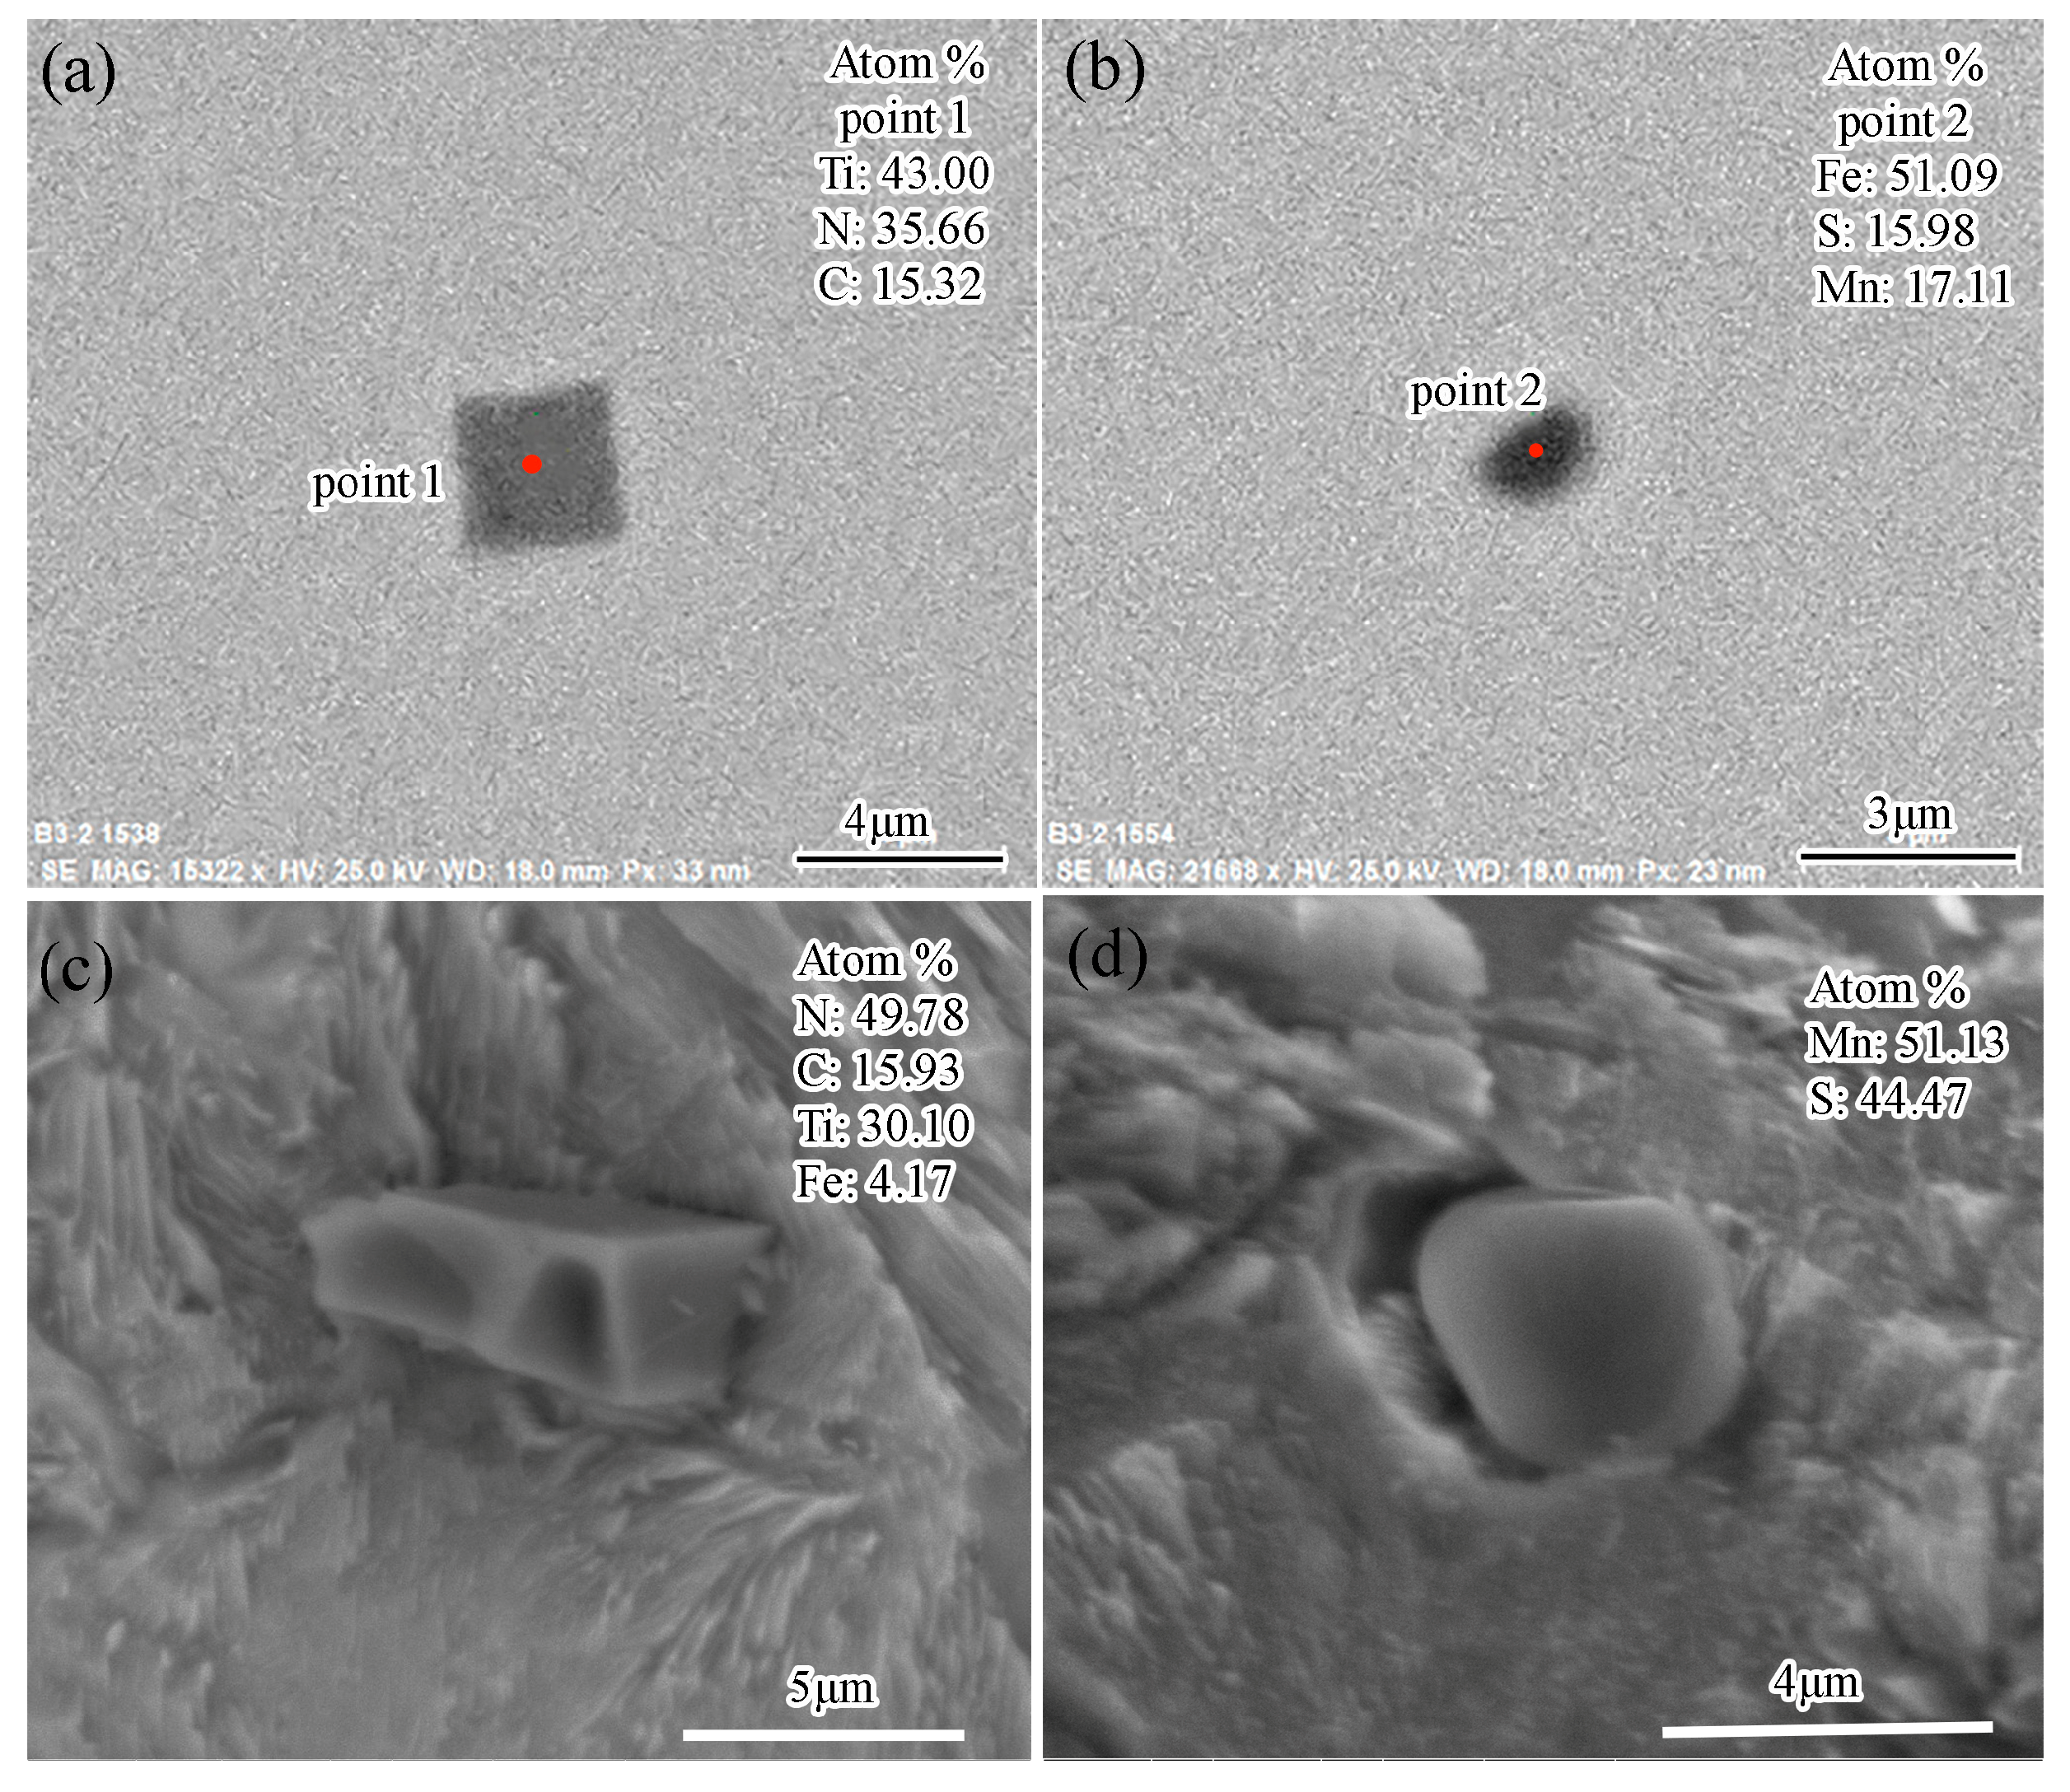
The type of main inclusions in steel 1 and steel 2 is basically the same. The typical two-dimensional and three-dimensional morphologies of main inclusions are shown in Figure 6. One inclusion is Ti(C, N) particle, and the other one is MnS. The shape of Ti(C, N) is a regular cube, and the size is approximately 5 μm. The shape of MnS is spheroid, and the size is about 4 μm.
3.4. Distribution of Ti(C, N) Particles in Samples
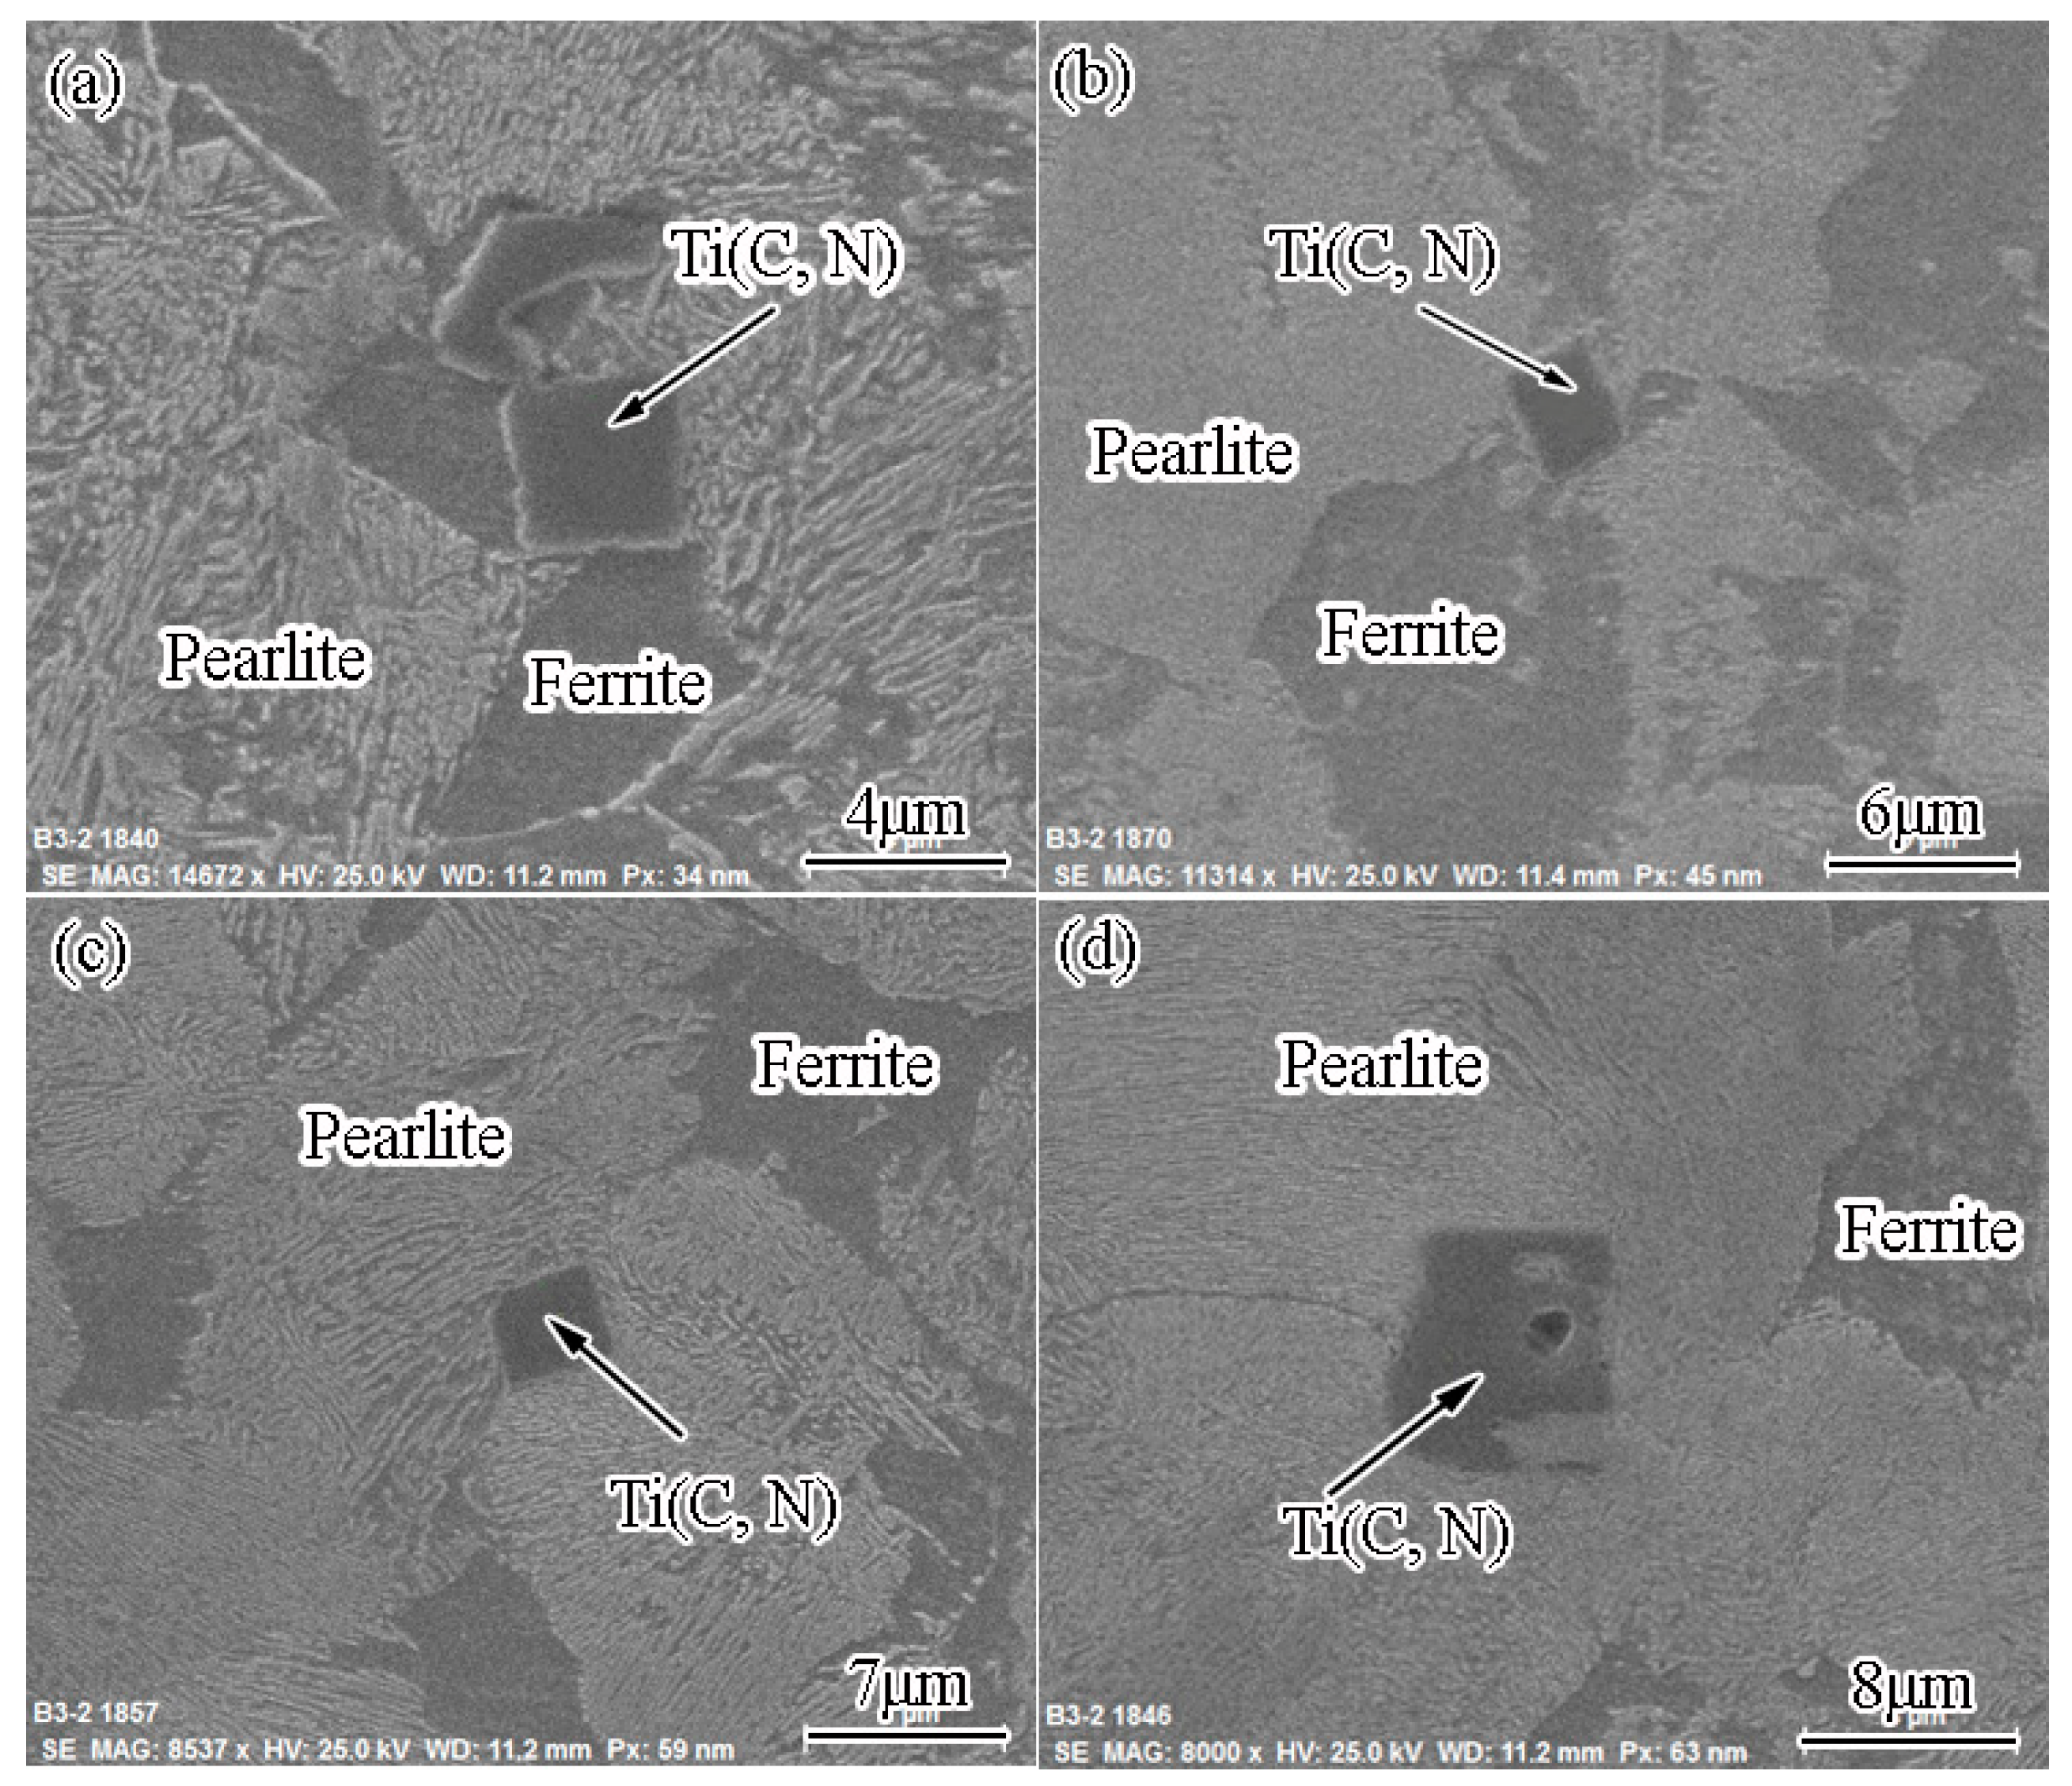
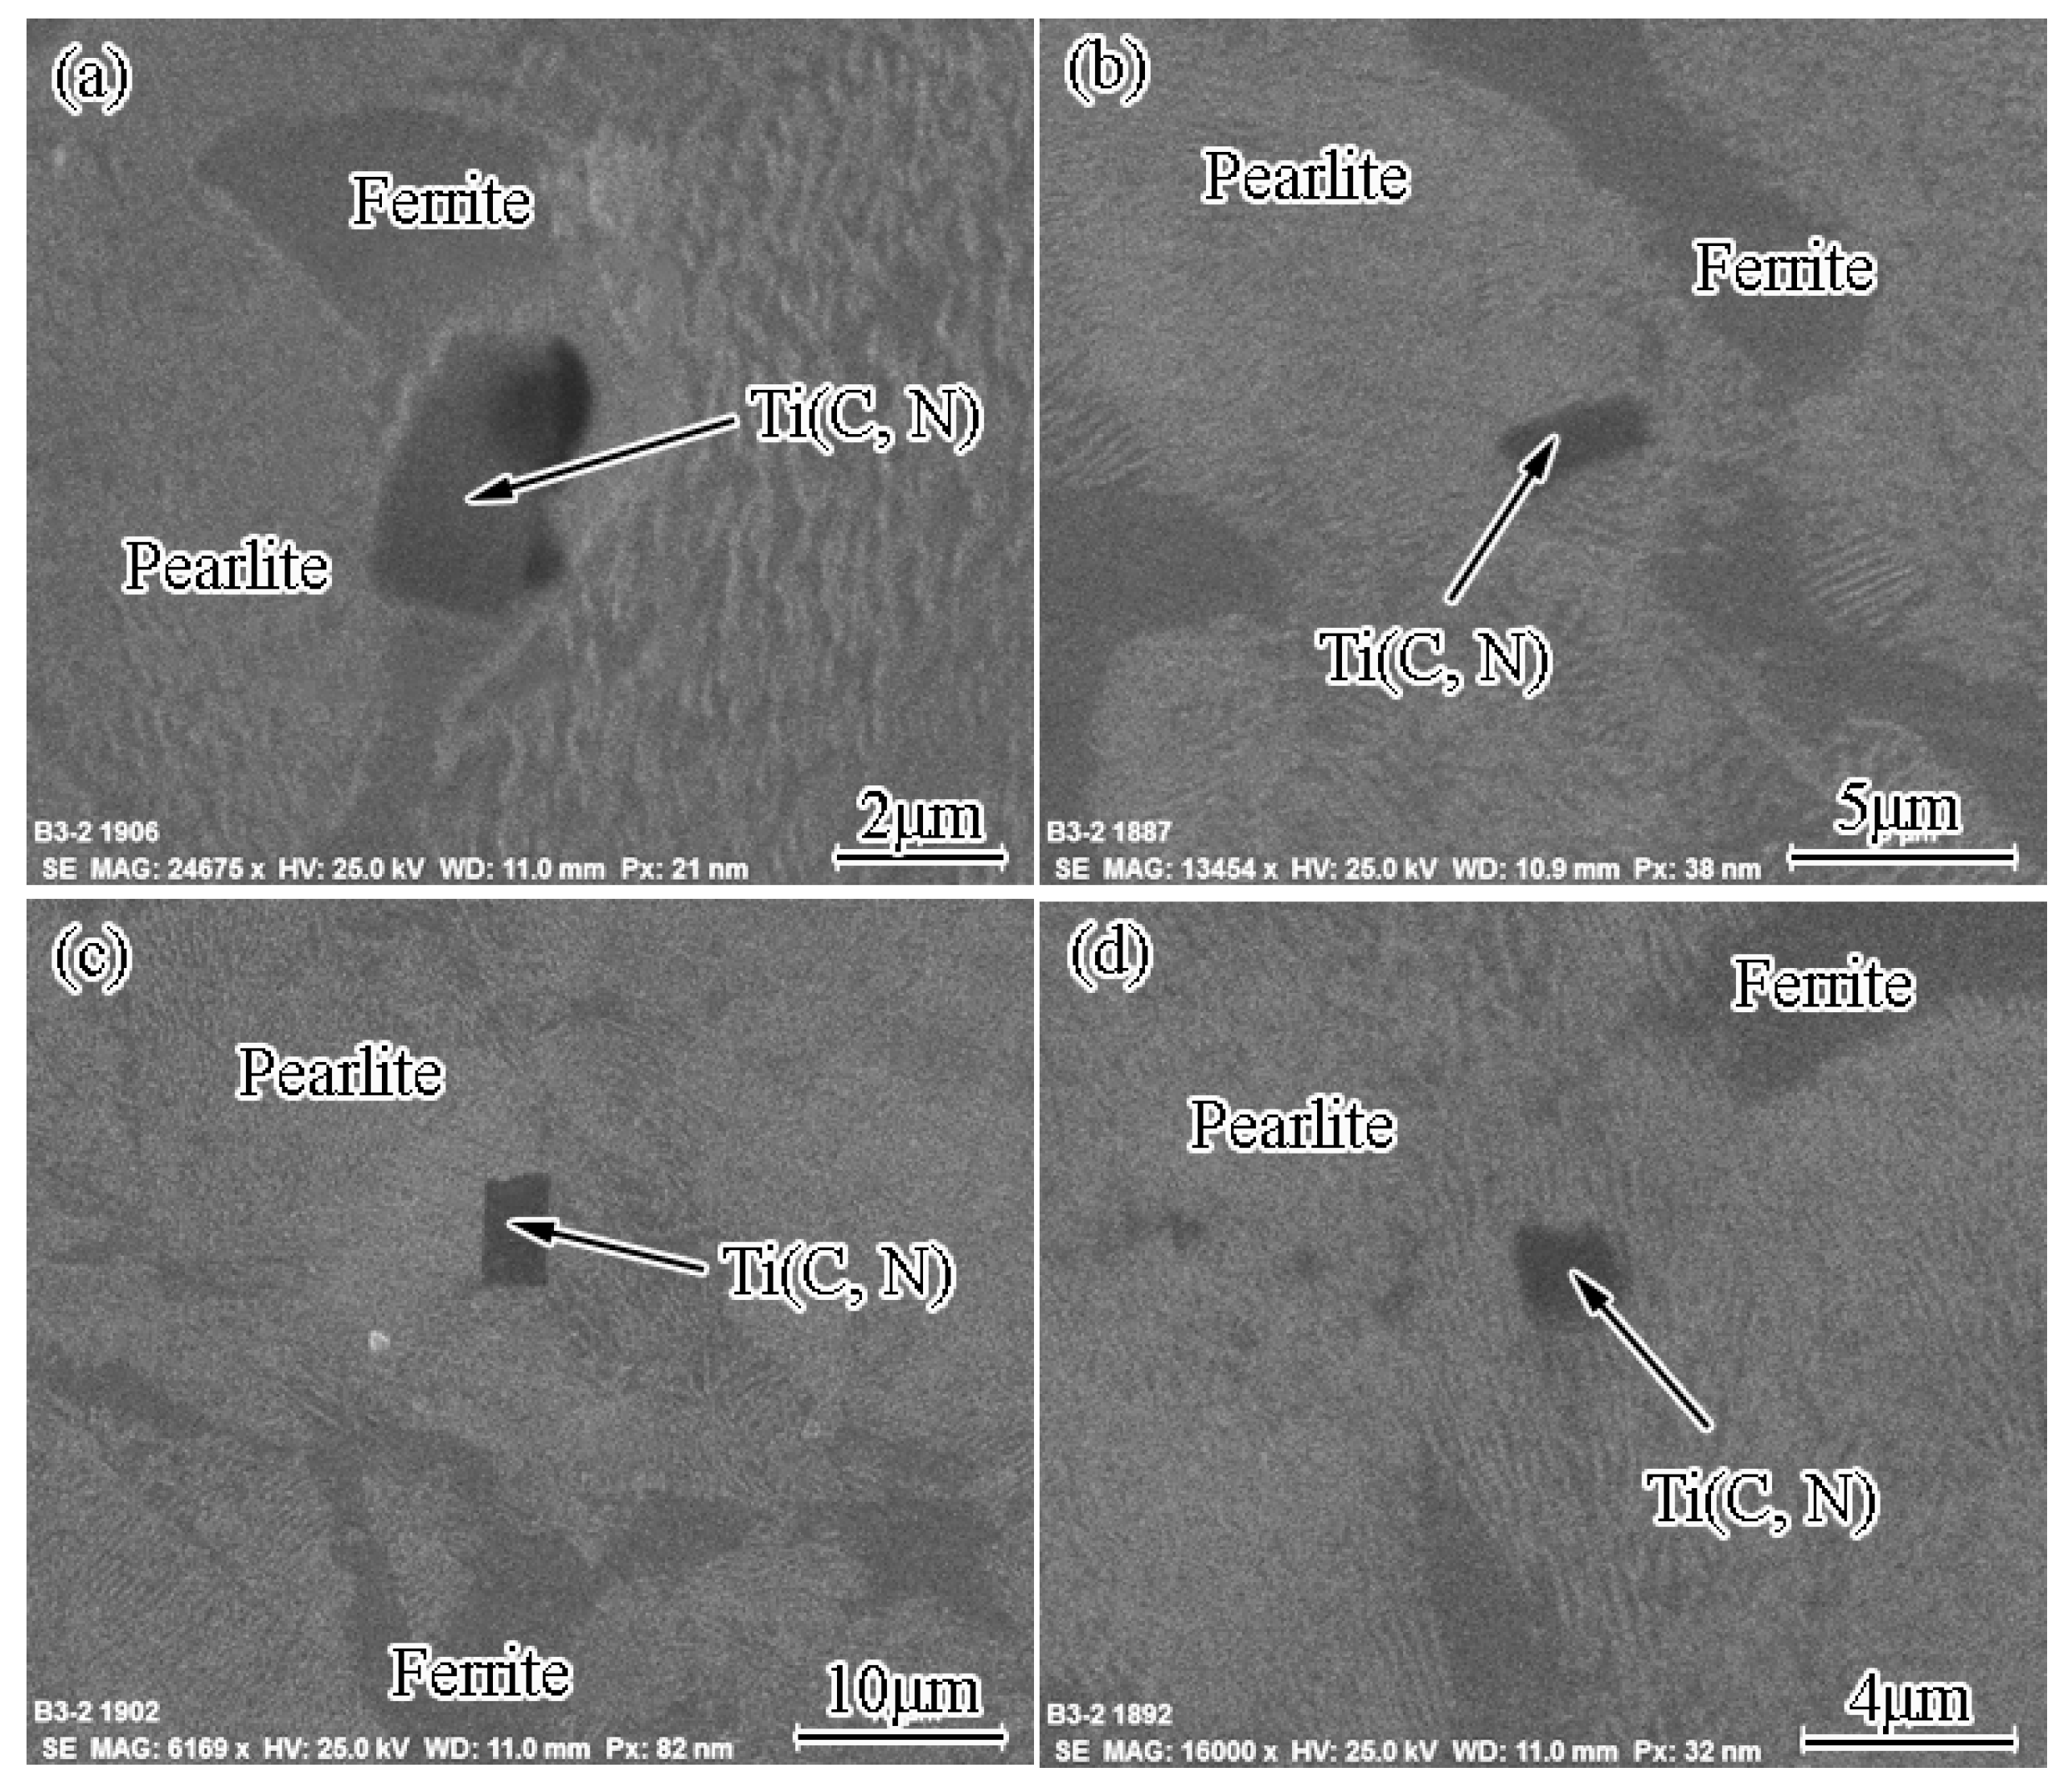
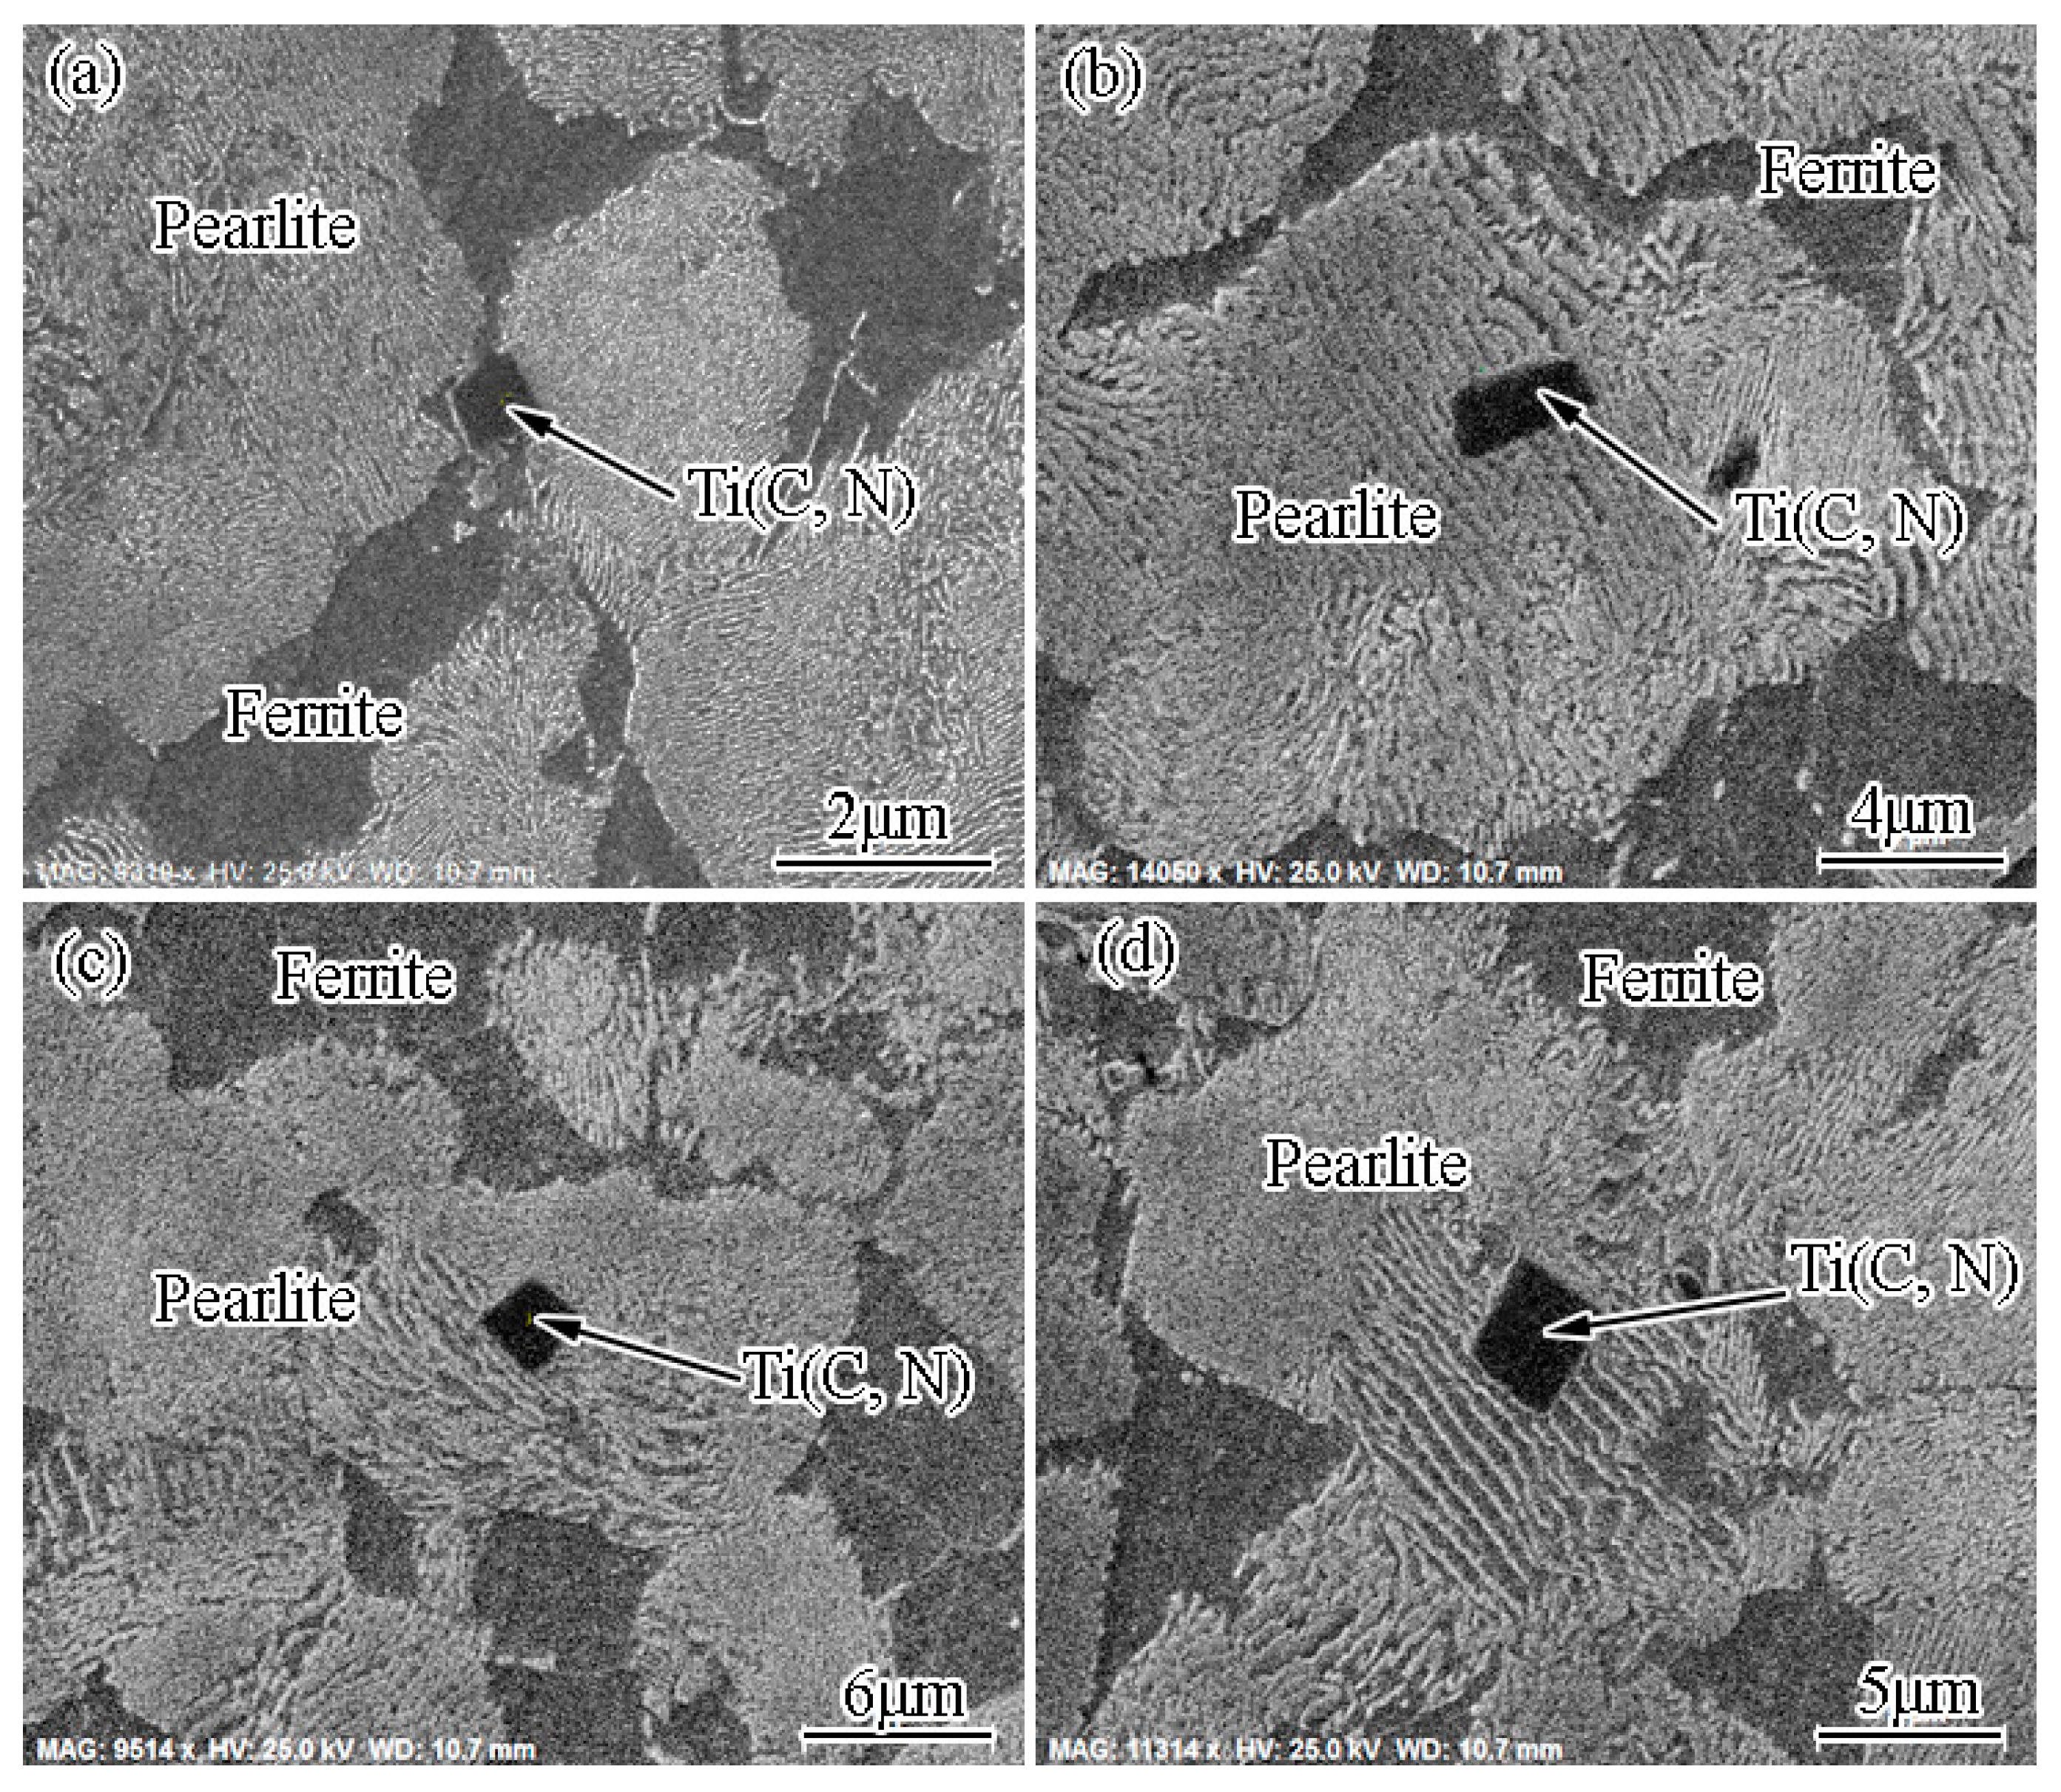
The location of coarse Ti(C, N) particles in specimens was identified by investigating the morphology of specimens corroded with alcohol solution containing 4% acid. Figure 7 shows the location of coarse Ti(C, N) particles in steel 1, and it can be seen that the coarse Ti(C, N) particles were located in both ferrite and pearlite. The percentage of coarse Ti(C, N) particles located in ferrite is 58%, as shown in Table 4, obtained through investigating of the location of 100 Ti(C, N) particles. The coarse Ti(C, N) particles in steel 1-890 were also located in both ferrite and pearlite, as shown in Figure 8. However, the percentage of coarse Ti(C, N) particles located in ferrite is only 20%, and located in pearlite is 80%, which means the location of Ti(C, N) particles partly changed from ferrite to pearlite during the normalizing process. Figure 9 shows the location of Ti(C, N) particles in steel 2, where 78% of coarse Ti(C, N) particles were located in pearlite, which is similar to steel 1-890.
Hard Ti(C, N) particles can significantly reduce the continuity of soft ferrite, causing stress concentration between Ti(C, N) particles and ferrite and, then, leading to the final failure of specimen [25,26]. Therefore, the more the Ti(C, N) particles are located in ferrite, the worse the impact toughness is. After the normalizing treatment, the location change of coarse Ti(C, N) particle and grain size refinement are the main reasons for the increase of the CUN-absorbed energy.
3.5. The Composition, Number Density and Size of Ti(C, N) Inclusions
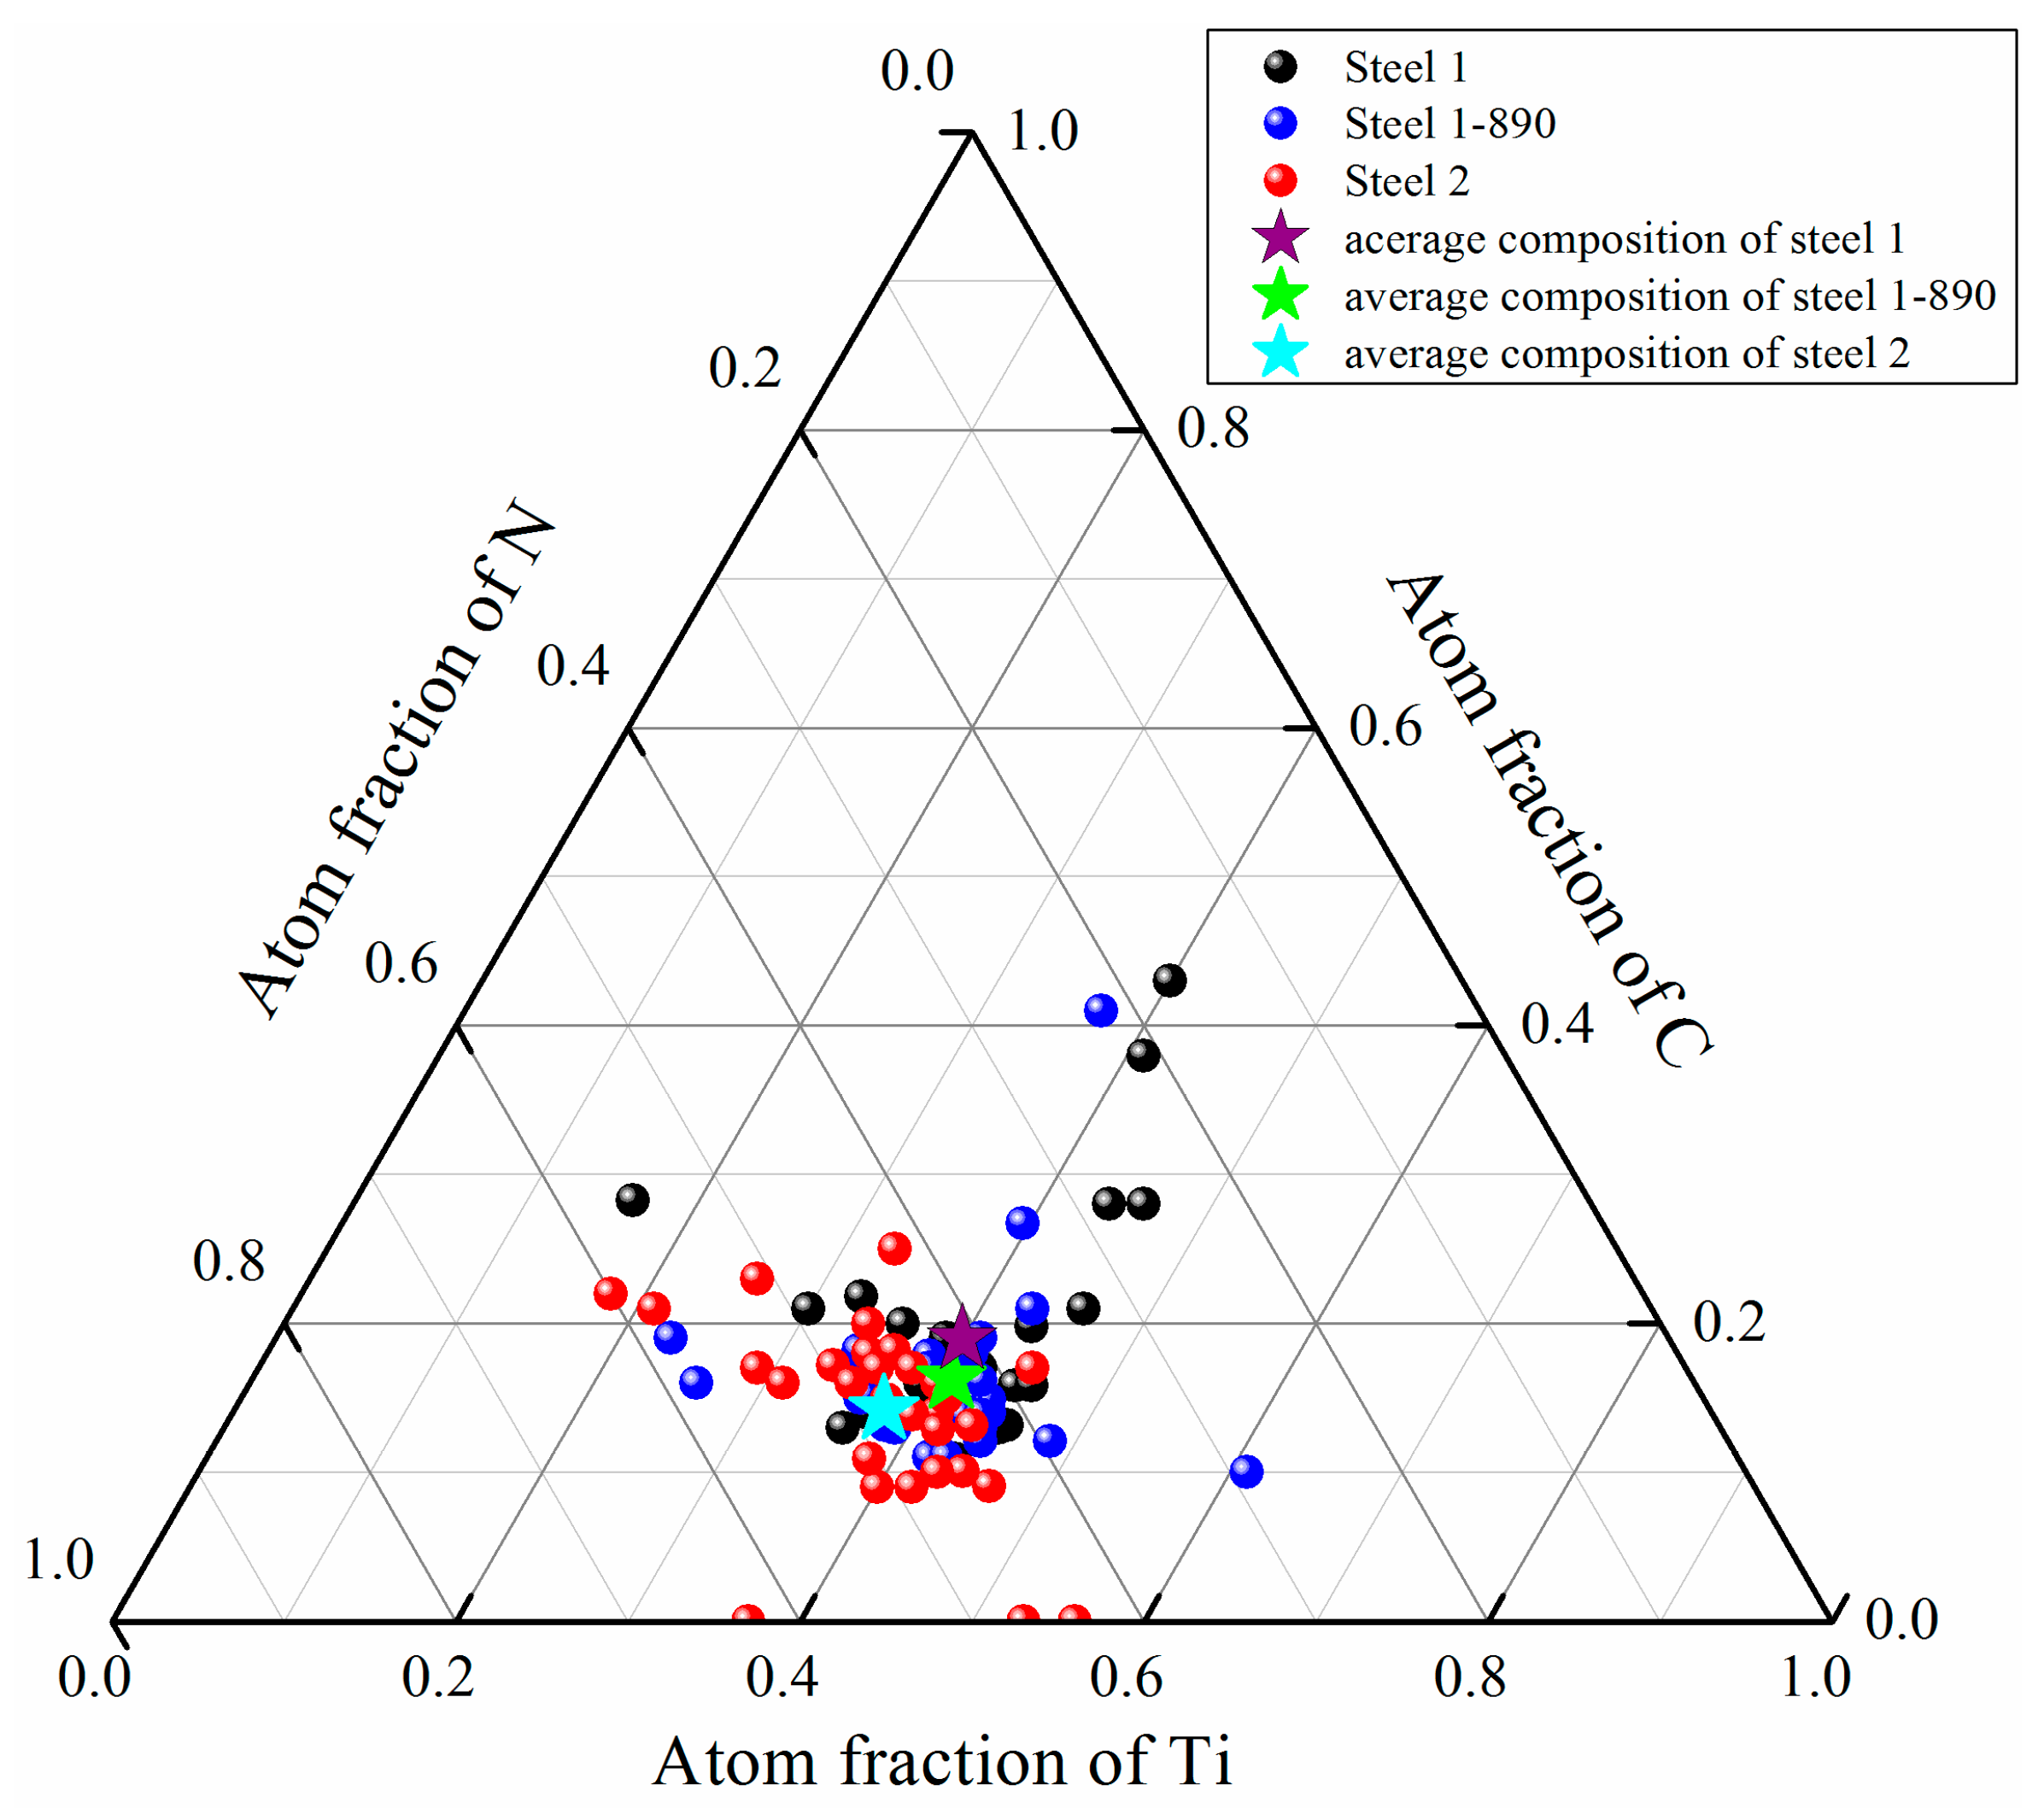
Figure 10 shows the normalized compositional distribution of the main elements in Ti(C, N) inclusions. The stars represent the average composition of coarse Ti(C, N) particles in specimens. It can be seen that the Ti content is almost the same, but the N content in Ti(C, N) particles found in steel 2 is higher than steel 1. Due to the Ti/N ratio in steel 1 being larger than steel 2, the greater C content would react with Ti to form Ti(C, N) inclusions during solidification.
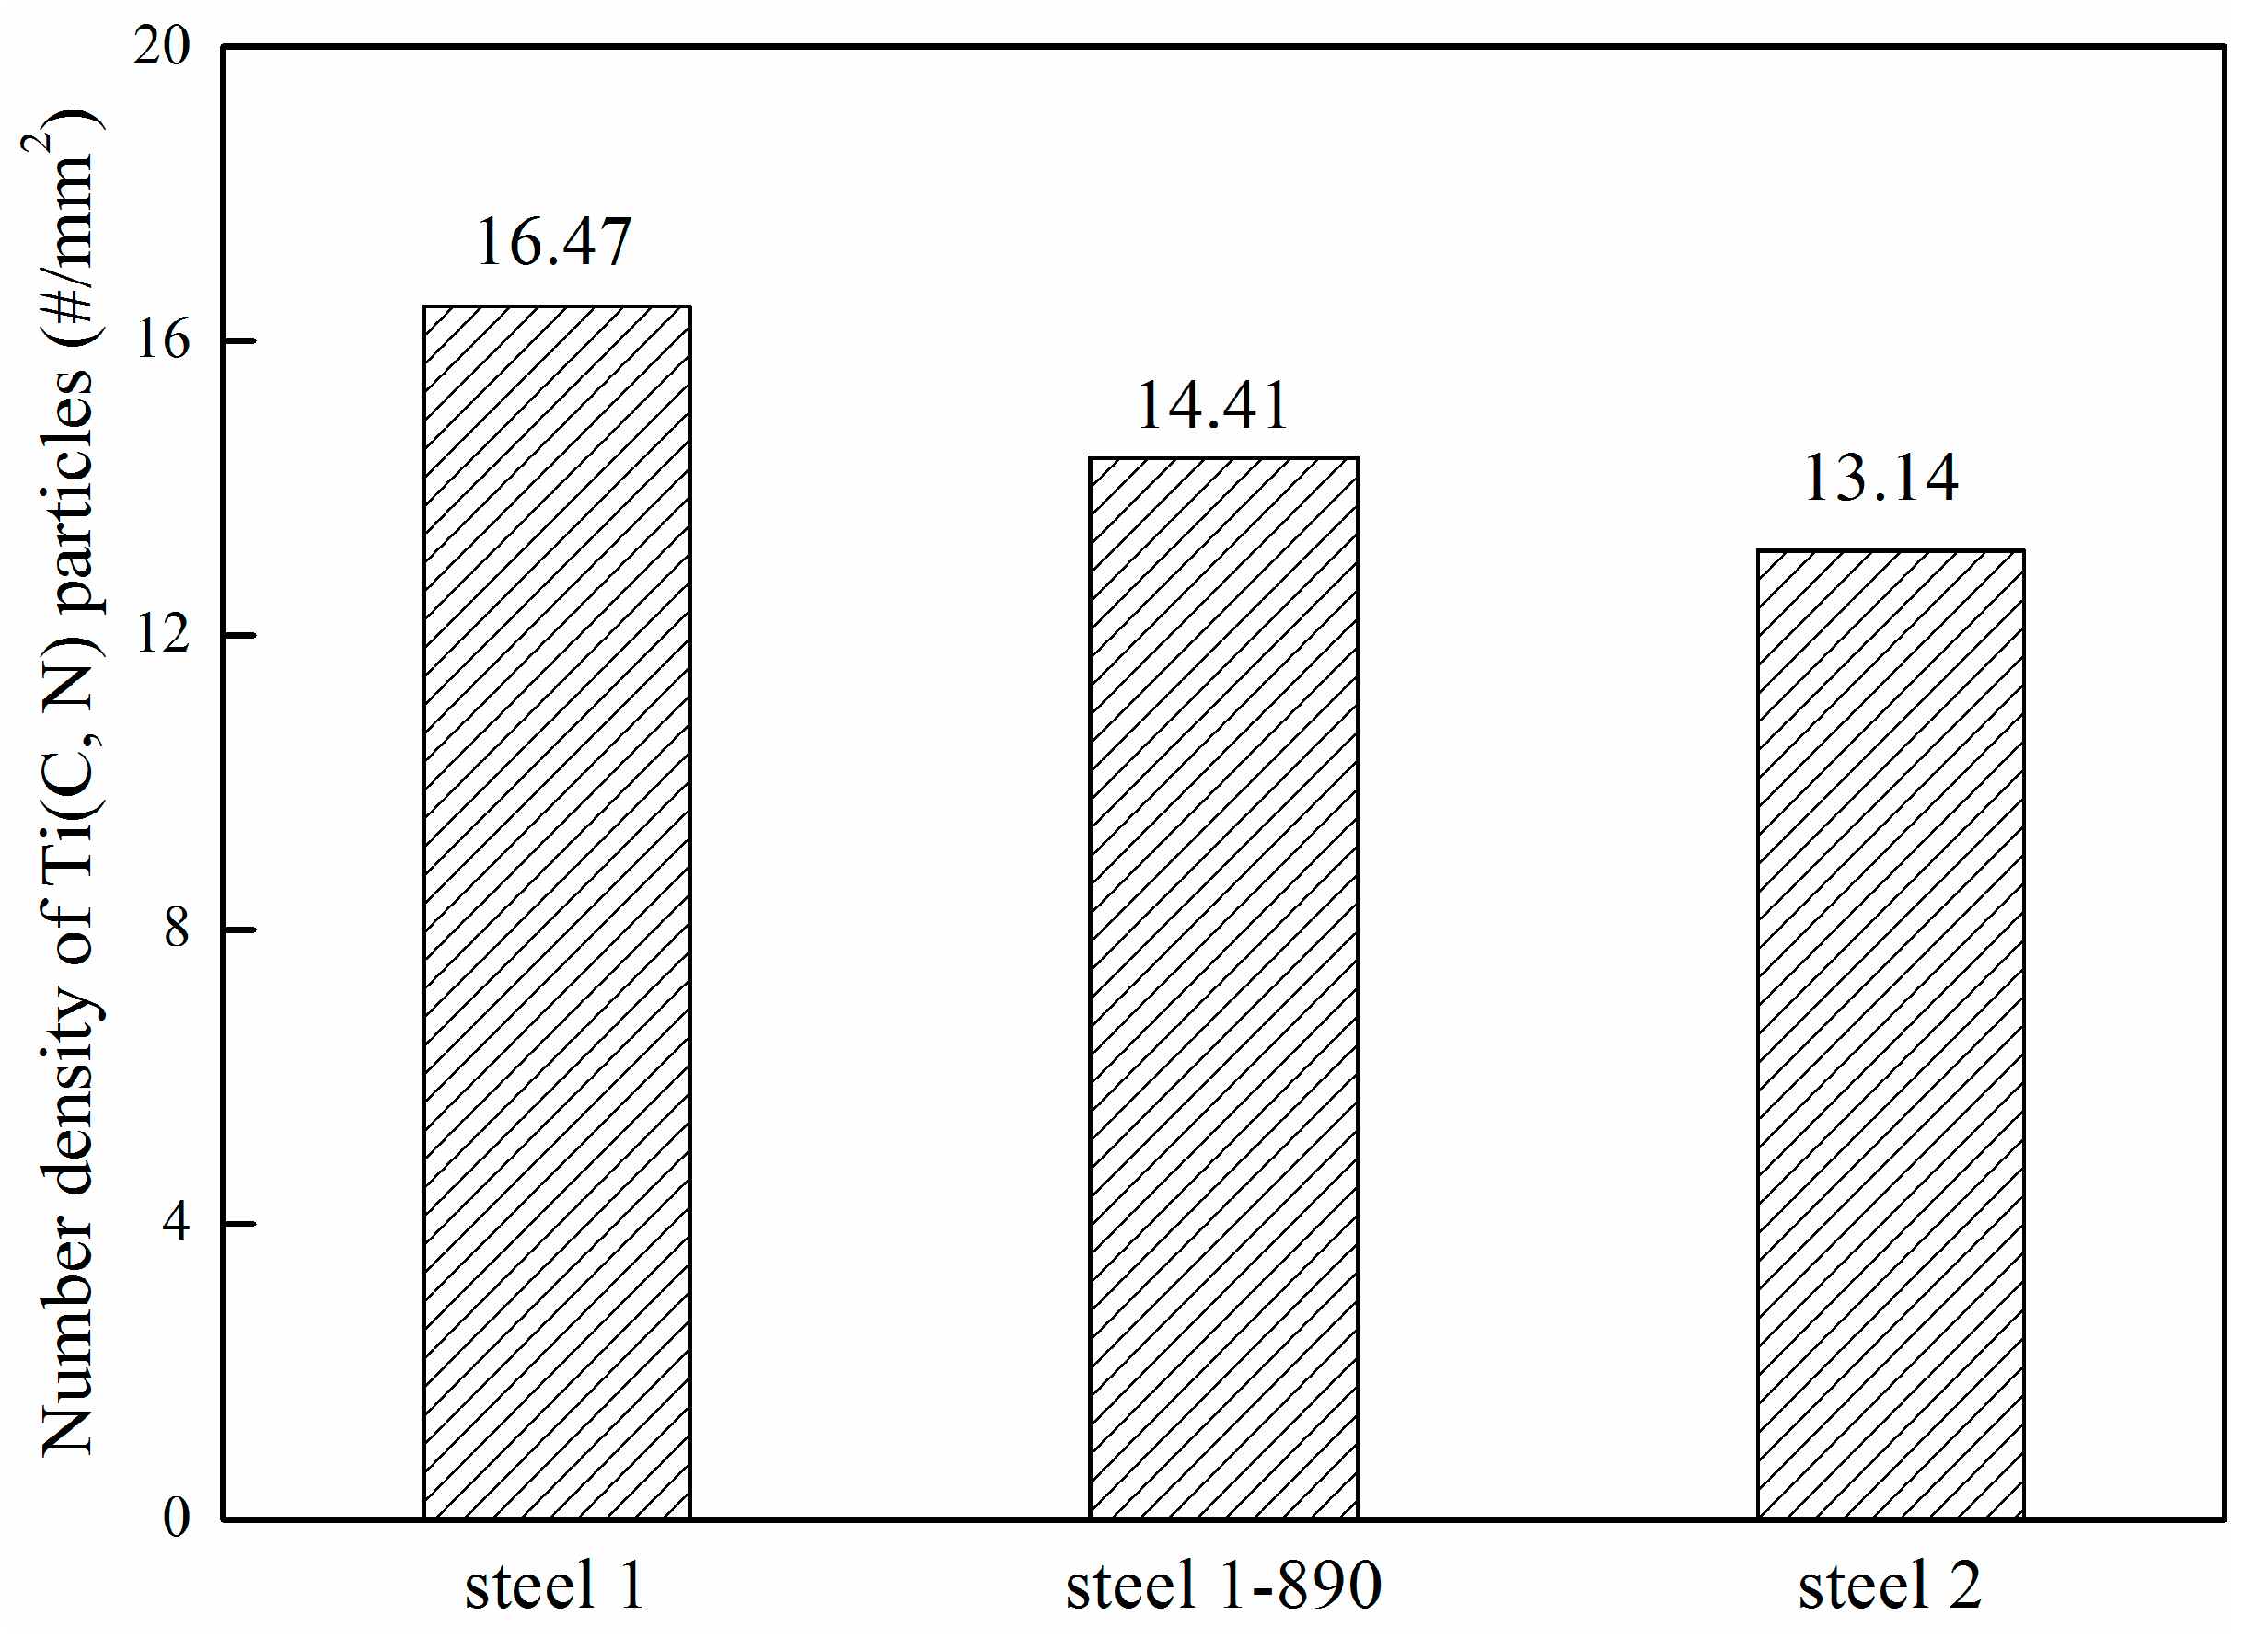
The number density of coarse Ti(C, N) particles (with the size larger than 1 μm) in steel 1 is 16.47 mm−2, and the number density of Ti(C, N) particles in steel 1-890 is 14.41 mm−2, as shown in Figure 11. The number density of coarse Ti(C, N) particles slightly decreases after heat treatment, probably caused by the consequence of the dispersion along the steel bars tested.
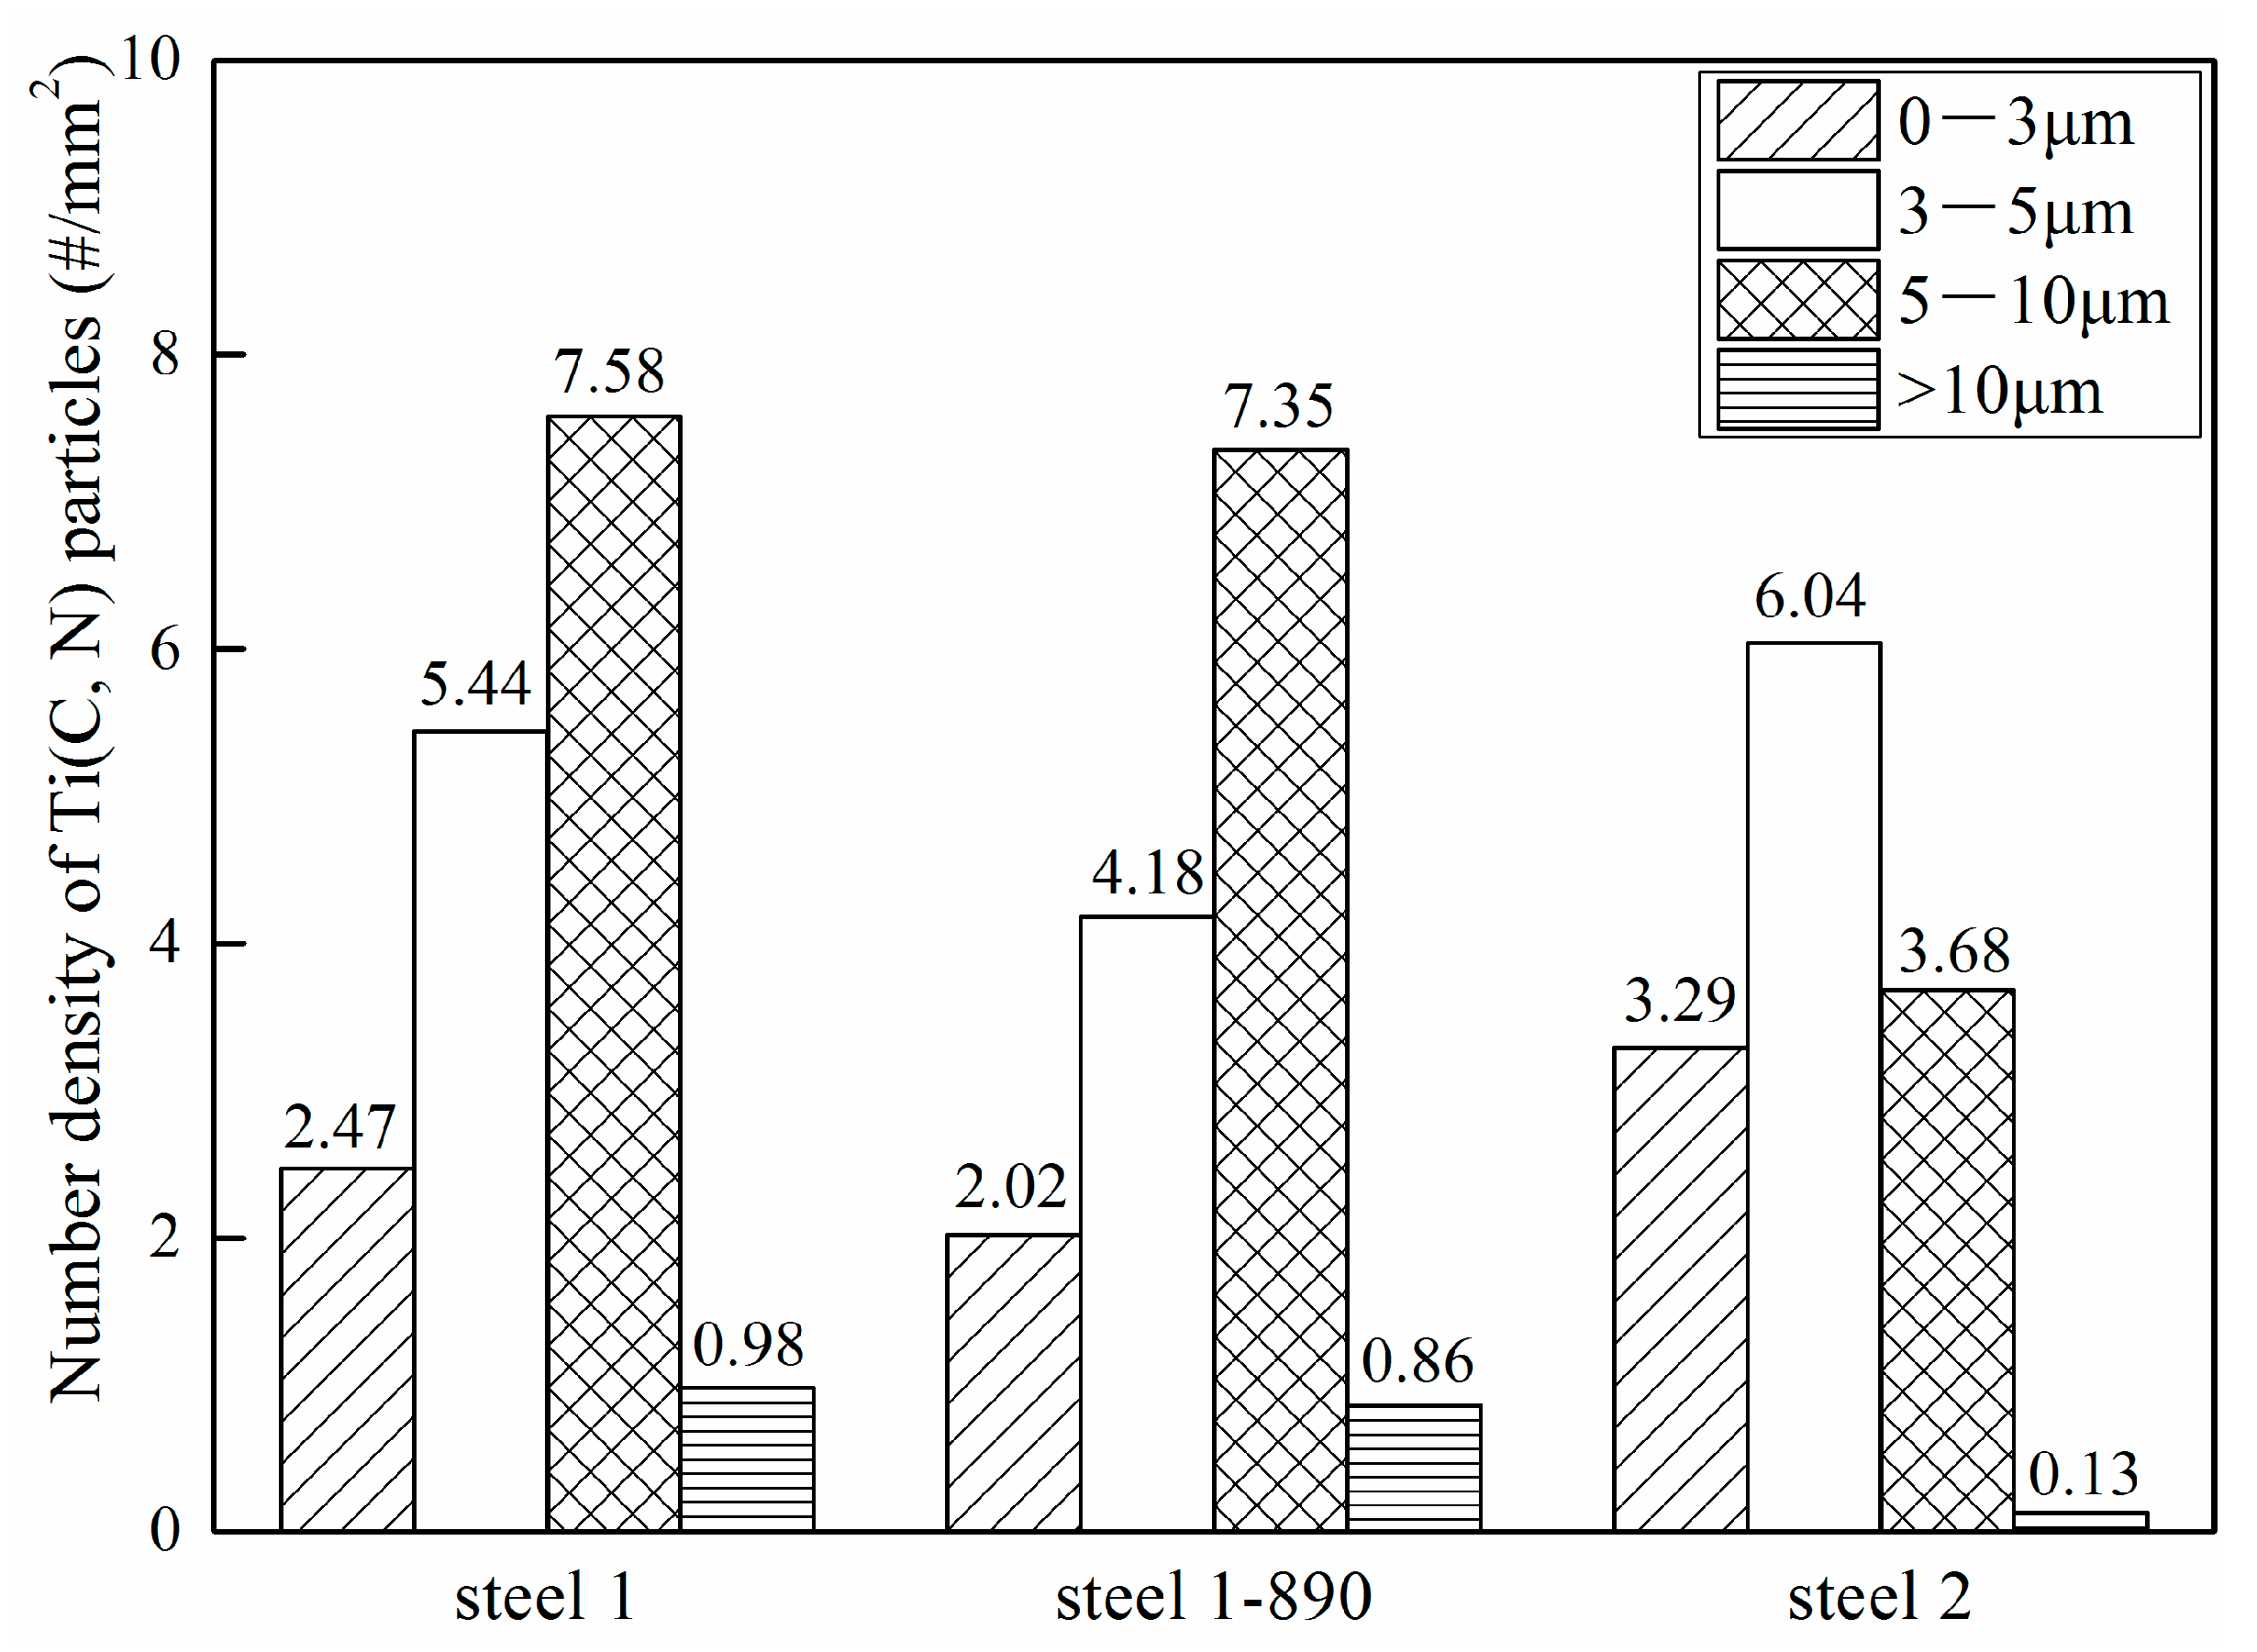
Figure 12 shows the change of Ti(C, N) particle size before and after normalizing treatment. The percentages of small size (1–3 μm and 3–5 μm) Ti(C, N) particles in steel 1-890 are all basically the same. The heat treatment had little influence on the number density of large size (>5 μm) coarse Ti(C, N) particles. In addition, the number density of coarse Ti(C, N) particles in steel 2 was only 13.14 mm−2, and the size was smaller than steel 1. It is indicated that the high Ti/N ratio would promote the precipitation of Ti(C, N) particle during solidification, resulting in the poor impact toughness of B-microalloyed steel.
4. Discussion
4.1. Crack Initiation from Ti(C, N) Particle and Crack Propagation
According to previous research works [13,18,27], the mechanism by which a coarse Ti(C, N) particle causes a cleavage fracture can be described in four stages: stage 1, the microcrack initiates in the coarse Ti(C, N) inclusions or at the interface between the inclusions and matrix; stage 2, the microcrack propagates across the inclusion/matrix interface; stage 3, the crack propagates into the matrix within a grain; stage 4, the crack propagates through the matrix/matrix grain boundaries.
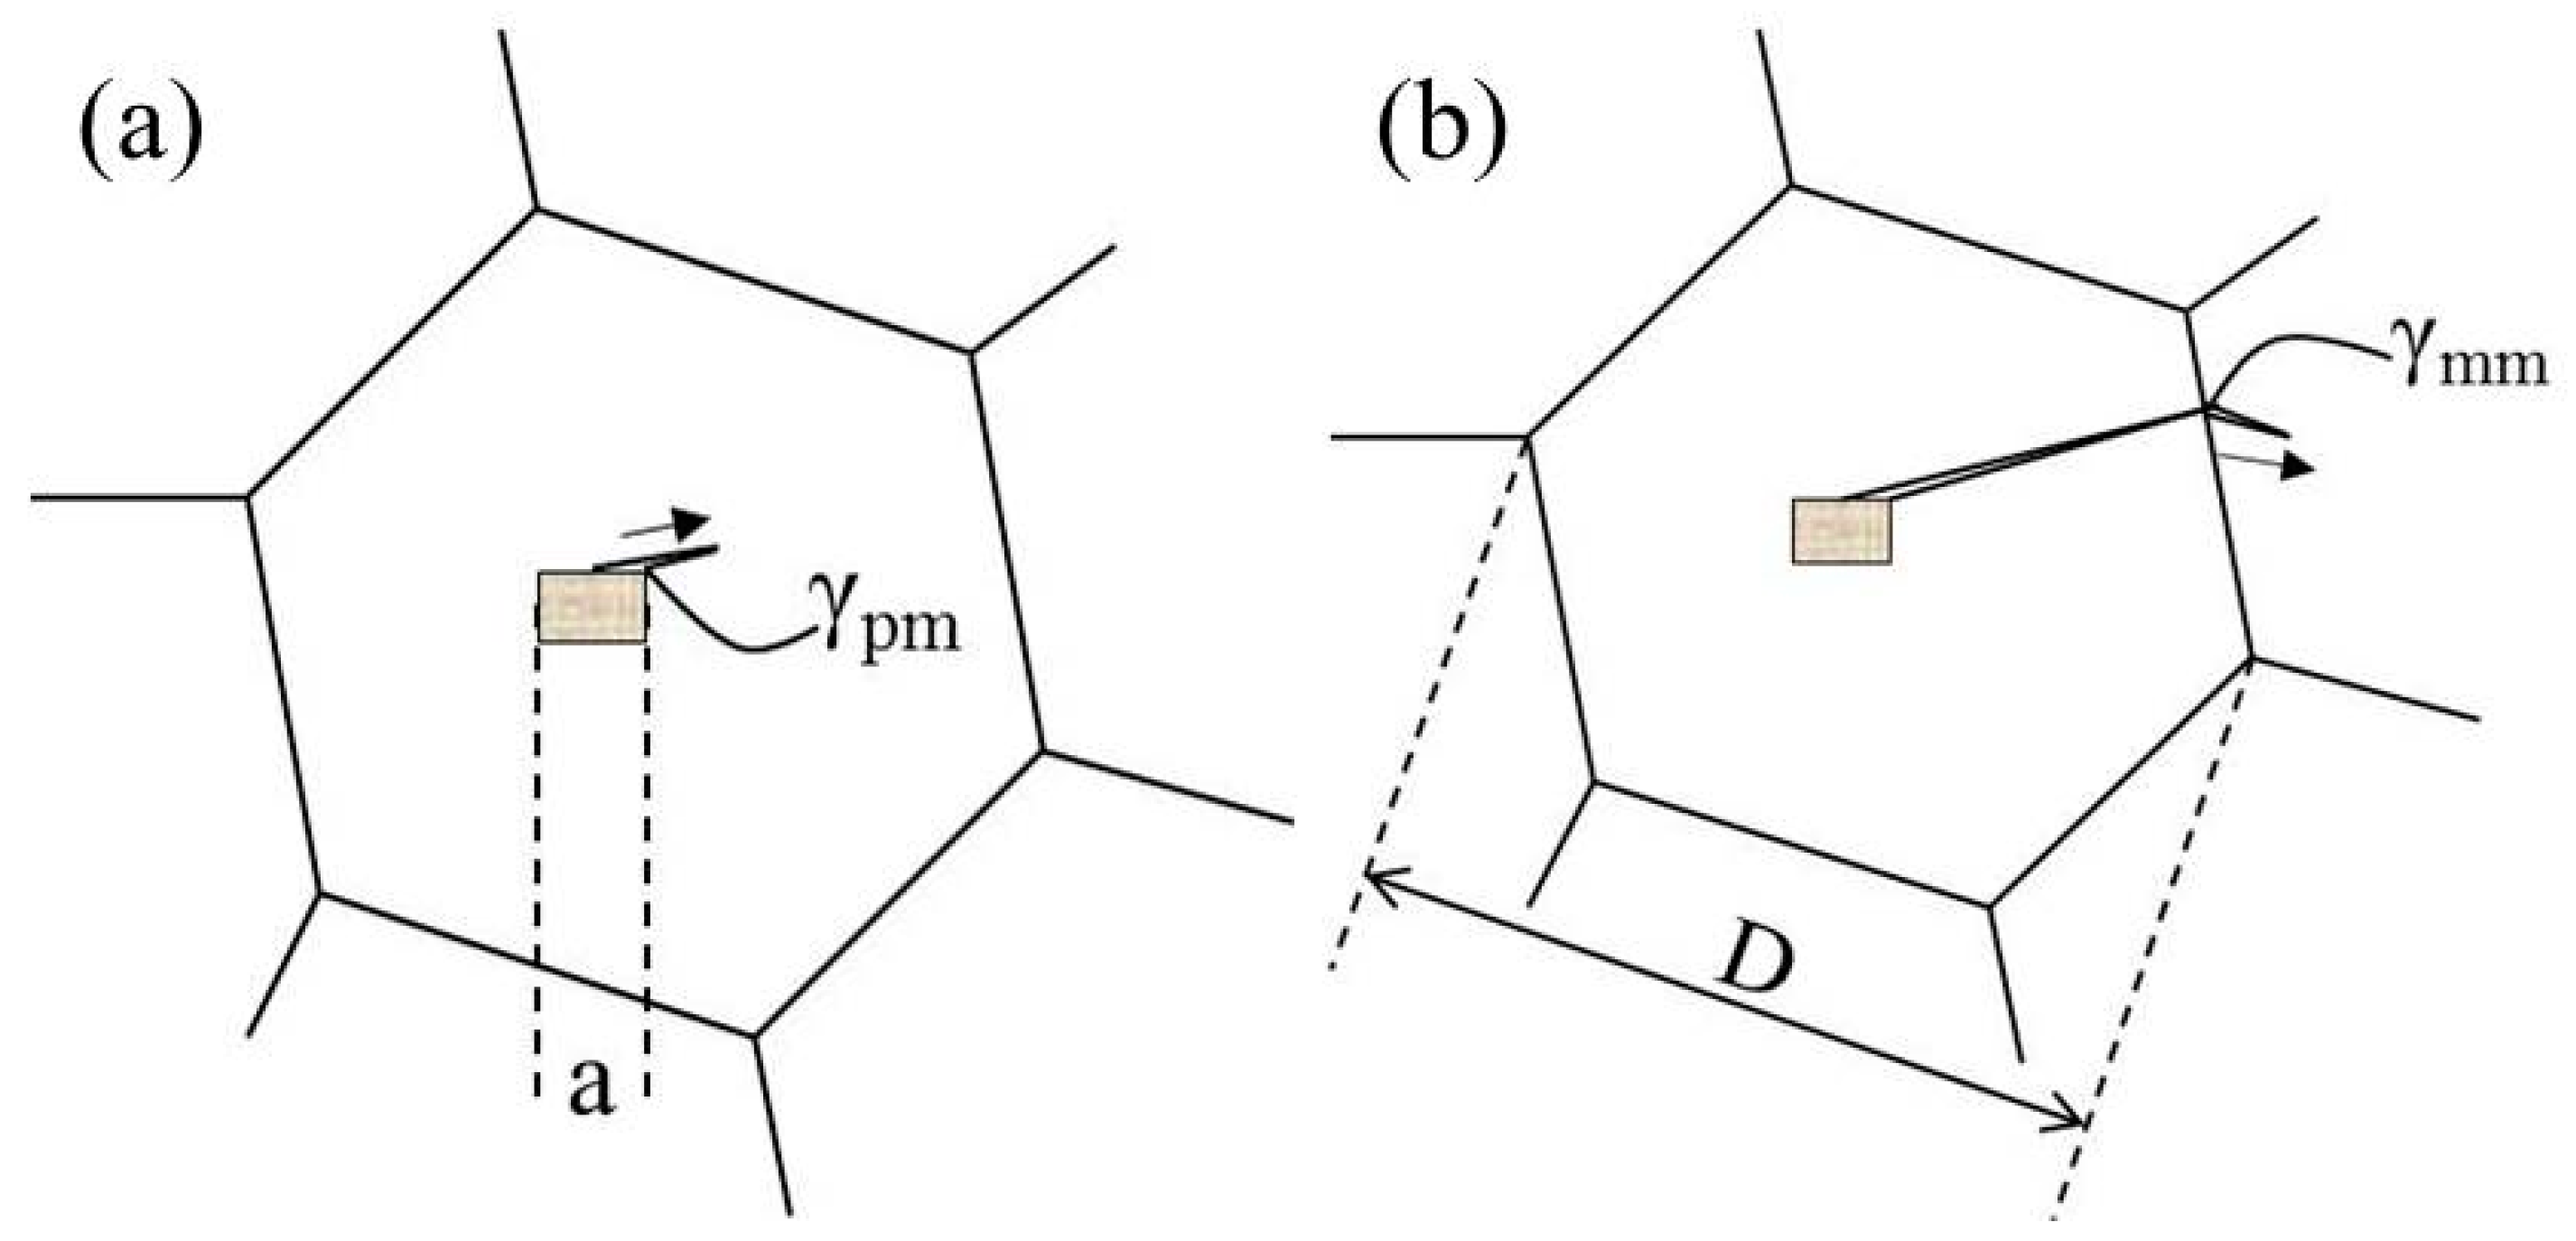
In this work, the SEM examination of the fracture surface revealed that some coarse Ti(C, N) particles were acting as the fracture initiation sites. Ti(C, N) particles can easily act as cleavage crack initiators in steels during impact testing because they are brittle and present in statistically sufficient numbers. Since the crack has appeared in Ti(C, N) particles or at the interface between the particle and the matrix, the propagation of Ti(C, N) particles is dominated during the fracture failure. Whether the microcrack propagates into the matrix or not mainly depends on the interstress level, as shown in Figure 13, including the particle–matrix interface strength and the matrix–matrix interface strength, that can be calculated with the following equations [28]:
where ν is Poisson ratio (0.3 for steels), E is Young’s modulus, generally taken as 210 GPa for steels, γpm and γmm are the particle–matrix interface energy and matrix–matrix interface energy, a is the size of inclusion, and D is the grain size. Once the loading stress exceeds the particle–matrix interface strength σpm, the crack will propagate into the matrix immediately, which means cleavage fracture occurs.
The γmm is dependent on the temperature, which is lower than 50 J/mm2 at −196 °C and more than 200 J/mm2 at room temperature [29,30]. At the same time, the particle–matrix interface energy (γpm) between Ti(C, N) and pearlite is slightly larger than Ti(C, N)-ferrite [31]. The inclusion dimension (a) and grain size (D) of steel 1 are larger than steel 2. Therefore, the σpm and σmm calculated from Equations (1) and (2) for steel 2 are larger than steel 1, which is one of the reasons for the lower impact toughness of steel 1 than steel 2.
4.2. Formation Mechanism of Ti(C, N) Inclusion during Solidification
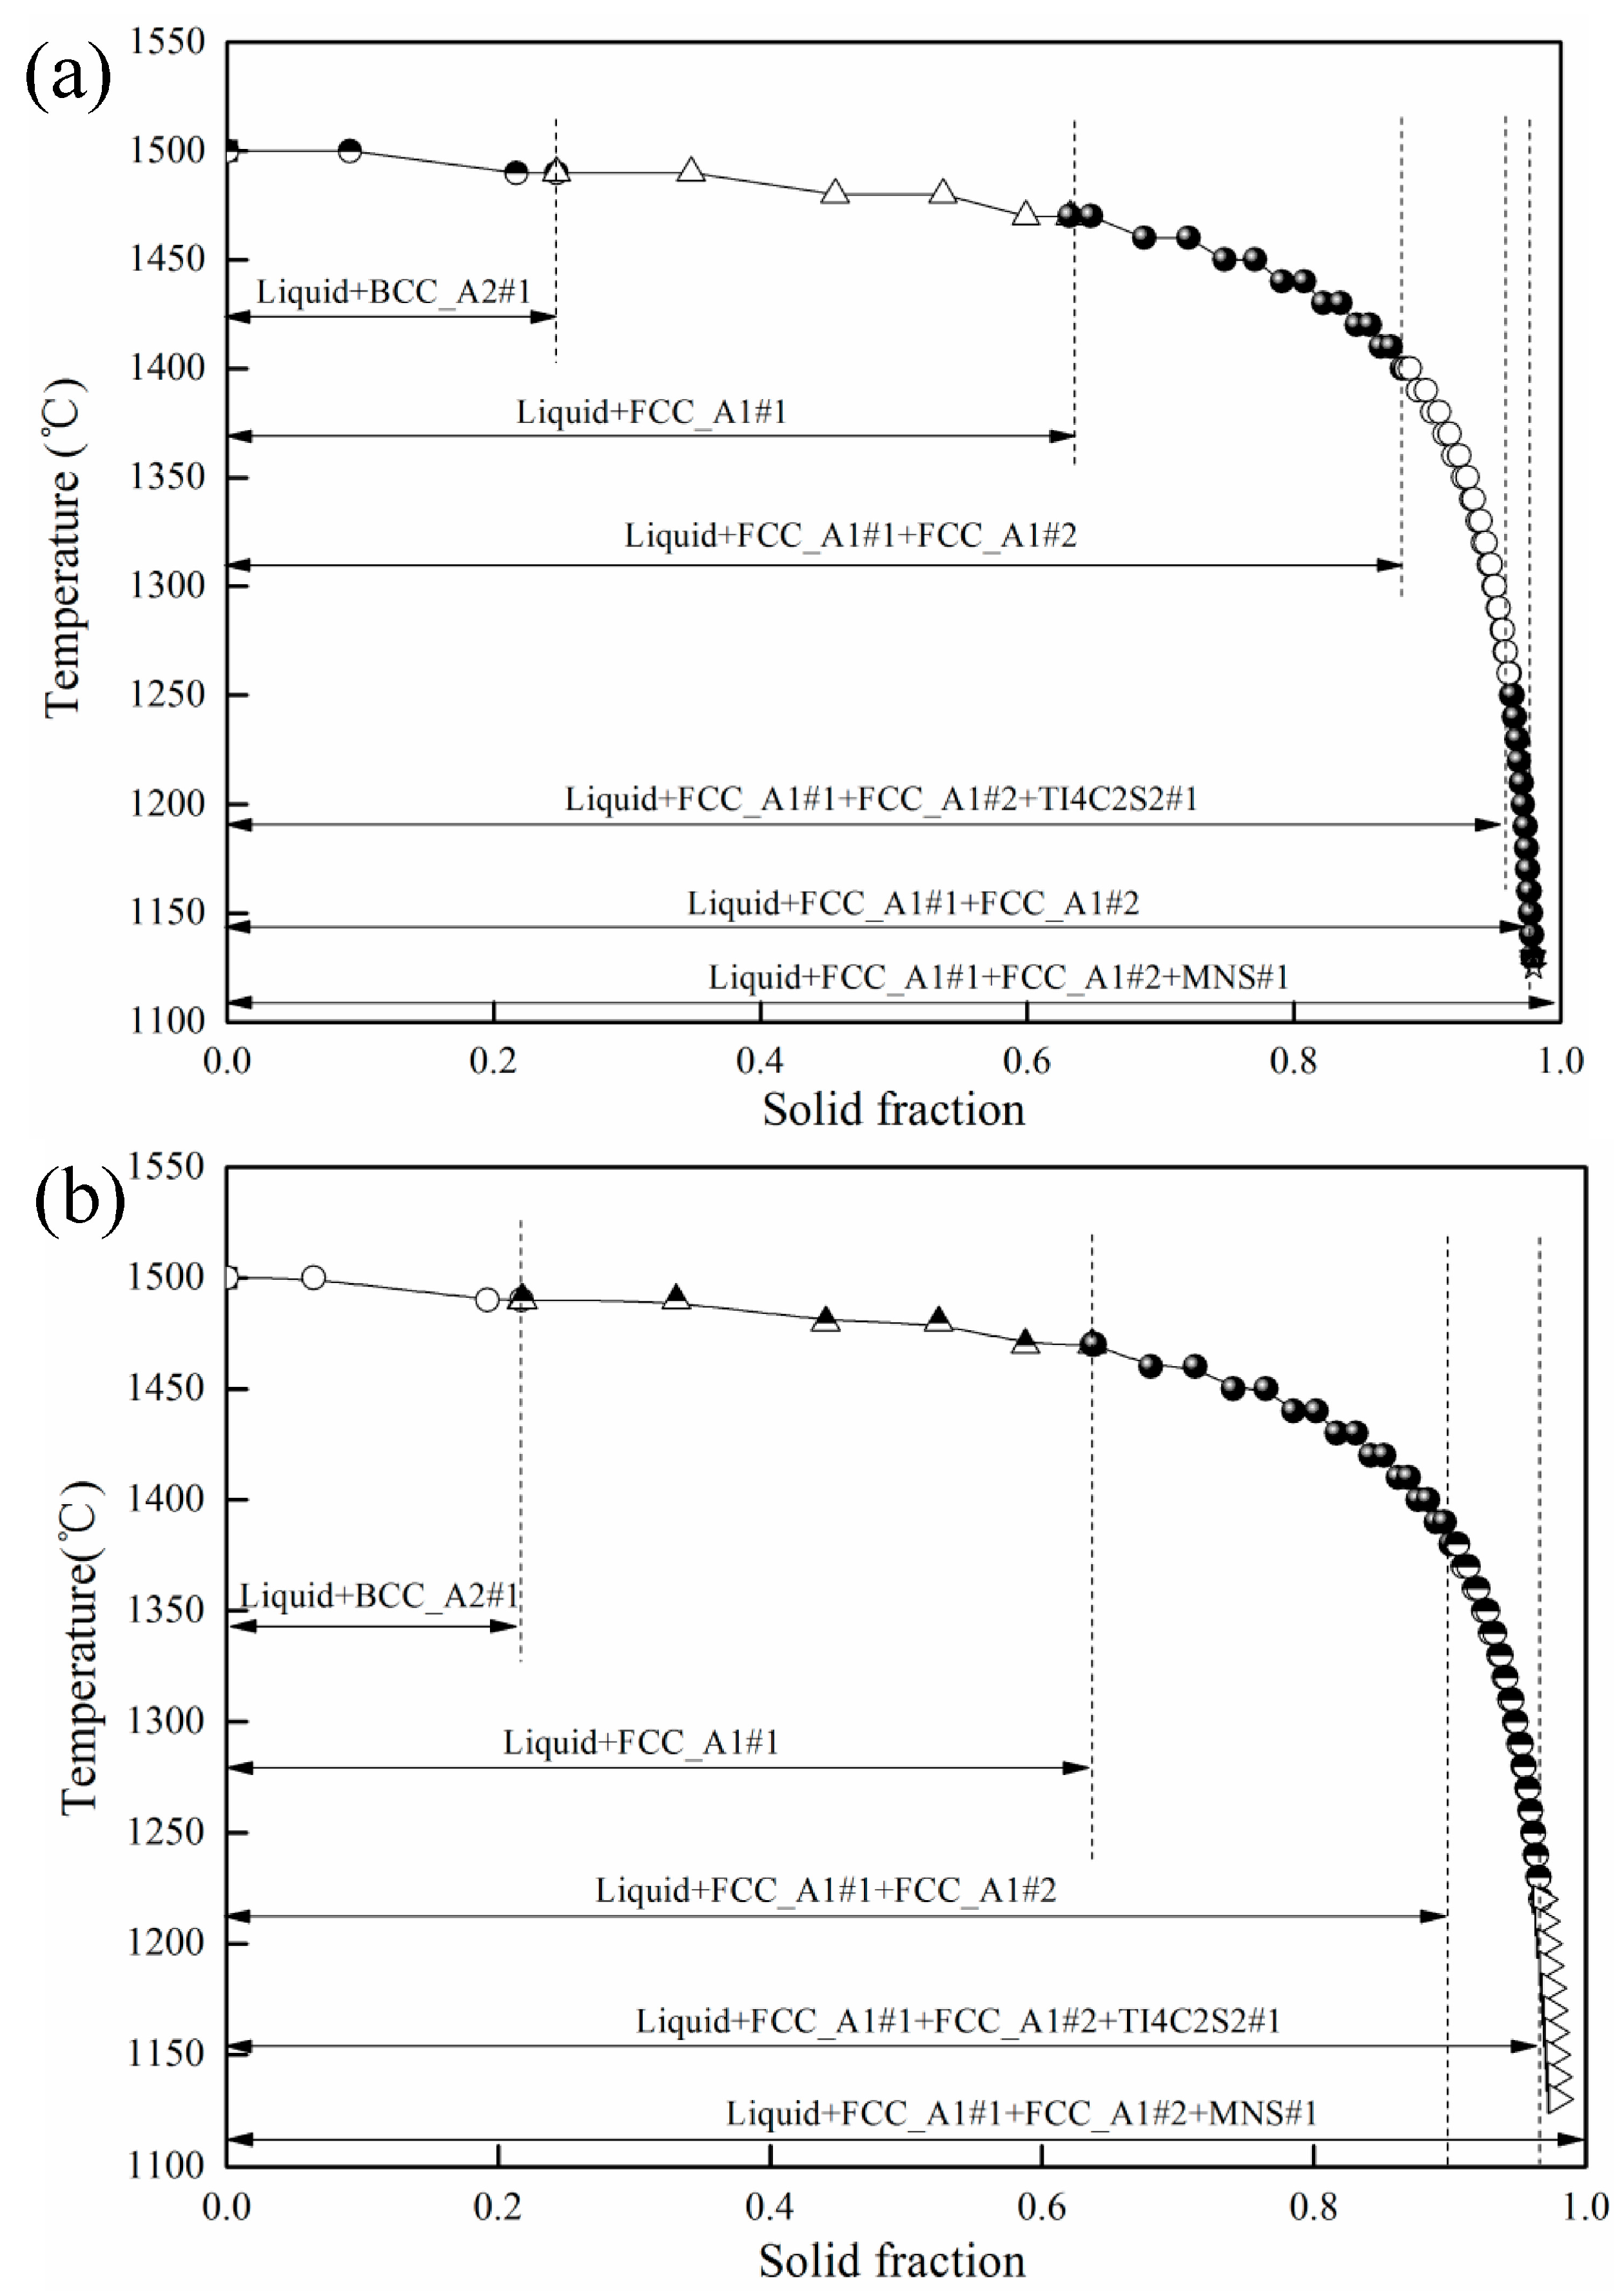
The Scheil–Gulliver solidification model in Thermo-Calc software was used to calculate the formation mechanism of coarse Ti(C, N) particle during solidification. The model assumes that the alloying elements are perfectly uniform in liquid steel, and that diffusion has not occurred in solid steel and local equilibrium at solid–liquid interface is maintained during solidification. During the calculation process, the composition in Table 1 was used as the initial composition, and the content of Mg, Al, O were ignored because of the ultralow content before solidification begins. The calculated results are shown in Figure 14. The corresponding solid weight fraction of precipitated phases is shown in Table 5. The FCC_A1#2 phase is Ti(C, N), and the MNS#1 phase is MnS. The solid fraction of Ti(C, N) is almost the same for both steel 1 and steel 2, and the solid fraction of MnS in steel 1 is lower than steel 2, due to the higher S content in steel 1.
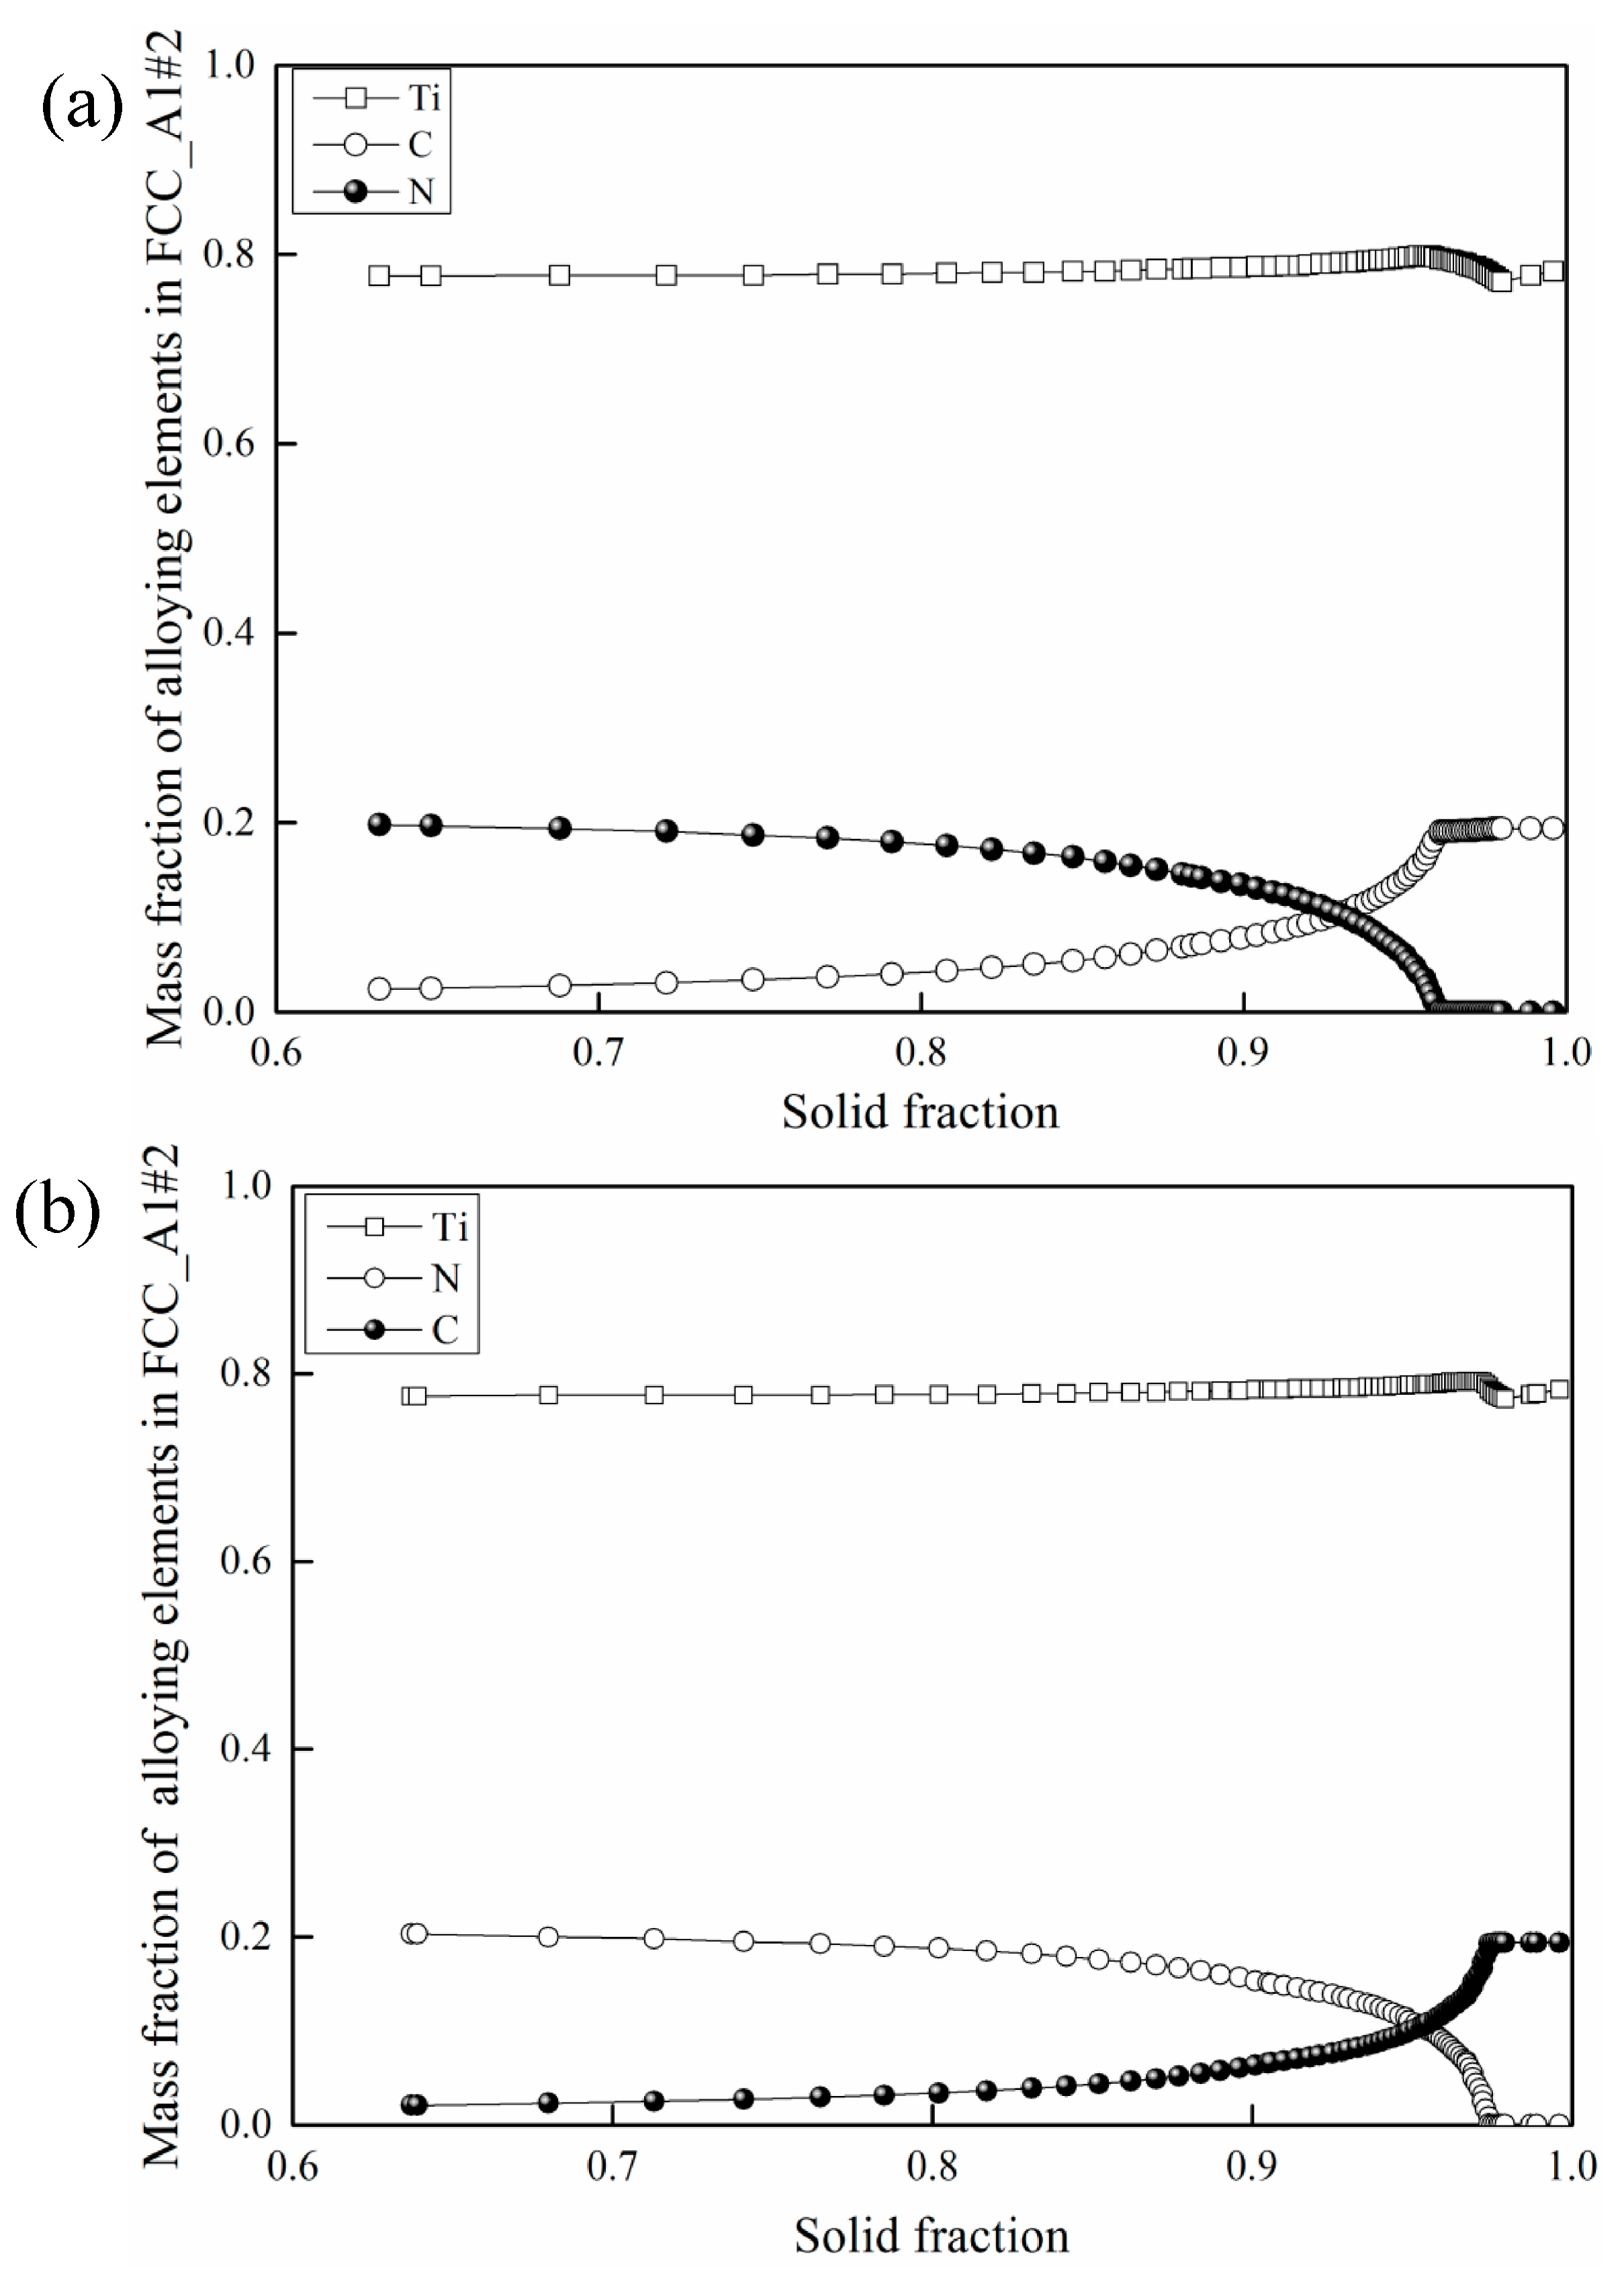
Figure 15 shows the variation of main compositions in FCC_A1#2 phase for steel 1 and 2 during solidification. The N-rich Ti(C, N) phase precipitates first when the solid fraction is 0.63 for both steel 1 and steel 2, and then the C content in FCC_A1#2 phase increases gradually, and the N content decreases little by little. The C-rich Ti(C, N) phase precipitates at the end of the solidification. However, the precipitation solid fraction of C-rich Ti(C, N) phase in steel 1 is smaller than steel 2. Therefore, the growth rate of C-rich Ti(C, N) phase in steel 1 would be much larger than steel 2, resulting in the larger size of Ti(C, N) particle in steel 1 than steel 2, and the Ti(C, N) phase in steel 1 is richer in C content than steel 2, which agree well with the results in Figure 10.
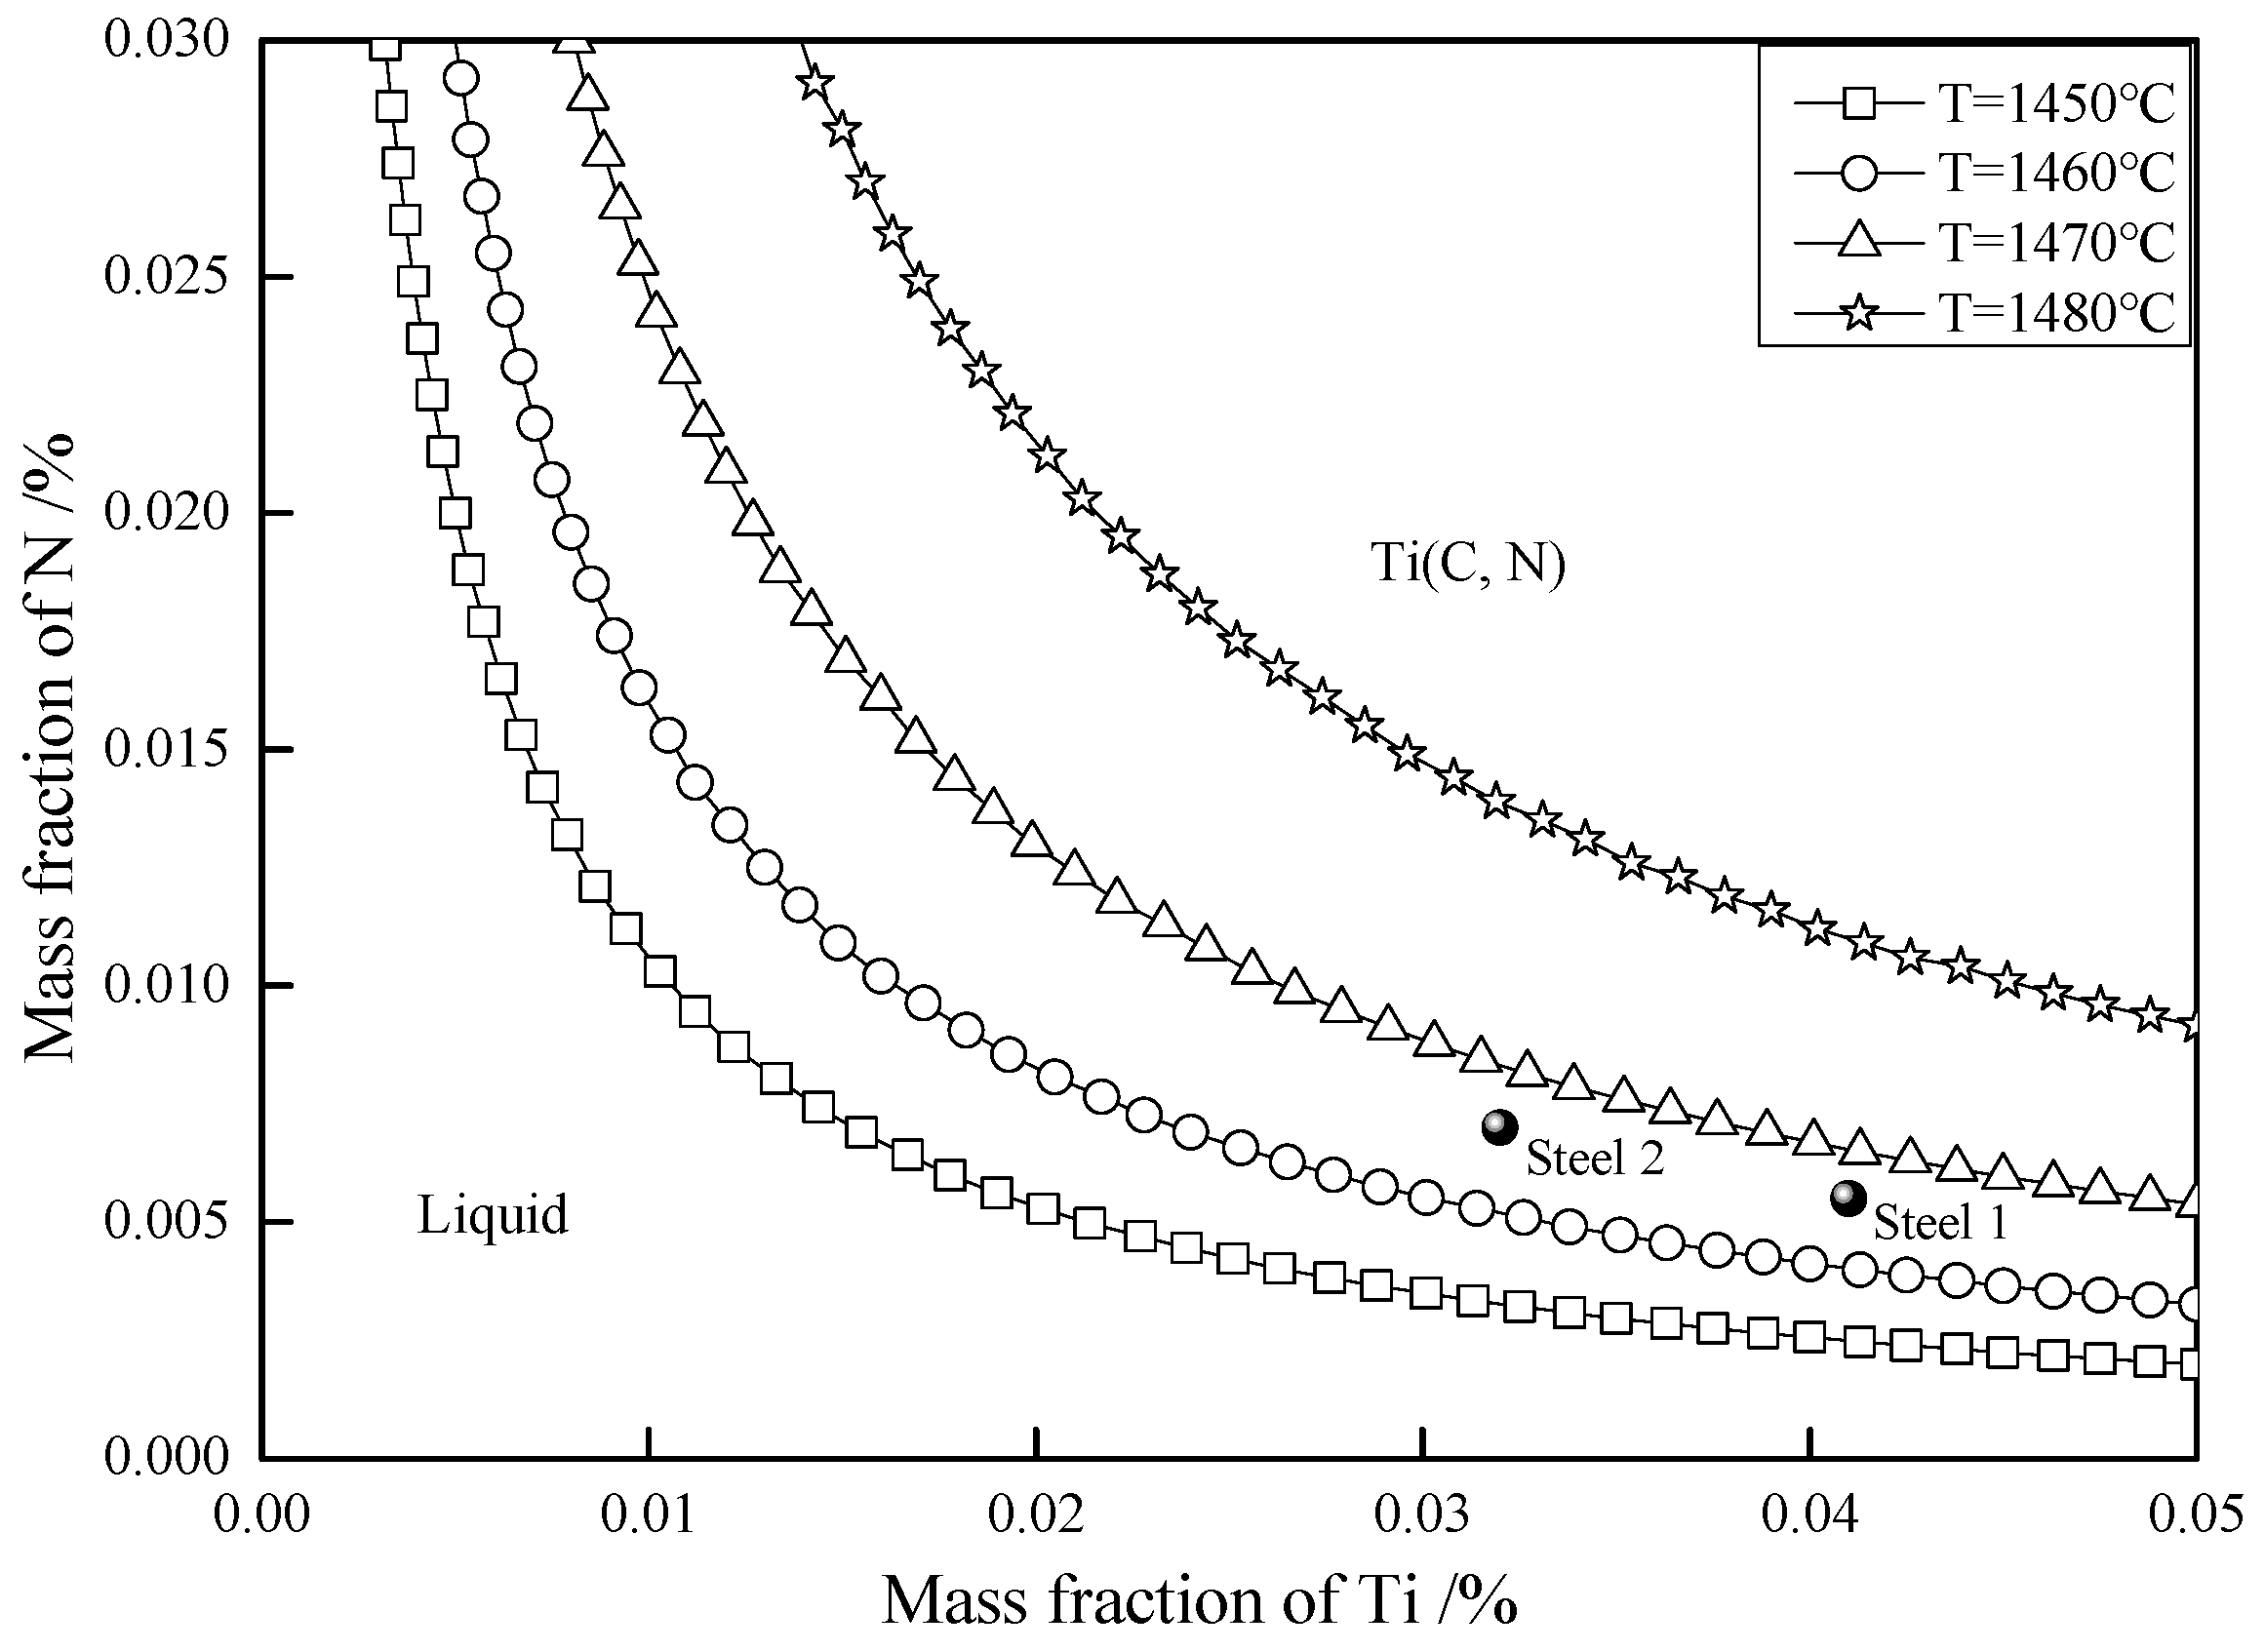
The phase equilibrium between molten steel and Ti(C, N) inclusion was calculated by Factsage 7.1 software, as shown in Figure 16. The coarse Ti(C, N) could not precipitate until the [Ti]·[N] was larger than the calculated line under a certain temperature. The temperature also has great influence on the equilibrium precipitation line of Ti(C, N) particle. The coarse Ti(C, N) inclusion in both steel 1 and steel 2 will precipitates as the solidification temperature reduces to 1460 °C. Therefore, it is key to control the Ti and N content in B-microalloyed steel to inhibit the formation of coarse Ti(C, N) particle.
5. Conclusions
In the current study, the effect of the nature of coarse Ti(C, N) particles on the impact toughness of B-microalloyed medium-carbon steel was studied. The location of coarse Ti(C, N) has great influence on the impact toughness, which is different from previous works. The final conclusions from this work are as follows:
- (1)
- Smaller grain size and larger ferrite area percentage contribute to the higher impact toughness of B-microalloyed steel. Coarse Ti(C, N) particle acts as the cleavage crack initiators, resulting in the poor impact toughness of steel 1. After the normalizing treatment, the ferrite area percentage increases significantly and the impact toughness improves remarkably.
- (2)
- Coarse Ti(C, N) particles have a tendency to be located in pearlite with higher Ti/N ratio. The location of coarse Ti(C, N) will change from ferrite to pearlite during normalizing treatment. The more coarse Ti(C, N) particles located in ferrite, the worse the impact toughness.
- (3)
- Coarse Ti(C, N) particles precipitate during the solidification of molten steel. Oxides (MgAl2O4) can act as the nucleation core of coarse Ti(C, N) particle, promoting the formation of Ti(C, N) particle. The Ti/N ratio also has great influence on the composition of coarse Ti(C, N) particle. Higher Ti/N ratio promotes the formation of C-rich Ti(C, N), and the Ti content and N content should be well controlled to avoid the formation of coarse Ti(C, N) particles to further improve the impact toughness.
Author Contributions
Writing—review and editing, Y.H.; Writing—original draft preparation, Y.H.; Conceptualization, G.-G.C.; Formal analysis, S.-J.L.; Resources, Y.X.; Data curation, W.-X.D.
Funding
This work was supported by the National Natural Science Foundation of China (No. 51874034, No. 51674024).
Acknowledgments
The authors acknowledge the help of Zenith Steel Co., Ltd.
Conflicts of Interest
The authors declare no conflict of interest.
References
- Karmakar, A.; Kundu, S.; Roy, S.; Neogy, S.; Srivastava, D.; Chakrabarti, D. Effect of microalloying elements on Austenite grain growth in Nb–Ti and Nb–V steels. Mater. Sci. Technol. A 2014, 30, 653–664. [Google Scholar] [CrossRef]
- Reyes-Calderón, F.; Mejía, I.; Boulaajaj, A.; Cabrera, J.M. Effect of microalloying elements (Nb, V and Ti) on the hot flow behavior of high-Mn austenitic twinning induced plasticity (TWIP) steel. Mater. Sci. Eng. A 2013, 560, 552–560. [Google Scholar] [CrossRef]
- Kim, Y.W.; Kim, J.H.; Hong, S.G.; Lee, C.S. Effects of rolling temperature on the microstructure and mechanical properties of Ti–Mo microalloyed hot-rolled high strength steel. Mater. Sci. Eng. A 2014, 605, 244–252. [Google Scholar] [CrossRef]
- Zhang, L.P.; Davis, C.L.; Strangwood, M. Effect of TiN particles and microstructure on fracture toughness in simulated heat-affected zones of a structural steel. Metall. Mater. Trans. A 1999, 30, 2089–2096. [Google Scholar] [CrossRef]
- Wang, Y.N.; Bao, Y.P.; Wang, M.; Zhang, L.C. Precipitation behavior of BN type inclusions in 42CrMo steel. Int. J. Miner. Metall. Mater. 2013, 20, 28–36. [Google Scholar] [CrossRef]
- Bai, D.Q.; Yue, S.; Jonas, J.J.; Maccagno, T.M. Continuous cooling transformation temperatures determined by compression tests in low carbon bainitic grades. Metall. Mater. Trans. A 1998, 29, 989–1001. [Google Scholar] [CrossRef]
- Tomita, Y.; Saito, N.; Tsuzuki, T.; Tokunaga, Y.; Okamoto, K. Improvement in HAZ toughness of steel by TiN-MnS addition. ISIJ Int. 1994, 34, 829–835. [Google Scholar] [CrossRef]
- Ohno, Y.; Okamura, Y.; Matsuda, S.; Yamamoto, K.; Mukai, T. Characteristics of HAZ microstructure in Ti-B treated steel for large heat input welding. Tetsu-to-Hagané 1987, 73, 1010–1017. [Google Scholar] [CrossRef]
- Kanazawa, S.; Nakashima, A.; Okamoto, K.; Kanaya, K. Improved toughness of weld fussion zone by fine TiN particles and development of a steel for large heat input welding. Tetsu-to-Hagané 1975, 61, 2589–2603. [Google Scholar] [CrossRef]
- Mukae, S.; Nishio, K.; Katoh, M. Solution of TiN during synthetic weld thermal cycling and heat affected zone toughness in low carbon steels. Trans. Jpn. Weld. Soc. 1987, 18, 148–158. [Google Scholar]
- Balart, M.J.; Davis, C.L.; Strangwood, M. Cleavage initiation in Ti–V–N and V–N microalloyed ferritic–pearlitic forging steels. Mater. Sci. Eng. A 2000, 284, 1–13. [Google Scholar] [CrossRef]
- Yan, W.; Shan, Y.Y.; Yang, K. Effect of TiN inclusions on the impact toughness of low-carbon microalloyed steels. Metall. Mater. Trans. A 2006, 37, 2147–2158. [Google Scholar] [CrossRef]
- Yan, W.; Shan, Y.Y.; Yang, K. Influence of TiN inclusions on the cleavage fracture behavior of low-carbon microalloyed steels. Metall. Mater. Trans. A 2007, 38, 1211–1222. [Google Scholar] [CrossRef]
- Shen, Y.; Hansen, S.S. Effect of the Ti/N ratio on the hardenability and mechanical properties of a quenched-and-tempered C-Mn-B steel. Metall. Mater. Trans. A 1997, 28, 2027–2035. [Google Scholar] [CrossRef]
- Rak, I.; Gliha, V.; Koçak, M. Weldability and toughness assessment of Ti-microalloyed offshore steel. Metall. Mater. Trans. A 1997, 28, 199–206. [Google Scholar] [CrossRef]
- Chen, M. Kinetic model of TiN particle dissolution and coarsening during welding thermal cycle. J. Mater. Sci. Technol. 2002, 18, 439–442. [Google Scholar]
- Vega, M.I.; Medina, S.F.; Quispe, A.; Gómez, M.; Gómez, P.P. Recrystallisation driving forces against pinning forces in hot rolling of Ti-microalloyed steels. Mater. Sci. Eng. A 2006, 423, 253–261. [Google Scholar] [CrossRef]
- Du, J.; Strangwood, M.; Davis, C.L. Effect of TiN particles and grain size on the charpy impact transition temperature in steels. J. Mater. Sci. Technol. 2012, 28, 878–888. [Google Scholar] [CrossRef]
- Zhang, L.P.; Davis, C.L.; Strangwood, M. Dependency of fracture toughness on the inhomogeneity of coarse TiN particle distribution in a low alloy steel. Metall. Mater. Trans. A 2001, 32, 1147–1155. [Google Scholar] [CrossRef]
- Medina, S.F.; Chapa, M.; Valles, P.; Quispe, A.; Mi, V. Influence of Ti and N contents on austenite grain control and precipitate size in structural steels. ISIJ Int. 1999, 39, 930–936. [Google Scholar] [CrossRef]
- Zhu, Z.X.; Kuzmikova, L.; Marimuthu, M.; Li, H.J.; Barbaro, F. Role of Ti and N in line pipe steel welds. Sci. Technol. Weld. Join. 2013, 18, 1–10. [Google Scholar] [CrossRef]
- Saeidi, N.; Ekrami, A. Comparison of mechanical properties of martensite/ferrite and bainite/ferrite dual phase 4340 steels. Mater. Sci. Eng. A 2009, 523, 125–129. [Google Scholar] [CrossRef]
- Badji, R.; Bouabdallah, M.; Bacroix, B.; Kahloun, C.; Belkessa, B.; Maza, H. Phase transformation and mechanical behavior in annealed 2205 duplex stainless steel welds. Mater. Charact. 2008, 59, 447–453. [Google Scholar] [CrossRef]
- Schäfer, L. Influence of delta ferrite and dendritic carbides on the impact and tensile properties of a martensitic chromium steel. J. Nucl. Mater. 1998, 258, 1336–1339. [Google Scholar] [CrossRef]
- Fairchild, D.P.; Howden, D.G.; Clark, W. The mechanism of brittle fracture in a microalloyed steel: Part II. Mechanistic modeling. Metall. Mater. Trans. A 2000, 31, 653–667. [Google Scholar] [CrossRef]
- Fairchild, D.P.; Howden, D.G.; Clark, W. The mechanism of brittle fracture in a microalloyed steel: Part I. Inclusion-induced cleavage. Metall. Mater. Trans. A 2000, 31, 641–652. [Google Scholar] [CrossRef]
- Echeverrí, A.; Rodriguez-Ibabe, J.M. The role of grain size in brittle particle induced fracture of steels. Mater. Sci. Eng. A 2003, 346, 149–158. [Google Scholar] [CrossRef]
- McMahon, C.J., Jr.; Cohen, M. Initiation of cleavage in polycrystalline iron. Acta Metall. 1965, 13, 591–604. [Google Scholar] [CrossRef]
- San Martin, J.I.; Rodriguez-Ibabe, J.M. Determination of energetic parameters controlling cleavage fracture in a Ti-V microalloyed ferrite-pearlite steel. Scr. Mater. 1999, 40, 459–464. [Google Scholar] [CrossRef]
- Linaza, M.A.; Rodriguez-Ibabe, J.M.; Urcola, J.J. Determination of the energetic parameters controlling cleavage fracture initiation in steels. Fatigue Fract. Eng. Mater. Struct. 1997, 20, 619–632. [Google Scholar] [CrossRef]
- Alexander, D.J.; Bernstein, I.M. Cleavage fracture in pearlitic eutectoid steel. Metall. Mater. Trans. A 1989, 20, 2321–2335. [Google Scholar] [CrossRef]
Figure 1.
Fracture investigations of steel 1 (a) and steel 1-890 (b); higher magnification image of steel 1 (c) and steel 1-890 (d).
Figure 1.
Fracture investigations of steel 1 (a) and steel 1-890 (b); higher magnification image of steel 1 (c) and steel 1-890 (d).

Figure 2.
(a–d) SEM images of coarse Ti(C, N) particles found at initiation sites for brittle fractured sample steel 1; (e–h) higher magnification images of the red ellipse and the composition of Ti(C, N) particles in (a–d), respectively.
Figure 2.
(a–d) SEM images of coarse Ti(C, N) particles found at initiation sites for brittle fractured sample steel 1; (e–h) higher magnification images of the red ellipse and the composition of Ti(C, N) particles in (a–d), respectively.

Figure 3.
Element mapping of MgAl2O4 + Ti(C, N) inclusion found at initiation sites in steel 1.

Figure 4.
SEM images at initiation sites for brittle fractured sample steel 1-890; (a) nothing; (b) coarse Ti(C, N) particle.
Figure 4.
SEM images at initiation sites for brittle fractured sample steel 1-890; (a) nothing; (b) coarse Ti(C, N) particle.

Figure 5.
Metallographic structures of steel 1 (a), steel 2 (b), and steel 1-890 (c).

Figure 6.
Typical morphologies of inclusions in steel 1 and steel 2. (a,c) Ti(C, N); (b,d) MnS.

Figure 7.
Coarse Ti(C, N) particles located in ferrite (a,b) and pearlite (c,d) in steel 1.

Figure 8.
Coarse Ti(C, N) particles located in ferrite (a) and pearlite (b–d) in steel 1-890.

Figure 9.
Coarse Ti(C, N) particles located in ferrite (a) and pearlite (b–d) in steel 2.

Figure 10.
The composition of Ti(C, N) particles in specimens.

Figure 11.
Number density of Ti(C, N) particles in specimens.

Figure 12.
The size of Ti(C, N) particles in specimens.

Figure 13.
Schematic of the propagation stages of a crack in brittle fracture. (a) propagation across the particle–matrix barrier; (b) propagation across the matrix–matrix barrier.
Figure 13.
Schematic of the propagation stages of a crack in brittle fracture. (a) propagation across the particle–matrix barrier; (b) propagation across the matrix–matrix barrier.

Figure 14.
Variation of solid fraction with temperature for steel 1 (a) and steel 2 (b) during solidification.
Figure 14.
Variation of solid fraction with temperature for steel 1 (a) and steel 2 (b) during solidification.

Figure 15.
Mass fraction of alloying elements in FCC_A1#2 phase. (a) steel 1; (b) steel 2.

Figure 16.
Phase equilibrium between molten steel and Ti(C, N) inclusion.


Table 1.
Chemical compositions of experimental specimens (wt.%).
| Materials | C | Si | Mn | Cr | Ni | Al | B | S | Mg | O | Ti | N | Ti/N |
|---|---|---|---|---|---|---|---|---|---|---|---|---|---|
| steel 1 | 0.36 | 0.24 | 1.34 | 0.36 | 0.012 | 0.027 | 0.0012 | 0.0018 | 0.0005 | 0.0008 | 0.041 | 0.0055 | 7.4 |
| steel 2 | 0.37 | 0.24 | 1.35 | 0.34 | 0.0092 | 0.023 | 0.0017 | 0.0028 | 0.0005 | 0.0009 | 0.032 | 0.007 | 4.6 |
Table 2.
Mechanical properties of samples.
| Samples | Yield Strength (MPa) | Tensile Strength (MPa) | Reduction of Area (%) | CUN Energy (J) |
|---|---|---|---|---|
| Steel 1 | 588 (±3) | 808 (±3) | 44 (−1,+2) | 18 (±2) |
| Steel 2 | 443 (±3) | 771 (±2) | 52 (±2) | 60 (±3) |
| Steel 1-890 | 426 (±5) | 750 (±4) | 66 (±3) | 54 (±4) |
Table 3.
Area percentage of ferrite and grain size in hot-rolled materials.
| Materials | Grain Size, μm | Area Percentage of Ferrite, % | Standard Deviation |
|---|---|---|---|
| Steel 1 | 39.7 | 7.1 | 1.24 |
| Steel 1-890 | 28.1 | 12.9 | 0.26 |
| Steel 2 | 25.2 | 18.8 | 1.48 |
Table 4.
Location of Ti(C, N) particles in samples.
| Materials | Location of Ti(C, N) Particles | |
|---|---|---|
| Ferrite | Pearlite | |
| Steel 1 | 58% | 42% |
| Steel 1-890 | 20% | 80% |
| Steel 2 | 24% | 76% |
Table 5.
Solid fraction of precipitated phases.
| Samples | FCC_A1#2 | TI4C2S2#1 | MNS#1 |
|---|---|---|---|
| Steel 1 | 0.632 | 0.884 | 0.979 |
| Steel 2 | 0.637 | 0.905 | 0.967 |
© 2018 by the authors. Licensee MDPI, Basel, Switzerland. This article is an open access article distributed under the terms and conditions of the Creative Commons Attribution (CC BY) license (http://creativecommons.org/licenses/by/4.0/).
Share and Cite
MDPI and ACS Style
Huang, Y.; Cheng, G.-G.; Li, S.-J.; Dai, W.-X.; Xie, Y. Effect of Ti(C, N) Particle on the Impact Toughness of B-Microalloyed Steel. Metals 2018, 8, 868. https://doi.org/10.3390/met8110868
AMA Style
Huang Y, Cheng G-G, Li S-J, Dai W-X, Xie Y. Effect of Ti(C, N) Particle on the Impact Toughness of B-Microalloyed Steel. Metals. 2018; 8(11):868. https://doi.org/10.3390/met8110868
Chicago/Turabian StyleHuang, Yu, Guo-Guang Cheng, Shi-Jian Li, Wei-Xing Dai, and You Xie. 2018. "Effect of Ti(C, N) Particle on the Impact Toughness of B-Microalloyed Steel" Metals 8, no. 11: 868. https://doi.org/10.3390/met8110868
Note that from the first issue of 2016, this journal uses article numbers instead of page numbers. See further details here.