Functionally Graded SS 316L to Ni-Based Structures Produced by 3D Plasma Metal Deposition


1
Department of Mechanical Engineering, EIA University, 055428 Envigado, Colombia
2
Chair of Welding Engineering, Chemnitz University of Technology, Reichenhainer Straße 70, 09126 Chemnitz, Germany
*
Author to whom correspondence should be addressed.
Metals 2019, 9(6), 620; https://doi.org/10.3390/met9060620
Submission received: 29 April 2019
/
Revised: 15 May 2019
/
Accepted: 23 May 2019
/
Published: 28 May 2019
(This article belongs to the Special Issue Arc-based Additive Manufacturing)
Abstract
:In this investigation, the fabrication of functionally graded structures of SS316L to Ni-based alloys were studied, using the novel technique 3D plasma metal deposition. Two Ni-based alloys were used, a heat resistance alloy Ni80-20 and the solid-solution strengthened Ni625. Different configurations were analyzed, for the Ni80-20 a hard transition and a smooth transition with a region of 50% SS316L/50% Ni80-20. Regarding the structures with Ni625, a smooth transition configuration and variations in the heat input were applied. The effect of the process parameters on the geometry of the structures and the microstructures was studied. Microstructure examinations were carried out using optical and scanning electron microscopy. In addition, microhardness analysis were made on the interfaces. In general, the smooth transition of both systems showed a gradual change in the properties. The microstructural results for the SS316L (both systems) showed an austenite matrix with δ-phase. For the mixed zone and the Ni80-20 an austenite (γ) matrix with some M7C3 precipitates and laves phase were recognized. The as-built Ni625 microstructure was composed of an austenite (γ) matrix with secondary phases laves and δ-Ni3Nb, and precipitates M7C3. The mixed zone exhibited the same phases but with changes in the morphology.
1. Introduction
The layer-by-layer production of components with locally variable properties describes the process of multi-material additive manufacturing (MMAM). The variation of the component density depending on the location is an example of this and can be seen as an analogy to human bone formation [1,2,3]. Further examples are the variation of the grain size [4] and changed materials [5] within the component. The continuous change of the component properties results in advantages such as: improved strength values [6], reduced internal stresses [7,8,9,10,11], and a lower crack propagation potential [12].
3D plasma metal disposition (3DPMD) is a further development of the classical plasma transferred arc process (PTA) with regard to the requirements of additive manufacturing (AM) and belong to the category of directed energy deposition processes [13]. In addition, applications of micro-PTA for the production for MMAM are known [14,15]. In comparison, the higher build rates (up to 10 kg·h−1), the lower demands on powder quality and the possibility to handle up to four different powders in parallel, are to be emphasized. Further information on the process and the materials to be processed can be found elsewhere [16,17,18].
Due to its good weldability, corrosion resistance and adequate high temperature mechanical properties, austenitic stainless steel (ASS) is used in different industries, such as petrochemical, shipbuilding, and nuclear industries. These steels are non-magnetic, stable at room temperature, and cannot be hardened by heat treatment [19,20,21]. ASS is generally manufactured by casting and their components can be joined by different fusion welding processes. In recent years, additive manufacturing has also been used for the fabrication of ASS components. Different AM processes have been employed such as laser process [22,23,24], electron beam [25], and tungsten inert gas welding [26]. Austenite and vermicular ferrite are the main phases found in components fabricated with high cooling rates characteristic of AM. In addition, the mechanical properties of the components could be comparable to the components manufactured by conventional fusion process [19].
Depending on the alloy composition, the microstructure and the solidification path of the austenitic stainless steel can change significantly. Therefore, with the aim to predict the microstructure after the fabrication of ASS components several diagrams have been developed [27]. The diagrams are based on the elements that stabilize ferrite and austenite. To group the elements, two equations were created, the first one is the chromium equivalent (Creq) and the second one the nickel equivalent (Nieq). The equations developed by Kotecki and Siewart [28], that correspond to the diagram WRC-1992 (Welding Research Council) are shown below:
Creq = %Cr + %Mo + 0.7 Nb
Nieq = %Ni + 35%Cr + 20%N + 0.25%Cu
By using the Creq/Nieq ratio, it is possible to identify the primary solidification mode of the stainless steels. With ratios below 1.2 the steel solidifies in the primary austenite mode (A), where at the beginning of the solidification the nucleation of austenite grains occurs. Then, the ferrite stabilizers elements are enriched in the liquid as the austenite grains grow, leading to the solidification of more austenite or δ-ferrite. Creq/Nieq ratios between 1.2 and 1.5 favor the austenite-ferrite mode (AF). Therefore, at the end of the primary solidification process some ferrite is formed via a eutectic reaction. This occurs due to the presence of ferrite-promoting elements (like Cr and Mo) at the subgrain boundaries to promote the formation of ferrite at the end of the process. Finally, the ferrite-austenite (FA) mode occurs by the formation of primary ferrite and the austenite forms at the end of the process. The austenite forms via a peritectic-reaction [27,28,29].
In industries like aeronautical, aerospace, chemical, petrochemical, and marine one of the most important materials are the nickel-based alloys. High corrosion resistance, high strength at both ambient and elevated temperatures, and good ductility and toughness at low temperatures are among the main mechanical properties of the nickel-based alloys [30]. Ni-based alloy 625 (Ni625) is a solid-solution strengthened alloy with strengthened refractory metals such as niobium and molybdenum in the nickel-chromium matrix. Precipitation hardening is mainly derived from the formation of metastable phases and carbides. The main secondary phases found in these alloys are MC, M23C6, M6C, and M7C3 carbides, γ”-Ni3(Al,Ti), η-Ni3Nb, laves, and σ and δ-Ni3Nb [31]. On the other hand, the alloy Ni80Cr20 is a heat-resistance alloy with an austenitic nickel-chromium matrix. High resistivity, good oxidation resistance, ductility, and weldability characterize this alloy.
Dissimilar joints of stainless steels to Ni-based alloys also play an important role in the modern industries. In thermal and nuclear plants the joint of Inconel 625 to AISI 304L is used in cryogenic applications [32], in sub-sea manifolds dissimilar joints of Inconel 625 and duplex stainless steel are employed [33], NASA manufactured the sub-scale boilers using dissimilar Inconel 625 to austenitic stainless steel [34]. In addition, the union of Inconel 625 to ASS is used in calcining process involving chromic acid which contains diluted acidic environment [35]. Another typical application of the bimetallic components is the sub-scale boiler employed for Advanced Stirling Conversion System project, where the sub scale boiler was built with AISI 316 for the condenser and Inconel 625 with 304L stainless steel wick for the boiler [36]. Cladding is another widely used application for the Ni-based alloy and stainless steels, e.g., hot section components in thermal power plant boilers, gas turbines and chemical industries are exposed to corrosive environments. In general, ASS are employed in those applications due to their good weldability, corrosion resistance, mechanical properties, and costs. However, to extend the life of the components weld overlays of Ni-based alloys are used. This method allow an increase of the protection against corrosion, hot oxidation, wear, and erosion [37].
When a component is in service, only some parts of its structure might be exposed to extreme service conditions, such as corrosive environments or high temperatures. Therefore, it is not essential to build the component with a mono-composition. In these cases, the use of functionally graded materials (FGMs) would be more appropriate. FGMs are characterized by the variation in composition across the volume [38] and their properties can be tailored for a particular application [39]. Several processes have been used to build FGMs like material extrusion [38], laser metal deposition [39,40], laser cladding [41], or laser rapid forming [42].
Functionalized coatings are also applied by plasma spraying and applications for laser-bound powder bed processes are also known [43]. Different Ni-based graded components have been studied, e.g., functional graded Inconel 718 components were produced using select laser melting (SLM) to target different textures optimizing the process parameters [4]. Pulugurtha et al. [40] used laser metal deposition to study FGMs of Fe-82%V and Ni-based 625 deposited in Ti6Al4V and SS316L substrates. Cracks of both materials were found with the Ti6Al4V substrate and the geometric dilution increased with increase in laser power, travel speed, and substrate heating. Xu et al. [42] investigated laser rapid forming of a Ti-Ni alloy structures with a continuous compositional gradient from pure Ti to Ti-50%Ni and analyzed the effect of the gradient composition on the microstructural evolution. Lin et al. [44,45] studied the graded SS316-Rene88DT, Ti/Rene88DT and Ti6Al4V/Rene88DT alloys fabricated by laser rapid forming (LRF) and performed analysis of the phase evolution with the variation of the composition. Abboud et al. [41] studied functionally graded Ni-Al and Fe-Al coatings (up to 4 mm in total thickness) and examined the microstructure and composition based on the aluminides coatings. Khor et al. [43] fabricated functionally graded thermal barrier coatings of the system yttria stabilized zirconiar/NiCoCrAlY by plasma spraying and studied, based on the variations of the chemical composition, the mechanical properties and the microstructure.
In this study, functionally graded structures SS316L to Ni-based alloys were manufactured using the novel process 3D plasma metal deposition. Two Ni-based alloys were employed, heat resistant alloy Ni80-20 and solid-solution strengthened Ni625. Different configurations were studied, for the Ni80-20; a hard transition and smooth transition with a region of 50% SS316L/50% Ni80-20. Regarding the structures with Ni625, a smooth transition configuration and variations in the heat input were applied. Moreover, the effect of the process parameters on the geometry of the structure and microstructure characterization were investigated.
2. Materials and Methods
Functionally graded structures of austenitic stainless steel on the bottom and Ni-based alloy on the top were fabricated using 3D plasma metal deposition. Structures in two configurations were fabricated, SS316L to Ni80-20 and SS316L to Ni 625. The chemical composition of the alloys is displayed in Table 1. A t = 10 mm thick plate of SS316L was employed as base platform (BP) for the structures. For the SS316L to Ni80-20 systems two configurations, transition between the steel and the Ni-based alloy, were tested. The first one, a hard transition (HT) between the SS316L (bottom) and Ni80-20 (top). Fifteen layers of each material were deposited for the HT configuration. The second one, a smooth transition (ST) between both pure materials was built with 50% of steel and 50% of Ni-based alloy. In this case, ten layers of each material were deposited, 30 in total. Regarding the SS316L to Ni625, the smooth transition configuration was chosen and three heat inputs (HI) were employed to build the structures. For the selection of the HI, a standard welding current was found, then a variation of ΔI = 15 A was used to obtain the low and high input. Like the system with Ni80-20, ten layers of each material were deposited. The build structures were cuboids with a length of l = 120 mm, width of w = 30 mm and height of h = 30 mm, with an average wall thickness of t = 6 mm. One cuboid of each system was built using the final process parameters.
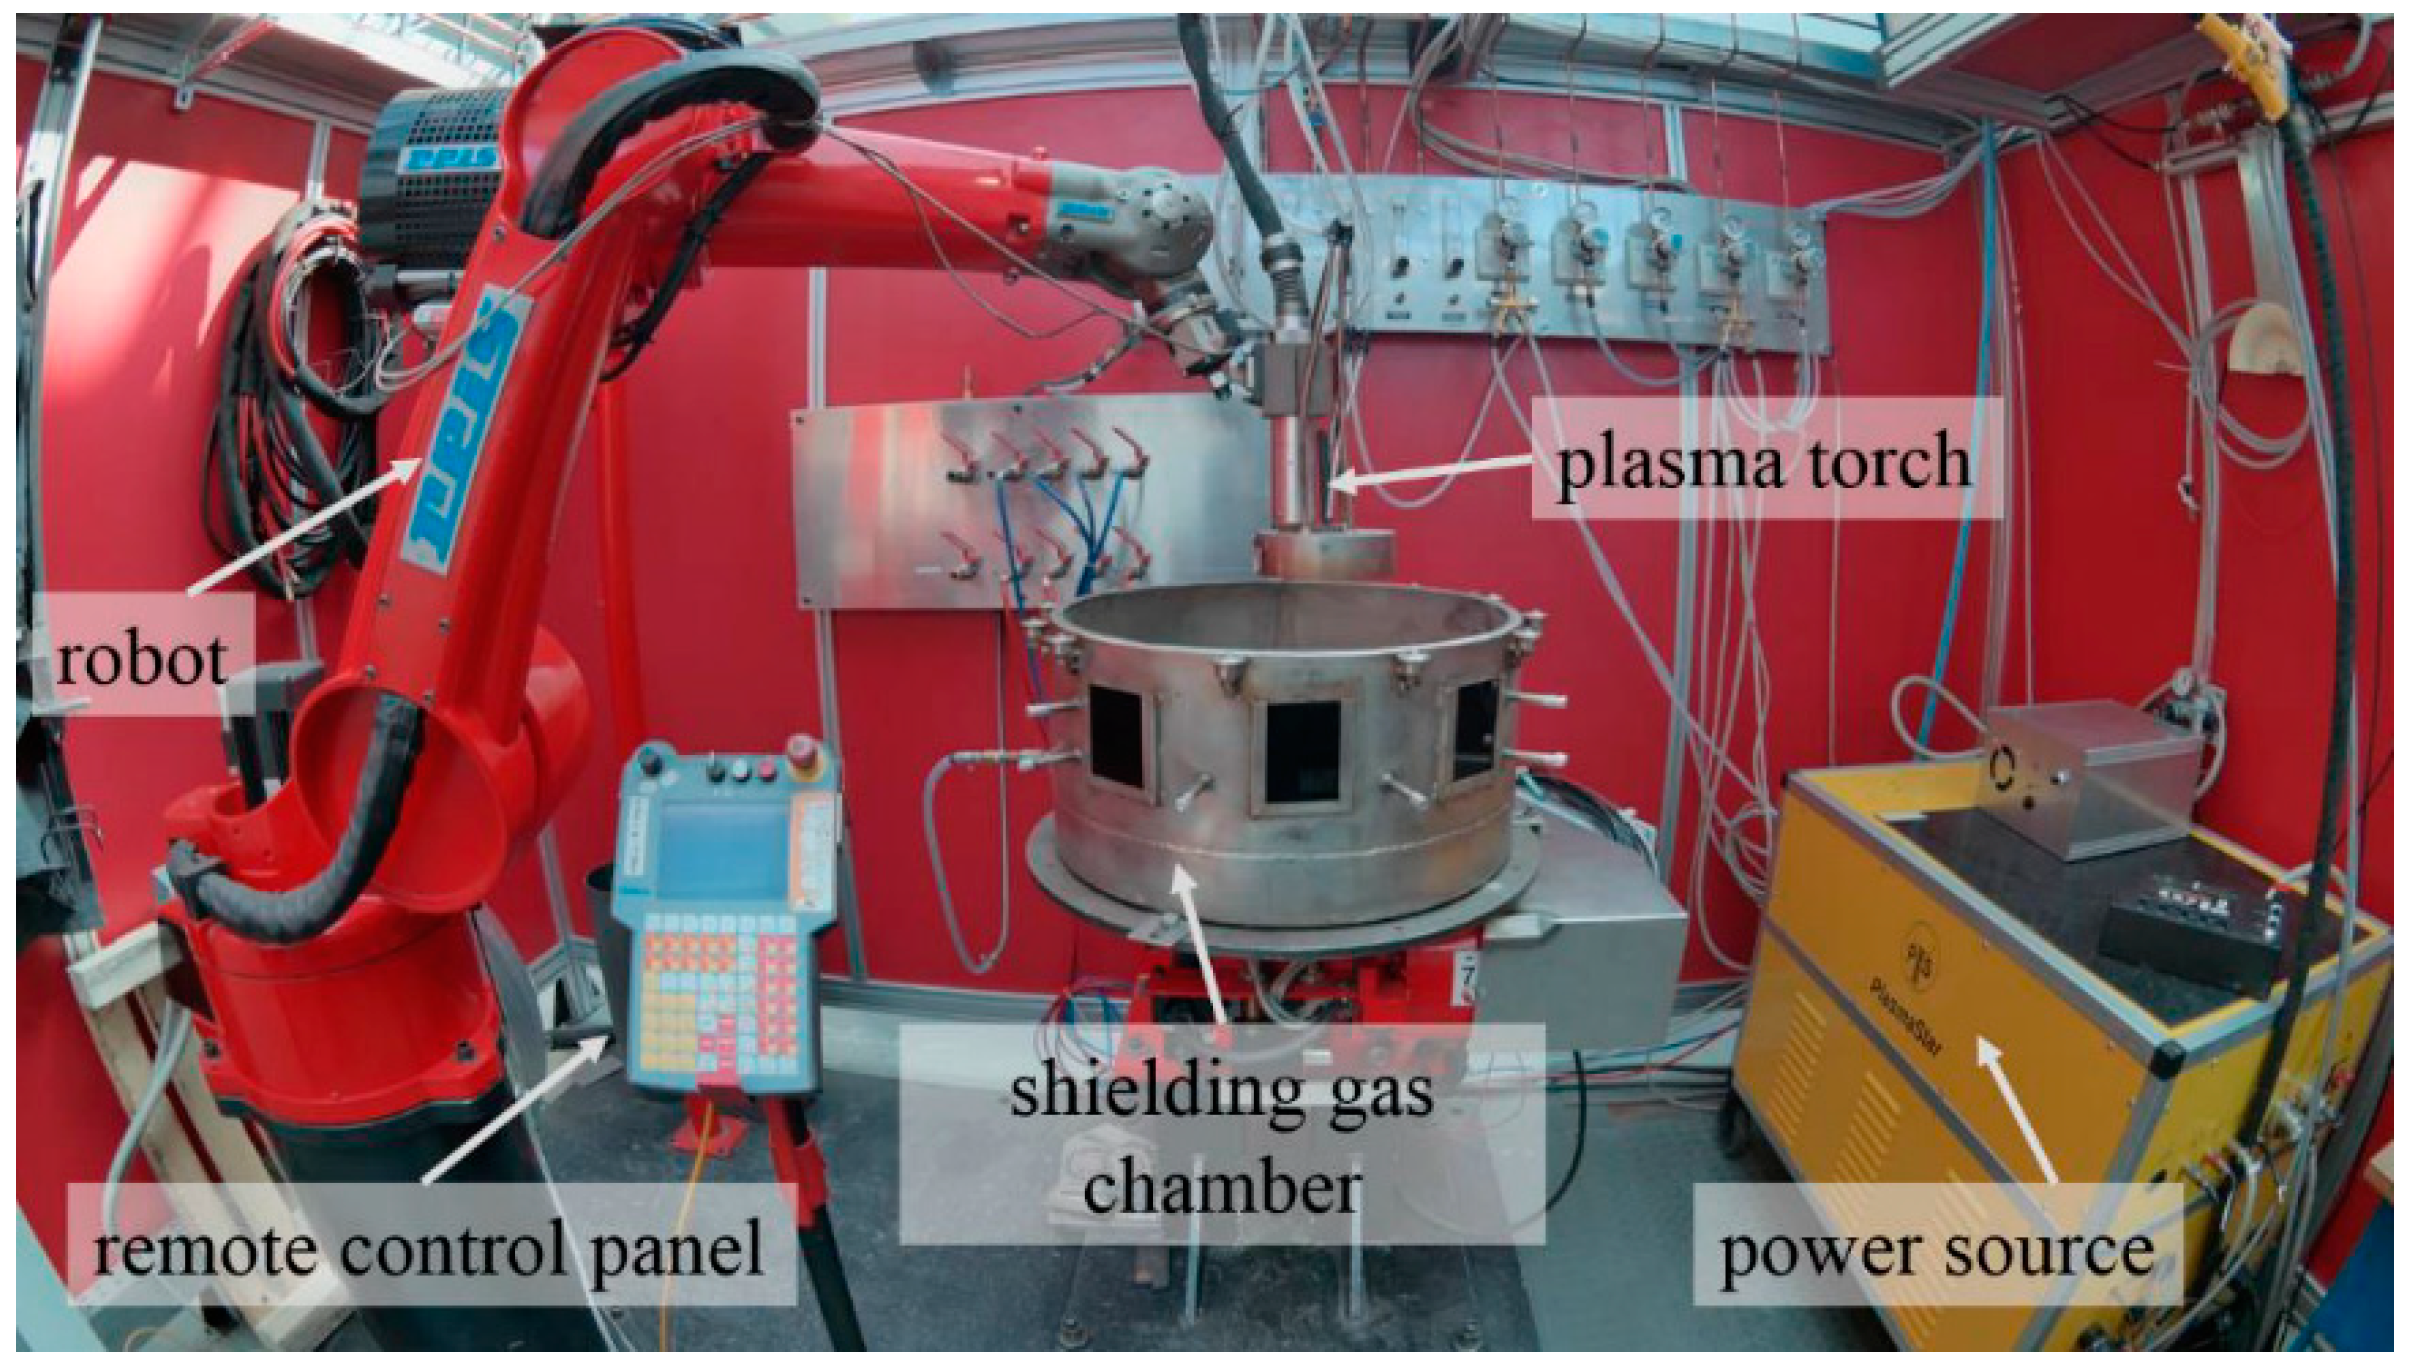
A power source PlasmaStar 500 (Imax = 500 A) in combination with the welding torch PlasmaStar MV230 Imax = 230 A was used to fabricate the structures. A meander disk feeder (two separate disk powder feeder) fed the powders with a particle size between 50–150 μm. High-purity argon was used as shielding gas (12 L∙min−1), carrier gas (3 L∙min−1) and plasma gas (1.5 L∙min−1). A six axis articulated arm robot REIS RV20-16 was employed as a manipulation system (see Figure 1).
A constant welding speed of υ = 10 mm·s−1 was used to build each layer of the structures. In the case of the system SS316L to Ni80-20, the current was I = 120 A for the stainless steel, I = 105 A for the Ni-based alloy and I = 110 A for the powder mix (50% of steel and 50% of Ni-based alloy), the welding parameters are shown in Table 2. Regarding, the system SS316L to Ni625, the standard current of I = 120 A for the stainless steel, I = 105 A for the Ni-based alloy and I = 110 A for the powder mix were chosen. As mentioned before, a variation of ΔI = 15 A was used to obtain the samples for low and high heat input (Table 3). For the heat input, an arc efficiency of 0.72 was used. According to Haelsig et al. [46], the plasma arc welding efficiency is between 0.69 and 0.80 with a mean value of 0.75. However, for the PTA process there is a small decrease of the process efficiency caused by the use of powder.
Flowrate of powder for each material in both systems was set to = 25.52 g·mm−1 for the stainless steel, and = 27.09 g·mm−1 for the Ni-based alloy. For the powder mix, a flowrate of = 12.32 g·mm−1 and = 25.52 g·mm−1 of SS316L and Ni625 was employed, respectively.
For the metallographic examinations, cross-section specimens from the fabricated structures were obtained. Three specimens of each system were cut, two for microstructural analysis, and one for microhardness measurements. Standard metallographic preparation was used based on the ASTM E3-95 [47]. First, the samples were prepared by grinding using SiC papers, followed by polishing with 1 µm diamond paste. Then, the final step was carried out using vibration polishing with colloidal silica. To revel the microstructure of deposited materials, 10% oxalic acid was used at 2 V for 30 s. The microstructure was observed using optical microscopy (OM, ZEISS, Chemnitz, Germany) and scanning electron microscopy (SEM, Tescan, Chemnitz, Germany). For the identification of the precipitates, energy dispersive X-ray spectroscopy (XEDS, Bruker, Chemnitz, Germany) was employed. Vickers microhardness tests were performed on the interfaces between the materials using an automatic hardness indenter (Emco-Test, Chemnitz, Germany) with 0.98 N load and 15 s dwell time. The microhardness test were performed according to the standard ASTM E384-99 [48].
3. Results and Discussion
3.1. 3DPMD Process
• SS316L–Ni80-20 structures
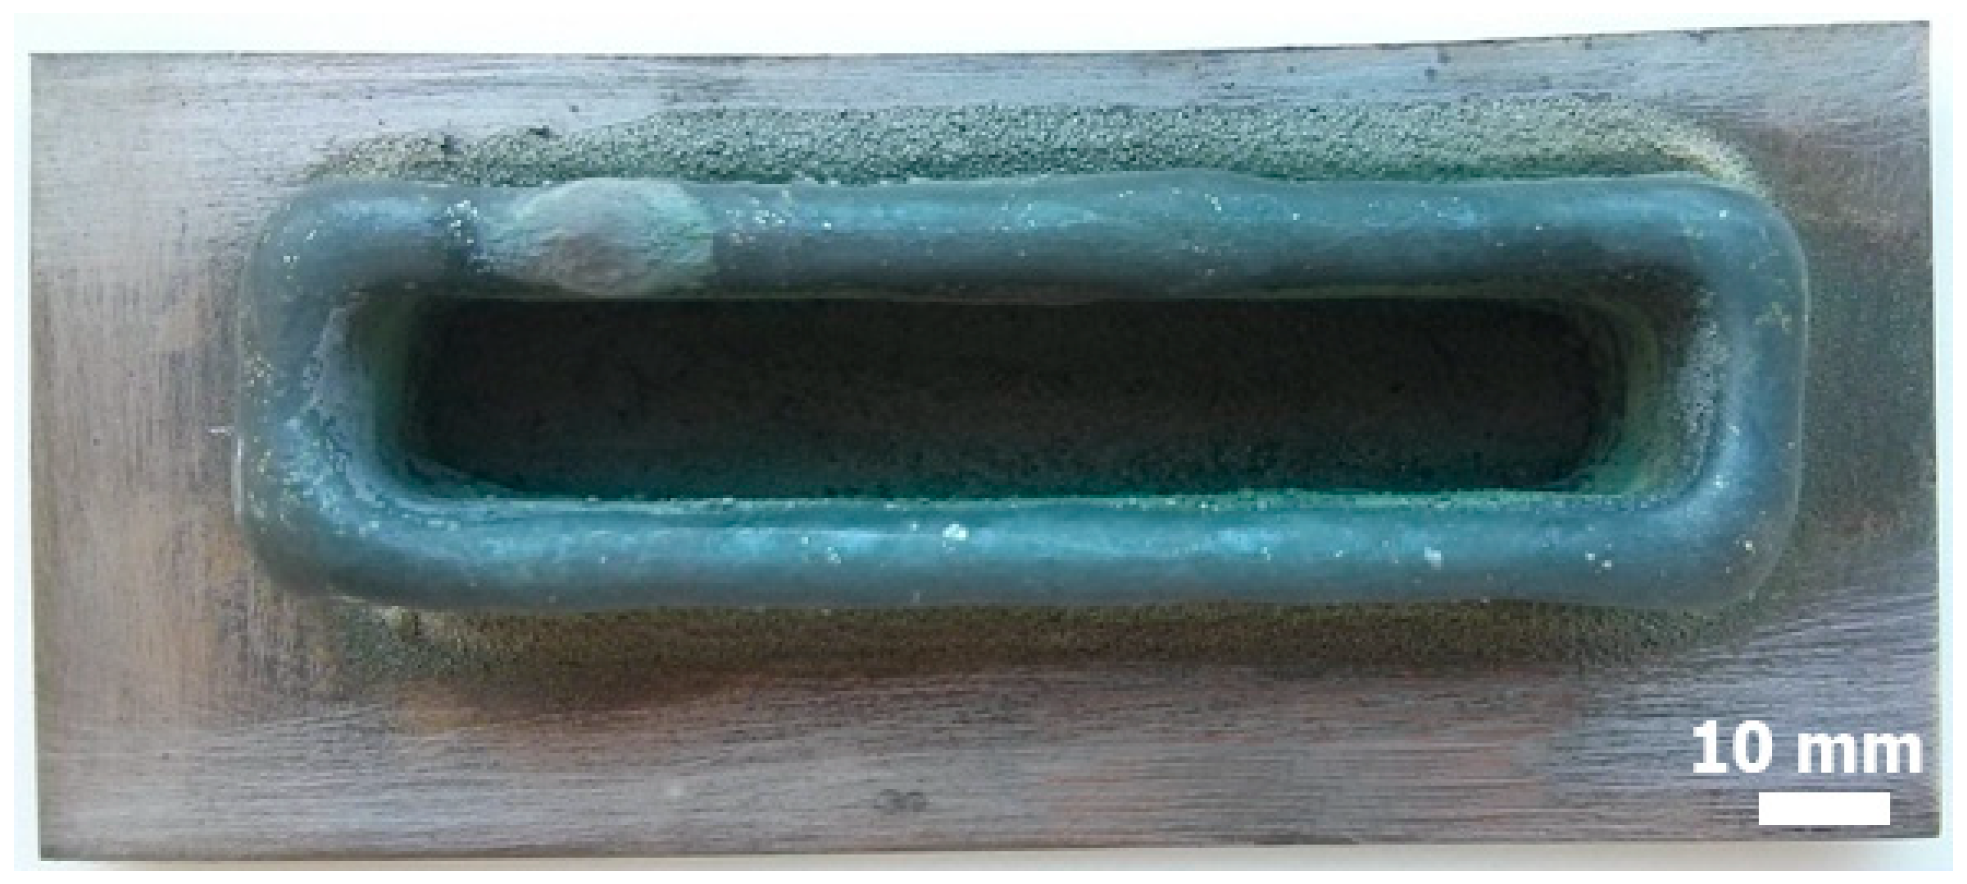
Figure 2 shows a top view of the hybrid components manufactured. The external shape showed a homogeneous layer structure without delamination or cracks. The surface of the components is wavy, but negligible due to the intended post-processing.
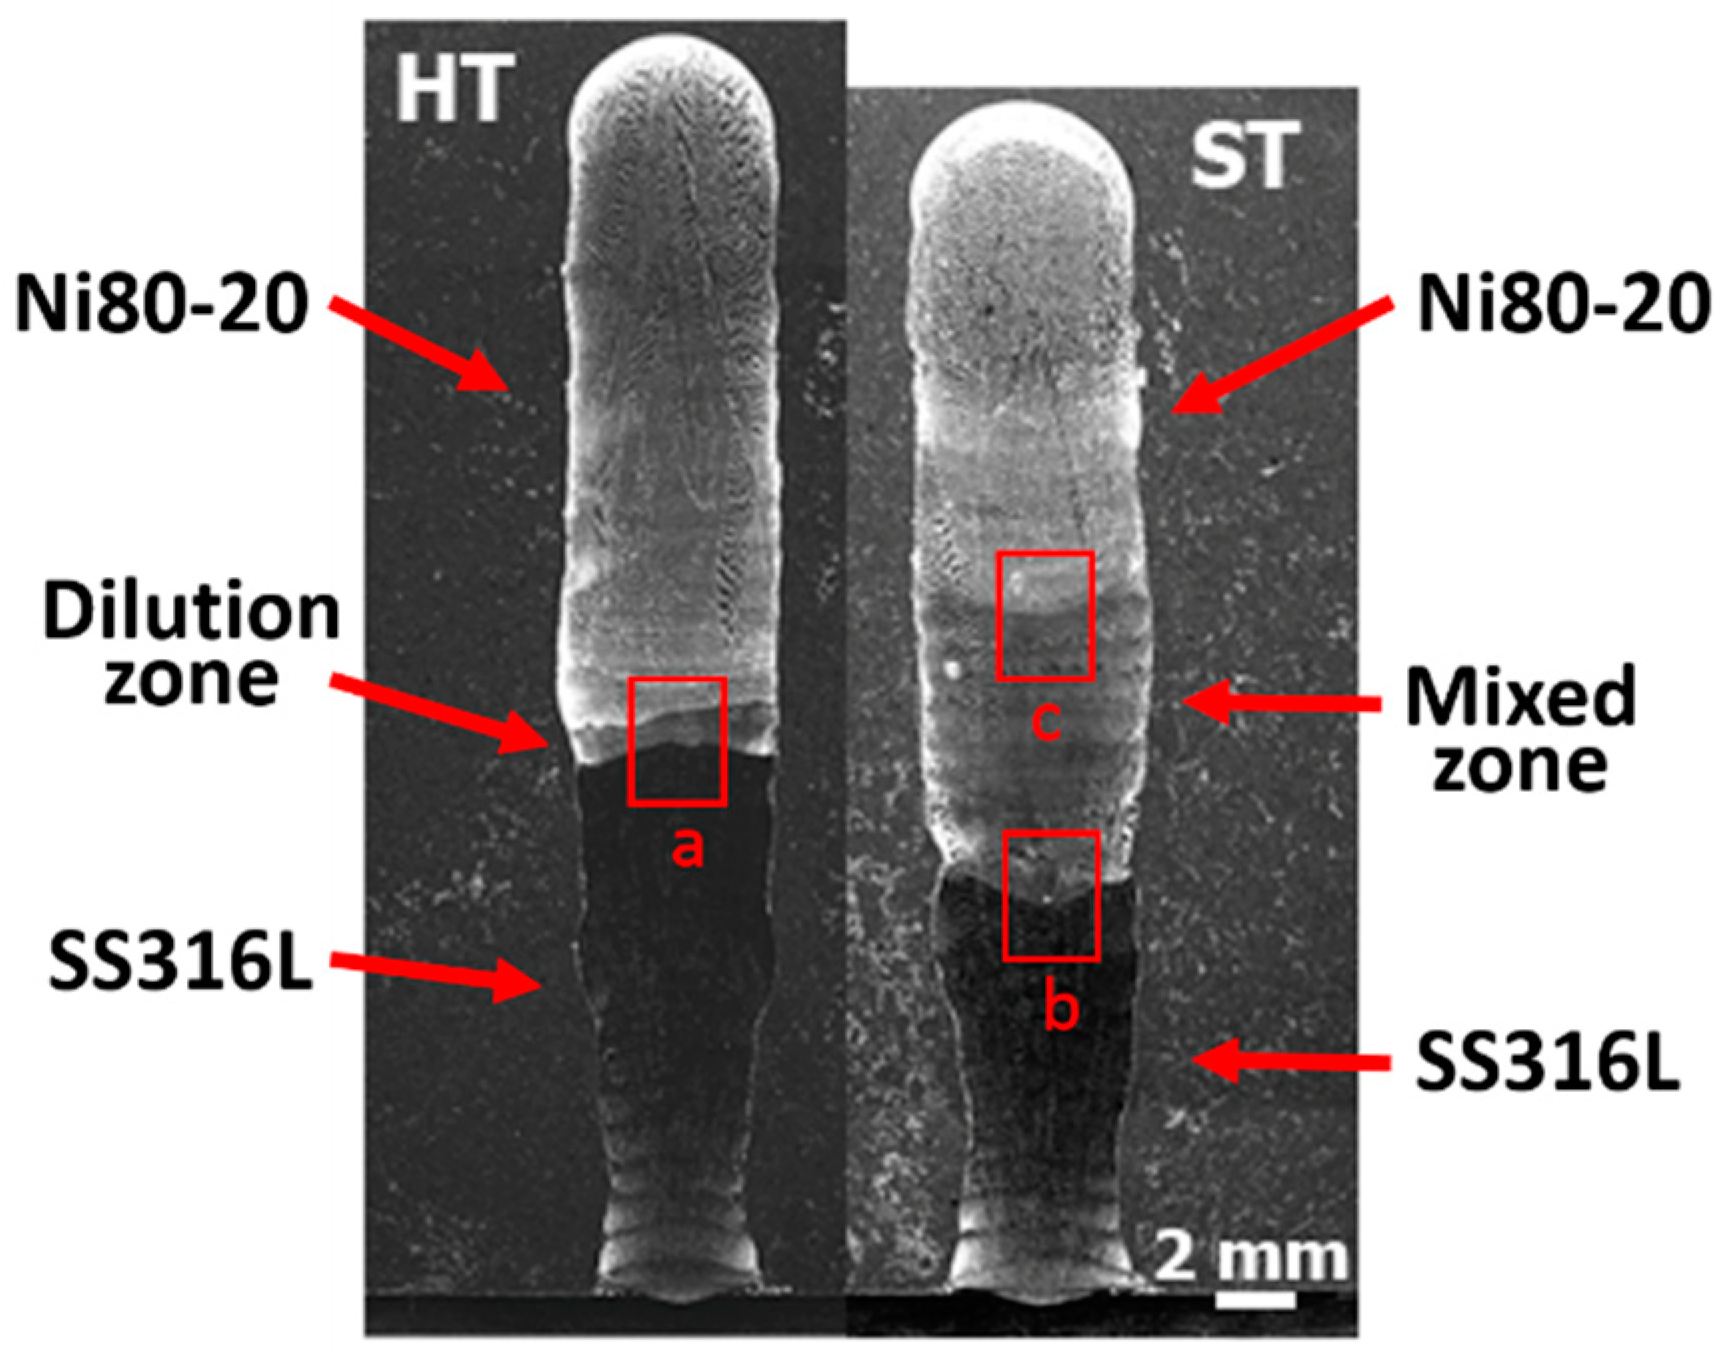
The macro photographs in Figure 3 also confirm the uniform layer structure. Figure 3 shows the abrupt transition for the HT sample of the properties within one layer. A wall thickness of t = 6.7 mm and a component height of h = 30.4 mm were determined. The average layer thickness was z = 1.08 mm. The transition in properties is only damped by the process-typical dilution zone. The mixed zone (ST sample) for the soft transition was 10 layers (Figure 3). The smooth transition part is characterized by a higher wall thickness (Δt = 19%) and a lower component height/layer thickness (Δh = 6.5%) compared to the hard transition. The higher proportion of Ni80-20 in the ST variant can explain the differences in component geometry. The lower thermal conductivity of the nickel-based alloy leads to heat accumulation and thus to a larger weld pool with effects on the geometry.
• SS316L–Ni625 structures
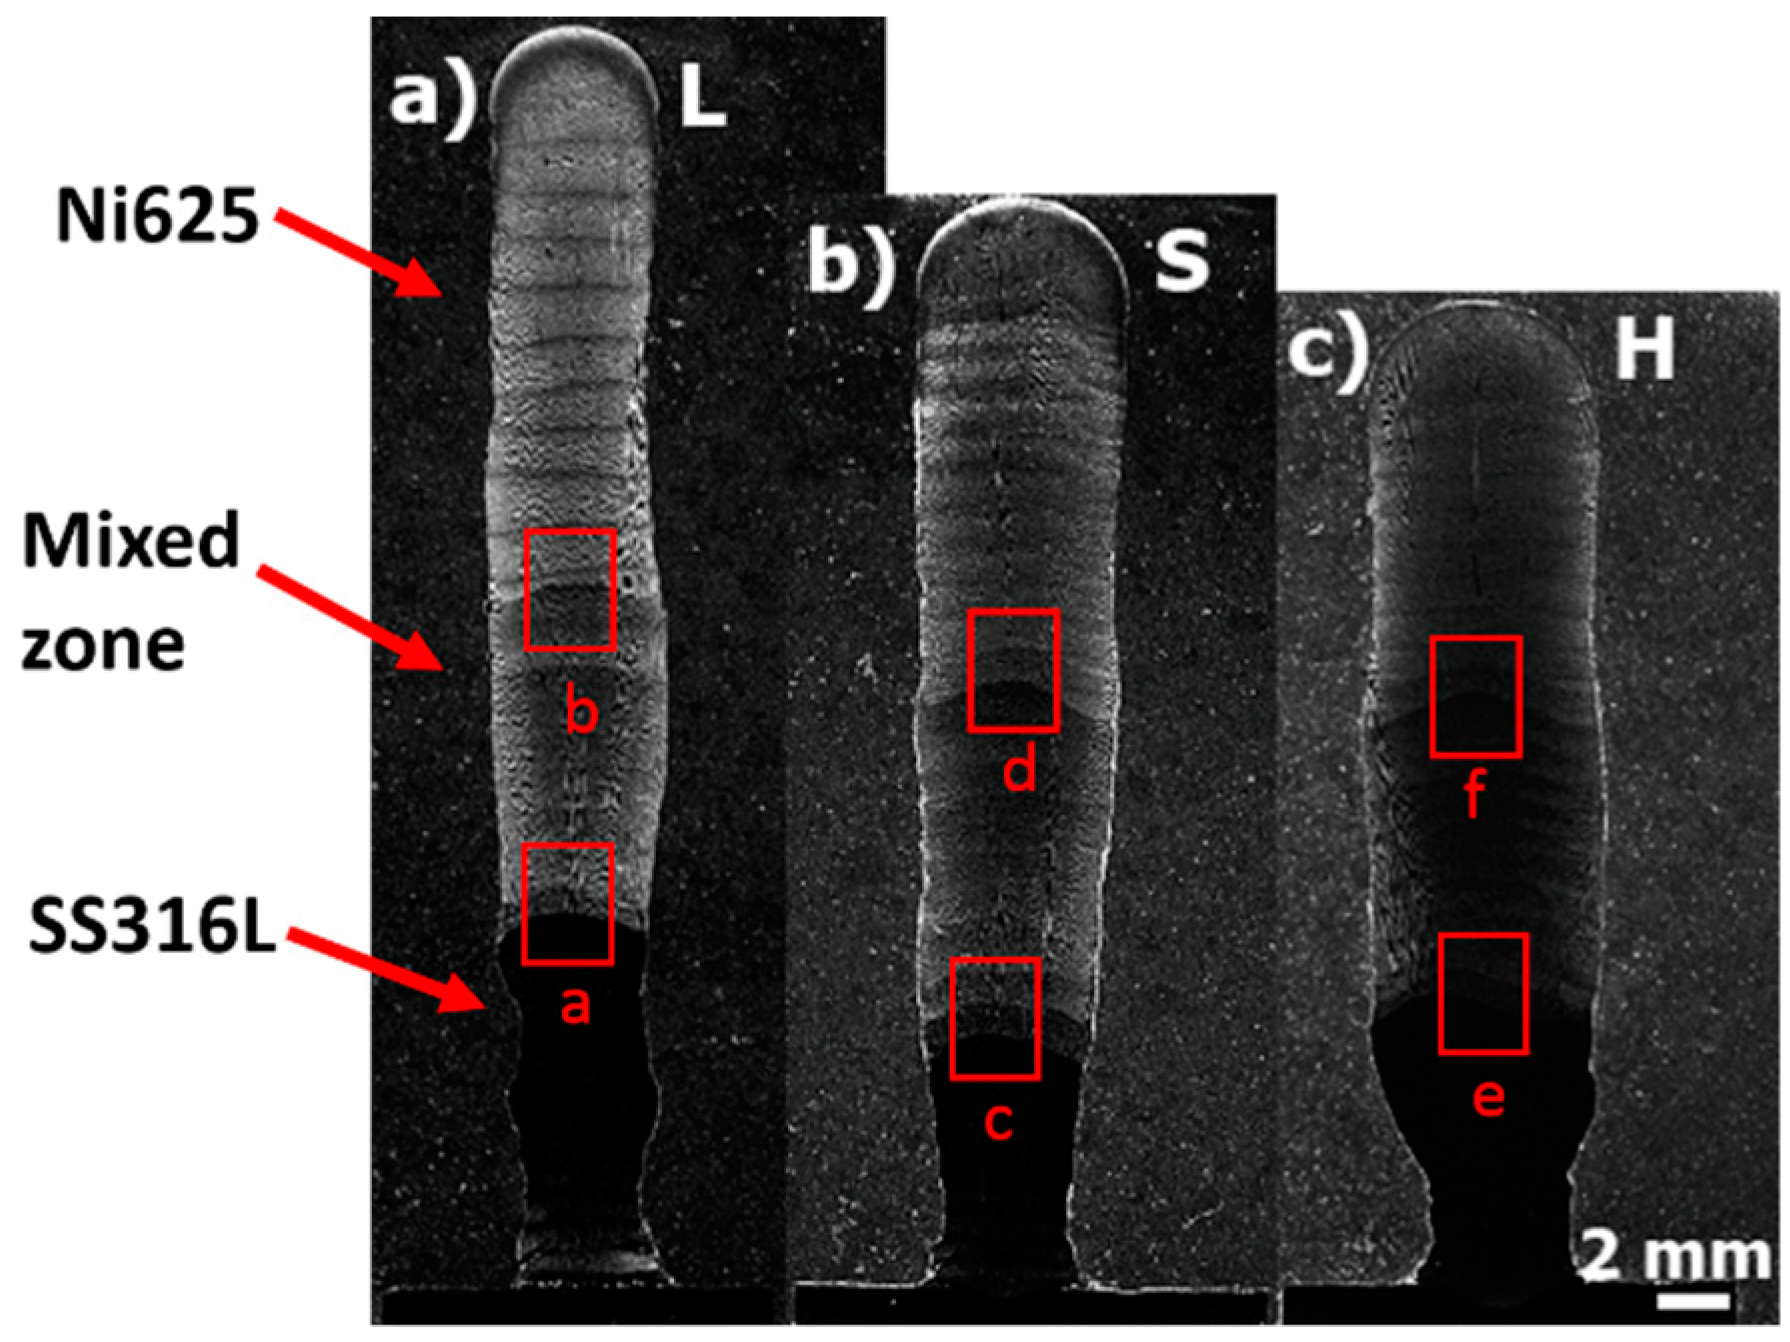
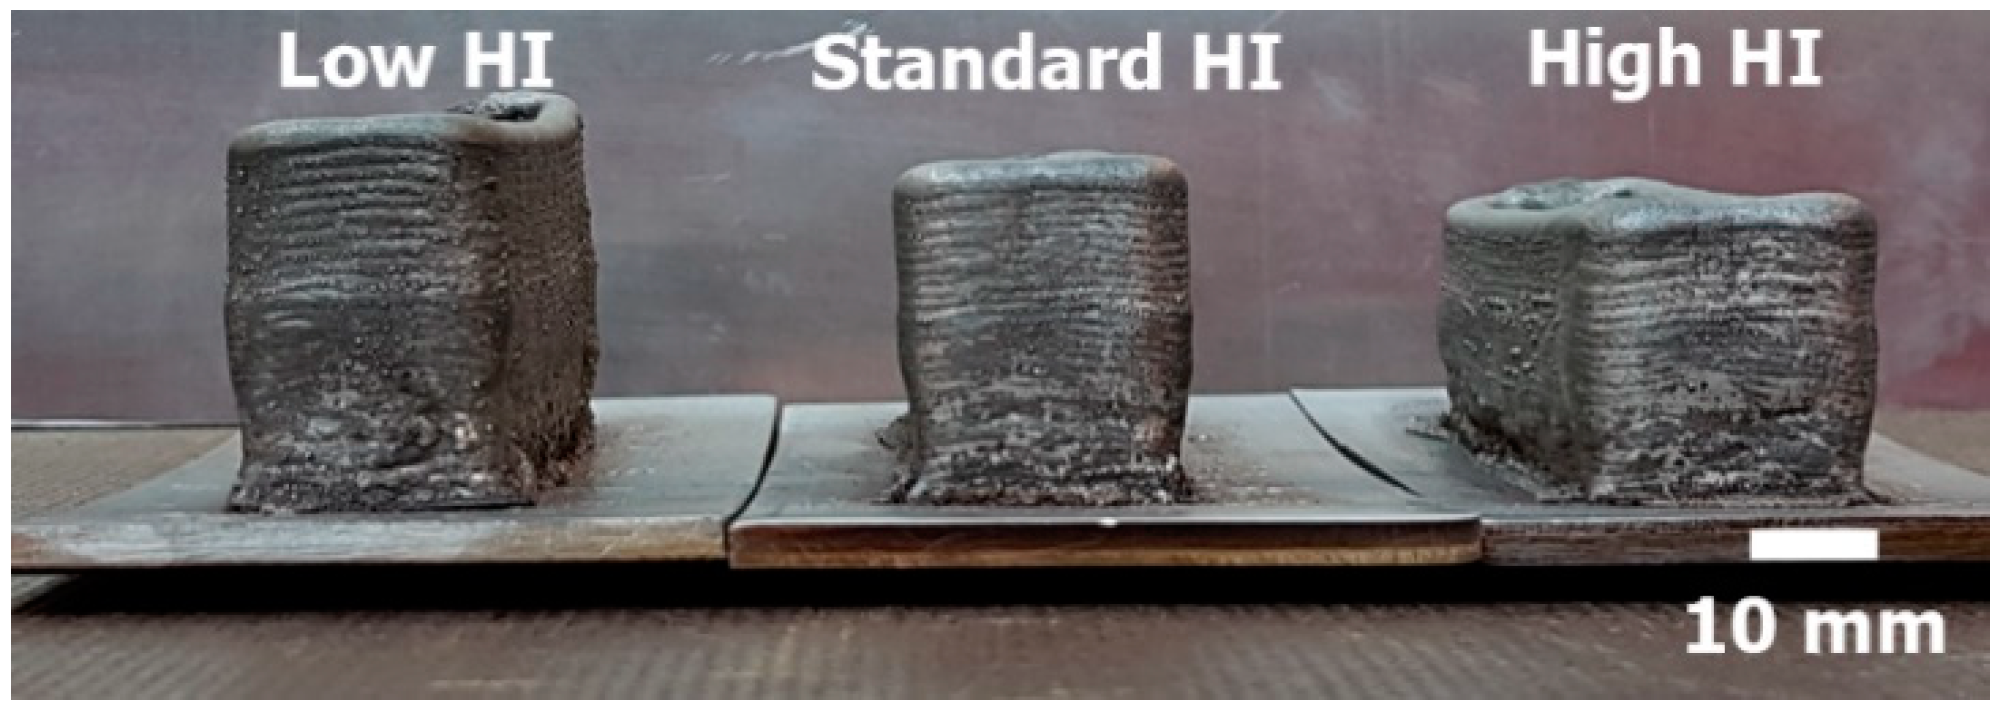
The effect of modified heat inputs on the part geometry is shown in Figure 4. It can be seen that the height of the component decreases with increasing heat input. Considering the macro images in Figure 5, an increase in wall thickness can also be observed. These changes are caused by a higher part temperature. This leads to a reduction of the melt pool viscosity and thus to modified geometries. Table 4 summarizes the geometric properties. Effects on component quality could not be determined macroscopically.
3.2. Microstructural Characterization
• SS316L–Ni80-20 structures
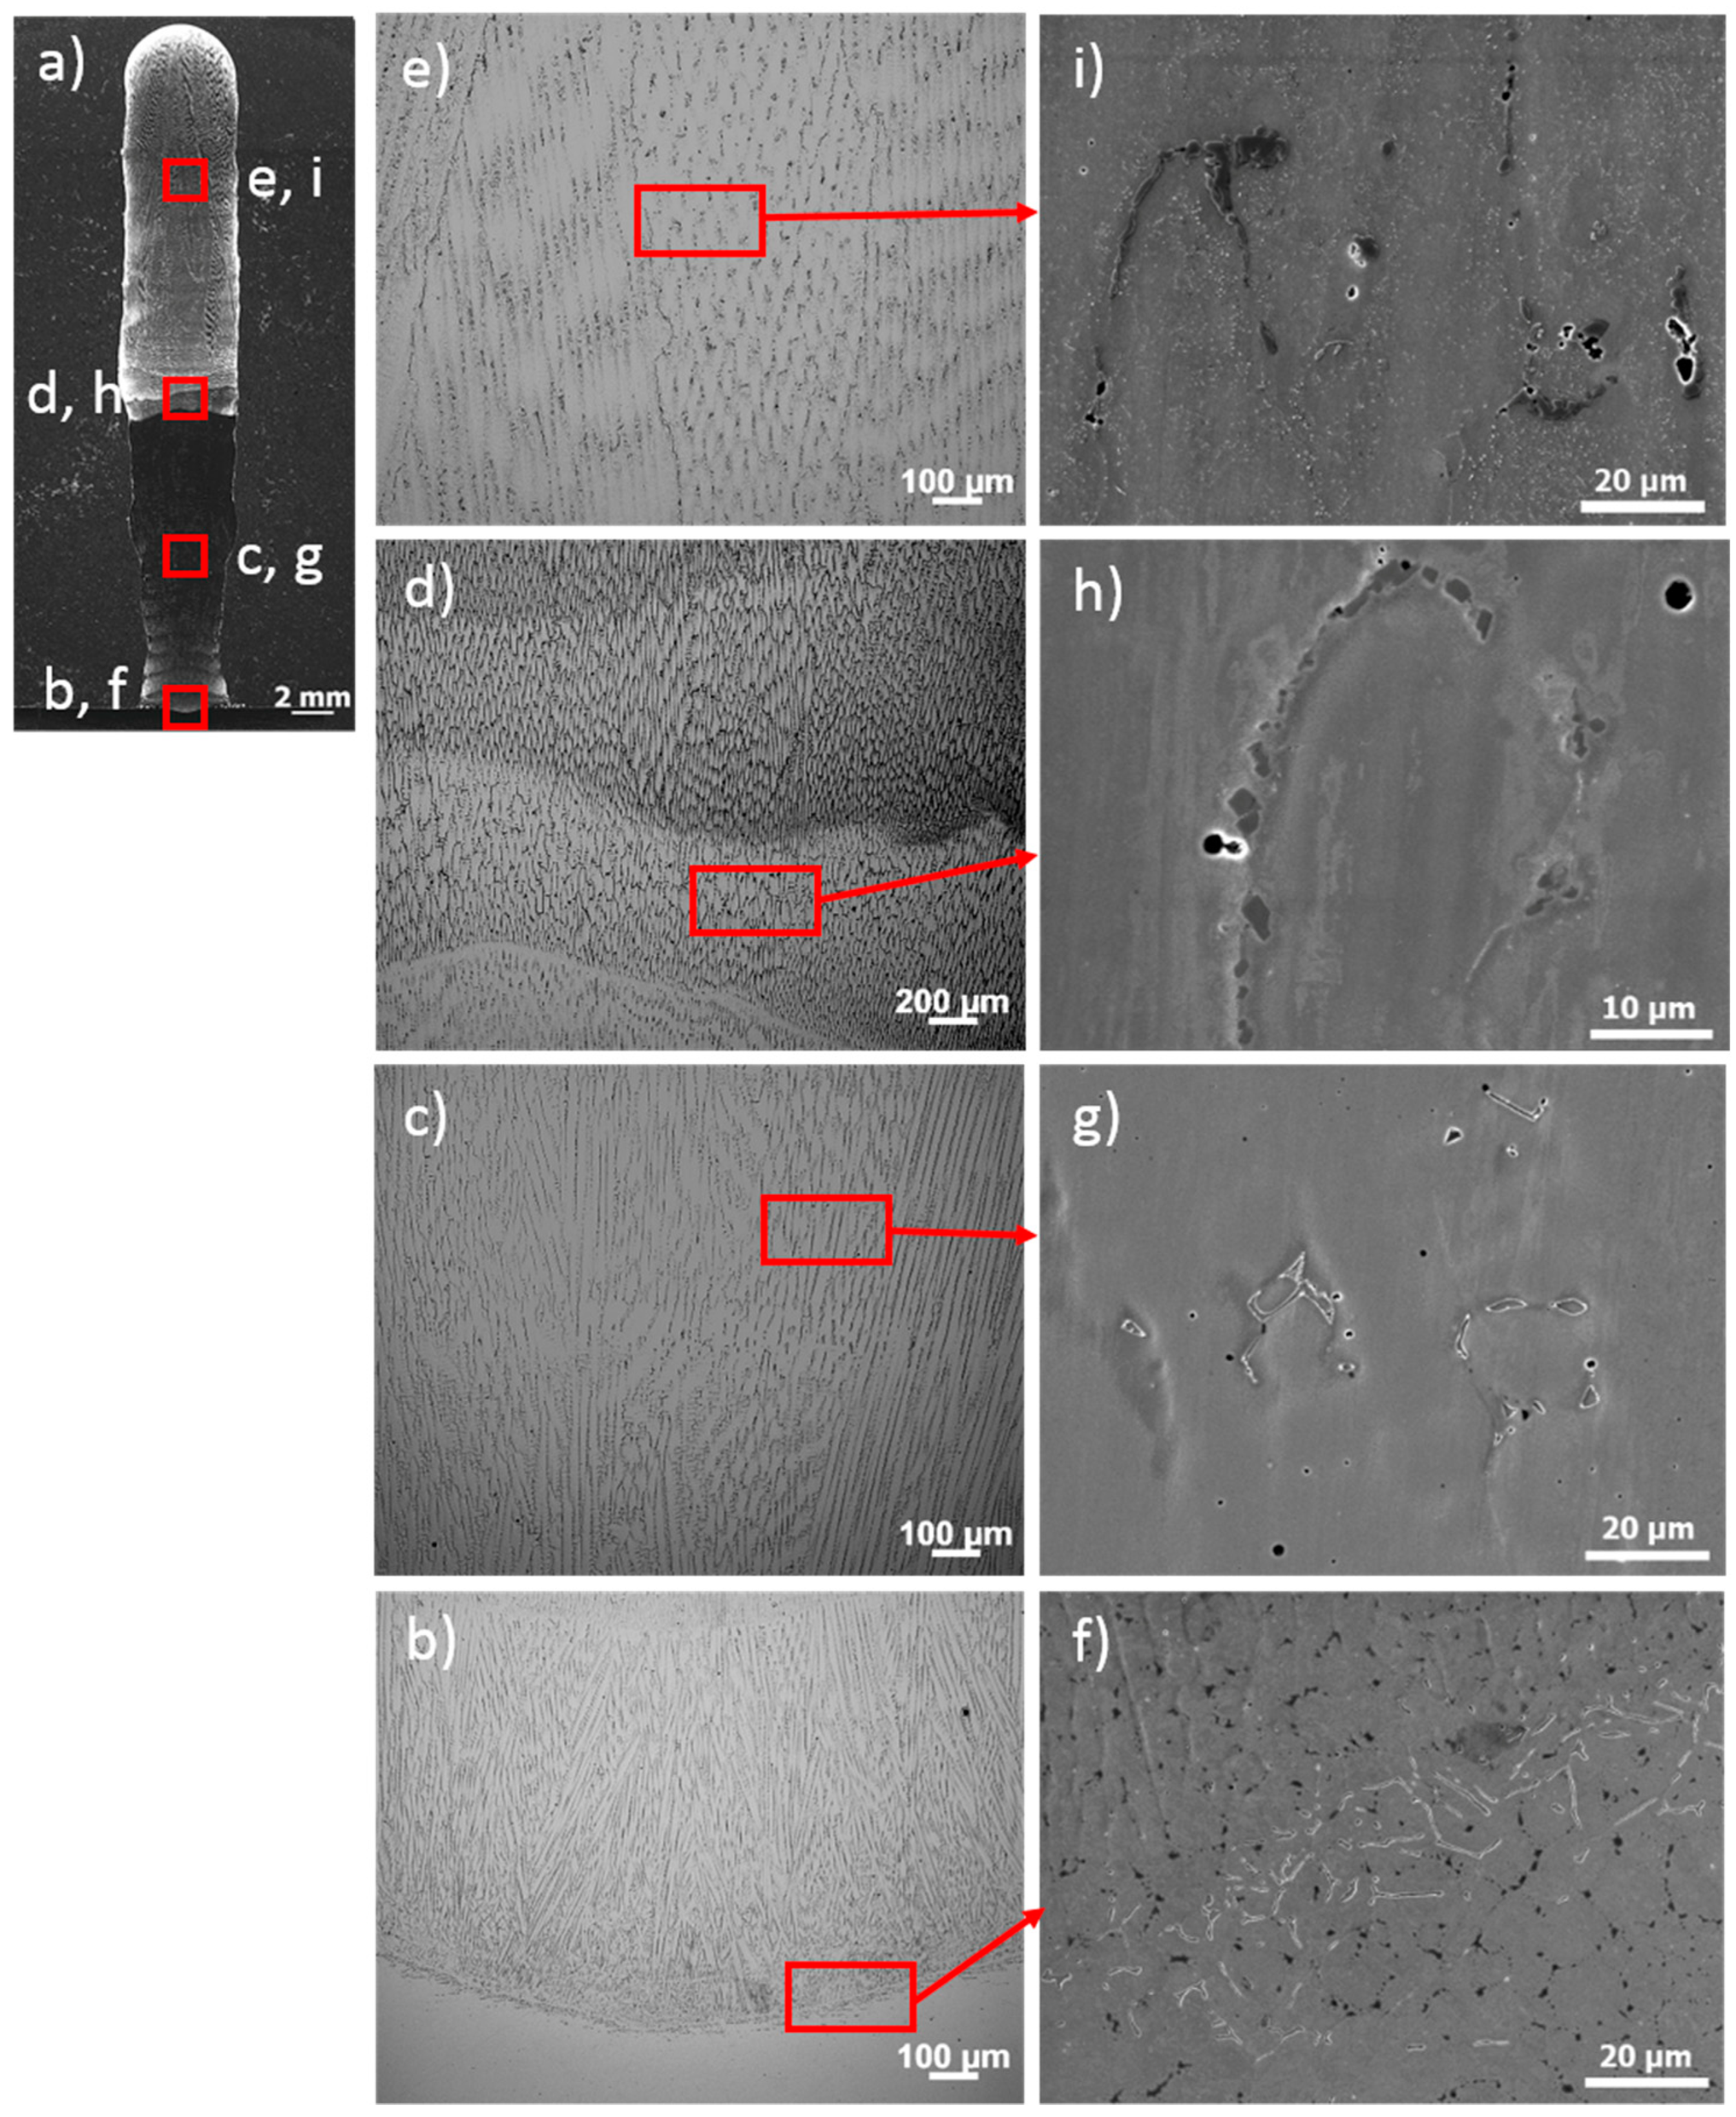
The microstructural characterization of the HT and ST samples is shown in Figure 6 and Figure 7, respectively. The as-built structures presented a microstructure composed of austenite and δ-ferrite. The austenite showed a dendrite morphology while the δ-ferrite presented a vermicular morphology. At the interface between the SS316L and the BP segregation of a second phase was also observed in both structures showing a vermicular morphology (Figure 6f and Figure 7h). No carbide formation was noted due to the low C content. The equivalent contents of Cr and Ni were calculated using the chemical composition presented in Table 1 (Equations (1) and (2)).
The results showed a Cr equivalent (Creq) of 18.6% and Ni equivalent (Nieq) of 14.1%. The Creq/Nieq is about 1.32. This ratio indicated that the solidification mode was austenite-ferrite (AF). The solidification sequence for the AF mode is L → L + A → L + A + (A+F)eut → A + Feut, showing ferrite at cell and dendrite boundaries. The solidification occurs via a eutectic reaction due to the presence of ferrite-promoting elements, like Cr and Mo. The ferrite-promoting elements migrate to the subgrain boundaries during the cooling of the microstructure promoting the formation of ferrite as terminal product [27]. Comparing both configurations (HT and ST), no morphological changes of the δ-ferrite were observed due to the use of the same heat input during the fabrication of the samples. In addition, at the interface between the SS316L and the BP, also SS316L, the formation of a second phase was observed in both structures showing a vermicular morphology (Figure 6f and Figure 7h). Therefore, based on the morphology and the solidification sequence, the second phase was identified as δ-ferrite.
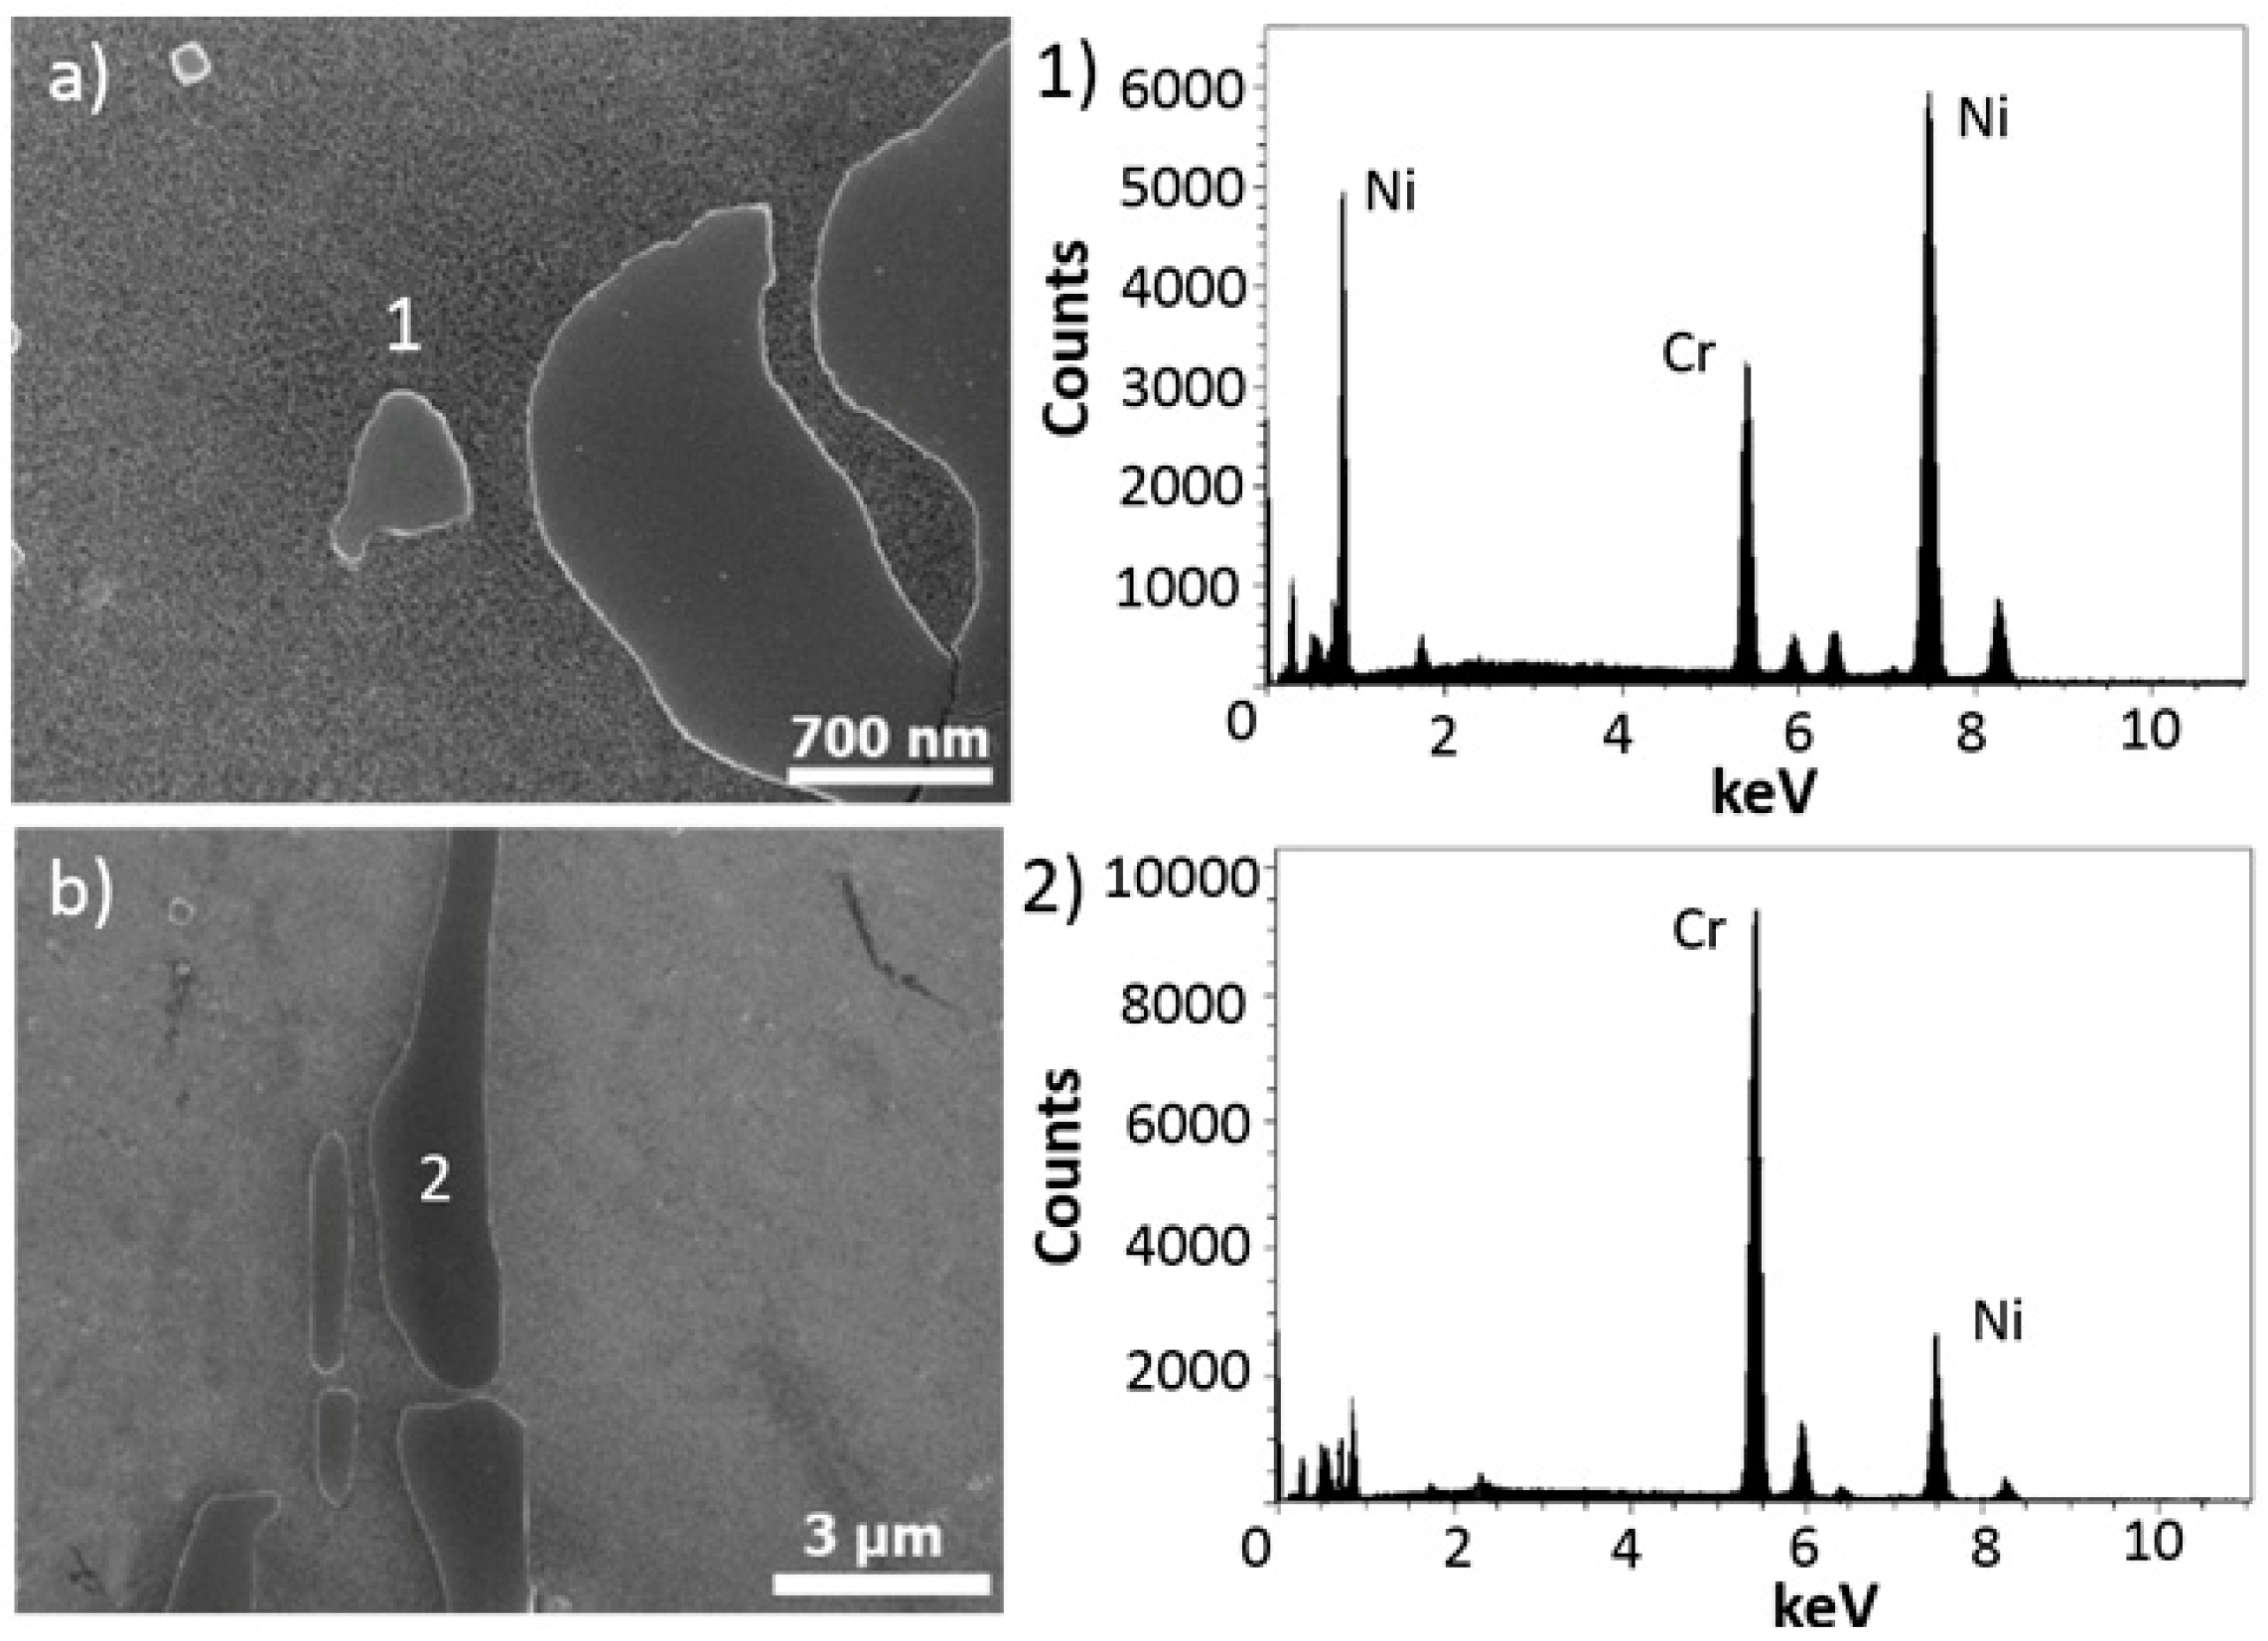
The microstructure of the Ni80-20 was characterized as an austenite (γ) matrix with some M7C3 precipitates and laves phase. The γ displayed a dendritic morphology with intergranular and intragranular second phases for both 3D systems. Figure 6e and Figure 7g show the dendrite structure observed for the HT and ST samples, respectively. The M7C3 precipitates exhibited a roughly round morphology. The precipitate were characterized using an XEDS analysis and classified as Cr7C3, as shown in Figure 8a. In this precipitates the main stabilizer is the Cr. M7C3 precipitates are formed at intermediate temperatures, however, in some cases the formation of M7C3 at high temperatures is noticed. The intermetallic compound laves with an A2B type structure was also observed, where A = Fe, Ni, Cr and B = Nb, Mo, Si [30]. Figure 8b shows the XEDS analysis of the laves phase classified as (Ni, Fe, Cr)2(Mo, Si). The laves phased exhibited blocky morphology roughly continuous at the grain boundaries, as depicted in Figure 6h,i and Figure 7m for HT and ST samples, respectively.
Regarding the mixed zone of the ST sample, an austenite (γ) matrix with dendritic morphology was observed. Similar to the Ni80-20, the mixed zone showed M7C3 precipitates and laves phase. However, a change in the laves morphology was observed. Figure 9 displays a detailed view of the γ/laves eutectic type morphology [30]. In addition, the mixed zone showed a refined microstructure when compared with the Ni80-20 region. The variation in the laves morphology for this zone can be explained by the changes in the chemical composition and the dilution during fabrication.
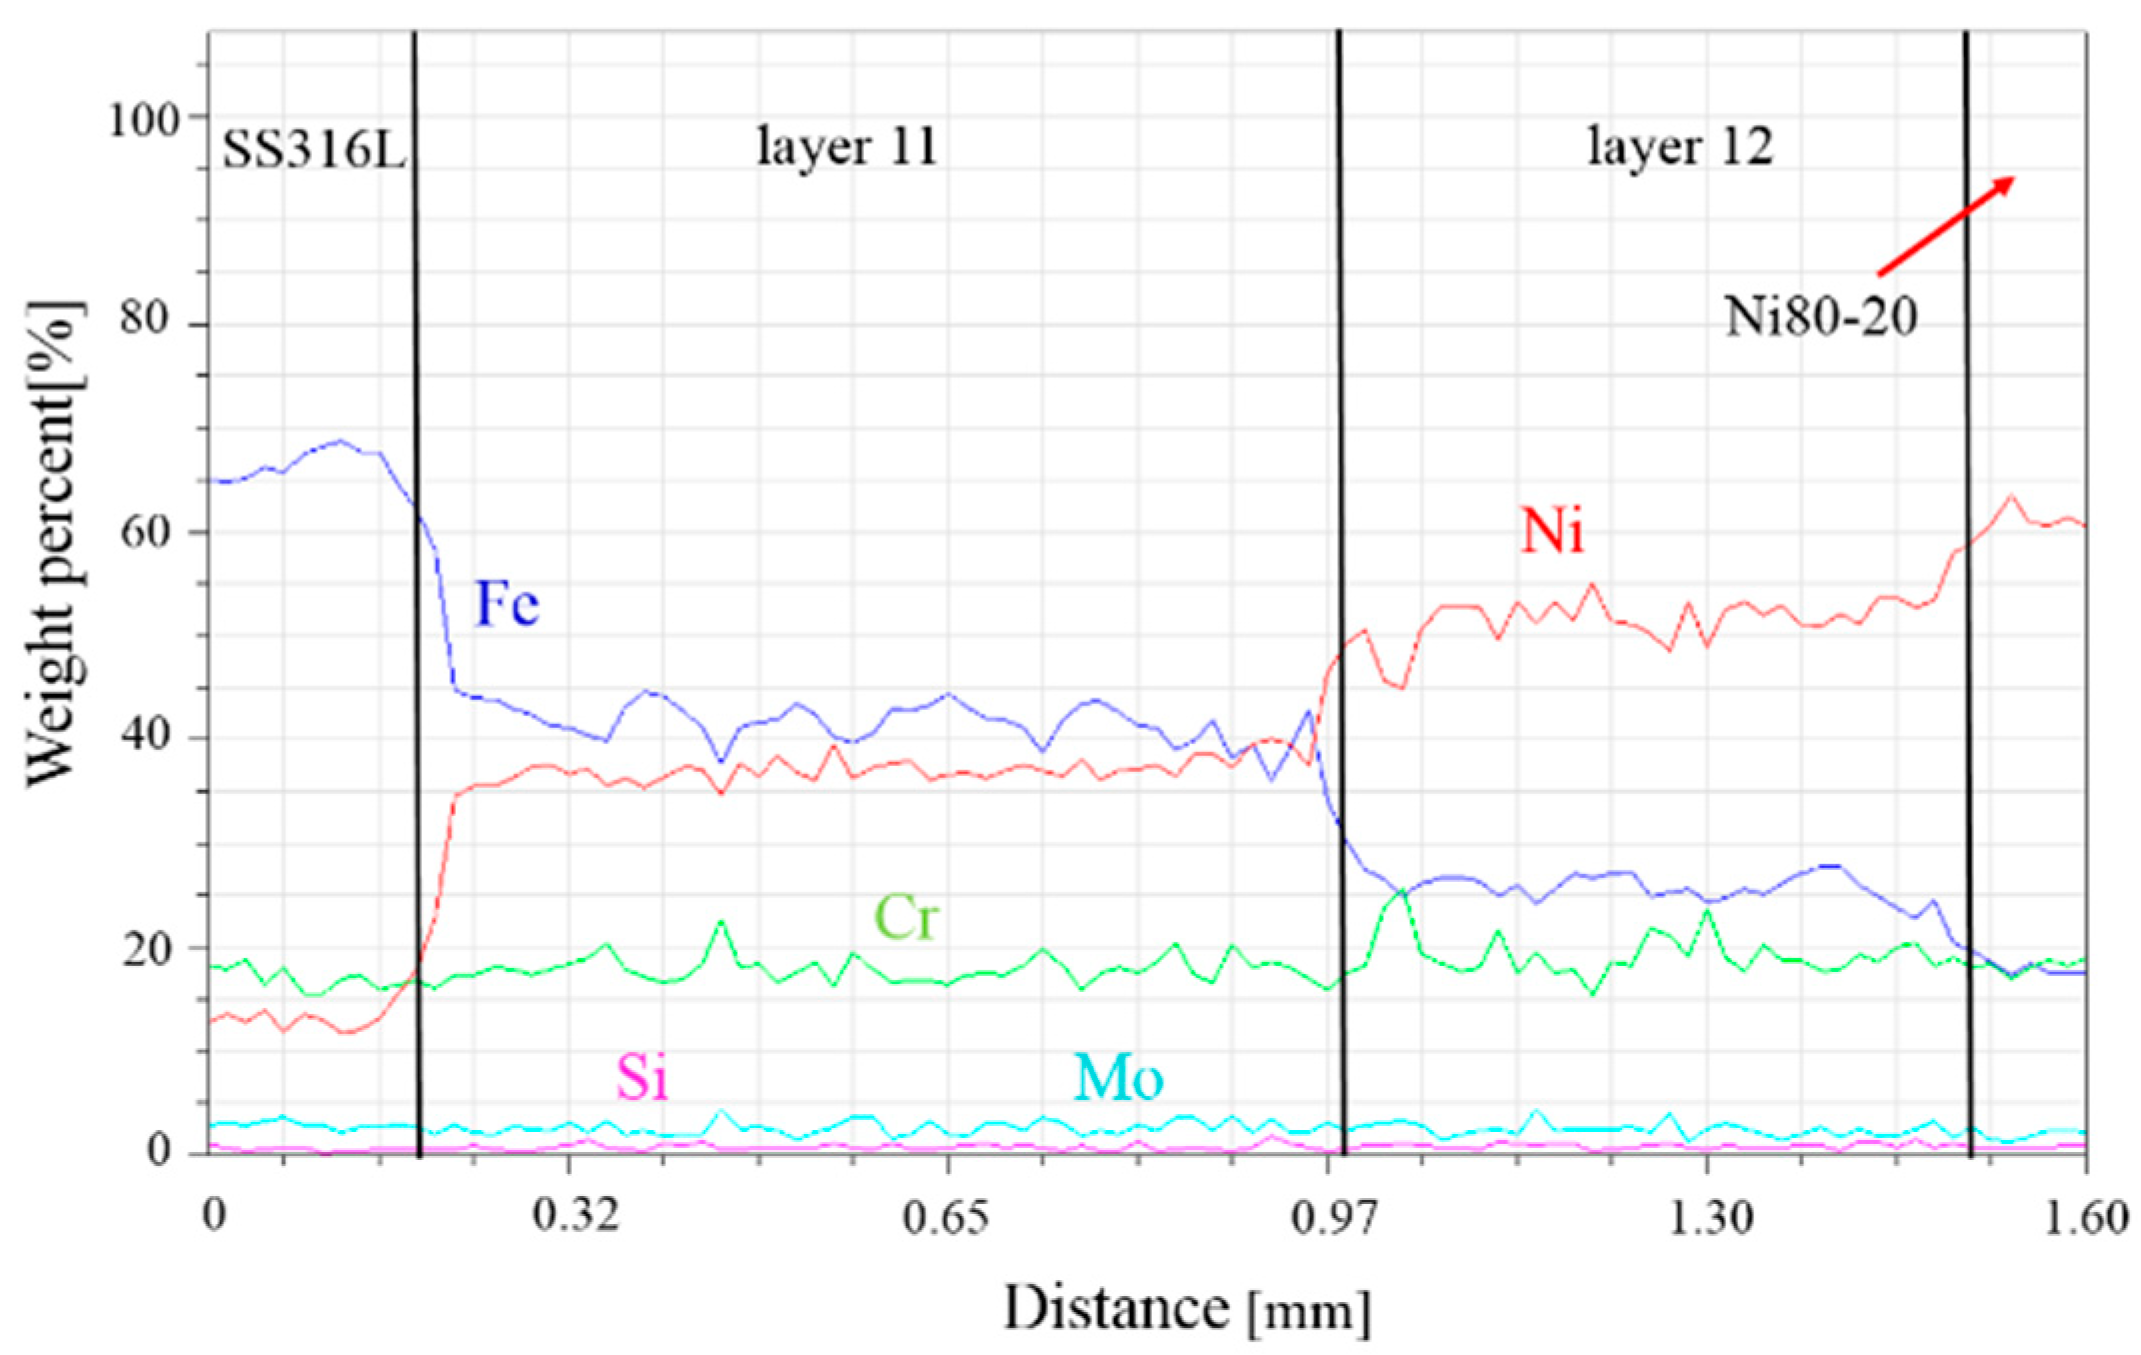
An XEDS line scan across the interface between the SS316L and Ni80-20 for the HT sample (Figure 3, rectangle a) is shown in Figure 10. Significant variations of the Fe and Ni content through the layers are observed. However, for Cr, Si, and Mo, no appreciable variations are noticed. An approximation to the dilution across the interfaces was made based on the classical equation proposed by DuPont [49], where the concentration of any alloy element, i, in the layer of interest () is determined by the dilution and concentrations of element i in the previous layer () and the theoretical composition of the powder () by Equation 3. Therefore, the dilution percentage (%D) across the layers 11 and 12 was calculated. The Ni80-20 composition was reached after the deposition of layer 13. For the Ni content, the %D is 61% and 60% for the layers 11 and 12, respectively. The HT configuration could be a disadvantage in the mechanical and corrosion properties of the structure due to the rapid change in the microstructures:
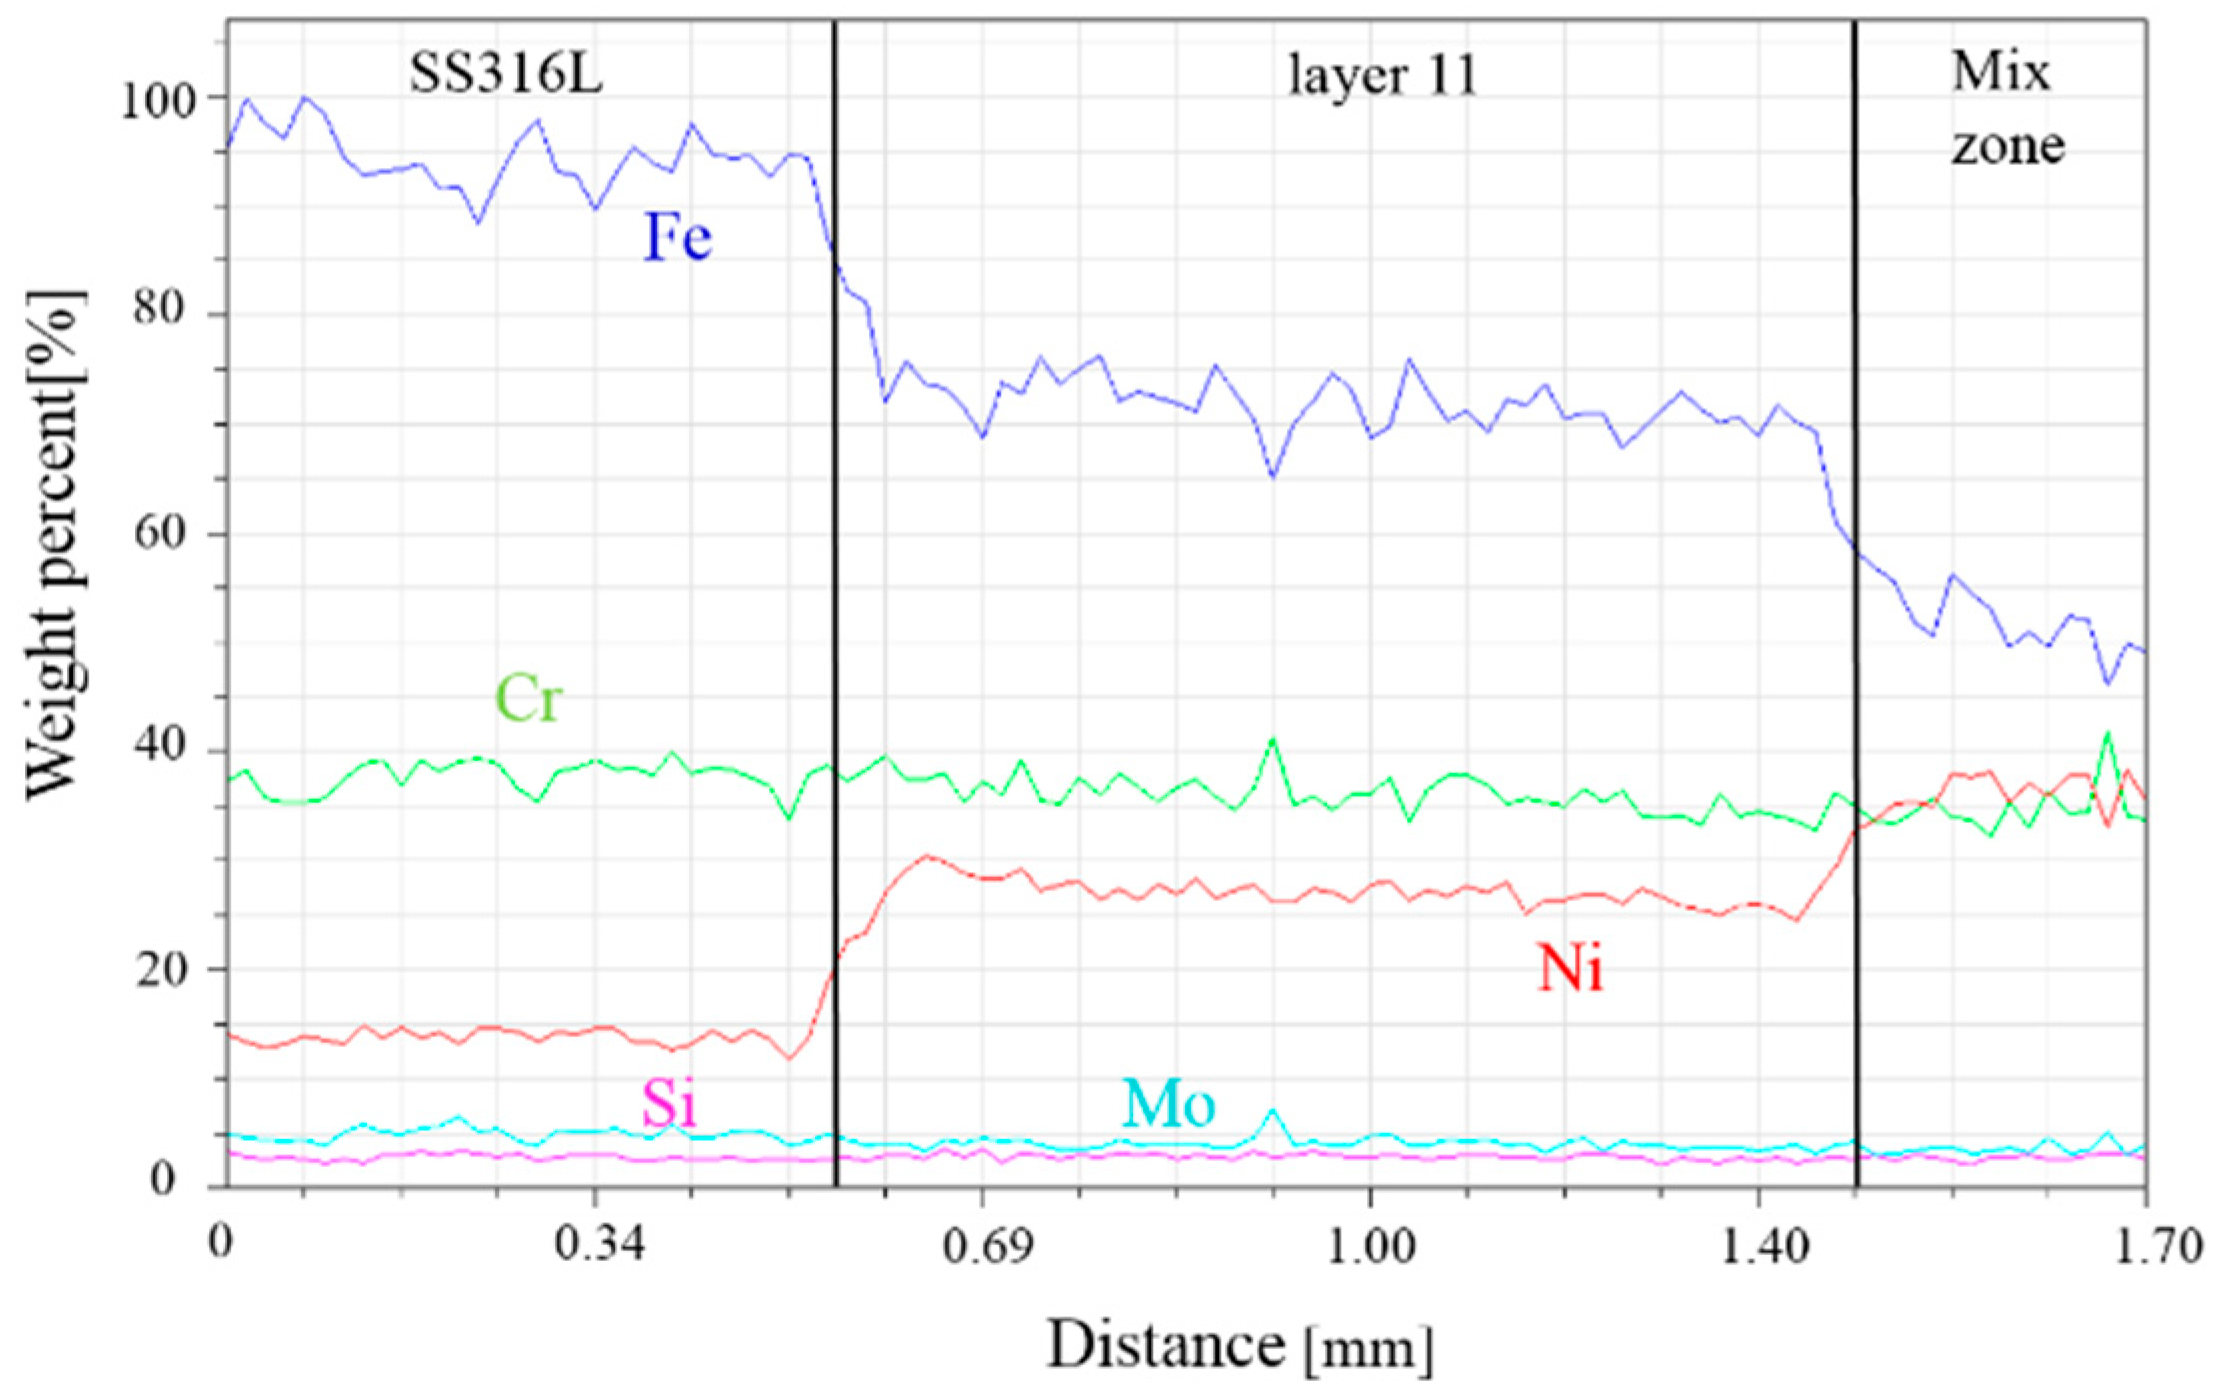
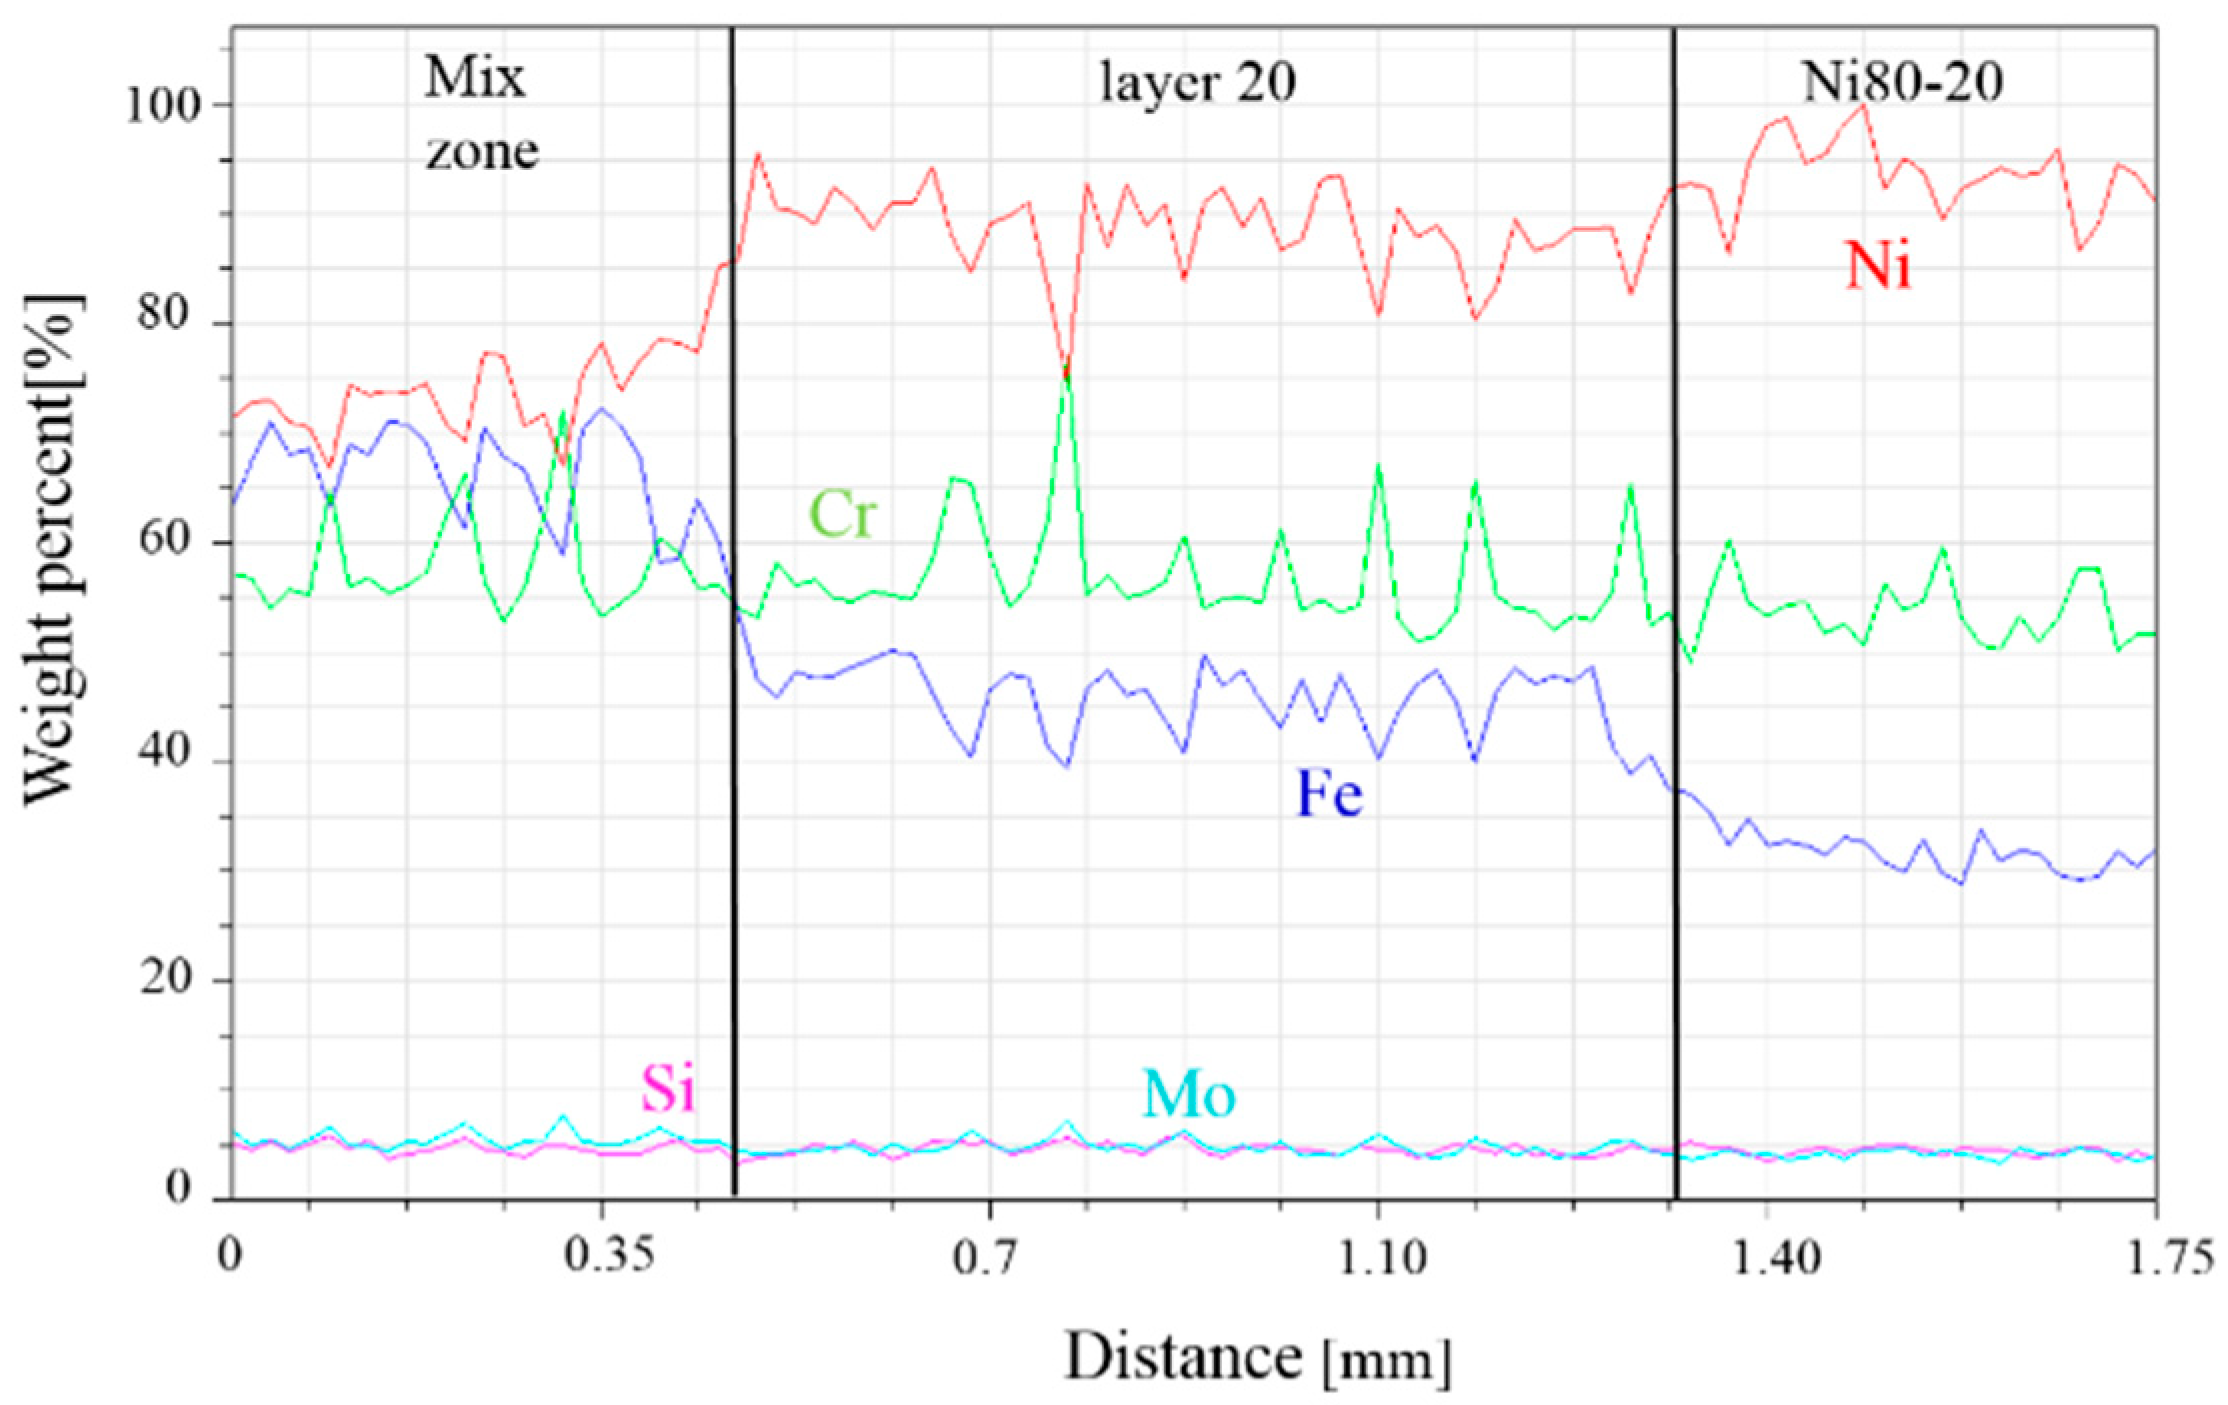
Figure 11 depicts the XEDS line scan across the interface between the SS316L and the mixed zone (Figure 3, rectangle b). Similar to the HT sample, only significant variations in the Fe and Ni content were observed. The %D for the layer 11 is 54%. For the other interface (Figure 12), between the mixed zone and the Ni80-20 (Figure 3 rectangle c), the variation in the chemical composition is less abrupt, therefore, the %D is 24%.
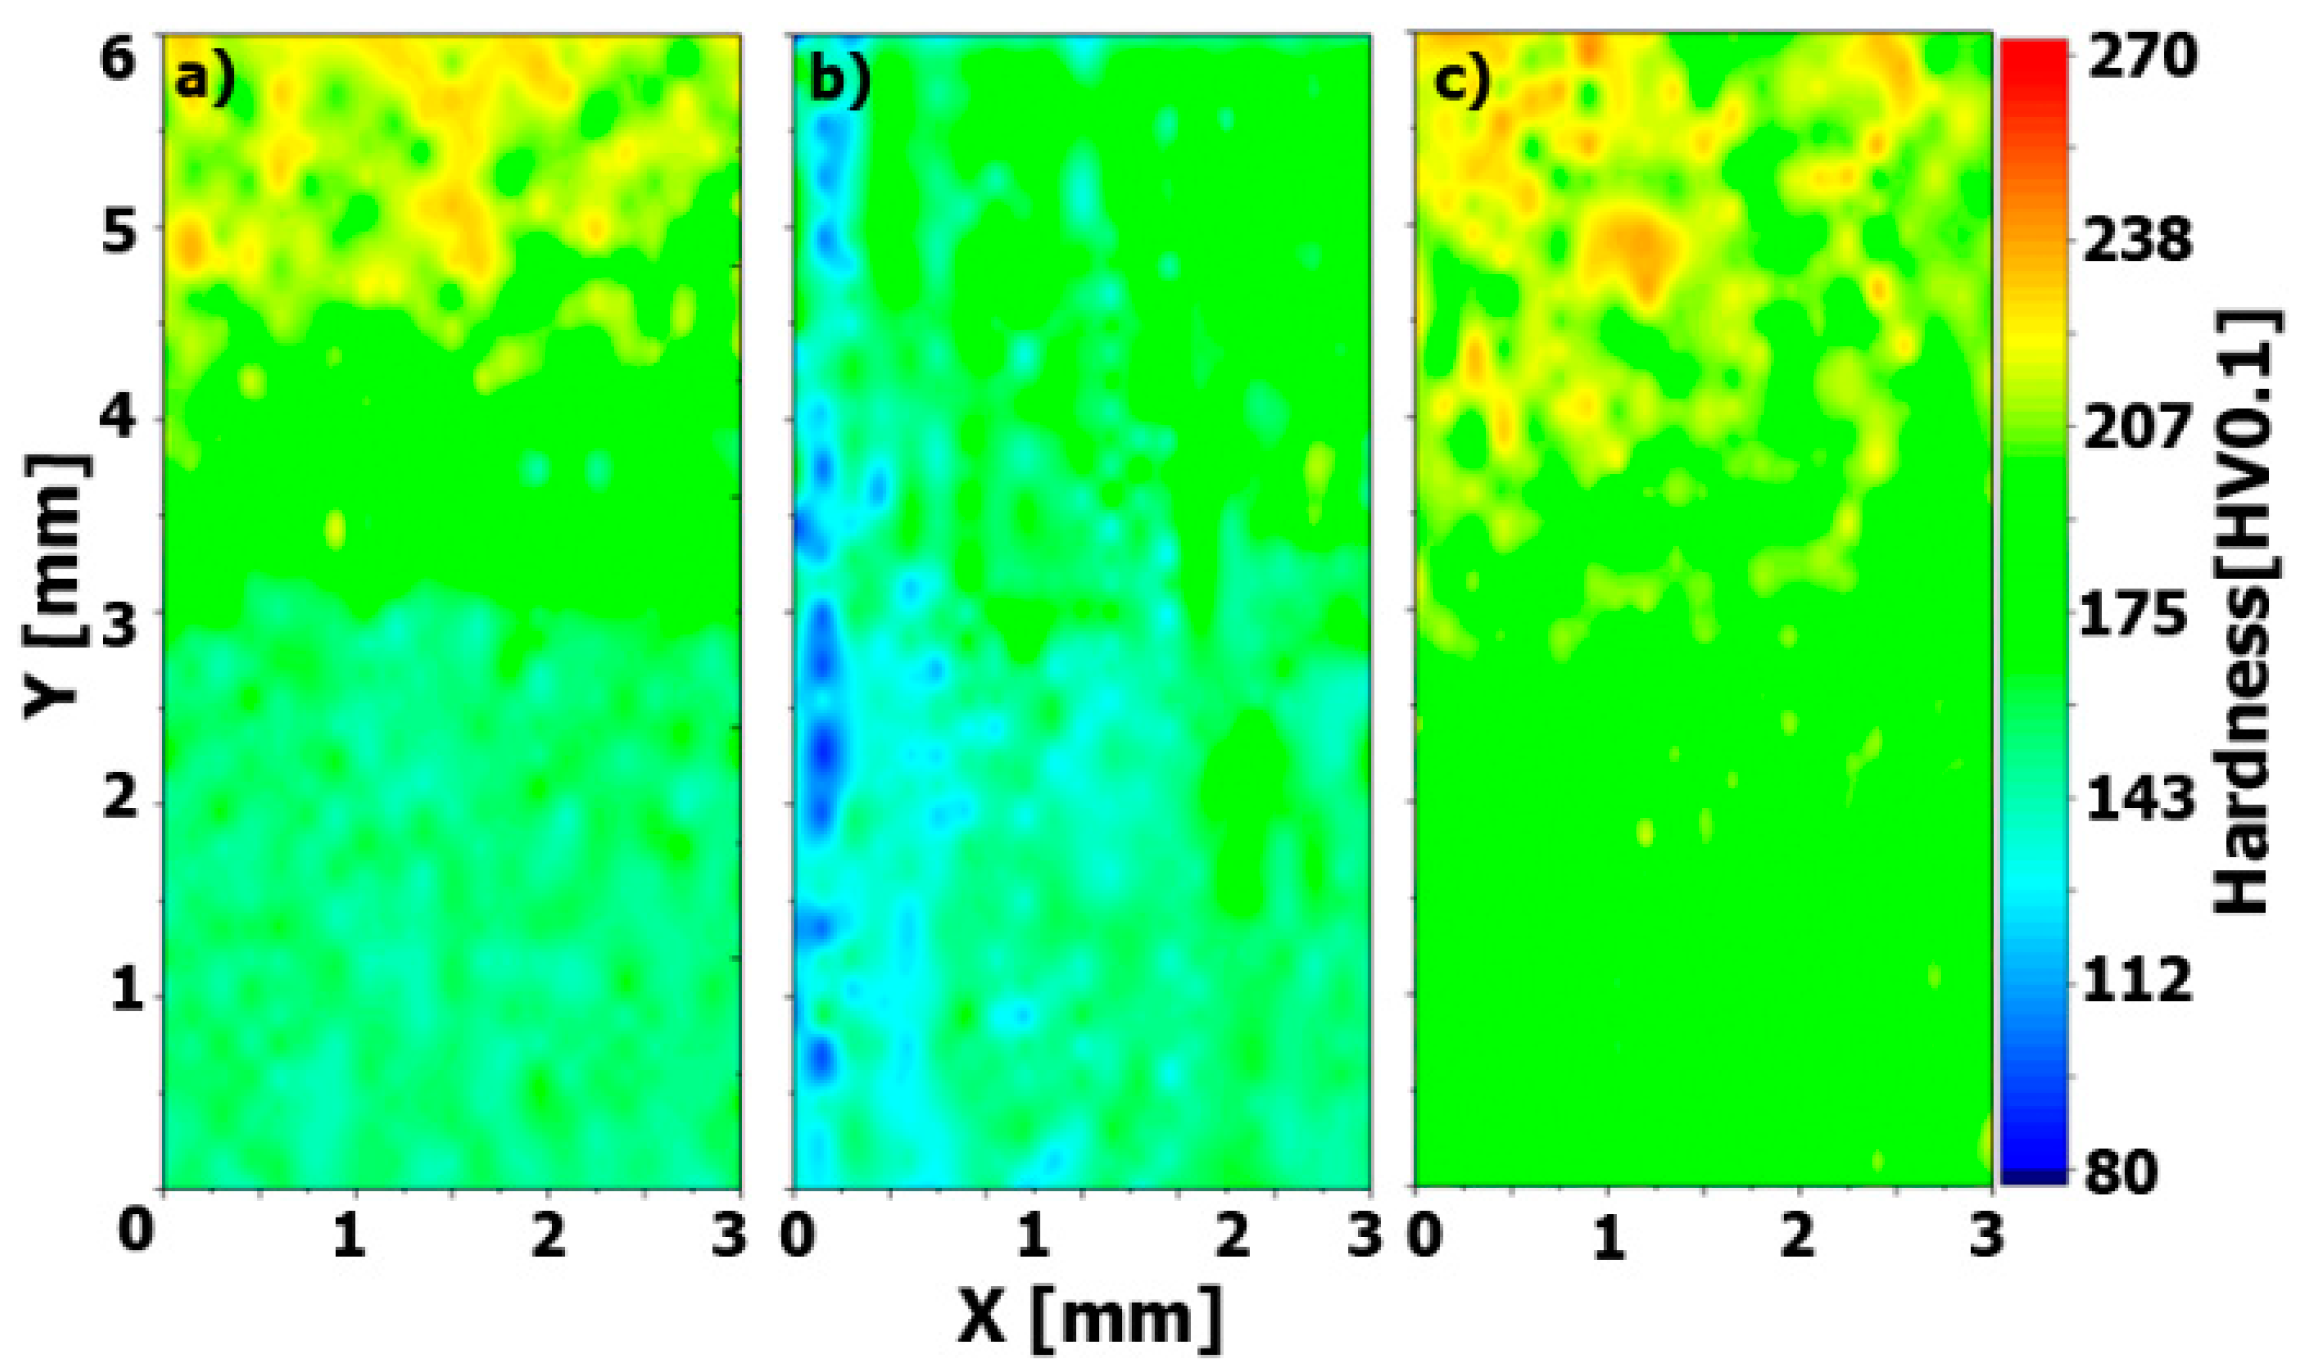
Hardness maps across the interfaces for both samples are shown in Figure 13 (taken from regions marked in Figure 3). The hardness analysis for the HT sample shows a drastic change in the mechanical properties, increasing from 150 to 230 HV0.1, approximately. Regarding the ST samples, a subtle transition of the hardness was observed (Figure 13b,c). When compared with the HT sample, small increases of the hardness values were noticed in both interfaces. The changes were around 30 HV0.1. Even though no great difference in the microstructure of both samples are observed, the degree of dilution and the hardness change across the interfaces. The hard variations in the HT sample could be a disadvantage for industrial applications of these systems.
• SS316L–Ni625 structures
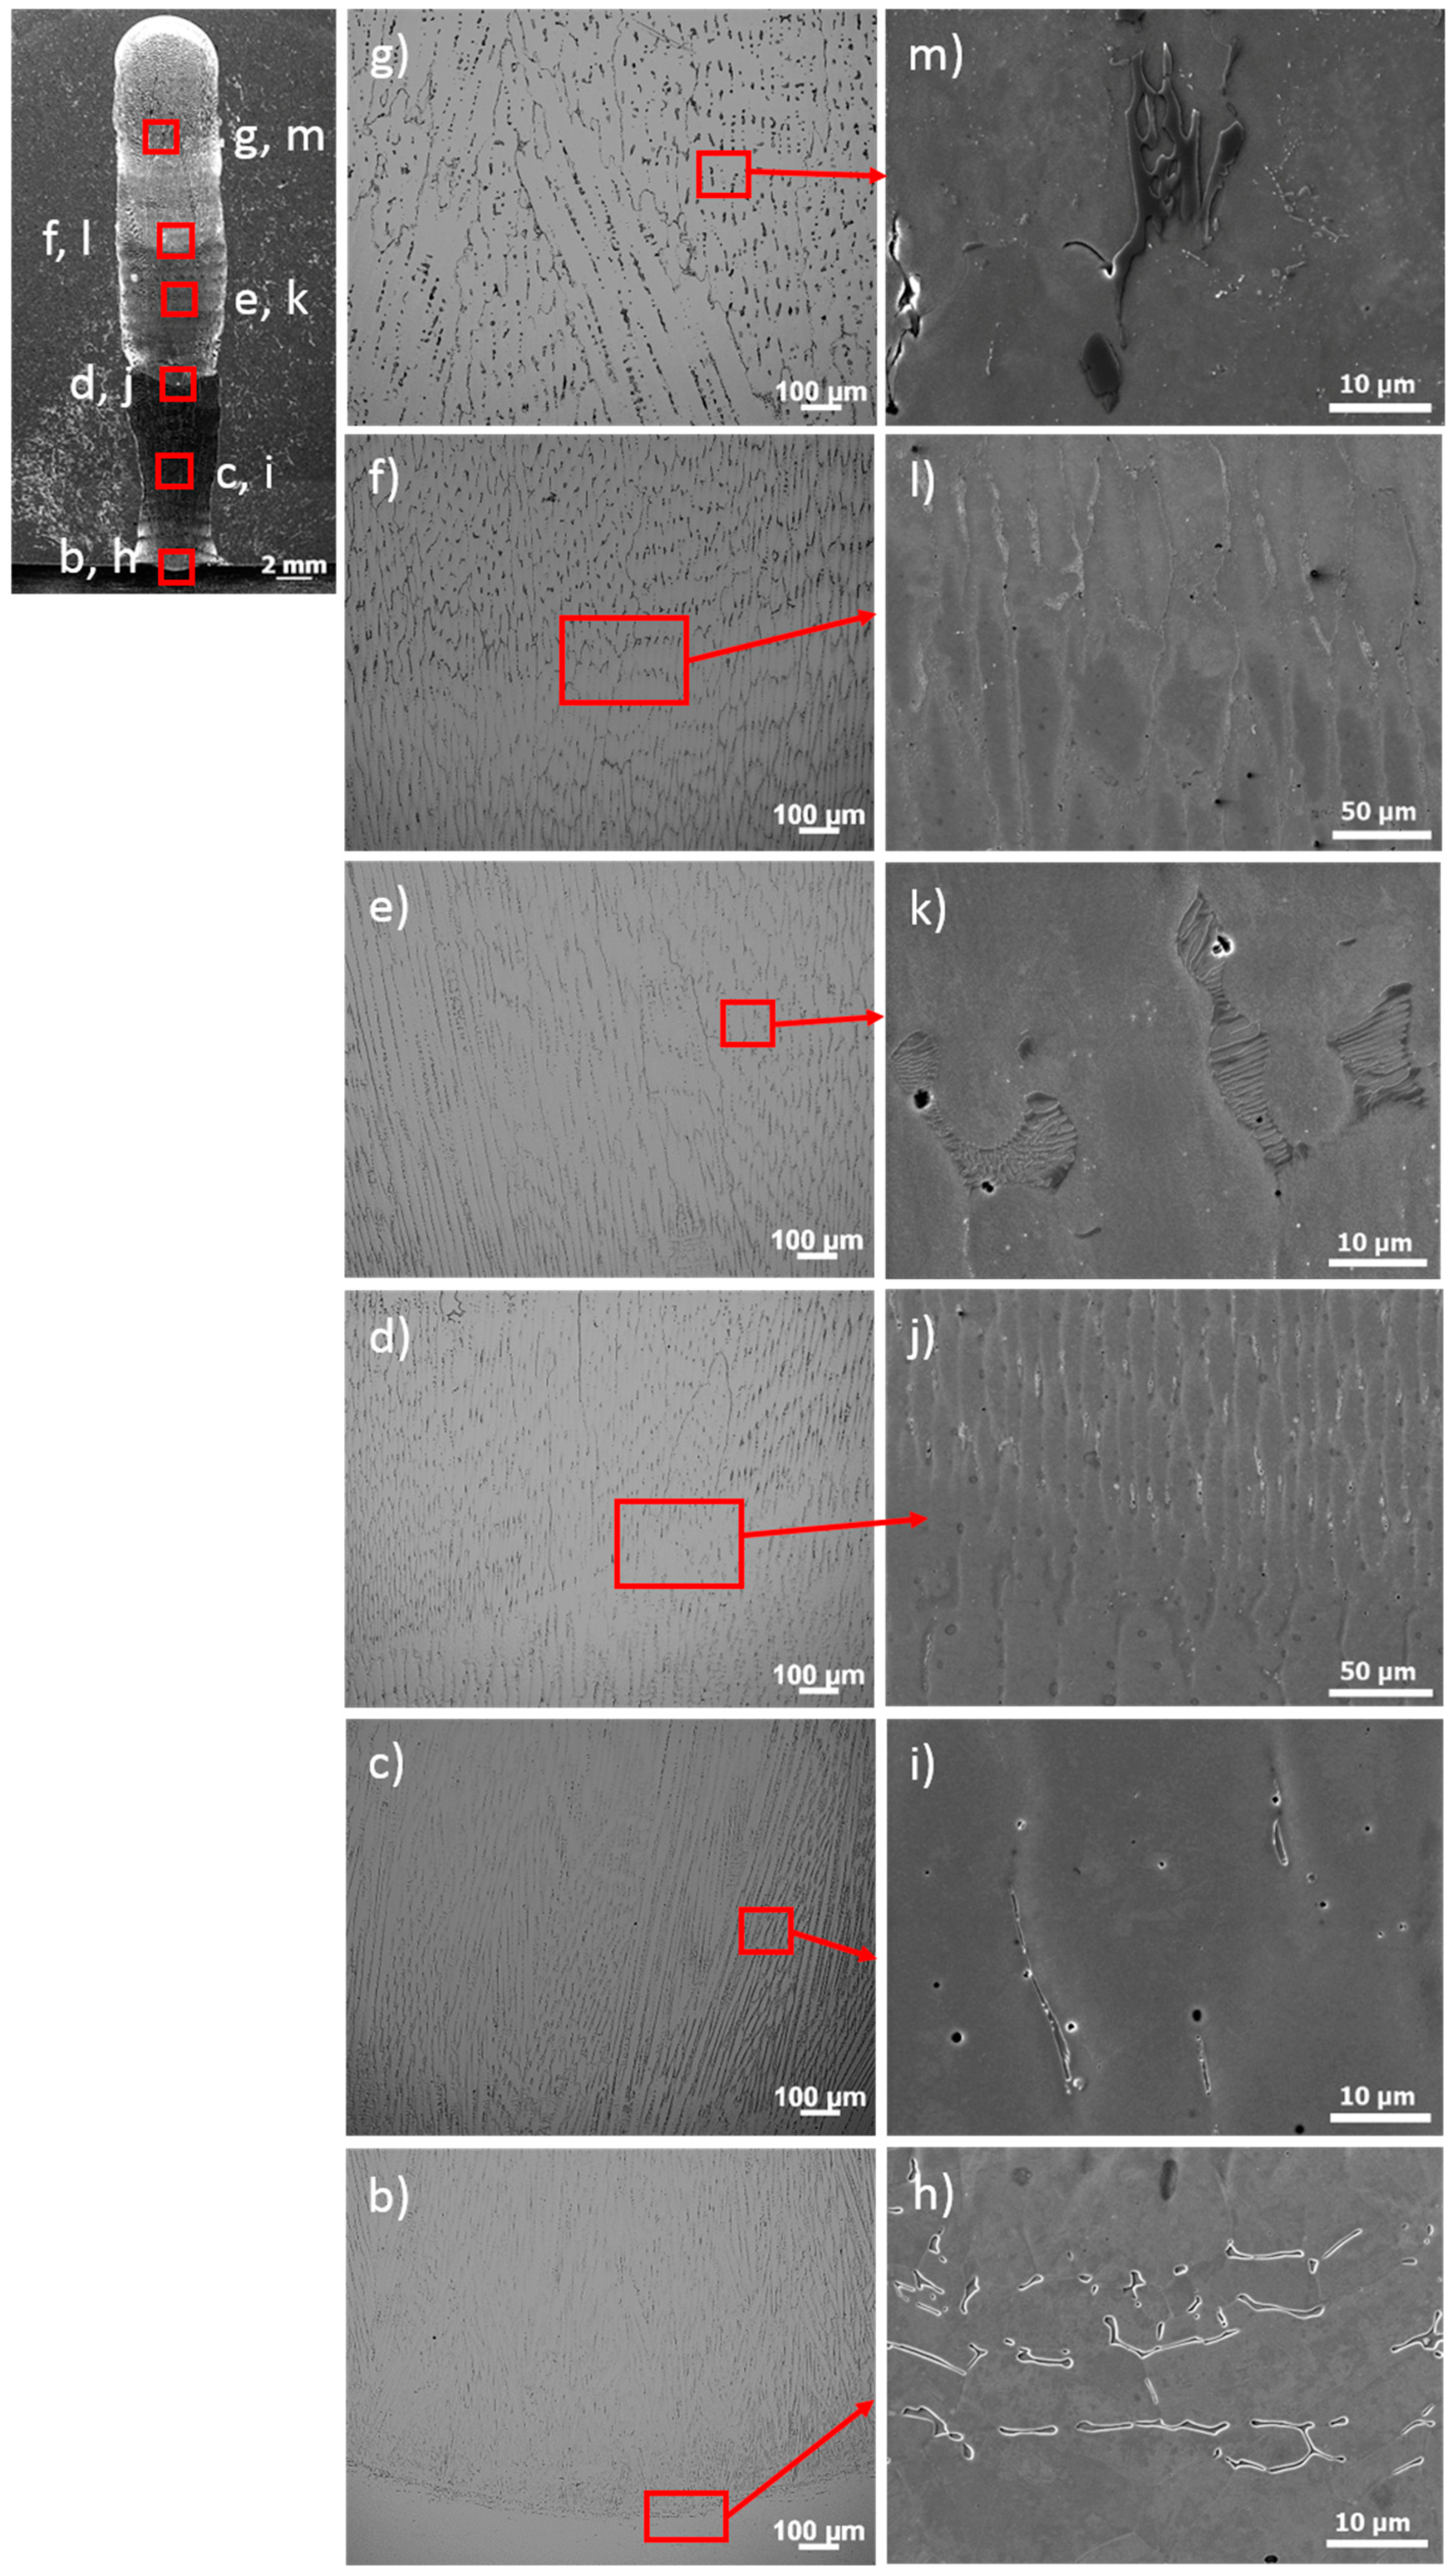
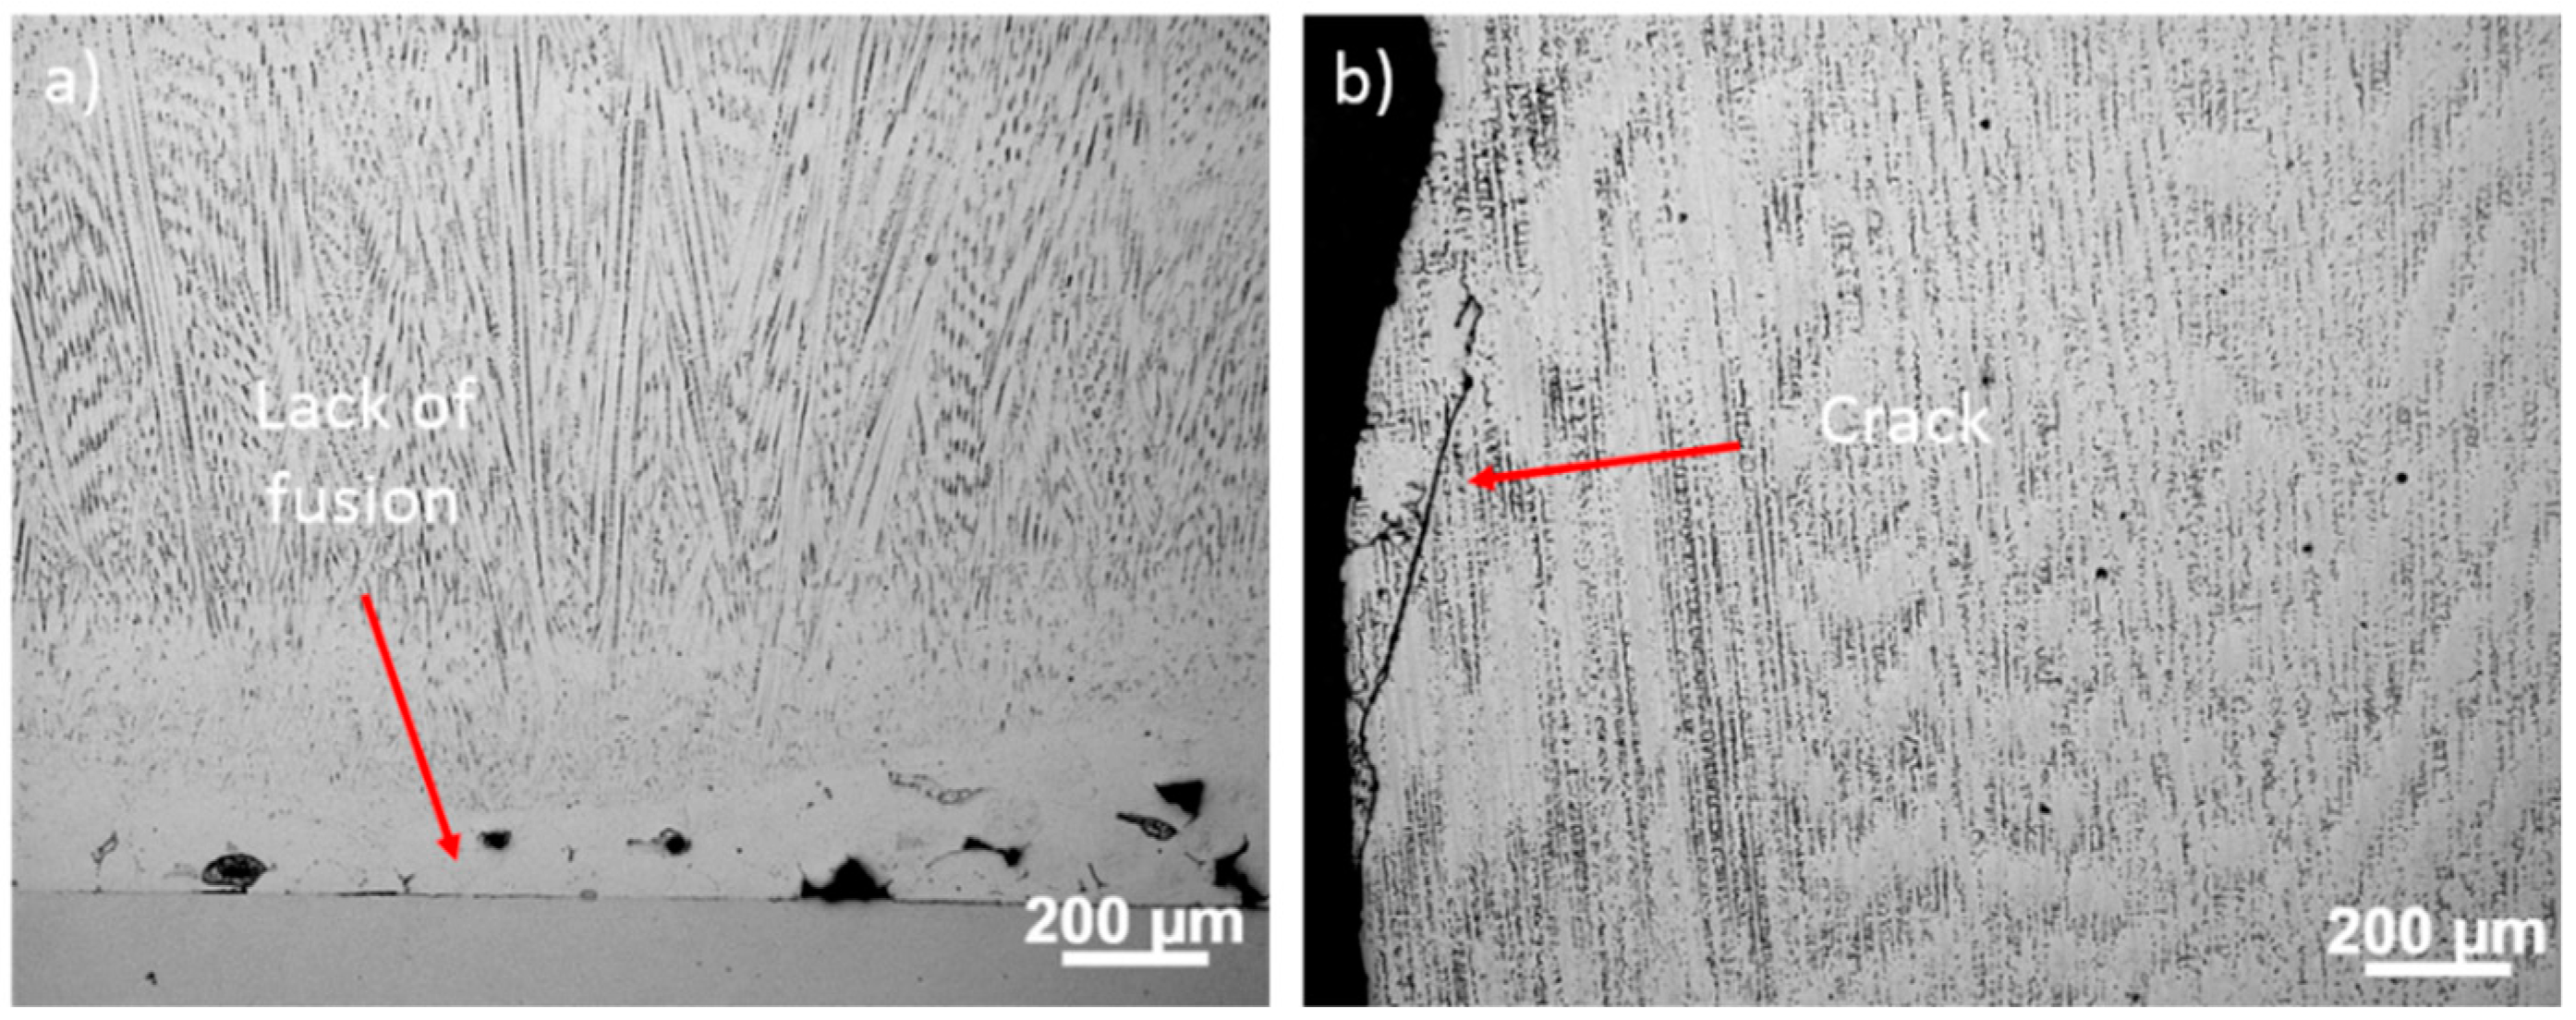
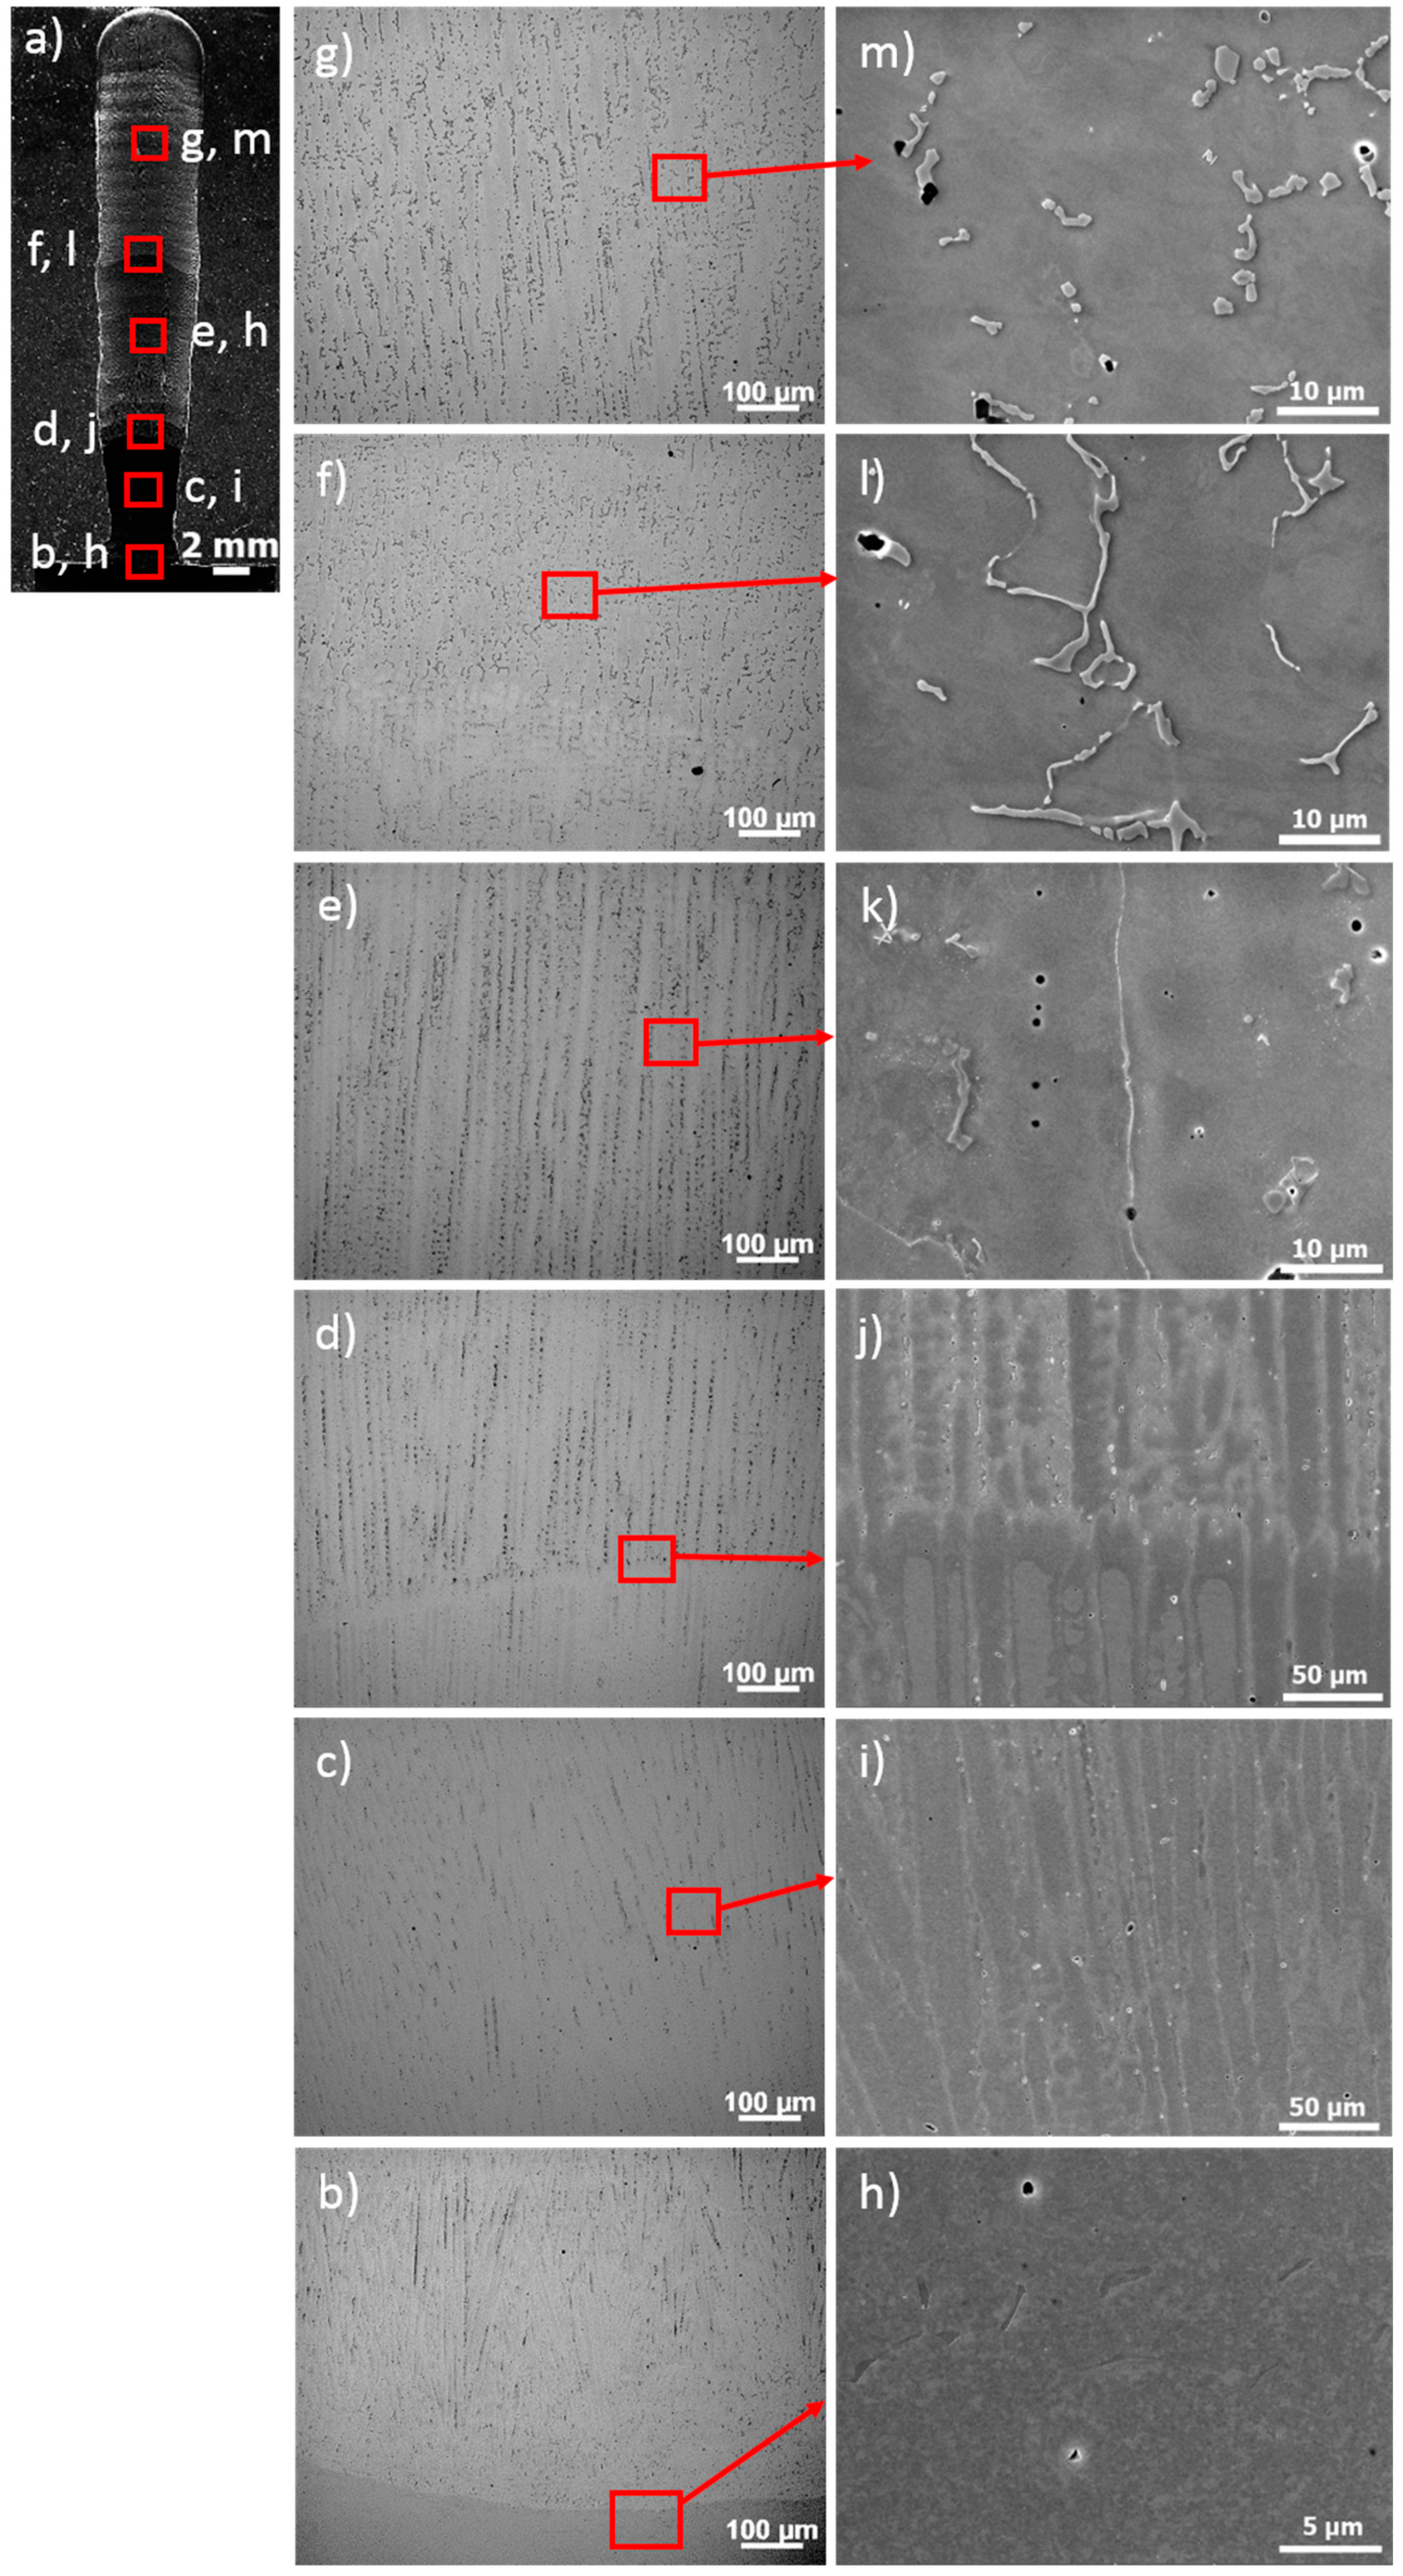
The macro analysis of the three samples fabricated for this system showed the presence of pores at the mixed zone and Ni625. In addition, lack of fusion of the SS316L on the BM and cracks in Ni625 were noticed for the low HI sample (Figure 14). Regarding the microstructural characterization for the stainless steel, no variations of the microstructure were observed with the decrease or increase of the HI. Similar to the samples built of SS316L to Ni80-20, a microstructure composed of austenite and δ-ferrite was observed. Figure 15b,h depicts the interface between the SS316L and the BM where precipitation of the δ-ferrite is noticed. The γ matrix and the δ-ferrite displayed dendritic and vermicular morphology, respectively.
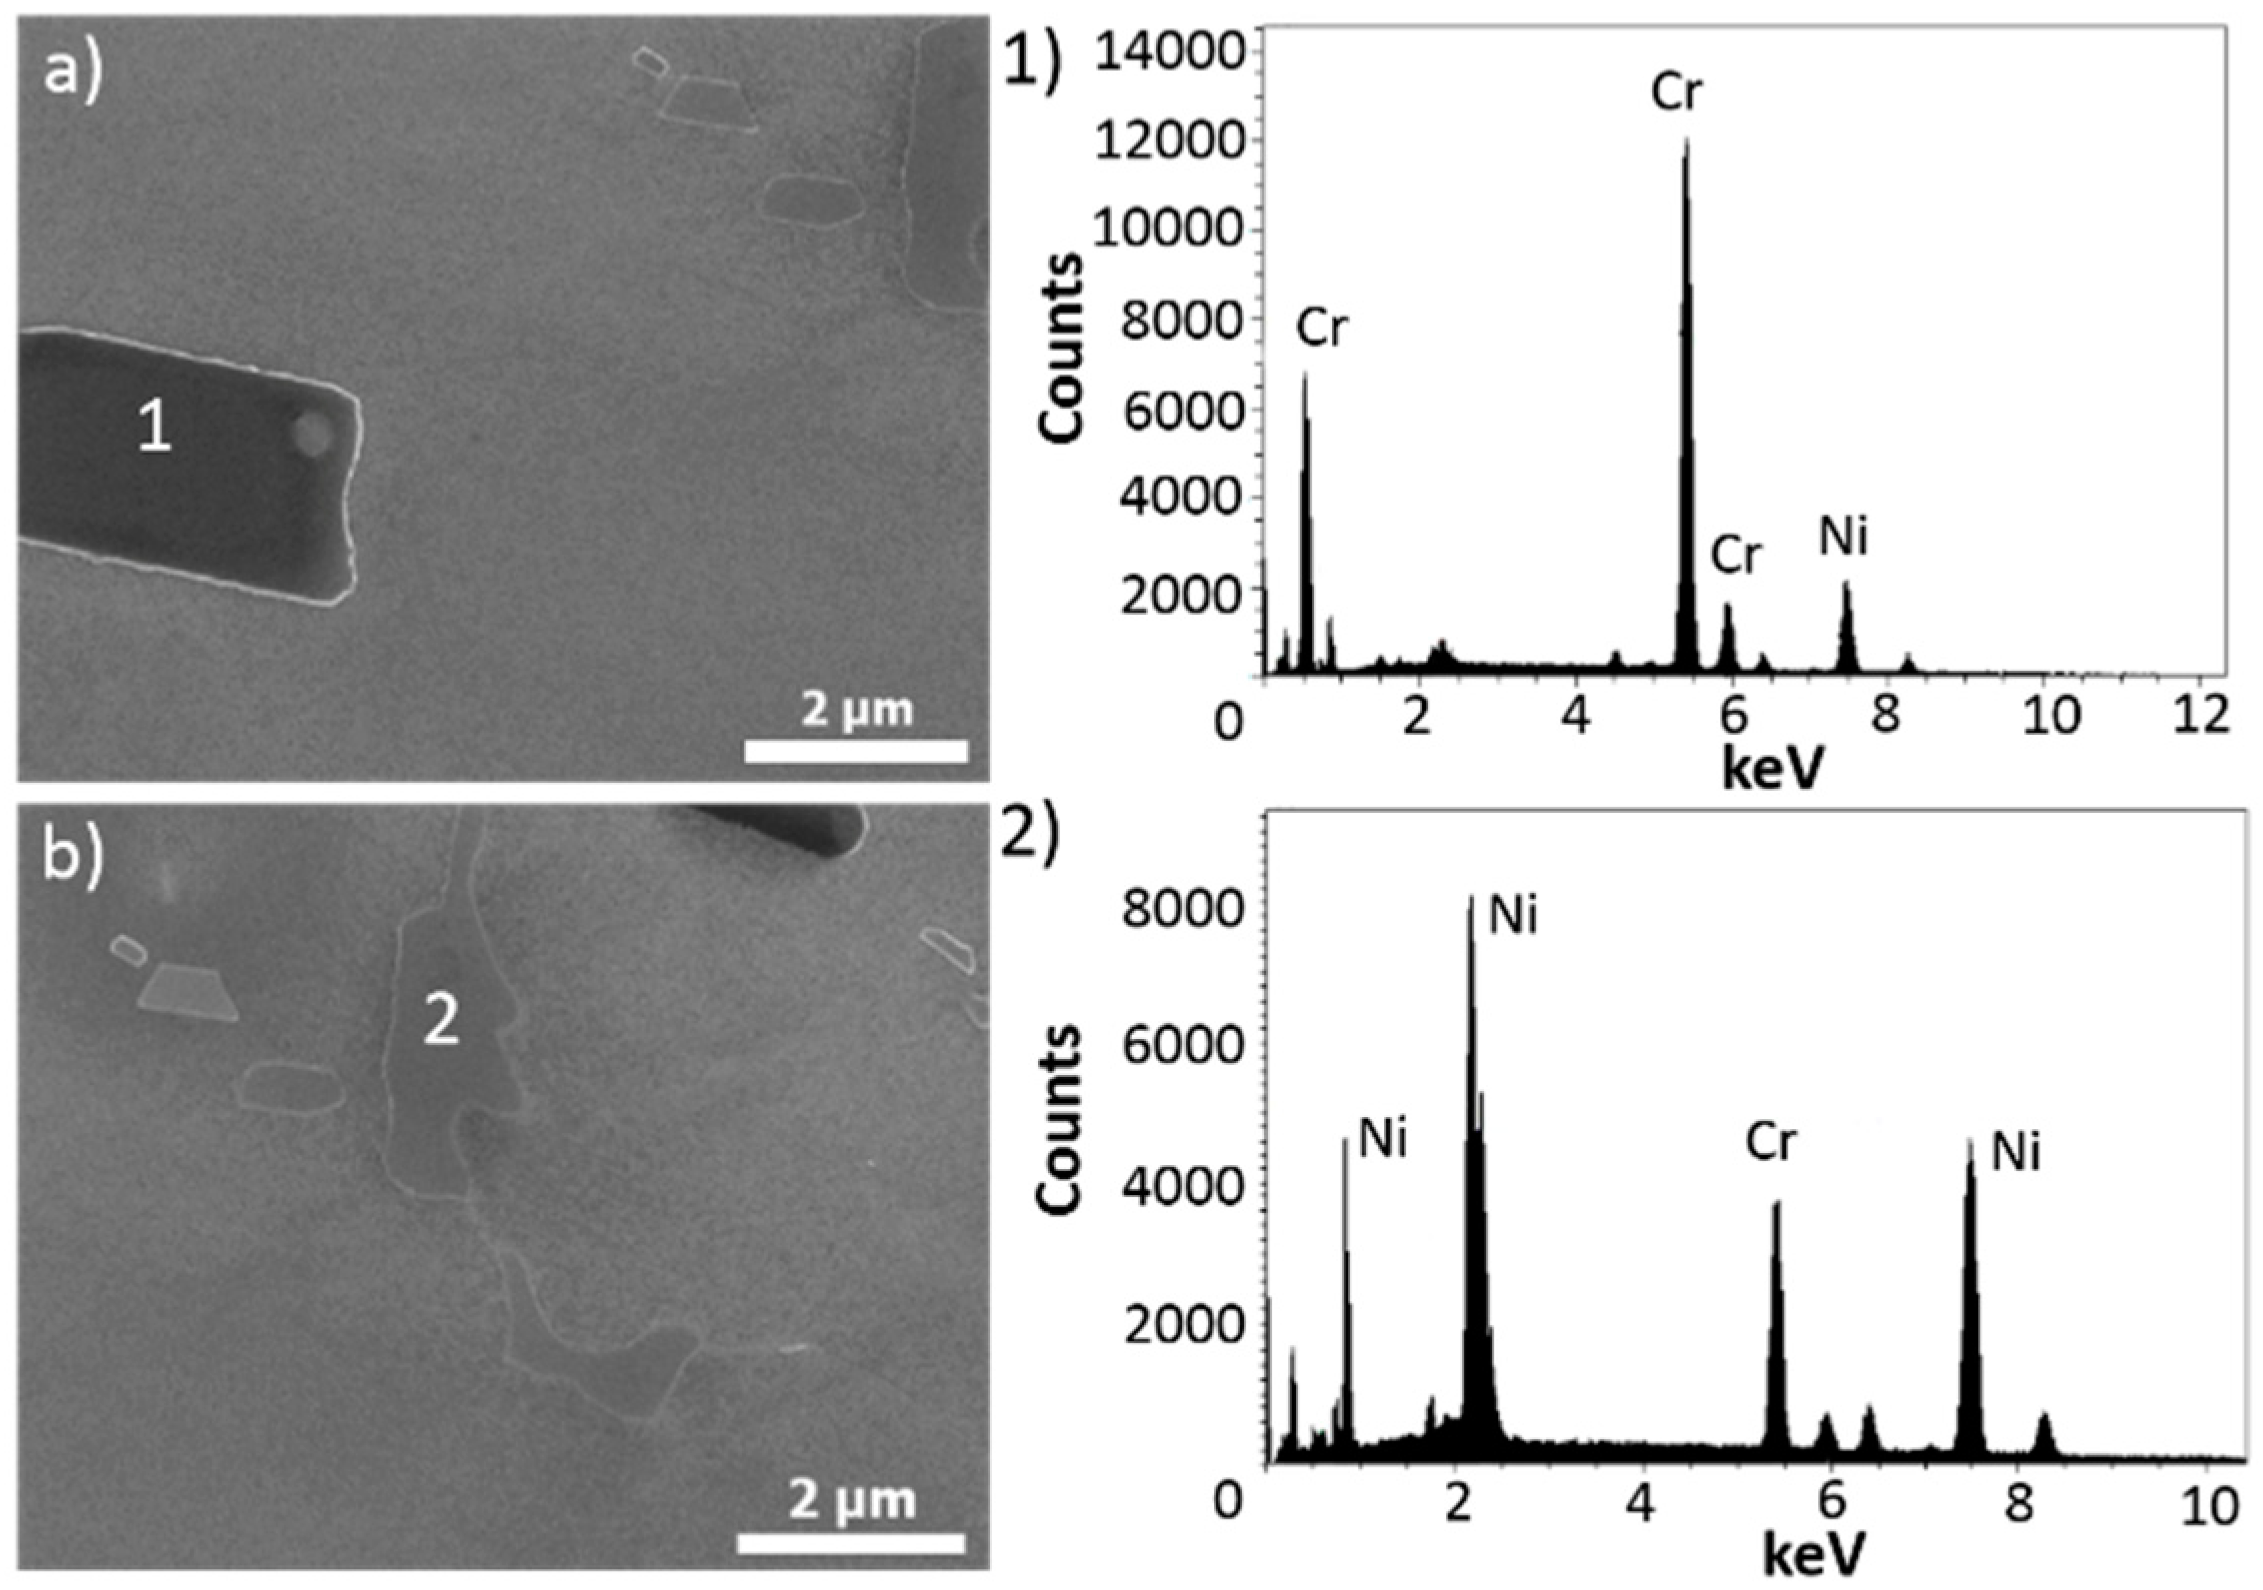
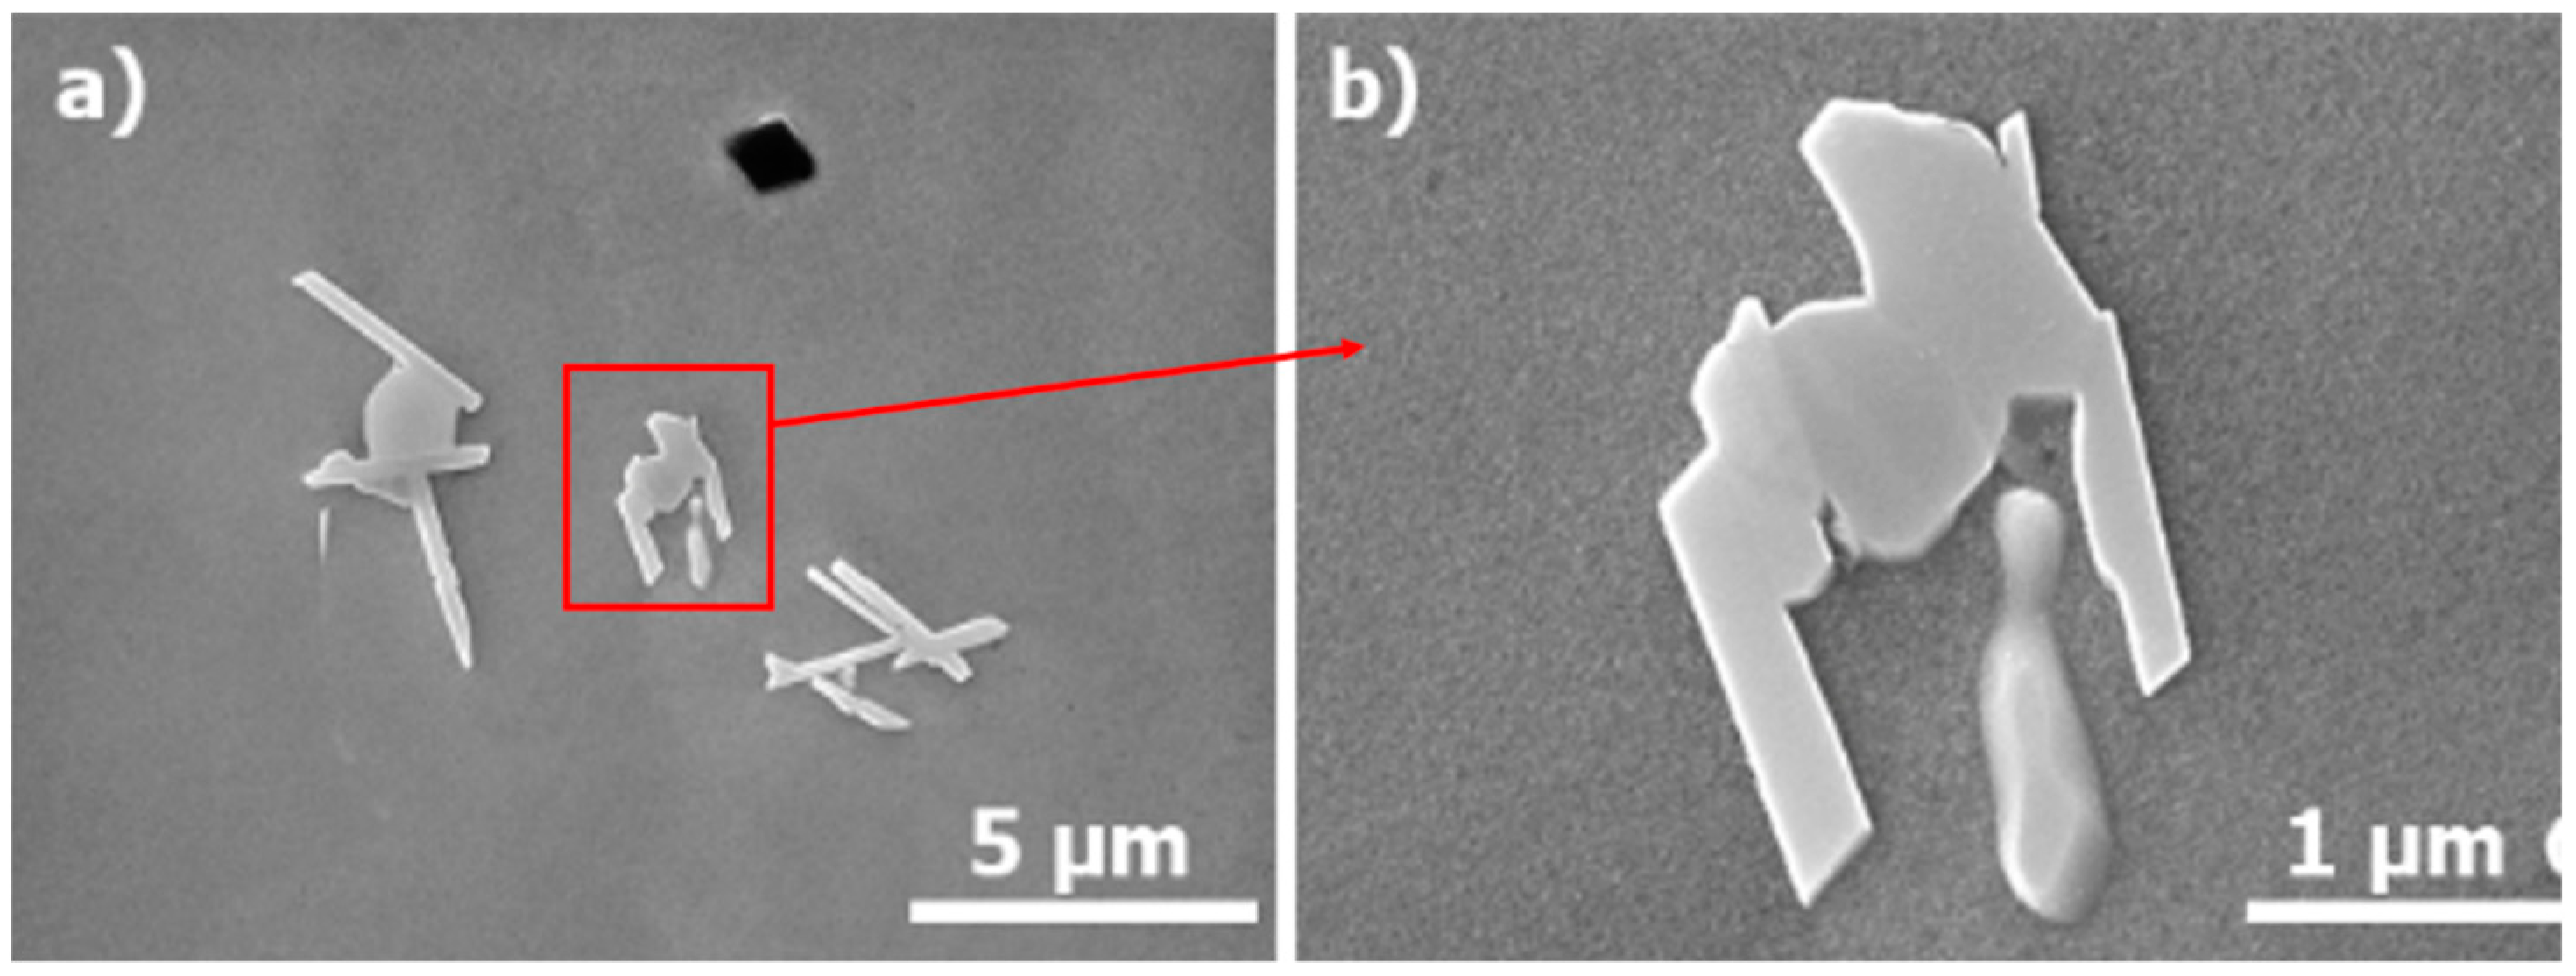
The microstructure of the as-built Ni625 was composed of an austenite (γ) matrix with secondary phases laves and δ-Ni3Nb, and precipitates M7C3. Figure 15g,h shows the dendritic morphology of the matrix and a detail view of the microstructure, respectively. The second phases were characterized by XEDS analysis and their morphology. No MC-type precipitates were observed here, mainly due to the lack of MC stabilizers like W, Ta, and Ti. The precipitates were classified as Cr7C3, as discussed for the Ni80-20 alloy (Figure 16a). According to DuPont et al. [30] the high temperature precipitates are usually replaced by intermediate temperature precipitates during thermal processing and/or high temperature service. In addition, according to the XEDS analysis the laves phase is classified as (Ni, Cr)2(Nb, Mo) and presented an irregular and blocky morphology at the grain boundaries (Figure 16b) [30]. Figure 17 depicts a needle-like phase observed in the as-deposited Ni625. Based on the morphology, this phase was identified as δ-Ni3Nb. Xu et al. [50] also reported the formation of the δ-phase during the deposition of Ni625 using a pulsed Plasma Arc Deposition Process. The δ-Ni3Nb has an orthorhombic structure (ordered Cu3Ti) and forms usually by cellular reaction at low aging temperatures and intergranular precipitation at high aging temperatures [51]. Due to the lack of coherence with the Ni matrix, therefore, not an effective strengthener, this phase is generally undesirable in the Ni-based alloys. Moreover, a loss in ductility related with embrittlement could be observed.
Based on the previous observations, the solidification sequence was analyzed for the as-deposited Ni625. The solidification process starts with the primary reaction L → γ, causing the segregation of Cr, Nb, and Mo to interdendritic spaces and grain boundaries. Thus, the precipitation of secondary phases like M7C3 and δ-Ni3Nb is promoted in these regions. Then, the subsequent formation of M7C3 consumes most of the carbon available until the reaction L → γ + laves + δ occurs, finishing the solidification process [52].
The interfaces of the mixed zone with the SS316L and the Ni625, are shown in Figure 15d,f, respectively. Similar to the Ni-based alloy on the top, the microstructure of the mixed was composed of an γ matrix with laves, M7C3 and δ-Ni3Nb. However, no significant variations in the microstructure of the mixed zone was noticed, but changes in the morphology of the phases. The mixed zone matrix exhibited a dendritic morphology with secondary phases at the grain boundaries (Figure 15j,k,l). The laves phase presented a more continuous morphology at the grain boundaries, as shown in Figure 15l.
Regarding the difference in the microstructure of the three samples, the change in the heat input did not cause significant variations either in the type of phases nor in their morphology. Table 5 shows the dilution percentage of the interfaces for the three samples of the SS316L to Ni625 system. The dilution percentage was calculated using the chemical composition obtained by XEDS. Similar results were observed for all the samples, with high dilution percentage for the interface between the SS316L and Ni625. However, due to the decrease of the heat input for one sample, a drop in the %D was observed. Moreover, for the three samples the percentage of dilution of the mixed zone to Ni625 interfaces is lower than the interfaces SS316L to mixed zone. The XEDS profile for the standard HI sample is shown in Figure 18, where the interfaces SS316L to mixed zone and mixed zone to Ni625 are located on the left and right, respectively. Noteworthy variations are observed in the Fe, Ni, and Cr profiles. However, the Cr profile was roughly constant throughout the interfaces. Similar results were noticed for the Mo, Si, and Nb. For the other two samples, similar XEDS profiles were obtained.
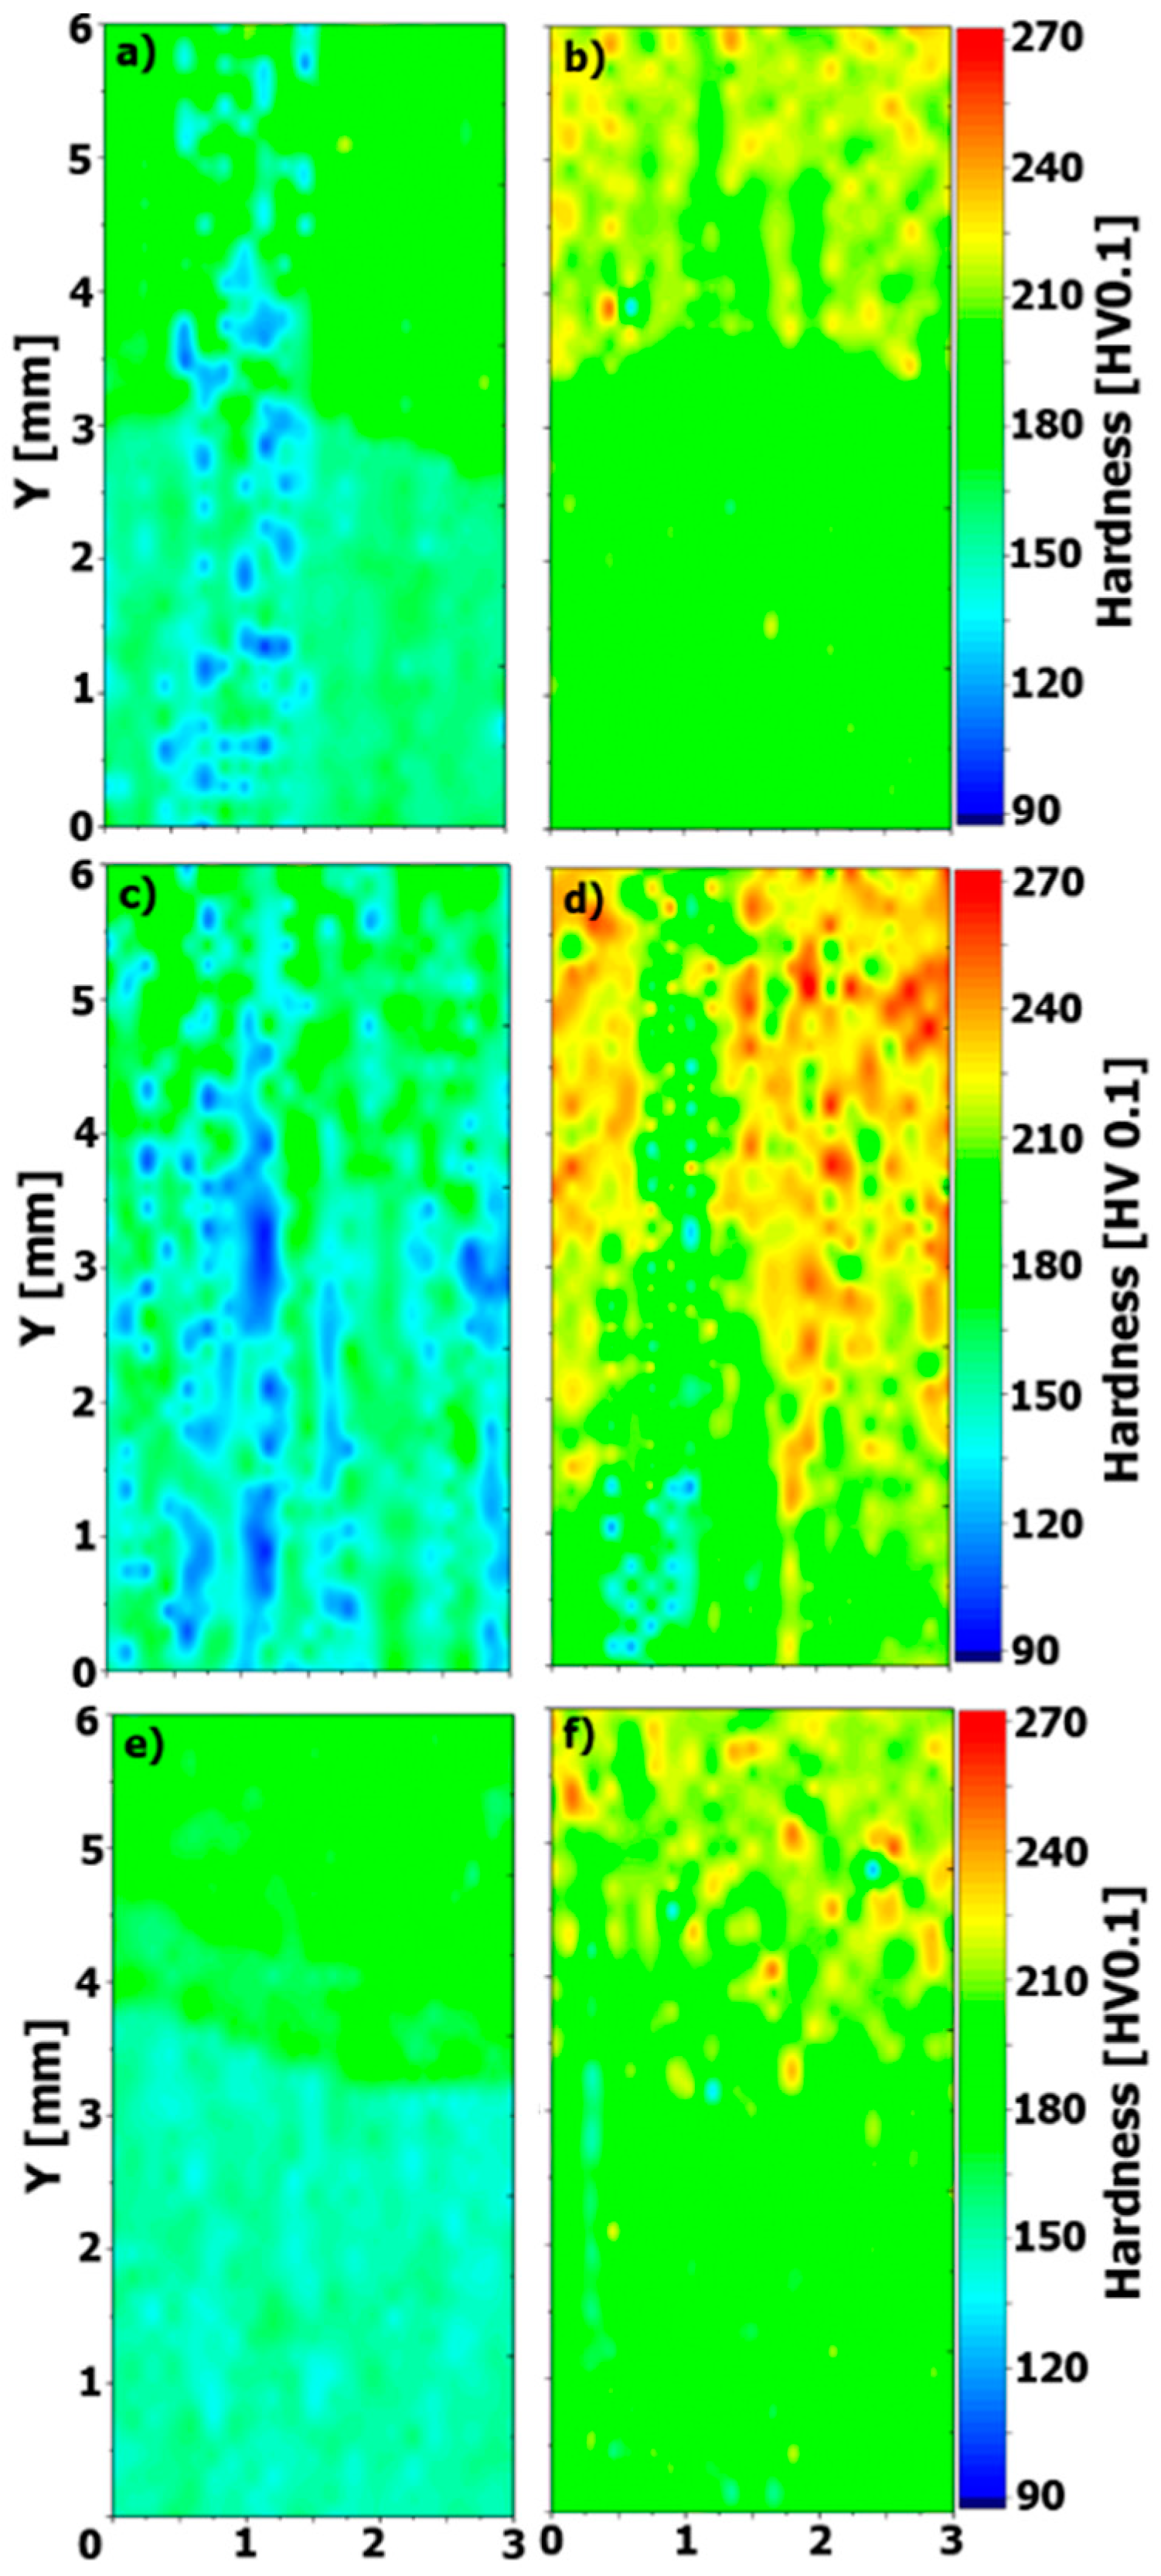
The hardness measurements for the three samples of the system SS316L to Ni625 are shown in Figure 19 (taken from regions marked in Figure 3). It is possible to see the changes in the material for the interfaces SS316L to mixed zone Figure 19a,e; except for the standard heat input where some zones presented low hardness values Figure 19c. The values are between 120 and 180 HV0.1. On the other hand, the interface between the mixed zone and the Ni625 depicted a higher hardness values, between 180 and 270 HV0.1. The as-deposited Ni625 of the standard heat input showed a higher hardness.
4. Conclusions
Functionally graded structures of SS316L to Ni80-20 and SS316L to Ni625 were fabricated by 3D Plasma Metal Deposition. The structures exhibited a homogeneous layer without any external delaminations or cracks. However, some pores were observed at the Ni-based.
Regarding the SS316L to Ni80-20 structures, the hard transition and smooth transition configurations were investigated. The smooth transition showed a better performance due to a continuous change in the chemical composition of the structures. The SS316L to Ni625 configuration did not show significant variations on the microstructure with the change of the heat input.
Different microstructures were recognized in the 3D structures. In the austenitic stainless steel an austenite (γ) matrix with δ-phase, product of the AF solidification mode was observed. The Ni80-20 exhibit austenite (γ) matrix with some M7C3 precipitates and laves phase. On the other hand, the as-deposited Ni625 showed an austenite (γ) matrix with laves, M7C3 and δ-Ni3Nb. In the mixed zones for both configurations similar microstructures were noticed, however, changes in the morphology were observed.
Author Contributions
Conceptualization: J.R.; K.H.; A.H.; P.M.; methodology: J.R.; K.H.; A.H.; validation: J.R.; K.H.; A.H.; formal analysis: J.R.; K.H.; investigation: J.R.; K.H.; writing—original draft preparation: J.R.; K.H.; writing—review and editing: J.R.; K.H.; A.H.; P.M.; visualization: J.R.; supervision: P.M.; project administration: P.M.
Funding
This research received no external funding.
Acknowledgments
The authors would like to thank all the members of the Institute of Joining and Assembly for the support during the development of this work. J.R. would like to thank the financial funding of the German Academic Exchange Service (DAAD) for the scholarship Research Stays for University Academics and Scientists, 2018 (57381327). In addition, special thanks to Gökhan Ertugrul and Kevin Abstoß for the support during the experimental work.
Conflicts of Interest
The authors declare no conflict of interest. The funders had no role in the design of the study; in the collection, analyses, or interpretation of data; in the writing of the manuscript; or in the decision to publish the results.
References
- Bandyopadhyay, A.; Krishna, B.V.; Xue, W.; Bose, S. Application of laser engineered net shaping (LENS) to manufacture porous and functionally graded structures for load bearing implants. J. Mater. Sci. Mater. Med. 2009, 20, 29–34. [Google Scholar] [CrossRef]
- Parthasarathy, J.; Starly, B.; Raman, S. A design for additive manufacture of functionally graded porous structures with tailored mechanical properties for biomedical applications. J. Manuf. Process. 2011, 13, 160–170. [Google Scholar] [CrossRef]
- Murr, L.E.; Gaytan, S.M.; Martinez, E.; Medina, F.; Wicker, R.B. Metal fabrication by additive manufacturing using laser and electron beam melting technologies. Int. J. Biomater. 2012, 28, 1–14. [Google Scholar] [CrossRef]
- Popovich, V.A.; Borisov, E.V.; Popovich, A.A.; Sufiiarov, V.S.; Masaylo, D.V.; Alzina, L. Functionally graded Inconel 718 processed by additive manufacturing: Crystallographic texture, anisotropy of microstructure and mechanical properties. Mater. Des. 2017, 114, 441–449. [Google Scholar] [CrossRef]
- Hoefer, K.; Nitsche, A.; Abstoss, K.G.; Ertugrul, G.; Haelsig, A.; Mayr, P. Multi-Material additive manufacturing by 3D plasma metal deposition for graded structures of super duplex alloy 1.4410 and the austenitic corrosion resistant alloy 1.4404. JOM 2019. [Google Scholar] [CrossRef]
- Sampath, S.; Herman, H.; Shimoda, N.; Saito, T. Thermal spray processing of FGMs. MRS Bull 1995, 20, 27–31. [Google Scholar] [CrossRef]
- Suresh, S.; Giannakopoulos, A.E.; Alcalá, J. Sherical indentation of compositionally graded materials: Theory and experiments. Acta Mater. 1997, 45, 1307–1321. [Google Scholar]
- Giannakopoulos, A.E.; Suresh, S. Indentation of solids with gradients in elastic properties: Part II axisysmmetric indentors. Int. J. Solids. Struct. 1997, 34, 2393–2428. [Google Scholar] [CrossRef]
- Giannakopoulos, A.E.; Suresh, S.; Finot, M.; Olsson, M. Elastoplastic analysis of thermal cycling: Layered materials with compositional gradients. Acta Metall. Mater. 1995, 43, 1335–1354. [Google Scholar] [CrossRef]
- Williamson, R.L.; Rabin, R.H.; Drake, J.T. Finite elements analysis of thermal residual stresses at graded ceramic-metal interfaces. J. Appl. Phys. 1993, 74, 1310–1320. [Google Scholar] [CrossRef]
- Drake, J.T.; Williamson, R.L.; Rabin, R.H. Finite elemete analysis of thermal residual stresses at graded ceramic-metal interfaces—part II microstructure. J. Appl. Phys. 1993, 74, 1321–1326. [Google Scholar] [CrossRef]
- Erdogan, F. Fracture mechanics of functionally graded materials. Compos. Eng. 1995, 5, 753–770. [Google Scholar] [CrossRef]
- ISO/ASTM 52900:2015 (ASTM F2792). Additive manufacturing—General principles—Terminology. International Organization for Standardization. Available online: https://www.iso.org/standard/69669.html (accessed on 28 April 2019).
- Jhavar, S.; Jain, N.K.; Paul, C.P. Development of micro-plasma transferred arc (µ-PTA) wire deposition process for additive layer manufacturing applications. J. Mater. Process Tech. 2014, 214, 1102–1110. [Google Scholar] [CrossRef]
- Zou, H.; Zhang, H.; Wang, G.; Li, J. Rapid manufacturing of FGM components by using electromagnetic compressed plasma deposition. In Proceedings of the Electromagnetics Research Symposium, Moskva, Russia, 18–21 August 2009. [Google Scholar]
- Hoefer, K.; Hälsig, A.; Mayr, P. Arc-based additive manufacturing of steel components—comparison of wire- and powder-based variants. Weld World 2018, 62, 243–247. [Google Scholar] [CrossRef]
- Hoefer, K.; Mayr, P. 3DPMD – Additive manufacturing of titanium parts using 3D plasma metal deposition. Mater. Sci. Forum 2018, 941, 2137–2141. [Google Scholar] [CrossRef]
- Hoefer, K.; Teichgraeber, C.; Mayr, P.; Berger, M. Arc-based additive Manufacturing—3DPMD (Generative Fertigung mit Lichtbogenprozessen). In Fümotec 2017; Mayr, P., Berger, M., Eds.; Chemnitz University of Technology: Chemnitz, Germany, 2017; pp. 1–14. (In German) [Google Scholar]
- Chen, X.; Li, J.; Cheng, X.; He, B.; Wang, Y.; Huang, Z. Microstructure and mechanical properties of the austenitic stainless steel 316L fabricated by gas metal arc additive manufacturing. Mater. Sci. Eng. 2017, 703, 567–577. [Google Scholar] [CrossRef]
- Feng, Y.; Luo, Z.; Liu, Z.; Li, Y.; Luo, Y.; Huang, Y. Keyhole gas tungsten arc welding of AISI 316L stainless steel. Mater. Des. 2015, 85, 24–31. [Google Scholar] [CrossRef]
- Soltani, H.M.; Tayebi, M. Comparative study of AISI 304L to AISI 316L stainless steels joints by TIG and Nd:YAG laser welding. J. Alloy Compd. 2018, 767, 112–121. [Google Scholar] [CrossRef]
- ElCheikh, H.; Courant, B.; Branchu, S.; Huang, X.; Hasco, J.Y.; Guille, R. Direct laser fabrication process with coaxial powder projection of 316L steel. Opt. Lasers Eng. 2012, 50, 1779–1784. [Google Scholar] [CrossRef]
- Järvinen, J.P.; Matilainen, V.; Li, X.; Piili, H.; Salminen, A.; Mäkelä, I.; Nyrhilä, O. Characterization of effect of support structures in laser additive manufacturing of stainless steel. Phys. Procedia 2014, 56, 72–81. [Google Scholar] [CrossRef]
- Yadollahi, A.; Shamsaei, N.; Thompson, S.M.; Seely, D.W. Effects of process time interval and heat treatment on the mechanical and microstructural properties of direct laser deposited 316L stainless steel. Mater. Sci. Eng. A 2015, 644, 171–183. [Google Scholar] [CrossRef]
- Zhao, J.; Zhang, B.; Li, X.; Li, R. Effects of metal-vapor jet force on the physical behavior of melting wire transfer in electron beam additive manufacturing. J. Mater. Process. Technol. 2015, 220, 243–250. [Google Scholar] [CrossRef]
- Skiba, T.; Baufeld, B.; Biest, O.V.D. Microstructure and mechanical properties of stainless steel component manufactured by shaped metal deposition. ISIJ Int. 2009, 49, 1588–1591. [Google Scholar] [CrossRef]
- Lippold, J.C.; Kotecki, D.J. Welding Metallurgy and Weldability of Stainless Steels; Wiley-Interscience: Hoboken, NJ, USA, 2005. [Google Scholar]
- Kotecki, D.J.; Siewert, T.A. WRC-1992 constitution diagram for stainless steel weld metals: A modification of the WRC-1988 diagram. Weld. J. 1992, 71, 171–178. [Google Scholar]
- Silva, C.C.; de Miranda, H.C.; de Sant’Ana, H.B.; Farias, J.P. Microstructure, hardness and petroleum corrosion evaluation of 316L/AWS E309MoL-16 weld metal. Mater Charact. 2009, 60, 346–352. [Google Scholar] [CrossRef]
- DuPont, J.N.; Lipoold, J.C.; Kiser, S.D. Welding Metallurgy and Weldability of Nickel-Base Alloys; John Wiley & Sons: Hoboken, NJ, USA, 2009. [Google Scholar]
- Donachie, M.J.; Donachie, S.J. Superalloy: A Technical Guide; ASM international: Novelty, OH, USA, 2002. [Google Scholar]
- Ramkumar, K.D.; Mithilesh, P.; Varun, D.; Reddy, A.R.G.; Arivazhagan, N.; Narayanan, S.; Kumar, K.G. Characterization of microstructure and mechanical properties of Inconel 625 and AISI 304 dissimilar weldments. J. Int. Ste. Inst. Jap. 2014, 54, 900–908. [Google Scholar] [CrossRef]
- Subsea Structure Demands. Available online: https://app.aws.org/wj/2002/06/feature2/ (accessed on 23 February 2019).
- Dreshfield, R.L.; Moore, T.J.; Bartolotta, P.A. Post-Test Examination of a Pool Boiler Receiver; DOE/NASA/33408-6; U.S Department of Energy Conservation and Renewable Energy Office of Solar Heat Technologies: Washington, WA, USA, 1992; pp. 1–4.
- Dokme, F.; Kulekci, M.K.; Ugur, U. Microstructural and mechanical characterization of dissimilar metal welding of Inconel 625 and AISI 316L. Metals 2018, 8, 797. [Google Scholar] [CrossRef]
- Mithilesh, P.; Varun, D.; Reddy, A.R.G.; Ramkumar, K.D.; Arivazhagan, N.; Narayanan, S. Investigations on dissimilar weldments of Inconel 625 and AISI 304. Procedia Eng. 2014, 75, 66–70. [Google Scholar] [CrossRef]
- Loh, G.H.; Pei, E.; Harrison, D.; Monzón, M.D. An overview of functionally graded additive manufacturing. Addit. Manuf. 2018, 23, 34–44. [Google Scholar] [CrossRef] [Green Version]
- Banait, S.M.; Jinoop, A.N.; Paul, C.P.; Kumar, H.; Pawade, R.S.; Bindra, K.S. Investigating laser additive manufacturing of functionally graded Ni-Cr-B-Si and SS 316L. In Proceedings of the International Conference on Advances in Thermal Systems, Materials and Design Engineering (ATSMDE2017), Mumbai, India, 21–22 December 2017. [Google Scholar]
- Varghese, P.; Vetrivendan, E.; Dash, M.K.; Ningshen, S.; Kamaraj, M.; Kamachi Mudali, U. Weld overlay coating of Inconel 617M on type 316L stainless steel by cold metal transfer process. Surf. Coat. Tech. 2019, 357, 1004–1013. [Google Scholar] [CrossRef]
- Pulugurtha, S.R.; Newkirk, J.; Liou, F.; Chou, H. Functionally Graded Materials by Laser Metal Deposition (preprint). In Proceedings of the 21st Annual International Solid Freeform Fabrication Symposium, Austin, TX, USA, 9–11 August 2010; University of Texas Press: Austin, TX, USA. [Google Scholar]
- Abboud, J.H.; Rawlings, R.D.; West, D.R.F. Functionally graded nickel-aluminide and iron-aluminide coatings produced via laser cladding. J. Mater. Sci. 1995, 30, 5931–5938. [Google Scholar] [CrossRef]
- Xu, X.; Lin, X.; Chen, J.; He, F.; Huang, W. Laser Rapid Forming of Ti-Ni Functionally Graded Alloy. Mater. Sci. Forum. 2007, 561, 227–230. [Google Scholar] [CrossRef]
- Khor, K.A.; Dong, Z.L.; Gu, Y.W. Plasma sprayed functionally graded thermal barrier coatings. Mater. Lett. 1999, 38, 437–444. [Google Scholar] [CrossRef]
- Lin, X.; Yue, T.M.; Yang, H.O.; Huang, W.D. Microstructure and phase evolution in laser rapid forming of a functionally graded Ti–Rene88DT alloy. Acta Mater. 2006, 54, 1901–1915. [Google Scholar] [CrossRef]
- Lin, X.; Yue, T.M.; Yang, H.O.; Huang, W.D. Solidification Behavior and the Evolution of Phase in Laser Rapid Forming of Graded Ti6Al4V-Rene88DT Alloy. Metall. Mater. Trans. A 2007, 38A, 127–137. [Google Scholar] [CrossRef]
- Hälsig, A.; Kusch, M.; Mayr, P. New findings on the efficiency of gas shielded arc welding. Weld. World 2012, 56, 98–104. [Google Scholar] [CrossRef]
- ASTM E3-95. Standard Guide for Preparation of Metallographic Specimens; ASTM International: West Conshohocken, PA, USA, 1995; Available online: www.astm.org (accessed on 10 January 2019).
- ASTM E384-99. Standard Test Method for Microindentation Hardness of Materials; ASTM International: West Conshohocken, PA, USA, 1999; Available online: www.astm.org (accessed on 10 January 2018).
- DuPont, J.N. Dilution in Fusion Welding. In ASM handbook Volume 6A. Welding fundamentals and Process; ASM International: Novelty, OH, USA, 2011. [Google Scholar]
- Xu, F.; Lv, Y.; Liu, Y.; Shu, F.; He, P.; Xu, B. Microstructural evolution and mechanical properties of Inconel 625 alloy during pulsed plasma arc deposition process. J. Mater. Sci. Technol. 2013, 29, 480–488. [Google Scholar] [CrossRef]
- ASM International. Heat-Resistant Casting Alloys: Metallographic Techniques and Microstructures. In ASM handbook Volume 9. Metallography and Microstructures; ASM International: Novelty, OH, USA, 1998. [Google Scholar]
- Ram, G.D.J.; Reddy, A.V.; Rao, K.P.; Reddy, G.M.; Sundar, J.K.S. Control of Laves phase in Inconel 718 GTA welds with current pulsing. Sci. Technol. Weld. Join. 2004, 9, 390–398. [Google Scholar]
Figure 1.
Experimental setup for 3DPMD. Adapted from [15].
Figure 1.
Experimental setup for 3DPMD. Adapted from [15].

Figure 2.
SS316L to Ni80-20 structure manufactured by 3DPMD, top view.

Figure 3.
Macro view of the graded structures of SS316L-Ni80-20 built. HT: hard transition, ST: smooth transition. Marked regions represent the areas analyzed by XEDS and hardness.
Figure 3.
Macro view of the graded structures of SS316L-Ni80-20 built. HT: hard transition, ST: smooth transition. Marked regions represent the areas analyzed by XEDS and hardness.

Figure 4.
Macro view of the graded structures of SS316L-Ni625 built. (a) Low, (b) standard, and (c) high HI. Marked regions represent the areas analyzed by XEDS and hardness.
Figure 4.
Macro view of the graded structures of SS316L-Ni625 built. (a) Low, (b) standard, and (c) high HI. Marked regions represent the areas analyzed by XEDS and hardness.

Figure 5.
SS316L to Ni625 structures manufactured by 3DPMD.

Figure 6.
Microstructure characterization of the HT sample, (a) macro of the 3D structure; (b,f) interface with the base material; (c,g) stainless steel (316L); (d,h) interface between SS316L and Ni80-20; (e,i) Ni-based alloy (Ni80-20). (b–e) OM images; and (f–i) SEM images.
Figure 6.
Microstructure characterization of the HT sample, (a) macro of the 3D structure; (b,f) interface with the base material; (c,g) stainless steel (316L); (d,h) interface between SS316L and Ni80-20; (e,i) Ni-based alloy (Ni80-20). (b–e) OM images; and (f–i) SEM images.

Figure 7.
Microstructure characterization of the ST sample, (a) macro of the 3D structure; (b,h) interface with the base material; (c,i) stainless steel (316L); (d,j) interface between SS316L and mixed zone; (e,k) mixed zone; (f,l) interface between the mixed zone and Ni80-20; (f,m) Ni-based alloy (Ni80-20). (b–g) OM images; and (h–m) SEM images.

Figure 8.
SEM images and XEDS analysis of the second phases in Ni80-20. (a,b) Secondary electron (SE) images in the Ni80-20; the numbers represent the second phases analyzed by XEDS.
Figure 8.
SEM images and XEDS analysis of the second phases in Ni80-20. (a,b) Secondary electron (SE) images in the Ni80-20; the numbers represent the second phases analyzed by XEDS.

Figure 9.
(a,b) SEM images of the laves phase in the mixed zone of the ST sample.

Figure 10.
XEDS line scan across the transition zone between SS316L and Ni80-20. Region (a) in Figure 3.
Figure 10.
XEDS line scan across the transition zone between SS316L and Ni80-20. Region (a) in Figure 3.

Figure 11.
XEDS line scan across the interface between SS316L and the mixed zone region. Region (b) in Figure 3.
Figure 11.
XEDS line scan across the interface between SS316L and the mixed zone region. Region (b) in Figure 3.

Figure 12.
XEDS line scan across the interface between and the mixed zone and Ni80-20. Region (c) in Figure 3.
Figure 12.
XEDS line scan across the interface between and the mixed zone and Ni80-20. Region (c) in Figure 3.

Figure 13.
Hardness maps across the interfaces for SS316L to Ni80-20 samples. (a) HT sample, interface between SS316L and Ni80-20, (b) ST sample, interface between SS316L and mixed zone, and (c) ST sample, interface between mixed zone and Ni80-20.
Figure 13.
Hardness maps across the interfaces for SS316L to Ni80-20 samples. (a) HT sample, interface between SS316L and Ni80-20, (b) ST sample, interface between SS316L and mixed zone, and (c) ST sample, interface between mixed zone and Ni80-20.

Figure 14.
Fabrication defects in the low HI sample (SS316L to Ni625). (a) Lack of fusion, and (b) crack.
Figure 14.
Fabrication defects in the low HI sample (SS316L to Ni625). (a) Lack of fusion, and (b) crack.

Figure 15.
Microstructure characterization of the SS316L to Ni625 sample with the standard HI, (a) macro of the 3D structure; (b,h) interface with the base material; (c,i) stainless steel (316L); (d,j) interface between SS316L and mixed zone; (e,k) mixed zone; (f,l) interface between the mixed zone and Ni625; (f,m) Ni625. (b–g) OM images; and (h–m) SEM images.

Figure 16.
SEM images and XEDS analysis of the secondary phases in Ni625. (a,b) Secondary electron (SE) images in the Ni625; the numbers represent the secondary phases analyzed by XEDS.
Figure 16.
SEM images and XEDS analysis of the secondary phases in Ni625. (a,b) Secondary electron (SE) images in the Ni625; the numbers represent the secondary phases analyzed by XEDS.

Figure 17.
(a) Needle-like structure in the Ni625 for the high HI sample, (b) detail view of the needle-like structure. SEM images.
Figure 17.
(a) Needle-like structure in the Ni625 for the high HI sample, (b) detail view of the needle-like structure. SEM images.

Figure 18.
XDS line scan across the interfaces of the regions in the SS316L to Ni625 structure.

Figure 19.
Hardness maps for the SS316L to Ni625 samples across the interfaces. (a,c,e) Interface between the SS316L and mixed zone; (b,d,f) interface between the mixed zone and Ni625. (a,b) Low HI; (c,d) standard HI; and (e,f) high HI.
Figure 19.
Hardness maps for the SS316L to Ni625 samples across the interfaces. (a,c,e) Interface between the SS316L and mixed zone; (b,d,f) interface between the mixed zone and Ni625. (a,b) Low HI; (c,d) standard HI; and (e,f) high HI.


Table 1.
Chemical composition of the powders used (wt%).
| Alloy | C | Si | Nb | Mn | Cr | Mo | Ni | Fe |
|---|---|---|---|---|---|---|---|---|
| SS316L | 0.03 | 0.7 | - | 0.5 | 16.5 | 2.1 | 13.0 | Bal. |
| Ni80-20 | - | 1.2 | - | - | 22.0 | - | Bal. | 0.6 |
| Ni625 | 0.03 | 0.5 | 3.2 | 0.4 | 21.1 | 8.5 | Bal. | 4.2 |
Table 2.
Welding parameters used for the system SS316L to Ni80-20.
| Configuration | Layers | Powder Type | Welding Current (A) | Heat Input (KJ·mm−1) |
|---|---|---|---|---|
| HI | 1–15 | SS316L | 120 | 0.197 |
| 16–30 | Ni80-20 | 105 | 0.173 | |
| ST | 1–10 | SS316L | 120 | 0.197 |
| 11–20 | 50% SS316L 50% Ni80-20 | 110 | 0.181 | |
| 21–30 | Ni80-20 | 105 | 0.173 |
Table 3.
Welding parameters used for the system SS316L to 625.
| HI | Layers (#) | Powder Type | Voltage (V) | Welding Current (A) | Heat Input (KJ·mm−1) |
|---|---|---|---|---|---|
| Low (L) | 1–10 | SS316L | 22.73 | 105 | 0.176 |
| 11–20 | 50% SS316L 50% Ni625 | 23.04 | 95 | 0.162 | |
| 21–30 | Ni625 | 22.87 | 90 | 0.151 | |
| Standard (S) | 1–10 | SS316L | 22.82 | 120 | 0.200 |
| 11–20 | 50% SS316L 50% Ni625 | 22.84 | 110 | 0.181 | |
| 21–30 | Ni625 | 22.90 | 105 | 0.177 | |
| High (H) | 1–10 | SS316L | 23.30 | 135 | 0.241 |
| 11–20 | 50% SS316L 50% Ni625 | 23.57 | 125 | 0.214 | |
| 21–30 | Ni625 | 23.73 | 120 | 0.204 |
Table 4.
Influence of different HI on the geometry.
| HI | Wall Thickness (mm) | Part Height (mm) | Layer Thickness (mm) |
|---|---|---|---|
| Low | 6.5 | 27.5 | 0.92 |
| Standard | 5.8 | 30.5 | 1.02 |
| High | 4.8 | 35.2 | 1.17 |
Table 5.
Percentage of dilution for the system SS316L to Ni625 fabricated with three heat inputs, low, standard, and high.
Table 5.
Percentage of dilution for the system SS316L to Ni625 fabricated with three heat inputs, low, standard, and high.
| Interface | %D |
|---|---|
| Low (L) HI | |
| SS316L to mixed zone | 38.9 |
| mixed zone to Ni625 | 26.3 |
| Standard (S) HI | |
| SS316L to mixed zone | 55.2 |
| mixed zone to Ni625 | 25 |
| High (H) HI | |
| SS316L to mixed zone | 51.1 |
| mixed zone to Ni625 | 23.1 |
© 2019 by the authors. Licensee MDPI, Basel, Switzerland. This article is an open access article distributed under the terms and conditions of the Creative Commons Attribution (CC BY) license (http://creativecommons.org/licenses/by/4.0/).
Share and Cite
MDPI and ACS Style
Rodriguez, J.; Hoefer, K.; Haelsig, A.; Mayr, P. Functionally Graded SS 316L to Ni-Based Structures Produced by 3D Plasma Metal Deposition. Metals 2019, 9, 620. https://doi.org/10.3390/met9060620
AMA Style
Rodriguez J, Hoefer K, Haelsig A, Mayr P. Functionally Graded SS 316L to Ni-Based Structures Produced by 3D Plasma Metal Deposition. Metals. 2019; 9(6):620. https://doi.org/10.3390/met9060620
Chicago/Turabian StyleRodriguez, Johnnatan, Kevin Hoefer, Andre Haelsig, and Peter Mayr. 2019. "Functionally Graded SS 316L to Ni-Based Structures Produced by 3D Plasma Metal Deposition" Metals 9, no. 6: 620. https://doi.org/10.3390/met9060620
Note that from the first issue of 2016, this journal uses article numbers instead of page numbers. See further details here.