Environmental Behavior of Low Carbon Steel Produced by a Wire Arc Additive Manufacturing Process
by
 , , , and
Tomer Ron
1 ,
,
Galit Katarivas Levy
2,
Ohad Dolev
1,
Avi Leon
1,
Amnon Shirizly
1 and
Eli Aghion
1,*
1
Department of Materials Engineering, Ben-Gurion University of the Negev, Beer-Sheva 8410501, Israel
2
Department of Engineering, University of Cambridge, Trumpington Street, Cambridge CB2 1PZ, UK
*
Author to whom correspondence should be addressed.
Metals 2019, 9(8), 888; https://doi.org/10.3390/met9080888
Submission received: 18 July 2019
/
Revised: 4 August 2019
/
Accepted: 9 August 2019
/
Published: 14 August 2019
Abstract
:Current additive manufacturing (AM) processes are mainly focused on powder bed technologies, such as electron beam melting (EBM) and selective laser melting (SLM). However, the main disadvantages of such techniques are related to the high cost of metal powder, the degree of energy consumption, and the sizes of the components, that are limited by the size of the printing cell. The aim of the present study was to evaluate the environmental behavior of low carbon steel (ER70S-6) produced by a relatively inexpensive AM process using wire feed arc welding. The mechanical properties were examined by tension testing and hardness measurements, while microstructure was assessed by scanning electron microscopy and X-ray diffraction analysis. General corrosion performance was evaluated by salt spray testing, immersion testing, potentiodynamic polarization analysis, and electrochemical impedance spectroscopy. Stress corrosion performance was characterized in terms of slow strain rate testing (SSRT). All corrosion tests were carried out in 3.5% NaCl solution at room temperature. The results indicated that the general corrosion resistance of wire arc additive manufacturing (WAAM) samples were quite similar to those of the counterpart ST-37 steel and the stress corrosion resistance of both alloys was adequate. Altogether, it was clearly evident that the WAAM process did not encounter any deterioration in corrosion performance compared to its conventional wrought alloy counterpart.
1. Introduction
The growing interest in additive manufacturing (AM) technology in the last decade has been largely due to the inherent advantages of this technology in terms of creating highly complex geometries in a relatively short time [1,2,3,4,5,6]. Currently, most relevant production and research activities focus on 3D printing processes using powder bed technology (PBT), such as selective laser melting (SLM) and electron beam melting (EBM) [7]. However, PBT is considered a relatively expensive process mainly due to the cost of powders and their handling procedures, as well as their high process energy consumption. In addition, the practical dimensions of the produced product are inherently limited to the size of the printing cell. Furthermore, the deposition rate of the PBT process is relatively low due to a very thin printing layer (30–60 µm) and the low scan speed of the energy source (SLM or EBM) [8]. Altogether, the inherent limitations of the PBT process highlight the potential of wire arc additive manufacturing (WAAM) as an attractive alternative technology. In this process, a metal wire serves as raw material, with relatively reduced energy consumption being required to fuse the wire into a pre-designed metal component. The WAAM process usually uses widely used welding technologies, such as gas metal arc welding (GMAW) that can reduce the production cost in terms of raw material and energy consumption by nearly 80%, as compared to the PBT process [9,10]. In practice, WAAM can provide a deposition rate of about 10 kg/h [11], as compared to a rate of only 600 g/h achieved by the conventional PBT process [12]. In addition, the dimensions of the printed product are almost unlimited with WAAM [13] since the printing process here is performed in open air using a robotic arm with a localized shielded area [14].
While previous investigations of WAAM processes mainly focused on production parameters and methodologies including tool path planning, residual stress analysis, printing single-bead or multi-layer structure, and more [15,16], relatively limited attention has been devoted to the critical correlated properties realized at the end of the printing process. Accordingly, the present study aimed at evaluating the environmental behaviour of products produced by a WAAM process using ER70S-6 welding wire. The counterpart alloy that was used as a reference material was ST-37 steel, which presents a very similar chemical composition. It should be noted that the selection of ST-37 steel as a reference alloy is related to the fact that the regular process used for welding this alloy uses a welding wire made of ER70S-6 steel.
2. Materials and Methods
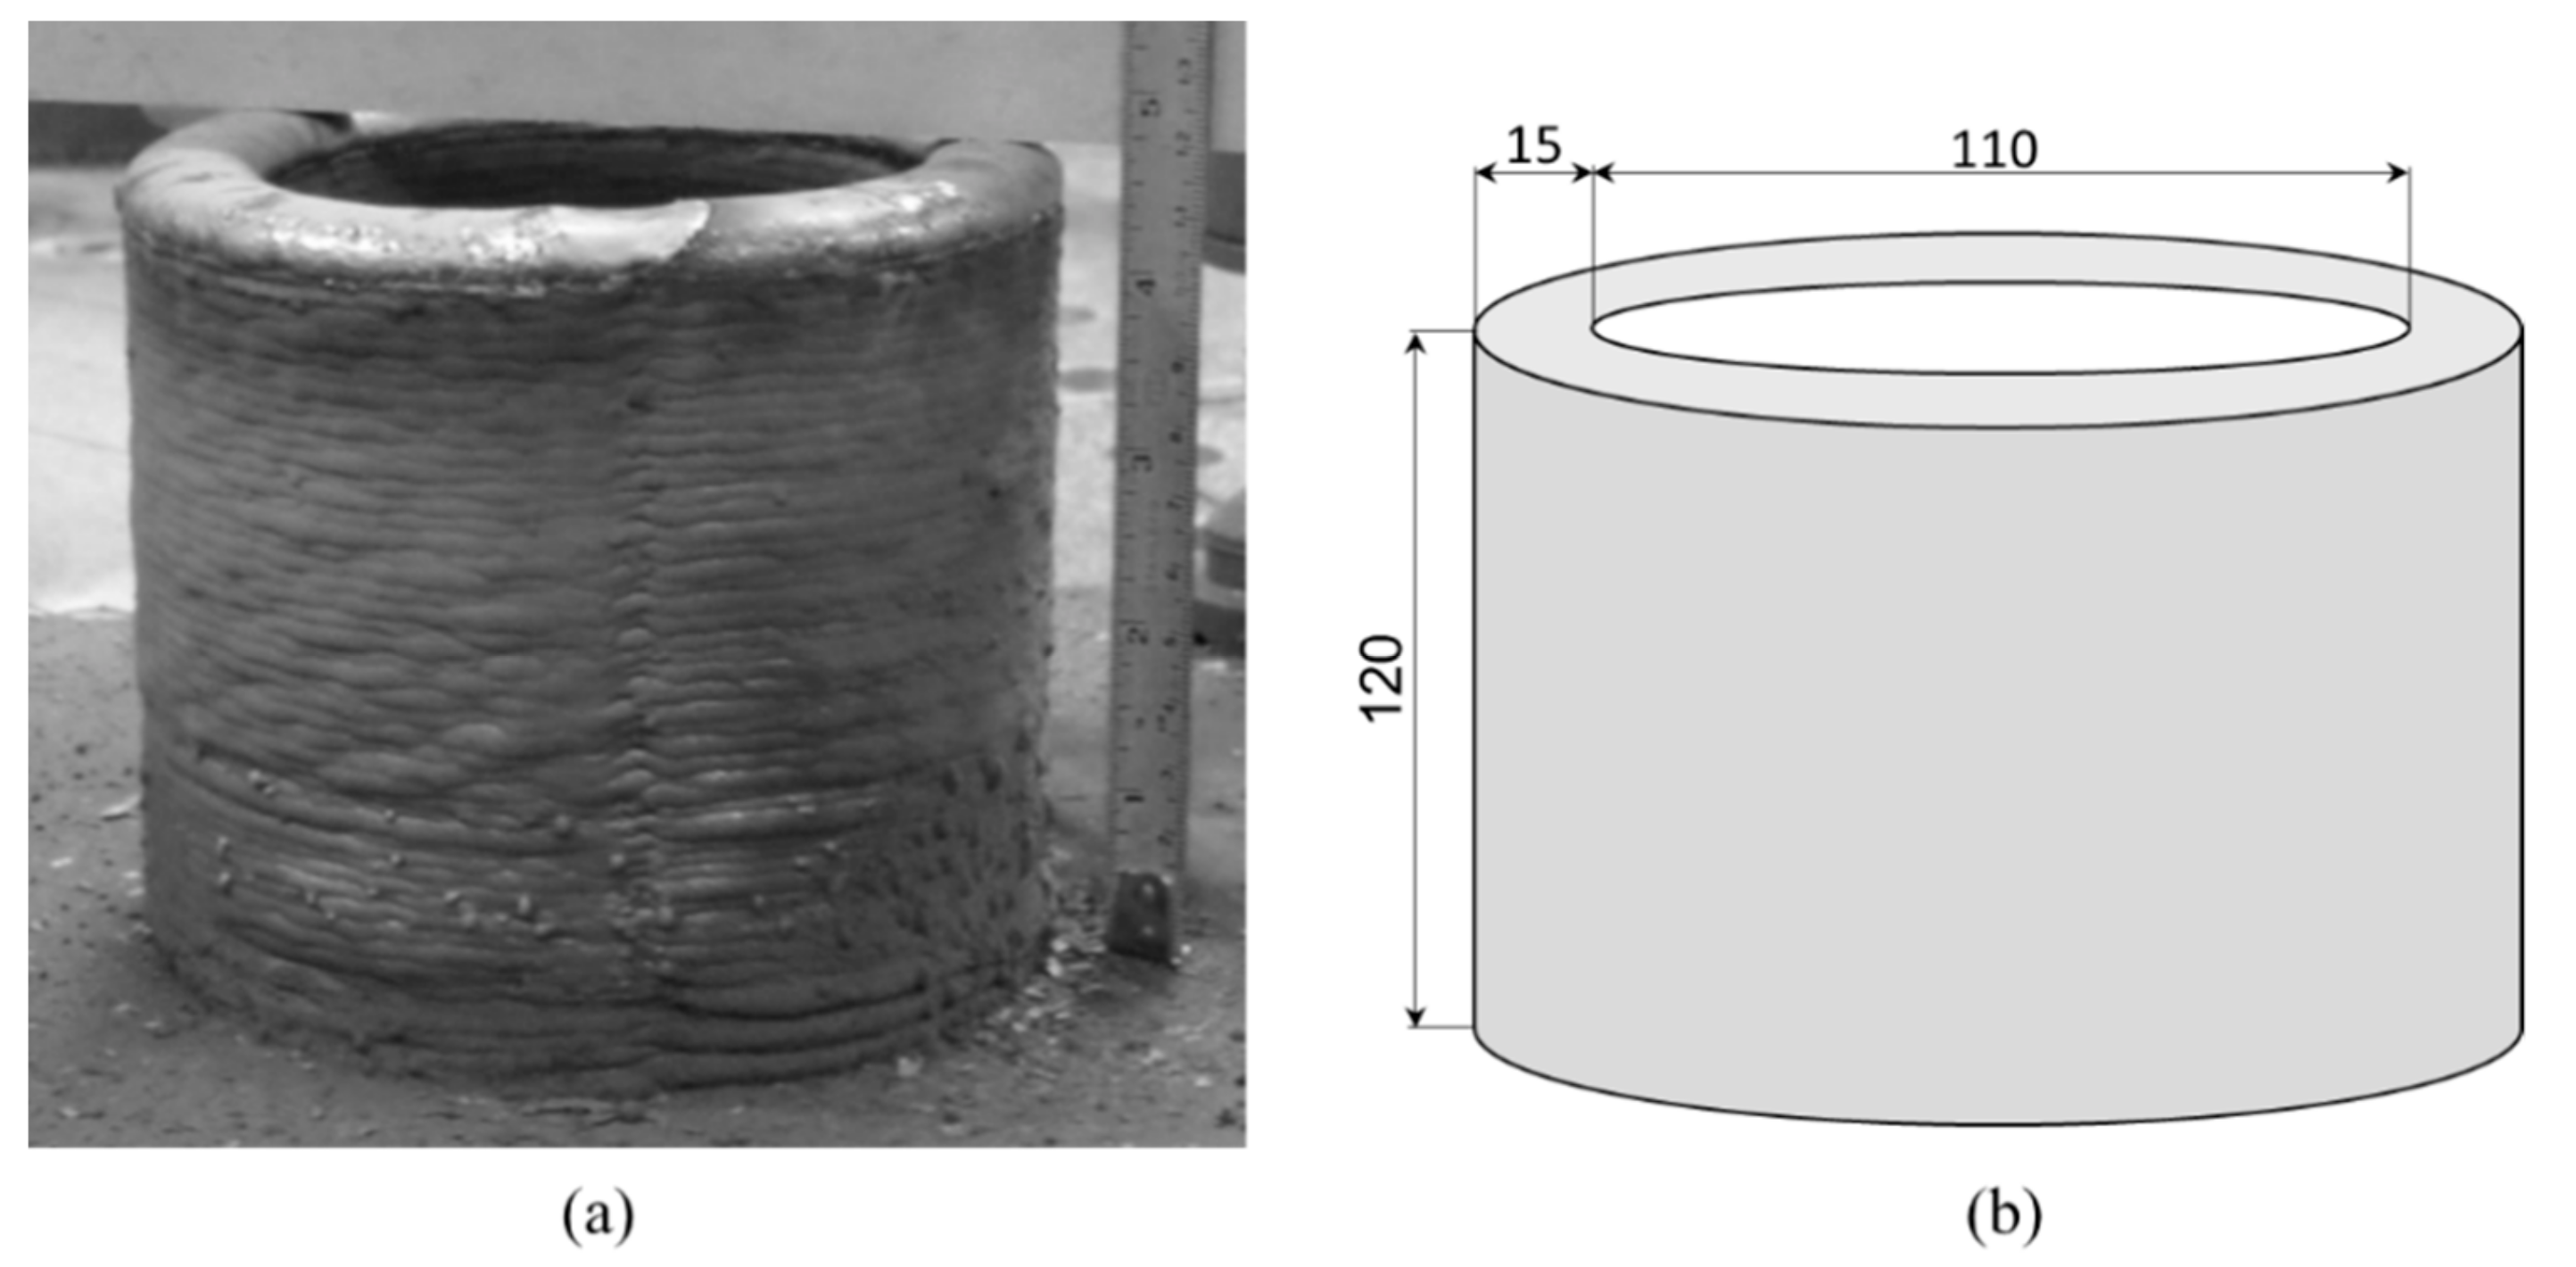
The chemical composition of WAAM steel samples (ER70S-6) and their counterpart wrought steel alloy (ST-37) are shown in Table 1, where it clearly reveals that both alloys are low carbon steels with very similar chemical composition. The WAAM test samples were machined from hollow cylindrical parts that were built to a height of 120 mm, a mid-wall radius of 55 mm and 15 mm wall thickness as shown in Figure 1, using 1.2 mm of ER70S-6 wire [16]. The welding process was carried out using a welding manipulator composed from a welding robot integrated with a numerically controlled computer. The pathway of the welding tool was directed by a CAD model with a programmed slicing layer thickness of 2 mm. The tangential welding speed of the robot was 14 cm/min and the protective gas atmosphere for the metal arc welding process was composed of 98% argon and 2% oxygen. The welding process parameters included a wire feed rate of 6.1 m/min, an electrical current of 210 A, a voltage 23.9 V, and a pulse frequency of 120 Hz.
Microstructure examination was carried out by optical and scanning electron microscopy (SEM; JEOL JSM-5600). Metallographic specimens were polished up to 0.04 μm and etched with Nital solution for 10 s. Examination of secondary phases and matrix was carried out using a RIGAKU-2100H X-ray diffractometer with CuKα, at 40 KV/30 mA, and a scanning rate of 2°/min.
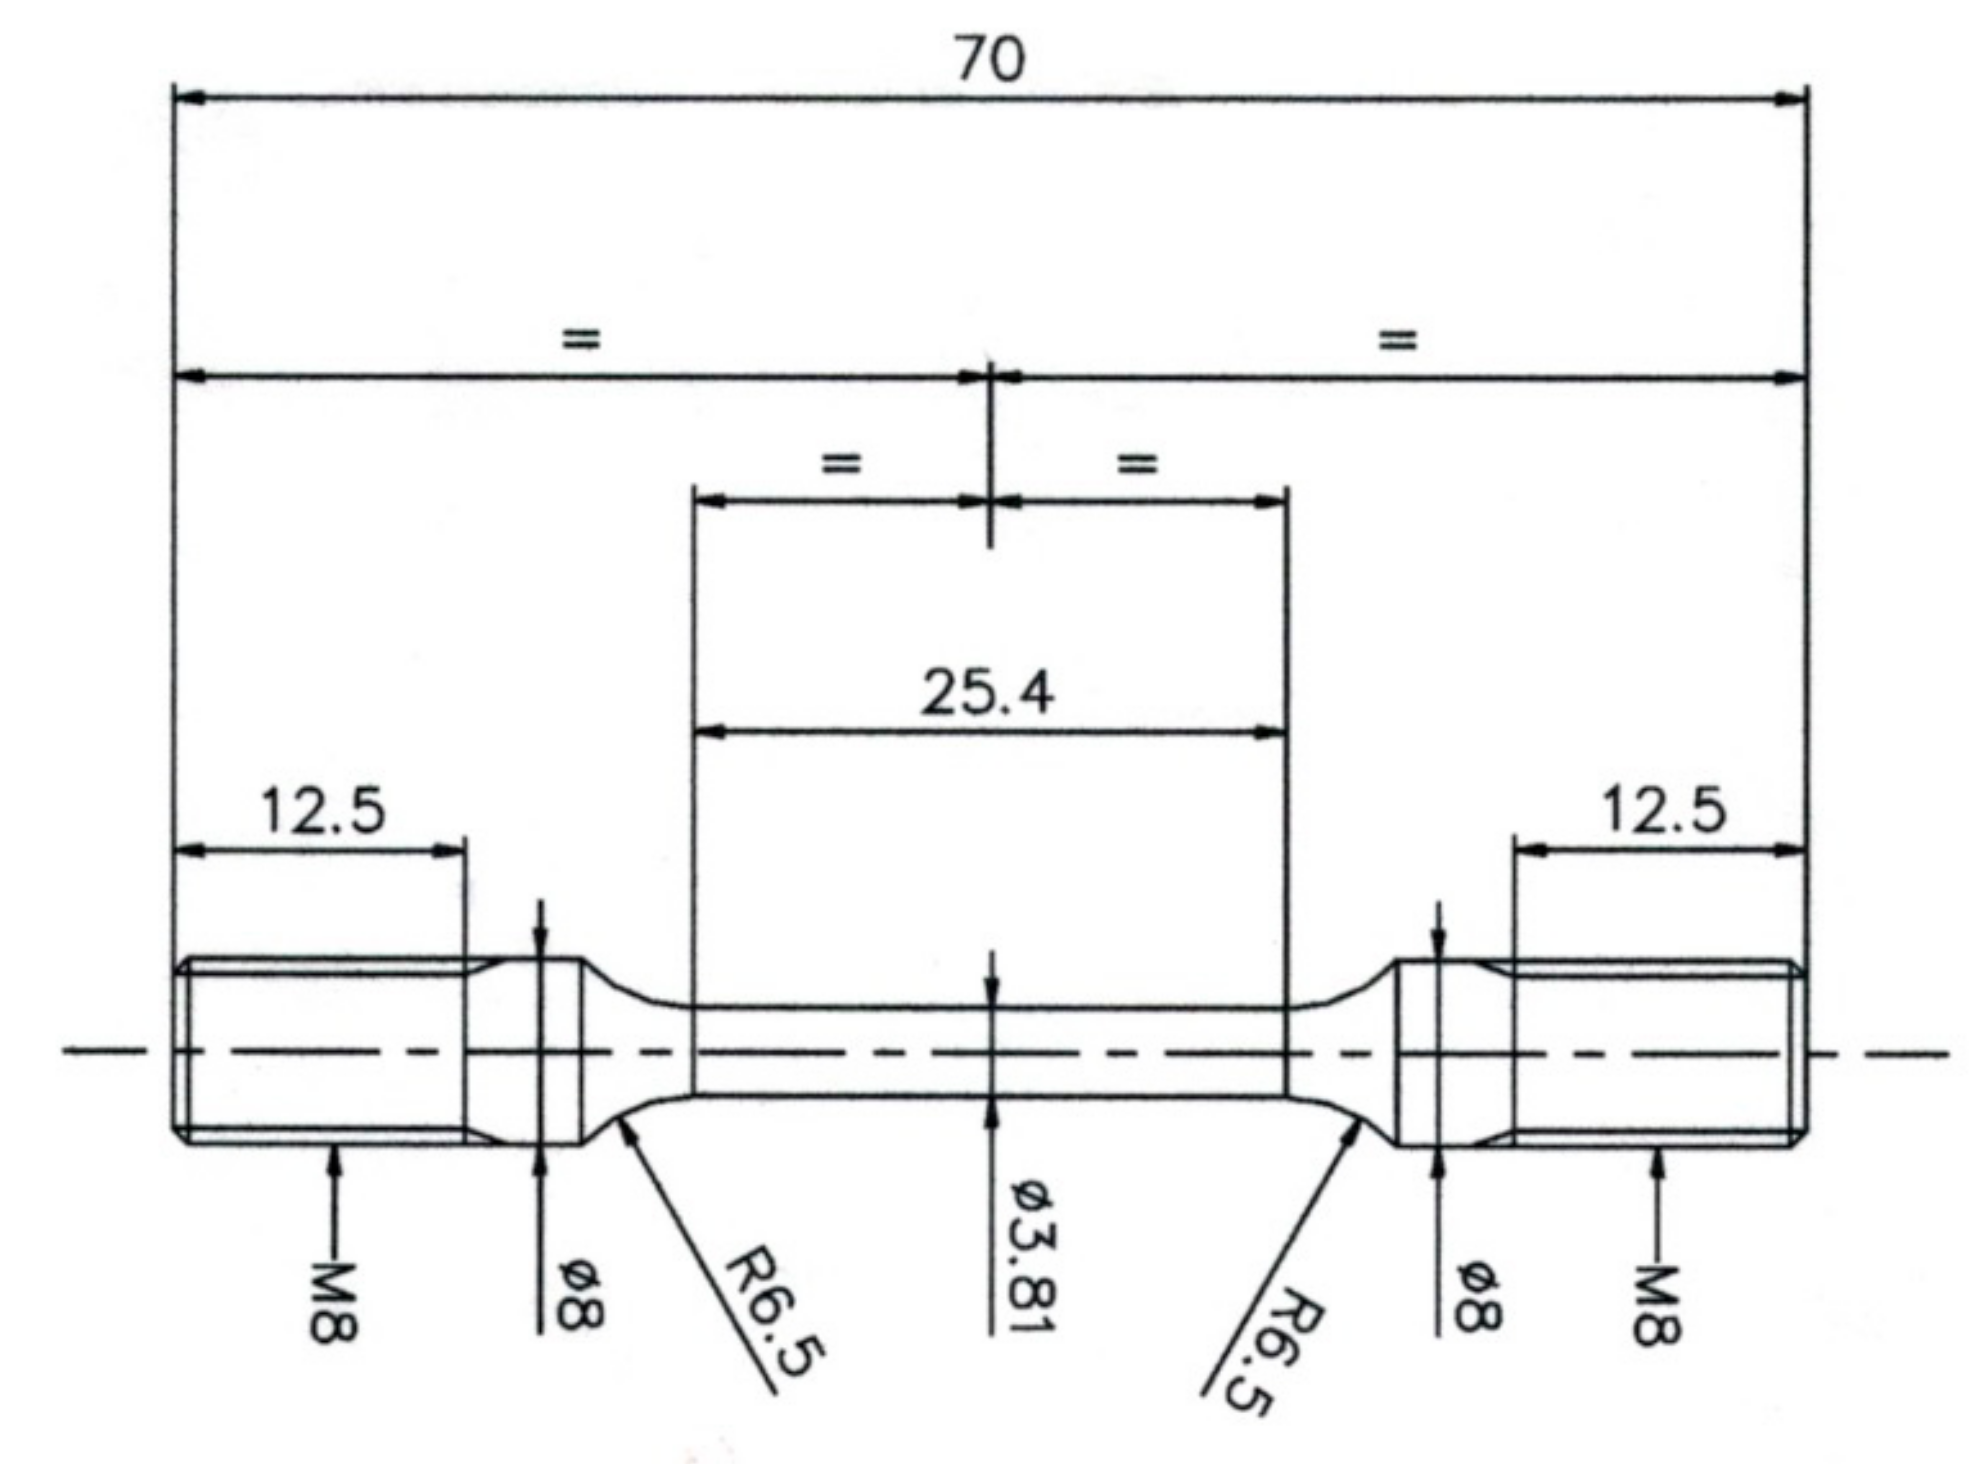
Corrosion performance was evaluated by immersion testing, salt spray testing, and electrochemical analysis; all tests were carried out in 3.5% NaCl solution. The immersion test was conducted for up to 90 days, while the removal of the corrosion products was carried out using NaOH solution with Zn chips for 30 min at 80 °C. Corrosion rate measurements were performed according to the ASTM G2 standard. Salt spray testing was performed for up to 45 days according to ASTM B117, whereas the removal of corrosion products, as well as corrosion rate measurements, were carried out as with the immersion tests. Electrochemical analyses were carried out using a Bio-Logic SP-200 potentiostat equipped with Ec-Lab software v11.18. This was performed with a standard three-electrode cell using saturated calomel electrode (SCE) as a reference electrode. The electrochemical examinations conducted included potentiodynamic polarization analysis and electrochemical impedance spectroscopy (EIS). The scanning rate of the potentiodynamic polarization analysis was 0.5 mV/s and the EIS measurements were carried out between 10 kHz and 0.015 Hz at a 10 mV amplitude signal over the open circuit potential after 30, 180 and 540 min. Prior to electrochemical testing, the samples were cleaned in an ultrasonic bath for 5 min, washed with alcohol, and dried in hot air. Stress corrosion behavior was examined by slow strain rate testing (SSRT) in 3.5% NaCl solution at ambient temperature using a Cormet C-76 set-up. The tested specimen gauge length was 25.4 mm with a cylindrical cross section of 11.4 mm2 as shown in Figure 2. The experimental strain rate parameters were 2.5 × 10⁻⁷, 2.5 × 10⁻⁶ and 2.5 × 10⁻⁵ 1/s.
3. Results
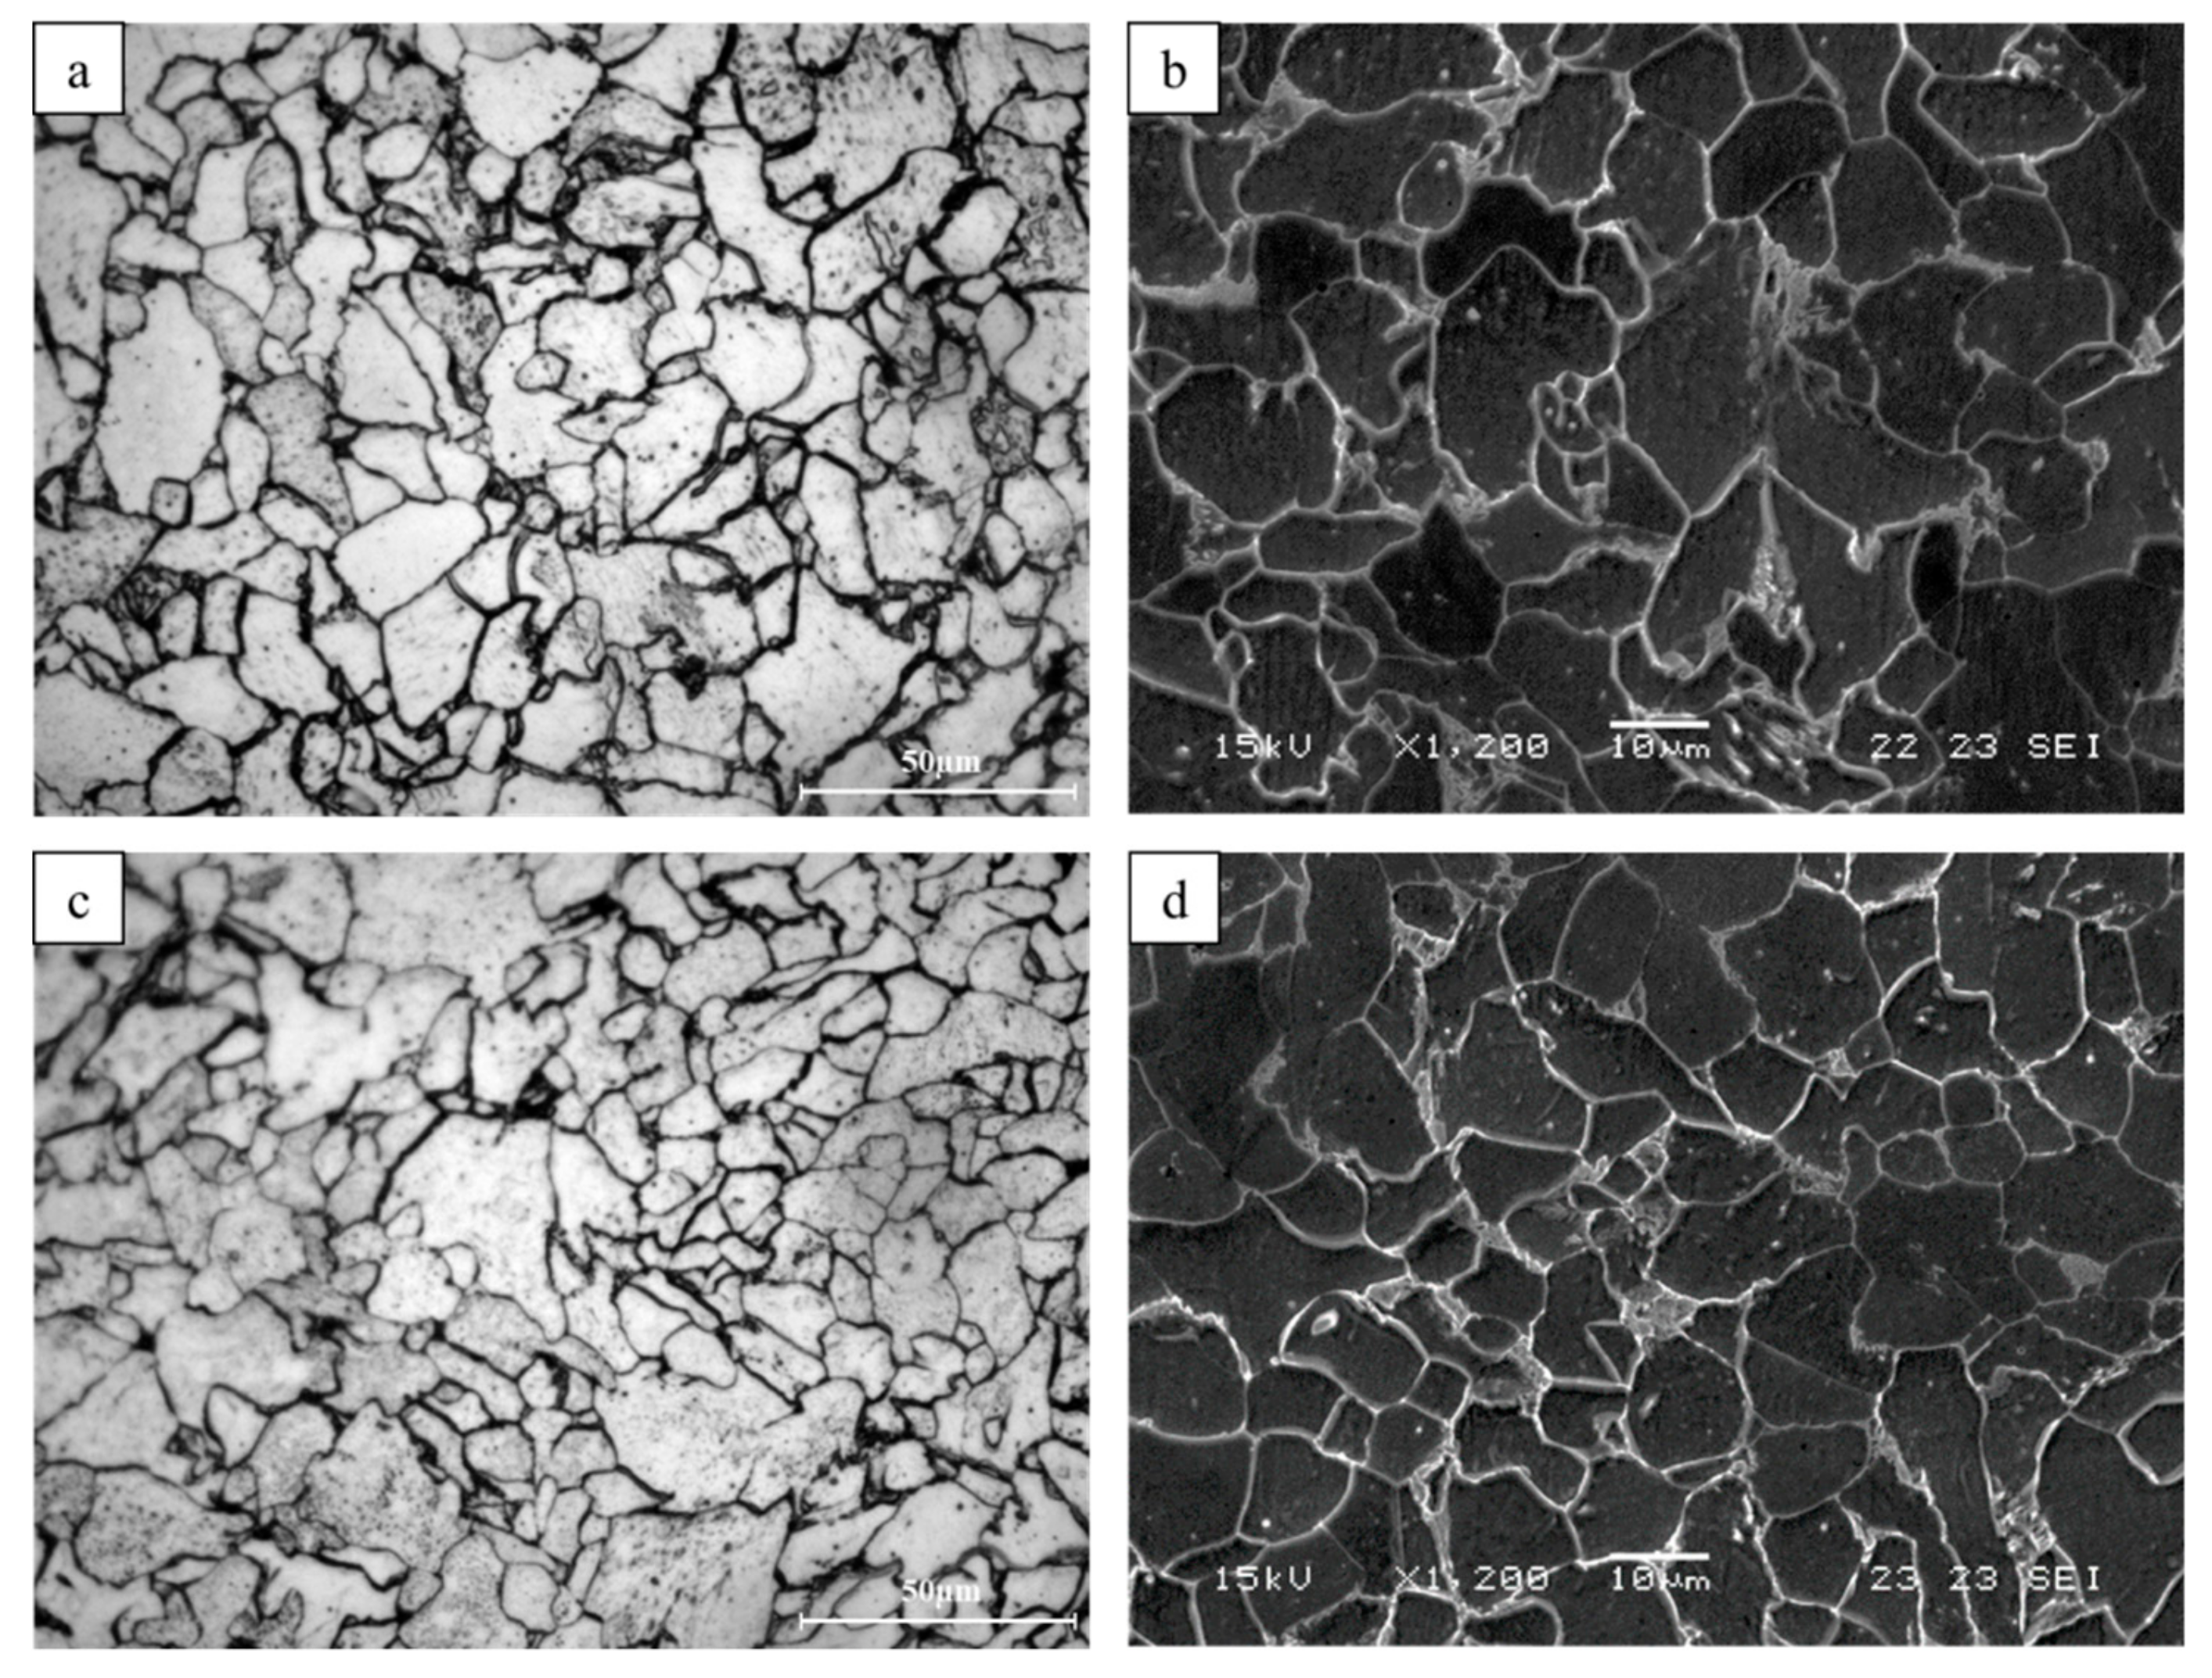
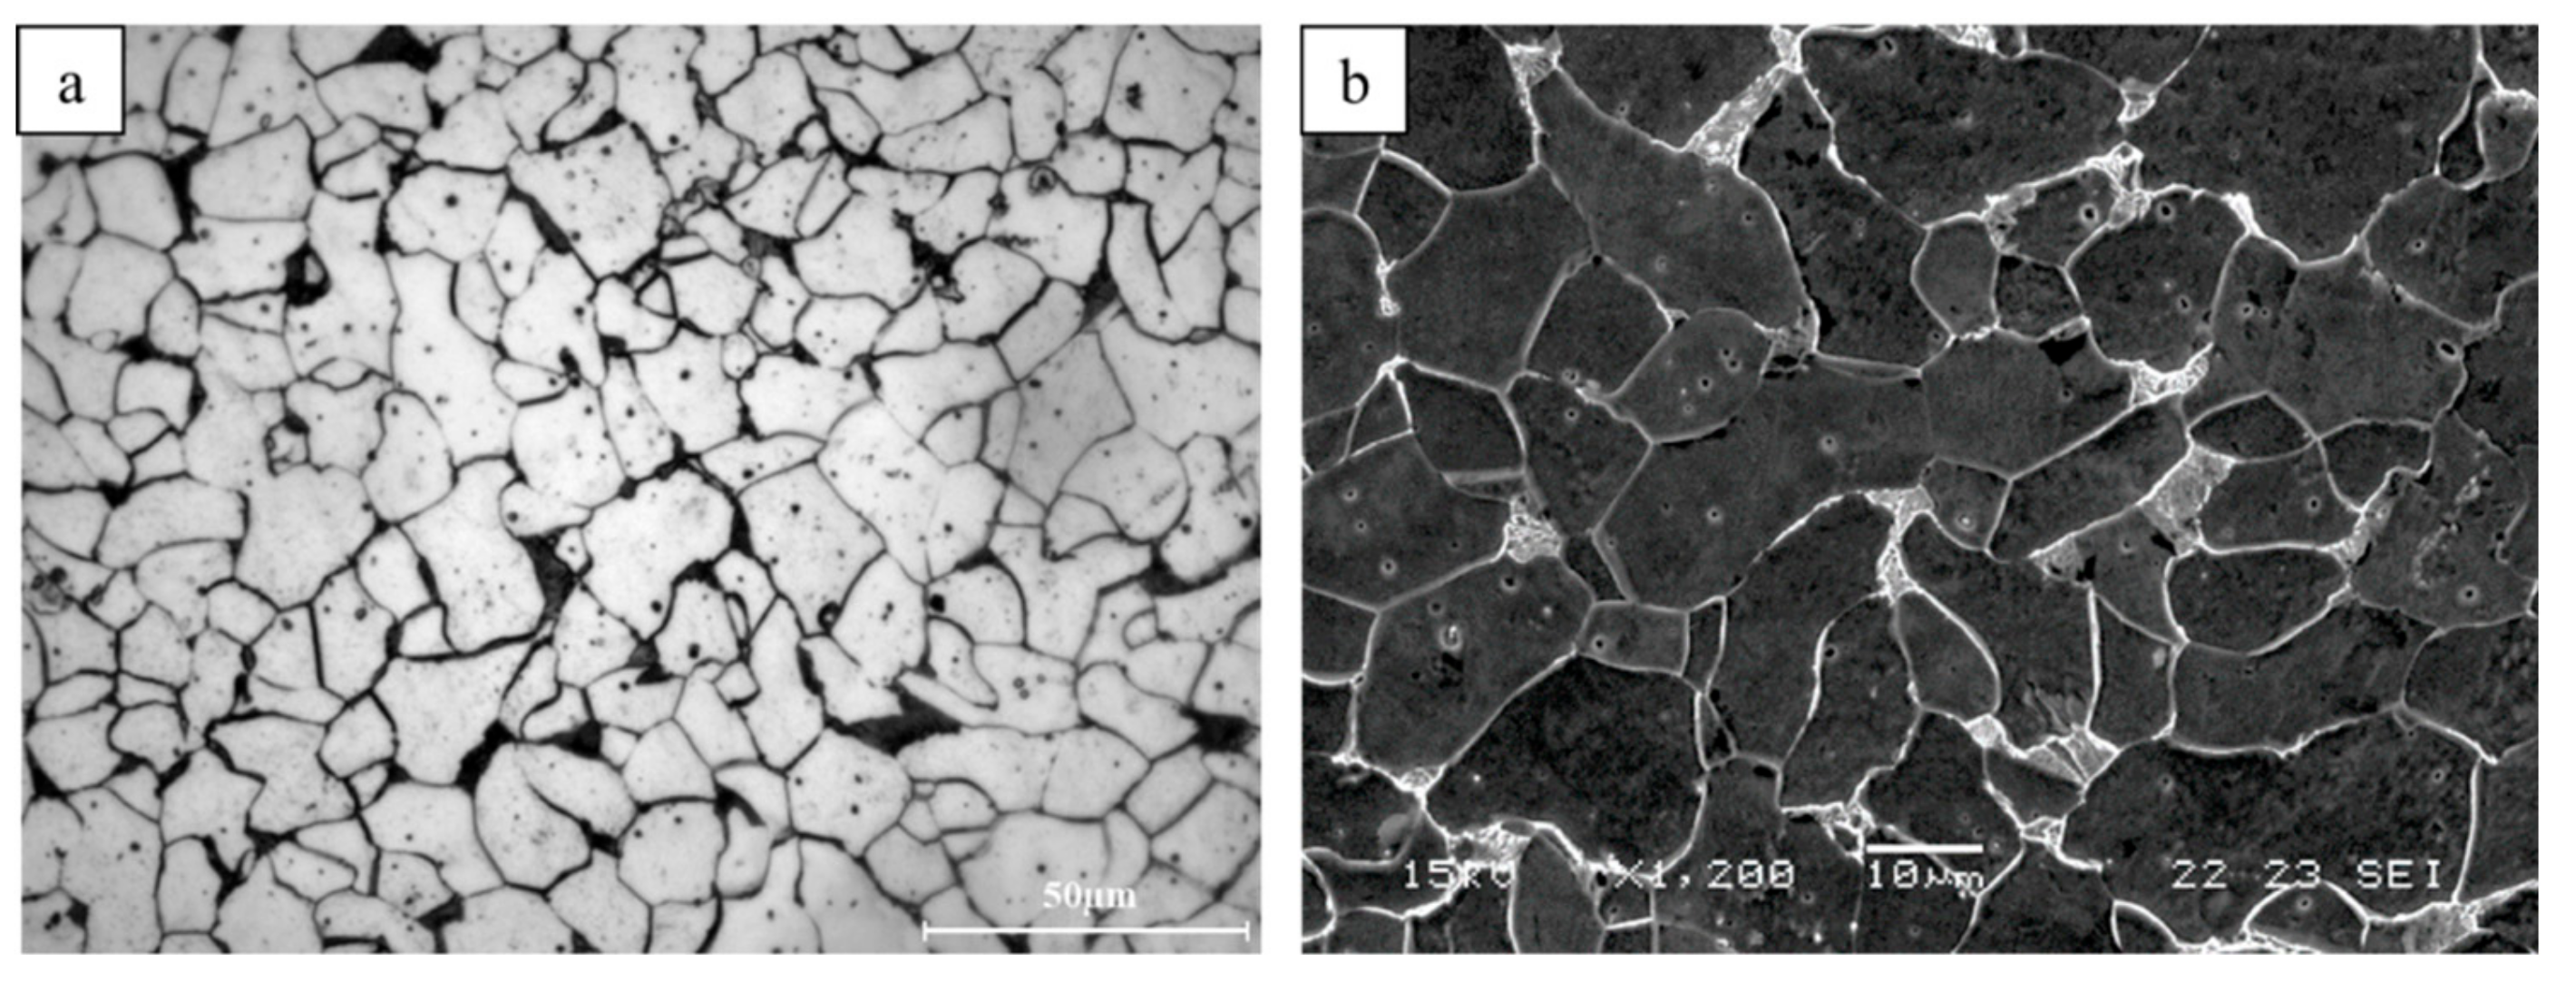
The microstructure of the printed (WAAM) alloy ER70S-6 at the transverse and longitudinal cross-sections (i.e., the XY and XZ planes, respectively) is shown in Figure 3. This revealed a typical microstructure of low carbon steel with a reduced amount of secondary pearlite phase, as obtained after an arc welding process, according to Jafarzadegan et al. [17]. The microstructure of the reference ST-37 alloy presented a regular ferrite matrix and a secondary pearlite phase, as shown in Figure 4. The relatively reduced amount of pearlite phase in the printed alloy was mainly the result of the inherent rapid solidification characteristics of the WAAM process, as well as the small differences in carbon content. In addition, it should be indicated that a minor amount of retain austenite was imbedded in the ferrite matrix in both alloys as expected. In terms of porosity, both alloys showed relatively similar amounts of porosity defects.
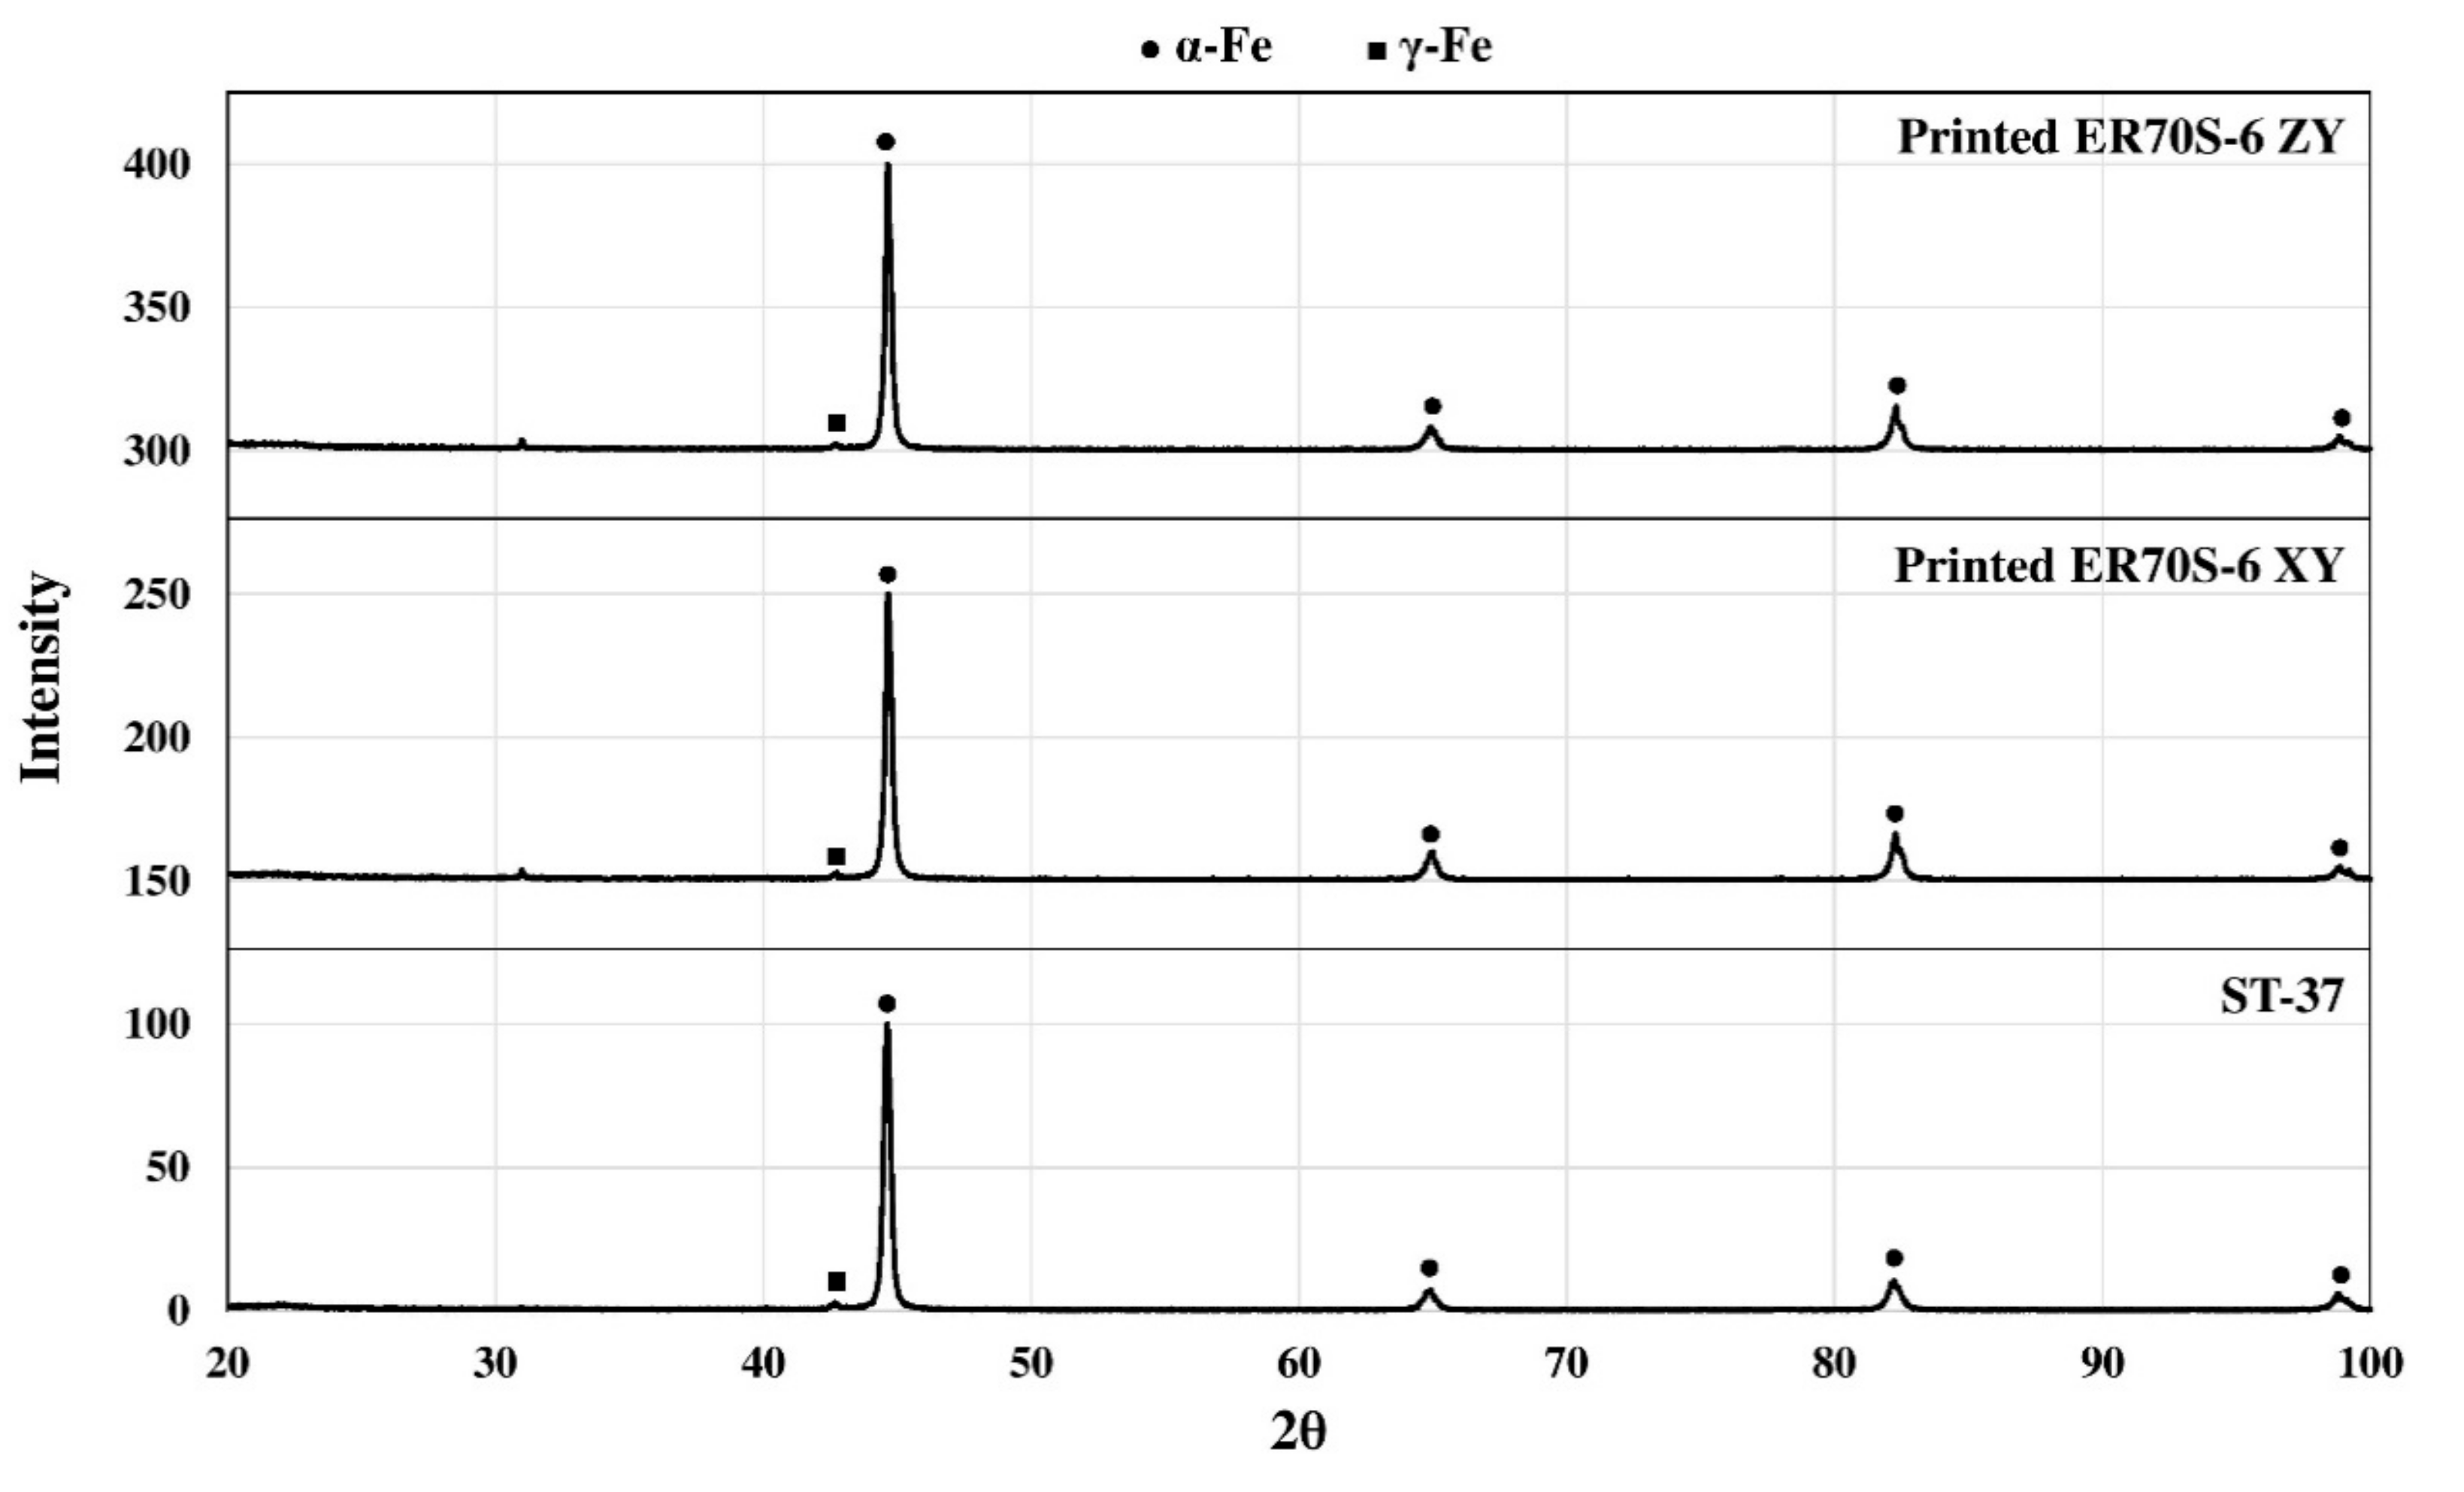
X-ray diffraction analysis of the printed ER70S-6 alloy and its reference ST-37 alloy is shown in Figure 5. This revealed that both alloys are mainly composed of a α-Fe (BCC) matrix, together with relatively small amounts of a retained austenitic phase γ-Fe (FCC). The calculated lattice parameter of α-Fe was 2.87 Å which comes in line with the literature value of 2.8664 Å (ICDD 006-0696). In addition, the diffraction patterns of the printed alloy in the XY and XZ planes were very similar, indicating that the inherent epitaxial solidification nature of the additive manufacturing process in this case was relatively insignificant.
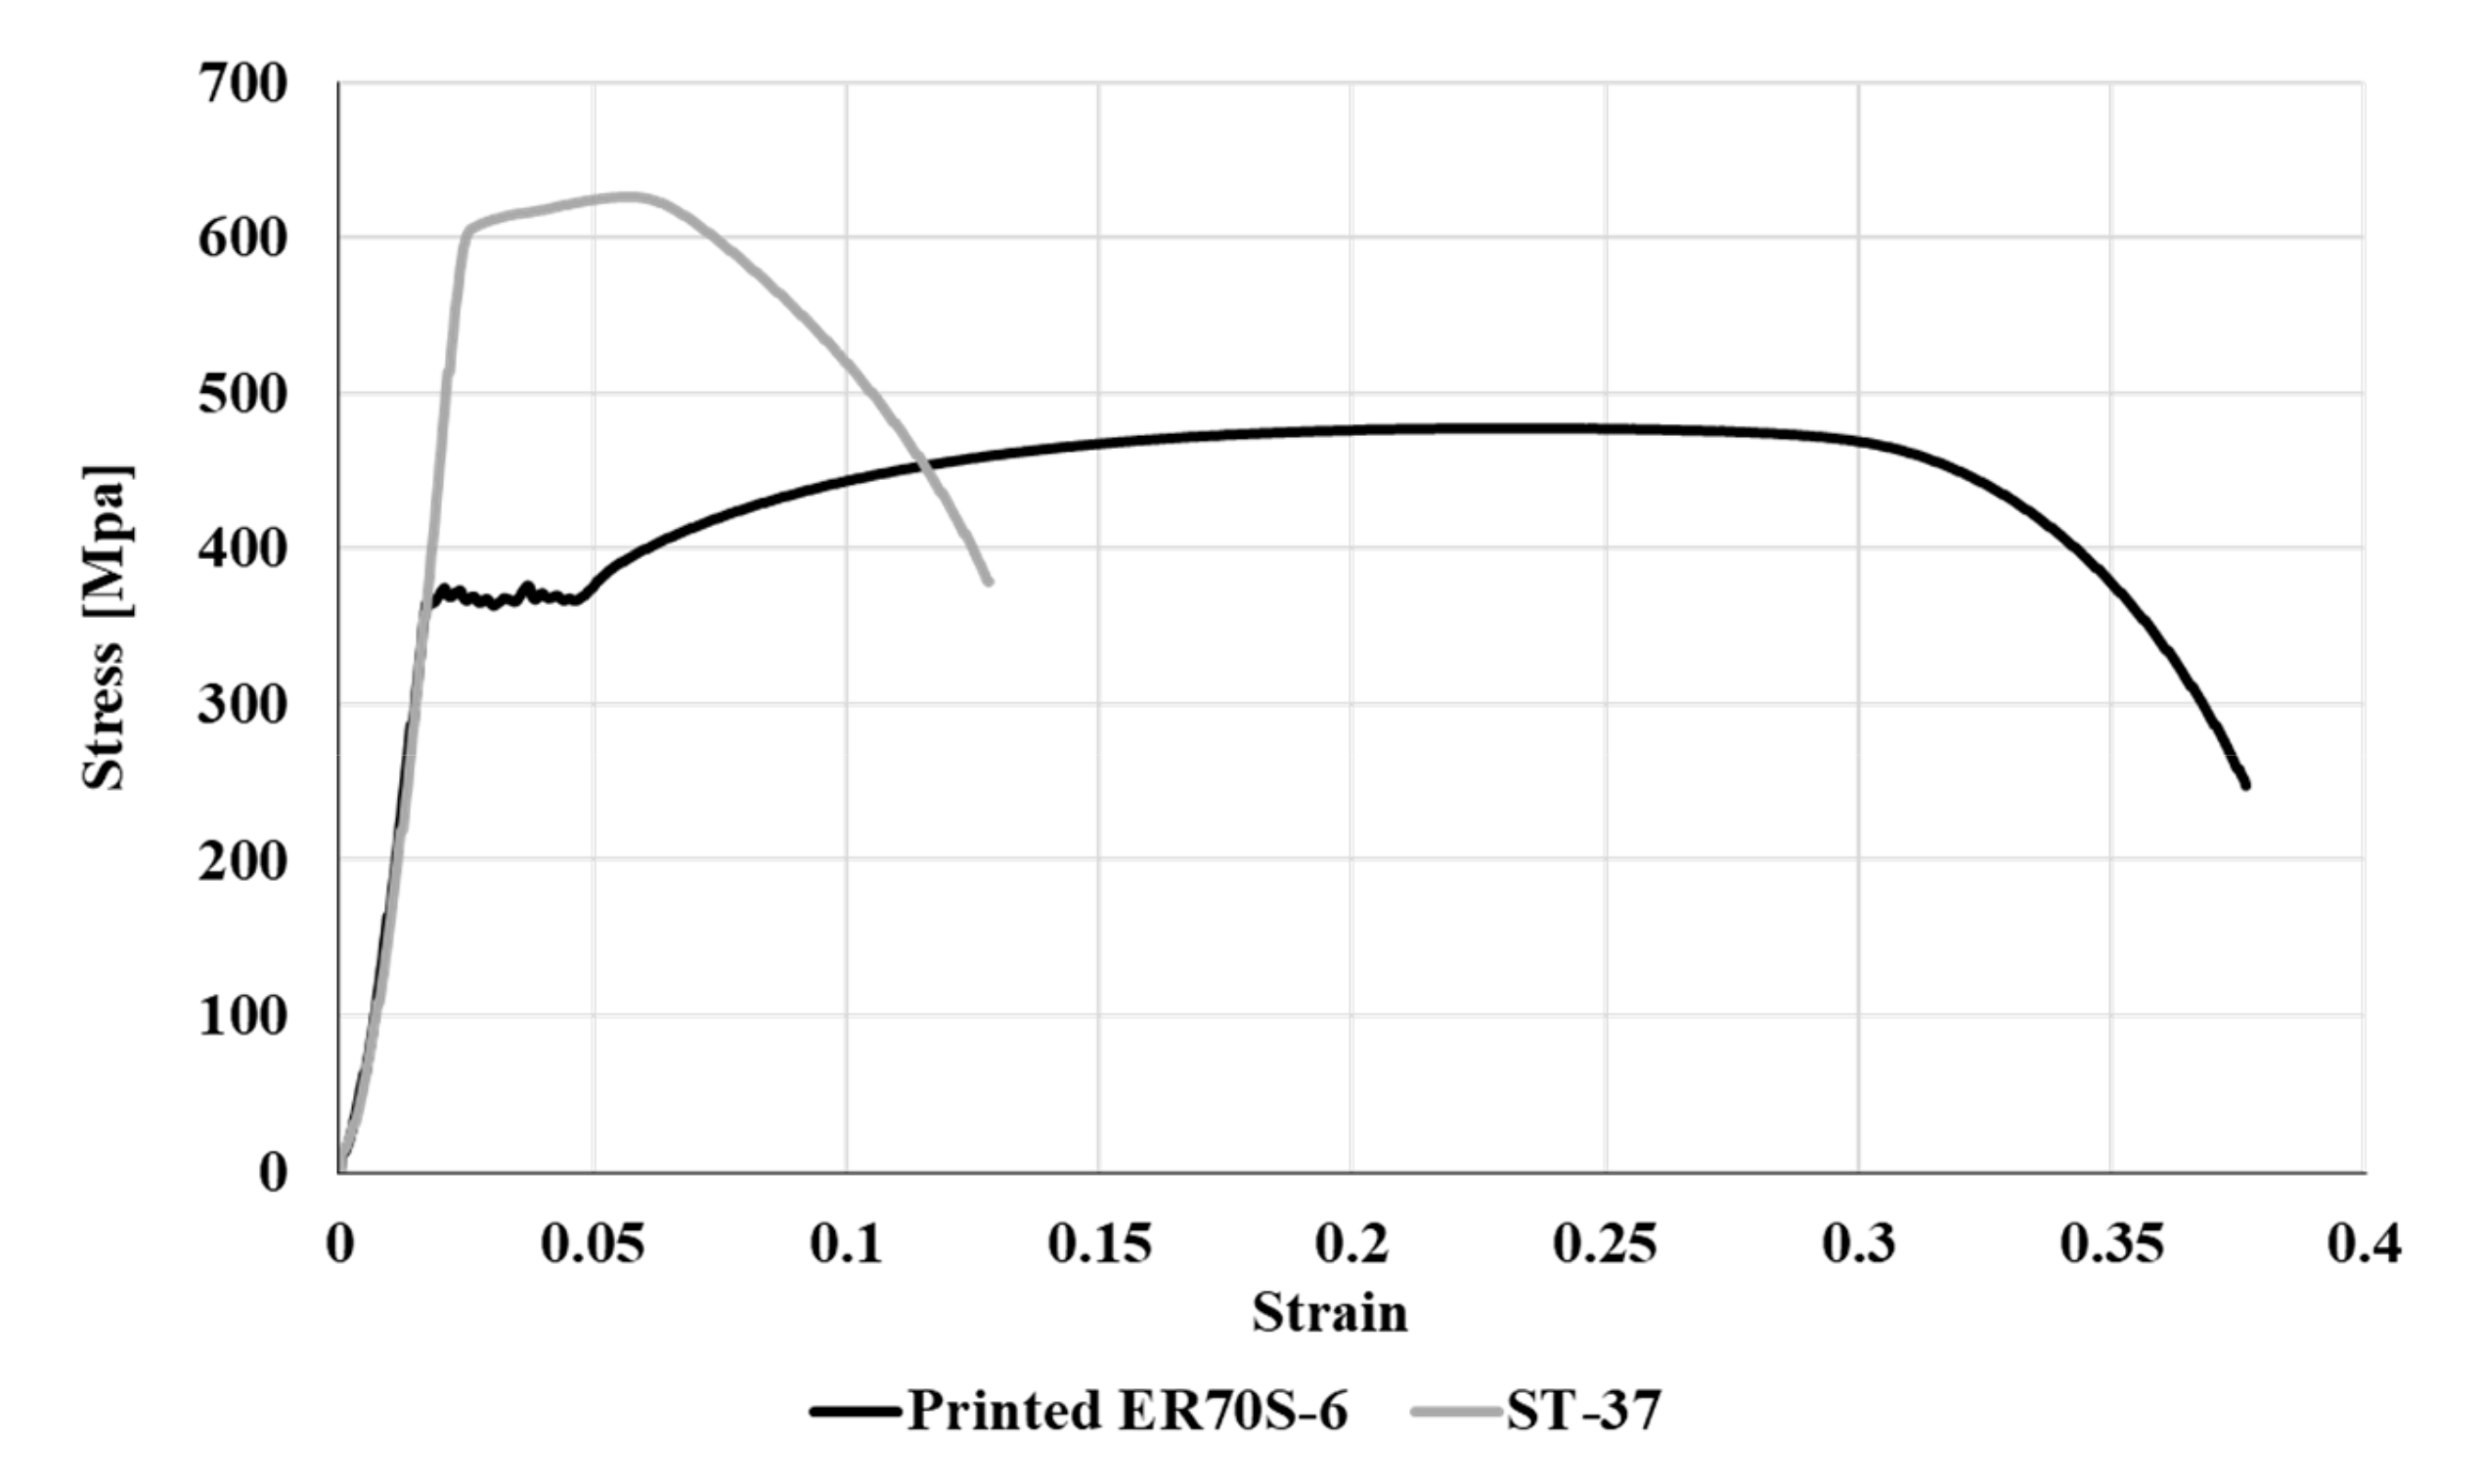
The mechanical properties of printed ER70S-6 alloy and its reference ST-37 alloy in terms of tensile strength and hardness are introduced in Table 2 along with their typical stress–strain curves shown in Figure 6. These measurements clearly revealed that the yield strength, tensile strength and hardness of the printed alloy were relatively reduced, as compared to the reference ST-37 alloy. In parallel, the ductility in terms of percent of elongation of the printed alloy was significantly increased, again as compared to the reference alloy. The differences in strength, hardness and ductility between the two alloys can be related to the reduced amount of pearlite phase in the printed alloy, as well as the plastic deformation processes encountered with the reference wrought alloy.
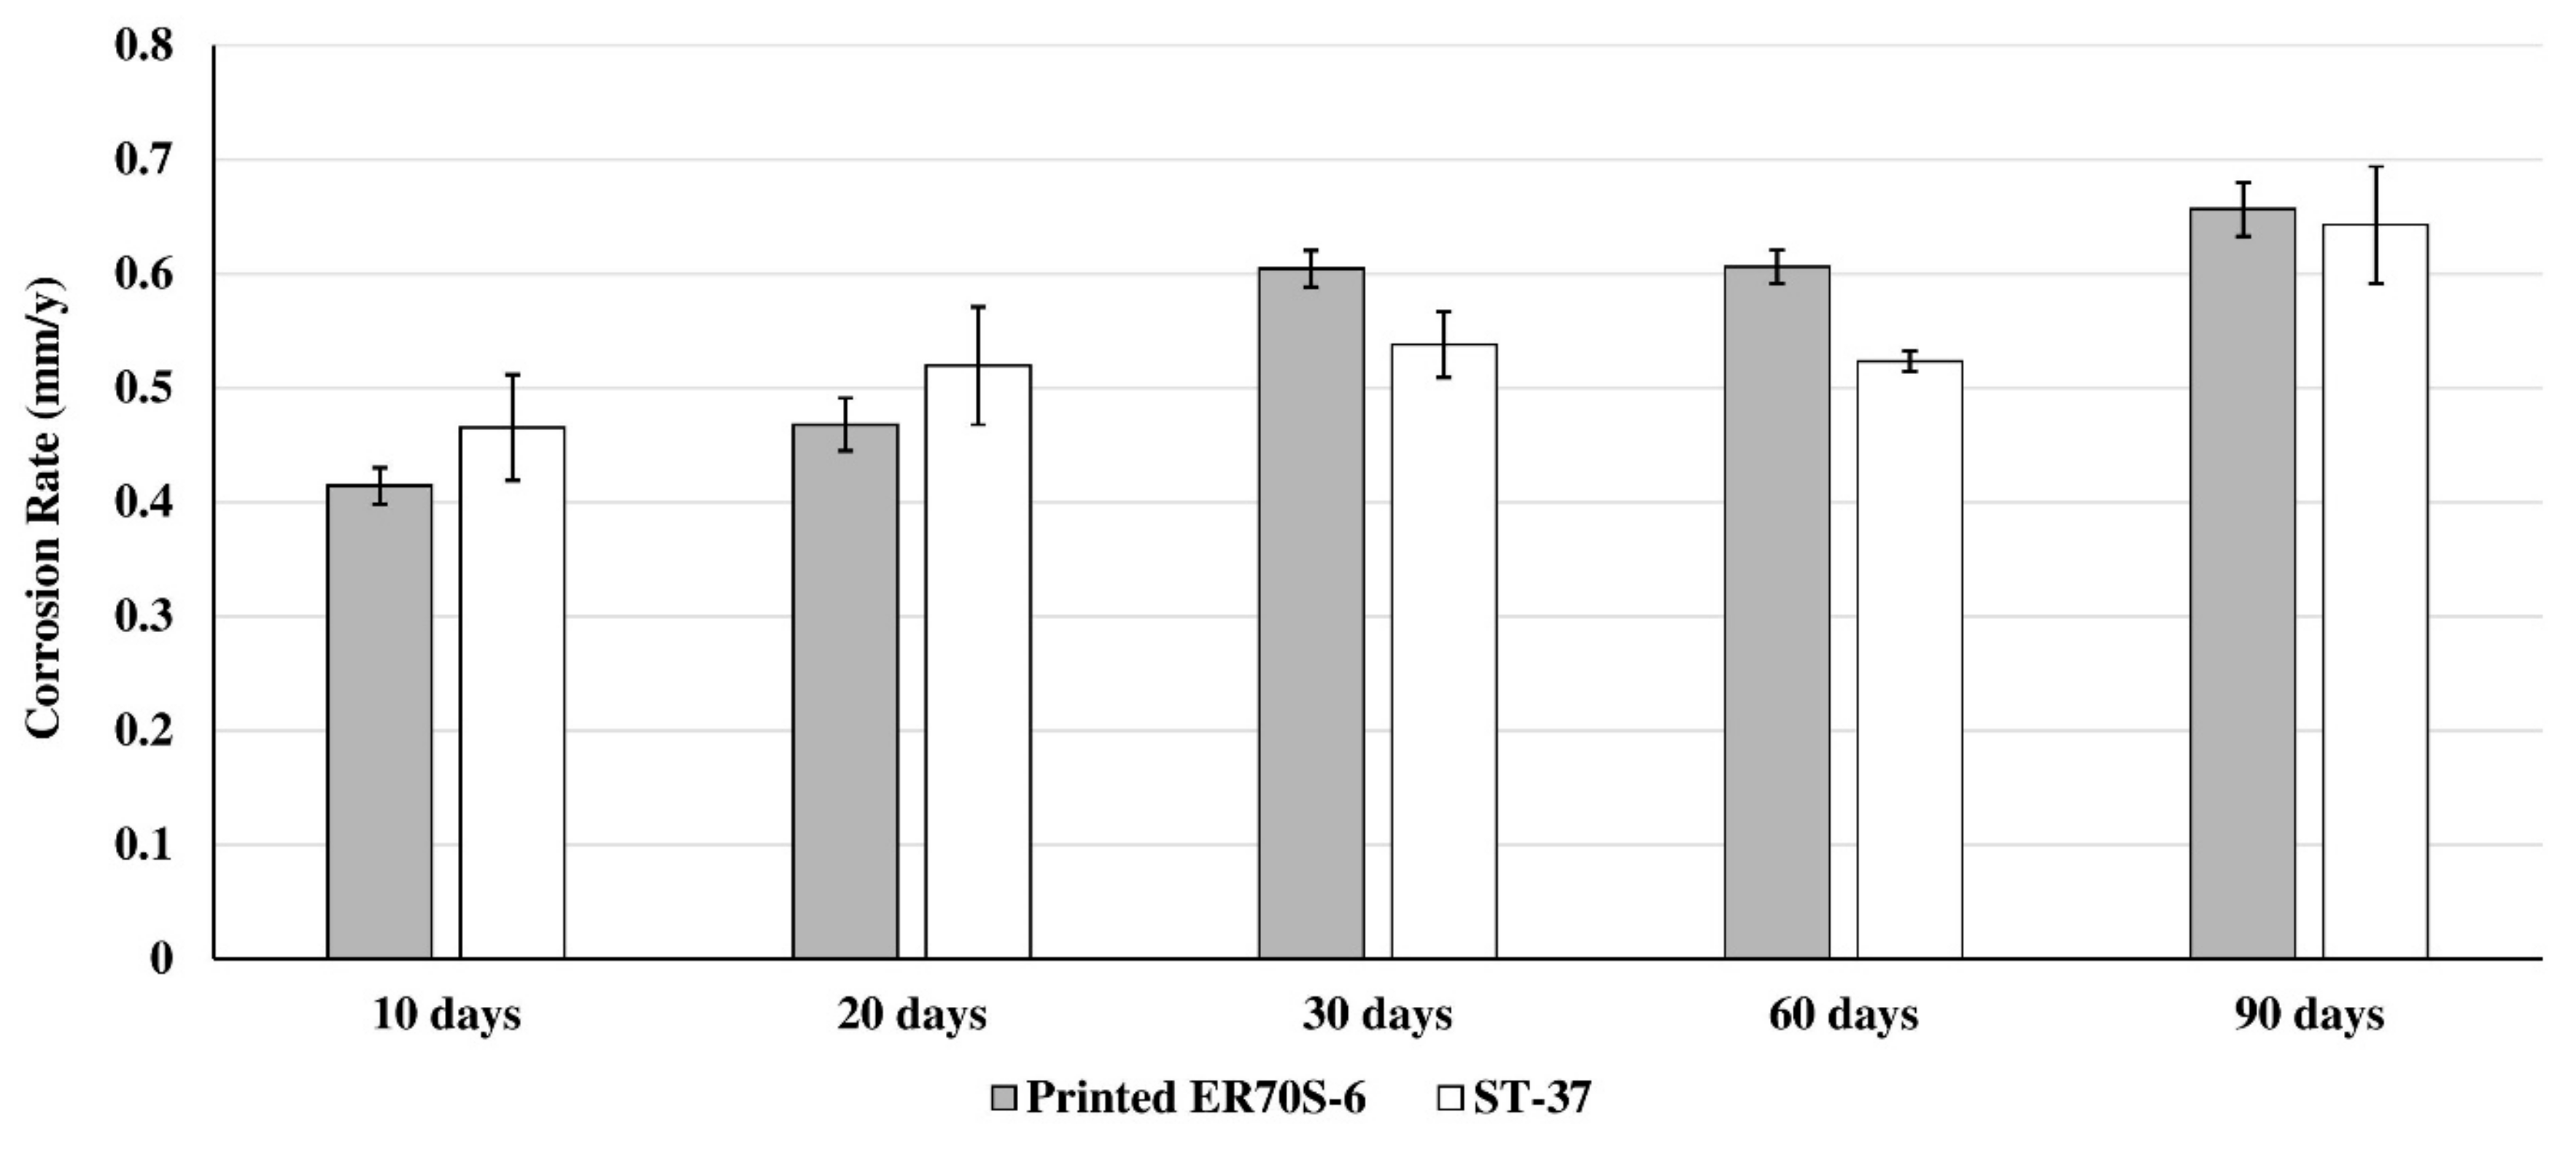
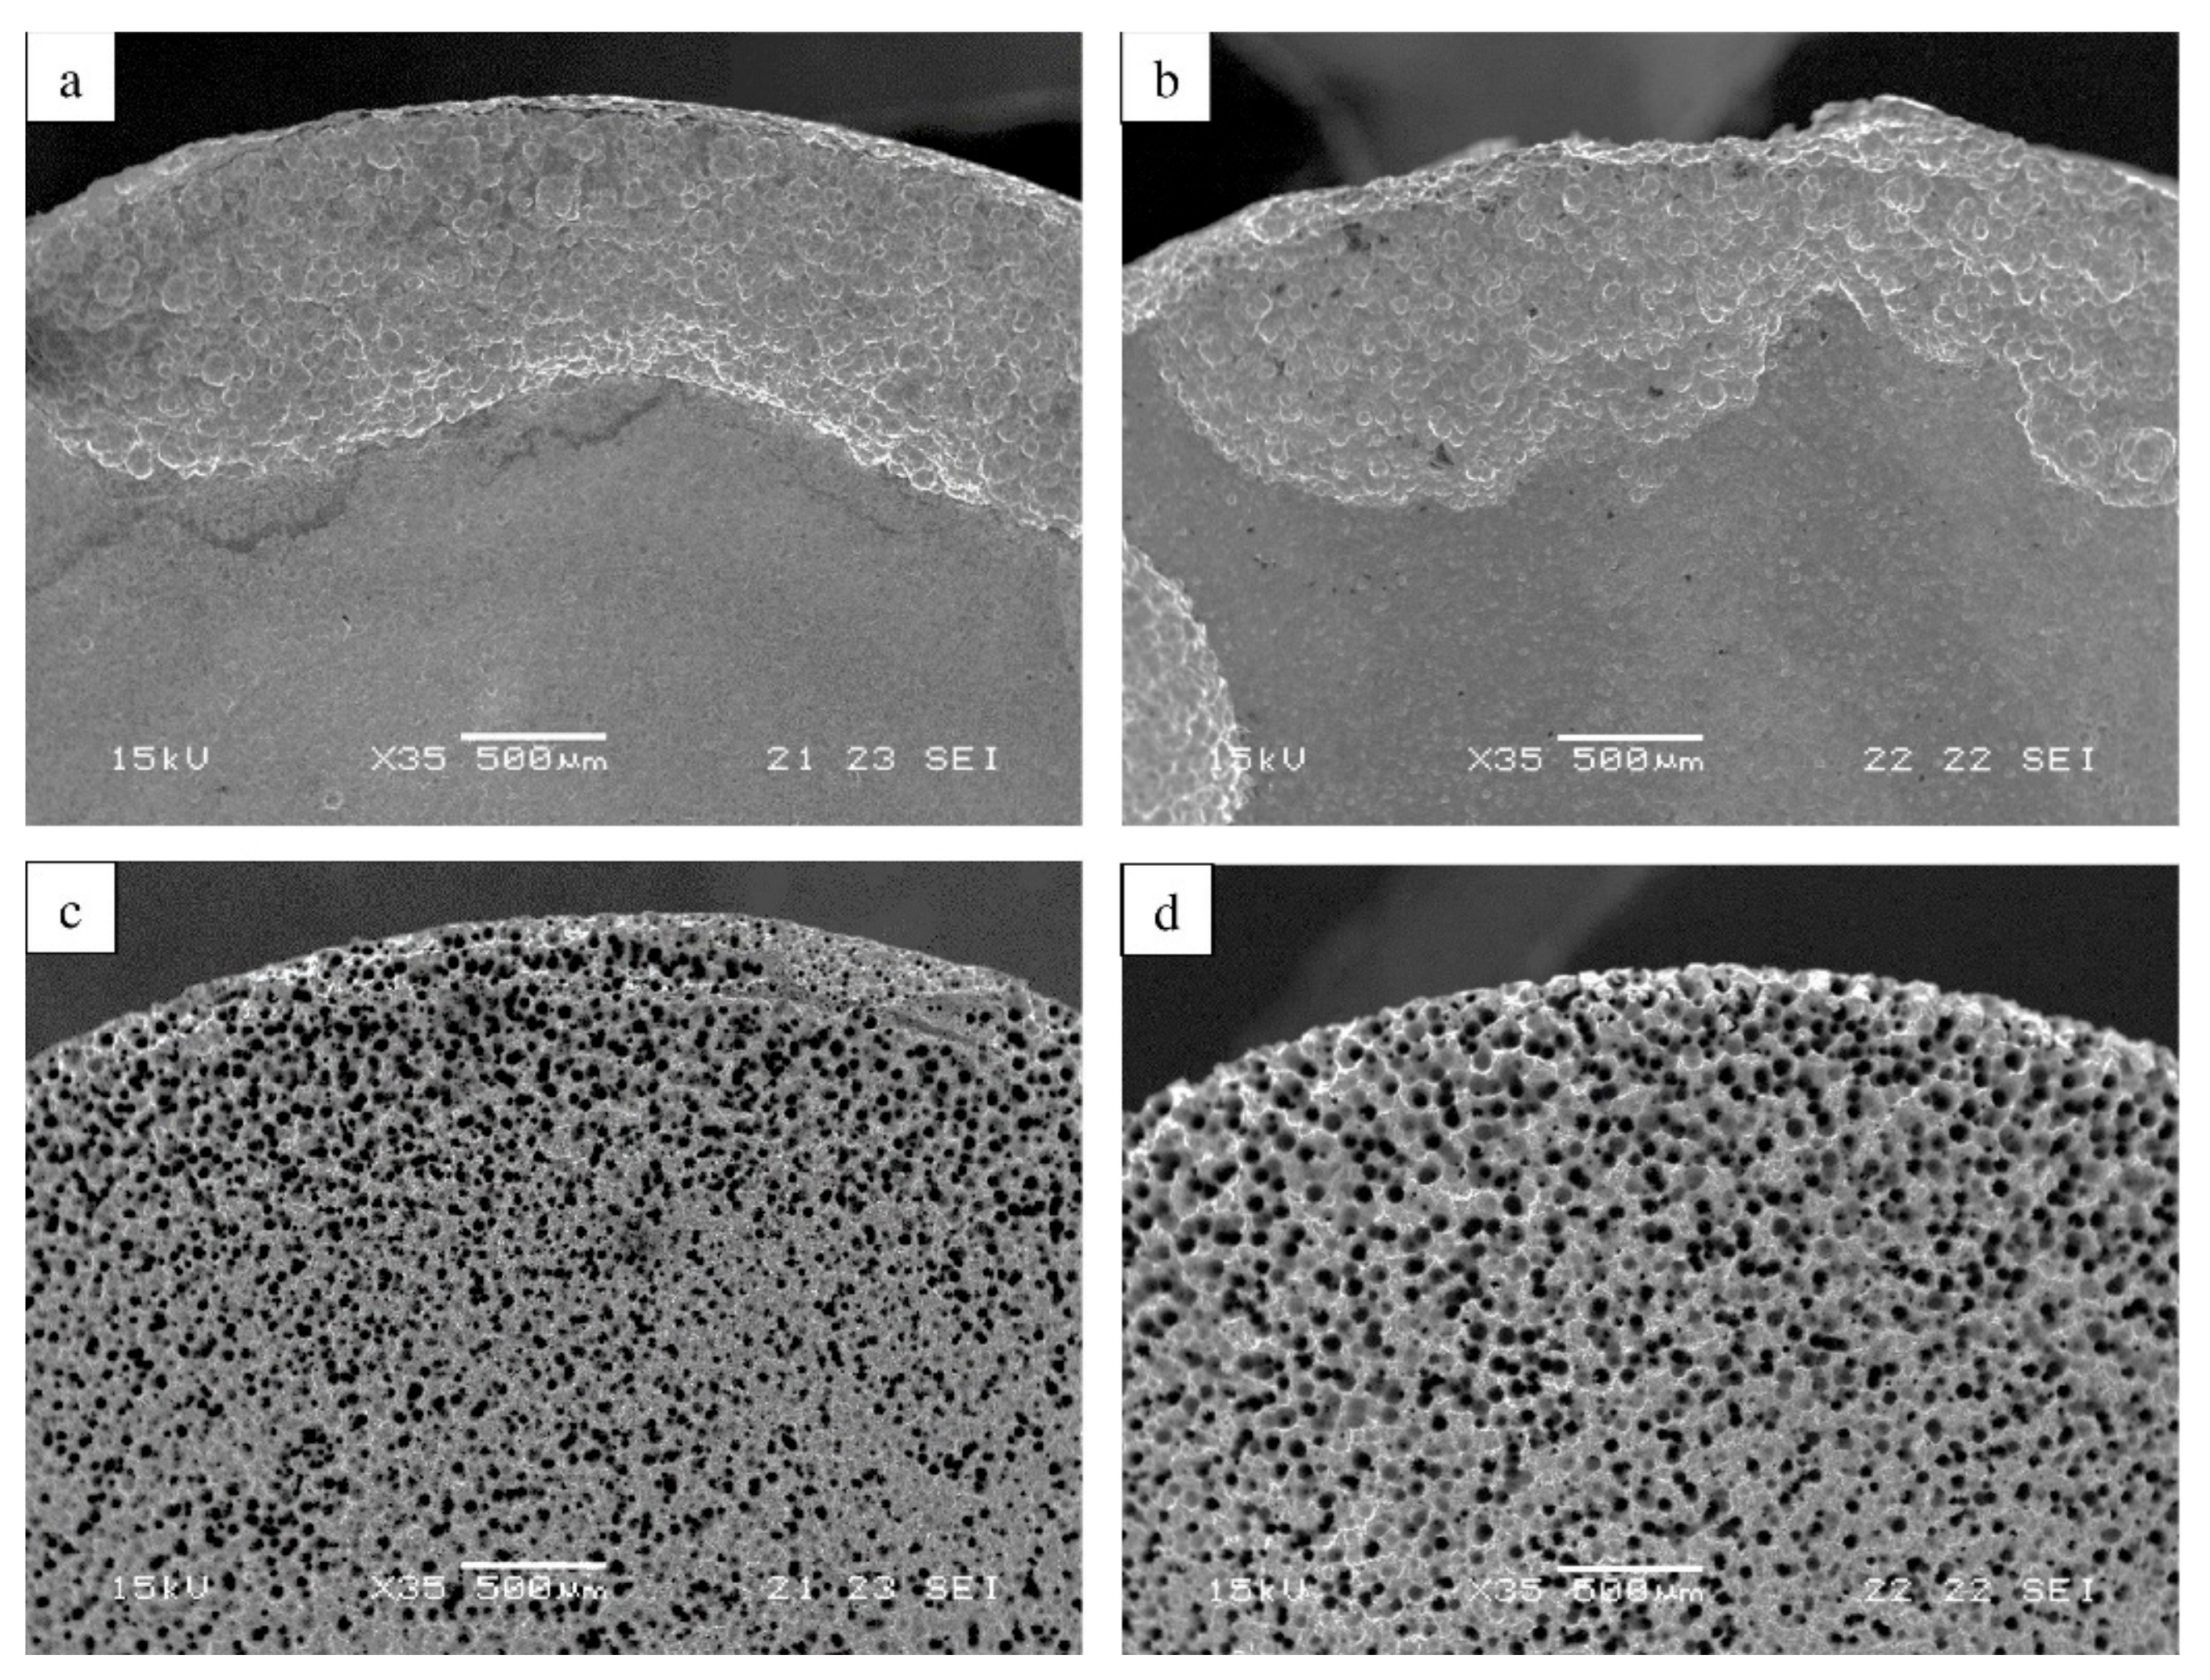
The corrosion rates of the printed ER70S-6 alloy and reference ST-37 alloy obtained after immersion tests lasting up to 90 days in 3.5% NaCl solution are shown in Figure 7. It can be seen that the corrosion rates of the two alloys were essentially quite similar. Close-up views of the surfaces of the two alloys after immersion tests of 60 and 90 days are shown in Figure 8 and clearly indicate that the corrosion degradation mechanisms of the two alloys were significantly different, although the corrosion rates were similar. The printed alloy showed a uniform exfoliation corrosion process, while the reference alloy presented corrosion degradation that was generated from localized corrosion sites that eventually produced a porous area. The significant dissimilarities between the two corrosion mechanisms can be related to differences in the microstructure of the two alloys and, in particular, may be related to the different contents of the pearlite phase that can generate micro-galvanic corrosion attack.
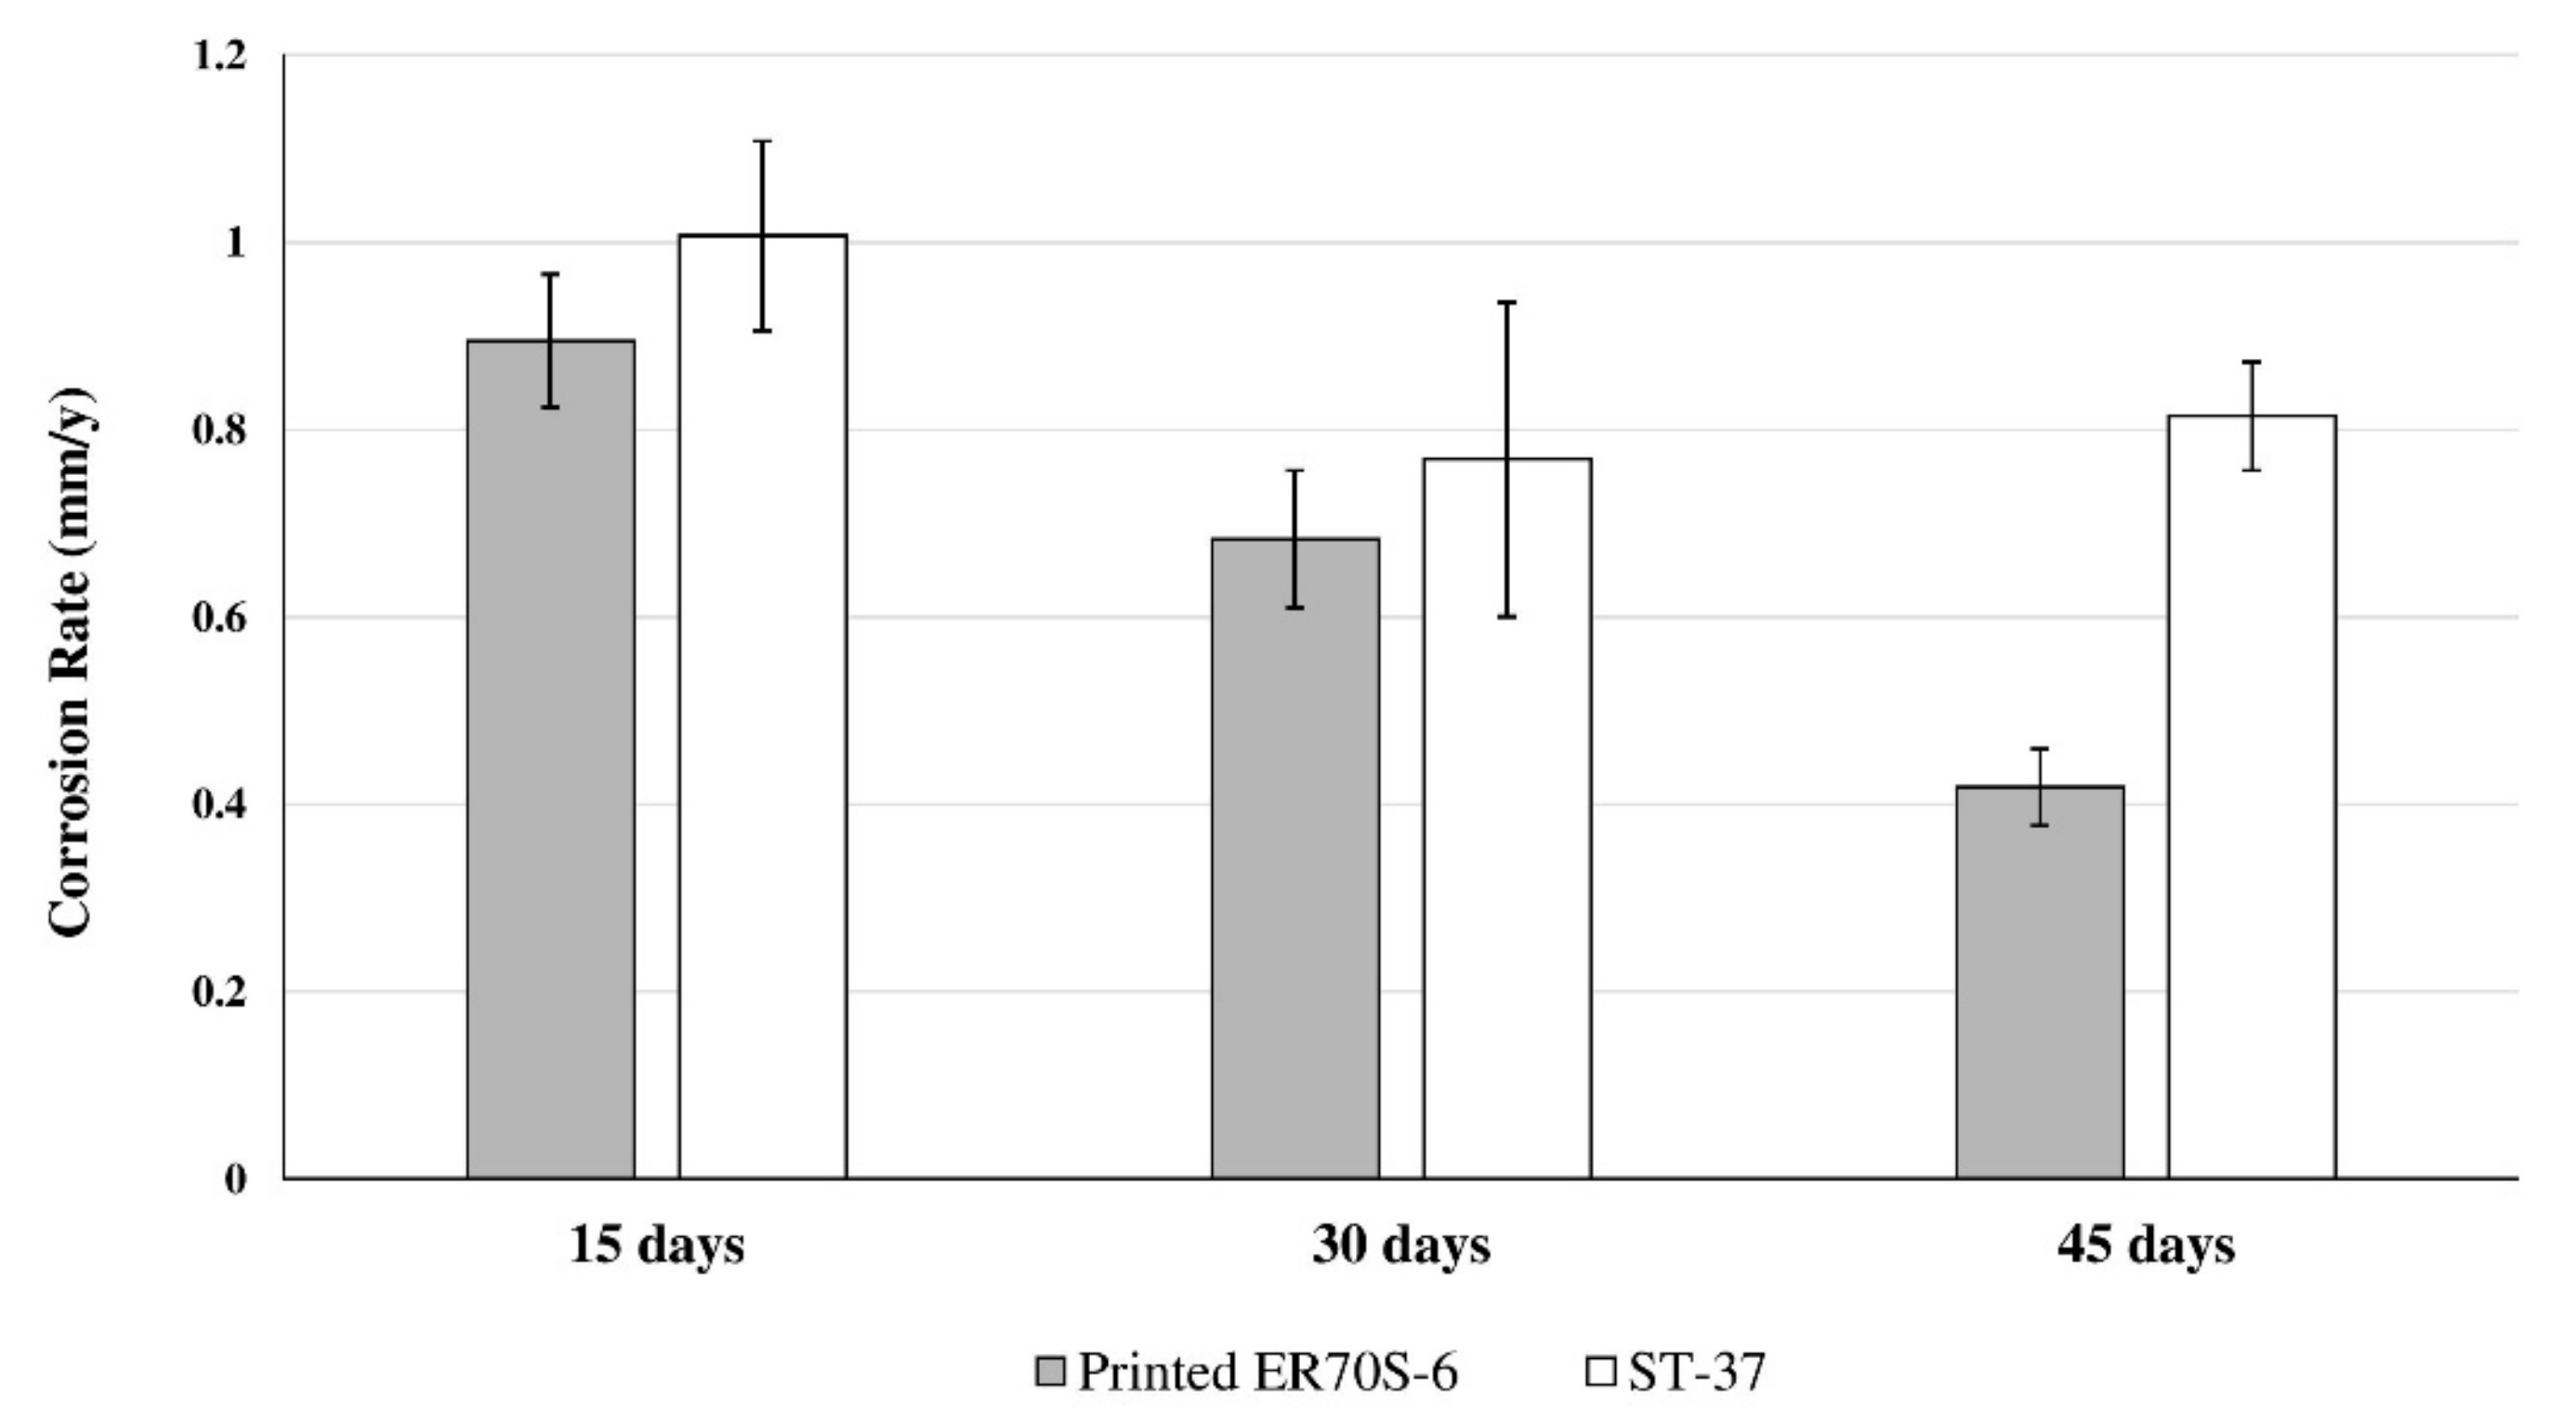
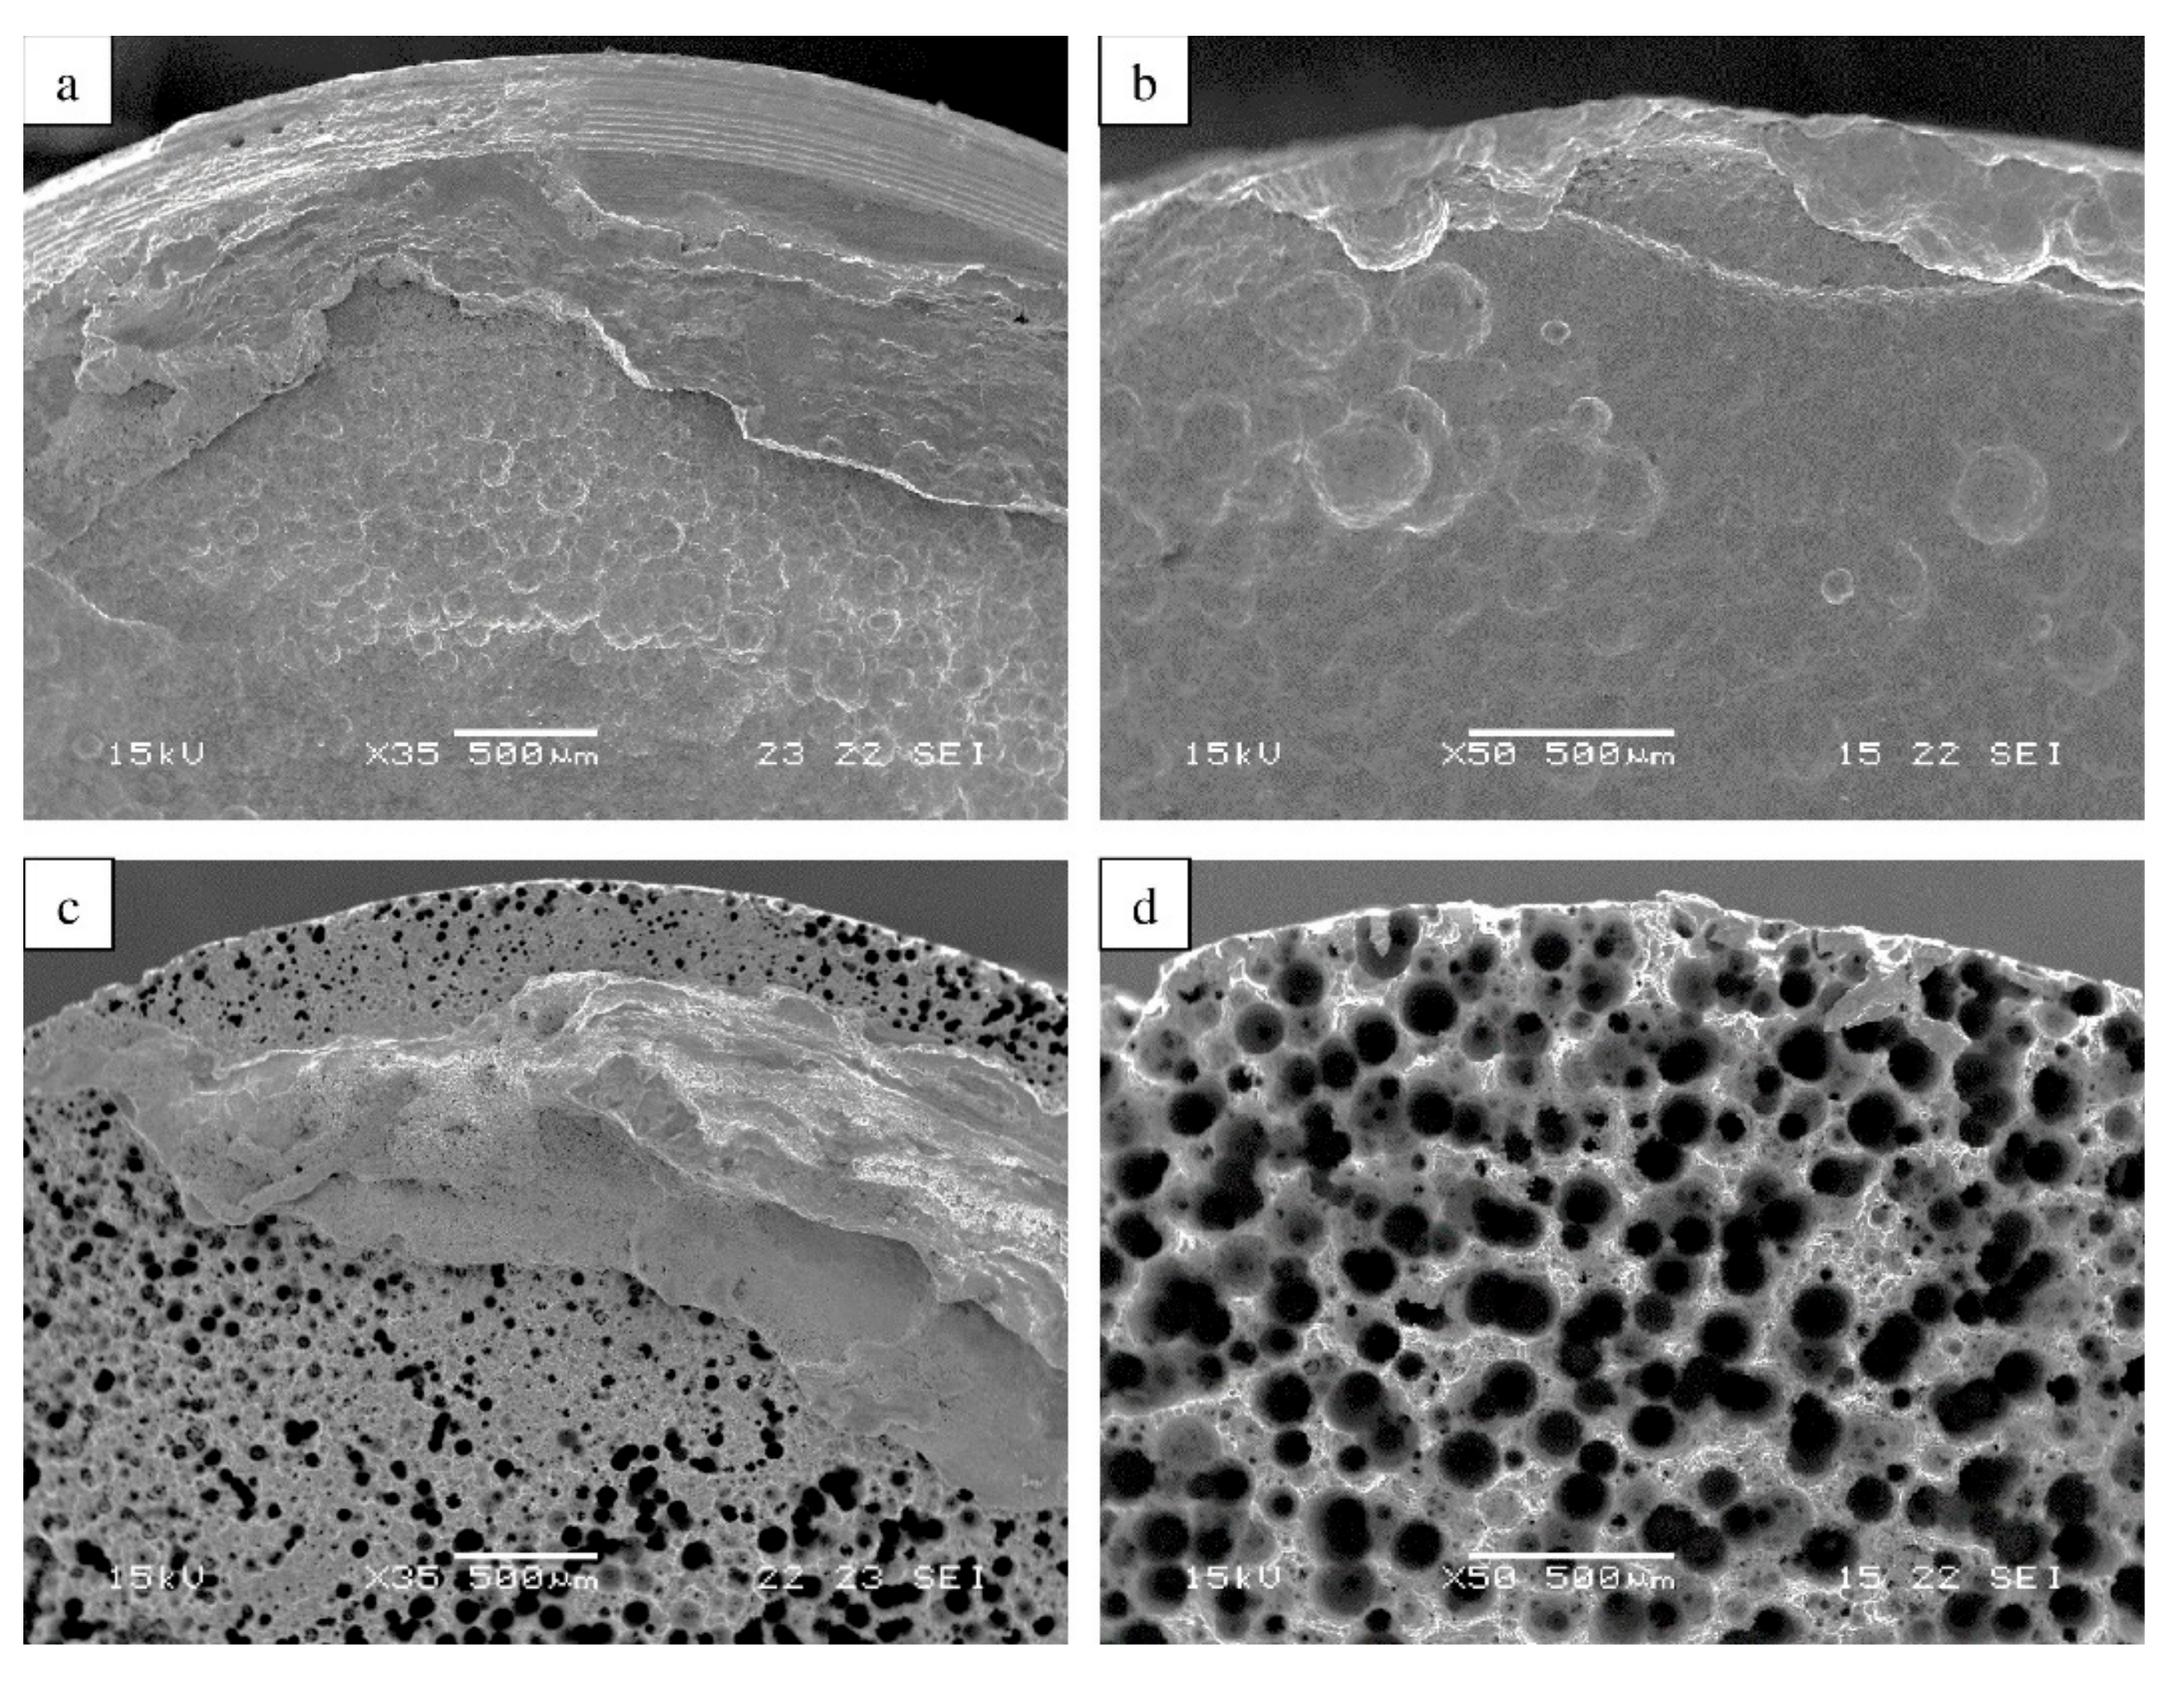
The corrosion resistances of printed ER70S-6 and reference ST-37 alloys after salt spray testing for up to 45 days are shown in Figure 9. This again showed that the corrosion rates of the two alloys were relatively similar. Close-up views of corrosion attack in the two alloys, shown in Figure 10, clearly indicate that the mechanisms of corrosion attack were similar to that realized in the immersion tests. However, it should be noted that the corrosion rates obtained upon salt spray testing were relatively higher, as compared to those from the immersion test, mainly due to the relatively increased aggressiveness of the environment in the former. This can be mainly attributed to the higher testing temperature (35 °C) and refreshment of the oxygen supply generated by air flow in the salt spray chamber.
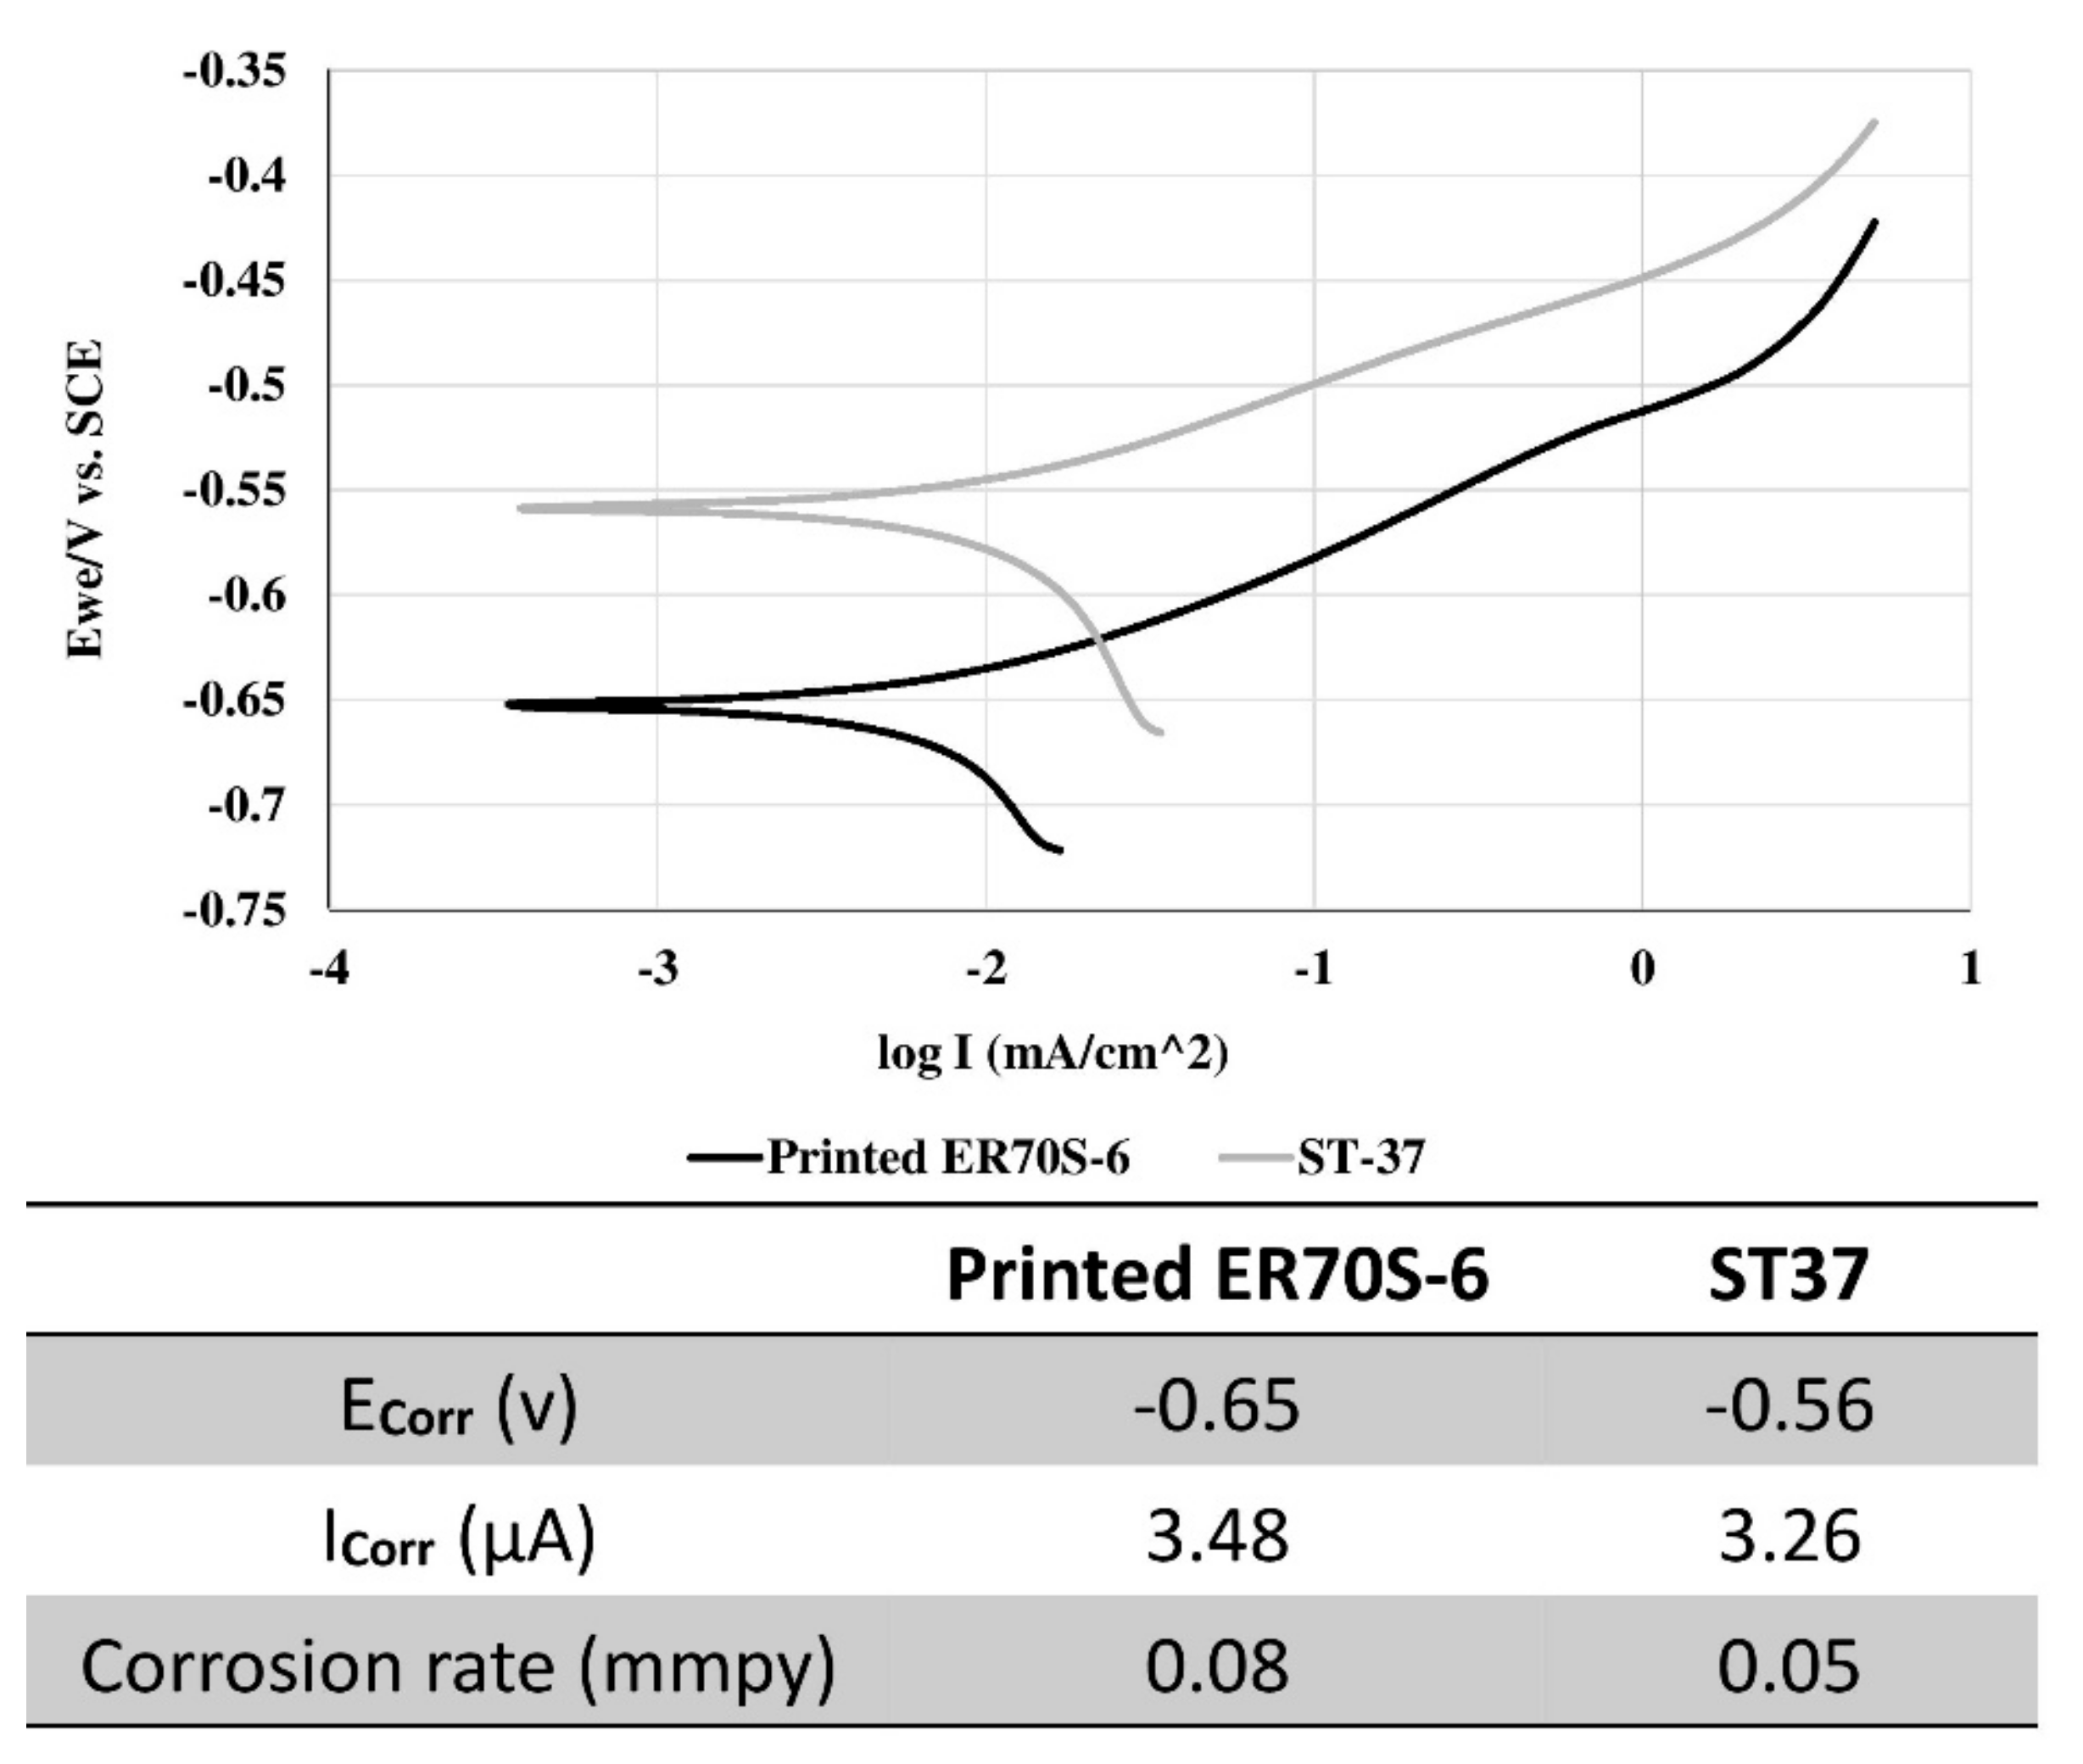
Electrochemical examination of the printed ER70S-6 alloy and reference ST-37 alloy in terms of potentiodynamic polarization analysis is shown in Figure 11. This revealed that the configurations of the polarization curves of the two alloys were quite similar, with a slight elevation seen in the potential of the reference alloy (corrosion potential: −0.63 V vs. −0.56 V, respectively). Tafel extrapolation measurements showed that the corrosion rate of the printed alloy was relatively close to that of the reference alloy (0.08 and 0.05 mmpy, respectively). This may represent similar corrosion resistance and hence, basically falls in line with the results reported by immersion and salt spray testing.
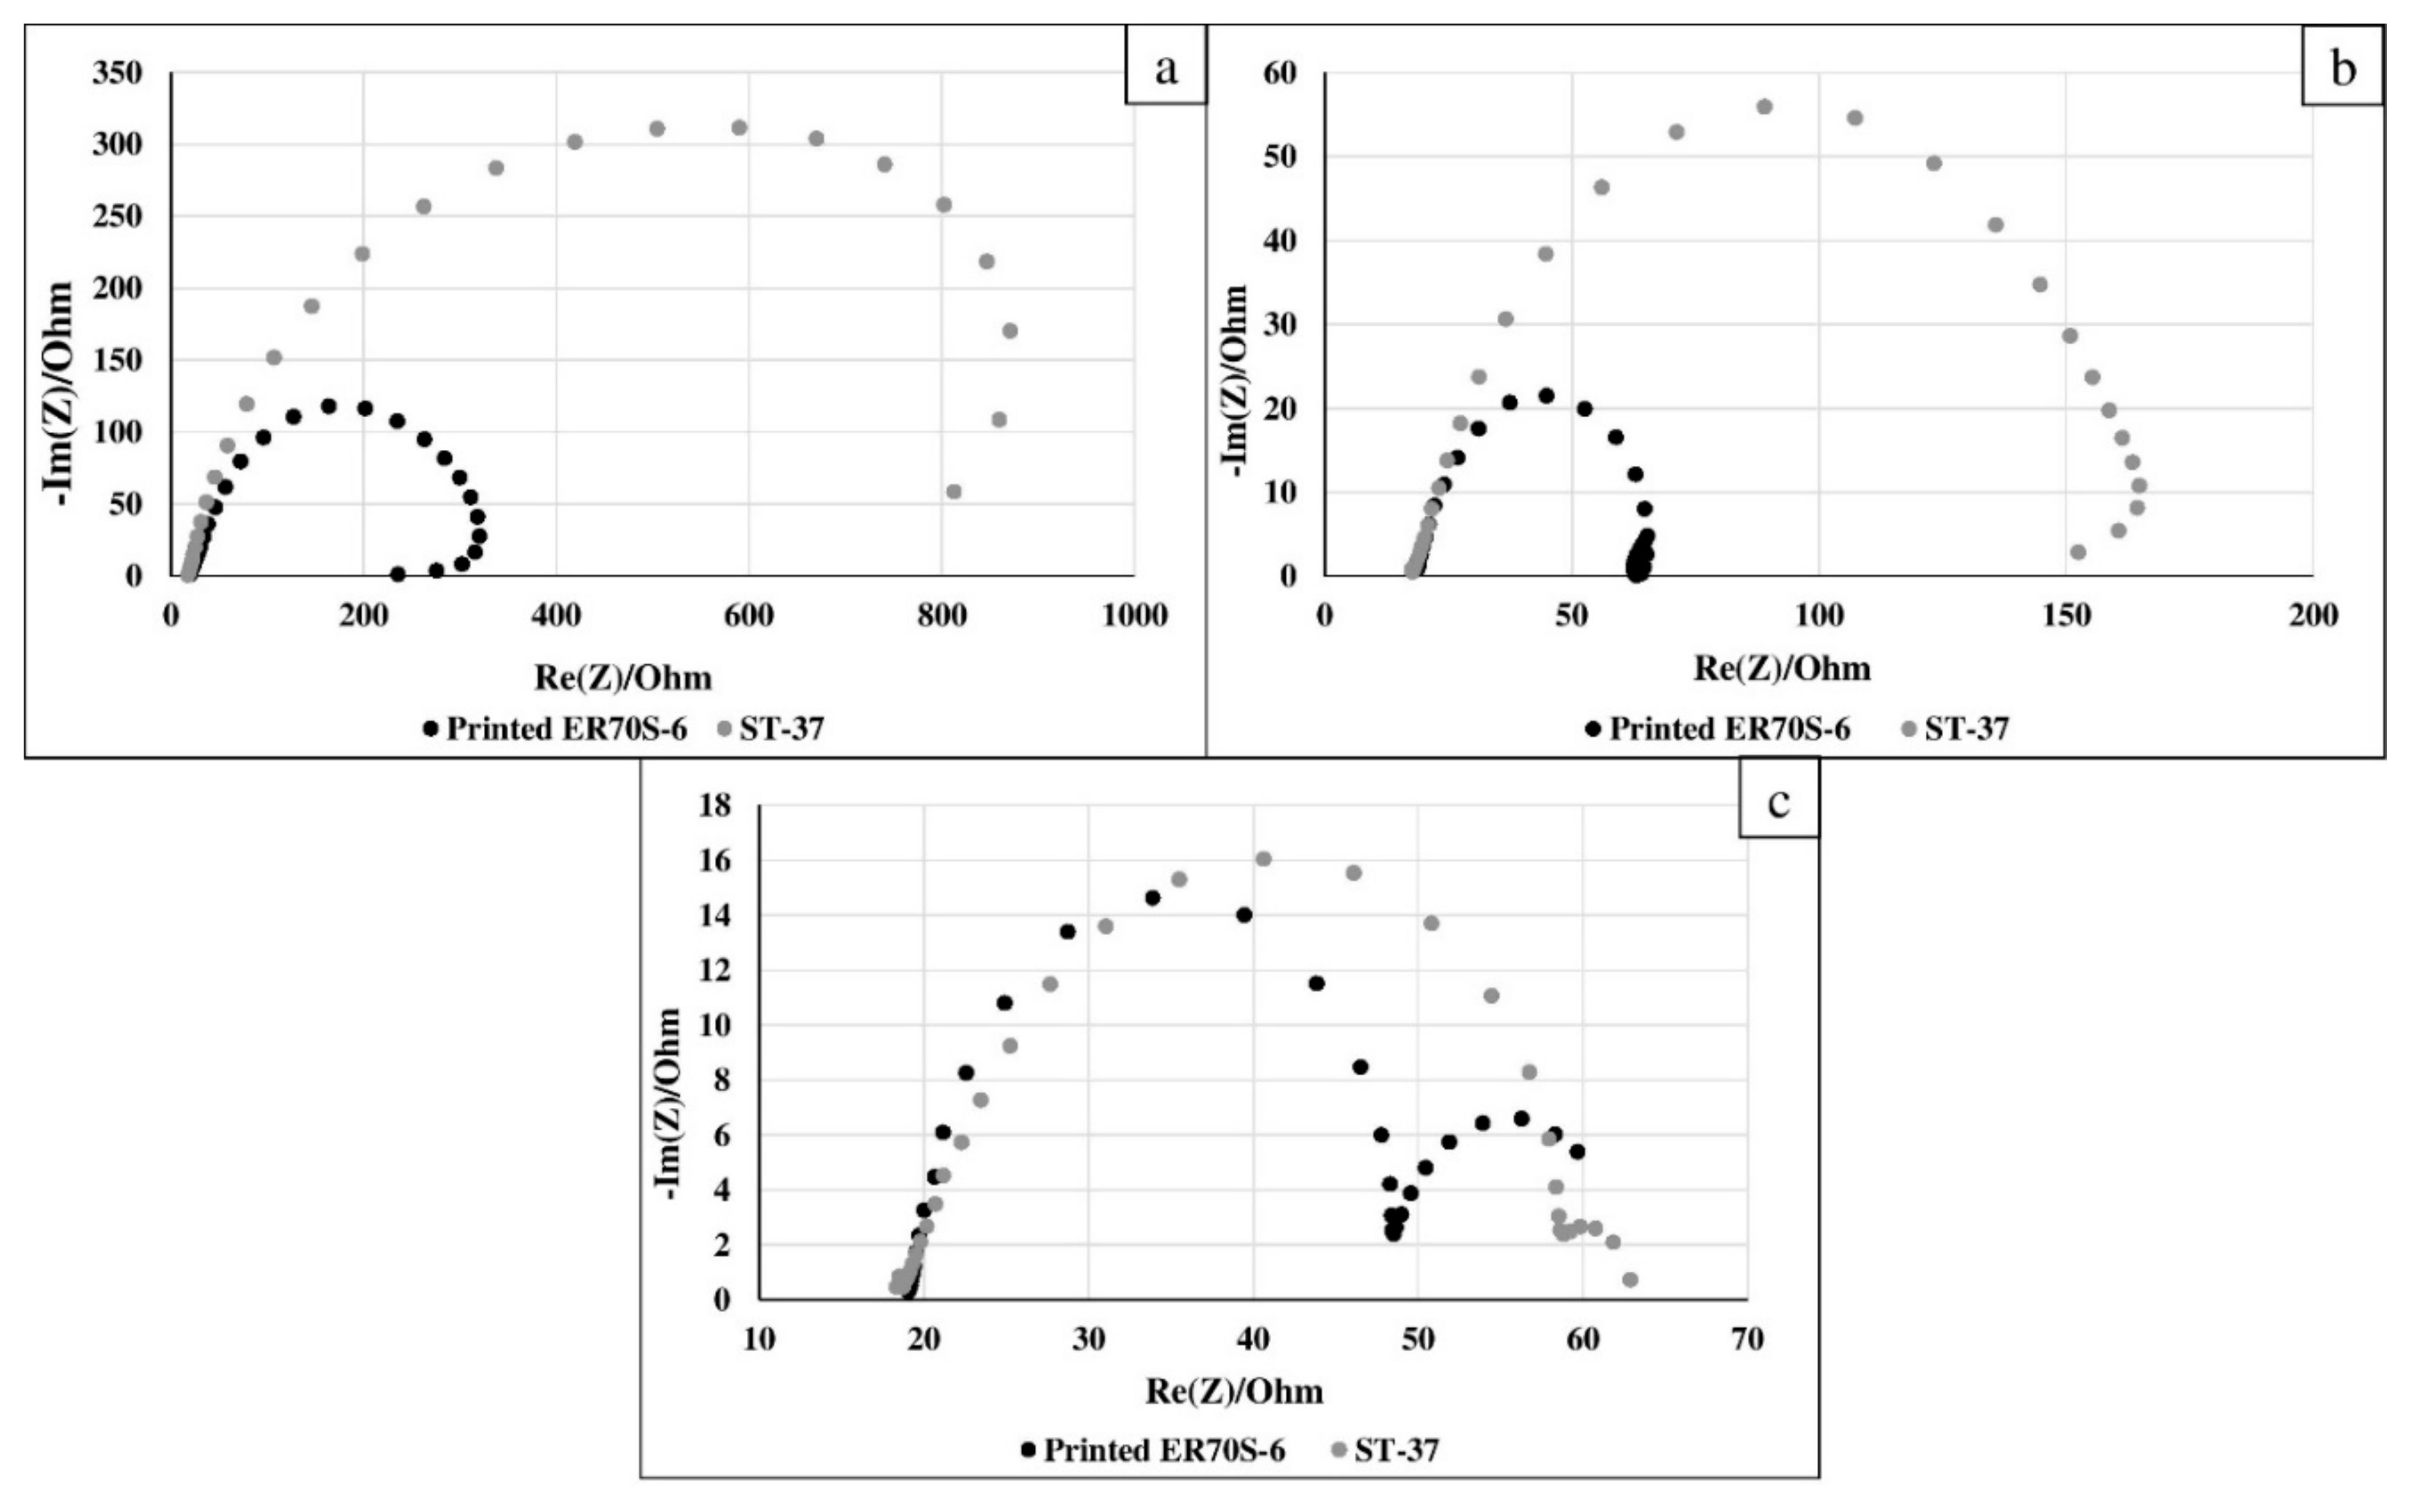
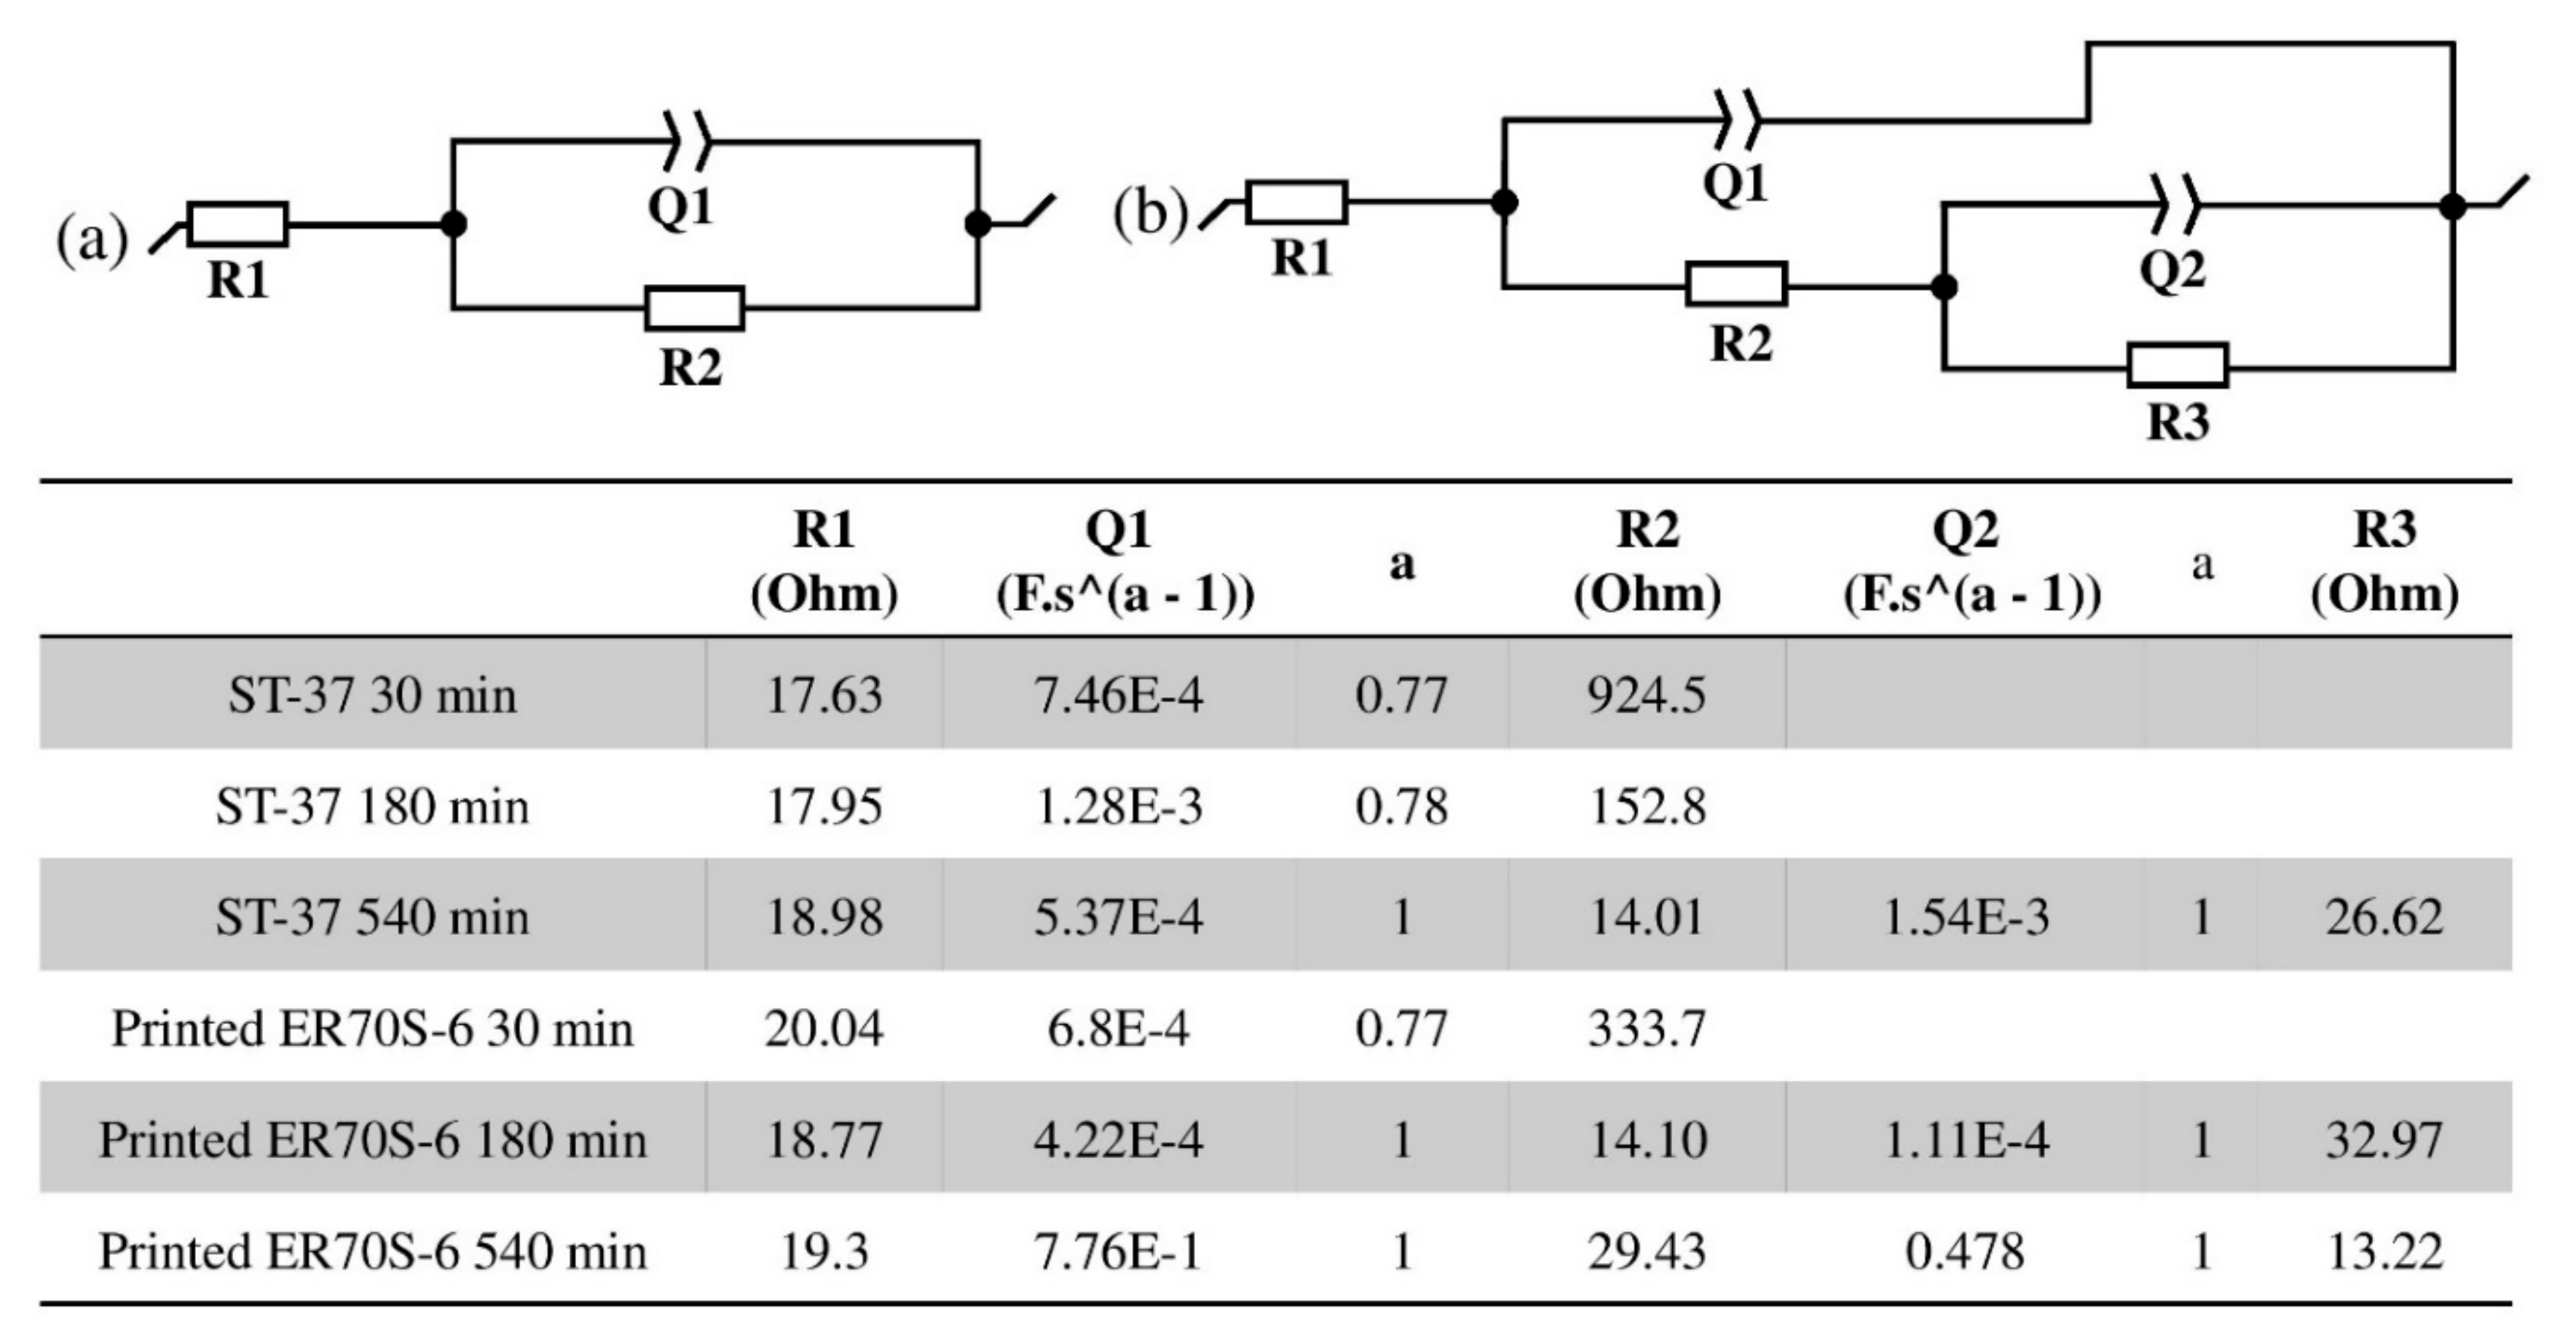
EIS analysis of the printed ER70S-6 and reference ST-37 alloys in terms of impedance variation after immersions of 30, 180 and 540 min in 3.5% NaCl solution are shown as Nyquist plots in Figure 12. After 30 min of immersion, the radius of curvature of the reference alloy in the Nyquist diagram was comparatively increased, indicating that its corrosion resistance was relatively improved, as compared to that of the printed sample. However, after 180 min of immersion, the difference in the curvature radius was significantly reduced, and after an immersion of 540 min, the curvature radii of the two alloys were nearly the same, which indicates that their corrosion resistances were quite similar. The two semi-circles obtained after a 540 min immersion represent different physical conditions, whereby the first semi-circle reflects the double layer, while the second is related to the effects of corrosion products [18]. The corresponding electrical equivalent circuits, along with the related fitted parameters for the initial and long-term immersion, are shown in Figure 13a,b, respectively. The fitted parameters include the following factors: R1—solution resistance, R2 and Q1 (capacitor), related to the double layer [19,20], R3 and Q2, corresponding to charge transfer resistance and capacitor, respectively, which are related to the effect of corrosion products and the time constant that appeared in the low frequency region [21,22].
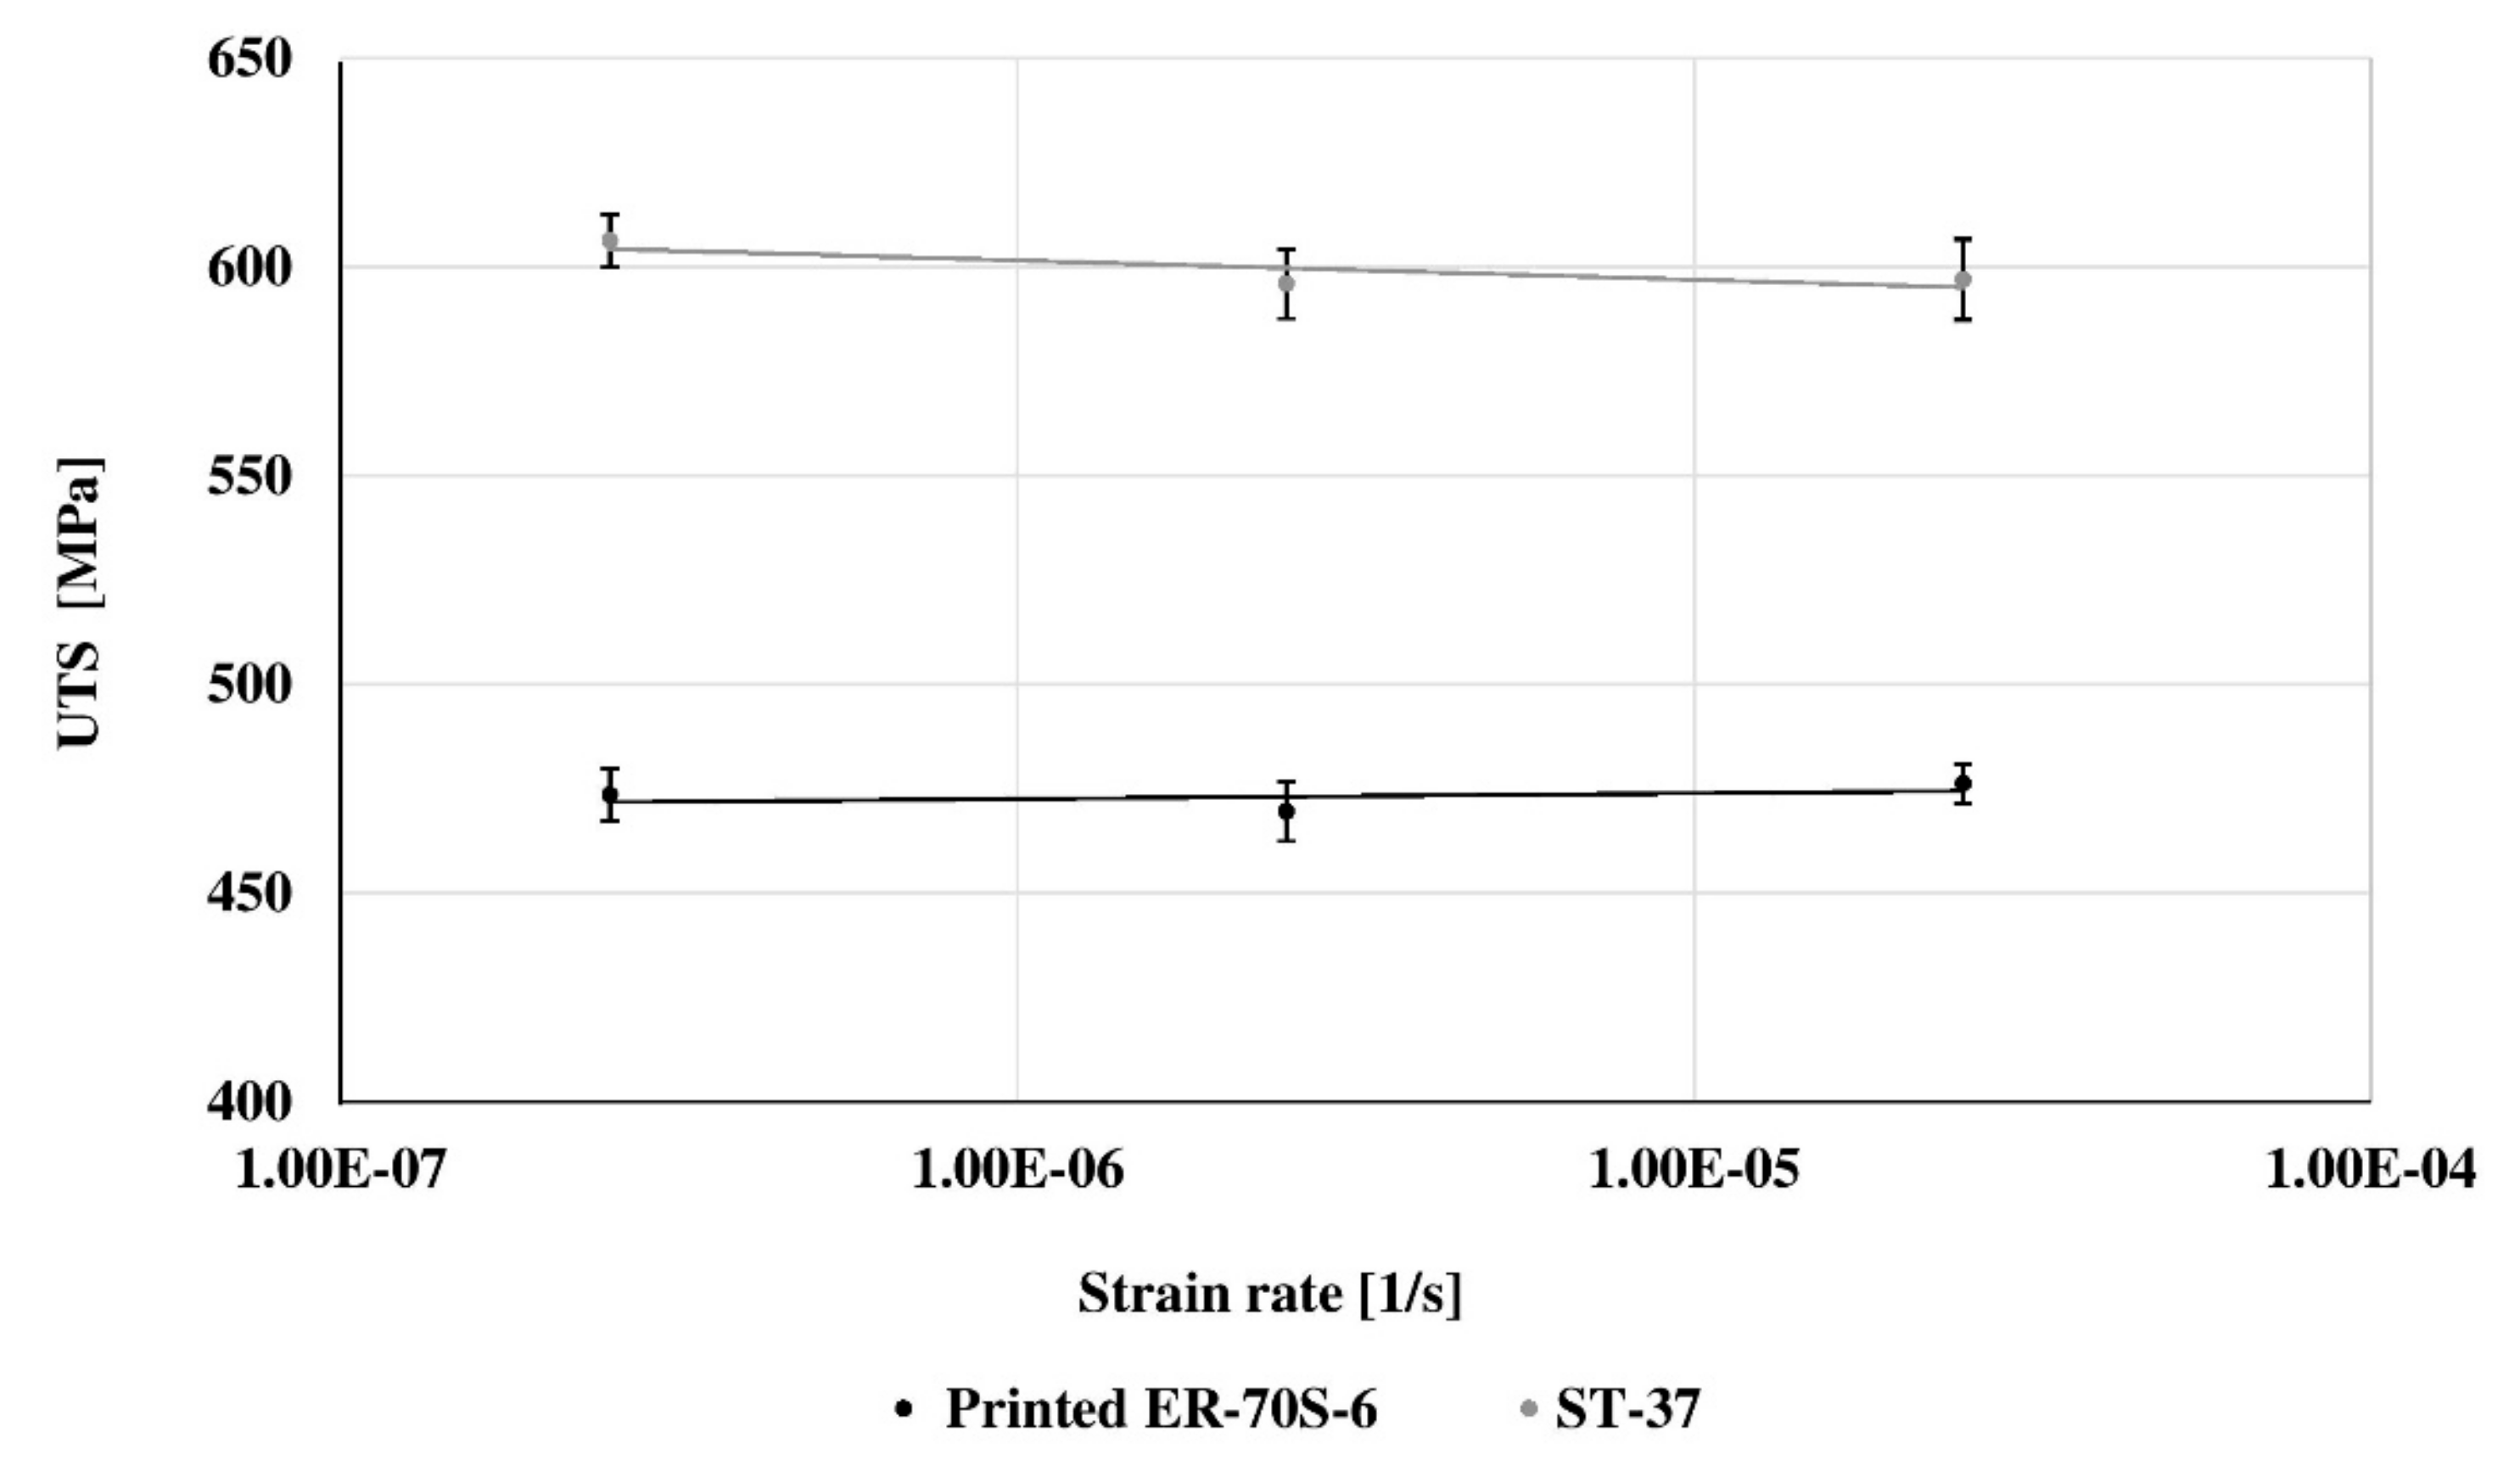
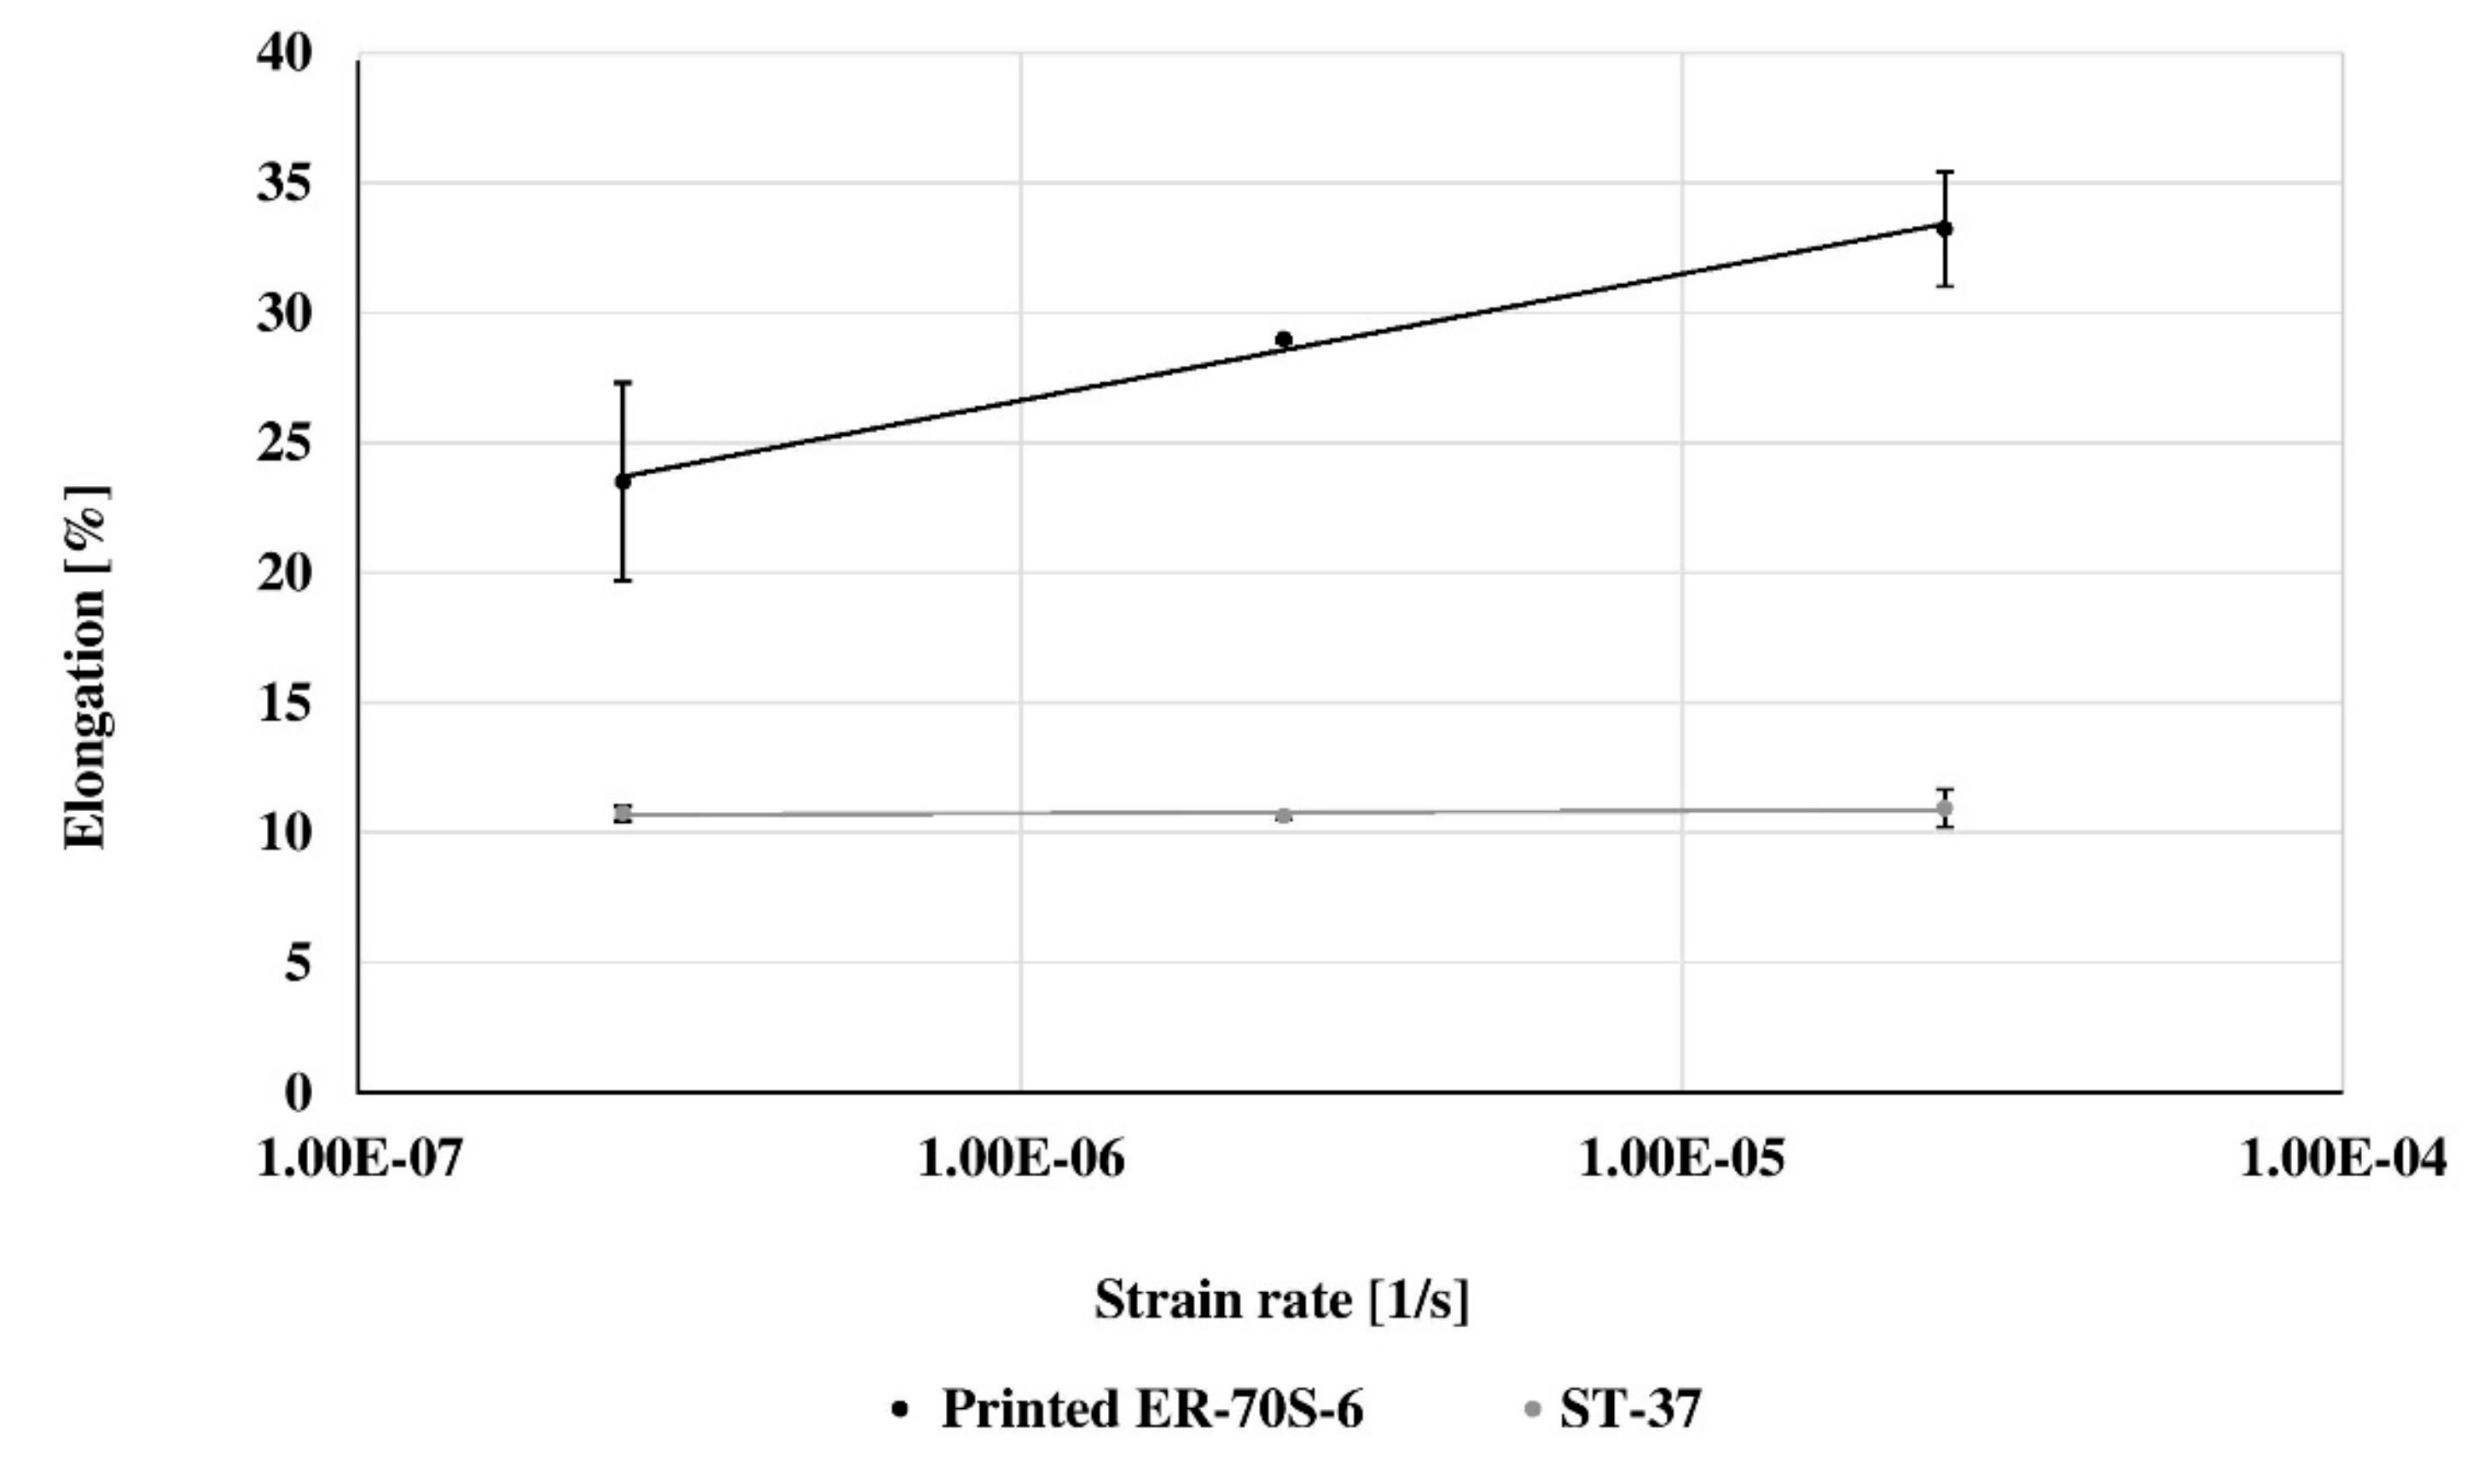
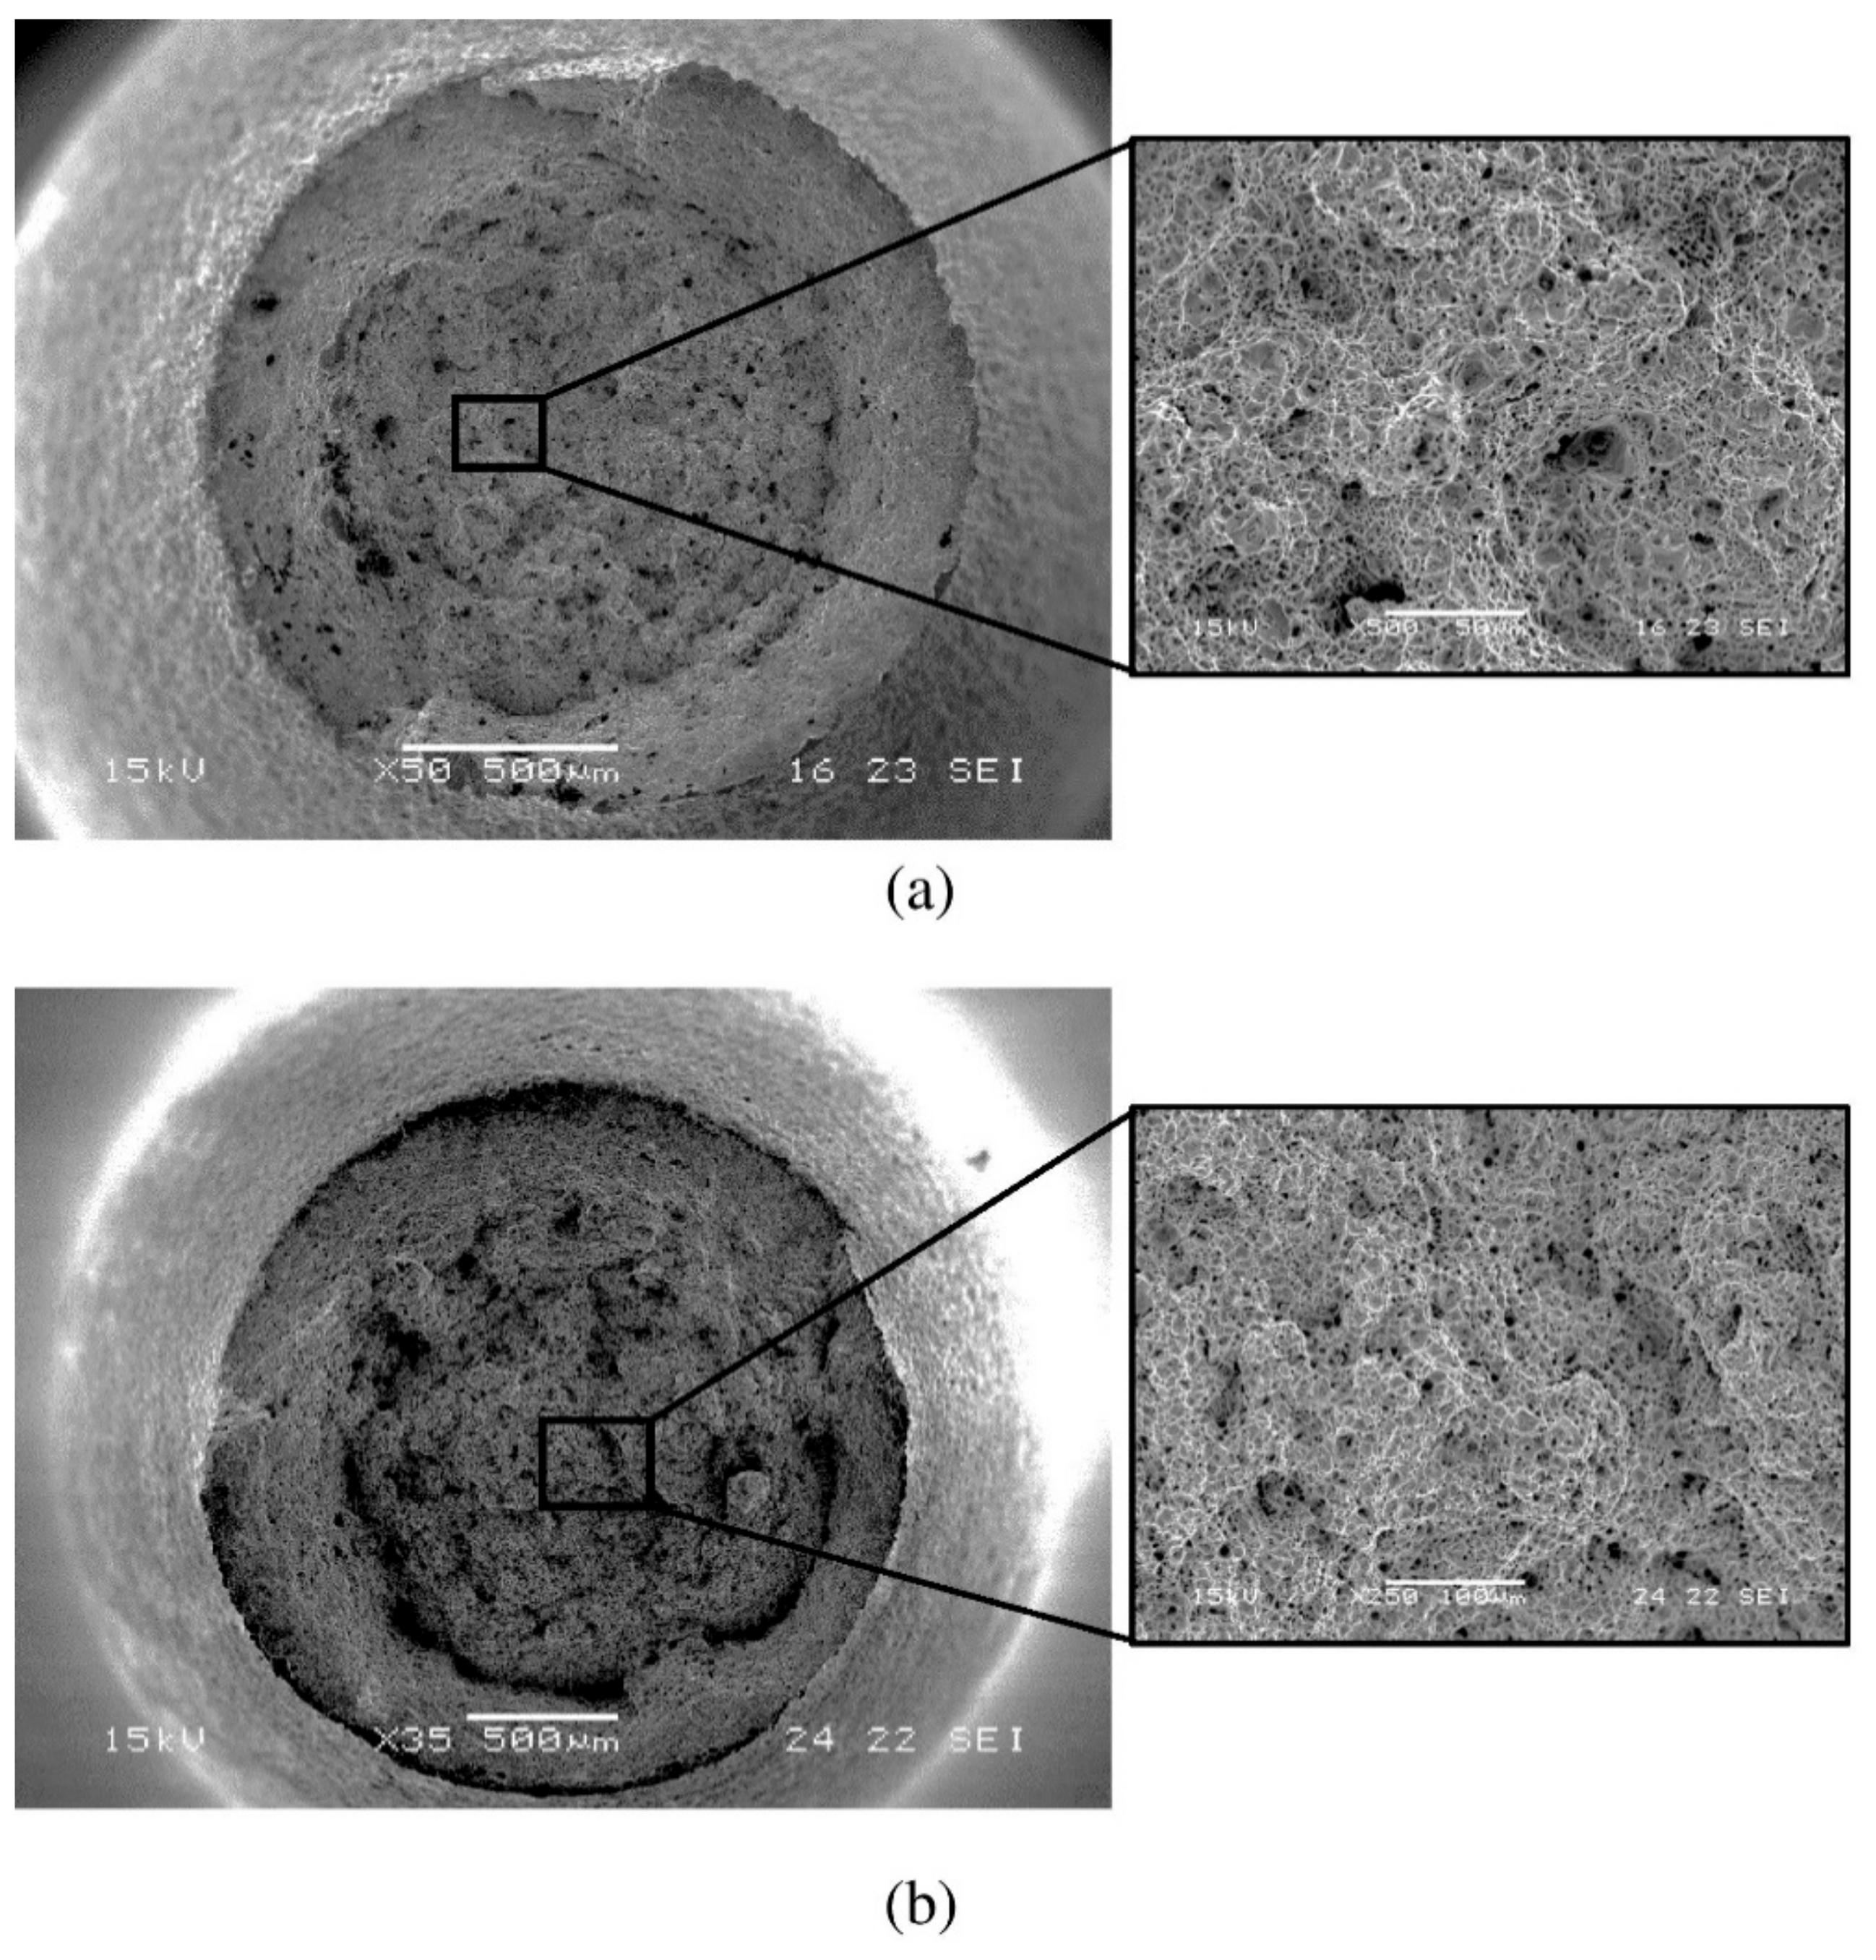
Stress corrosion examination of the printed ER70S-6 and reference ST-37 alloys by slow strain rate testing (SSRT) in 3.5% NaCl solution in terms of UTS and elongation are shown in Figure 14 and Figure 15, respectively. This has indicated that the tendency of both properties vs. strain rate in the two alloys was basically similar. The relatively increased UTS and elongation of the printed alloy was attributed to the original properties of this alloy compared to the counterpart alloy. In terms of fractography analysis after SSRT examination, both alloys showed ductile failure behaviour in the form of “cap and cone” fractures, as seen in Figure 16, that is indicative of their adequate stress corrosion resistance.
4. Discussion
The general corrosion performance of printed (WAAM) ER70S-6 alloy and reference ST-37 alloy in equilibrium conditions in terms of immersion and salt spray testing clearly demonstrated that the corrosion resistance of both alloys was relatively similar. However, the mechanisms of corrosion were quite different. The corrosion mechanism of the printed alloy was a uniform exfoliation corrosion process, while that of the reference alloy was mainly based on general surface degradation that resulted from a large number of corrosion sites that consequently created a porous area. The differences in the corrosion mechanisms of the two alloys can be attributed to the small variations in their chemical composition, as well as their different solidification rates. The significantly increased solidification rate of the printed alloy created a more homogenous structure, with considerably reduced amounts of secondary pearlite phase. In contrast, the lower solidification rate of the reference alloy created a relatively large amount of pearlite phase that could consequently generate a micro-galvanic corrosion attack of the α-Fe matrix [23,24]. This micro-galvanic effect can explain the existence of a large number of corrosion sites on the external surface after exposing the alloy to a corrosive environment.
The results obtained in the equilibrium corrosion tests were basically supported by the electrochemical analysis in terms of potentiodynamic polarization and electrochemical impedance spectroscopy. The small electrochemical variations demonstrated in the potentiodynamic polarization analysis may be related to the fact that the polarization curve can be considered as a linear combination of various partial contributions of current density [25,26]. This can be generated from the different microstructural features composing the two alloys, and in this case, it probably relates to the small variations in chemical composition and differences in secondary phase content. EIS analysis, as portrayed in Nyquist diagrams (radius of curvature) clearly demonstrated that the significant differences between the two alloys after a short-term immersion (30 min) were rectified in the long-term immersion (540 min). This again falls in line with the outcome of the equilibrium corrosion tests that indicated that the corrosion resistance of the two alloys was essentially similar.
Stress corrosion analysis by SSRT, in the form of UTS and elongation vs. strain rate, indicated that the printed and counterpart alloys showed similar tendencies in terms of their stress corrosion resistance. This was illustrated by comparing their mechanical response at a rapid strain rate of 2.5E-5 (1/S) that introduce nearly no corrosion effect and at a very slow strain rate of 2.5E-7 (1/S) that emphasizes the effect of the corrosive environment. Although the elongation of the printed alloy was slightly reduced at the lowest strain rate (from about 34% to 24%), it was still well above the ductility of the counterpart wrought alloy (12%) that was kept nearly constant vs. strain rate. Combining this result with the fact that the UTS of the two alloys were nearly unaffected by the strain rate can lead to the understanding that the stress corrosion resistance of both alloys was quite adequate. The relatively increased UTS and elongation vs. strain rate of the printed alloy can be mainly related to the original properties of this alloy compared to its counterpart wrought alloy (475.7 ± 2.3 Mpa and 34.6 ± 3.6% vs. 611.2 ± 12.9 Mpa and 12.6 ± 0.17%, respectively). The fact that their stress corrosion resistance tendency was basically similar was also supported by the fractography analysis after SSRT examination. This has revealed that both alloys showed ductile failure behaviour which is also indicative of adequate stress corrosion resistance.
5. Conclusions
The results of the present study clearly demonstrated that the general corrosion performance of ER70S-6 steel obtained by wire arc additive manufacturing process was quite similar to its ST-37 wrought steel counterpart. Stress corrosion analysis by SSRT testing revealed that both alloys showed adequate stress corrosion resistance. Overall, it was indicated that the printing process in this case did not have any deteriorating effect on the environmental behavior of the alloy compared to its conventional alloy counterpart.
Author Contributions
E.A., A.S. and T.R. conceived, designed and performed the experiments; G.K.L, A.L and O.D. assist in analyzing the data; E.A. and T.R. wrote the paper.
Funding
This research received no external funding.
Conflicts of Interest
The authors declare no conflict of interest.
References
- Herzog, D.; Seyda, V.; Wycisk, E.; Emmelmann, C. Additive manufacturing of metals. Acta Mater. 2016, 117, 371–392. [Google Scholar] [CrossRef]
- Zakay, A.; Aghion, E. Effect of Post-Heat Treatment on the Corrosion Behavior of AlSi10Mg Alloy Produced by Additive Manufacturing. JOM J. Miner. Met. Mater. Soc. 2019, 71, 1–8. [Google Scholar] [CrossRef]
- Leon, A.; Shirizly, A.; Aghion, E. Corrosion Behavior of AlSi10Mg Alloy Produced by Additive Manufacturing (AM) vs. Its Counterpart Gravity Cast Alloy. Metals 2016, 6, 148. [Google Scholar] [CrossRef]
- Bai, X.; Colegrove, P.; Ding, J.; Zhou, X.; Diao, C.; Bridgeman, P.; roman Hönnige, J.; Zhang, H.; Williams, S. Numerical analysis of heat transfer and fluid flow in multilayer deposition of PAW-based wire and arc additive manufacturing. Int. J. Heat Mass Transf. 2018, 124, 504–516. [Google Scholar] [CrossRef]
- Wu, B.; Pan, Z.; Ding, D.; Cuiuri, D.; Li, H.; Xu, J.; Norrish, J. A review of the wire arc additive manufacturing of metals: Properties, defects and quality improvement. J. Manuf. Process. 2018, 35, 127–139. [Google Scholar] [CrossRef]
- DebRoy, T.; Wei, H.L.; Zuback, J.S.; Mukherjee, T.; Elmer, J.W.; Milewski, J.O.; Beese, A.M.; Wilson-Heid, A.; De, A.; Zhang, W. Additive manufacturing of metallic components–Process, structure and properties. Prog. Mater. Sci. 2018, 92, 112–224. [Google Scholar] [CrossRef]
- Zhang, C.; Li, Y.; Gao, M.; Zeng, X. Wire arc additive manufacturing of Al-6Mg alloy using variable polarity cold metal transfer arc as power source. Mater. Sci. Eng. A 2018, 711, 415–423. [Google Scholar] [CrossRef]
- Leon, A.; Aghion, E. Effect of surface roughness on corrosion fatigue performance of AlSi10Mg alloy produced by Selective Laser Melting (SLM). Mater. Charact. 2017, 131, 188–194. [Google Scholar] [CrossRef]
- Bekker, A.C.; Verlinden, J.C.; Galimberti, G. Challenges in assessing the sustainability of wire+ arc additive manufacturing for large structures. In Proceedings of the Solid Freeform Fabrication Symposium–An Additive Manufacturing Conference, Austin, TX, USA, 8–10 August 2016. [Google Scholar]
- Cunningham, C.R.; Wikshåland, S.; Xu, F.; Kemakolam, N.; Shokrani, A.; Dhokia, V.; Newman, S.T. Cost Modelling and Sensitivity Analysis of Wire and Arc Additive Manufacturing. Procedia Manuf. 2017, 11, 650–657. [Google Scholar] [CrossRef]
- Donoghue, J.; Antonysamy, A.A.; Martina, F.; Colegrove, P.A.; Williams, S.W.; Prangnell, P.B. The effectiveness of combining rolling deformation with Wire–Arc Additive Manufacture on β-grain refinement and texture modification in Ti–6Al–4V. Mater. Charact. 2016, 114, 103–114. [Google Scholar] [CrossRef]
- Gu, D. Laser Additive Manufacturing (AM): Classification, Processing Philosophy, and Metallurgical Mechanisms. In Laser Additive Manufacturing of High-Performance Materials; Springer: Berlin/Heidelberg, Germany, 2015; pp. 15–71. [Google Scholar]
- Pan, Z.; Ding, D.; Wu, B.; Cuiuri, D.; Li, H.; Norrish, J. Arc Welding Processes for Additive Manufacturing: A Review. In Transactions on Intelligent Welding Manufacturing; Springer: Singapore, 2018; pp. 3–24. [Google Scholar]
- Williams, S.W.; Martina, F.; Addison, A.C.; Ding, J.; Pardal, G.; Colegrove, P. Wire + Arc Additive Manufacturing. Mater. Sci. Technol. 2016, 32, 641–647. [Google Scholar] [CrossRef] [Green Version]
- Derekar, K.S. A review of wire arc additive manufacturing and advances in wire arc additive manufacturing of aluminium. Mater. Sci. Technol. (UK) 2018, 34, 895–916. [Google Scholar] [CrossRef]
- Shirizly, A.; Dolev, O. From Wire to Seamless Flow-Formed Tube: Leveraging the Combination of Wire Arc Additive Manufacturing and Metal Forming. JOM J. Miner. Met. Mater. Soc. 2018, 71, 1–9. [Google Scholar] [CrossRef]
- Jafarzadegan, M.; Feng, A.H.; Abdollah-zadeh, A.; Saeid, T.; Shen, J.; Assadi, H. Microstructural characterization in dissimilar friction stir welding between 304 stainless steel and st37 steel. Mater. Charact. 2012, 74, 28–41. [Google Scholar] [CrossRef]
- Itzhak, D.; Ittah, R. Cathodic protection using granular Zn sacrificial anode applied on steel jacketed reactors operating with Dead sea brine colling liquid. Can. J. Sci. Ind. Res. 2012, 3, 123–129. [Google Scholar]
- Kafri, A.; Ovadia, S.; Goldman, J.; Drelich, J.; Aghion, E. The Suitability of Zn–1.3%Fe Alloy as a Biodegradable Implant Material. Metals (Basel) 2018, 8, 153. [Google Scholar] [CrossRef]
- Jafari, H.; Akbarzade, K.; Danaee, I. Corrosion inhibition of carbon steel immersed in a 1 M HCl solution using benzothiazole derivatives. Arab. J. Chem. 2014. [Google Scholar] [CrossRef]
- Asghari, E.; Ashassi-Sorkhabi, H.; Ahangari, M.; Bagheri, R. Optimization of a Three-Component Green Corrosion Inhibitor Mixture for Using in Cooling Water by Experimental Design. J. Mater. Eng. Perform. 2016, 25, 1416–1425. [Google Scholar] [CrossRef]
- Gerengi, H.; Uygur, I.; Solomon, M.; Yildiz, M.; Goksu, H. Evaluation of the inhibitive effect of Diospyros kaki (Persimmon) leaves extract on St37 steel corrosion in acid medium. Sustain. Chem. Pharm. 2016, 4, 57–66. [Google Scholar]
- Wei, J.; Dong, J.; Zhou, Y.; He, X.; Wang, C.; Ke, W. Influence of the secondary phase on micro galvanic corrosion of low carbon bainitic steel in NaCl solution. Mater. Charact. 2018, 139, 401–410. [Google Scholar] [CrossRef]
- Mitelea, I.; Bordeaşu, I.; Pelle, M.; Crăciunescu, C. Ultrasonic cavitation erosion of nodular cast iron with ferrite–pearlite microstructure. Ultrason. Sonochem. 2015, 23, 385–390. [Google Scholar] [CrossRef] [PubMed]
- Itzhak, D.; Aghion, E. Corrosion behaviour of hot-pressed austenitic stainless steel in H2SO4 solutions at room temperature. Corros. Sci. 1983, 23, 1085–1094. [Google Scholar] [CrossRef]
- Itzhak, D.; Aghion, E. An anodic behaviour study of an analogical sintered system of austenitic stainless steel in H2SO4 solution. Corros. Sci. 1984, 24, 145–149. [Google Scholar] [CrossRef]
Figure 1.
Wire arc additive manufacturing (WAAM) test sample in the form of hollow cylindrical part (a) as obtained after printing; (b) related geometrical dimension (Unit: mm).
Figure 1.
Wire arc additive manufacturing (WAAM) test sample in the form of hollow cylindrical part (a) as obtained after printing; (b) related geometrical dimension (Unit: mm).

Figure 2.
Dimensions of the slow strain rate testing (SSRT) test specimen (Unit: mm).

Figure 3.
Typical microstructures of printed (WAAM) alloy ER70S-6 obtained by optical and SEM microscopy respectively (a,b) XY plane (c,d) XZ plane.
Figure 3.
Typical microstructures of printed (WAAM) alloy ER70S-6 obtained by optical and SEM microscopy respectively (a,b) XY plane (c,d) XZ plane.

Figure 4.
Typical microstructure of the reference ST-37 alloy (a) optical microscopy, (b) SEM observation.
Figure 4.
Typical microstructure of the reference ST-37 alloy (a) optical microscopy, (b) SEM observation.

Figure 5.
X-ray diffraction analysis of printed ER70S-6 alloy and the reference ST-37 alloy.

Figure 6.
Typical stress–strain curves.

Figure 7.
Corrosion rates of printed ER70S-6 alloy and reference ST-37 alloy following immersion testing for up to 90 days in 3.5% NaCl solution.
Figure 7.
Corrosion rates of printed ER70S-6 alloy and reference ST-37 alloy following immersion testing for up to 90 days in 3.5% NaCl solution.

Figure 8.
Close-up views of corrosion attack at the surface of printed ER70S-6 and reference ST-37 alloys after immersion tests in 3.5% NaCl solution, as obtained by SEM: (a,b) printed alloy after an exposure times of 60 days and 90 days, respectively; (c,d) reference alloy after exposure times of 60 days and 90 days, respectively.

Figure 9.
Corrosion rates of printed ER70S-6 alloy and reference ST-37 alloy after salt spray testing for up to 45 days in 3.5% NaCl solution.
Figure 9.
Corrosion rates of printed ER70S-6 alloy and reference ST-37 alloy after salt spray testing for up to 45 days in 3.5% NaCl solution.

Figure 10.
Close-up views of corrosion attack at the surface of the printed ER70S-6 alloy and reference ST-37 alloy after salt spray testing in 3.5% NaCl solution. (a,b) printed alloy after exposure times of 30 days and 45 days, respectively; (c,d) reference alloy after exposure times of 30 days and 45 days, respectively.

Figure 11.
Potentiodynamic polarization analysis of printed ER70S-6 and reference ST37 alloys in 3.5% NaCl solution.
Figure 11.
Potentiodynamic polarization analysis of printed ER70S-6 and reference ST37 alloys in 3.5% NaCl solution.

Figure 12.
Nyquist diagrams of printed ER70S-6 and reference ST-37 alloys in 3.5% NaCl solution after various immersion times; (a) 30, (b) 180 and (c) 540 min.
Figure 12.
Nyquist diagrams of printed ER70S-6 and reference ST-37 alloys in 3.5% NaCl solution after various immersion times; (a) 30, (b) 180 and (c) 540 min.

Figure 13.
Electrical equivalent circuits and fitted parameters for the Nyquist diagrams shown in Figure 9, after various immersion times. (a) initial immersion, (b) long-term immersion.
Figure 13.
Electrical equivalent circuits and fitted parameters for the Nyquist diagrams shown in Figure 9, after various immersion times. (a) initial immersion, (b) long-term immersion.

Figure 14.
The effect of strain rate on the ultimate tensile strength (UTS) of printed ER70S-6 alloy and reference ST-37 alloy, as obtained by SSRT.
Figure 14.
The effect of strain rate on the ultimate tensile strength (UTS) of printed ER70S-6 alloy and reference ST-37 alloy, as obtained by SSRT.

Figure 15.
The effect of strain rate on the elongation of printed ER70S-6 alloy and reference alloy ST-37, as obtained by SSRT.
Figure 15.
The effect of strain rate on the elongation of printed ER70S-6 alloy and reference alloy ST-37, as obtained by SSRT.

Figure 16.
Typical fracture surface appearance obtained after SSRT at a strain rate of 2.5E-7 (1/S) in 3.5% NaCl solution. (a) printed ER70S-6 alloy and (b) reference ST37 alloy.
Figure 16.
Typical fracture surface appearance obtained after SSRT at a strain rate of 2.5E-7 (1/S) in 3.5% NaCl solution. (a) printed ER70S-6 alloy and (b) reference ST37 alloy.


Table 1.
Chemical compositions (wt.%) of wire arc additive manufacturing low carbon steel samples (ER70S-6) and reference wrought alloy steel (ST-37).
Table 1.
Chemical compositions (wt.%) of wire arc additive manufacturing low carbon steel samples (ER70S-6) and reference wrought alloy steel (ST-37).
| Alloy/Wt.% | C | Mn | Si | P | S | Ni | Cr | Mo | Fe |
|---|---|---|---|---|---|---|---|---|---|
| ER70S-6 | 0.072 | 1.248 | 0.761 | 0.015 | 0.0053 | 0.008 | 0.014 | 0.002 | Bal. |
| ST-37 | 0.15 | 0.491 | 0.073 | 0.008 | 0.009 | 0.03 | 0.001 | 0.008 | Bal. |
Table 2.
Typical mechanical properties of printed alloy ER70S-6 and the reference ST-37 alloy.
| Mechanical Properties | Printed ER70S-6 | ST-37 |
|---|---|---|
| Yield strength (Mpa) | 365.9 ± 4.6 | 593.8 ± 12.9 |
| Tensile strength (Mpa) | 475.7 ± 2.3 | 611.2 ± 12.9 |
| Uniform elongation (%) | 12.1 ± 2.7 | 6.7 ± 0.2 |
| Total elongation (%) | 34.6 ± 3.6 | 12.6 ± 0.2 |
| Hardness (HV) | 192.4 ± 6 | 259.1 ± 15 |
© 2019 by the authors. Licensee MDPI, Basel, Switzerland. This article is an open access article distributed under the terms and conditions of the Creative Commons Attribution (CC BY) license (http://creativecommons.org/licenses/by/4.0/).
Share and Cite
MDPI and ACS Style
Ron, T.; Levy, G.K.; Dolev, O.; Leon, A.; Shirizly, A.; Aghion, E. Environmental Behavior of Low Carbon Steel Produced by a Wire Arc Additive Manufacturing Process. Metals 2019, 9, 888. https://doi.org/10.3390/met9080888
AMA Style
Ron T, Levy GK, Dolev O, Leon A, Shirizly A, Aghion E. Environmental Behavior of Low Carbon Steel Produced by a Wire Arc Additive Manufacturing Process. Metals. 2019; 9(8):888. https://doi.org/10.3390/met9080888
Chicago/Turabian StyleRon, Tomer, Galit Katarivas Levy, Ohad Dolev, Avi Leon, Amnon Shirizly, and Eli Aghion. 2019. "Environmental Behavior of Low Carbon Steel Produced by a Wire Arc Additive Manufacturing Process" Metals 9, no. 8: 888. https://doi.org/10.3390/met9080888
Note that from the first issue of 2016, this journal uses article numbers instead of page numbers. See further details here.